Embed Size (px)
Citation preview
http://www.elon.edu/elonpoll || facebook.com/elonpoll || @elonpoll
Page 1 of 29 September 17-21, 2015
Presidential Primary Poll September 17-21, 2015
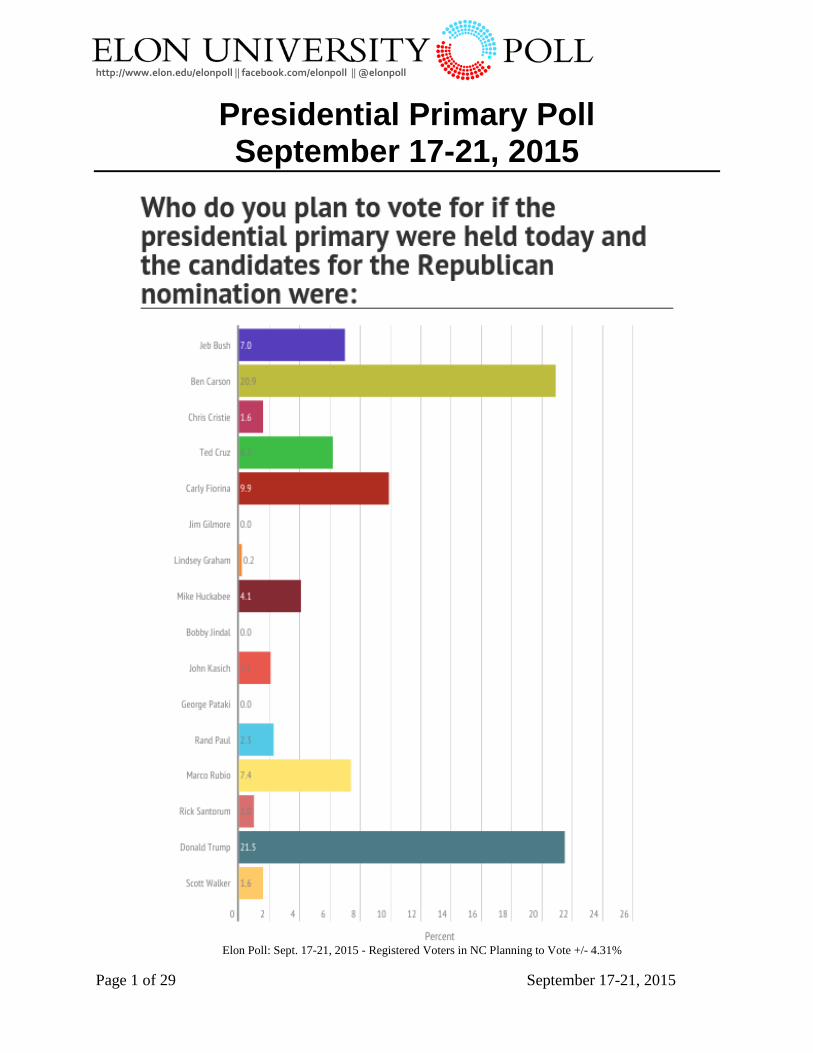
Elon Poll: Sept. 17-21, 2015 - Registered Voters in NC Planning to Vote +/- 4.31%
http://www.elon.edu/elonpoll || facebook.com/elonpoll || @elonpoll
Page 2 of 29 September 17-21, 2015
TABLE OF CONTENTS Executive Summary ........................................................................................................................ 3
Topline Results ............................................................................................................................... 7
Election 2016 .............................................................................................................................. 7
Approval Ratings ...................................................................................................................... 10
Policy Issues.............................................................................................................................. 11
Demographics ........................................................................................................................... 13
Cross Tabulations.......................................................................................................................... 15
Cross-Tabs GOP Presidential Race .......................................................................................... 15
Cross-Tabs Democratic Presidential Race ................................................................................ 16
Cross-Tabs: GOP vs. Clinton Head-to-Heads .......................................................................... 17
Cross-Tabs: McCrory vs Cooper Head-to-Head....................................................................... 19
Cross-Tabs: Gay Marriage & Abortion .................................................................................... 20
Question Ordering ......................................................................................................................... 22
Methodological Information ......................................................................................................... 24
The Elon University Poll Team .................................................................................................... 28
http://www.elon.edu/elonpoll || facebook.com/elonpoll || @elonpoll
Page 3 of 29 September 17-21, 2015
Executive Summary The Elon University Poll conducted a live-caller, dual frame (landline and cell phone) survey of 1,258 residents of North Carolina between September 17 and September 21, 2015. Of these respondents, 1,075 said they were registered to vote in the state of North Carolina. Of these registered voters, 516 said they were a Republican or Republican-leaning Independent who planned to vote in the Republican Primary next year. Also in the sample were 427 registered voters who self-identified as Democrat or Independents who leaned Democrat who said they planned on voting in the Democratic primary. The survey reported here presents the results for registered voters and has a margin of error of +/- 2.99 percentage points. Margins of error increase when looking at subgroups. The margin of error for Republican and Republican-leaning voters is +/- 4.31 percentage points, and for Democratic and Democratic-leaning voters it is +/- 4.74 percentage points. Details regarding the methodology of the survey can be found at the end of this report.
2016 GOP Presidential Primary
GOP Presidential Primary - Respondent's First Choice Registered voters who were self-identified Republicans or Independents who lean Republican were asked who they planned to vote for if the presidential primary were held today. Sixteen candidate names were read to respondents, with names randomly rotated to prevent primacy and recency effects.
The survey found Donald Trump (21.5%) and Ben Carson (20.9%) are leading the list of Republican candidates. In third place is Carly Fiorina with 9.9 percent, followed by Marco Rubio with 7.4 percent. Jeb Bush has fallen to fifth place with 7 percent. In a February 2015 Elon Poll, respondents were asked who they would like to see run for president. Bush was the most frequently mentioned candidate, followed by Scott Walker. Scott Walker received only 1.6 percent in this current poll. On the Elon Poll’s last day of polling, Walker announced he was suspending his campaign for the GOP presidential nomination.
Not a single respondent in our sample mentioned Jim Gilmore, Bobby Jindal or George Pataki as a candidate for whom they intend to vote. Thirteen percent of voters are undecided.
GOP Presidential Primary - Respondent's Second Choice Republican respondents were also asked a follow-up question: "If [Respondent's first choice] dropped out of the race for president which Republican candidate would you vote for?" Ben Carson is the choice for nearly 15% of Republican voters, followed by Trump with 13%, Fiorina with 11.4% and Marco Rubio with 10%. This suggests that the top four candidates – Trump, Carson, Fiorina, and Rubio – have wider appeal than some other candidates.
http://www.elon.edu/elonpoll || facebook.com/elonpoll || @elonpoll
Page 4 of 29 September 17-21, 2015
2016 Democratic Presidential Primary
Registered voters who are self-identified Democrats or Independents who lean Democratic were asked who they would vote for if the presidential primary were held today. Six candidates were read to respondents with names rotated randomly.
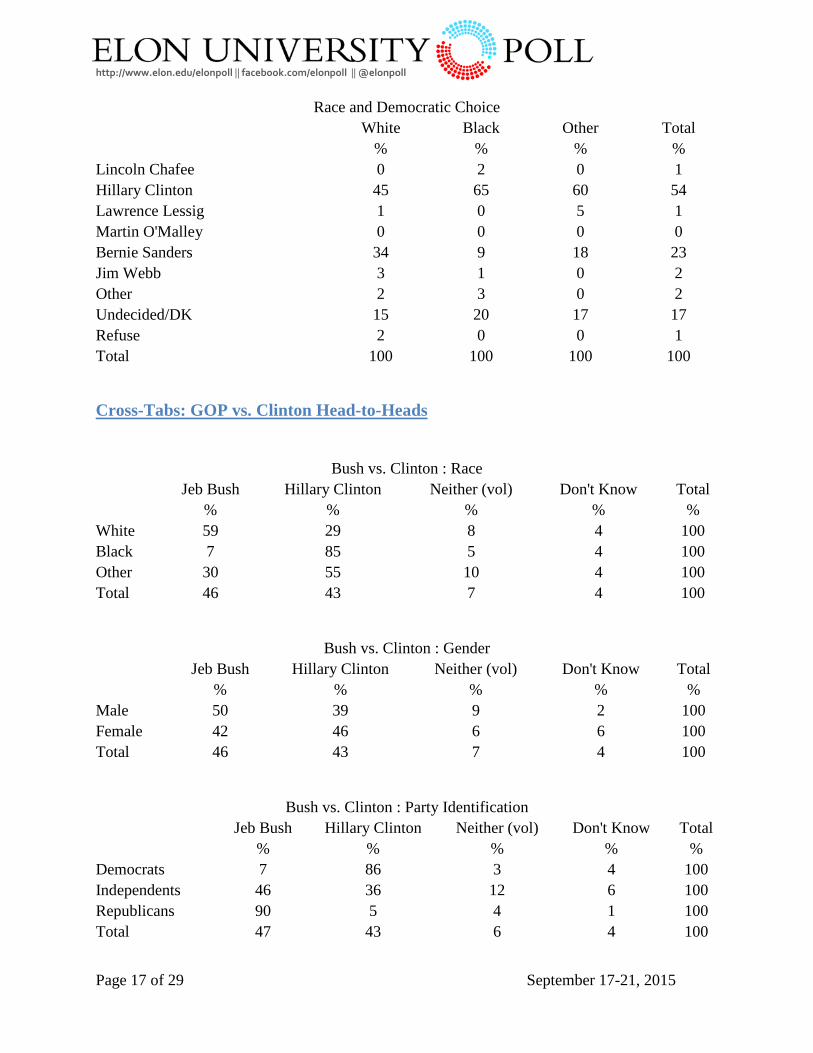
Hillary Clinton was the clear favorite among Democratic voters in North Carolina. With 53 percent support, Clinton leads Bernie Sanders by 30 points. Support for the other candidates running for the Democratic nomination is minimal. Seven respondents said they planned to vote for Jim Webb, three mentioned Lincoln Chafee, three mentioned Lawrence Lessig, and only one respondent mentioned Martin O'Malley. Approximately 17 percent of Democratic voters are undecided.
Hypothetical Match-Ups in the 2016 Election
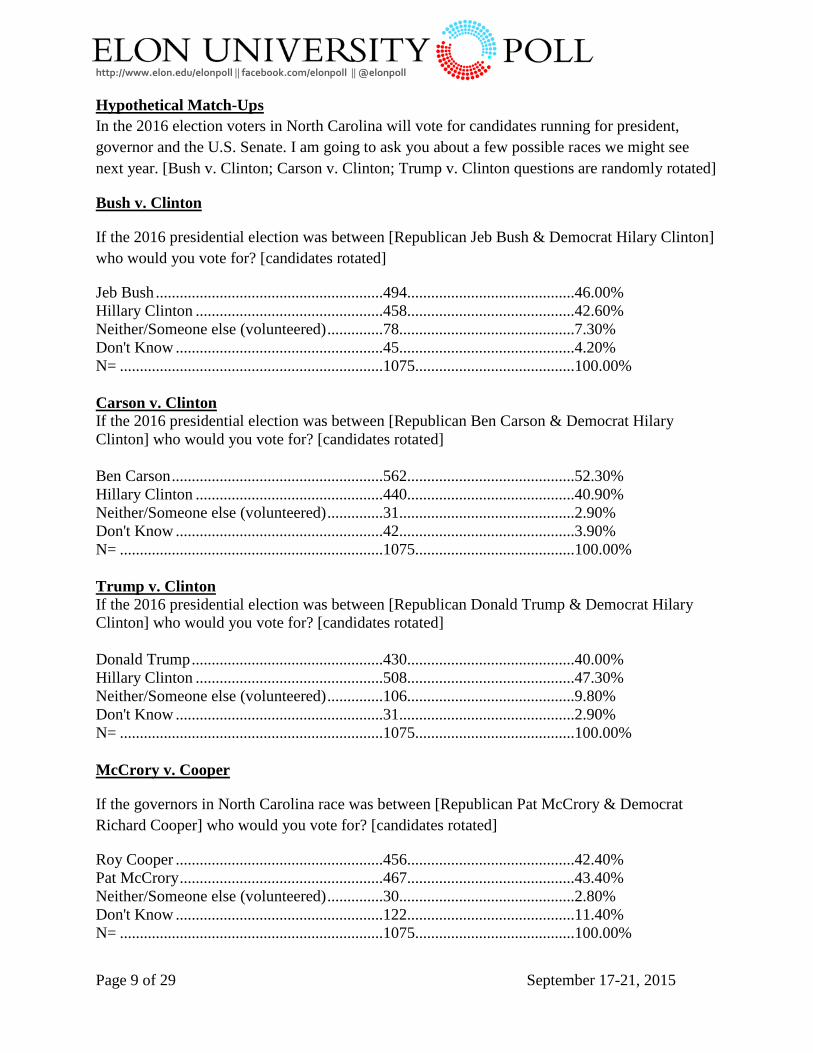
Clinton v. Bush Respondents were given three hypothetical races they might see in the 2016 election. For each they were asked to say which candidate they would support. The first hypothetical match-up posed to respondents was between Hillary Clinton and Jeb Bush. Bush beats Clinton by about 3 points (46% to 42.6%). This is a noticeable change from prior Elon University Poll surveys. In April, 47% of registered voters said they would vote for Clinton compared to 44% for Bush. In February, the Elon Poll found 46% supporting Clinton and 38% supporting Bush.
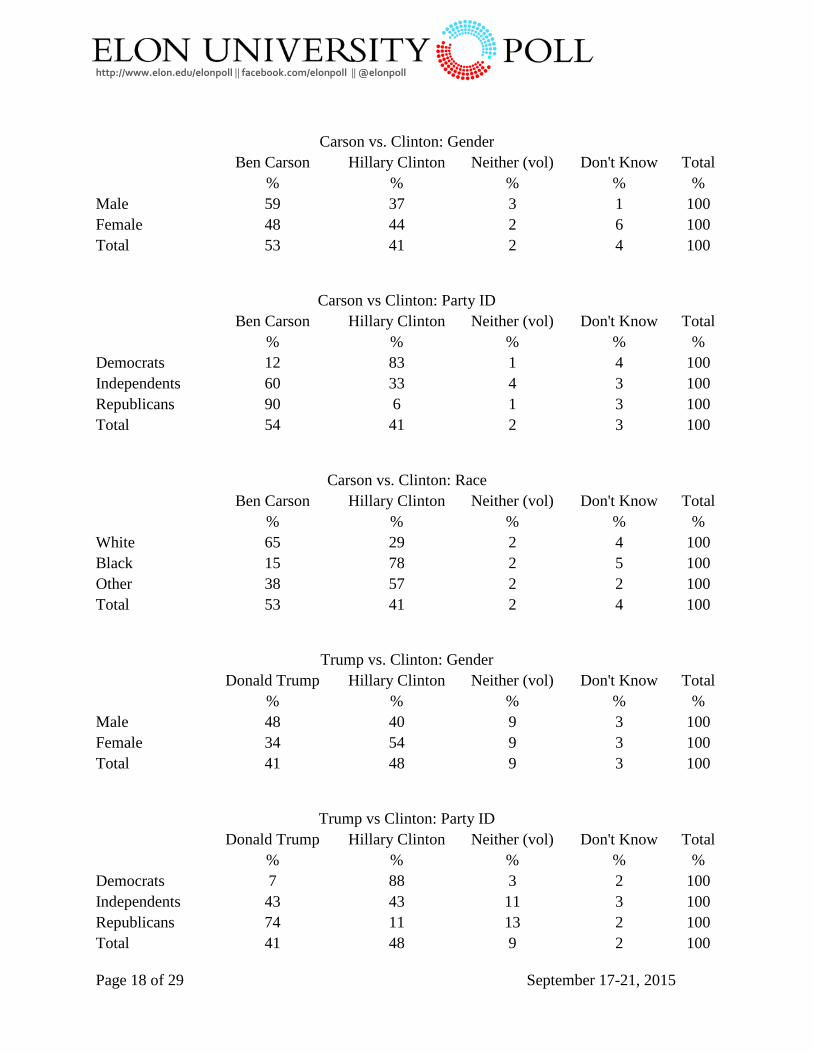
Clinton v. Carson When Clinton faces Ben Carson, Clinton loses by 11 points (41% to 52%). Carson does better with women than Clinton (48% to 44%) and Independents clearly favor Carson over Clinton (60% compared to 33%). Although African-Americans favor Clinton over Carson (78% to 15%), Carson gets twice as much support from black voters than does Jeb Bush or Donald Trump.
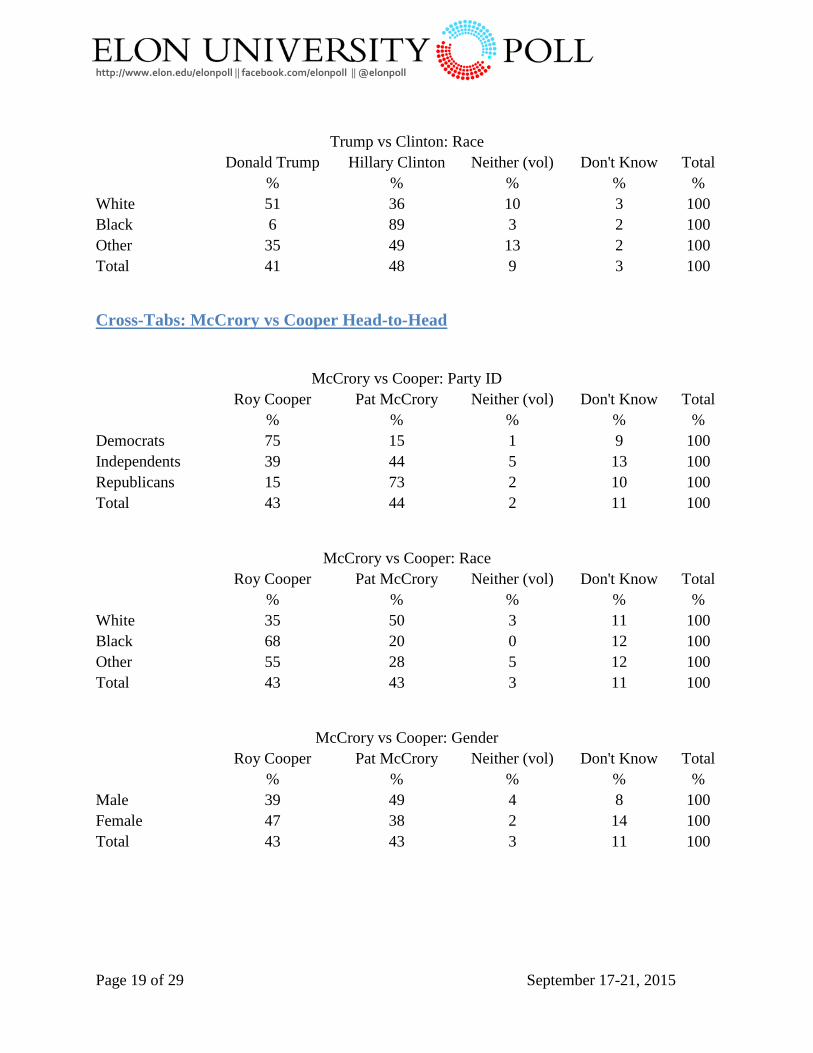
Clinton v. Trump If the 2016 general election was held today, Republicans seem to have a clear advantage in the race for president – unless Donald Trump is the nominee. Although Bush and Carson beat Clinton in our sample of registered voters, Clinton beats Trump by 7 points (47% to 40%). Clinton is able to get half of all Independents (43%) and 11 percent of Republicans when facing Trump. When facing Bush or Carson, Clinton gets far less support from Independents and no more than 6 percent of Republican support.
McCrory vs. Cooper
Respondents were asked who they would vote for governor in 2016 if incumbent Republican Pat McCrory faced Democrat Roy Cooper. Respondents were not told that McCrory was the incumbent (although a prior question in the survey would have clued them in if they were not
http://www.elon.edu/elonpoll || facebook.com/elonpoll || @elonpoll
Page 5 of 29 September 17-21, 2015
aware of this fact) and were not told that Roy Cooper is currently the state's attorney general. McCrory leads Cooper by only 1 point (43.4% to 42.4%). These findings were similar to what the Elon Poll found in April of this year when 45% supported McCrory and 43% said they would vote for Cooper. McCrory does better with Independents than Cooper (44% to 39%), but Cooper does much better with women (47% to 38%). Fifteen percent of Democrats said they would vote for McCrory, with an equal amount of Republicans supporting Cooper.
Approval Ratings
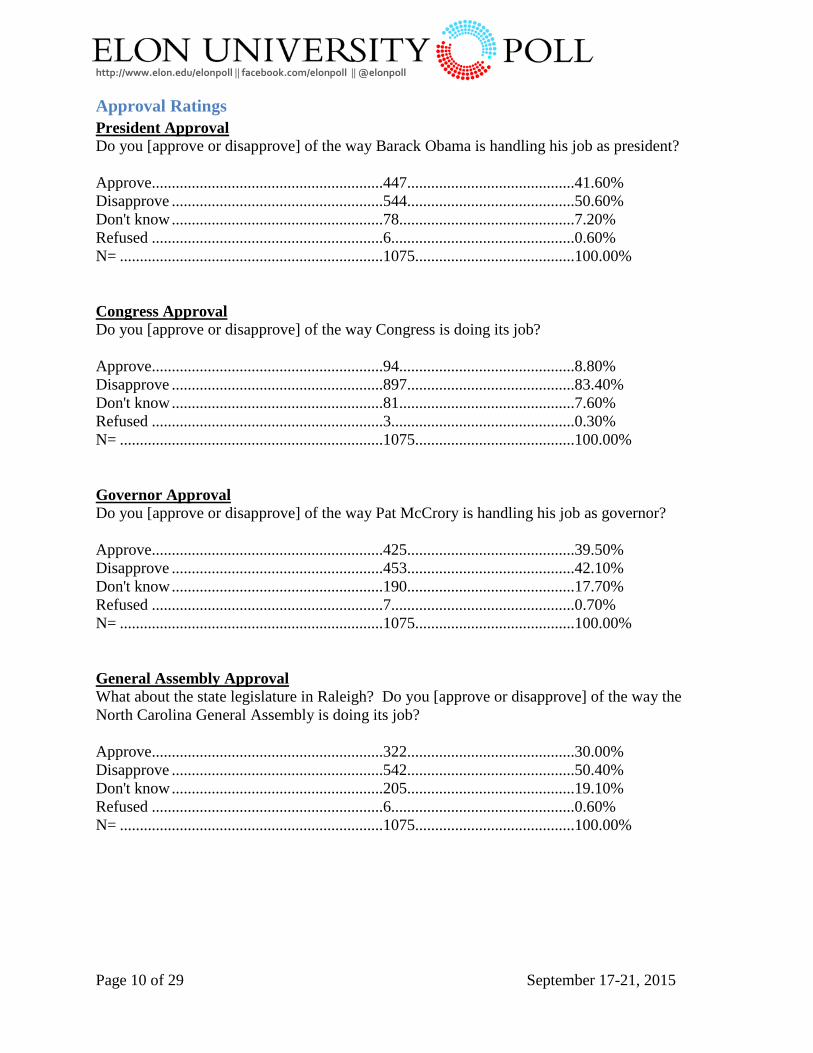
President Barack Obama Currently, President Barack Obama's approval rating is 41.6% among registered voters. This is a slight decline from the 42.9% approval found in April of this year. Support for the president is typically lower in North Carolina than in the nation as a whole. National polls who look at registered voters have recently found the president's approval rating near 46 or 47%. Just over half of registered voters disapprove of the president (50.6%), while 7.2% were not sure.
Congress Approval for Congress remains low among registered voters in North Carolina. Only 8.8% of registered voters approve of the job Congress is doing, more than a 4-point drop in approval since April of this year (13.1%). This is one of the lowest approval ratings since February 2014.
Governor Pat McCrory Approximately 40% of registered voters approve of the job the governor is doing. This is a small, 2-point increase since April.
North Carolina General Assembly In April 2015, the approval rating of the North Carolina General Assembly was 33.3%. This dropped approximately 3 percentage point to 30.0% in the current survey.
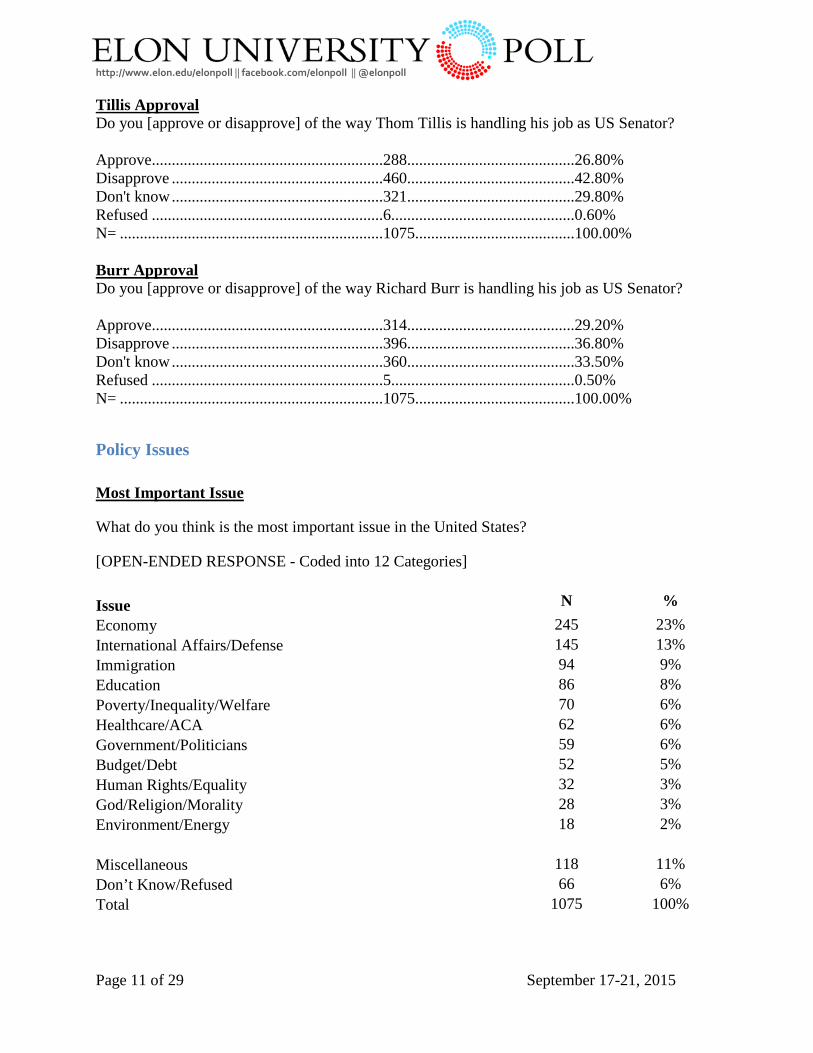
Senator Richard Burr Approximately 29% of registered voters approved of the job the Senator is doing, compared to 33% in April and 37% in February.
Senator Thom Tillis The approval rating of Senator Thom Tillis saw a decline from 32% in April to 27% in this most recent survey. In February, Tillis had an approval rating of 30 percent.
http://www.elon.edu/elonpoll || facebook.com/elonpoll || @elonpoll
Page 6 of 29 September 17-21, 2015
Policy Issues
Most Important Issue
The economy was considered the most important issue in the United States by 23% of voters. This was followed by international affairs and/or defense with 13%. A year ago, the Elon Poll found more respondents mentioning international affairs (20%) than mentioned the economy (18%) as the most important issue. The saliency of immigration has remained somewhat stable. Immigration is mentioned by 9% of respondents in this recent survey, compared to almost 8% a year ago.
Gay Marriage
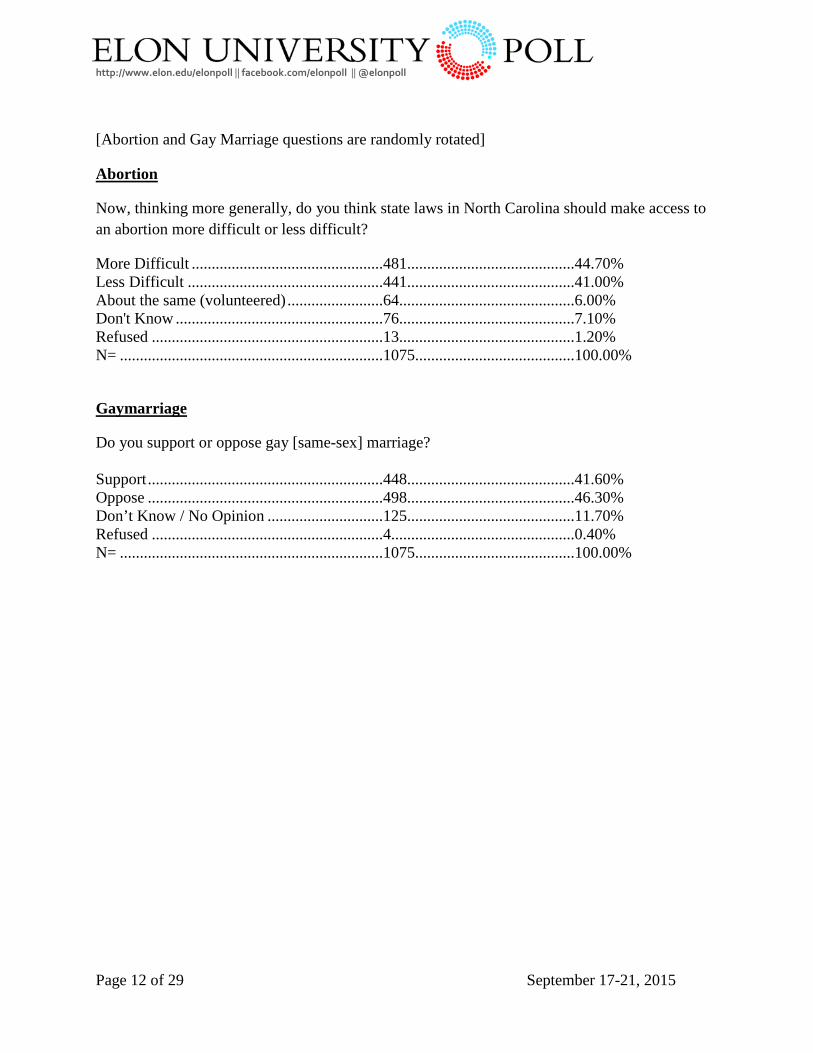
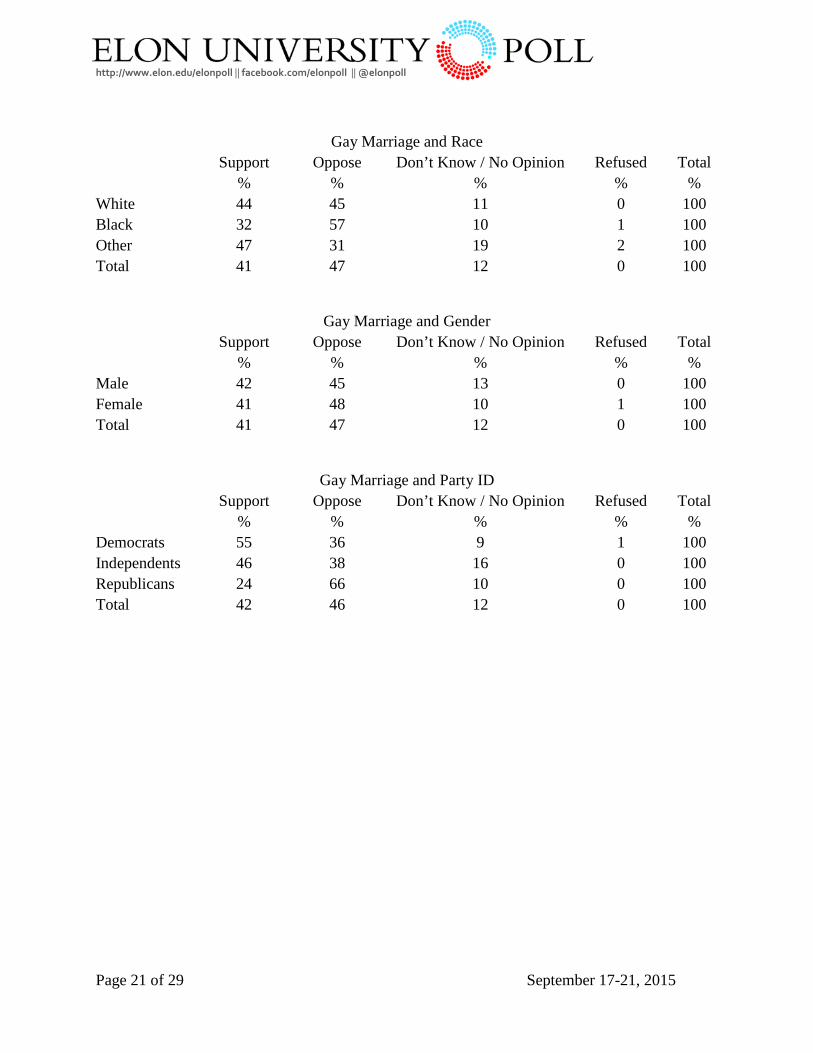
Just over 46% of registered voters oppose same-sex marriage, and almost 42% support the issue. The February 2015 poll found very similar results with 48% of registered voters opposing gay marriage (and 43% supporting it). This was nearly identical to the October 2014 poll which found 47% of registered voters opposed gay marriage, while 42% supported it.
Abortion
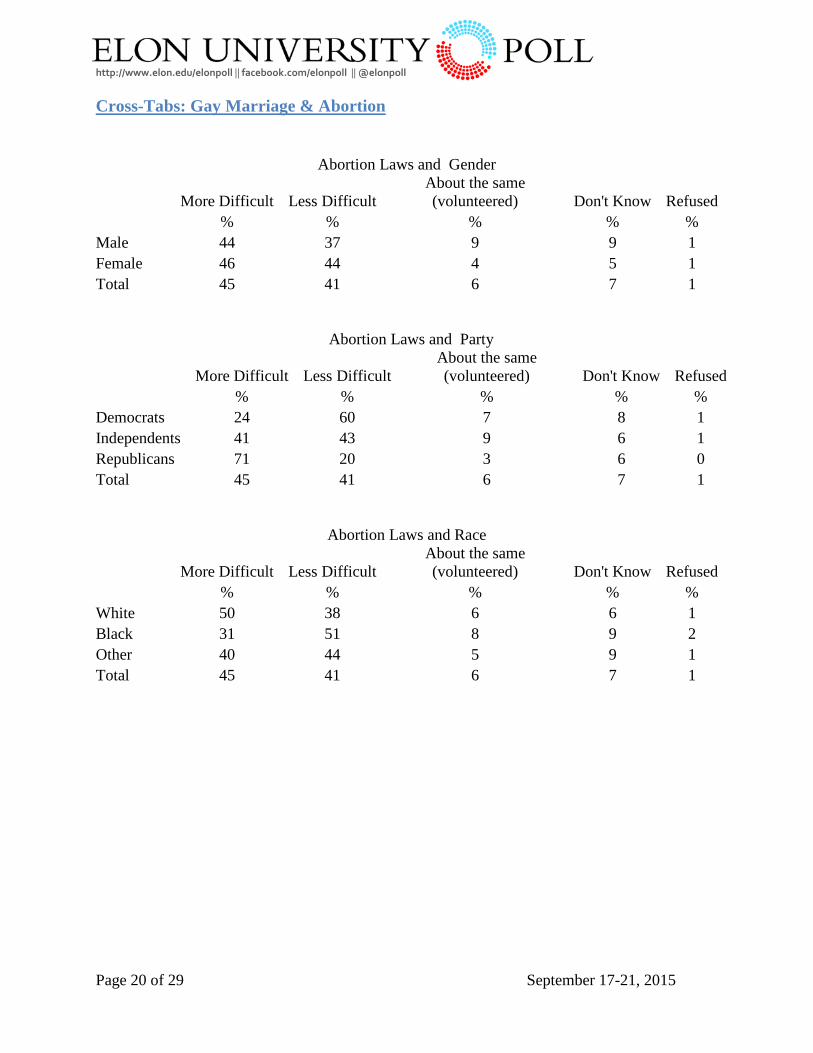
In April 2014 the Elon Poll observed a trend toward more support for access to abortions. This trend was confirmed by surveys in September 2014, October 2015 and February 2015. However, the most recent survey has seen a reversal and North Carolina once again has more registered voters believing access to abortion should be made more difficult (45%) than those believing access should be made less difficult (41%).
http://www.elon.edu/elonpoll || facebook.com/elonpoll || @elonpoll
Page 7 of 29 September 17-21, 2015
Topline Results
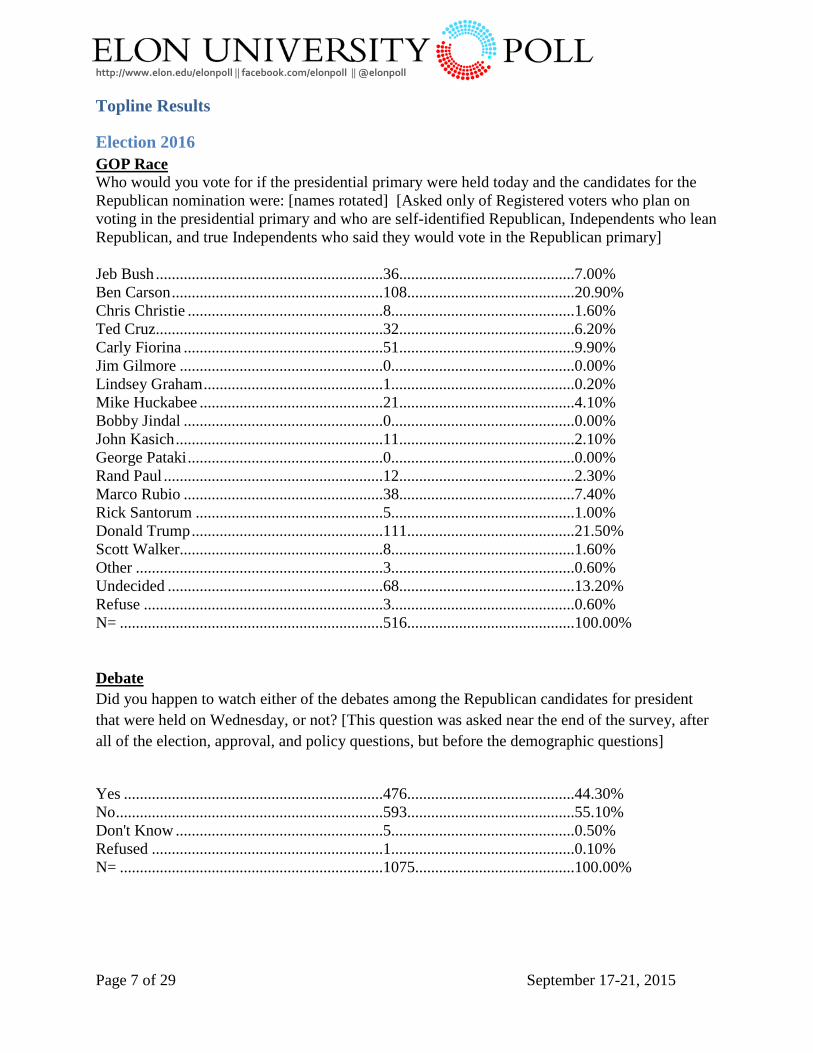
Election 2016 GOP Race Who would you vote for if the presidential primary were held today and the candidates for the Republican nomination were: [names rotated] [Asked only of Registered voters who plan on voting in the presidential primary and who are self-identified Republican, Independents who lean Republican, and true Independents who said they would vote in the Republican primary] Jeb Bush .........................................................36............................................7.00% Ben Carson .....................................................108..........................................20.90% Chris Christie .................................................8..............................................1.60% Ted Cruz.........................................................32............................................6.20% Carly Fiorina ..................................................51............................................9.90% Jim Gilmore ...................................................0..............................................0.00% Lindsey Graham .............................................1..............................................0.20% Mike Huckabee ..............................................21............................................4.10% Bobby Jindal ..................................................0..............................................0.00% John Kasich ....................................................11............................................2.10% George Pataki .................................................0..............................................0.00% Rand Paul .......................................................12............................................2.30% Marco Rubio ..................................................38............................................7.40% Rick Santorum ...............................................5..............................................1.00% Donald Trump ................................................111..........................................21.50% Scott Walker...................................................8..............................................1.60% Other ..............................................................3..............................................0.60% Undecided ......................................................68............................................13.20% Refuse ............................................................3..............................................0.60% N= ..................................................................516..........................................100.00% Debate Did you happen to watch either of the debates among the Republican candidates for president that were held on Wednesday, or not? [This question was asked near the end of the survey, after all of the election, approval, and policy questions, but before the demographic questions]
Yes .................................................................476..........................................44.30% No ...................................................................593..........................................55.10% Don't Know ....................................................5..............................................0.50% Refused ..........................................................1..............................................0.10% N= ..................................................................1075........................................100.00%
http://www.elon.edu/elonpoll || facebook.com/elonpoll || @elonpoll
Page 8 of 29 September 17-21, 2015
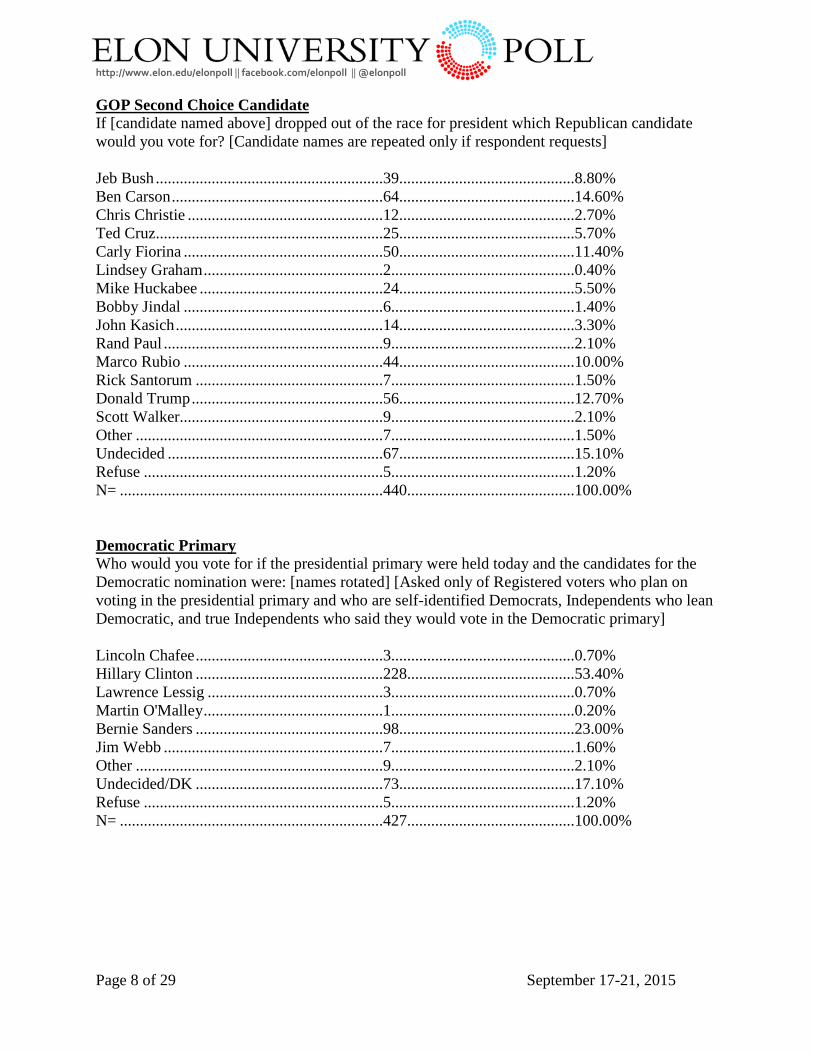
GOP Second Choice Candidate If [candidate named above] dropped out of the race for president which Republican candidate would you vote for? [Candidate names are repeated only if respondent requests] Jeb Bush .........................................................39............................................8.80% Ben Carson .....................................................64............................................14.60% Chris Christie .................................................12............................................2.70% Ted Cruz.........................................................25............................................5.70% Carly Fiorina ..................................................50............................................11.40% Lindsey Graham .............................................2..............................................0.40% Mike Huckabee ..............................................24............................................5.50% Bobby Jindal ..................................................6..............................................1.40% John Kasich ....................................................14............................................3.30% Rand Paul .......................................................9..............................................2.10% Marco Rubio ..................................................44............................................10.00% Rick Santorum ...............................................7..............................................1.50% Donald Trump ................................................56............................................12.70% Scott Walker...................................................9..............................................2.10% Other ..............................................................7..............................................1.50% Undecided ......................................................67............................................15.10% Refuse ............................................................5..............................................1.20% N= ..................................................................440..........................................100.00% Democratic Primary Who would you vote for if the presidential primary were held today and the candidates for the Democratic nomination were: [names rotated] [Asked only of Registered voters who plan on voting in the presidential primary and who are self-identified Democrats, Independents who lean Democratic, and true Independents who said they would vote in the Democratic primary] Lincoln Chafee ...............................................3..............................................0.70% Hillary Clinton ...............................................228..........................................53.40% Lawrence Lessig ............................................3..............................................0.70% Martin O'Malley .............................................1..............................................0.20% Bernie Sanders ...............................................98............................................23.00% Jim Webb .......................................................7..............................................1.60% Other ..............................................................9..............................................2.10% Undecided/DK ...............................................73............................................17.10% Refuse ............................................................5..............................................1.20% N= ..................................................................427..........................................100.00%
http://www.elon.edu/elonpoll || facebook.com/elonpoll || @elonpoll
Page 9 of 29 September 17-21, 2015
Hypothetical Match-Ups In the 2016 election voters in North Carolina will vote for candidates running for president, governor and the U.S. Senate. I am going to ask you about a few possible races we might see next year. [Bush v. Clinton; Carson v. Clinton; Trump v. Clinton questions are randomly rotated]
Bush v. Clinton
If the 2016 presidential election was between [Republican Jeb Bush & Democrat Hilary Clinton] who would you vote for? [candidates rotated]
Jeb Bush .........................................................494..........................................46.00% Hillary Clinton ...............................................458..........................................42.60% Neither/Someone else (volunteered) ..............78............................................7.30% Don't Know ....................................................45............................................4.20% N= ..................................................................1075........................................100.00% Carson v. Clinton If the 2016 presidential election was between [Republican Ben Carson & Democrat Hilary Clinton] who would you vote for? [candidates rotated] Ben Carson .....................................................562..........................................52.30% Hillary Clinton ...............................................440..........................................40.90% Neither/Someone else (volunteered) ..............31............................................2.90% Don't Know ....................................................42............................................3.90% N= ..................................................................1075........................................100.00% Trump v. Clinton If the 2016 presidential election was between [Republican Donald Trump & Democrat Hilary Clinton] who would you vote for? [candidates rotated] Donald Trump ................................................430..........................................40.00% Hillary Clinton ...............................................508..........................................47.30% Neither/Someone else (volunteered) ..............106..........................................9.80% Don't Know ....................................................31............................................2.90% N= ..................................................................1075........................................100.00% McCrory v. Cooper
If the governors in North Carolina race was between [Republican Pat McCrory & Democrat Richard Cooper] who would you vote for? [candidates rotated]
Roy Cooper ....................................................456..........................................42.40% Pat McCrory ...................................................467..........................................43.40% Neither/Someone else (volunteered) ..............30............................................2.80% Don't Know ....................................................122..........................................11.40% N= ..................................................................1075........................................100.00%
http://www.elon.edu/elonpoll || facebook.com/elonpoll || @elonpoll
Page 10 of 29 September 17-21, 2015
Approval Ratings President Approval Do you [approve or disapprove] of the way Barack Obama is handling his job as president? Approve..........................................................447..........................................41.60% Disapprove .....................................................544..........................................50.60% Don't know .....................................................78............................................7.20% Refused ..........................................................6..............................................0.60% N= ..................................................................1075........................................100.00% Congress Approval Do you [approve or disapprove] of the way Congress is doing its job? Approve..........................................................94............................................8.80% Disapprove .....................................................897..........................................83.40% Don't know .....................................................81............................................7.60% Refused ..........................................................3..............................................0.30% N= ..................................................................1075........................................100.00% Governor Approval Do you [approve or disapprove] of the way Pat McCrory is handling his job as governor? Approve..........................................................425..........................................39.50% Disapprove .....................................................453..........................................42.10% Don't know .....................................................190..........................................17.70% Refused ..........................................................7..............................................0.70% N= ..................................................................1075........................................100.00% General Assembly Approval What about the state legislature in Raleigh? Do you [approve or disapprove] of the way the North Carolina General Assembly is doing its job? Approve..........................................................322..........................................30.00% Disapprove .....................................................542..........................................50.40% Don't know .....................................................205..........................................19.10% Refused ..........................................................6..............................................0.60% N= ..................................................................1075........................................100.00%
http://www.elon.edu/elonpoll || facebook.com/elonpoll || @elonpoll
Page 11 of 29 September 17-21, 2015
Tillis Approval Do you [approve or disapprove] of the way Thom Tillis is handling his job as US Senator? Approve..........................................................288..........................................26.80% Disapprove .....................................................460..........................................42.80% Don't know .....................................................321..........................................29.80% Refused ..........................................................6..............................................0.60% N= ..................................................................1075........................................100.00% Burr Approval Do you [approve or disapprove] of the way Richard Burr is handling his job as US Senator? Approve..........................................................314..........................................29.20% Disapprove .....................................................396..........................................36.80% Don't know .....................................................360..........................................33.50% Refused ..........................................................5..............................................0.50% N= ..................................................................1075........................................100.00%
Policy Issues Most Important Issue
What do you think is the most important issue in the United States?
[OPEN-ENDED RESPONSE - Coded into 12 Categories]
Issue N % Economy 245 23% International Affairs/Defense 145 13% Immigration 94 9% Education 86 8% Poverty/Inequality/Welfare 70 6% Healthcare/ACA 62 6% Government/Politicians 59 6% Budget/Debt 52 5% Human Rights/Equality 32 3% God/Religion/Morality 28 3% Environment/Energy 18 2%
Miscellaneous 118 11% Don’t Know/Refused 66 6% Total 1075 100%
http://www.elon.edu/elonpoll || facebook.com/elonpoll || @elonpoll
Page 12 of 29 September 17-21, 2015
[Abortion and Gay Marriage questions are randomly rotated]
Abortion
Now, thinking more generally, do you think state laws in North Carolina should make access to an abortion more difficult or less difficult?
More Difficult ................................................481..........................................44.70% Less Difficult .................................................441..........................................41.00% About the same (volunteered) ........................64............................................6.00% Don't Know ....................................................76............................................7.10% Refused ..........................................................13............................................1.20% N= ..................................................................1075........................................100.00%
Gaymarriage
Do you support or oppose gay [same-sex] marriage? Support ...........................................................448..........................................41.60% Oppose ...........................................................498..........................................46.30% Don’t Know / No Opinion .............................125..........................................11.70% Refused ..........................................................4..............................................0.40% N= ..................................................................1075........................................100.00%
http://www.elon.edu/elonpoll || facebook.com/elonpoll || @elonpoll
Page 13 of 29 September 17-21, 2015
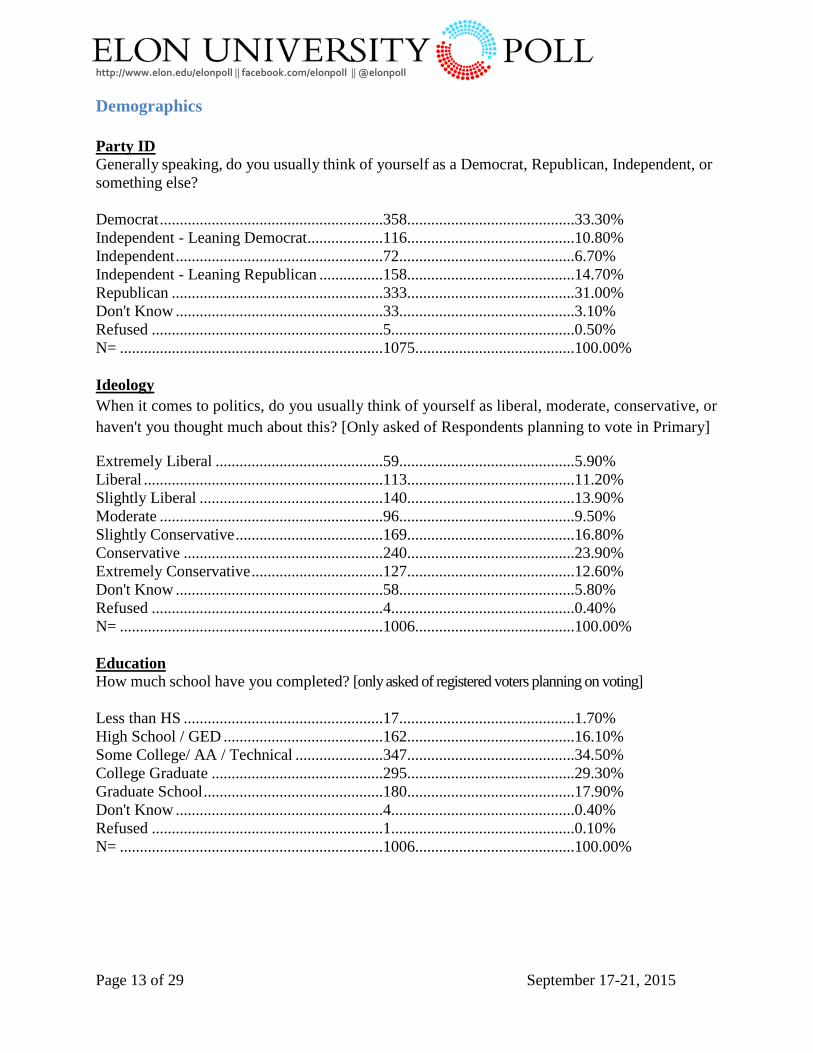
Demographics Party ID Generally speaking, do you usually think of yourself as a Democrat, Republican, Independent, or something else? Democrat ........................................................358..........................................33.30% Independent - Leaning Democrat ...................116..........................................10.80% Independent ....................................................72............................................6.70% Independent - Leaning Republican ................158..........................................14.70% Republican .....................................................333..........................................31.00% Don't Know ....................................................33............................................3.10% Refused ..........................................................5..............................................0.50% N= ..................................................................1075........................................100.00% Ideology When it comes to politics, do you usually think of yourself as liberal, moderate, conservative, or haven't you thought much about this? [Only asked of Respondents planning to vote in Primary]
Extremely Liberal ..........................................59............................................5.90% Liberal ............................................................113..........................................11.20% Slightly Liberal ..............................................140..........................................13.90% Moderate ........................................................96............................................9.50% Slightly Conservative .....................................169..........................................16.80% Conservative ..................................................240..........................................23.90% Extremely Conservative .................................127..........................................12.60% Don't Know ....................................................58............................................5.80% Refused ..........................................................4..............................................0.40% N= ..................................................................1006........................................100.00% Education How much school have you completed? [only asked of registered voters planning on voting] Less than HS ..................................................17............................................1.70% High School / GED ........................................162..........................................16.10% Some College/ AA / Technical ......................347..........................................34.50% College Graduate ...........................................295..........................................29.30% Graduate School .............................................180..........................................17.90% Don't Know ....................................................4..............................................0.40% Refused ..........................................................1..............................................0.10% N= ..................................................................1006........................................100.00%
http://www.elon.edu/elonpoll || facebook.com/elonpoll || @elonpoll
Page 14 of 29 September 17-21, 2015
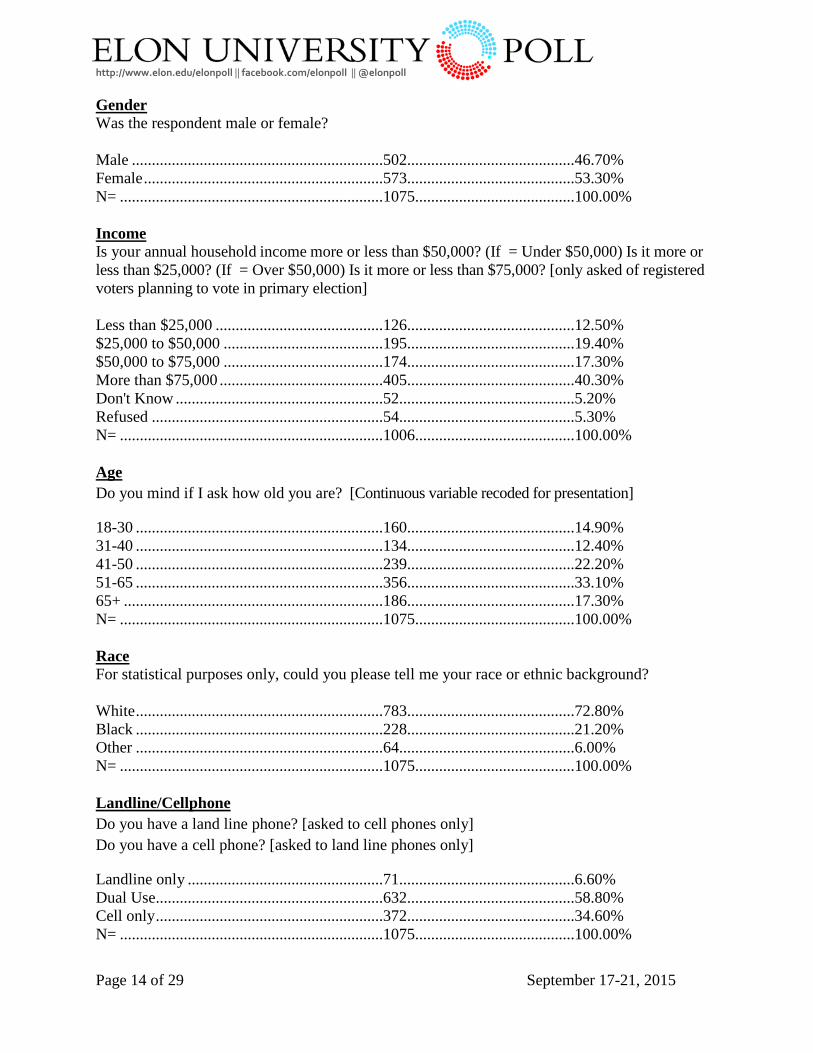
Gender Was the respondent male or female? Male ...............................................................502..........................................46.70% Female ............................................................573..........................................53.30% N= ..................................................................1075........................................100.00% Income Is your annual household income more or less than $50,000? (If = Under $50,000) Is it more or less than $25,000? (If = Over $50,000) Is it more or less than $75,000? [only asked of registered voters planning to vote in primary election] Less than $25,000 ..........................................126..........................................12.50% $25,000 to $50,000 ........................................195..........................................19.40% $50,000 to $75,000 ........................................174..........................................17.30% More than $75,000 .........................................405..........................................40.30% Don't Know ....................................................52............................................5.20% Refused ..........................................................54............................................5.30% N= ..................................................................1006........................................100.00% Age Do you mind if I ask how old you are? [Continuous variable recoded for presentation]
18-30 ..............................................................160..........................................14.90% 31-40 ..............................................................134..........................................12.40% 41-50 ..............................................................239..........................................22.20% 51-65 ..............................................................356..........................................33.10% 65+ .................................................................186..........................................17.30% N= ..................................................................1075........................................100.00% Race For statistical purposes only, could you please tell me your race or ethnic background? White ..............................................................783..........................................72.80% Black ..............................................................228..........................................21.20% Other ..............................................................64............................................6.00% N= ..................................................................1075........................................100.00% Landline/Cellphone Do you have a land line phone? [asked to cell phones only] Do you have a cell phone? [asked to land line phones only]
Landline only .................................................71............................................6.60% Dual Use.........................................................632..........................................58.80% Cell only .........................................................372..........................................34.60% N= ..................................................................1075........................................100.00%
http://www.elon.edu/elonpoll || facebook.com/elonpoll || @elonpoll
Page 15 of 29 September 17-21, 2015
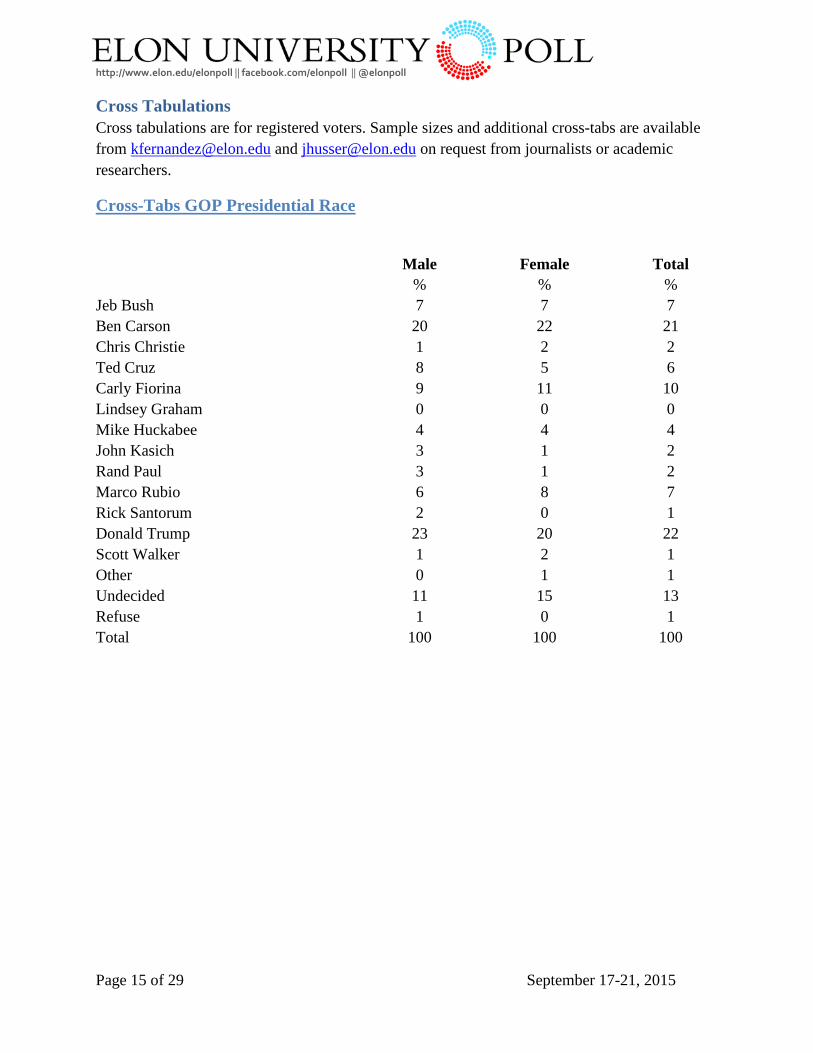
Cross Tabulations Cross tabulations are for registered voters. Sample sizes and additional cross-tabs are available from [email protected] and [email protected] on request from journalists or academic researchers.
Cross-Tabs GOP Presidential Race
Male Female Total
% % %
Jeb Bush 7 7 7 Ben Carson 20 22 21 Chris Christie 1 2 2 Ted Cruz 8 5 6 Carly Fiorina 9 11 10 Lindsey Graham 0 0 0 Mike Huckabee 4 4 4 John Kasich 3 1 2 Rand Paul 3 1 2 Marco Rubio 6 8 7 Rick Santorum 2 0 1 Donald Trump 23 20 22 Scott Walker 1 2 1 Other 0 1 1 Undecided 11 15 13 Refuse 1 0 1 Total 100 100 100
http://www.elon.edu/elonpoll || facebook.com/elonpoll || @elonpoll
Page 16 of 29 September 17-21, 2015
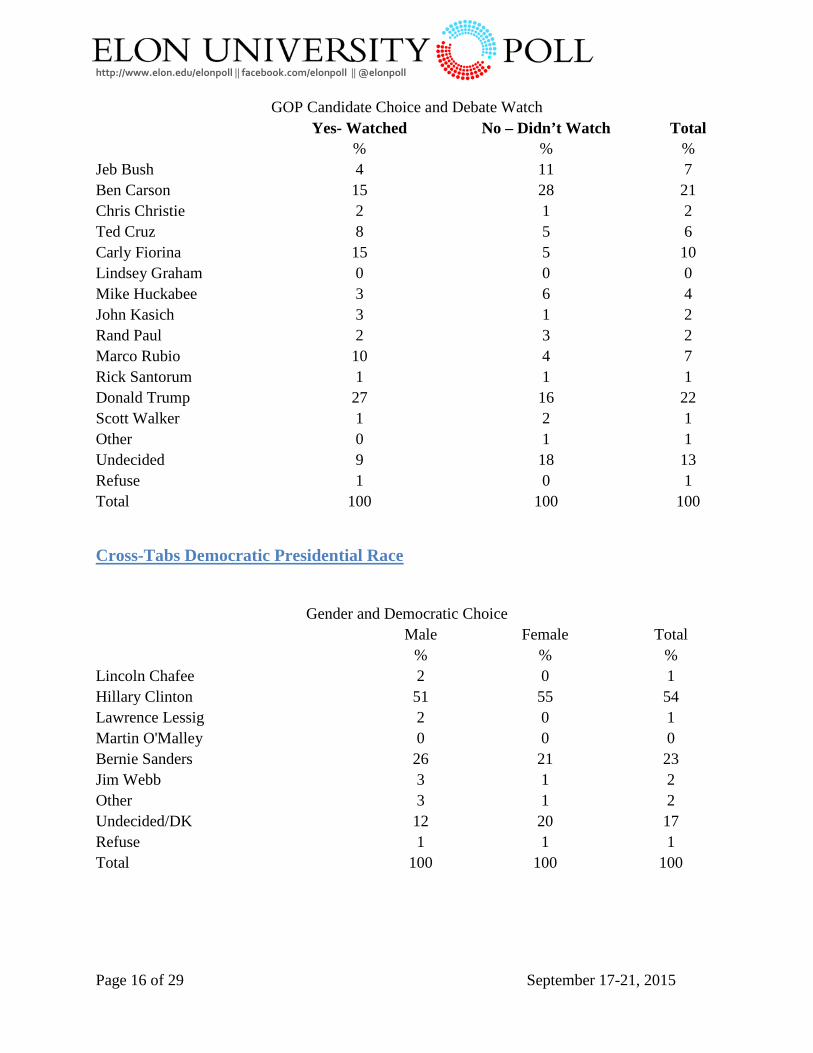
GOP Candidate Choice and Debate Watch
Yes- Watched No – Didn’t Watch Total
% % %
Jeb Bush 4 11 7 Ben Carson 15 28 21 Chris Christie 2 1 2 Ted Cruz 8 5 6 Carly Fiorina 15 5 10 Lindsey Graham 0 0 0 Mike Huckabee 3 6 4 John Kasich 3 1 2 Rand Paul 2 3 2 Marco Rubio 10 4 7 Rick Santorum 1 1 1 Donald Trump 27 16 22 Scott Walker 1 2 1 Other 0 1 1 Undecided 9 18 13 Refuse 1 0 1 Total 100 100 100
Cross-Tabs Democratic Presidential Race
Gender and Democratic Choice
Male Female Total
% % %
Lincoln Chafee 2 0 1 Hillary Clinton 51 55 54 Lawrence Lessig 2 0 1 Martin O'Malley 0 0 0 Bernie Sanders 26 21 23 Jim Webb 3 1 2 Other 3 1 2 Undecided/DK 12 20 17 Refuse 1 1 1 Total 100 100 100
http://www.elon.edu/elonpoll || facebook.com/elonpoll || @elonpoll
Page 17 of 29 September 17-21, 2015
Race and Democratic Choice
White Black Other Total
% % % %
Lincoln Chafee 0 2 0 1 Hillary Clinton 45 65 60 54 Lawrence Lessig 1 0 5 1 Martin O'Malley 0 0 0 0 Bernie Sanders 34 9 18 23 Jim Webb 3 1 0 2 Other 2 3 0 2 Undecided/DK 15 20 17 17 Refuse 2 0 0 1 Total 100 100 100 100
Cross-Tabs: GOP vs. Clinton Head-to-Heads
Bush vs. Clinton : Race
Jeb Bush Hillary Clinton Neither (vol) Don't Know Total
% % % % %
White 59 29 8 4 100 Black 7 85 5 4 100 Other 30 55 10 4 100 Total 46 43 7 4 100
Bush vs. Clinton : Gender
Jeb Bush Hillary Clinton Neither (vol) Don't Know Total
% % % % %
Male 50 39 9 2 100 Female 42 46 6 6 100 Total 46 43 7 4 100
Bush vs. Clinton : Party Identification
Jeb Bush Hillary Clinton Neither (vol) Don't Know Total
% % % % %
Democrats 7 86 3 4 100 Independents 46 36 12 6 100 Republicans 90 5 4 1 100 Total 47 43 6 4 100
http://www.elon.edu/elonpoll || facebook.com/elonpoll || @elonpoll
Page 18 of 29 September 17-21, 2015
Carson vs. Clinton: Gender
Ben Carson Hillary Clinton Neither (vol) Don't Know Total
% % % % %
Male 59 37 3 1 100 Female 48 44 2 6 100 Total 53 41 2 4 100
Carson vs Clinton: Party ID
Ben Carson Hillary Clinton Neither (vol) Don't Know Total
% % % % %
Democrats 12 83 1 4 100 Independents 60 33 4 3 100 Republicans 90 6 1 3 100 Total 54 41 2 3 100
Carson vs. Clinton: Race
Ben Carson Hillary Clinton Neither (vol) Don't Know Total
% % % % %
White 65 29 2 4 100 Black 15 78 2 5 100 Other 38 57 2 2 100 Total 53 41 2 4 100
Trump vs. Clinton: Gender
Donald Trump Hillary Clinton Neither (vol) Don't Know Total
% % % % %
Male 48 40 9 3 100 Female 34 54 9 3 100 Total 41 48 9 3 100
Trump vs Clinton: Party ID
Donald Trump Hillary Clinton Neither (vol) Don't Know Total
% % % % %
Democrats 7 88 3 2 100 Independents 43 43 11 3 100 Republicans 74 11 13 2 100 Total 41 48 9 2 100
http://www.elon.edu/elonpoll || facebook.com/elonpoll || @elonpoll
Page 19 of 29 September 17-21, 2015
Trump vs Clinton: Race
Donald Trump Hillary Clinton Neither (vol) Don't Know Total
% % % % %
White 51 36 10 3 100 Black 6 89 3 2 100 Other 35 49 13 2 100 Total 41 48 9 3 100
Cross-Tabs: McCrory vs Cooper Head-to-Head
McCrory vs Cooper: Party ID
Roy Cooper Pat McCrory Neither (vol) Don't Know Total
% % % % %
Democrats 75 15 1 9 100 Independents 39 44 5 13 100 Republicans 15 73 2 10 100 Total 43 44 2 11 100
McCrory vs Cooper: Race
Roy Cooper Pat McCrory Neither (vol) Don't Know Total
% % % % %
White 35 50 3 11 100 Black 68 20 0 12 100 Other 55 28 5 12 100 Total 43 43 3 11 100
McCrory vs Cooper: Gender
Roy Cooper Pat McCrory Neither (vol) Don't Know Total
% % % % %
Male 39 49 4 8 100 Female 47 38 2 14 100 Total 43 43 3 11 100
http://www.elon.edu/elonpoll || facebook.com/elonpoll || @elonpoll
Page 20 of 29 September 17-21, 2015
Cross-Tabs: Gay Marriage & Abortion
Abortion Laws and Gender
More Difficult Less Difficult
About the same (volunteered) Don't Know Refused
% % % % %
Male 44 37 9 9 1 Female 46 44 4 5 1 Total 45 41 6 7 1
Abortion Laws and Party
More Difficult Less Difficult
About the same (volunteered) Don't Know Refused
% % % % %
Democrats 24 60 7 8 1 Independents 41 43 9 6 1 Republicans 71 20 3 6 0 Total 45 41 6 7 1
Abortion Laws and Race
More Difficult Less Difficult
About the same (volunteered) Don't Know Refused
% % % % %
White 50 38 6 6 1 Black 31 51 8 9 2 Other 40 44 5 9 1 Total 45 41 6 7 1
http://www.elon.edu/elonpoll || facebook.com/elonpoll || @elonpoll
Page 21 of 29 September 17-21, 2015
Gay Marriage and Race
Support Oppose Don’t Know / No Opinion Refused Total
% % % % %
White 44 45 11 0 100 Black 32 57 10 1 100 Other 47 31 19 2 100 Total 41 47 12 0 100
Gay Marriage and Gender
Support Oppose Don’t Know / No Opinion Refused Total
% % % % %
Male 42 45 13 0 100 Female 41 48 10 1 100 Total 41 47 12 0 100
Gay Marriage and Party ID
Support Oppose Don’t Know / No Opinion Refused Total
% % % % %
Democrats 55 36 9 1 100 Independents 46 38 16 0 100 Republicans 24 66 10 0 100 Total 42 46 12 0 100
http://www.elon.edu/elonpoll || facebook.com/elonpoll || @elonpoll
Page 22 of 29 September 17-21, 2015
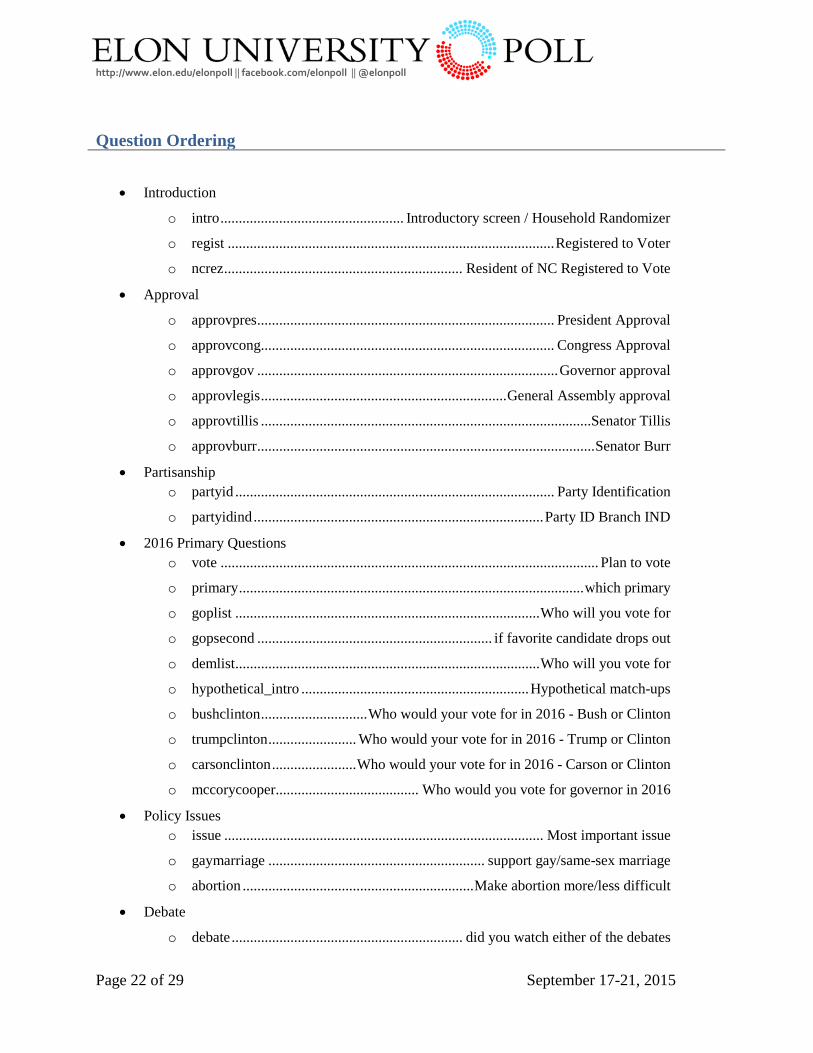
Question Ordering
• Introduction
o intro .................................................. Introductory screen / Household Randomizer
o regist ......................................................................................... Registered to Voter
o ncrez ................................................................. Resident of NC Registered to Vote
• Approval
o approvpres ................................................................................. President Approval
o approvcong................................................................................ Congress Approval
o approvgov .................................................................................. Governor approval
o approvlegis ................................................................... General Assembly approval
o approvtillis ..........................................................................................Senator Tillis
o approvburr ............................................................................................ Senator Burr
• Partisanship o partyid ....................................................................................... Party Identification
o partyidind ............................................................................... Party ID Branch IND
• 2016 Primary Questions o vote ....................................................................................................... Plan to vote
o primary .............................................................................................. which primary
o goplist ................................................................................... Who will you vote for
o gopsecond ................................................................ if favorite candidate drops out
o demlist ................................................................................... Who will you vote for
o hypothetical_intro .............................................................. Hypothetical match-ups
o bushclinton ............................. Who would your vote for in 2016 - Bush or Clinton
o trumpclinton ........................ Who would your vote for in 2016 - Trump or Clinton
o carsonclinton ....................... Who would your vote for in 2016 - Carson or Clinton
o mccorycooper ....................................... Who would you vote for governor in 2016
• Policy Issues o issue ....................................................................................... Most important issue
o gaymarriage ........................................................... support gay/same-sex marriage
o abortion ............................................................... Make abortion more/less difficult
• Debate
o debate ............................................................... did you watch either of the debates
http://www.elon.edu/elonpoll || facebook.com/elonpoll || @elonpoll
Page 23 of 29 September 17-21, 2015
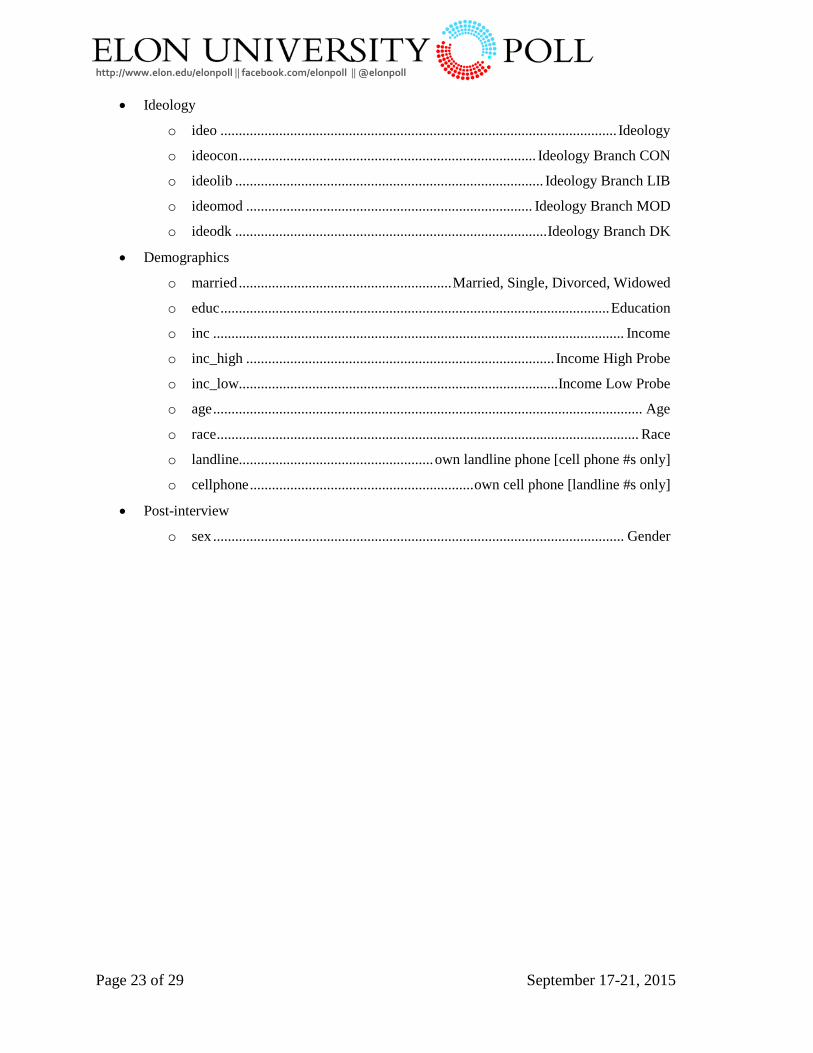
• Ideology
o ideo ............................................................................................................ Ideology
o ideocon ................................................................................. Ideology Branch CON
o ideolib .................................................................................... Ideology Branch LIB
o ideomod .............................................................................. Ideology Branch MOD
o ideodk ..................................................................................... Ideology Branch DK
• Demographics
o married .......................................................... Married, Single, Divorced, Widowed
o educ .......................................................................................................... Education
o inc ................................................................................................................ Income
o inc_high .................................................................................... Income High Probe
o inc_low....................................................................................... Income Low Probe
o age ..................................................................................................................... Age
o race ................................................................................................................... Race
o landline..................................................... own landline phone [cell phone #s only]
o cellphone ............................................................. own cell phone [landline #s only]
• Post-interview
o sex ................................................................................................................ Gender
http://www.elon.edu/elonpoll || facebook.com/elonpoll || @elonpoll
Page 24 of 29 September 17-21, 2015
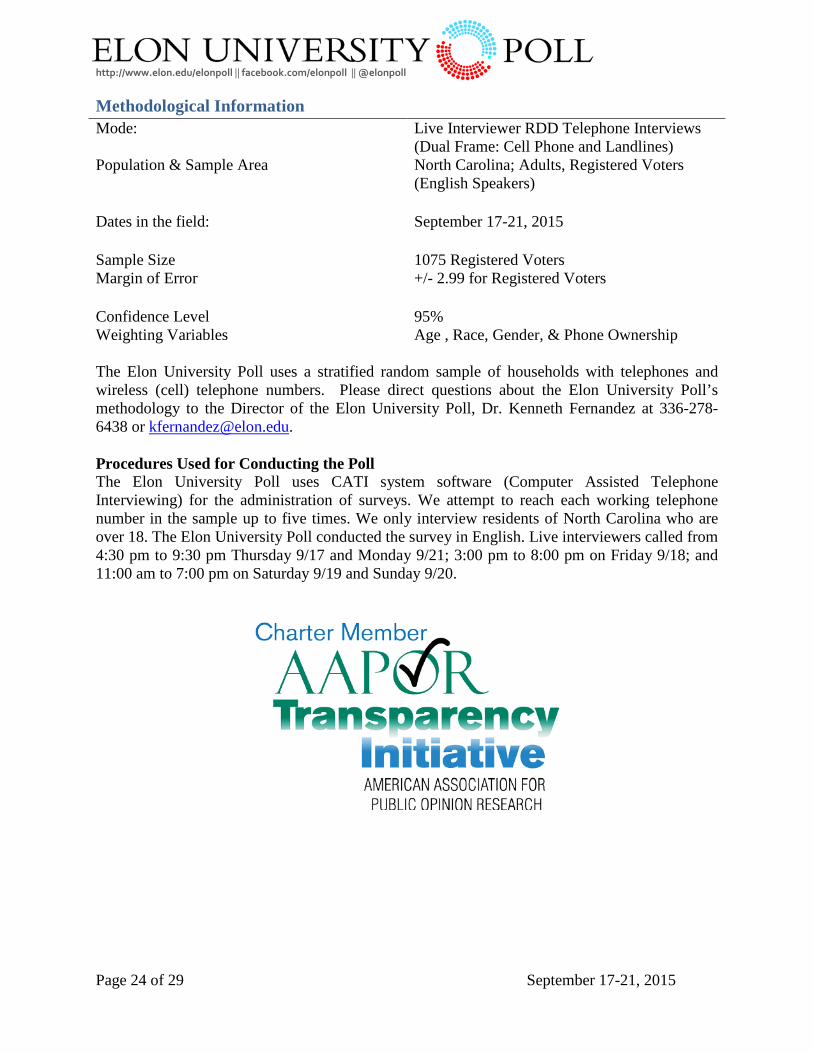
Methodological Information Mode: Live Interviewer RDD Telephone Interviews
(Dual Frame: Cell Phone and Landlines) Population & Sample Area North Carolina; Adults, Registered Voters
(English Speakers)
Dates in the field: September 17-21, 2015
Sample Size 1075 Registered Voters Margin of Error +/- 2.99 for Registered Voters
Confidence Level 95% Weighting Variables Age , Race, Gender, & Phone Ownership The Elon University Poll uses a stratified random sample of households with telephones and wireless (cell) telephone numbers. Please direct questions about the Elon University Poll’s methodology to the Director of the Elon University Poll, Dr. Kenneth Fernandez at 336-278-6438 or [email protected]. Procedures Used for Conducting the Poll The Elon University Poll uses CATI system software (Computer Assisted Telephone Interviewing) for the administration of surveys. We attempt to reach each working telephone number in the sample up to five times. We only interview residents of North Carolina who are over 18. The Elon University Poll conducted the survey in English. Live interviewers called from 4:30 pm to 9:30 pm Thursday 9/17 and Monday 9/21; 3:00 pm to 8:00 pm on Friday 9/18; and 11:00 am to 7:00 pm on Saturday 9/19 and Sunday 9/20.
http://www.elon.edu/elonpoll || facebook.com/elonpoll || @elonpoll
Page 25 of 29 September 17-21, 2015
Additional Methodological Decisions Branching Questions For many questions with multiple response options, we program our surveys to branch into a secondary probing question. “Don’t Know” & “Refused” Response Options All questions include an option for respondents to volunteer “don’t know” or to refuse. In the vast majority of questions, interviewers do not prompt “don’t know” responses. Weighting and Design Effects We typically weight results from the Elon University Poll on multiple demographic characteristics: race, gender, phone use/type and age. Weighting rarely leads to substantial changes in results. We use iterative raking, adjusting one dimension at a time. The standard error of an estimate for a simple random sample is different from the standard error of an estimate based on a weighted sample. This is referred to as a design effect. For example the overall design effect for the final weights for the sample of Adult Residents of North Carolina was 1.15. So an adjusted margin of error for that sample that takes into account the design effect of a survey would be +/- 3.44 instead of +/- 2.99. Within Household Randomization For landlines, we use the common “oldest-youngest” technique to ensure within household randomization. We assume cellphones belong to an individual rather than a household. Thus, we do not conduct within-household randomization within our cellphone sample. Completion Criteria An interview is a complete only if a respondent progresses through the entire survey. Respondents who hang up before completing the last question or who refuse to more than 10 % of the questions are incompletes. Support for Transparency The Elon University Poll supports transparency in survey research and is a charter member of the American Association for Public Opinion Research Transparency Initiative, which is a program promoting openness and transparency about survey research methods and operations among survey research professionals and the industry. All information about the Elon University Poll that we released to the public conforms to reporting conventions recommended by the American Association for Public Opinion Research and the National Council on Public Polls. Question Construction and Question Order In releasing survey results, the Elon University Poll provides the questions as worded and the order in which respondents receive these questions. In some cases question ordering rotates to avoid biases. In an effort to provide neutral, non-biased questions, we attempt to observe conventional question wording and question order protocols in all of our polls. In order to avoid recency or primacy effects, we randomize candidate names and directional response options (e.g. support / oppose) within the text of each question. We pretest every questionnaire multiple times before entering the field.
http://www.elon.edu/elonpoll || facebook.com/elonpoll || @elonpoll
Page 26 of 29 September 17-21, 2015
Sampling Survey Sampling International, LLC, provide samples of telephone numbers. To equalize the probability of telephone selection, sample telephone numbers are systematically stratified according to subpopulation strata (e.g., a zip code, a county, etc.), which yields a sample from telephone exchanges in proportion to each exchange's share of telephone households in the population of interest. Estimates of telephone households in the population of interest are generally obtained from several databases. Samples of household telephone numbers are distributed across all eligible blocks of numbers in proportion to the density of listed households assigned in the population of interest according to a specified subpopulation stratum. Upon determining the projected (or preferred) sample size, a sampling interval is calculated by summing the number of listed residential numbers in each eligible block within the population of interest and dividing that sum by the number of sampling points assigned to the population. From a random start between zero and the sampling interval, blocks are selected systematically in proportion to the density of listed household "working blocks." A block (also known as a bank) is a set of contiguous numbers identified by the first two digits of the last four digits of a telephone number. A working block contains three or more working telephone numbers. Exchanges are assigned to a population on the basis of all eligible blocks in proportion to the density of working telephone households. Once each population's proportion of telephone households is determined, then a sampling interval, based on that proportion, is calculated and specific exchanges and numbers are randomly selected. The wireless component of the study sample starts with determining which area code-exchange combinations in North Carolina are included in the wireless or shared Telcordia types. Similar to the process for selecting household telephone numbers, wireless numbers involve a multi-step process in which blocks of numbers are determined for each area code-exchange combination in the Telcordia types. From a random start within the first sampling interval, a systematic nth selection of each block of numbers is performed and a two-digit random number between 00 and 99 is appended to each selected nth block stem. The intent is to provide a stratification that will yield a sample that is representative both geographically and by large and small carrier. From these, a random sample is generated. Because exchanges and numbers are randomly selected, unlisted as well as listed numbers are included in the sample. Thus, the sample of numbers generated for the population of interest constitutes a random sample of telephone households and wireless numbers of the population. Frequently Asked Questions about our Methodology
1. Who pays for the Elon University Poll? Elon University fully funds the Elon University Poll.
2. Does the Elon University Poll favor a certain party? The Elon University Poll is an academic, non-partisan survey. We do not engage or work with any political candidates or parties. We employ best practices to ensure the results are not biased.
http://www.elon.edu/elonpoll || facebook.com/elonpoll || @elonpoll
Page 27 of 29 September 17-21, 2015
3. Where do you get your numbers?
We obtain samples of randomized phone numbers from Survey Sample International.
4. How many times do you call a number before giving up? We will attempt to call each working number up to five times before removing it from the sample.
5. Do you call both cell phones and land lines? Yes. We use a mixed sample of both cell phones and landlines. We weight on phone ownership to adjust for the higher probability of selection of those who own both cell phones and landline phones.
6. Do you report non-response rates?
Yes. We report non-response rates based on AAPOR guidelines. The response rate for the September 2015 poll was 14.2% which approximates the national average response rates of other high quality survey organizations. The response rate is calculated using the American Association of Public Opinion Research (AAPOR) formula RR4.
7. Do you weight the data?
Yes. We apply weights to the data. An iterative proportional fitting algorithm generates weights based on Census and CDC population parameters of residents in North Carolina. Registered voter screens sometimes cause final weighted variables to not match those parameters exactly- which is intended.
8. Do you randomize response options? Yes. We rotate the order of candidate names in all applicable questions. We also rotate order of text for other questions, such as those that include response options such as “more” and “less.” Furthermore, we rotate the order of some questions themselves if we suspect the order of a question could bias results.
9. Do you conduct within-household randomization?
Yes. For landlines, we use the common “oldest-youngest” rotation to ensure within household randomization. We assume cellphones belong to an individual rather than a household. Thus, we do not conduct within-household randomization within our cellphone sample.
http://www.elon.edu/elonpoll || facebook.com/elonpoll || @elonpoll
Page 28 of 29 September 17-21, 2015
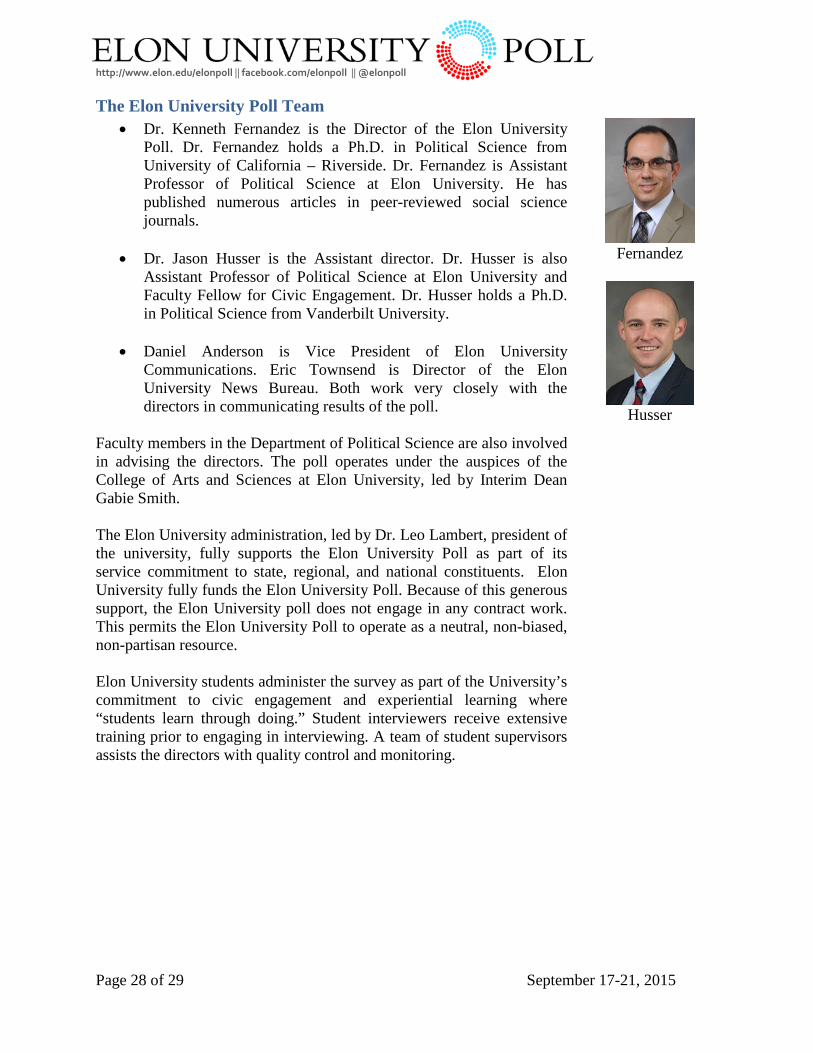
The Elon University Poll Team • Dr. Kenneth Fernandez is the Director of the Elon University
Poll. Dr. Fernandez holds a Ph.D. in Political Science from University of California – Riverside. Dr. Fernandez is Assistant Professor of Political Science at Elon University. He has published numerous articles in peer-reviewed social science journals.
• Dr. Jason Husser is the Assistant director. Dr. Husser is also
Assistant Professor of Political Science at Elon University and Faculty Fellow for Civic Engagement. Dr. Husser holds a Ph.D. in Political Science from Vanderbilt University.
• Daniel Anderson is Vice President of Elon University
Communications. Eric Townsend is Director of the Elon University News Bureau. Both work very closely with the directors in communicating results of the poll.
Faculty members in the Department of Political Science are also involved in advising the directors. The poll operates under the auspices of the College of Arts and Sciences at Elon University, led by Interim Dean Gabie Smith. The Elon University administration, led by Dr. Leo Lambert, president of the university, fully supports the Elon University Poll as part of its service commitment to state, regional, and national constituents. Elon University fully funds the Elon University Poll. Because of this generous support, the Elon University poll does not engage in any contract work. This permits the Elon University Poll to operate as a neutral, non-biased, non-partisan resource. Elon University students administer the survey as part of the University’s commitment to civic engagement and experiential learning where “students learn through doing.” Student interviewers receive extensive training prior to engaging in interviewing. A team of student supervisors assists the directors with quality control and monitoring.
Fernandez
Husser
http://www.elon.edu/elonpoll || facebook.com/elonpoll || @elonpoll
Page 29 of 29 September 17-21, 2015
For more information on the Elon University Poll and this survey, visit http://www.elon.edu/elonpoll or Contact: Kenneth E. Fernandez, Ph.D. Director of the Elon University Poll Assistant Professor of Political Science [email protected] (336) 278-6438 @ElonFernandez Jason A. Husser, Ph.D. Assistant Director of the Elon University Poll Assistant Professor of Political Science Faculty Fellow for Civic Engagement [email protected] (336) 278-5239 @JasonHusser Follow us on Twitter @elonpoll


![XP Presidential Poll Round 15 - s3.amazonaws.com€¦ · Source: XP Investimentos –Presidential Polls [TSE register # available on slide 2] . 4 Highlights Political Analysis The](https://img.pdfslide.net/doc/110x75/5e15f4861b39a95c143568ae/xp-presidential-poll-round-15-s3-source-xp-investimentos-apresidential-polls.jpg)