Embed Size (px)
Citation preview
Embracing Change:
Financial Informatics and Risk Analytics
Mark D. Flood Senior Financial Economist
Federal Housing Finance Board [email protected]
20 July 2006
[floodm:EmbracingChange-v03]
ALL COMMENTS ARE VERY WELCOME The author would like to thank Bill Segal, Deane Yang, David Malmquist, Scott Ciardi, Kirandeep Atwal, and seminar participants at the FDIC for many helpful comments. Any and all remaining errors pertain to the author. The views expressed are those of the author and do not necessarily reflect official positions of the Federal Housing Finance Board or the U.S. Department of the Treasury.
2
• DCMI summary • • Title="Embracing Change: Financial Informatics and Risk Analytics" • Creator="Mark D. Flood" • Description="A software architecture for managing metadata for financial risk analytics" • Date="2006-07-20" • Type="Text" • Format="application/pdf" • Identifier="floodm:EmbracingChange-v03" • Language=en • Subject="JEL:G10, JEL:C63, JEL:C88" • Subject="financial risk modeling, contractual terms and conditions, metadata, ontology, enterprise
design patterns"
3
Embracing Change:
Financial Informatics and Risk Analytics
Abstract We present an enterprise design pattern for managing metadata in support of financial analytics
packages. The complexity of financial modeling typically requires deployment of multiple
financial analytics packages, drawing data from multiple source systems. Business domain
experts are typically needed to understand the data requirements of these packages. Financial
product innovation and research advances imply that data requirements are chronically unstable.
These forces of complexity and instability motivate a software architecture that exposes financial
metadata declaratively, thus allowing on-the-fly metadata modifications by domain experts,
without provoking a costly design-develop-test-deploy lifecycle.
Contents
1. Introduction 2. Financial Analytics 3. Specification and Mapping Costs
3.1. Stovepipe benchmark 3.2. A “numeraire” alternative 3.3. Scalability
4. A Design Pattern 4.1. Forces 4.2. High-level architecture 4.3. Data integration 4.4. Data mapping manager 4.5. Ontology editor 4.6. Metadata manager
5. Conclusions
4
1. Introduction Uncertainty is a fundamental defining characteristic of financial markets, where prices,
returns, and trading volumes fluctuate from day to day and minute to minute. For example, the
efficiency of financial markets is frequently defined statistically, in terms of the martingale or
random-walk properties of observed prices (Cuthbertson, 1996, ch. 5). However, while
uncertainty is frequently parameterized simply as the statistical volatility of securities prices or
returns, the present paper construes it more broadly, to include as well shifts in the statistical
regime describing securities prices, political risks such as changes in regulation or market
structure that alter strategic priorities, technological risks such as new product innovation, and
model risks such as new mathematical techniques or software implementations. This uncertainty
is the underlying motivation for three basic forces affecting risk management databases.
The first is financial innovation, the process of experimentation with and creation of new
financial products. Markets abound with contracts and strategies for limiting, transferring,
diversifying, hedging, buying, and selling risk. As a result, market participants innovate
constantly to better manage the wide variety of risks they face (Merton, 1995); in equilibrium,
assuming perfect information and low transactions costs, risk exposures should thus be transferred
to those who can most efficiently bear them. Financial innovation is encouraged by both changing
market conditions, and advances in research and technology.
The second is model risk, the possibility that a given analytical model or its
implementation is incorrect or inappropriate for the task at hand. As a simple but important
example, it is frequently impossible to identify unequivocally the “best” model for a particular
measurement task – note the popularity of “horse-race” comparisons of alternative models as a
5
research topic.1 Complicating matters, software implementations of the various theoretical
models are themselves changing frequently, with new vendors, new and enhanced features,
updated configuration options, revised calibration data, and bug fixes. The full dimensions of the
practical problem of “model risk” are more extensive still (Jorion, 2001, ch. 21).
The third is strategy evolution, the possibility that the strategic goals and priorities that
justify a particular analytical toolkit may themselves be changing, in response to financial
innovation, legal and regulatory changes, macroeconomic developments, research innovations, or
changes in a firm’s balance-sheet or portfolio composition, among other things (Jorion, 2001, ch.
1). Thus, even holding constant the set of instruments to be measured and the set of available
financial analytics, the set of models used and their configuration may nonetheless be changing.
These three basic forces – financial innovation, model risk, and strategic policy evolution
– conspire to create a very unstable data integration environment for risk-managment analytics.
The nature of the data coming into the models may be changing, due to financial innovation. The
set of models in use may be changing, due to modeling innovations or shifting conditions and
priorities. The nature of outputs requested from the models may be changing, due to changes in
strategic goals. Unfortunately, “fudging” the results with approximations is typically not an
option when concrete trading decisions, capital allocations, and hedging limits are involved, as is
frequently the case. The costs of inaccuracy are simply too large. (Although the focus is on
financial data, many of the ideas developed here may apply to other contexts with unstable
metadata.)
The present paper advocates a strategy of flexible metadata management for risk
1 There are scores of examples of such model comparisons. See, for example, Bühler, Uhrig-Homburg, Walter, and Weber (1999), Eberlein, Keller, and Prause (1998), or Mattey and Wallace (2001) on models of interest rates, implied volatility, and mortgage prepayments, respectively.
6
management analytics, and offers a specific high-level architecture to guide implementation. The
crux of the design involves the definition of formal metadata ontologies encompassing both
traditional SQL metadata as well as any published artifacts describing the data, such as end-user
documentation, data transformation rules, and published schemas. The internal integrity of this
“extended metadata” is enforced by the ontological rules. Derived artifacts (documentation,
schemas, etc.) are generated programmatically, ensuring that they remain consistent with the
ontology and therefore with each other. This guarantee of consistency solves a significant
coordination problem, and enables a high degree of responsiveness to external changes.
2. Financial analytics The term financial analytics refers to the mathematical tools and computer software used
for the valuation and/or risk measurement of financial obligations. Financial obligations typically
include all contracts that commit a firm to legally enforceable payments (irrespective of whether
the firm is payor or payee, or whether such payments are contingent or not).
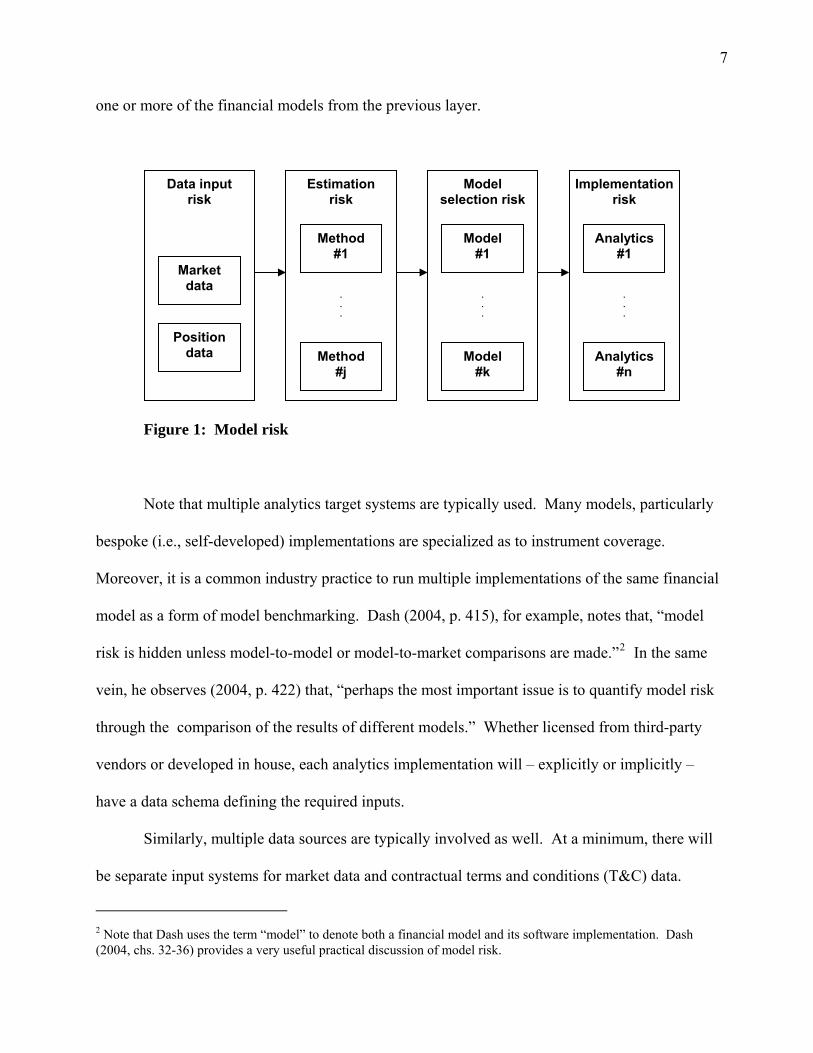
For present purposes, the most significant fact about financial analytics is their
multiplicity. Figure 1, adapted from Jorion (2001, p. 493) depicts as “model risk” the various
layers in the application of financial analytics where the process can go wrong, with errors
compounding themselves from one layer to the next. Data input risk refers to basic data validation
errors; i.e., garbage in, garbage out. Estimation risk refers to various statistical techniques for
deriving model inputs from raw financial data; for example, estimating a returns covariance matrix
or credit-rating transition matrix from historical data. Model selection risk refers to the choice
among various theoretical financial models; for example, HJM vs. BGM vs. CIR models of
interest-rate dynamics. Lastly, and most significantly, implementation risk refers to the choice(s)
of software implementations for the various statistical and financial models. Each will implement
7
one or more of the financial models from the previous layer.
Figure 1: Model risk
Note that multiple analytics target systems are typically used. Many models, particularly
bespoke (i.e., self-developed) implementations are specialized as to instrument coverage.
Moreover, it is a common industry practice to run multiple implementations of the same financial
model as a form of model benchmarking. Dash (2004, p. 415), for example, notes that, “model
risk is hidden unless model-to-model or model-to-market comparisons are made.”2 In the same
vein, he observes (2004, p. 422) that, “perhaps the most important issue is to quantify model risk
through the comparison of the results of different models.” Whether licensed from third-party
vendors or developed in house, each analytics implementation will – explicitly or implicitly –
have a data schema defining the required inputs.
Similarly, multiple data sources are typically involved as well. At a minimum, there will
be separate input systems for market data and contractual terms and conditions (T&C) data.
2 Note that Dash uses the term “model” to denote both a financial model and its software implementation. Dash (2004, chs. 32-36) provides a very useful practical discussion of model risk.
Model selection risk
Model #1
Model #k
.
.
.
Data input risk
Estimation risk
Implementation risk
Method #1
Analytics #1
Market data
Analytics #n
.
.
.
Position data Method
#j
.
.
.
8
Typically, however, both market and T&C categories will themselves break out into multiple
systems. For example, market data may include yield curve data, market prices on instruments
with and without registered CUSIP identifiers, vendor-based mortgage prepayment forecasts,
correlation matices, and volatility surfaces. T&C data may include multiple trading and lending
databases, in addition to the general ledger accounting system.
3. Specification and mapping costs
Brainpower is by far our scarcest resource. – E. W. Dijkstra (1972)
The sources of instability described in the introduction manifest themselves in two
concrete ways affecting data integration. First, there is a potentially numerous and unstable list of
source systems from which data will ultimately be drawn. Second, there is another potentially
numerous and unstable list of target analytical packages which the data will feed. There are two
costly operations involved with managing the metadata for such a system: (a) specification of the
data schemas for each system; and (b) mapping between schemas in the source systems and input
schemas for the target analytics packages.3
The significance of these costs has long been recognized. Bernstein and Rahm, for
example, have a series of papers considering what they call the “model management” problem
(see Bernstein and Rahm (2000), Bernstein (2003), and Rahm and Bernstein (2001)). At the core
of their discussion is a proposal to “make model [i.e., specification] and mapping first-class
3 Unless otherwise noted, we use the term “specification” here instead of “model” and “modeling” – which latter two appear frequently in the computer science literature (e.g., OMG (2002), or Bernstein and Rahm (2000)) – to disambiguate between references to “data modeling,” “object modeling,” “financial modeling,” etc.
9
objects with generic high-level operations that simplify their use.”4 Regarding specifications (i.e.,
“models” in their parlance), Bernstein, Levy, and Pottinger (2000, p. 15) note that, “applications
that manipulate models [specifications] are complicated and hard to build. It is slow work.”
Miller, et al. (2001, p. 78), note that, “at the core of all integration tasks lies the representation,
understanding and manipulation of schemas and the data that they describe and structure.”
Regarding mappings, Rahm and Bernstein (2001) provide a very useful survey of the various
attempts to relieve the burden of the mapping process through “automatic schema matching.”
Bernstein (2000), holds out hope that a generic, automated solution to what he calls the
“model management” problem will ultimately be implemented. This contrasts with Mitra and
Wiederhold (2004, p. 99), who report that fully automated generation of mappings between
models (which they define as ontologies, or sets of domain-specific terms and their relationships)
is currently impractical: “However, in order to declaratively capture the semantics of the
ontologies and the application that uses them, we would have to use a very expressive language.
Automated reasoning with very expressive languages soon becomes intractable.”5 Although they
work with full-blown ontologies rather than simple schema, the basic point remains: costly
human intervention is required to manage metadata and mappings between independent metadata
sets.
Much of the current interest in metadata modeling is motivated or enhanced by the promise
of leveraging the power of the Internet for automated sharing of semantics – in other words, the
4 Bernstein and Rahm (2000); emphasis in the original. For Bernstein and Rahm, a “model” is a quite general metadata artifact, including XML DTDs or SQL schemas, but also workflow definitions and software configurations. Using this very general interpretation of “model,” a “mapping” is then a model relating the elements of two other models. 5 The relationship between expressiveness and tractability is intricate. For example, see Zolin (2006) for a tool that relates various description logic dialects to the hardness of various reasoning tasks, as well as further references on the topic.
10
Semantic Web.6 Discussions of metadata management for the Semantic Web translate only with
difficulty to the context of financial analytics, since the latter concerns a problem that is much
narrower and more precise. For instance, much of the literature on the Semantic Web is organized
around generic technologies for querying the Internet’s heterogeneous data sources, where the
introduction of shared semantics should, for example, reduce the ambiguity that results in so many
false-positive results when using an ordinary Internet search engine. The literature typically
avoids the “Esperanto” solution of devising a universal, shared, semantic language, in deference to
a more federated approach based on mapping or “mediation” (see, for example, Lakshmanan and
Sadri (2003), Halevy, Ives, Mork, and Tatarinov (2003), or Halevy, et al. (2004)). Importantly for
our purposes, the focus on a generic querying solution frequently diverts attention from the level
of precision required for mapping data for input to financial analytics. It is not sufficient, for
example, that a mapping technology be more precise than a Google keyword search; for financial
analytics to generate meaningful results, the mapping that populates the input fields must be exact.
The remainder of this section isolates the key software maintenance costs associated with
modeling and mapping metadata with a very simple graphical exposition. Although this section
presents the issues in an abstract theoretical context, the specific problems described here –
modeling cost and mapping cost – have been identified as central through many months of
prototyping on concrete, applied solutions in financial risk management.
3.1 Stovepipe benchmark
The basic forces lend themselves well to a simple graphical formalism.7 We begin by
6 The Semantic Web is a set of technologies for associating well defined shared semantics (i.e., meanings) to content available on the Internet. This is a large and complex topic, well beyond the scope of the present paper. For more information, see W3C (2004) and the references therein. 7 This section uses very basic graph theory to isolate clearly the metadata scalability issue. For an introduction to graph terminology, see Balakrishnan (1997).
11
describing a “stovepipe” topology, in which each of several source systems is mapped
independently to each of several analytics packages. Assume that each source system and (target)
analytics system has its own formal data schema.8 Represent each schema by a vertex in a graph
G. Let S = {si}, (i=1, …, m) represent the set of source data schemas, and let A = {aj},
(j=1, …, n) represent the set of analytics (target) schemas. For simplicity, assume that A and S
are disjoint, and assume a fixed scalar cost, kspec, of specifying a data schema. To simplify the
exposition, we assume that the specification cost, kspec, is constant for all data schemas to be
specified. This cost might be measured in analyst-hours, or converted to dollars at a relevant wage
rate. The upshot is an empty bipartite graph, G0 = (S + A), where the total specification cost,
denoted by the function Kspec(▪), is proportional to the order (i.e., vertex count) of the graph:
Kspec(G0) = |S + A|kspec = (m + n)kspec. In other words, the specification cost is a fixed multiple of
the number of source and analytical systems in use.
We next extend the graph by adding mappings between source and analytics data schemas.
Represent each mapping as an edge, siaj, between a source schema, si, and a target schema, aj. For
simplicity, assume that every source system is mapped into every analytics package, and assume a
constant cost, kmap, of creating a mapping between data schemas. The upshot is the complete
bipartite graph, G1 = (S + A, E), where the total mapping cost is proportional to the size (i.e.,
edge count) of the graph: Kmap(G1) = |E|kmap. For a complete bipartite graph (every source
mapped to every target), the edge count is the product of the (disjoint) vertex counts, |E| = (mn),
and the total mapping cost reduces to: Kmap(G1) = (mn)kmap. An example of G1 for m=3 and n=4
8 A schema is a formal description of the structure of and constraints on a data set. In practice, schemas are typically either relational schemas (preferably in standard SQL/DDL) or XML schemas (for example, DTDs, XSD schemas, or RelaxNG schemas). In many cases, either the system vendor does not provide a formal schema, or the available schema is inadequate (e.g., unnecessarily permissive). In such cases, a specialized schema tailored specifically to the data-integration requirements can be created. This guarantees that the assumption is always satisfiable.
12
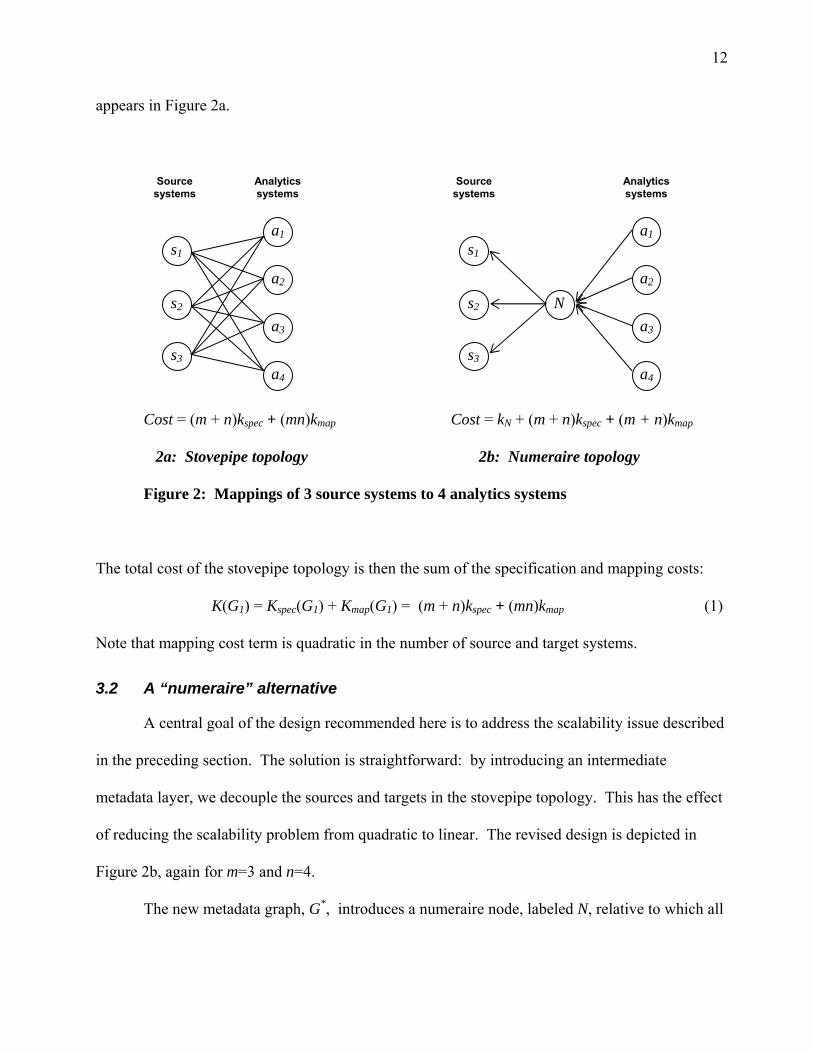
appears in Figure 2a.
Cost = (m + n)kspec + (mn)kmap Cost = kN + (m + n)kspec + (m + n)kmap
2a: Stovepipe topology 2b: Numeraire topology
Figure 2: Mappings of 3 source systems to 4 analytics systems
The total cost of the stovepipe topology is then the sum of the specification and mapping costs:
K(G1) = Kspec(G1) + Kmap(G1) = (m + n)kspec + (mn)kmap (1)
Note that mapping cost term is quadratic in the number of source and target systems.
3.2 A “numeraire” alternative
A central goal of the design recommended here is to address the scalability issue described
in the preceding section. The solution is straightforward: by introducing an intermediate
metadata layer, we decouple the sources and targets in the stovepipe topology. This has the effect
of reducing the scalability problem from quadratic to linear. The revised design is depicted in
Figure 2b, again for m=3 and n=4.
The new metadata graph, G*, introduces a numeraire node, labeled N, relative to which all
Source systems
Analytics systems
s1
s2
s3
a1
a2
a3
a4
N
a1
a2
a3
a4
s1
s2
s3
Source systems
Analytics systems
13
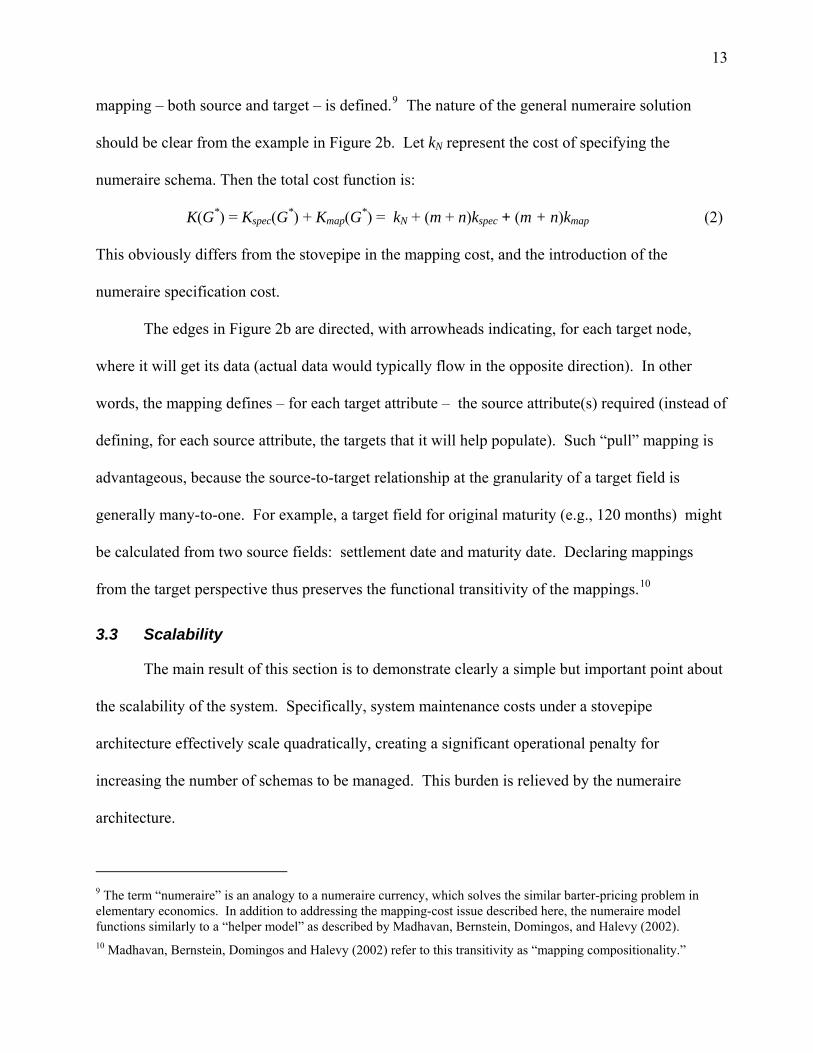
mapping – both source and target – is defined.9 The nature of the general numeraire solution
should be clear from the example in Figure 2b. Let kN represent the cost of specifying the
numeraire schema. Then the total cost function is:
K(G*) = Kspec(G*) + Kmap(G*) = kN + (m + n)kspec + (m + n)kmap (2)
This obviously differs from the stovepipe in the mapping cost, and the introduction of the
numeraire specification cost.
The edges in Figure 2b are directed, with arrowheads indicating, for each target node,
where it will get its data (actual data would typically flow in the opposite direction). In other
words, the mapping defines – for each target attribute – the source attribute(s) required (instead of
defining, for each source attribute, the targets that it will help populate). Such “pull” mapping is
advantageous, because the source-to-target relationship at the granularity of a target field is
generally many-to-one. For example, a target field for original maturity (e.g., 120 months) might
be calculated from two source fields: settlement date and maturity date. Declaring mappings
from the target perspective thus preserves the functional transitivity of the mappings.10
3.3 Scalability
The main result of this section is to demonstrate clearly a simple but important point about
the scalability of the system. Specifically, system maintenance costs under a stovepipe
architecture effectively scale quadratically, creating a significant operational penalty for
increasing the number of schemas to be managed. This burden is relieved by the numeraire
architecture.
9 The term “numeraire” is an analogy to a numeraire currency, which solves the similar barter-pricing problem in elementary economics. In addition to addressing the mapping-cost issue described here, the numeraire model functions similarly to a “helper model” as described by Madhavan, Bernstein, Domingos, and Halevy (2002). 10 Madhavan, Bernstein, Domingos and Halevy (2002) refer to this transitivity as “mapping compositionality.”

14
1 2 3 4 5 6 7 8 9 101 2 34 5678910
0
20
40
60
80
100
120
Cos
t
m
n 1 2 3 4 5 6 7 8 9 101 23 45678910
0
20
40
60
80
100
120
Cos
t
m
n
3a: Stovepipe topology 3b: Numeraire topology
Figure 3: Scaling of system maintenance costs
Referring to equation (1), the cost of the stovepipe arrangement scales with the product in
the final term. That is, K(G1) = O(nm) as n,m→∞. If there is any positive correlation between n
and m – for example, due to financial innovation simultaneously increasing the number of
instrument types (sources) and the number of analytical packages (targets) used to value them –
then the cost of a stovepipe system will scale quadratically: K(G ) = O(n21 ) as n→∞. In either
case, the nonlinear scaling is a serious problem, since nonlinear expansion of software
maintenance costs for specification and mapping could easily lead to an overall system that is
inflexible in the context of a rapidly changing financial environment.
The numeraire arrangement described by equation (2) clearly scales linearly. Specifically,
K(G*) = O(n+m) as n,m→∞. Alternatively, if n and m are correlated: K(G*) = O(n) as n→∞. The
two cost equations, (1) and (2), are plotted in Figures 3a and 3b, respectively (assuming kN=3 and
kspec=k =1). map
15
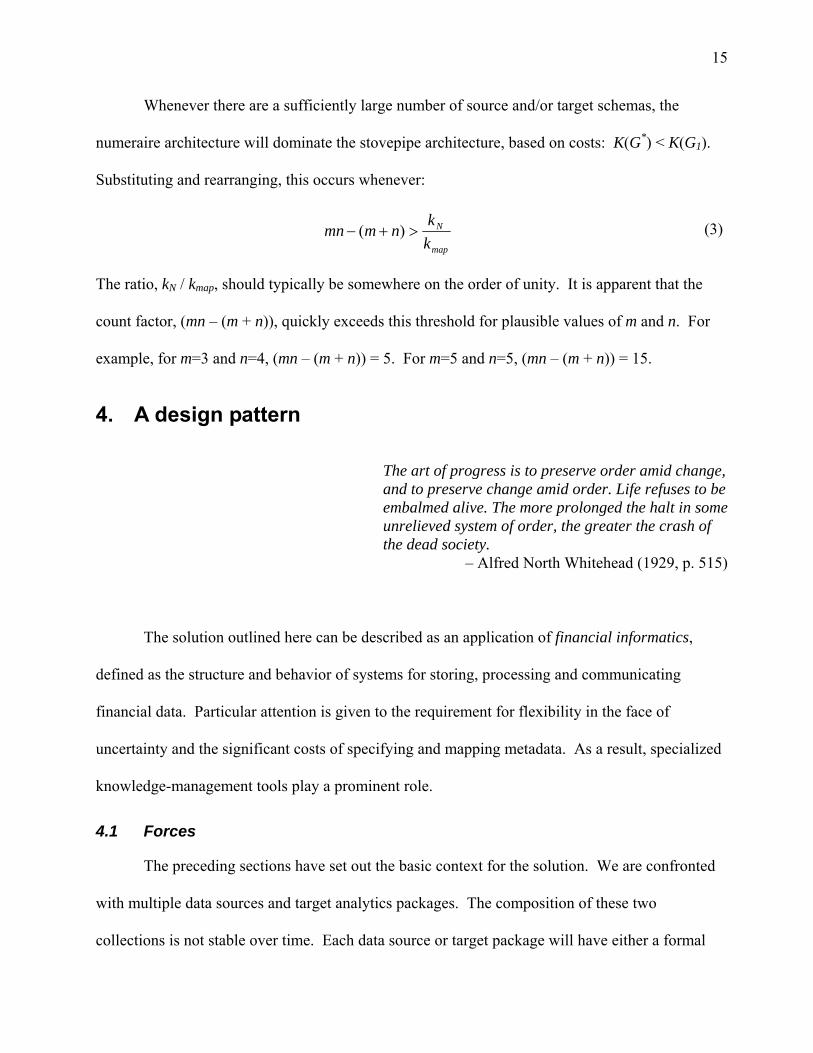
Whenever there are a sufficiently large number of source and/or target schemas, the
numeraire architecture will dominate the stovepipe architecture, based on costs: K(G*) < K(G1).
Substituting and rearranging, this occurs whenever:
map
N
kk
nmmn >+− )( (3)
The ratio, k / kN map, should typically be somewhere on the order of unity. It is apparent that the
count factor, (mn – (m + n)), quickly exceeds this threshold for plausible values of m and n. For
example, for m=3 and n=4, (mn – (m + n)) = 5. For m=5 and n=5, (mn – (m + n)) = 15.
4. A design pattern
The art of progress is to preserve order amid change, and to preserve change amid order. Life refuses to be embalmed alive. The more prolonged the halt in some unrelieved system of order, the greater the crash of the dead society.
– Alfred North Whitehead (1929, p. 515)
The solution outlined here can be described as an application of financial informatics,
defined as the structure and behavior of systems for storing, processing and communicating
financial data. Particular attention is given to the requirement for flexibility in the face of
uncertainty and the significant costs of specifying and mapping metadata. As a result, specialized
knowledge-management tools play a prominent role.
4.1 Forces
The preceding sections have set out the basic context for the solution. We are confronted
with multiple data sources and target analytics packages. The composition of these two
collections is not stable over time. Each data source or target package will have either a formal
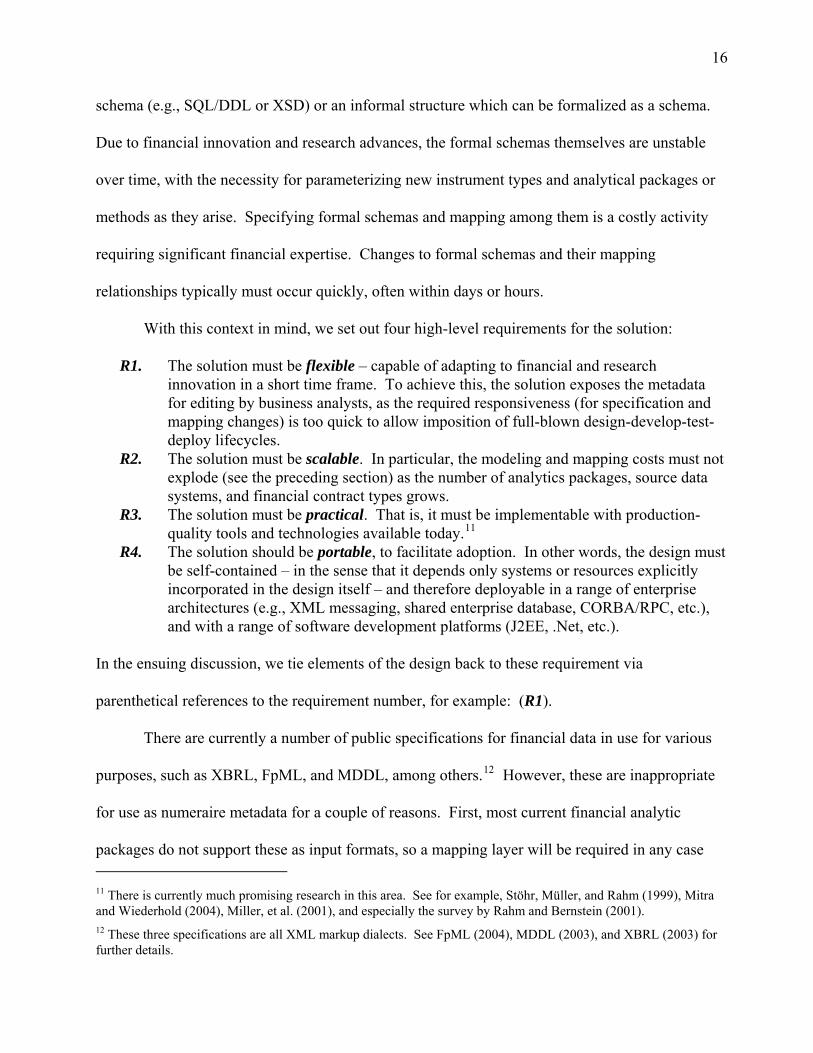
16
schema (e.g., SQL/DDL or XSD) or an informal structure which can be formalized as a schema.
Due to financial innovation and research advances, the formal schemas themselves are unstable
over time, with the necessity for parameterizing new instrument types and analytical packages or
methods as they arise. Specifying formal schemas and mapping among them is a costly activity
requiring significant financial expertise. Changes to formal schemas and their mapping
relationships typically must occur quickly, often within days or hours.
With this context in mind, we set out four high-level requirements for the solution:
R1. The solution must be flexible – capable of adapting to financial and research innovation in a short time frame. To achieve this, the solution exposes the metadata for editing by business analysts, as the required responsiveness (for specification and mapping changes) is too quick to allow imposition of full-blown design-develop-test-deploy lifecycles.
R2. The solution must be scalable. In particular, the modeling and mapping costs must not explode (see the preceding section) as the number of analytics packages, source data systems, and financial contract types grows.
R3. The solution must be practical. That is, it must be implementable with production-quality tools and technologies available today.11
R4. The solution should be portable, to facilitate adoption. In other words, the design must be self-contained – in the sense that it depends only systems or resources explicitly incorporated in the design itself – and therefore deployable in a range of enterprise architectures (e.g., XML messaging, shared enterprise database, CORBA/RPC, etc.), and with a range of software development platforms (J2EE, .Net, etc.).
In the ensuing discussion, we tie elements of the design back to these requirement via
parenthetical references to the requirement number, for example: (R1).
There are currently a number of public specifications for financial data in use for various
purposes, such as XBRL, FpML, and MDDL, among others.12 However, these are inappropriate
for use as numeraire metadata for a couple of reasons. First, most current financial analytic
packages do not support these as input formats, so a mapping layer will be required in any case 11 There is currently much promising research in this area. See for example, Stöhr, Müller, and Rahm (1999), Mitra and Wiederhold (2004), Miller, et al. (2001), and especially the survey by Rahm and Bernstein (2001). 12 These three specifications are all XML markup dialects. See FpML (2004), MDDL (2003), and XBRL (2003) for further details.
17
(R3). More importantly, using a third-party specification in the role of numeraire gives control
over the metadata to entities outside of managerial control: third-party schemas can change more
quickly or more slowly than dictated by the requirements of the organization, potentially in subtle
ways. This sort of dependency is unnecessary. 13 It is safer to decouple the crucial metadata from
third-party specifications via a mapping layer.
4.2 High-level architecture
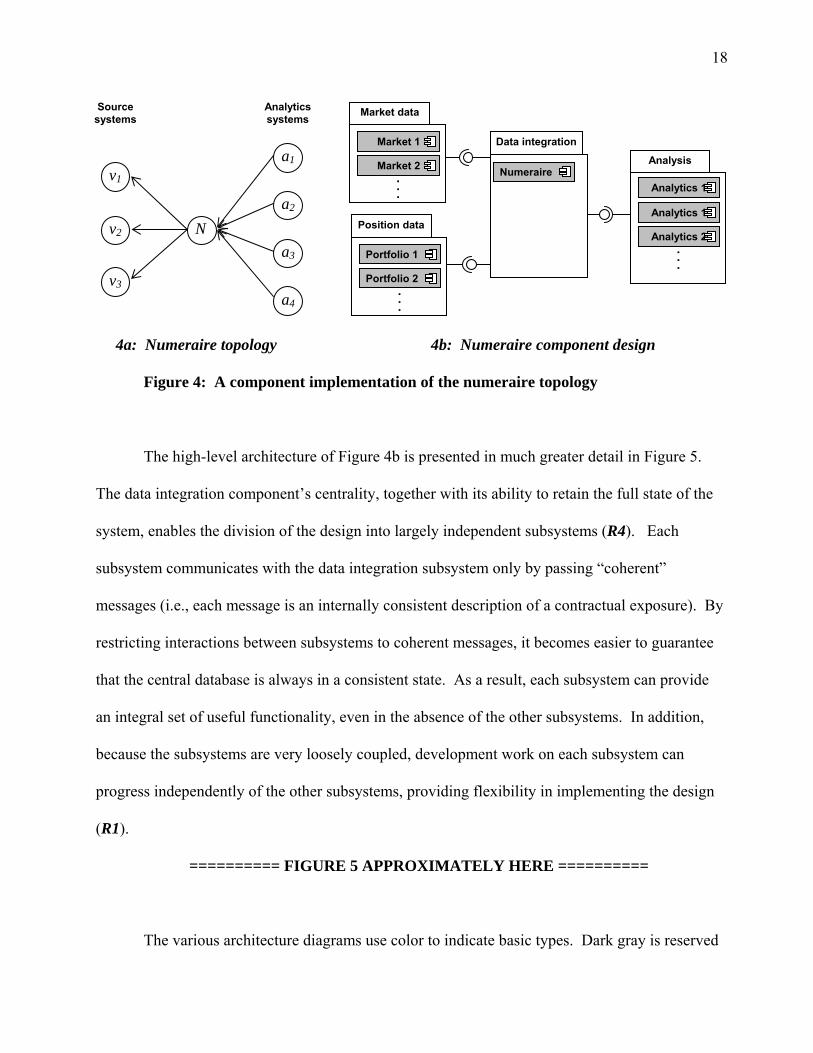
As depicted in Figure 4b, the design divides into four separate subsystems. As the figure
suggests, the component design attempts to implement the numeraire topology outlined in the
preceding section (R2). The source systems include both Position Data and Market Data
components. The analytics systems appear in the Analytics component. The numeraire is part of
the Data Integration component. This division into subsystems enhances portability (R4), since
the subsystems are very loosely coupled. As needed, they can be deployed and maintained on
separate (and potentially diverse) platforms. The four subsystems are discussed in greater detail
below and depicted in the accompanying component diagrams.14
13 This is essentially the same reason that object designers are frequently advised to “prefer composition to inheritance.” See, for example, Sutter and Alexandrescu (2004). 14 The component diagrams here follow the Unified Modeling Language (UML) 2.0 specification, a standard visual language for specifying and documenting computer software diagrammatically. The UML 2.0 specification, OMG (2005, p. 139), defines a component as “as a modular unit with well-defined interfaces that is replaceable within its environment.” Under UML 2.0, a subsystem element is a special case of a component, and functionally identical; we use the terms “subsystem” and “component” interchangeably here. See OMG (2005) for the full UML language definition, and Ambler (2005) for further guidelines.
18
4a: Numeraire topology 4b: Numeraire component design
Figure 4: A component implementation of the numeraire topology
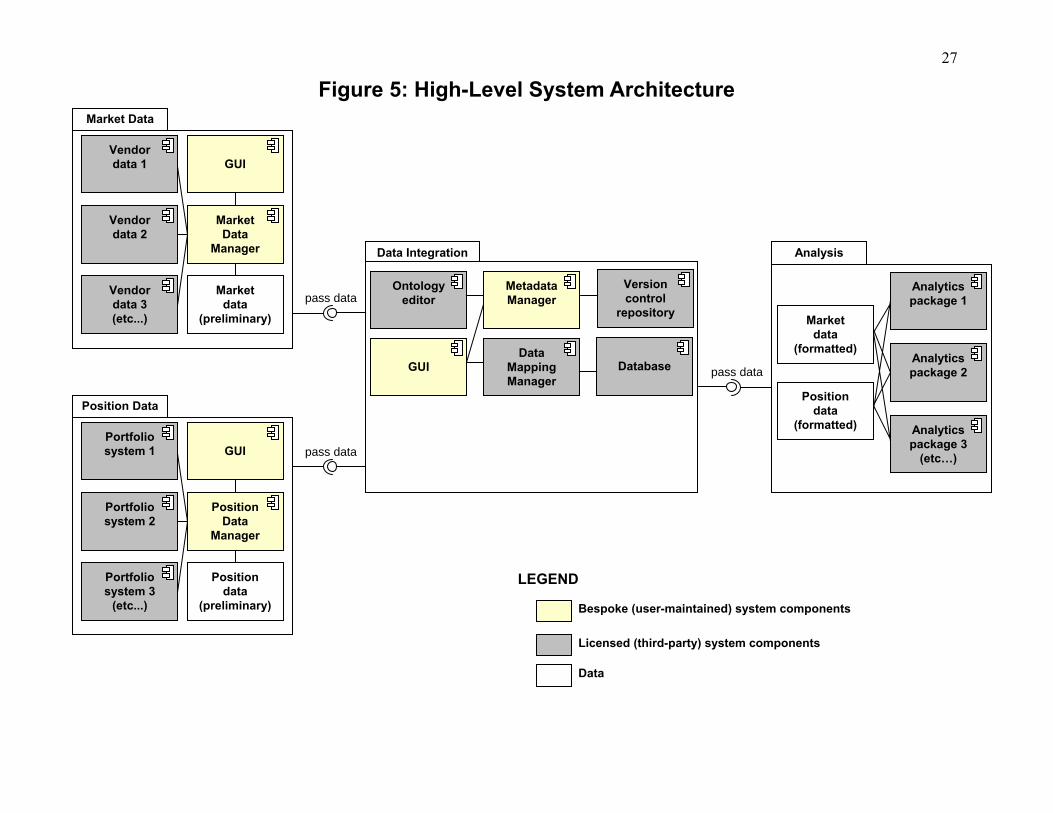
The high-level architecture of Figure 4b is presented in much greater detail in Figure 5.
The data integration component’s centrality, together with its ability to retain the full state of the
system, enables the division of the design into largely independent subsystems (R4). Each
subsystem communicates with the data integration subsystem only by passing “coherent”
messages (i.e., each message is an internally consistent description of a contractual exposure). By
restricting interactions between subsystems to coherent messages, it becomes easier to guarantee
that the central database is always in a consistent state. As a result, each subsystem can provide
an integral set of useful functionality, even in the absence of the other subsystems. In addition,
because the subsystems are very loosely coupled, development work on each subsystem can
progress independently of the other subsystems, providing flexibility in implementing the design
(R1).
========== FIGURE 5 APPROXIMATELY HERE ==========
The various architecture diagrams use color to indicate basic types. Dark gray is reserved
Market data
▪ ▪ ▪
Market 1
Market 2
Position data
▪ ▪ ▪
Portfolio 1
Portfolio 2
Data integration
Numeraire Analysis
▪ ▪ ▪
Analytics 1
Analytics 2
Analytics 1
Source systems
Analytics systems
v1
a1
a2
v2
v3
a3
a4
N
19
for components that are readily available today from third-party vendors, and which can be
integrated into the system. Light gray indicates software components that will likely require a
bespoke implementation. (The most important bespoke component – the metadata manager – is
further elaborated in Figure 6.) Labeled white boxes indicate important data elements. The small
white boxes on component boundaries represent “port” classes of the component (the component’s
explicit points of communication or interaction with its environment other components).
Following the recommendations of Ambler (2005, p. 135), the <<application>> stereotype indicates
user-interface components, <<datastore>> indicates persistent storage, and <<infrastructure>>
indicates other “behind-the-scenes” technical components.
========== FIGURE 6 APPROXIMATELY HERE ==========
4.3 Data integration
The data integration subsystem sits at the center of the design, literally and figuratively. It
includes a database, and so can maintain the full official state of the system at a given point in
time. Importantly, it also includes the metadata manager component and ontology editor, thus
exposing metadata for editing by financial analysts. Note that the design makes extensive use of
XML and XSLT technologies, consistent with the requirements of practicality (R3) and, to a lesser
extent, portability (R4).15 The subsections that follow describe the major subcomponents (data
mapping manager, ontology editor, metadata manager, etc.) of the data integration subsystem.
4.4 Data mapping manager and database
The data mapping manager is responsible for both: (a) recording the mapping declarations
that provide a “crosswalk” between fields in different specifications (or between different versions
15 The XML and XSLT components in the design can be replaced with other technologies, but at the cost of having to find a replacement for the XML parser and validator, and XSLT engine, which are widely available. Replacement components would likely be bespoke implementations.
20
of the same specification); and (b) actually converting data from one specification to another. The
data mapping manager receives the necessary source and target schemas as artifacts generated by
the metadata manager. We elide further discussion of the otherwise important details of mapping
implementation both because a number of commercial data integration products are available for
GUI-based schema matching and data conversion (R3), and to maintain a focus on ontology-based
metadata management, which we see as a key contribution of the paper.
Because a relational database should typically provide persistent storage for data satisfying
the numeraire specification (as well as perhaps some or all of the source and target specifications),
the data mapping manager will interact closely with the database. The relational schema should
typically be maintained as part of the metadata ontology described below.
4.5 Ontology editor
One of the central aspects of the flexibility requirement (R1) is the ability of financial
analysts to modify (perhaps frequently) the specifications of the various data sources and targets.
The system has a number of disparate pieces, or artifacts. For example, these might include:
• end-user documentation of the specification, • XML schemas, • SQL schemas, • XML-to-SQL conversion stylesheets, • data dictionaries • sample/test data, and • bibliographies of relevant financial research, legislation, etc.
These must remain consistent with one another, even in the face of such changes. The design
employs a formal ontology to record these facts as declarative metadata (as opposed to procedural
business rules). Importantly, our ontologies include the rules to enforce consistency among the
disparate pieces at all times. This isolation of all specification metadata in a comprehensive,
internally consistent ontology is what makes flexibility possible.

21
Formally, an ontology is a collection of terms and their relationships as used in a domain
of discourse.16 In our case, a “domain of discourse” is a financial analytics application.
Simplisticly, each analytics domain has its own terms for things (interrelated by mappings, among
other things), and therefore its own ontology. As a practical matter, an ontology differs from an
ordinary technical dictionary in that ontologies are typically specified with a formal syntax that
makes them accessible to programmatic access by applications – like an ontology editor – that can
process that syntax. The ontology editor must enable users to modify both the general structure of
a data-specification ontology as well as the individual specification instances corresponding to
each data source and target. Constraining specification instances to share a common structure
greatly facilitates programmatic access to the ontology for editing and generating documentation,
data schemas, test data, etc.
The structure-instance pattern has a long history in software design, including, for
example, ontologies, data typing, object-oriented programming (OOP), data modeling, and model-
driven architecture. As a result, there a number of analogous descriptions available for the
software design pattern we propose here. Description logics, for example, typically refer to the
ontological structure as the “terminology box,” or “TBox,” while the ontology instances are
“assertion boxes,” or “ABoxes.”17 Frame-based knowledge representations (like object-oriented
programming) refer to the ontological structure as the “classes” and the ontology instances as
16 Informally, an ontology is a knowledge base. See Gómez-Pérez, A., M. Fernández-López, and O. Corcho (2004), especially ch. 1, for a more thorough definition and general survey of ontologies. 17 A description logic is a standard formal representation (based on first-order logic) of a knowledge base. Description logics also underly the Web Ontology Language (OWL) – in particular, the OWL-DL subset. See Nardi and Brachman, (2002), Baader, Horrocks and Sattler (2004), and Borgida, Lenzerini and Rosati (2002) for an introductory treatment of description logics and related knowledge representations.
22
18“instances.”
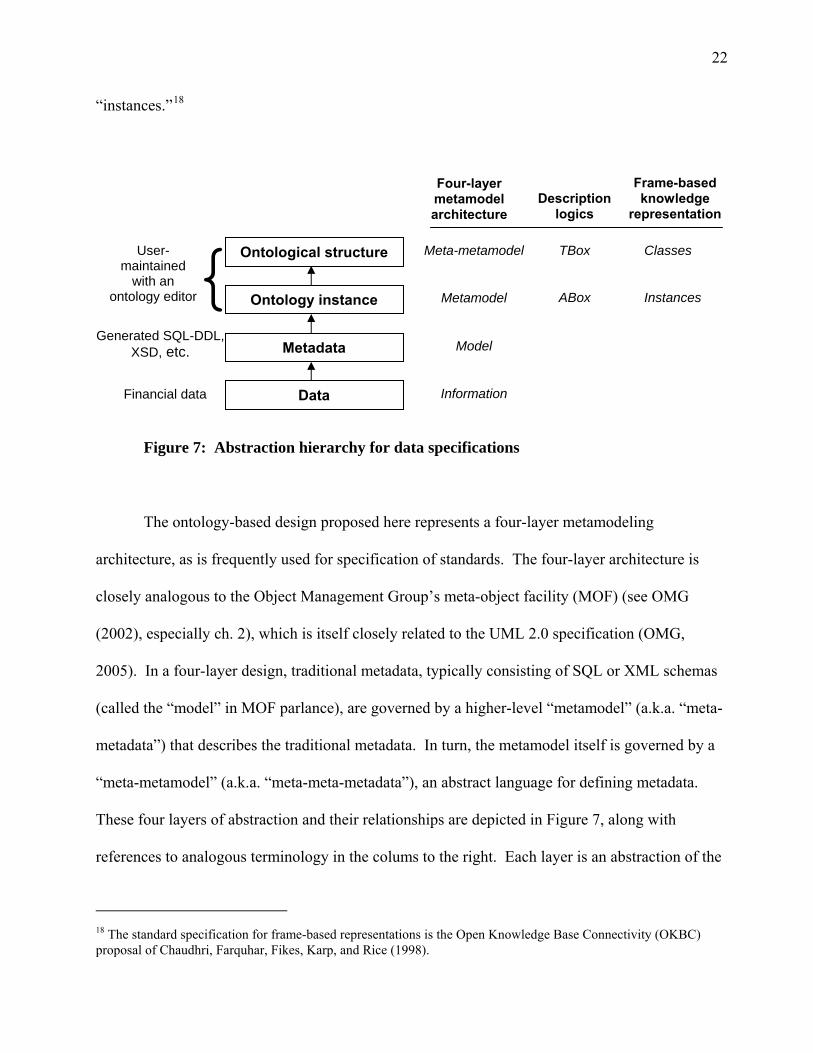
Figure 7: Abstraction hierarchy for data specifications
The ontology-based design proposed here represents a four-layer metamodeling
architecture, as is frequently used for specification of standards. The four-layer architecture is
closely analogous to the Object Management Group’s meta-object facility (MOF) (see OMG
(2002), especially ch. 2), which is itself closely related to the UML 2.0 specification (OMG,
2005). In a four-layer design, traditional metadata, typically consisting of SQL or XML schemas
(called the “model” in MOF parlance), are governed by a higher-level “metamodel” (a.k.a. “meta-
metadata”) that describes the traditional metadata. In turn, the metamodel itself is governed by a
“meta-metamodel” (a.k.a. “meta-meta-metadata”), an abstract language for defining metadata.
These four layers of abstraction and their relationships are depicted in Figure 7, along with
references to analogous terminology in the colums to the right. Each layer is an abstraction of the
Generated SQL-DDL, XSD, etc.
18 The standard specification for frame-based representations is the Open Knowledge Base Connectivity (OKBC) proposal of Chaudhri, Farquhar, Fikes, Karp, and Rice (1998).
Metadata Model
Financial data Data Information
Description
logics
Frame-based knowledge
representation
Four-layer metamodel architecture
Ontological structure TBox Classes Meta-metamodel
Ontology instance ABox Instances Metamodel
User- maintained
with an ontology editor {
23
layers below it, and each layer depends on the constraints it must obey, which are defined by the
layer above it (as depicted by the arrows indicating dependence).
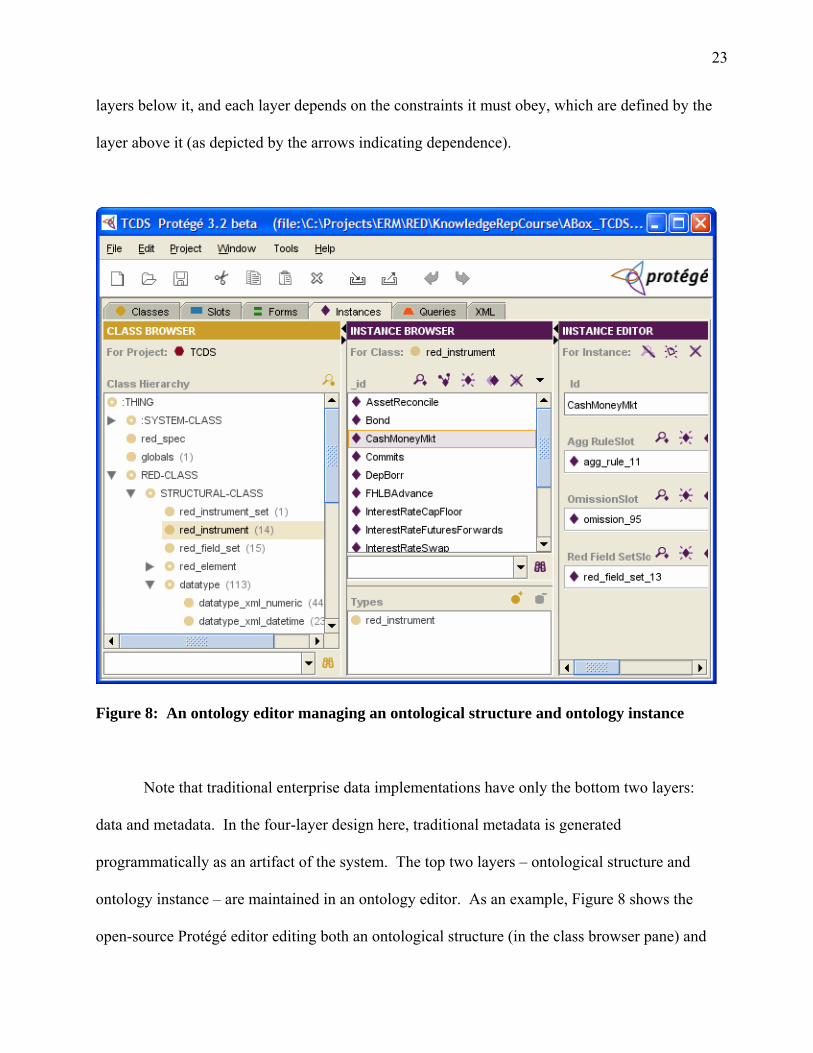
Figure 8: An ontology editor managing an ontological structure and ontology instance
Note that traditional enterprise data implementations have only the bottom two layers:
data and metadata. In the four-layer design here, traditional metadata is generated
programmatically as an artifact of the system. The top two layers – ontological structure and
ontology instance – are maintained in an ontology editor. As an example, Figure 8 shows the
open-source Protégé editor editing both an ontological structure (in the class browser pane) and
24
ontology instance (instance browser pane) for a financial data specification. As a practical matter
(R3), a number of ontology editors are currently available (see Denny (2004) for a survey).
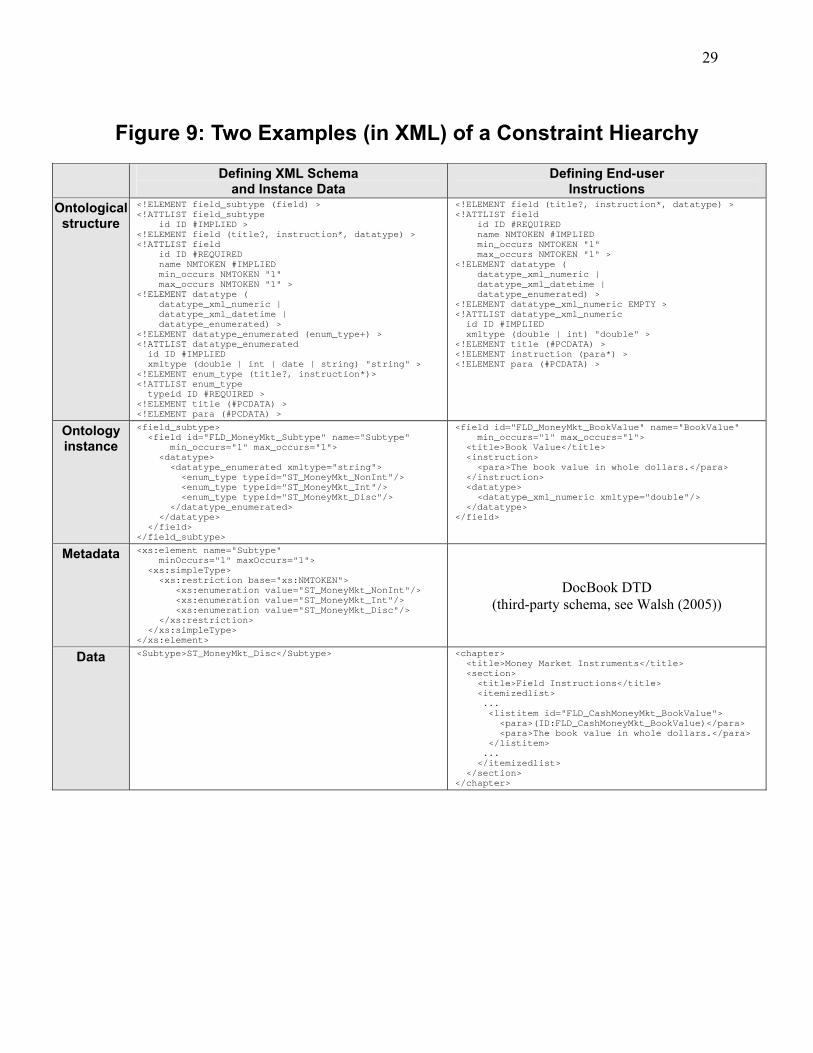
To make this more concrete, Figure 9 provides two examples of financial data and
metadata represented at different levels in the abstraction hiearchy. Emphasizing the practicality
of the design (R3), the snippets in the example use a simple XML DTD to capture the ontological
structure, and a simple XML document to represent the ontology instances; metadata is
represented in XML schema syntax. The first example shows the representation of a constrained
datatype – in this case a “Subtype” field for money-market securities that must take on one of
three values: non-interest-bearing, interest-bearing, or discount, represented by the token set:
{ST_MoneyMkt_NonInt, ST_MoneyMkt_Int, ST_MoneyMkt_Disc}.
The actual data element is: <Subtype>ST_MoneyMkt_Disc</Subtype>. Note the tendency for
the volume of specification data to increase as the level of abstraction increases (reflecting the
more general domain of application). The second example shows the generation of end-user
documentation for a book-value field. In this case, the concrete data are in the form of DocBook
documentation, generated from the ontology instance. The metadata – i.e., the DocBook schema –
is publicly available from a third party (see Walsh, 2005), and not managed by the system.
========== FIGURE 9 APPROXIMATELY HERE ==========
4.6 Metadata manager (with GUI and version control repository)
The metadata manager is responsible for coordinating access to the various data
specifications (stored in the version control repository), as well as the abstract ontology which the
data specifications obey. The metadata manager is also responsible for building the basic
specification artifacts from the specifications. Because data specifications (ontology instances,
labeled as ABoxes in Figure 5) all obey a consistent ontological structure, they are readily
25
amenable to programmatic access for the generation of project artifacts. New and modified data
specifications thus automatically gain a wealth of diverse but consistent specification artifacts
(R1).19 The metadata manager exposes four interfaces, two for the ontology editor, and two more
for the application GUI:
• ontological structure – allows the editor to retrieve and update the specification ontology. • ontology instance – allows the ontology editor to create, retrieve, update, and delete
specification instances (one for each source and target schema, including the numeraire). • config – allows a client application (for example, the user GUI) to select which
specification and which artifact to process. • artifacts – allows a client application (for example, the GUI and/or the Data Mapping
Manager components) to retrieve generated artifacts. In addition, the metadata manager requires a single interface, namely a store, which allows the
metadata manager to store and retrieve versioned documents (ontologies, specifications, and
stylesheets) from a version control repository or other long-term storage.
Note that the functionality of the metadata manager provides two natural extension points.
First, there is the ability to add to the collection of available ontology instances (i.e., data
specifications). As new analytical packages (or other system interfaces) are added, they can be
modeled with a matching specification instance. Standard specification artifacts (e.g.,
documentation, schemas, etc.) can then be generated, as for all specifications obeying the rules of
the ontology. Second, there is the ability to extend the collection of generated artifacts. New
specification artifacts can be defined and implemented as XSLT stylesheets, and made available in
the list of production stylesheets. Note that because the ontological structure is itself editable, the
set of artifacts represented by a specification can be customized closely to the needs of the
19 As a simple order-of-magnitude metric, we compared the volume (size in bytes) of our prototype specification to the volume of artifacts (schemas, documentation, data dictionaries, etc.) generated from it. The ratio is roughly 1:40. XSLT is a natural choice for the generation of artifacts, since XSLT engines are very standard and widely available for all major development and deployment platforms (R3, R4), and because it the most widely accepted ontology language, OWL, has an XML representation (R4).

26
organization (R1). Also note that, although a reasoner is not required to achieve the data-
integration goals of the design, there is no reason why machine reasoning could not be applied to
derive additional implications of the ontology.
The GUI interfaces with the metadata manager to provide user control of those aspects of
the component that are not covered by the ontology editor itself. In particular, the GUI must
provide controls to configure and invoke the XSLT processor for generating artifacts (such as
schemas) from the specification ontologies. The version control repository is needed to maintain
versions of the ontologies, which are the primary user-edited documents in the system.
27
Figure 5: High-Level System Architecture
Analysis
Analytics package 1
Analytics package 2
Analytics package 3
(etc…)
Position data
(formatted)
Market data
(formatted)
pass data
pass data
pass data
Data Integration
Ontology editor
GUI
Data Mapping Manager
Metadata Manager
Version control
repository
Database
Bespoke (user-maintained) system components
Licensed (third-party) system components
LEGEND
Data
Market Data
GUI
Market Data
Manager
Vendor data 1
Market data
(preliminary)
Vendor data 3 (etc...)
Vendor data 2
Position Data
GUI
Position Data
Manager
Position data
(preliminary)
Portfolio system 3
(etc...)
Portfolio system 2
Portfolio system 1

28
Figure 6: Metadata Manager
Metadata Manager << infrastructure >>
Ontology editor << application >>
Version control
repository << datastore >>
store
Client GUI
<< application >>
artifacts
ontology instance
ontology
config
XSLT processor << infrastructure >>
input
style output
spec2artifact.xslt 1..*
source spec.
target spec.
numeraire
Ontological structure
1..*
1..*
1..*
29
Figure 9: Two Examples (in XML) of a Constraint Hiearchy
Defining XML Schema
and Instance Data Defining End-user
Instructions Ontological
structure <!ELEMENT field_subtype (field) > <!ATTLIST field_subtype id ID #IMPLIED > <!ELEMENT field (title?, instruction*, datatype) > <!ATTLIST field id ID #REQUIRED name NMTOKEN #IMPLIED min_occurs NMTOKEN "1" max_occurs NMTOKEN "1" > <!ELEMENT datatype ( datatype_xml_numeric | datatype_xml_datetime | datatype_enumerated) > <!ELEMENT datatype_enumerated (enum_type+) > <!ATTLIST datatype_enumerated id ID #IMPLIED xmltype (double | int | date | string) "string" > <!ELEMENT enum_type (title?, instruction*)> <!ATTLIST enum_type typeid ID #REQUIRED > <!ELEMENT title (#PCDATA) > <!ELEMENT para (#PCDATA) >
<!ELEMENT field (title?, instruction*, datatype) > <!ATTLIST field id ID #REQUIRED name NMTOKEN #IMPLIED min_occurs NMTOKEN "1" max_occurs NMTOKEN "1" > <!ELEMENT datatype ( datatype_xml_numeric | datatype_xml_datetime | datatype_enumerated) > <!ELEMENT datatype_xml_numeric EMPTY > <!ATTLIST datatype_xml_numeric id ID #IMPLIED xmltype (double | int) "double" > <!ELEMENT title (#PCDATA) > <!ELEMENT instruction (para*) > <!ELEMENT para (#PCDATA) >
Ontology instance
<field_subtype> <field id="FLD_MoneyMkt_Subtype" name="Subtype" min_occurs="1" max_occurs="1"> <datatype> <datatype_enumerated xmltype="string"> <enum_type typeid="ST_MoneyMkt_NonInt"/> <enum_type typeid="ST_MoneyMkt_Int"/> <enum_type typeid="ST_MoneyMkt_Disc"/> </datatype_enumerated> </datatype> </field> </field_subtype>
<field id="FLD_MoneyMkt_BookValue" name="BookValue" min_occurs="1" max_occurs="1"> <title>Book Value</title> <instruction> <para>The book value in whole dollars.</para> </instruction> <datatype> <datatype_xml_numeric xmltype="double"/> </datatype> </field>
Metadata <xs:element name="Subtype" minOccurs="1" maxOccurs="1"> <xs:simpleType> <xs:restriction base="xs:NMTOKEN"> <xs:enumeration value="ST_MoneyMkt_NonInt"/> <xs:enumeration value="ST_MoneyMkt_Int"/> <xs:enumeration value="ST_MoneyMkt_Disc"/> </xs:restriction> </xs:simpleType> </xs:element>
DocBook DTD (third-party schema, see Walsh (2005))
Data <Subtype>ST_MoneyMkt_Disc</Subtype> <chapter> <title>Money Market Instruments</title> <section> <title>Field Instructions</title> <itemizedlist> ... <listitem id="FLD_CashMoneyMkt_BookValue"> <para>(ID:FLD_CashMoneyMkt_BookValue)</para> <para>The book value in whole dollars.</para> </listitem> ... </itemizedlist> </section> </chapter>
30
5. Conclusions This paper presents an enterprise design pattern for managing metadata in support of
financial analytics packages. The complexity of financial modeling typically requires
deployment of multiple financial analytics packages, drawing data from multiple source systems.
Business domain experts are typically needed to understand the data requirements of these
packages. Financial product innovation and research advances imply that data requirements are
chronically unstable. Although the focus here is on financial analytics, many of the issues
discussed may also apply to other data-integration contexts with unstable metadata.
These forces of complexity and instability impose four high-level requirements on the
design. The solution must be flexible – capable of adapting to financial and research innovation
in a short time frame. It must be scalable, with modeling and mapping costs linear in the number
of source and target packages to manage. It must be practical, in the sense that it can be
implemented with current technologies available today. Lastly, the design should be portable
across development and deployment platforms, to facilitate adoption.
The proposed design has two key features that help it address these requirements. First,
it centralizes metadata in a numeraire specification, to linearize the mapping costs. Second, it
introduces an ontological structure and an ontology editor to expose the metadata to financial
analysts for on-the-fly editing. Because the specifications are constrained by a well defined
ontological terminology set, and because all specification artifacts are generated automatically
from an ontology, metadata can safely be modified without involving a costly test/deploy
lifecycle. Further research will focus on the specific implementation of a working ontology for
financial risk analytics.
31
References Ambler, S., 2005, The Elements of UML 2.0 Style, Cambridge University Press, Cambridge.
Baader, F., I. Horrocks, and U. Sattler, 2004, “Description Logics,” in: Handbook on Ontologies, S. Staab and R. Studer, eds., Springer Verlag, Berlin, pp. 3-28.
Balakrishnan, V. K., 1997, Schaum's Outline of Graph Theory, McGraw Hill, New York.
Bernstein, P., 2000, “Panel: Is Generic Metadata Management Feasible?,” Proceedings of the 26th International Conference on Very Large Databases (VLDB), Cairo, Egypt.
Bernstein, P., 2003, “Applying Model Management to Classical Meta Data Problems,” Proceedings of the First Biennial Conference on Innovative Data Systems Research (CIDR), Asilomar, California, January 5-8, 2003.
Bernstein, P., A. Levy, and R. Pottinger, 2000, “A Vision for Management of Complex Models,” Technical Report MSR-TR-2000-53, Microsoft Research, Redmond.
Bernstein, P., and E. Rahm, 2000, “Data Warehousing Scenarios for Model Management,” Proceedings of the 19th International Conference on Entity-Relationship Modelling, (Lecture Notes in Computer Science), Springer Verlag, Berlin.
Borgida, A., M. Lenzerini, and R. Rosati, 2002, “Description Logics for Data Bases,” in: Description Logic Handbook, F. Baader, D. Calvanese, D.L. McGuinness, D. Nardi, P.F. Patel-Schneider, eds., Cambridge University Press, pp. 472-94.
Bühler, W., M. Uhrig-Homburg, U. Walter, and T. Weber, 1999, “An Empirical Comparison of Forward-Rate and Spot-Rate Models for Valuing Interest-Rate Options,” Journal of Finance, 54(1), pp. 269-305.
Chaudhri, V., A. Farquhar, R. Fikes, P. Karp, and J. Rice, 1998, Open Knowledge Base Connectivity, 2.0.3, Proposed, retrieved 12 Apr. 2006, Internet: <http://www.ai.sri.com/~okbc/spec/okbc2/okbc2.html/>.
Cuthbertson, K., 1996, Quantitative Financial Economics, John Wiley and Sons, Chichester.
Dash, J. W., 2004, Quantitative Finance and Risk Management: A Physicist’s Approach, World Scientific Publishing, River Edge, New Jersey.
Denny, M., 2004, “Ontology Tools Survey, Revisited,” XML.com, retrieved 31 Jan. 2006, Internet: <http://www.xml.com/lpt/a/2004/07/14/onto.html>.
Dijkstra, E. W., 1972, “The Humble Programmer [ACM Turing Lecture 1972],” Communications of the ACM, 15(10), pp. 859-66.
Eberlein, E., U. Keller, and K. Prause, 1998, “New Insights into Smile, Mispricing, and Value at

32
Risk: The Hyperbolic Model,” Journal of Business, 71(3), pp. 371-405.
FpML, 2004, FpML Financial product Markup Language 4.0 Recommendation, retrieved 20 Feb. 2006, Internet: <http://www.fpml.org/spec/latest.php>.
Gómez-Pérez, A., M. Fernández-López, and O. Corcho, 2004, Ontological Engineering, Springer Verlag, London.
Jorion, P., 2001, Value at Risk, 2nd ed., McGraw Hill, New York.
Halevy, A., Z. Ives, J. Madhavan, P. Mork, D. Suciu, and I. Tatarinov, 2004, “The Piazza Peer Data Management System,” IEEE Transactions on Knowledge and Data Engineering, 16(7).
Halevy, A., Z. Ives, P. Mork, I. Tatarinov, 2003, “Piazza: Data Management Infrastructure for Semantic Web Applications,” Proceedings of the International WWW Conference.
Kaskowitz, D., A. Kipkalov, K. Lundstedt, and J. Mingo, 2002, “Best-Practices in Mortgage Default Risk Measurement and Economic Capital,” manuscript, May.
Lakshmanan, L., and F. Sadri, 2003, “XML Interoperability,” manuscript, International Workshop on the Web and Databases (WebDB), San Diego, California, June 12-13 2003.
Madhavan, J., Bernstein, P., Domingos, P., and Halevy, A., 2002, “Representing and Reasoning about Mappings between Domain Models,” Proceedings of the Eighteenth National Conference on Artificial Intelligence, AAAI Press, Edmonton Canada, pp.80-86.
Mattey, J., and N. Wallace, 2001, “Housing-Price Cycles and Prepayment Rates of U.S. Mortgage Pools,” The Journal of Real Estate Finance and Economics, 23(2), pp. 161-84.
MDDL, 2003, Market Data Definition Language (MDDL), Technical Specification, Version 2.0-draft 31 March 2003, retrieved 20 Feb. 2006, Internet: <http://www.mddl.org/mddl/2003/2.3-final/>.
Merton, R. C., 1995, “Financial Innovation and the Management and Regulation of Financial Institutions,” Journal of Banking and Finance, 19(2), pp. 461-81.
Miller, R., M. Hernández, L. Haas, L. Yan, C. T. H. Ho, R. Fagin, and L. Popa, 2001, “The Clio Project: Managing Heterogeneity,” ACM SIGMOD Record, 30(1), pp. 78-83.
Mitra, P., and G. Wiederhold, 2004, “An Ontology-Composition Algebra,” in: Handbook on Ontologies, S. Staab and R. Studer, eds., Springer Verlag, Berlin, pp. 93-113.
Nardi, D., and R. Brachman, 2002, “An Introduction to Description Logics,” in: Description Logic Handbook, F. Baader, D. Calvanese, D.L. McGuinness, D. Nardi, P.F. Patel-Schneider, eds., Cambridge University Press, pp. 5-44.
Object Management Group (OMG), 2002, Meta Object Facility (MOF) Specification (version

33
1.4, formal/02-04-03), retrieved 11 Apr. 2006, Internet: <http://www.omg.org/docs/formal/02-04-03.pdf >.
__________, 2005, Unified Modeling Language: Superstructure (version 2.0, formal/05-07-04), retrieved 19 Feb. 2006, Internet: <http://www.omg.org/docs/formal/05-07-04.pdf>.
Rahm, E., and P. Bernstein, 2001, “A survey of approaches to automatic schema matching,” The VLDB Journal, 10, pp. 334-50.
Stanford Medical Informatics, 2005, Protégé, retrieved 11 Apr. 2006, Internet: <http://protege.stanford.edu/>.
Stöhr, T., R. Müller, and E. Rahm, 1999, “An Integrative and Uniform Model for Metadata Management in Data Warehousing Environments,” Proceedings of the International Workshop on Design and Management of Data Warehouses, Heidelberg, Germany.
Sutter, H., and A. Alexandrescu, 2004, “Prefer composition to inheritance,” in: C++ Coding Standards, retrieved 15 June 2006, Internet: <http://www.artima.com/cppsource/codestandards3.html>.
Walsh, N., 2005, DocBook 5.0: The Definitive Guide, retrieved 12 Apr. 2006, Internet: <http://www.docbook.org/tdg5/en/html/docbook.html>.
Whitehead, A. N., 1929, Process and Reality, Macmillan, New York.
World Wide Web Consortium (W3C), 2004, Semantic Web, retrieved 11 Apr. 2006, Internet: <http://www.w3.org/2001/sw/>.
XBRL, 2003, Extensible Business Reporting Language (XBRL) 2.1, RECOMMENDATION - 2003-12-31 + Corrected Errata - 2005-11-07, retrieved 21 Feb. 2006, Internet: <http://www.xbrl.org/Specification/XBRL-RECOMMENDATION-2003-12-31+Corrected-Errata-2005-11-07.htm>.
Zolin, E., 2006, Complexity of reasoning in Description Logics, retrieved 14 June 2006, Internet: <http://www.cs.man.ac.uk/~ezolin/logic/complexity.html>.