Embed Size (px)
Citation preview
EMBRYO SELECTION IS VITAL FOR SUCCESSFUL IVF –
WHY TIME-LAPSE IMAGING IS PROVING IMPORTANT
Prof. Fishel Simon

THE EMBRYO – WHY THE FOCUS?
• Largest single cause of IVF failure.
• Single main cause of early miscarriage.
0
5
10
15
20
25
30
35
40
45
30 31 32 33 34 35 36 37 38 39 40 41 42 43 44
Live Birth
Female age
%
~ 35% of embryosmake babies
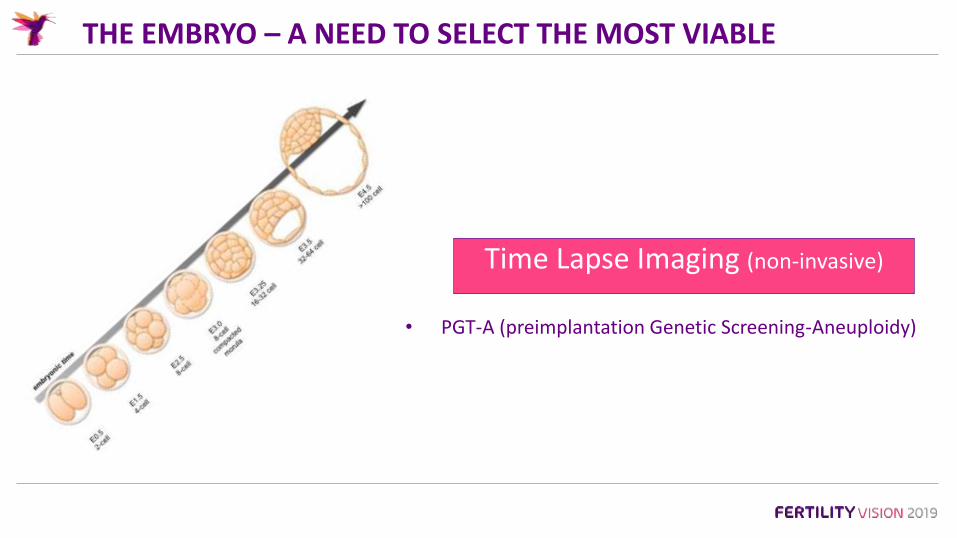
THE EMBRYO – A NEED TO SELECT THE MOST VIABLE
Time Lapse Imaging (non-invasive)
• PGT-A (preimplantation Genetic Screening-Aneuploidy)
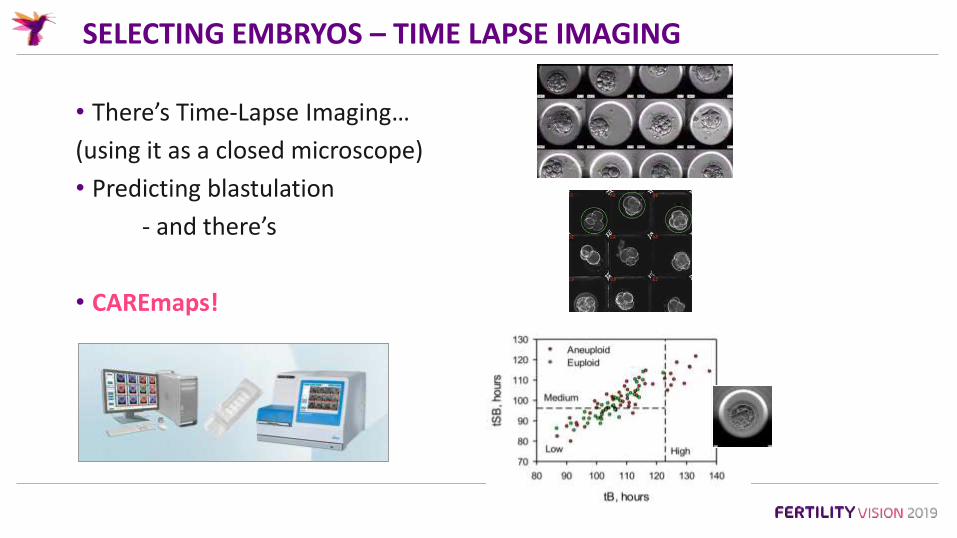
SELECTING EMBRYOS – TIME LAPSE IMAGING
• There’s Time-Lapse Imaging…
(using it as a closed microscope)
• Predicting blastulation
- and there’s
• CAREmaps!

CAREMAPS – COMPUTING MORPHOKINETICS
• Time to cell stages.
• Durations.
• Dynamics e.g.
• Pronuclei.
• Reverse cleavage.
• Compaction.
• Blastulation.
• Strings.mo
rph
oki
net
ic

TIME-LAPSE IMAGING – CONSTANT VISUAL OF MORPHODYNAMICS
Intracytoplasmic• Granulation.
• Refractile bodies.
• Vacuolation.
• Smooth Endoplasmic ReticulumClustures.
• Multi Nuclei.
• Pronuclei.
Extracytoplasmic• Polar body.
• Perivitelline space.
• Zona Pellucida.
• Fragments.
Imaging - Single v 300/day!
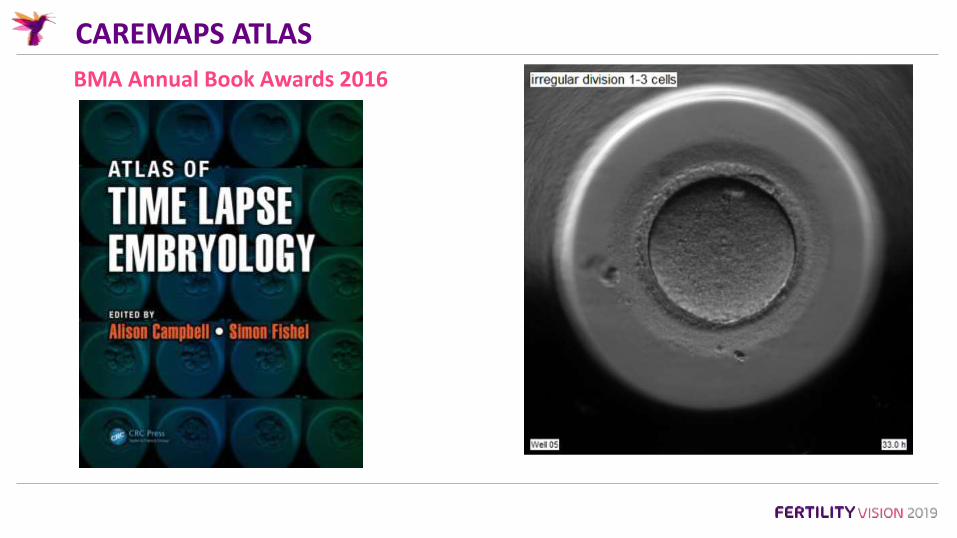
CAREMAPS ATLAS
BMA Annual Book Awards 2016
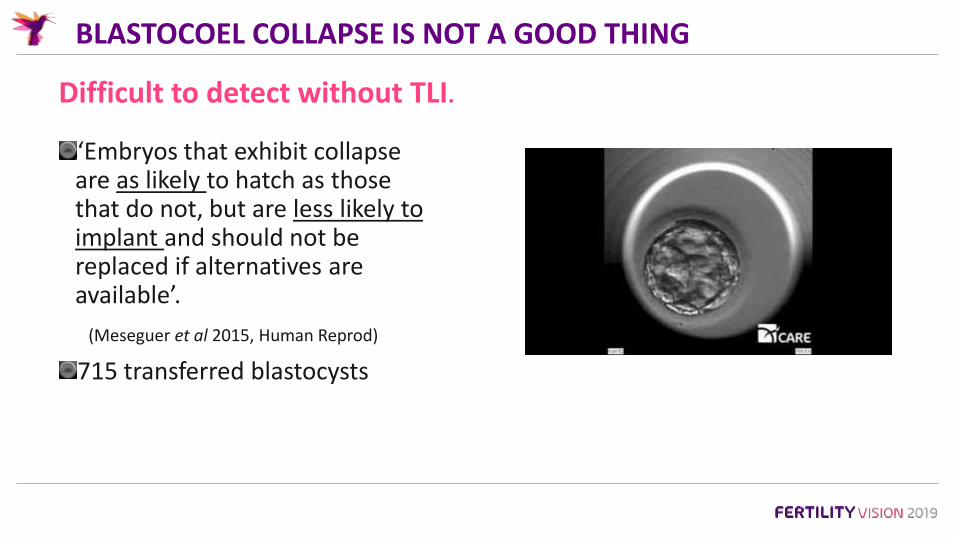
BLASTOCOEL COLLAPSE IS NOT A GOOD THING
‘Embryos that exhibit collapse are as likely to hatch as those that do not, but are less likely to implant and should not be replaced if alternatives are available’.
(Meseguer et al 2015, Human Reprod)
715 transferred blastocysts
Difficult to detect without TLI.
TIME LAPSE ALLOWS NOVEL OBSERVATIONS
• Which may be used to enhance embryo selection.
CARE Fertility example:
• Angle between polar bodies.
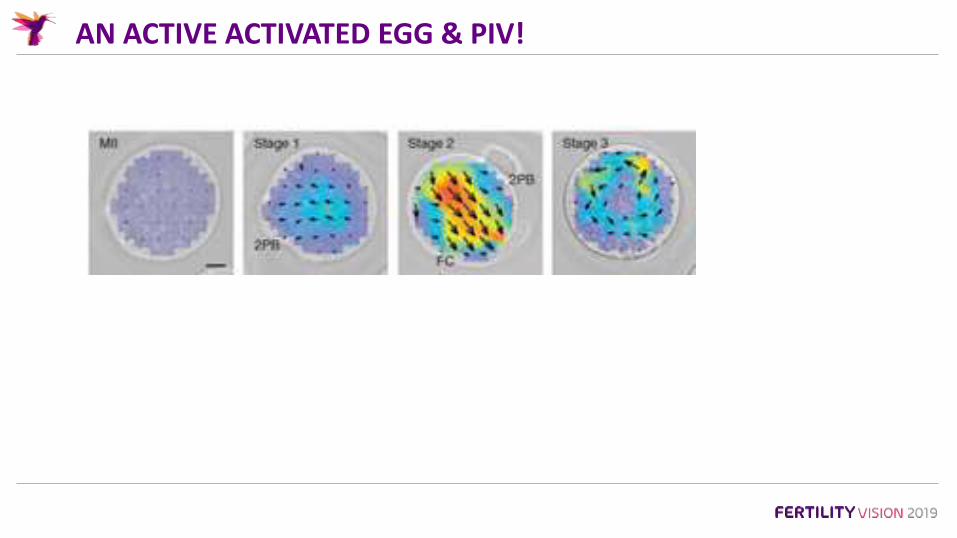
AN ACTIVE ACTIVATED EGG & PIV!
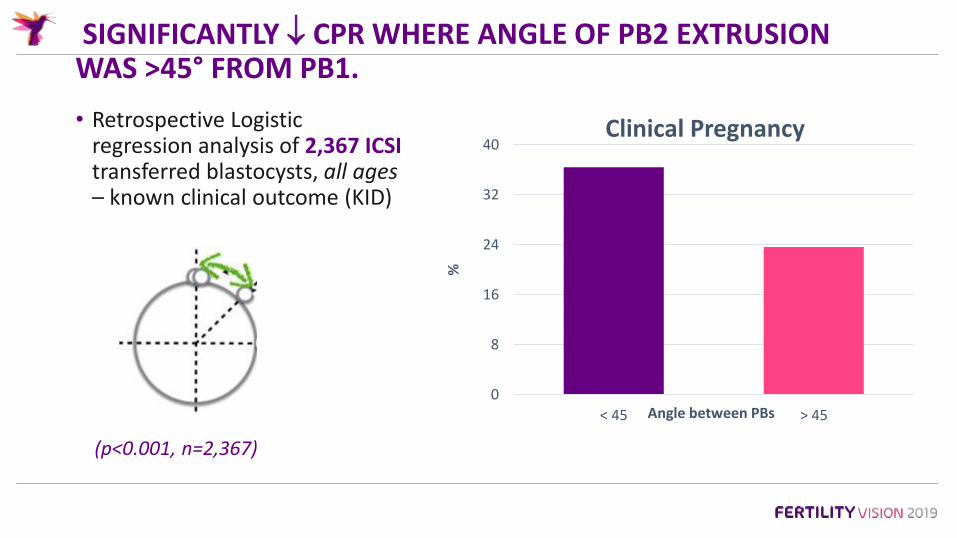
SIGNIFICANTLY CPR WHERE ANGLE OF PB2 EXTRUSION WAS >45° FROM PB1.
• Retrospective Logistic regression analysis of 2,367 ICSI transferred blastocysts, all ages– known clinical outcome (KID)
(p<0.001, n=2,367)
0
8
16
24
32
40
< 45 > 45
%
Angle between PBs
Clinical Pregnancy

TIME-LAPSE TO PREDICT BLASTULATION
• A high percentage of blastocyts never make babies.
• A significant percentage of blastocysts result in miscarriage.
• Some blastocysts make unhealthy babies.
• A case(s) in point…
Of the 9, 7 predicted to be a blastocyst.
They did.
All 7 were chromosomally
abnormal!
‘CAREMAPS’
M.A.P.S
Morphokinetic
Algorithms to
Predict
Success
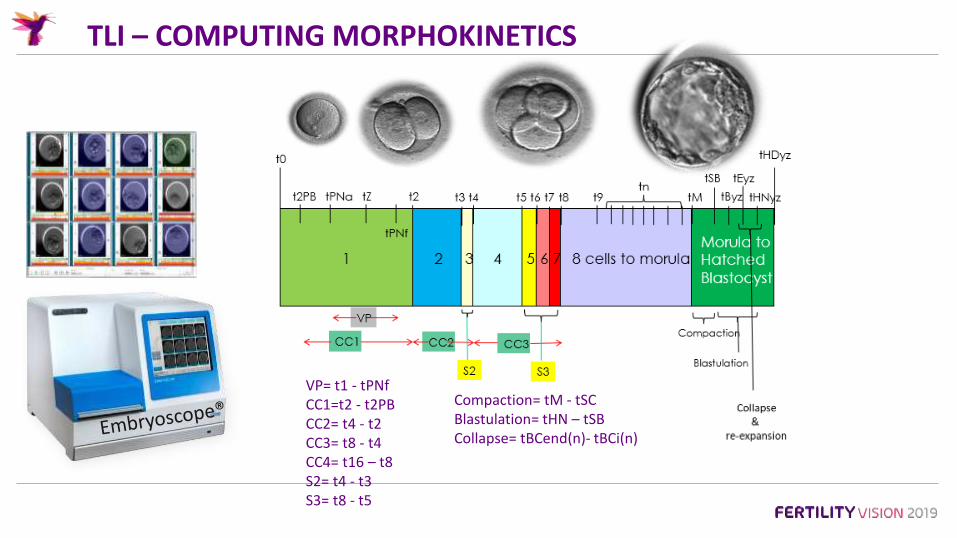
TLI – COMPUTING MORPHOKINETICS
VP= t1 - tPNfCC1=t2 - t2PBCC2= t4 - t2CC3= t8 - t4CC4= t16 – t8S2= t4 - t3S3= t8 - t5
Compaction= tM - tSCBlastulation= tHN – tSBCollapse= tBCend(n)- tBCi(n)

PRIBENSZKY ET AL 2017: TIME-LAPSE META-ANALYSIS
•Meta-analysis of RCT of morphokinetic algorithms v single time point morphology for embryo selection.•Outcome measures:
• Clinical pregnancy, Live birth, EPL, Stillbirth.
• 5 RCTs (n=1637)• LB: 44.2% v 31.3% (OR= 1.668; P<0.009)• EPL: 15.3% v 21.3% (OR= 0.662; P<0.019)• Stillbirth: NS
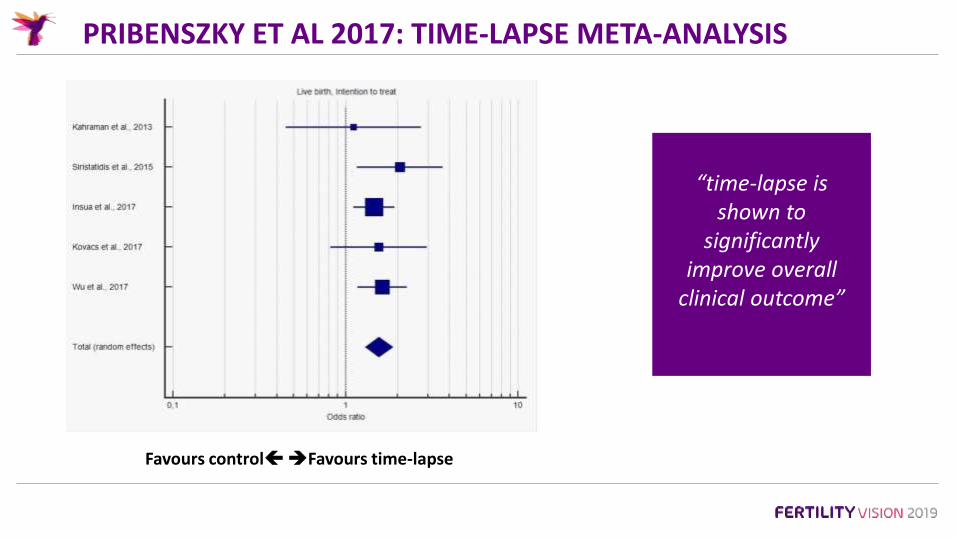
PRIBENSZKY ET AL 2017: TIME-LAPSE META-ANALYSIS
Favours controlFavours time-lapse
“time-lapse is shown to
significantly improve overall
clinical outcome”
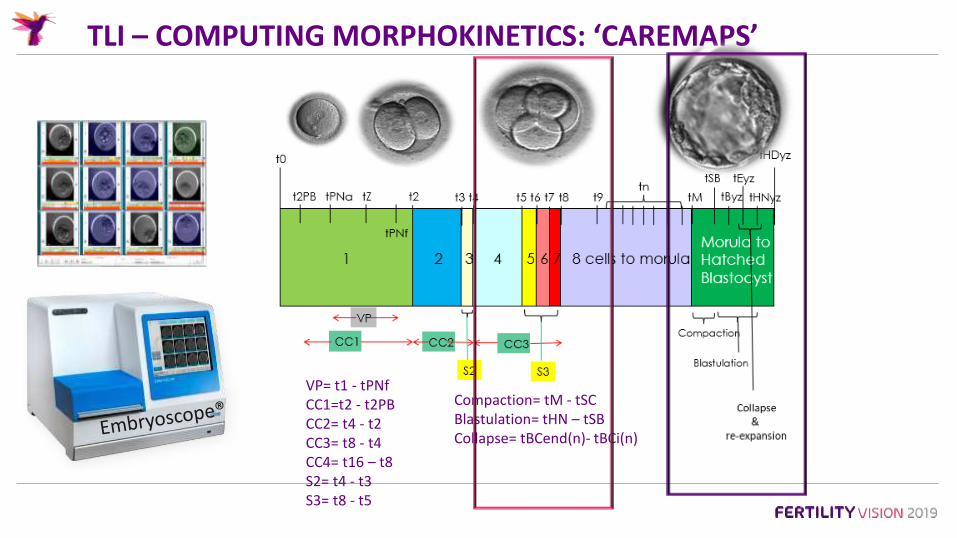
TLI – COMPUTING MORPHOKINETICS: ‘CAREMAPS’
VP= t1 - tPNfCC1=t2 - t2PBCC2= t4 - t2CC3= t8 - t4CC4= t16 – t8S2= t4 - t3S3= t8 - t5
Compaction= tM - tSCBlastulation= tHN – tSBCollapse= tBCend(n)- tBCi(n)

TLI - QA

QA – ATTAINMENT SCORES
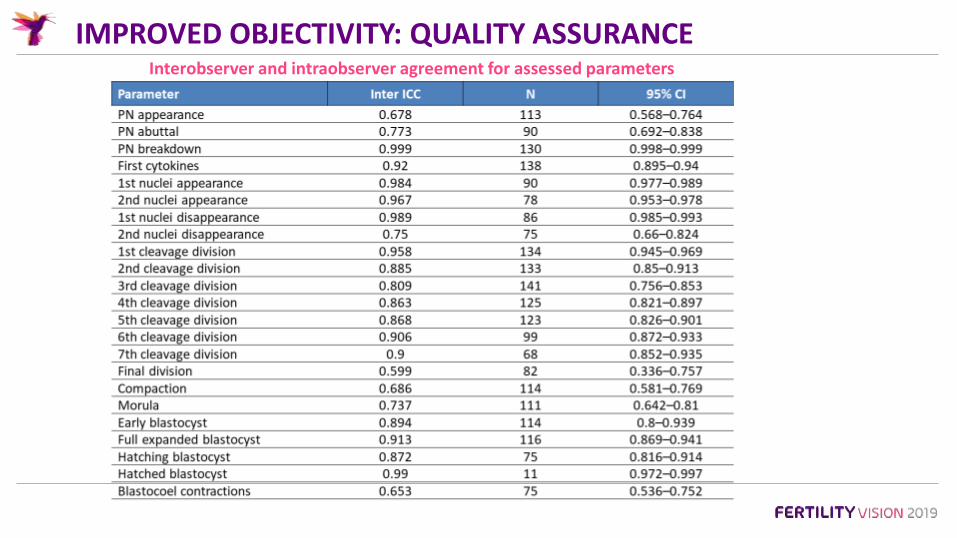
IMPROVED OBJECTIVITY: QUALITY ASSURANCEInterobserver and intraobserver agreement for assessed parameters
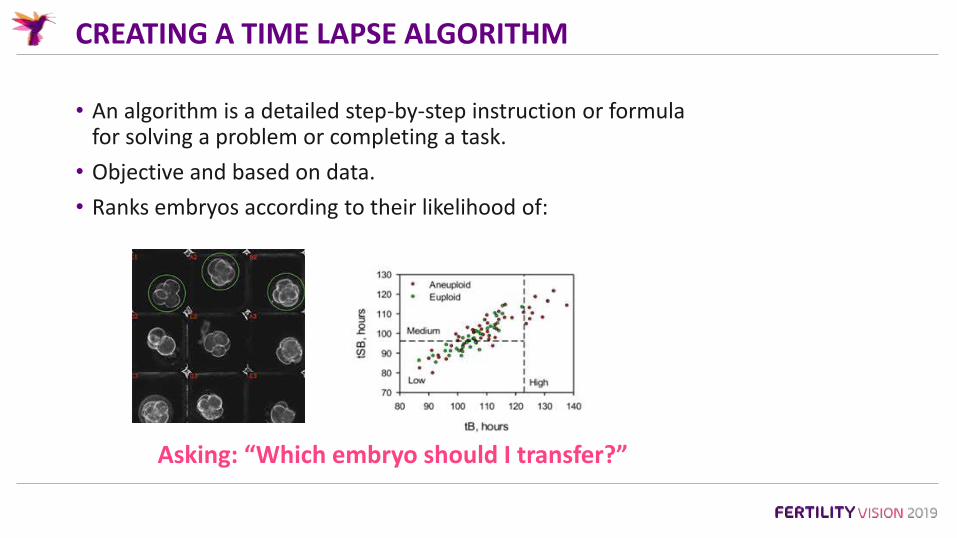
CREATING A TIME LAPSE ALGORITHM
• An algorithm is a detailed step-by-step instruction or formula for solving a problem or completing a task.
• Objective and based on data.
• Ranks embryos according to their likelihood of:
Asking: “Which embryo should I transfer?”

A CHOICE OF ALGORITHMS:
• Easy to use.
• Derived from large heterogeneous data.
• Supporting evidence.suggesting better than morphology alone.
• Many to choose from.
• Can retro-test on own data.
• Little evidence to support transferability.
• Barrie et al *2017 Fertil Steril.
• Takes time and expertise.
• Data and experience grow quickly.
• Can be as simply or complex.
• Reassurance that built and validated in house.
Integrated software Published In house derived
* ‘These results highlight the need for the development of in-house ESAs that are specific to the patient, treatment, and environment.’
WHAT MAKES A GOOD ALGORITHM?
• Based on large data and tested independently.
• A high predictability score (e.g. Area Under ROC Curve).
• Incorporates variables which are reliably annotated (high IOC).
• Scores are weighted according to importance.
• Allows relative ranking.
• Simple to decode and sense check.
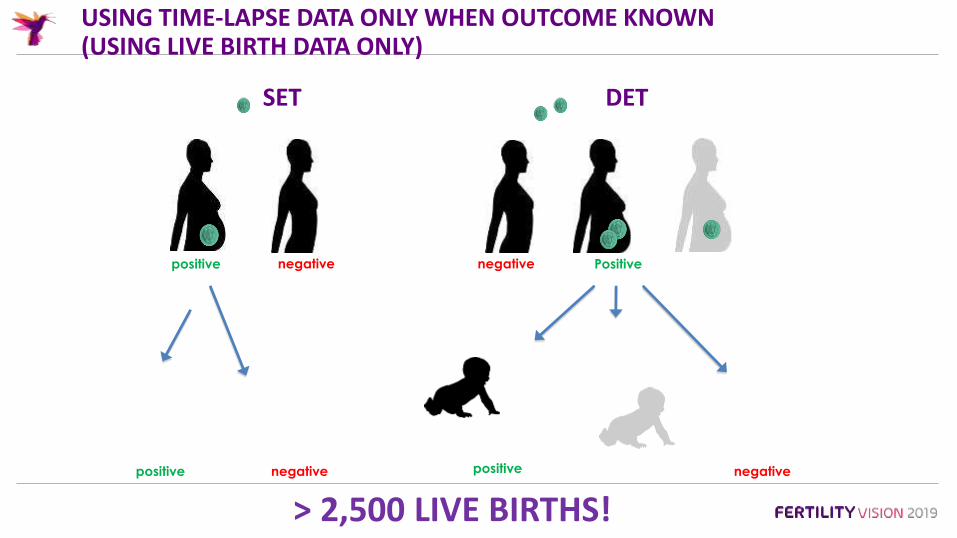
USING TIME-LAPSE DATA ONLY WHEN OUTCOME KNOWN(USING LIVE BIRTH DATA ONLY)
KID positive KID negative KID negative (KID Positive) No KID**
DET
Pregnancy
loss2 x implantations
lost
1 x
implantations
lost
One Live Birth KID positive
Two Live Birth KID positive
No Live BirthKID negative
No LB KID 2 x LB KID negative
SETSET DET
> 2,500 LIVE BIRTHS!

“BREAKTHROUGH SCIENCE”
Nominated for the Rbmonline
Robert Edwards 2013 Award

TIME-LAPSE IMAGING – CONSTANT VISUAL OF MORPHODYNAMICS
Intracytoplasmic• Granulation.
• Refractile bodies.
• Vacuolation.
• Smooth Endoplasmic ReticulumClustures.
• Multi Nuclei.
• Pronuclei.
Extracytoplasmic• Polar body.
• Perivitelline space.
• Zona Pellucida.
• Fragments.
Imaging - Single v 300/day!

CARE FERTILITY GROUP – 1000 LIVE BIRTHS
Mean ♀ Age: CAREmaps = 36.9
v SI = 35.3
Live births = 973 deliveries
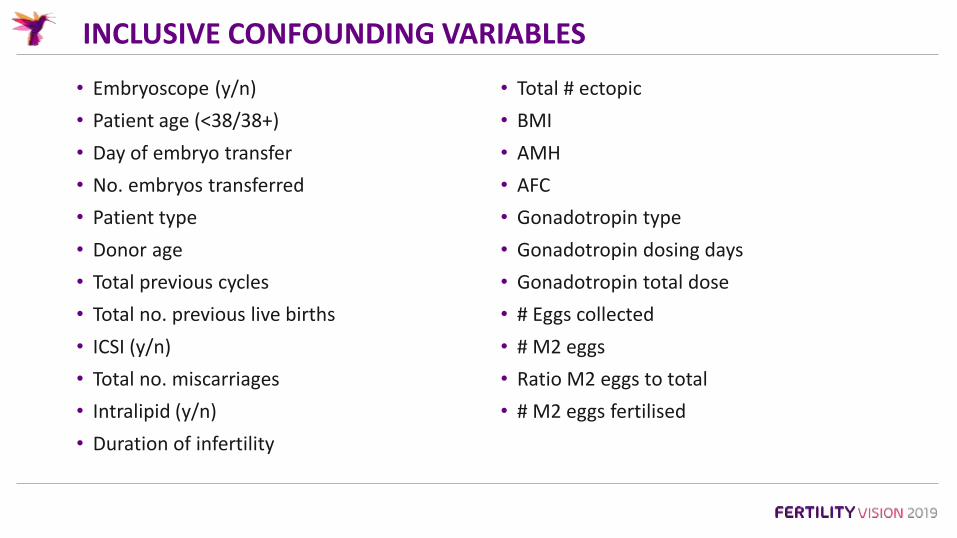
INCLUSIVE CONFOUNDING VARIABLES
• Embryoscope (y/n)
• Patient age (<38/38+)
• Day of embryo transfer
• No. embryos transferred
• Patient type
• Donor age
• Total previous cycles
• Total no. previous live births
• ICSI (y/n)
• Total no. miscarriages
• Intralipid (y/n)
• Duration of infertility
• Total # ectopic
• BMI
• AMH
• AFC
• Gonadotropin type
• Gonadotropin dosing days
• Gonadotropin total dose
• # Eggs collected
• # M2 eggs
• Ratio M2 eggs to total
• # M2 eggs fertilised
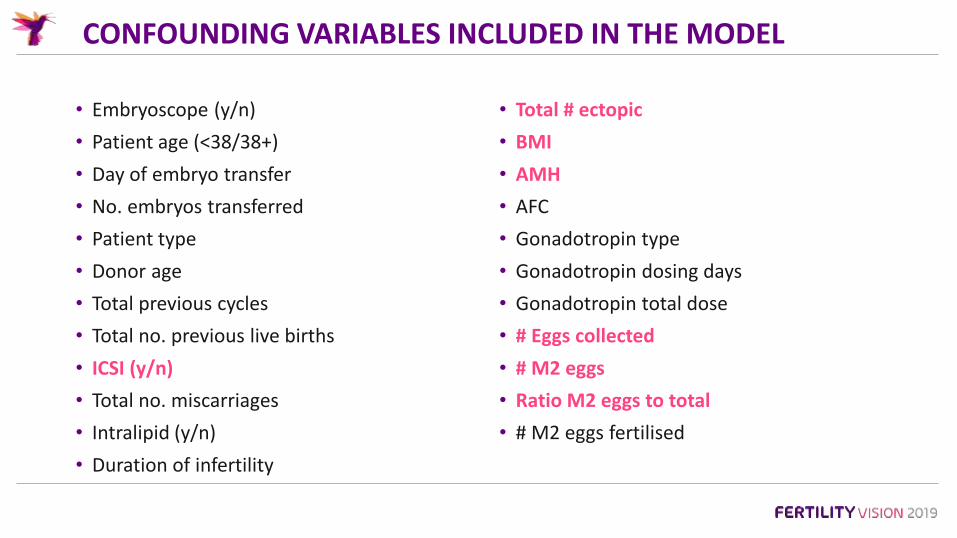
CONFOUNDING VARIABLES INCLUDED IN THE MODEL
• Embryoscope (y/n)
• Patient age (<38/38+)
• Day of embryo transfer
• No. embryos transferred
• Patient type
• Donor age
• Total previous cycles
• Total no. previous live births
• ICSI (y/n)
• Total no. miscarriages
• Intralipid (y/n)
• Duration of infertility
• Total # ectopic
• BMI
• AMH
• AFC
• Gonadotropin type
• Gonadotropin dosing days
• Gonadotropin total dose
• # Eggs collected
• # M2 eggs
• Ratio M2 eggs to total
• # M2 eggs fertilised

CARE FERTILITY DATA (LIVE BIRTH OUTCOME ONLY)
24,000 records of treatment
Statistical Analysis:*multiple variable logistic regression models were fit to assess the effects of embryo rank on each potential confounder* Akaike information criterion (AIC) penalty fit for number of parameters and stepwise selection
• 21,379 Standard incubation treatments
• 2,527 Embryoscope treatments
• 14,878 unique patients

LIVE BIRTHS (DELIVERY EVENTS AGE <38) – SIG POINTS
0,0
10,0
20,0
30,0
40,0
50,0
60,0
# pos Beta # with >=1FH Biochem Loss # Implantations # Clinmiscarriage
# Live BirthEvent
babies/EmbTrd
TLI SI
* P<0.0001
* P<0.0001* P<0.0001
* P<0.0001* P<0.001
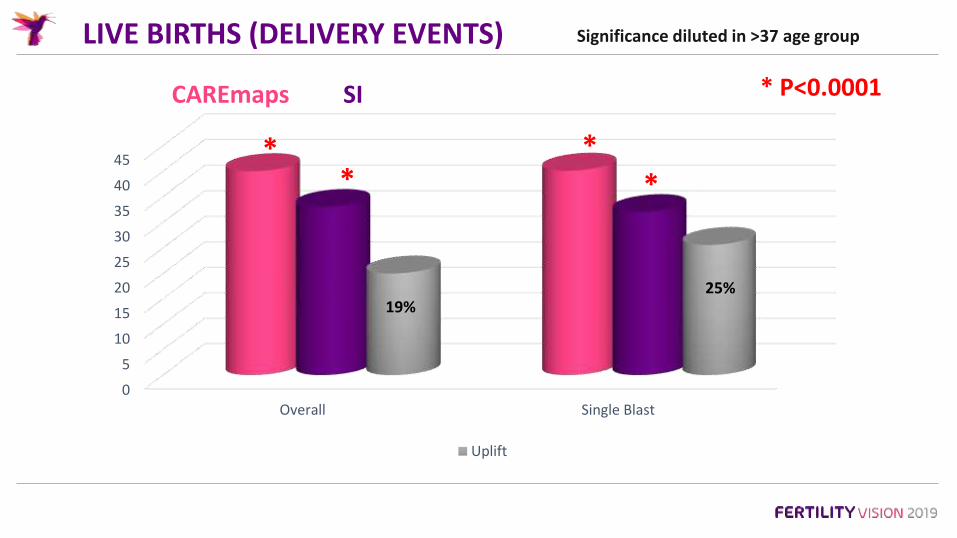
LIVE BIRTHS (DELIVERY EVENTS)
0
5
10
15
20
25
30
35
40
45
Overall Single Blast
Uplift
CAREmaps SI
19%25%
* ** *
* P<0.0001
Significance diluted in >37 age group
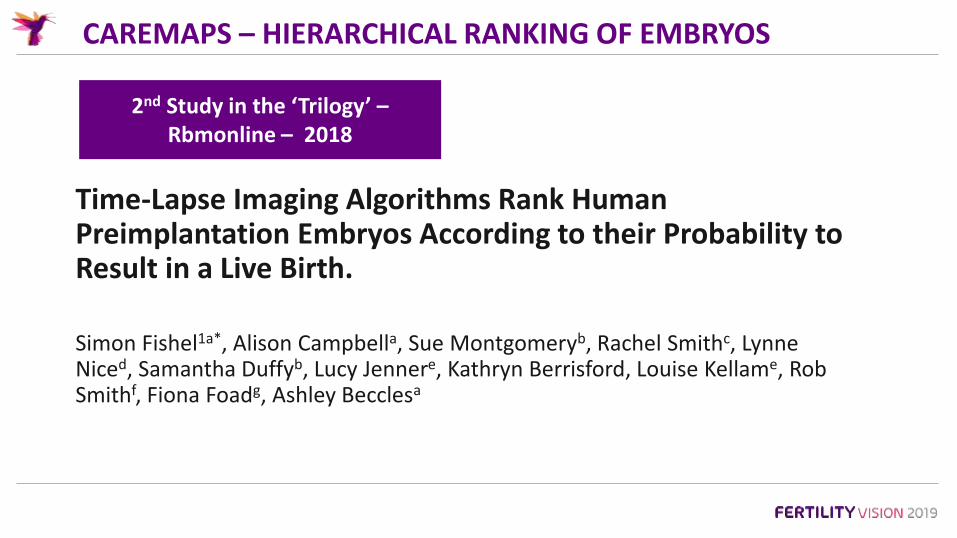
CAREMAPS – HIERARCHICAL RANKING OF EMBRYOS
Time-Lapse Imaging Algorithms Rank Human Preimplantation Embryos According to their Probability to Result in a Live Birth.
Simon Fishel1a*, Alison Campbella, Sue Montgomeryb, Rachel Smithc, Lynne Niced, Samantha Duffyb, Lucy Jennere, Kathryn Berrisford, Louise Kellame, Rob Smithf, Fiona Foadg, Ashley Becclesa
2nd Study in the ‘Trilogy’ –Rbmonline – 2018
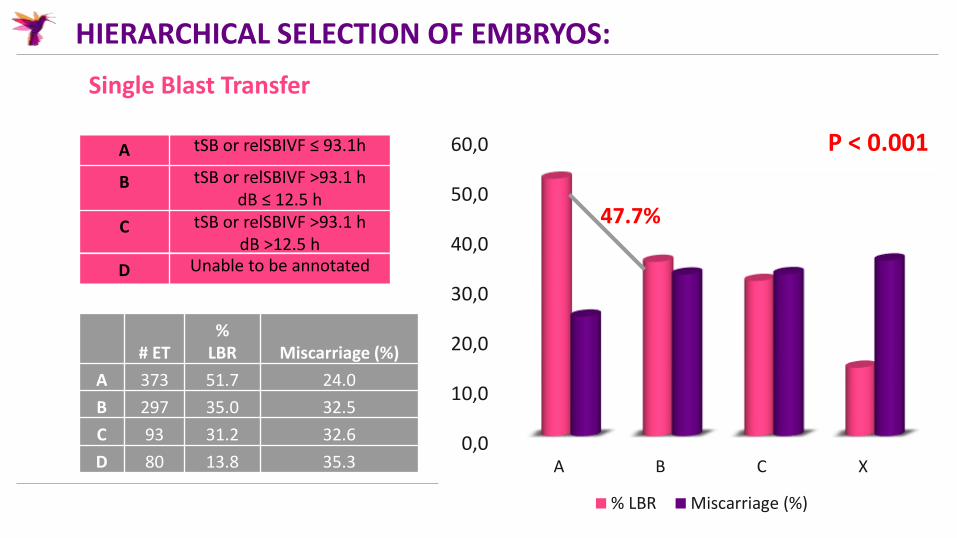
HIERARCHICAL SELECTION OF EMBRYOS:
Single Blast Transfer
A tSB or relSBIVF ≤ 93.1h
B tSB or relSBIVF >93.1 hdB ≤ 12.5 h
C tSB or relSBIVF >93.1 hdB >12.5 h
D Unable to be annotated
# ET%
LBR Miscarriage (%)
A 373 51.7 24.0
B 297 35.0 32.5
C 93 31.2 32.6
D 80 13.8 35.30,0
10,0
20,0
30,0
40,0
50,0
60,0
A B C X
% LBR Miscarriage (%)
47.7%
P < 0.001

RANKED EMBRYO LB OUTCOME
Strong evidence of an effect of embryo rank on the odds of live births.
A has a 233% chance of LB compared to D
• D << A (OR = 0.3046; P<0.010)• D << B (OR = 0.428; P<0.01)• B < A (OR = 0.7114; P<0.01)• C <A (OR = 0.6501; P< 0.01) • B > C (OR = 1.09; P<0.01) • C >> D (OR=2.135; p<0.01)

CAREMAPS V MORPHOLOGY:
Grade 2:2 highest LB!
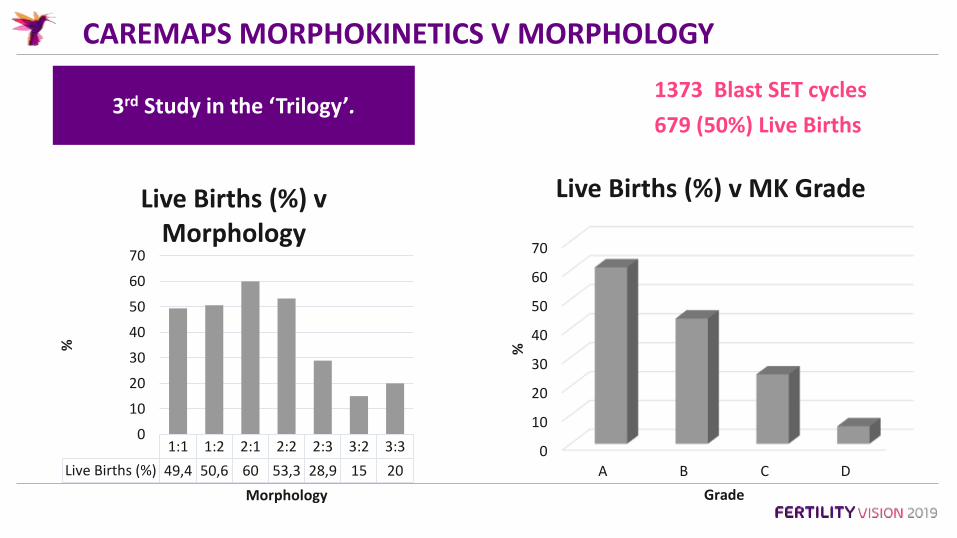
CAREMAPS MORPHOKINETICS V MORPHOLOGY
1373 Blast SET cycles
679 (50%) Live Births3rd Study in the ‘Trilogy’.
0
10
20
30
40
50
60
70
A B C D
%
Grade
Live Births (%) v MK Grade
1:1 1:2 2:1 2:2 2:3 3:2 3:3
Live Births (%) 49,4 50,6 60 53,3 28,9 15 20
0
10
20
30
40
50
60
70
%
Morphology
Live Births (%) v Morphology

CAREMAPS MORPHOKINETICS V MORPHOLOGY
Strong evidence of the superiority of the embryo rank model compared with the transfer grade model.(p<0.0001)

CARE FERTILITY STRATEGY TO MAXIMISING LBR
• CAREmaps for all patients ♀age <38 =(19-)25% ↑ Live Birth.
• ♀age >35 => PGT-A.
• ♀age >35: PGT-A and CAREmaps NOT mutually exclusive.

THANK YOU FOR LISTENING
www.carefertility.com