Embed Size (px)
Citation preview
University of Ottawa Faculty of Graduate and Postdoctoral Studies
M.Sc. Systems Science
Emergency Management Planning: A Value Based Approach to Preparing Coastal Communities for
Sea Level Rise
A Thesis Proposal Submitted in Partial Fulfillment of the Requirements for the
Degree of M.Sc. Systems Science
Alexander Q.H. Chung
Thesis Supervisor: Dr. Daniel E. Lane
Telfer School of Management University of Ottawa
© Alexander Chung 2013

2
Abstract
There is an increasing amount of evidence that the climate is changing at an unnatural
rate on a global scale. Unpredictable extreme weather patterns have become a common
occurrence and they take a toll on humans from all perspectives as seen in Hurricane Sandy
(2012). The damage was undeniable and questions were raised about the preparedness and
response of the communities affected. The need to be proactive in preparing for these events
as a means of adapting to climate change is evident. This study seeks to determine what it
means for coastal communities vulnerable to severe storms to be prepared. Preparedness is
often defined by the resources and plans a community has in place. However, a large part of
being prepared also lies in the decision making and deployment process as well as the reliability
of the overall system. This study will attempt to evaluate that decision making process at the
community level in the event of a storm surge. A value based approach will be used to
construct storm simulation mock-up exercises for community responders. The simulation can
be prescribed as a method to identify gaps in the strategy where improvements can be made.
Keywords: Value-based design, decision analysis and evaluation, Storm damage, Community
preparation and adaptation, Adaptive strategies, Simulation, Storm event mock-ups
Discipline: Operations research, Decision analysis, Simulation modelling

3
Abbreviations
ADMS – Advanced Disaster Management Simulator
DPi – Disaster Preparedness Index
EMBC – Emergency Management British Columbia
EMO – Emergency Management Organization or Emergency Measures Organization
EMWIN – Emergency Managers Weather Information Network
EOC – Emergency Operations Centre
FERP – Federal Emergency Response Plan
FEMA – Federal Emergency Management Agency
GEM Model – Global Environmental Multiscale Model
HFA – Hyogo Framework for Action
IEMAC – International Emergency Management Assistance Compact
IEMG – International Emergency Management Group
IEMS – Integrated Emergency Management System
IFRC Societies – International Federation of Red Cross and Red Crescent Societies
IPCC – Intergovernmental Panel on Climate Change
JEOC – Joint Emergency Operations Centre
LIDAR – Laser Imaging Detection and Ranging
MEOPAR – Marine Environmental Observation Prediction and Response
MEOW – Maximum Envelopes of Water
MOM – Maximum of the MEOW
NOAA – National Oceanic and Atmospheric Administration
NWS – National Weather Service
SLOSH – Sea, Lake, and Overland Surges from Hurricanes
TCL – Target Capabilities List
UN/ISDR – United Nations International Strategy for Disaster Reduction
UN/OCHA – United Nations Office for the Coordination of Humanitarian Affairs
UTL – Universal Task List

4
Table of Contents
Abstract ........................................................................................................................................... 2
Abbreviations .................................................................................................................................. 3
List of Tables ................................................................................................................................... 6
List of Figures .................................................................................................................................. 7
1 Introduction ............................................................................................................................ 8
1.1 Background and Motivation ............................................................................................. 8
1.2 Research Questions and Objectives ............................................................................... 10
1.3 Thesis Proposal Outline .................................................................................................. 11
2 Literature Review .................................................................................................................. 13
2.1 Terminology ................................................................................................................... 13
2.2 Approaches to Preparedness ......................................................................................... 14
2.2.1 National Weather Service – StormReady Program ................................................ 15
2.2.2 Federal Emergency Management Agency – Target Capabilities List ...................... 18
2.2.3 UN Office for Disaster Risk Reduction – Hyogo Framework for Action .................. 21
2.2.4 Public Safety Canada – Emergency Measures Organizations ................................. 24
2.2.5 International Emergency Management Group – International Emergency
Management Assistance Compact ....................................................................................... 31
2.3 Preparedness Measures ................................................................................................. 33
2.3.1 Preparedness Indicator Checklists .......................................................................... 34
2.3.2 Preparedness Indices .............................................................................................. 34
2.3.3 Response Reliability ................................................................................................ 38
2.4 Evaluation and Preparedness Modelling ....................................................................... 40
2.4.1 Emergency Situation Modelling .............................................................................. 40

5
2.4.2 Emergency Mock-up Exercises ............................................................................... 45
2.5 Applications .................................................................................................................... 48
2.5.1 Coastal Communities – City of Charlottetown, P.E.I. ............................................. 49
2.5.2 Coastal Communities – Community of Isle Madame, N.S. ..................................... 51
2.6 Summary ........................................................................................................................ 52
3 Methodology ......................................................................................................................... 55
3.1 Defining the Components of Preparedness ................................................................... 55
3.2 Indicators of Preparedness Specific to Coastal Communities ....................................... 60
3.3 Process Definition and Dynamics ................................................................................... 62
3.4 Determinant of Best Decisions ....................................................................................... 64
3.5 Process Simulation ......................................................................................................... 64
3.6 Mock-up Exercises .......................................................................................................... 65
4 Expected Results and Analysis .............................................................................................. 68
5 Expected Outcomes and Recommendations ........................................................................ 70
6 Timeline of Proposed Study .................................................................................................. 72
Bibliography .................................................................................................................................. 73
Glossary of Terms ......................................................................................................................... 81
Appendices .................................................................................................................................... 82
A. P.E.I. Municipal Emergency Management Guide – “Exercise October” ............................. 82
B. Emergency Management Ontario Guidelines for Development of an Exercise Program .. 84
Needs Assessment ................................................................................................................ 84
Defining the Scope ................................................................................................................ 85

6
List of Tables
Table 2-1 StormReady population-based guidelines overview. Source: NOAA (2013) ................ 17
Table 2-2 FEMA's Target Capabilities List overview. Source: FEMA (2007b) ............................... 20
Table 2-3 Jurisdictions participating in the IEMAC. Source: IEMG (2009) .................................... 32
Table 2-4 Twelve problems in the Canadian emergency response system as identified by the
Canadian Senate report. Source: Government of Canada (2008) .................................... 49
Table 3-1 Classification of preparedness characteristics .............................................................. 58
Table 6-1 Timeline of proposed study .......................................................................................... 72

7
List of Figures
Figure 2-1 The incident command system’s P-model. Source: FEMA (2012) ............................... 29
Figure 2-2 IEMAC activation process. Source: IEMG (2009) ......................................................... 33
Figure 2-3 Disaster indexing measurement model diagram. Source: Simpson and Katirai (2006)
........................................................................................................................................... 37
Figure 2-4 Example fault tree for the analysis for identifying risks to evacuation reliability.
Source: Jackson (2008)...................................................................................................... 39
Figure 2-5 Sample output of the SLOSH model for Hurricane Ike in 2008 on Galveston Bay in
Texas. Source: NOAA (2011) ............................................................................................. 41
Figure 2-6 UN-ISDR Stop Disasters simulation game screenshot Source: UN/ISDR (2007) ......... 44
Figure 2-7 Map of Charlottetown. Source: Google Maps (2013) ................................................. 50
Figure 2-8 Map of Isle Madame. Source: Google Maps (2013) .................................................... 52
Figure 3-1 The components of emergency response preparedness ............................................ 57
Figure 3-2 Sample structure of a preparedness taxonomy. ......................................................... 60
Figure 3-3 Time component of preparedness indicators ............................................................. 61
Figure 3-4 Sample decision tree for the storm mock-up simulation ............................................ 63
Figure 3-5 Arena Simulation model parameters .......................................................................... 65
Figure 3-6 The phases of a mock-up exercise program management ......................................... 66
Figure 4-1 Map of Petite Anse Community on Isle Madame. Source: Google Maps (2013) ........ 68

8
1 Introduction
Climate change represents one of the great environmental challenges of our time. There
is increasing discussion and evidence by the scientific community that the climate is changing at
an unprecedented rate on a global scale. Along with climate change, comes an increase in
occurrence of severe storms that may have adverse effects on humans if we are not prepared.
This chapter presents the issues of climate change and the importance of developing
adaptation methods, primarily in the area of preparing for the effects of sea level rise. Research
questions and objectives are found in the latter section of this chapter.
1.1 Background and Motivation
In 2007, the Intergovernmental Panel on Climate Change (IPCC) produced their fourth
assessment report showing that there is compelling evidence that points to a warming climate
trend (IPCC, 2007a; IPCC, 2007b). The three IPCC working groups issued several key statements
found in the synthesis report that further strengthens the connection between human activities
and the warming climate system. Greenhouse gas emissions due to human activities have
increased at an astonishing 70% between 1970 and 2004. As a result of higher concentrations
of greenhouse gases in the atmosphere, the average global temperature has also increased
drastically. The average temperatures in the Northern Hemisphere over the last 50 years have
been very likely higher than any other 50 year period over the last 500 years (IPCC, 2007c).
Climate change is a trending issue. At the same time, the global population is growing and
the resource consumption rate has never been higher. It can be seen that under the most
optimistic conditions the Earth has committed to some degree of warming for the near future
and the need for humans to adapt is imperative (Etkin, Medalye, & Higuchi, 2012; World Bank,
2012). This raises the question of what climate change brings in terms of a new environment
and how communities can anticipate and prepare for it.
As the average temperature rises, evaporation rates also increase, adding more moisture
into the atmosphere. Naturally the result of an increase in atmospheric vapour is an increase in
more drastic and unpredictable weather occurrence. Rising sea level is also consistent with

9
warming temperatures due to thermal expansions, melting glaciers, ice caps and ice sheets.
Global average sea level has risen at an average rate of 3.1 mm/yr since 1993, which far
exceeds any model projections (IPCC, 2007c). Changes in precipitation patterns and rising sea
levels put coastal communities the first in line to witness the effects of climate change. The
consequences of sea level rise is an increase in storm surge occurrences as well as much more
severe weather phenomena as seen in Hurricane Katrina (August 2005) and Hurricane Sandy
(October 2012).
The notion of preparedness for natural disasters is a contentious topic of discussion for
policy makers. It garners less attention in the scope of policy making, where problems at hand
attain greater priority (Jackson, 2008). This is particularly prevalent in less fortunate
communities where the list of community problems is extensive. Investing in preparedness for
a situation that may or may not happen may seem trivial but with the recent issues and impacts
surrounding climate change one may wish to think otherwise. Decision and policy makers are
proactive in taking recourse actions after the storm has occurred. Learning from one’s mistakes
based on real life situations is important but with the tools and technology available in our day
and age, decision makers should be proactive in advance. They require better methods to
assess preparedness from the resources, strategies, as well as system reliability standpoint. Not
only will such a method of assessment aid decision and policy makers, it will also allow the
public to set reasonable expectations of their government at all levels and invoke a sense of
confidence and comfort in the general population (Jackson, 2008).
The C-Change project aims at developing resources for coastal communities to increase
their capacity to adapt to and anticipate environmental change. The coastal communities
selected for research are spread out across Canada and selected communities in the Caribbean
region. Their selection is based on the seriousness and immediate threats to infrastructure if an
environmental disaster was to occur (C-Change, 2010). The C-Change project aspires to
enhance community capacities and to better prepare for possible environmental disasters.
There are other numerous ongoing campaigns to raise awareness about this issue. At the same
time adaptive response plans should be in place and well designed to prepare for climate
change.

10
This proposed research examines the state of preparedness for coastal communities
within the C-Change Project. The following research questions and objectives are proposed.
1.2 Research Questions and Objectives
Sea level rise leads to a common occurrence of storm surges in coastal communities. This
calls for adaptive response strategies to mitigate the effects of the threatening storm surge.
The challenge to designing adaptive response strategies lies in balancing between being cost
efficient and being sufficiently prepared. This notion of being prepared is evidently dependent
of the magnitude of the storm; therefore another challenge lies in dealing with the uncertainty
and varying magnitude of the storm. It is commonly seen that preparedness takes a
retrospective approach in planning. Gaps in response strategies are identified and patched post
storm. This research project aims at developing a framework to define preparedness for storm
surges in coastal communities and develop methods to evaluate response strategies pre-storm.
The following research questions were proposed for this study:
1. What does it mean for communities to be prepared for emergency situations?
2. How can this concept of preparedness be applied to coastal communities vulnerable
to sea level rise and more frequent severe storms?
3. How effective is the emergency response system in practice?
4. What prescriptions are required to improve preparedness and response reliability?
The objective of this study is to develop a framework for coastal communities to assess
their level of preparedness in the event of a storm surge. Several steps will be taken to achieve
this objective and to provide a means of answering the research questions. These steps will
consist of:
1. Examining literature to determine what it means to be prepared for emergency
situations.
2. Developing hierarchal indicators of preparedness for applying concepts of
preparedness to coastal communities vulnerable to the effects of sea level rise.

11
3. Constructing a model designed to evaluate the decision making and reliability of the
emergency response system for communities.
4. Analyzing the results of the simulation storm mock-up to identify gaps for
preparedness improvement for communities.
Given recent events, e.g. Hurricane Sandy, the Great Earthquake and Tsunami of the Sea
of Japan, many efforts have been made to assess preparedness overall and create a baseline
standard that defines preparedness. However, many of these standards tackle the layout and
framework for emergency planning. They typically do not include a method of evaluation for
deployment and effectiveness of the system in practice. A quantitative modelling approach to
determine preparedness provides the missing link in the adoption of community-based storm
surge adaptation strategies. Communities would be able to utilize the storm mock-up model to
identify gaps in their adaptive response strategy and improve on them.
1.3 Thesis Proposal Outline
An outline of the key components presented in each chapter is as follows
Chapter 1 – Introduction: The current section provides the background information to
climate change as well as the motivation for this study. Several key issues stemming from
climate change were discussed and the need for adaptation was shown. The latter section of
Chapter 1 presented the challenges in designing adaptive response strategies. This leads to the
research questions proposed and the objectives of the study.
Chapter 2 – Literature Review: A literature review of the concepts examined in this study
will be presented in this section. Areas of interest include terminologies, approaches to
preparedness, preparedness measures and indicators, and evaluation and preparedness
modelling. Chapter 2 also presents applications of the study and a summary of the literature
reviewed.
Chapter 3 – Methodology: The methodology section of the proposal will examine the
tools and potential methods required to develop the framework mentioned as part of the
objectives. Preparedness will be redefined within the context of coastal communities

12
vulnerable to the effects of severe storms. A process for the storm mock-up exercise is laid out
and suggested as means for identifying gaps in response plans.
Chapter 4 – Expected Analysis and Results: An overview of the expected analysis method
and modelling approach will be shown in this section. The case of the causeway way in Petite
Anse Isle Madame will be used as an example to show the expected results.
Chapter 5 – Expected Outcomes and Recommendations: The expected outcome as well
as expected recommendations for adaptive response strategy designing will be discussed in this
chapter.
Chapter 6 – Timeline of proposed Study: A brief timeline for the proposed study can be
found in the last chapter.
13
2 Literature Review
The unnatural weather patterns of late have forced many communities to review their
emergency preparedness strategies in addition to the resources they have to overcome the
storm. The strategy reviews often times put policy makers from all ends of the spectrum in a
position to determine at what point one can say that they have achieved preparedness. Often
seen in media is that a community was not prepared, however they fail to define what
preparedness is and how they measure it to come to such a conclusion. In Chapter 2 we wish to
frame the issues behind preparedness for emergency situations in communities. Several key
concepts found in literature will be examined along with the different methods in use to define
preparedness.
To set the stage for the literature review, common terminologies used in the field are
presented in Section 2.1. The terminologies are followed by approaches to preparedness as
defined by different levels of disaster management organizations in Section 2.2. Numerous
attempts have been made to quantify preparedness in the form of a measure or index. These
are discussed in Section 2.3. Methods to model storm surge effects and response efforts are
shown in Section 2.4. An overview of the applications for this research and a profile of
Charlottetown and Isle Madame, which will be used as case studies, are shown in Section 2.5.
2.1 Terminology
Community preparedness is a vast topic of study and the terminologies used are often
ambiguous or interchangeable due to the immense range of community based programs that
exist. The following section identifies key terms and discusses and defines the issues of these
terms that are fundamental to this research.
The term adaptation that is used in the climate change field has its roots in the field of
natural science and specifically evolutionary biology (Smit & Wandel, 2006). Classically,
adaptation refers to the evolutionary process involving a genetic or behavioural change in
which a population or individual becomes fitted to its prevailing environment (Campbell, et al.,
2008). The later part of this definition still hold true in the context of this study, but humans

14
have evolved to a point where genetic makeup can be masked by advancements in technology.
Adaptation to a prevailing environment for humans is now dependent on how a population
prepares themselves for environmental forces as opposed to an elimination of futile genes. The
C-Change project describes adaptation as the capacity of natural and human systems to adjust
to global and local environmental change and to reduce adverse effects (C-Change, 2010). The
use of the word adaptation in this study will refer to the C-Change definition.
The term disaster is commonly used in emergency management. It may refer to a wide
variety of disaster types, including cyber-attacks, terrorist attacks, and pandemic disease
outbreaks (FEMA, 2007b). The Intergovernmental Panel on Climate Change defines disasters as
severe alterations in the normal function of a community due to hazardous physical events,
leading to widespread adverse human, material, economic, or environmental effects requiring
immediate emergency response (IPCC, 2007c). Within the context of this study, disasters are of
the form caused by sea level rise. Rising sea levels lead to hurricanes, storm surges, and floods.
The approaches to preparedness that will be examined in the following section present
their method as guidelines, frameworks, or plans to preparedness. Each approach presents a
different perspective and method for defining preparedness. In this section terms like
capabilities, indicators, goals, priorities, and targets arise. For this study the term indicators will
take on the meaning of a quantitative or qualitative identifier to monitor the state of
preparedness.
Please refer to the glossary for definitions of commonly used terms that are fundamental
to this study.
2.2 Approaches to Preparedness
Organizations worldwide have taken a proactive approach to developing definitions of
preparedness. They range from local community based programs (provincial or territorial
Emergency Measures Organization) to international efforts (Hyogo Framework for Action).
Local community based programs focus on resources specific to the community at risk while
international efforts aim at introducing a holistic approach to defining preparedness worldwide.

15
An overview of the different scopes of preparedness as defined by those in the field
would provide a better understanding of what it means to be prepared. In the following
section, 5 different approaches to preparedness are examined; National Weather Service’s
StormReady Program, Federal Emergency Management Agency’s Target Capabilities List, UN
Office for Disaster Risk Reduction’s Hyogo Framework for Action, Public Safety Canada’s
Emergency Measures Organization and the International Emergency Management Group’s
International Emergency Management Assistance Compact. They have the similar objectives
but differ in their approach as well as terminologies. The terminology used in each section is
within the context presented by that specific organization’s approach.
2.2.1 National Weather Service – StormReady Program
The StormReady program introduced by the National Weather Service (NWS) in 1999 has
certified 2056 communities in the United States as of March 31st 2013 to be “StormReady”
(NOAA, 2013). The National weather Service is a branch of the National Oceanic and
Atmospheric Administration (NOAA). The program increases the level of preparedness in the
community through a checklist approach that aims at improving the communication and safety
skills needed to mitigate storm effects, before and during a storm. The program was created
with the intentions of the following as described by NWS (NOAA, 2004):
1. Improve timeliness and effectiveness of weather warnings
2. Provide clear and detailed recommendations to the community
3. Helps community leaders justify budget allocations for emergency preparedness
4. Reward communities that have exemplified what it means to be “StormReady”
5. Provide an image incentive for the community
6. Encourage surrounding communities to take part as well
Aside from improving community response, the designation also increases property value
for the community. From a public relations standpoint, this provides an incentive that
encourages all citizens to participate.
A set of guidelines were developed to encourage communities to take a proactive
approach and improve their response operations. The guidelines touch on the different aspects

16
or dimensions of being prepared as defined by the NWS. They are communication, information
reception, hydrometeorological monitoring, warning dissemination, community preparedness
and administration (NOAA, 2013). Table 2-1 shows an overview of the population based
guidelines developed for the StormReady program. Guidelines that have boxes containing an
(X) are required at the given population, while empty boxes mean that the guidelines are not
required for a population of that size. In cases where the guidelines require a quantitative
count, they are presented in the table as a numerical value.
Community budgets are typically dependent of the community size, therefore the
guidelines were designed to accommodate budgets and resources available based on the
population size (NOAA, 2004).
To meet the communication guideline as set out by the StormReady program, a warning
point that can relay NWS information must be established as well as an Emergency Operations
Centre (EOC) in communities with a population larger than 2,500 (NOAA, 2004). This
communication point can be established at law enforcement or fire department dispatching
points. In the case where a community has neither of these, the use of a county agency is also
acceptable. The office must operate 24 hours a day with warning reception capabilities and
authority to activate local warning systems. In larger communities, an EOC is required and must
be staffed during hazardous weather. Aside from the duties of a warning point, the EOC must
also be able to communicate with adjacent communities and act as the messenger between the
NWS and community decision makers (NOAA, 2004).
The second guideline to meet for the StormReady program is the number of ways in
which the warning point or EOC can receive NWS warnings. The storm may damage
communication means, therefore it is important to have several different means of
communication with the NWS. These information receivers range from something as
technologically advance as Emergency Managers Weather Information Network (EMWIN)
receivers with satellite feed to something as basic as a radio or pager system (NOAA, 2004).

17
Table 2-1 StormReady population-based guidelines overview. Source: NOAA (2013)
Guidelines Population
< 2,500 2,500 – 14,999
15,000 – 40,000
> 40,000
1. Communication
Established 24 hr Warning Point X X X X
Establish Emergency Operations Centre X X X
2. NWS Information Reception
Number of ways for EOC/WP to receive NWS warning, etc.
3 4 4 4
3. Hydrometeorological Monitoring
Number of ways to monitor hydrometerological data 1 2 3 4
4. Local Warning Dissemination
Number of ways for EOC/WP to disseminate warnings
1 2 3 4
NWR - SAME receivers in public facilities X X X X
5. Community Preparedness
Number of annual weather safety talks 1 2 3 4
Train spotters and dispatchers biennially X X X X
Host/co-host annual NWS spotter training X
6. Administrative
Formal hazardous weather operations plan X X X X
Biennial visits by emergency manager to NWS X X X X
Annual visits by NWS official to community X X X X
Aside from communication and emergency operations centres, communities must also be
able to monitor hydrometerological (weather) information in their surrounding area (NOAA,
2004). StormReady suggests the following means of gathering supplementary weather
information: access to radar information via internet, instruments to measure local hydrological
conditions, or locally owned and operated weather radars (NOAA, 2004).
18
Communication with the NWS and surrounding communities is important, but the EOC
and warning points are simply the middle connection in the communication chain. The ultimate
goal lies in relaying the information to decision makers and the public. For this reason warning
dissemination methods should be placed to alert the citizens and keep them informed. The
StormReady program proposes several public propagation means such as television
audio/video overrides, outdoor warning sirens and the NOAA Weather Radio All-hazards
receivers (NOAA, 2004).
From a different perspective, the last two guidelines are aimed at pre-storm preparation
practices. Public education is vital in preparing citizens to respond effectively to weather
threats. A more educated community is more likely to take proactive steps to receive warnings
and recognize potential threatening weather conditions (NOAA, 2004). The three
subcomponents of the community preparedness guideline for the StormReady checklist are: to
conduct safety talks for schools, hospitals and industries, facilitate weather related safety
campaigns, and send EOC staff to NWS storm spotter training (NOAA, 2004).
Lastly, no program will be successful without proper and proactive administration for
support. Consequently, StormReady established the last guideline with this concept in mind.
The administrative team has to be well organized and be able to effectively communicate with
NWS (NOAA, 2004).
The StormReady program was proven to be effective in the case of Dickinson County Iowa
on July 17th 2010. Dickinson County encountered a severe windstorm that caused widespread
damage across most of the Great Lakes area of Dickinson County in Northwest Iowa (NOAA,
2010). Wind gusts of 100 mph damaged trees, boats, farm buildings and storage sheds.
Numerous residents reported hearing the warnings and took shelter before the storm hit and
credited the National Weather Service in issuing the life-saving warnings (NOAA, 2010).
2.2.2 Federal Emergency Management Agency – Target Capabilities List
In an effort to be better prepared for emergency situations in the United States, the
Department of Homeland Security’s Federal Emergency Management Agency (FEMA) set out to
establish a national policy to prevent, protect, respond, and recover from terrorist attacks,

19
major disasters, and other emergencies. The National Preparedness Guidelines were created in
2007 to define what it means for a nation to be prepared by providing a vision for
preparedness, establishing priorities and identifying target capabilities (FEMA, 2007a). The
vision for the guidelines was coined as the following;
“A nation prepared with coordinated capabilities to prevent, protect against,
respond to, and recover from all-hazards in a way that balances risk with
resources and need.” (FEMA, 2007a, p. 1)
The planning process as outlined by the National Preparedness Guidelines is supported by
three planning tools; the National Planning Scenarios, Target Capabilities List (TCL), and
Universal Task List (UTL) (FEMA, 2007a).
The National Planning Scenarios portray a diverse set of 15 high-threat scenarios that
covers a range of possible situations, including terrorist attacks and natural disasters (FEMA,
2007a). Collectively they were designed to focus on contingency planning at all levels from
governments to the private sector and the public. The scenarios were used for identifying tasks
required to facilitate efforts in preparing for emergency situations as well as the capabilities
required to perform the tasks. A catalogue of these tasks can be found in the UTL (FEMA,
2007c), while a listing of capabilities is found in the TCL (FEMA, 2007b).
The TCL contains 37 capabilities that are shown in Table 2-2. They address the four
homeland security mission areas of prevent, protect, respond, and recover. The TCL document
also acts as a basis for assessing preparedness in local communities, an important tool in
designing action plans. The approach to defining these capabilities rest on three fundamental
questions (FEMA, 2007b);
How prepared do we need to be?
How prepared are we?
How do we prioritize efforts to close the difference?
To answer these questions, a threat analysis was conducted using the 15 National
Planning Scenarios. Tasks required to overcome these scenarios were identified and capabilities
necessary to perform the tasks were compiled as the TCL (FEMA, 2007b).

20
Table 2-2 FEMA's Target Capabilities List overview. Source: FEMA (2007b)
Common Capabilities
1. Planning
2. Communications
3. Community Preparedness and
Participation
4. Risk Management
5. Intelligence and Information Sharing and
Dissemination
Prevent Mission Capabilities
6. Information Gathering and Recognition of
Indicators and Warning
7. Intelligence Analysis and Production
8. Counter-Terror Investigation and Law
Enforcement
9. CBRNE Detection
Protect Mission Capabilities
10. Critical Infrastructure Protection
11. Food and Agriculture Safety and Defence
12. Epidemiological Surveillance and
Investigation
13. Laboratory Testing
Respond Mission Capabilities
14. On-Site Incident Management
15. Emergency Operations Centre
Management
16. Critical Resource Logistics and
Distribution
17. Volunteer Management and Donations
18. Responder Safety and Health
19. Emergency Public Safety and Security
20. Animal Disease Emergency Support
21. Environmental Health
22. Explosive Device Response Operations
23. Fire Incident Response Support
24. WMD and Hazardous Materials Response
and Decontamination
25. Citizen Evacuation and Shelter-in-Place
26. Isolation and Quarantine
27. Search and Rescue (Land-Based)
28. Emergency Public Information and
Warning
29. Emergency Triage and Pre-Hospital
Treatment
30. Medical Surge
31. Medical Supplies Management and
Distribution
32. Mass Prophylaxis
33. Mass Care (Sheltering, Feeding and
Related Services)
34. Fatality Management
Recover Mission capabilities
35. Structural Damage Assessment
36. Restoration of Lifelines
37. Economic and Community Recovery
Each capability summary in the TCL document contains the capability definition and is
followed by an outcome statement that describes the expected results to be achieved. The
summary includes an identification of the relationship between the capability and the
emergency support function. Each summary also contains a description of major activities
performed and the critical tasks and measures associated with the each activity. As a method to
determine if a community has achieved the target capability, the summary provides metrics
21
associated with the performance measures of that capability (FEMA, 2007b). Performance
measures are quantitative or qualitative levels against which achievements of a task or
capability can be assessed. It should be noted that they are not normalized, nor are they
standards. They are simply a guide for planning and training.
The communication capability will be used as an example of the information provided by
the TCL document. The capability definition is given as follows:
“Communications is the fundamental capability within disciplines and
jurisdictions that practitioners need to perform the most routine and basic
elements of their job functions. Agencies must be operable, meaning they
must have sufficient wireless communications to meet their everyday internal
and emergency communication requirements before they place value on being
interoperable, i.e., able to work with other agencies.” (FEMA, 2007b, p. 29)
An example of critical tasks required to meet this capability are (FEMA, 2007b, p. 34):
“Implement incident communications interoperability plans and protocols”
“Implement procedures to protect information facility and communication network
systems”
Measures and metrics to determine accomplishment of these tasks are given as the
following (FEMA, 2007b, p. 34):
“Percent of communications sent and received that are completely understood
without ambiguity by the sender or the intended receiver - 90%”
“Frequency with which communications back-up is provided during emergencies
when the conventional mode of communication fails or become overloaded -
Continuous”
2.2.3 UN Office for Disaster Risk Reduction – Hyogo Framework for Action
Shortly after the Asian tsunami in 2005, the Hyogo Framework for Action (HFA) 2005-
2015 was developed at the World Conference on Disaster Reduction in Kobe Japan (UN/ISDR,
2005). The conference provided an opportunity to promote a strategic and systematic approach

22
to reducing vulnerabilities and risks to hazards. The need to identify ways to build communities
with better resilience to disasters was evident. As a result, the United Nations International
Strategy for Disaster Reduction (UN/ISDR) office in collaboration with United Nations Office for
the Coordination of Humanitarian Affairs (UN/OCHA) put forth three strategic goals as part of
the Hyogo Framework for Action (UN/ISDR and UN/OCHA, 2008).
1. To integrate risk reduction into sustainable development and planning
2. To develop and strengthen institutions, mechanisms and capacities to build resilience
to hazards
3. To systematically incorporate risk reduction approaches into the implementation of
emergency preparedness, response and recovery programs
To achieve the goal set out as part of the framework, the conference also outlined five
specific priorities (UN/ISDR and UN/OCHA, 2008).
1. Making disaster risk reduction a national and local priority
2. Improving risk information and enhance early warning
3. Building a culture of safety and resilience through education and innovation
4. Reducing the risks in key sectors
5. Strengthening preparedness for effective response
As part of the fifth priority, strengthening preparedness for effective response, a guidance
and indicator package for implementing the framework was created. In the package, the Hyogo
Framework highlighted the essential role that disaster preparedness can play in saving lives
when integrated into an overall disaster risk reduction approach. Preparedness for hazardous
events is mainly concerned with two objectives, increasing capacity to predict, monitor and be
prepared to reduce damage and strengthening preparedness to respond in an emergency and
help those involved (UN/ISDR and UN/OCHA, 2008).
The essentials required for developing disaster preparedness capabilities is discussed as
part of the framework. It outlines the importance of contingency planning and capacity analysis
in strengthening disaster preparedness. Each section includes a suggested outcome and a set of
indicators to help measure levels of preparedness and progress made. The indicators have
various forms for measuring outputs and processes. Ideally, indicators developed during the

23
preparedness phase can be used as a baseline for measuring change over time and across
different contexts. In some instances the indicators serve as a checklist for ensuring
preparedness activities are being undertaken. The indicators cover the following components of
preparedness (UN/ISDR and UN/OCHA, 2008).
Holistic Approaches and Preparedness
National institutional and Legislative Framework
Coordination at the Local, National, Regional, and International Level
Contingency Planning
Capacity Analysis and Capacity-Building
Hazard Monitoring, Forecasting and Early Warning
Information Management and Communication
Emergency Services and Stand-by Arrangements
Incorporating Early Recovery into Preparedness Planning
Resource Allocation and Funding
Each component has a set of indicators developed specifically for each level of society;
government, civil society, regional organizations and international actors (UN/ISDR and
UN/OCHA, 2008).
The Red Cross and Red Crescent Implementation of the Hyogo Framework
Since the Hyogo Framework’s conception in 2005, 168 governments and organizations
have pledged to implement it (UN/ISDR and UN/OCHA, 2008). One of the more prominent
supporters of the Hyogo Framework is the International Federation of Red Cross and Red
Crescent Societies (IFRC). As seen in the International Federation’s global agenda in 2008, the
IFRC committed to four goals. They are the following: (1) reduce the deaths, injuries and
impacts of natural disasters, (2) reduce the deaths, injuries and impacts of diseases and public
health emergencies, (3) increase capacity to address urgent situations of vulnerability, and (4)
promote respect for diversity and human dignity (IFRC, 2008).

24
With the first goal in mind, the IFRC societies have been working with communities to
strengthen their coping capabilities and resilience to natural disasters using the HFA. By
integrating the HFA and lessons learned through experience, the International Federation and
National Societies were able to develop their own framework entitle Framework for
Community Safety and Resilience (IFRC, 2008).
“The aim (of the Framework) is to support National Societies in the promotion
and implementation of a holistic, integrated approach developed with and for
communities in response to the multiple hazards they face (including those
worsened by climate change) and incorporating health, environmental risks,
and economic and social issues. The framework consolidates work undertaken
to date to reduce underlying vulnerabilities to disasters as part of the Red
Cross Red Crescent’s commitments under the HFA.” (IFRC, 2008, p. 1)
By contributing to the goals and priorities of the HFA, the IFRC societies have given
themselves an advantage in disaster preparedness. They are now part of a global network that
shares the same goals and priorities when it comes to disaster risk reduction. The advantage
enables them to participate in large scale disaster relief operations in parallel with other
organizations that have implemented the HFA.
2.2.4 Public Safety Canada – Emergency Measures Organizations
Emergencies stemming from natural disasters are localized events for most cases. Coastal
and landlocked communities are vulnerable to different threats and therefore have different
measures in place. A village in Saskatchewan would most likely not have emergency response
plans to deal with storm surges. For this reason emergencies are managed at the community or
provincial/territorial level. However, in some cases natural disasters can transcend jurisdictional
boundaries and the scope of the emergency becomes much larger than the jurisdiction can
handle. The Federal Emergency Response Plan (FERP) is the Government of Canada’s all-hazard
response plan. The FERP is designed to complement response efforts from the provincial and
territorial government. It does not override the provincial plans (Government of Canada, 2011).

25
The provincial approach to preparedness is managed by their respective Emergency
Management Organization or Emergency Measures Organization (EMO). Whether they go by
emergency management or measures, they provide the same service to their inhabitants and
collectively fall under Public Safety Canada. The EMO’s activities include planning, training, and
responding to disaster situations. They are also responsible for research and the administration
and delivery of financial assistance to their province. By establishing provincial or territorial
organizations, EMOs can address natural hazards and risks for their respective region. The
following segment provides an overview of the EMOs for the four provinces and territories in
which there are Canadian C-Change communities.
Prince Edward Island Emergency Measures Organization
The Prince Edward Island Office of Public Safety overlooks emergency services in the
province. These services include the 911 Administration office, the Fire Marshal's office and
Emergency Measures Organization. The emergency measures organization is responsible for
the development and coordination of the provinces emergency management program in
relation to emergencies and disasters in the province (Prince Edward Island EMO, 2010).
In an effort to prepare communities in PEI for emergency situations, a comprehensive
response program was introduced. As part of the response plan two key documents can be
found on the PEI EMOs website, the Municipal Emergency Management Guide (Prince Edward
Island EMO, 2010) and the Municipal Emergency Measures Plan Template (Prince Edward
Island EMO, 2012). The management guide outlines key components and steps to develop
plans, create exercises and ensure resources have been identified before an emergency occurs.
The document guides communities through the process of developing a municipal emergency
program, writing the contingency and evacuation plan, and setting up the emergency operation
centre (Prince Edward Island EMO, 2010). The Municipal Emergency Measures Plan Template
provides municipalities with a starting point in developing an emergency measure plan. This all-
hazards emergency plan template guides the emergency management actions of the
community and describes activities and arrangements to deal with any emergency situation
(Prince Edward Island EMO, 2012).

26
Municipalities in PEI are responsible for (Prince Edward Island EMO, 2010):
Analyzing risks and hazards within their municipality and developing emergency plans
for those in the community.
Preparing and implementing emergency programs using the resources available to
them.
Guiding all emergency operations where the magnitude of the emergency is within
their capabilities.
Requesting assistance from other municipalities or higher government levels when
needed.
The documents by the PEI EMO are all-hazard emergency response oriented, however
they provide breakdowns and case studies that may prove to be very helpful for this research.
In the Municipal Emergency Management Guide, a sample table top exercise called “Exercise
October” was shown. This will be discussed in further detail in Section 2.4.2. The table top
exercise can be found in Appendix A.
Emergency Management British Columbia
British Columbia is the third most populated province in Canada. With over 4.6 million
people (BC Stats, 2013). It boasts a wide variety of services and resources as seen in their
emergency planning resources. The provincial emergency program, Emergency Management
British Columbia (EMBC) is the coordinating agency for all emergencies in the province. EMBC
has the mission to enhance public safety through leadership and collaboration with all levels of
the government, public and stakeholders involved (EMBC, 2012a).
Similar to Prince Edward Island, British Columbia has an all-hazard emergency response
plan. The All-Hazard Plan outlines the response framework for emergencies and disasters at
scales that requires the involvement of EMBC. The framework involves a provincial all-hazards
methodology, description of responsibility for key players at all levels, and an outline of the
collaborative intergovernmental relationship and integration for emergency planning (EMBC,
2012a).

27
In British Columbia the Emergency Program Act and the Local Authority Emergency
Management Regulation states that local municipalities are responsible for developing
emergency plans based on the hazards and vulnerabilities of their communities (Government of
British Columbia, 2013). Often times, these plans will closely reflect the All-Hazard Plan for
maximum interoperability within the system. It should be noted that the provincial All-Hazard
Plan does not override the local authority plans. Instead, the provincial All-Hazard Plan will
guide EMBC activities when the local municipality has declared a provincial state of emergency
(EMBC, 2012a).
Aside from the provincial All-Hazard Plan, EMBC has a flood response plan that is specific
to dealing with rising water levels and storm surges. The British Columbia Flood Response Plan
of 2012 describes the methodology to be taken by the government in the event of a flood. The
plan focuses on readiness and response activities for floods at the regional or provincial level
(EMBC, 2012b).
Water level advisory is provided by the River Forecast Centre in three advisory levels
(EMBC, 2012b):
1. High stream flow advisory: river levels are rising rapidly, but no major flooding is
expected. Minor flooding in low-lying areas is possible.
2. Flood watch: river levels are rising and may exceed bankfull. Flooding of areas
adjacent to affected rivers may occur.
3. Flood warning: river levels have exceeded bankfull. Flooding of areas adjacent to the
rivers affected will result.
In the event of a high stream flow advisory resources are pre-positioned and the media is
contacted to alert the public. Public flood impact mitigation techniques are relayed through the
media. Local authority will assign observers and monitor the water level closely. If a flood watch
advisory is issued by the river forecast centre, local authorities will actively patrol river banks to
monitor the situation. Dikes, dams and other water control infrastructure are constantly
monitored and spillways are kept clear. These measures are conducted on top of the high
stream flow advisory measures. Flood warnings advisories indicate a high probability of a flood
28
that will lead to damage. Provincial response will depend on the severity of the event and the
areas affected (EMBC, 2012b).
Nova Scotia Emergency Management Office
Emergency preparedness in Nova Scotia is outlined in the Nova Scotia Emergency
Response Plan and the Emergency Management Act of 2009. The all-hazard approach
document outlines methodologies for an effective, efficient and coordinated emergency
response plan. The document was designed to guide actions and decisions at the provincial
level, whether it involves a response from a single department on a contained site or a fully
coordinated joint response across multiple departments and jurisdictions (Nova Scotia EMO,
2012).
The response effort as outlined in the Nova Scotia Emergency Response Plan is
coordinated through the Joint Emergency Operations Centre (JEOC). The centre has the mission
to facilitate and maintain an efficient system for planning, managing and executing response
and recovery operations with the help of technology. The planning process at the JEOC follows
the incident command system’s P-model as shown in Figure 2-1 once an event has occurred
(Nova Scotia EMO, 2012). The P-model is commonly seen in incident command systems
management and the following section is based on the P-model as presented by FEMA in their
Incident Action Planning Guide (FEMA, 2012). The Nova Scotia Emergency Response Plan did
not explain the stages of the P-model. It should also be noted the Nova Scotia Emergency
Response Plan focuses on the action and decision making process of responding. Not as much
emphasis has been placed on the resources required to be prepared.
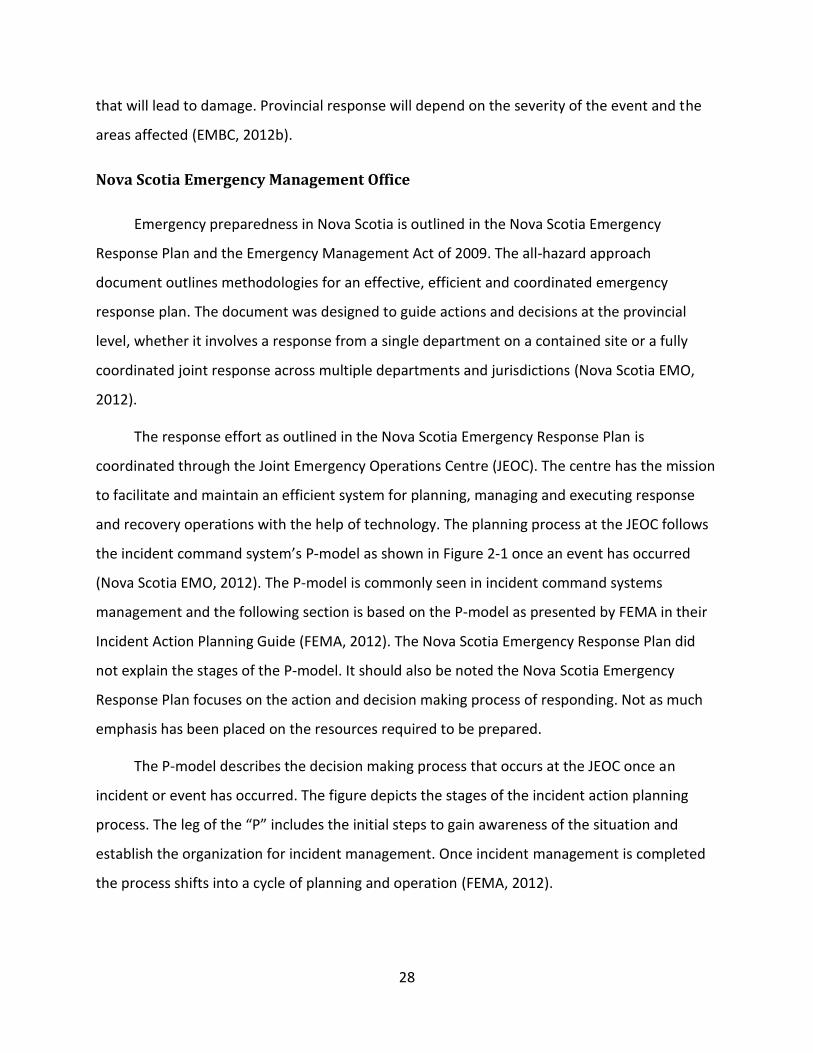
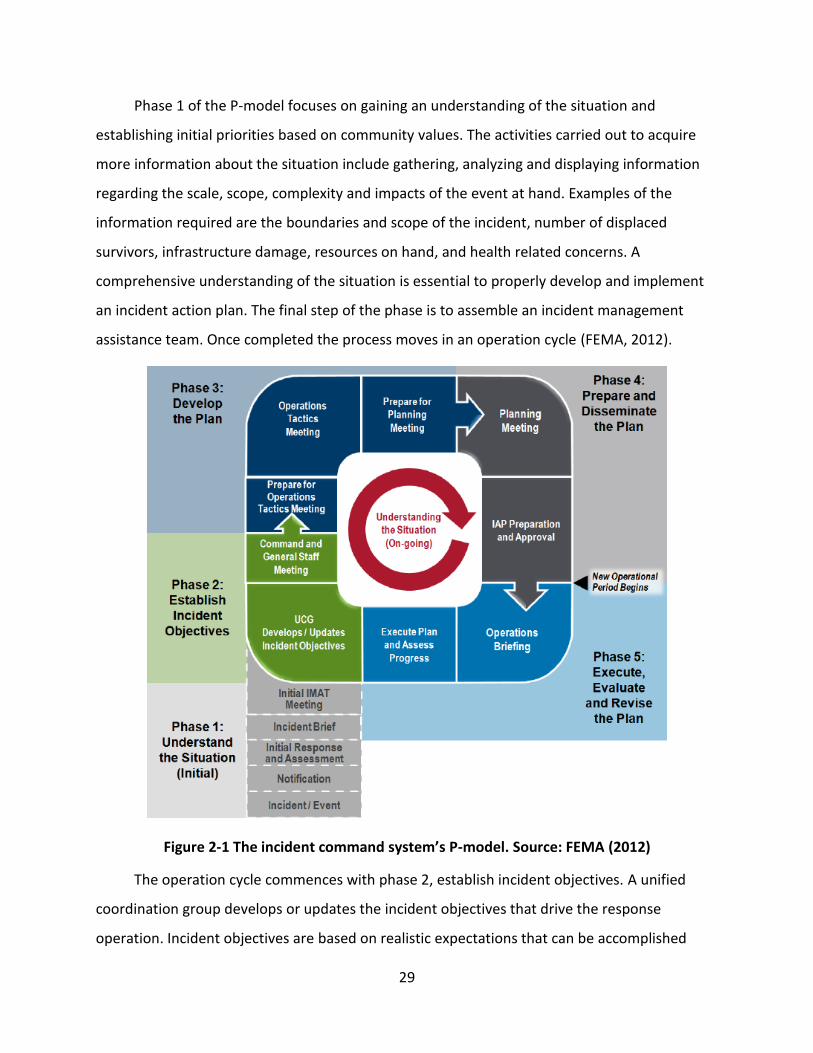
The P-model describes the decision making process that occurs at the JEOC once an
incident or event has occurred. The figure depicts the stages of the incident action planning
process. The leg of the “P” includes the initial steps to gain awareness of the situation and
establish the organization for incident management. Once incident management is completed
the process shifts into a cycle of planning and operation (FEMA, 2012).
29
Phase 1 of the P-model focuses on gaining an understanding of the situation and
establishing initial priorities based on community values. The activities carried out to acquire
more information about the situation include gathering, analyzing and displaying information
regarding the scale, scope, complexity and impacts of the event at hand. Examples of the
information required are the boundaries and scope of the incident, number of displaced
survivors, infrastructure damage, resources on hand, and health related concerns. A
comprehensive understanding of the situation is essential to properly develop and implement
an incident action plan. The final step of the phase is to assemble an incident management
assistance team. Once completed the process moves in an operation cycle (FEMA, 2012).
Figure 2-1 The incident command system’s P-model. Source: FEMA (2012)
The operation cycle commences with phase 2, establish incident objectives. A unified
coordination group develops or updates the incident objectives that drive the response
operation. Incident objectives are based on realistic expectations that can be accomplished
30
when all available resources are effectively deployed. In the initial stages following an incident,
objectives are general and simple. As the operation loop progresses and the situational
awareness and status has improved, then objectives can become more specific. An example of
a general objective is to restore electrical service in the county. Once the situation has
improved, then a time component can be added to the objective. For instance, restore power
to more vulnerable areas first within a given time frame (FEMA, 2012).
Phase 3 of the P-model calls for developing strategies to achieve the incident objectives
previously set out and to create tactics to accomplish the strategies. Strategies, as defined by
FEMA, describe actions and resources required to achieve specific objectives. They are distinct
from tactics, which address the conduct of specific operations. Properly developed strategies
are (FEMA, 2012):
Feasible and are likely to achieve a desired outcome
Meet safety standards
Cost effective
Conscious of the environment
Considers the political situation
Address the capabilities
As part of the strategy developing process, work assignments and responsibilities for the
response are allocated at this stage as well. Organizations are to assign responsibilities based
on their internal hierarchical structure, and this may vary from organization to organization
(FEMA, 2012).
In phase 4, prepare and disseminate the plan, the incident action is approved by the
unified command group. As part of policy, this phase requires key supporting documents and
paperwork to be completed. The supporting documents will depend on the event or incident to
be addressed. In most instances they include: Incident Radio Communications Plan, Incident
Map, Assignment List, Air Operations Summary and Medical Plans (FEMA, 2012).
31
Once all plans and strategies have been approved, phase 5 calls for execution, evaluation
and revision of the plan. Phase 5 begins with the operations briefing and continues as the
incident action plan is executed, followed by the evaluation (FEMA, 2012).
Incident action plans are useful for emergency responders in the sense that it:
Shows clear objectives of the decision makers for the response operation
Shows how individuals fit in the overall plan and that their individual effort affects
the success of the operation
Identifies work assignments
Provides a schedule of key events during operation
Provides information about safety, important contacts, and graphical representation
of the incident area
The Nova Scotia Emergency Management Office Incorporates the P-model into their
decision making process as well (Nova Scotia EMO, 2012).
Nunavut Emergency Management
Nunavut Emergency Management is part of the Community and Government Services
Department of Nunavut. They are responsible for developing emergency response plans and
coordinating emergency response operations in the territory. Training for emergency
responders and education for public awareness and preparedness is coordinated through the
Nunavut Emergency Management also (Government of Nunavut, 2010). The City of Iqaluit has a
Climate Change Adaptation Action Plan developed in 2010 that mentioned the need to improve
emergency response plans to adapt to a changing climate (Lewis & Miller, 2010).
2.2.5 International Emergency Management Group – International Emergency Management Assistance Compact
The International Emergency Management Assistance Compact (IEMAC), adopted in 1998
by the International Emergency Management Group (IEMG) following the ice storm, provides a
structure for inter-jurisdictional and international mutual aid (IEMG, 2009). It establishes the
procedures whereby a disaster impacted jurisdiction can request the aid of another quickly and
32
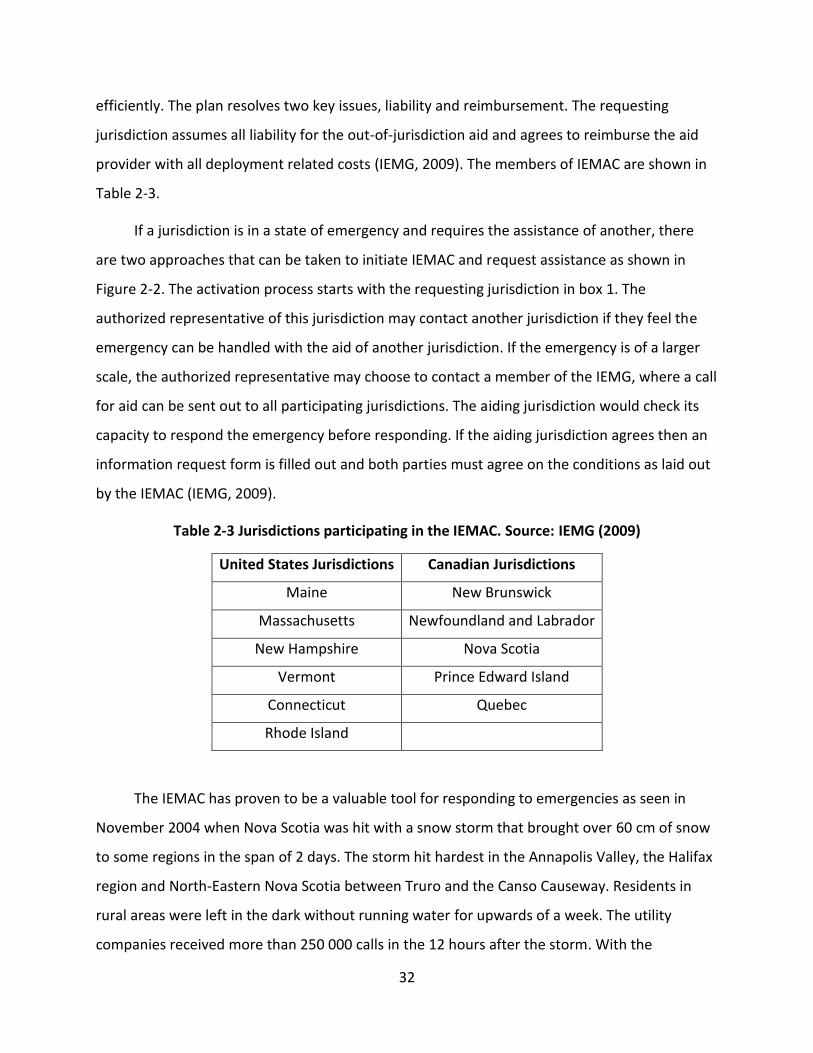
efficiently. The plan resolves two key issues, liability and reimbursement. The requesting
jurisdiction assumes all liability for the out-of-jurisdiction aid and agrees to reimburse the aid
provider with all deployment related costs (IEMG, 2009). The members of IEMAC are shown in
Table 2-3.
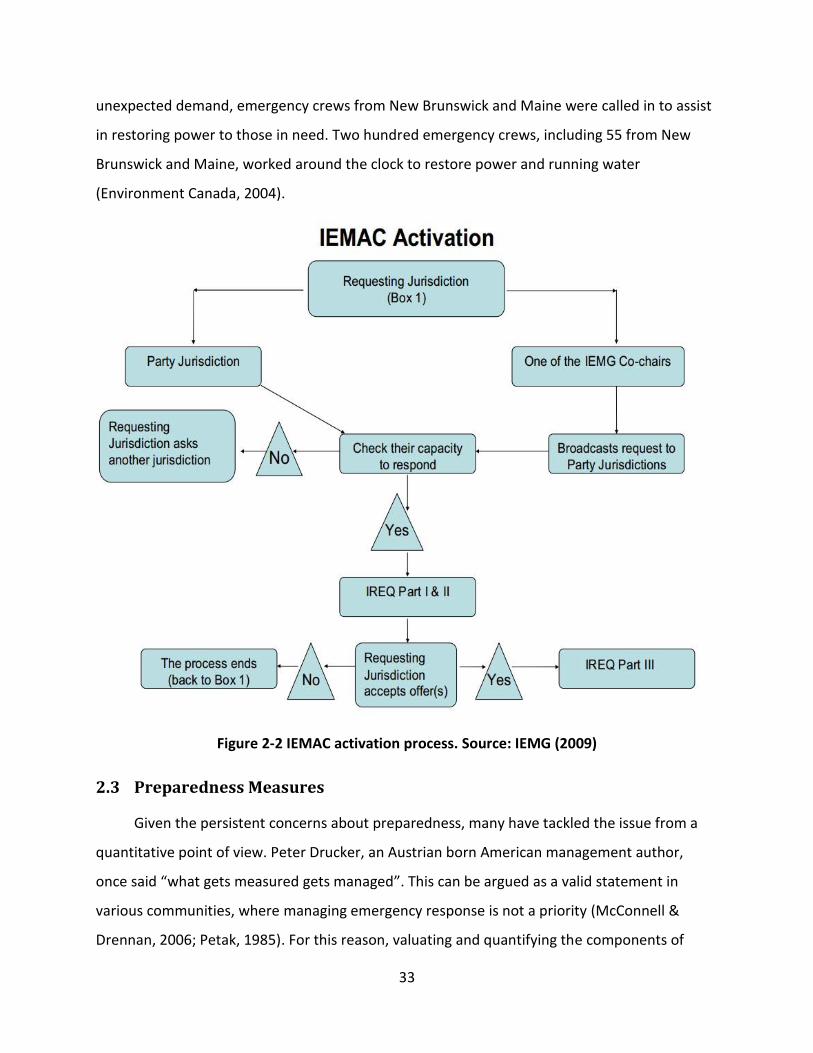
If a jurisdiction is in a state of emergency and requires the assistance of another, there
are two approaches that can be taken to initiate IEMAC and request assistance as shown in
Figure 2-2. The activation process starts with the requesting jurisdiction in box 1. The
authorized representative of this jurisdiction may contact another jurisdiction if they feel the
emergency can be handled with the aid of another jurisdiction. If the emergency is of a larger
scale, the authorized representative may choose to contact a member of the IEMG, where a call
for aid can be sent out to all participating jurisdictions. The aiding jurisdiction would check its
capacity to respond the emergency before responding. If the aiding jurisdiction agrees then an
information request form is filled out and both parties must agree on the conditions as laid out
by the IEMAC (IEMG, 2009).
Table 2-3 Jurisdictions participating in the IEMAC. Source: IEMG (2009)
United States Jurisdictions Canadian Jurisdictions
Maine New Brunswick
Massachusetts Newfoundland and Labrador
New Hampshire Nova Scotia
Vermont Prince Edward Island
Connecticut Quebec
Rhode Island
The IEMAC has proven to be a valuable tool for responding to emergencies as seen in
November 2004 when Nova Scotia was hit with a snow storm that brought over 60 cm of snow
to some regions in the span of 2 days. The storm hit hardest in the Annapolis Valley, the Halifax
region and North-Eastern Nova Scotia between Truro and the Canso Causeway. Residents in
rural areas were left in the dark without running water for upwards of a week. The utility
companies received more than 250 000 calls in the 12 hours after the storm. With the
33
unexpected demand, emergency crews from New Brunswick and Maine were called in to assist
in restoring power to those in need. Two hundred emergency crews, including 55 from New
Brunswick and Maine, worked around the clock to restore power and running water
(Environment Canada, 2004).
Figure 2-2 IEMAC activation process. Source: IEMG (2009)
2.3 Preparedness Measures
Given the persistent concerns about preparedness, many have tackled the issue from a
quantitative point of view. Peter Drucker, an Austrian born American management author,
once said “what gets measured gets managed”. This can be argued as a valid statement in
various communities, where managing emergency response is not a priority (McConnell &
Drennan, 2006; Petak, 1985). For this reason, valuating and quantifying the components of

34
preparedness to develop preparedness measures, checklists and indices have been pursued by
many.
2.3.1 Preparedness Indicator Checklists
The checklist approach focuses on developing a list of items (guidelines) or set of
indicators that a community requires in order to be prepared for a storm. In general, these
guidelines or list of indicators are based on ingredients of preparedness that a readily countable
(Jackson, 2008). They do not take into account the dynamics of the system, the operations
aspect. To be successful a community needs plans in place to respond, needs equipment that
the plans call for as well as personnel to implement the plan. This approach is most easy to
follow for decision makers and allows the common public to visualize areas that need
improvement (O'Leary, 2004). Shortages in preparedness ingredients can easily be identified
from the list of indicators and appropriate actions can be taken. In a sense, it is the most user
friendly approach and lays out the requirements clearly (Jackson, 2008).
Checklist style approaches often utilize the terms guidelines, indicators, and/or
capabilities to identify the components of the checklist. The NWS StormReady Program, FEMA
Target Capabilities List and the Hyogo Framework for Action all take this approach to defining
preparedness.
2.3.2 Preparedness Indices
A different approach to defining preparedness is through the use of an aggregated
measure or index of preparedness. The creation and use of an index has been a popular
methodology for evaluating relative levels of some state, whether economic, health, quality of
life or another state of being (O'Leary, 2004; Simpson, 2008). In some cases, there have been
indices that attempt to capture levels of social vulnerability to natural hazards (Adger, 1999).
Preparedness indices consist of a set of indicators, and through the application of a
mathematical method the indicators are assigned scores and an index value is derived to
measure relative preparedness.

35
A number of issues arise when attempting to construct disaster-preparedness measures
and indices. Potential problems include subjectivity, bias, weighting, mathematical
combinations, and selection of indicators. The following discussion examines several major
indices and provides a breakdown of their structure and approach.
In 1987, Gillespie and Streeter proposed a method of conceptualizing and measuring
disaster preparedness of an organization through the use of seven items that contributed to an
overall measure of the preparedness. The summative measure of preparedness was scored
upon how the organizations responded to the seven questions. The questions covered past
training experience for the organization, future training opportunities, planning, and Integrated
Emergency Management System (IEMS) Concepts. The IEMS concept was coined in the 1980s
by FEMA as an all-hazard approach to the coordination, direction and control of disasters
independent of their type, origin, size, and complexity. The responses were scored based on
their type. For example, a yes or no response from the question of “Does your organization
have a specific emergency response plan to guide its operation in a disaster?” would yield a
score of 1 for yes and 0 for no. Questions that yield a quantitative responses such as “During
the past three years, how many different times has a representative of your organization
participated in simulated disaster exercises?” will have a scoring system of 0, 1, 2 or 3 for 3 or
more times. The scores from the seven items were normalized onto a single dimension with the
help of z-distributions. The average between the scores became preparedness measure
(Gillespie & Streeter, 1987).
In 2006, Simpson and Katirai from the Centre for Hazard Research and Policy
Development at the University of Louisville proposed an integrative framework for disaster
preparedness index (DPi). Various models have been created in the past to evaluate community
exposure and risks to a disaster but not so much for preparedness. They proposed a disaster
resiliency index that is a function of vulnerability and preparedness (Simpson & Katirai, 2006).
( ) ( )
( ) ( )

36
Where DRi > 1 means that the community is more resilient, and DRi < 1, the community is
less resilient.
The disaster resiliency index can be considered to be a function of a community’s
preparedness in a ratio relative to its exposure and a set of hazards. Resiliency and community
preparedness are directly proportional (Simpson & Katirai, 2006).
The key variables, measures and metrics for such a model are developed using a
collaborative and consensus based process among literature in the field. The individual
measures used will be determined and weighted from a list of indicators used in previous
literature. The indicators will be identified as either a functional measure of preparedness (FM)
or a vulnerability measure (VM). Once these measures have been identified and selected from
previous literature, they can scaled and normalized to fill the following equations (Simpson &
Katirai, 2006).
The first equation derives the preparedness index for the given community.
∑( ) ( )
Where:
( )
The second equation derives the vulnerability score for the given community
∑ ∑( ) ( )
Where:
( )

37
By plugging vulnerability (V) and preparedness index (Pi) into the disaster resiliency index
equation mentioned previously, one can derive a score that is directly proportional to the
community’s preparedness level (Simpson & Katirai, 2006).
Figure 2-3 summarizes how the disaster preparedness index is formulated. The
measurement indicators will be determined from a listing of indicators used in other models.
Figure 2-3 Disaster indexing measurement model diagram. Source: Simpson and Katirai (2006)

38
2.3.3 Response Reliability
As seen from the checklists and indices, attempts to assess preparedness have focused on
quantifying resources or measures that are easiest to quantify and identify. It is evident that
having the right quantity of equipment or personnel is essential for a community to be
prepared. Without the right tools the operation would not be able to succeed. Other efforts
have gone beyond inventorying resources to developing preparedness standards to assess less
tangible components of preparedness. These efforts generally produce an action plan or
framework for response. They can be viewed as the instruction manuals providing guidance on
how to proceed in the case of an emergency. At this stage, the tools and instructions are both
evident as modules of preparedness. With an excess of resources and an optimal response
plan, communities still lack a response to the fundamental question of: How certain can we be
that the systems we have put in place to respond to storm surges will be able to deliver when
called upon? The answer to this question lies in evaluating the effectiveness or reliability of the
system once it is in practice. Confidence that response plans will be able to execute effectively
depends on the reliability of the system that is executing these plans (Jackson, 2008; Jackson,
Sullivan, Willis, & Goulka, 2009).
Emergency preparedness plans can be deceiving in many cases. In theory, access to aid
supplies and a plan to deliver them to areas in need is a great preparedness strategy. However,
if these areas of need are only accessible by a single road that can easily wash out in the event
of a storm then the plan is no longer as relevant to the overall preparedness state.
The RAND Corporation has brought light to this issue by proposing that response
reliability should be evaluated as part of preparedness measurement efforts. Such assessments
should be based on the nature of the system of organizations, governments and public and the
factors that contribute to how well they respond as a whole. The RAND Corporation suggested
mapping the system and identifying the elements that shape the performance of a given task.
In other words, the capabilities are mapped with factors that may interrupt the process.
Reliability measures can be tabulated by estimating the likelihood of breakdowns and
identifying their impact on performance of the system (Jackson, 2008; Jackson, Sullivan, Willis,
& Goulka, 2009).

39
Figure 2-4 is an example of a fault analysis for identifying risks to evacuation reliability
using buses.
Figure 2-4 Example fault tree for the analysis for identifying risks to evacuation reliability. Source: Jackson (2008)
This example is seen in areas prone to flooding and the population needs to evacuate.
The response operation is shown in the white boxes, while the shaded boxes show possible
disruption to the evacuation operation. The events are not exhaustive but they do illustrate
factors that vary the reliability of such a plan. Simply having a system in place is not merely
enough. Preparedness is heavily dictated by the reliability of the system in place (Jackson, 2008;
Jackson, Sullivan, Willis, & Goulka, 2009).

40
2.4 Evaluation and Preparedness Modelling
The application of modelling techniques to preparedness has proven to be a valuable
tool. Modelling and simulation studies have been conducted to predict vulnerable areas to
storms, and train responders. Simulation studies can also be done as a role playing table top
exercise, commonly referred to as a “mock-up” exercise.
Section 2.4.1 reviews modelling and simulation approaches for emergency situations
while Section 2.4.2 examines emergency mock-up exercises.
2.4.1 Emergency Situation Modelling
The section reviews emergency situation models. Four models supported by large
organizations, such as the US National Weather Service and the Canadian Meteorological
Centre of Environment Canada, provide modelling information for describing and predicting
weather related impacts. The later sections review simulation approaches applied to public
education and professional training through the use simulation gaming.
Sea, Lake, Overland Surges from Hurricanes (SLOSH)
In the days leading up to arrival of Hurricane Sandy in 2012, emergency responders were
tasked with deciding on which regions of the Eastern Seaboard had to be evacuated due to
imminent floods. The National Weather Service of the United States developed a tool called the
Sea, Lake, and Overland Surges from Hurricanes (SLOSH) model to provide guidance when a
hurricane is threatening by providing the predicted surge height in a specific region. In most
cases the model is used as a hazard analysis study for hurricane evacuation and training by
FEMA, the U.S. Army Corps of Engineers and local state or municipal responders. It has been
applied to 38 specific coastal areas in the United States, called basins that run along the eastern
coast down into the Gulf of Mexico coast (Glahn, Taylor, Kurkowski, & Shaffer, 2009; NOAA,
2003).
The SLOSH model is run by the National Hurricane Centre to estimate storm surge heights
resulting from historical, hypothetical, or predicted hurricanes by taking into account the
atmospheric pressure, size, forward speed, and track data. These parameters are used to create

41
a model of the wind field which drives the storm surge. The model is constructed on a set of
physics equations which are applied to the local topological and bathymetrical data. It also
incorporates physical barriers such as roads, bridges, trees, and levees (NOAA, 2003).
Figure 2-5 Sample output of the SLOSH model for Hurricane Ike in 2008 on Galveston Bay in Texas. Source: NOAA (2011)
Currently, there are three approaches that the SLOSH model can take on, deterministic,
probabilistic, and composite modelling. The deterministic approach is based on the assumption
of a perfect forecast. For a realistic simulation using the deterministic approach, the model
must have accurate meteorological inputs. These inputs have the form of pressure, radius of
maximum winds, location, direction, and forward speed. The deterministic approach proves to
be a great tool for simulation and training exercises where the storm is required to be
generated. The probabilistic approach incorporates statistics of past forecast performances to
generate an ensemble of SLOSH runs based on distributions of tracks, intensity, and size errors.
The composite SLOSH model predicts surge levels and location by running SLOSH several
thousand times with hypothetical hurricane conditions. The outputs generated from the
composite model are the Maximum Envelopes of Water (MEOW) and Maximum of the MEOWs

42
(MOM). This is determined to be the best method of analysis for surge vulnerability since it
takes into account forecasting uncertainty. A screenshot of the SLOSH program output is shown
in Figure 2-5 for the basin of Galveston Bay, Texas during Hurricane Ike. The colours represent
surge heights for their respective quadrant (NOAA, 2011).
The advantage found in using the SLOSH model is its efficiency in generating results in
real time. This makes it an ideal tool for operational use. The model can resolve the flow
dynamics of the surge as it passes through barriers. The disadvantage of the SLOSH model is
that it lacks the ability to account for waves on top of the surge level. It also does not account
for normal river flow and rain, nor does it model the tide level. In most cases the tide level can
be inputted as an initial water level before the simulation run (NOAA, 2003; NOAA, 2011).
Global Environmental Multiscale Model (GEM)
The Global Environmental Multiscale (GEM) model was developed by the Canadian
Meteorological Centre of Environment Canada. The GEM model presents an integrated
forecasting and data assimilation system to meet the foreseeable weather forecasting needs of
Canada. The motivation behind creating a global model is to forecast the weather, address
climate issues such as global change, and examine air quality issues such as smog, and ozone
depletion. The model is often used to predict short range forecasts and is often integrate with
the Global Forecast System model as designed by the Nation Weather Services of the United
States to North American Ensemble Forecast System (Environment Canada, n.d.).
National Oceanic and Atmospheric Administration – Sea Level Rise and Flooding
Impacts Viewer
The National Oceanic and Atmospheric Administration developed a tool to enable users
to visualize sea level rise and how it may affect their community. The Sea Level Rise and
Flooding Impacts Viewer is a screening level tool that enables the user to adjust the increase in
sea levels and explore their community through different visualization. It is interesting to note
that the viewer also enables users to compare socioeconomic vulnerability with flood risks
(NOAA, 2012).

43
Marine Environmental Observation Prediction and Response (MEOPAR)
Formed in 2012, the Marine Environmental Observation Prediction and Response
Network (MEOPAR) brought together leading Canadian researchers in the fields of marine
environment research and hazard management. Through research, MEOPAR seeks to reduce
Canada’s vulnerabilities and exposure to marine emergencies. This goal is to be carried out by
developing disaster risk reduction tools and proposing positive adaptation measures for
impacts of the ocean (MEOPAR, 2012).
MEOPAR is currently developing several weather prediction tools. Of interest to this study
are the Building a Network of Fixed Coastal Observing and Forecast Systems and the Climate
Change and Extreme Events in The Marine Environment projects. The first project will build
observation and prediction systems in the Halifax Harbour and the Southern Strait of Georgia.
The data acquired from these systems will help forecast sea levels, waves, currents, and
biogeochemical properties on a real-time basis for a multiple users like port authorities,
municipalities, and the oil and gas sector. The second project will translate scientific weather
prediction data into tools to increase preparedness and mitigate the impact of extreme
weather events in coastal regions (MEOPAR, 2012).
UN/ISDR Stop Disaster Simulation
Simulation as tool is not only used for professional training, but is often used in public
education as well. The United Nation’s International Strategy for Disaster Reduction as
implemented by the Office for Disaster Risk Reduction took the simulation gamming approach
to educate the public about preparing for threats from natural disasters. The game simulates
threats from tsunamis, floods, wildfires, hurricanes and earthquakes (UN/ISDR, 2007).
The on-line game aims at teaching the public how to build safer communities for
preparation against natural disasters. The lessons imparted in the simulation game include how
location and construction materials of houses can make a difference when disasters strike. Early
warning systems, evacuation plans and education all contribute to being prepared (UN/ISDR,
2007).

44
Figure 2-6 UN-ISDR Stop Disasters simulation game screenshot Source: UN/ISDR (2007)
Figure 2-6 is a screenshot of the Stop Disasters game. The game gives the player several
disaster scenarios to choose from and a budget to work with. The player is tasked with
upgrading existing infrastructures, building new ones and educating the public about
responding to the imposing threats. The player must finish the required tasks before the
disaster strikes. Once the disaster event has occurred a report is given in with suggestions and
recommendations for how to prepare in the future if the player failed at preparing the
simulated community (UN/ISDR, 2007).
Environmental Tectonics Corporation - Advanced Disaster Management Simulator
Technology is often used to simulate for a more realistic scenario during responders
training. The Advanced Disaster Management Simulator (ADMS) produced by the
Environmental Tectonics Corporation incorporates the use of CAD and produced 3D models and

45
environments for the purpose of professional training. ADMS is aimed at training incident
commanders, command post staff, and emergency vehicle operators at all levels. The program
offers training for individuals or as teams for a more realistic scenario where communication
amongst team members is vital (Environmental Tectonics Corporation, 2012).
The advantage that the ADMS program provides is a fully customizable environment. The
scenarios and spatial elements can be constructed from scratch based on community needs and
requirements. ADMS provides a comprehensive toolset for community simulation instructors to
control, assess and debrief after incident command exercises. From the instructor’s point of
view, they have a bird’s eye view of the operation environment. This allows for better
management during the exercise and areas that require improvement can be identified much
easier (Environmental Tectonics Corporation, 2012).
ADMS is widely used for emergency responder training in large scale operations. There
notable consumer are New York City’s Office of Emergency Management and the Ottawa
International Airport (Environmental Tectonics Corporation, 2012).
2.4.2 Emergency Mock-up Exercises
A mock-up exercise is a simulated emergency in which key players and actors can carry
out actions, functions, and responsibilities that would be expected of them in a real emergency.
Exercises are often used to validate plans and procedures that will lead to increasing
preparedness. These mock-up exercises are the most effective means of testing and validating
plans, policies, procedures, training, equipment, and interagency agreements for rare or
hazardous situations. If the unfortunate event of a natural disaster occurred more often, then
communities would have more experience in dealing with them. This is not a situation that one
would wish upon. Therefore a mock-up exercise provides the opportunity to test out the
preparedness measures in place. The following are examples of mock-up exercises used in the
field of disaster preparedness training.

46
Emergency Management Ontario
The Guidelines for the Development of an Exercise Program by Emergency Management
Ontario will assist governments and communities in developing a full exercise program to be
used for training. The Guidelines for the Development of an Exercise Program are a tool that
provides a risk based framework with guidance for planning, conducting and evaluating
exercises. These guidelines will enable organizations or communities to test elements of their
emergency plans, including equipment and functions of personnel. Rather than presenting a
predesigned exercise as seen with other approaches, the guidelines provide a standardized
process and framework for communities to design their own mock-up (Emergency
Management Ontario, 2010).
The document is organized into three sections: Process of Exercise Program
Development, Discussion-based Exercises, and Operations-based Exercises. The first section
focuses on key concepts in managing exercises and the phases involved in this process. The
latter two sections focus on requirements for the conduct of discussions and operations of the
exercises. The appendix also contains a mock-up creation template that may prove to be
valuable for this study (Emergency Management Ontario, 2010).
FEMA Tabletop Exercises
In 2010, FEMA’s Private Sector Division, Office of External Affairs created a series of
tabletop exercises as a tool to help private sector organizations advance their organization’s
preparedness. Tabletop exercises are designed to help test a hypothetical situation for a group
of responders, such as a natural or man-made disaster, and evaluate the ability of the group to
cooperate and work together, as well as test their readiness to respond. The packages contain a
PowerPoint presentation for the table top activity that includes notes and discussion questions
for the exercise facilitator. The exercise packages can be downloaded from the FEMA website
for communities to examine the first 72 hours of a response to a catastrophic disaster. The
interactive exercise was designed to spur discussion and develop innovative ways to fill gaps in
community emergency management plans (FEMA Private Sector Division, 2010).
47
The first table top exercise of the series entitled Whole Community: Planning for the
Unthinkable is designed to simulate an unprecedented catastrophic event, a maximum of
maximum approach. The presentation is given as three modules that cover the catastrophic
response, crisis communication and search and rescue. Each module is introduced with a mock-
up news report video, included in the downloadable package. Another exercise package to be
noted is the Hurricane Exercise. The exercise goal in this case is to prepare to respond and
recover from a category 5 hurricane (FEMA Private Sector Division, 2010).
PEI Municipal Emergency Management Guide – Exercise October
Prince Edward Island’s Municipal Emergency Response Guide includes a table tabletop
activity to prepare for emergency situations. Exercise October focuses on the planning
committee and organization of the EOC. The exercise can be conducted with little preparation
as a tabletop exercise to exchange information from the key players in response to an
emergency (Prince Edward Island EMO, 2010).
The following is a quick overview of what Exercise October brings. The scenario presented
is a severe winter storm on the hypothetical date of February 24th combined with high winds
and freezing rain. The ground is already covered by 30 centimetres of snow to increase the
difficulty of the operation. The Municipal Emergency Management Coordinator is apprehensive
about the situation and wishes to set up the EOC. What are the questions to consider when
setting up the emergency operations centre? As the storm progresses, different situations are
presented and a series of questions follow for the key players to discuss and share information
as a training exercise (Prince Edward Island EMO, 2010).
It is important to note afterwards, how things can be done differently and how
participants felt about the decisions as a whole. The detailed mock-up scenario can be found in
Appendix A of this proposal along with the questions for consideration during the walkthrough
(Prince Edward Island EMO, 2010).
48
2.5 Applications
In the case of an emergency, time is of the essence. An effective response means knowing
who is in charge and willing to take action. The Emergency Management Act of Canada sets out
clear roles and responsibilities for governments across the spectrum of emergency
management. The act covers prevention/mitigation, preparedness, response and recovery and
critical infrastructure protection. The Act is an integral part of the Government of Canada’s
efforts to protect its inhabitants. The Act provides the following (Government of Canada, 2007):
Gives responsibility to the Minister of Public Safety to provide leadership and sets
clear goals for emergency management in Canada
Establishes clear roles for key players in the emergency management spectrum
Enhances collaborative practices and information sharing among different levels of
government.
Gives authority to the Minister of Public Safety and Minister of Foreign Affairs to
coordinate Canada’s response to an emergency occurring in the United States.
In 2008, the Senate of Canada’s Committee on National Security and Defence produced a
report on emergency preparedness in Canada. In summary, the Canadian Government is not
moving quickly enough to minimize damage in the event of a hazard. The report also focuses on
what the government has done in recent years in preparation for the next large disaster event
(Government of Canada, 2008).
The all-hazard document claims that in recent years the government has inched towards
improving national coordination for disaster relief, but more is needed for Canadians to be
prepared. The committee examined disaster response capacity in areas that include
government services in emergency situations, capacity of Canadian forces to offer assistance,
funding municipalities, public communication, and many others. The results were attained
qualitatively through testimonies from more than 110 witnesses from 2001 to 2008. Two
emergency preparedness surveys were also conducted, one in 2003 and the other in 2007
(Government of Canada, 2008). The results identified 12 problems in the Canadian response
system that can be improved on. The problems are shown in Table 2-4.

49
Table 2-4 Twelve problems in the Canadian emergency response system as identified by the Canadian Senate report. Source: Government of Canada (2008)
1. Lack of emergency management
2. Use of the Canadian Forces for domestic emergencies
3. Hidden emergency caches
4. Lack of funding for equipment and training
5. Poor collaboration among governments
6. Lessons learned not remembered and poor leadership on best practices
7. Emergency public communications
8. Lack of first responder interoperability
9. First responders ignored
10. Poor federal leadership on critical infrastructure protection
11. Emergency ad hockery
12. Policing during emergencies
From the problems identified, one can see that disaster preparedness methodologies
have applications in Canadian communities.
2.5.1 Coastal Communities – City of Charlottetown, P.E.I.
The City of Charlottetown is the provincial capital of Prince Edward Island, located on the
southern shore of the island. The city boasts a rich history that dates back to when it was first
incorporated as a town in 1855. Today, with a population of 34,562 residents (2011 census),
Charlottetown is the centre of industrial and commercial activity in the province (C-Change,
2011a).
The tourism industry is most prominent in the region and is most strong during the
summer months when tourists flock the city for cultural events. Culturally the city is known for
its numerous summer festivals that include a Jazz and Blues Festival, Festival of Lights and The
International Shellfish Festival. Historically, it was the gathering place for the Charlottetown
Conference in 1864 that ultimately lead to the Canadian Confederation (C-Change, 2011a).
Geographically, the city is situated on the Charlottetown harbour forming a rough V-
shape pointing south. The harbour opens into the Northumberland Straight and is constrained
by the North (Yorke) and the Hillsborough (East) Rivers to the west and east. Aside from being
surrounded by waterways, Charlottetown has an impressive amount of green space and parks
(approx. 400 acres). They provide residents and tourists with many passive or active

50
experiences depending on their interests (C-Change, 2011a). A map of the city is shown in
Figure 2-7.
Figure 2-7 Map of Charlottetown. Source: Google Maps (2013)
As a coastal community along the eastern seaboard, Charlottetown is directly vulnerable
to the effects of sea level rise. In recent years storm surges have taken its toll on the city by
means of floods, large waves, and coastal erosions. In some cases, sea ice formations have
damaged infrastructures. These are explicitly observable forces. Sea level rise has also caused
well contamination in the many communities along the coast.
Hurricane Juan in 2003 was considered to be one of the most damaging hurricanes to
have hit the East Coast in recent memory. Juan made landfall onto the shores of Nova Scotia as
a category 2 storm in September 2003 with sustained winds of over 1213 km/h. The hurricane
moved across Nova Scotia into Prince Edward Island knocking down millions of trees and
causing major flooding that damaged homes, businesses and left hundreds of thousands of

51
residents without power for nearly 2 weeks. The storm was responsible for 8 deaths and $100 –
150 million in damage (Environment Canada, 2012).
In 2012, Hurricane Igor hit the eastern seaboard with winds of 140 km/h and rainfall of
more than 200 mm. It caused widespread flooding and power outages in many communities
along the coast. Water damaged homes, businesses, and harbours and caused several major
roads to close including the Trans-Canada Highway. There was one reported death and damage
was pegged at $65 million by the Insurance Bureau of Canada and non-insured costs were
estimated to be $120 million (Environment Canada, 2012).
It is evident through literature that climate change has made coastal communities
vulnerable to the effects of storm surges. The communities involved in the C-Change project are
all at risk. This proposed research uses Charlottetown as a case study but all coastal
communities would benefit from further research in adaptation planning for climate change.
2.5.2 Coastal Communities – Community of Isle Madame, N.S.
The island community of Isle Madame is home to 2644 residents as of 2011 (Government
of Nova Scotia, 2012) and is located on the South-Eastern side of the larger Cape Breton Island.
The community is a part of the Richmond Country in Nova Scotia and is separated from the
mainland of Cape Breton by the Lennox Passage. Isle Madame itself is composed of three main
communities, Isle Madame, Petit-de-Grat, and Janvrin’s Island (C-Change, 2011b).
Historically, it has been an important port for cod fishing in the region. Today, the fishing
industry still remains as a significant employer with a snow crab plant in Petit-de-Grat and the
international fisheries operation of Premium Seafoods Ltd. in Arichat. The island was first
settled by France and was presumed to be named after Madame de Maintenon, the second
wife of King Louis XIV. During the Seven Years’ War many Acadians took refuge in the region.
Acadian families were able to established roots in the region and form a large French
community. Today, Isle Madame can boast a rich blend of culture and a unique bilingual style
(C-Change, 2011b).
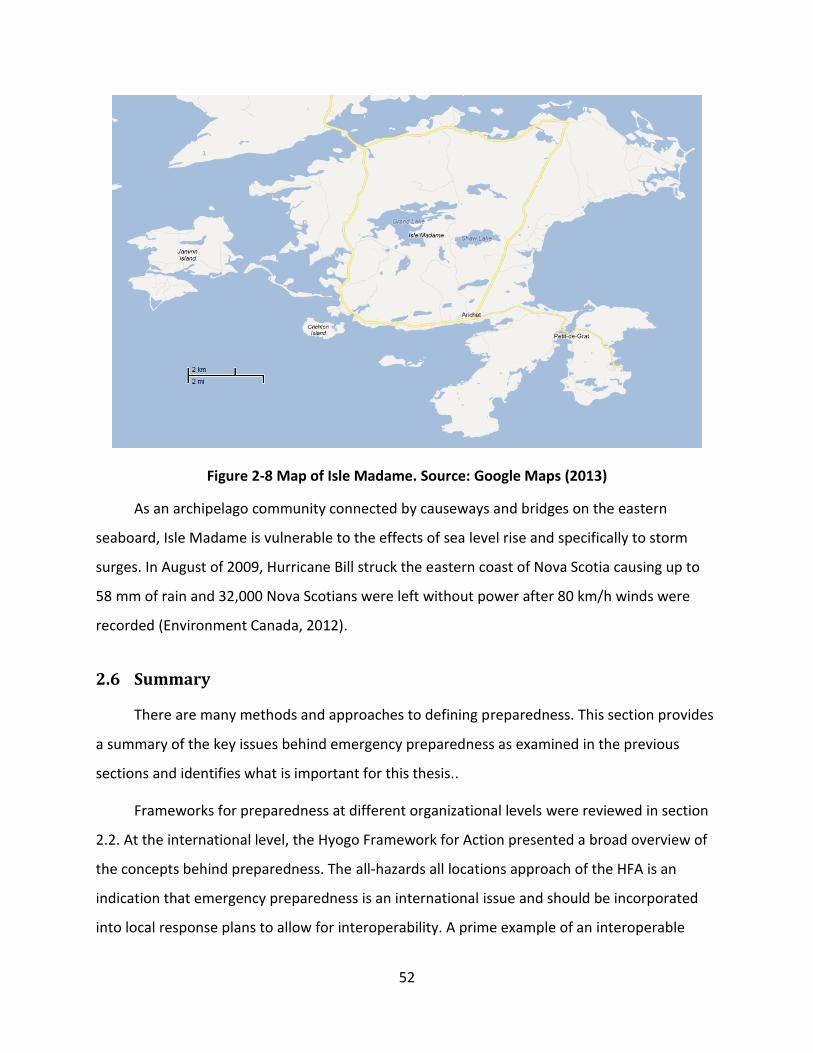
52
Figure 2-8 Map of Isle Madame. Source: Google Maps (2013)
As an archipelago community connected by causeways and bridges on the eastern
seaboard, Isle Madame is vulnerable to the effects of sea level rise and specifically to storm
surges. In August of 2009, Hurricane Bill struck the eastern coast of Nova Scotia causing up to
58 mm of rain and 32,000 Nova Scotians were left without power after 80 km/h winds were
recorded (Environment Canada, 2012).
2.6 Summary
There are many methods and approaches to defining preparedness. This section provides
a summary of the key issues behind emergency preparedness as examined in the previous
sections and identifies what is important for this thesis..
Frameworks for preparedness at different organizational levels were reviewed in section
2.2. At the international level, the Hyogo Framework for Action presented a broad overview of
the concepts behind preparedness. The all-hazards all locations approach of the HFA is an
indication that emergency preparedness is an international issue and should be incorporated
into local response plans to allow for interoperability. A prime example of an interoperable

53
operation is the IFRC’s implementation of the HFA. At the national level, FEMA’s Target
capabilities list is a thorough definition of preparedness given their approach to the problem.
FEMA identified 15 national planning scenarios as case studies to develop tasks that must be
achieved to overcome the scenarios. From the universal tasks list, they were able to develop
target capabilities required to accomplish the tasks. More specific to weather related disasters
is the NWS’s StormReady program that can certify communities to be StormReady if they meet
the StormReady guidelines. In Canada, emergency management falls under Public Safety
Canada’s EMO offices. EMOs are regionally based and operated by the provincial or territorial
government to address local threats. Emergency response plans developed by the EMOs for the
four provinces and territories in which there are Canadian C-Change communities were
presented. In addition to local response frameworks, preparedness can be found through
collaboration planning with neighbouring communities. The IEMAC allows for member
jurisdictions to request the aid of another member given that all financial costs are reimbursed
after the event of need.
Measures of preparedness are generally shown as indicators – a quantitative or
qualitative identifier to monitor the state of preparedness. These indicators are referred to as a
checklist approach if they are presented as a set of indicators. On the other hand, attempts
have been made at weighing and normalizing indicators to create an aggregated measure or
index of preparedness. The RAND Corporation presented the concept of a response reliability of
the overall response system to measure the preparedness.
Training and evaluation are vital steps towards being prepared. Emergency situation
simulation and modelling is often used to forecast weather events and provide responders with
risk free training opportunities. The SLOSH and GEM models are weather prediction models
commonly used in North America for forecasting. MEOPAR is in the process of developing
prediction methods to reduce Canada’s vulnerability and exposure to marine emergencies. A
simulation gaming exercise is used by the UN/ISDR for public educational purposes. The Stop
Disaster simulation game enables players to construct more resilient communities given a
budget and the community is tested against extreme weather forces. Simulation is an
important tool for responder training due to the risk free environment it provides. The ADMS

54
simulation program developed by the Environmental Tectonics Corporation uses 3D-CAD
models to place responders in realistic situations training.
In smaller communities, a large scale customized high-tech simulation program is not
allows a viable option. For this reason, table top mock-up exercises are often used for
responders to discuss and validate response plans given a mock scenario. Emergency
Management Ontario has published documents instructing communities on how to create
these training exercises. FEMA has table top exercise packages that can be presented at the
community level that includes mock videos to present the scenarios. Of the C-Change
community provinces, PEI has an exercise attached to their Emergency Management guide that
should evoke discussion during training.
The need to be prepared for a changing climate is evident internationally and many
efforts have been made by all levels of government to address such issues. The Canadian
Government’s Emergency Management and Emergency Preparedness Act were established to
strengthen emergency preparedness and management in Canada. The Canadian coastal
community of Charlottetown and Isle Madame will be used as case studies for this research.

55
3 Methodology
This study aims at answering what it means for coastal communities to be prepared for
severe storms and what prescriptions are required to improve preparedness. In an effort to
answer these questions, a methodology is proposed in this chapter to define storm surge
preparedness in coastal communities and to evaluate its effectiveness. Several pre-existing
tools and literature findings will be integrated with a proposed simulation mock-up exercise to
evaluate storm preparedness.
Initially the components of preparedness specific to coastal communities will be defined.
Defining is followed by creating a preparedness taxonomy table to systematically classify the
characteristics of preparedness and develop a comprehensive list of indicators relevant to
coastal communities. The response process and dynamics is presented in Section 3.3 followed
by methods for selecting best decisions in Section 3.4. The simulation process is presented in
Section 3.5 followed by the methodology for creating a mock-up exercise in 3.6.
3.1 Defining the Components of Preparedness
From the literature reviewed, there exist many different approaches to defining
preparedness. Within the context of this study, preparedness for storm surges in coastal
communities will be examined.
Organizations from different levels of governance have attempted to define
preparedness. They range from the global, as seen in the Hyogo Framework for Action, down to
the municipal/community level as seen in the Municipal Emergency Management Guide of
Prince Edward Island. The definition of preparedness was also shown from an all-hazard
approach for most of these organizations. Before redefining specific to storm surges and coastal
communities, one must integrate these components.
Preparedness is often defined by indicators, a quantitative or qualitative identifier to
monitor the state of a process. As seen from before, organizations have attempted to develop a
baseline count of the resources required to be prepared. This method produces a tangible
inventory list of the equipment and supplies required in the time of a disaster. Examples of

56
quantifiable resources are the number of fire trucks, police officers, water level monitoring
sites, and shelters. The other perspective that is often seen in defining preparedness is to
develop a response plan. These are often described as guidelines, frameworks, plans or
protocols for response.
Without actually deploying the system, one can say that given the correct tools
(resources) and the instructions (response plans) one can be prepared for an emergency
situation. This study aims to take it one step further and assess the decision making and the
reliability of the system. Once an emergency event occurs, decision-makers are tasked with
deciding on how to respond and how to apply the resources and response plan. Questions arise
in how decision-makers deal with the situation, the stress involved and the time constraints. In
the case of an emergency, numerous events may occur at the same time and deplete the
supplies and use the available equipment. A state of panic or inexperience may cause the
responders to improvise and deviate from the plan. The plan may also ask for decision making
and this becomes a crucial part of the outcome. At what point should the community at risk
declare a state of emergency, is a prime example of decision making. For the reasons
mentioned a third component of preparedness lies in how the decision-makers deploy the
resources and plans.
Another factor that can only be examined once the system is in practice is the reliability
of the system and how effective it really is. This component of preparedness is often examined
in hindsight of the disaster. Events can arise during the response operation that interrupts the
process. Examples of these events are seen in ambulances breaking down after flood water gets
into the engine, a road leading to a vulnerable site collapses or gets blocked, communication
system gets disrupted. These are all events that can occur given optimal resources, plans and
decision making. For this reason, system reliability is seen as a fourth component of
preparedness.
Figure 3-1 shows the four components of preparedness as identified from reviewing
literature. In order to be prepared for emergency situations, communities must be efficient in
all 4 aspects of preparedness.
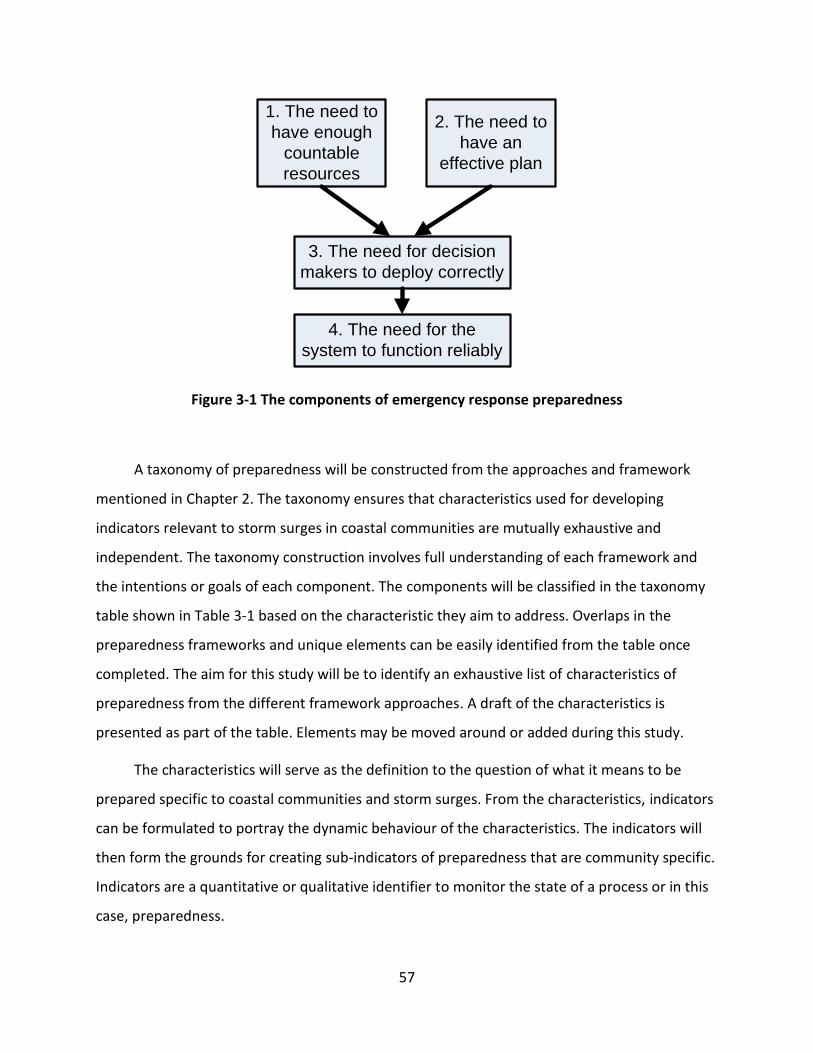
57
1. The need to
have enough
countable
resources
2. The need to
have an
effective plan
3. The need for decision
makers to deploy correctly
4. The need for the
system to function reliably
Figure 3-1 The components of emergency response preparedness
A taxonomy of preparedness will be constructed from the approaches and framework
mentioned in Chapter 2. The taxonomy ensures that characteristics used for developing
indicators relevant to storm surges in coastal communities are mutually exhaustive and
independent. The taxonomy construction involves full understanding of each framework and
the intentions or goals of each component. The components will be classified in the taxonomy
table shown in Table 3-1 based on the characteristic they aim to address. Overlaps in the
preparedness frameworks and unique elements can be easily identified from the table once
completed. The aim for this study will be to identify an exhaustive list of characteristics of
preparedness from the different framework approaches. A draft of the characteristics is
presented as part of the table. Elements may be moved around or added during this study.
The characteristics will serve as the definition to the question of what it means to be
prepared specific to coastal communities and storm surges. From the characteristics, indicators
can be formulated to portray the dynamic behaviour of the characteristics. The indicators will
then form the grounds for creating sub-indicators of preparedness that are community specific.
Indicators are a quantitative or qualitative identifier to monitor the state of a process or in this
case, preparedness.

58
Table 3-1 Classification of preparedness characteristics
Characteristics of Preparedness
Approaches Resources Action Plan Deployment Logistics
Infrastructure Governance Leadership
Monitoring Training Testing
Maintenance
Engagement Participation
Education
Communication Collaboration
Social Services
NWS – StormReady
Formal hazardous weather
operations plan
Visits and consultations
with NWS
Hydrometeorological Monitoring
Training for spotters
and dispatchers
Weather safety talks
Communication
Advanced warning system
EOC
FEMA – TCL Critical Resource
Logistics and Distribution
Medical Supplies
Management and
Distribution
Planning Risk Management
On-Site Incident
Management
Emergency Operations
Center Management
Citizen
Evacuation and Shelter-
in-Place
Information Gathering and Recognition of Indicators and
Warning
Community Preparedness
and Participation
Volunteer
Management and
Donations
Communication Intelligence and
information sharing
Emergency
Public Information and
Warning
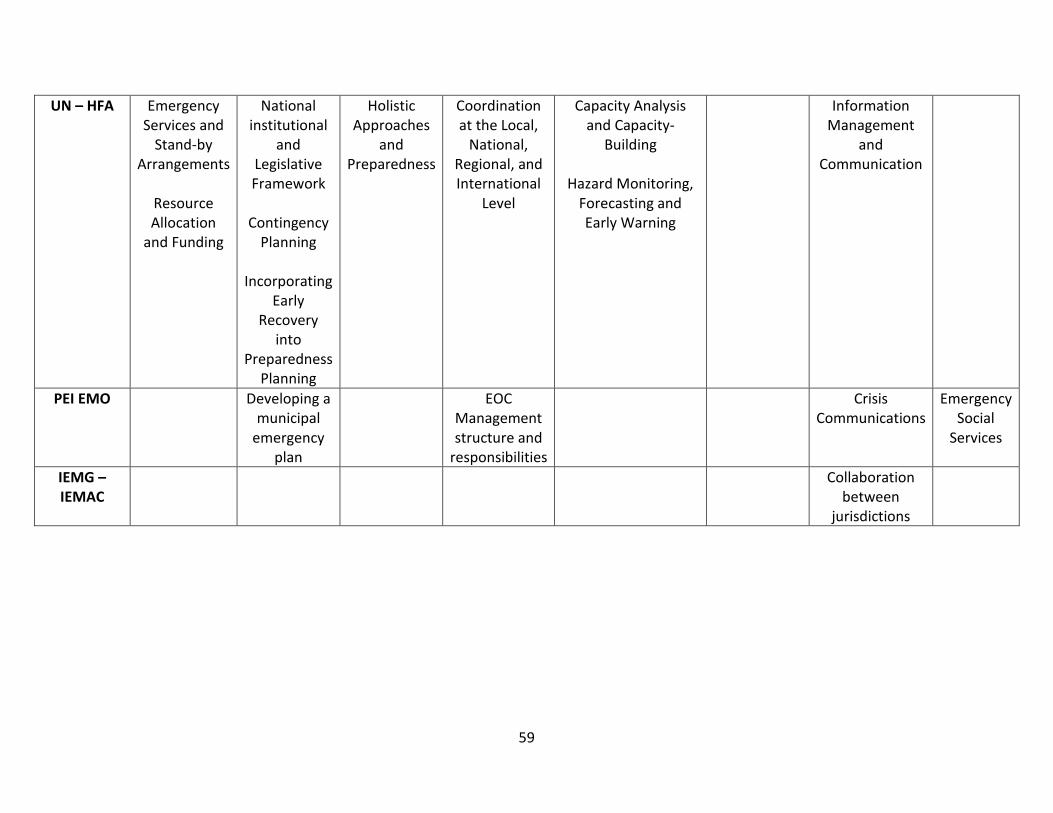
59
UN – HFA Emergency Services and
Stand-by Arrangements
Resource Allocation
and Funding
National institutional
and Legislative Framework
Contingency
Planning
Incorporating Early
Recovery into
Preparedness Planning
Holistic Approaches
and Preparedness
Coordination at the Local,
National, Regional, and International
Level
Capacity Analysis and Capacity-
Building
Hazard Monitoring, Forecasting and Early Warning
Information Management
and Communication
PEI EMO Developing a municipal
emergency plan
EOC Management structure and
responsibilities
Crisis Communications
Emergency Social
Services
IEMG – IEMAC
Collaboration between
jurisdictions

60
3.2 Indicators of Preparedness Specific to Coastal Communities
Given the plethora of descriptions of what it means to be prepared for an all-hazard
event, one can be selective and reclassify the descriptions based on their characteristics. As
part of the process to determine what it means to be prepared for coastal communities, a
collectively exhaustive set of characteristics can be formulated from the literature frameworks.
Each characteristic will carry with it a set of indicators that enables gauge the state of
preparedness. Figure 3-2 shows the hierarchical diagram of preparedness, starting from the
characteristics mentioned in Section 3.1 followed by the indicators at the next level down. From
the indicators one can formulate sub-indicators of preparedness that are community specific.
Preparedness
Infrastructure
Governance
Leadership
Monitoring
Training
Testing
Maintenance
Deployment
Logistics
Engagement
Participation
Education
Action Plans
Communication
Collaboration
Resources
Social
Services
A system to
inventory
public
resources
Indicator “n”
Budget allocated
for preparedness
initiatives and
disaster
management
planning
The community of
Isle Madame
requires a budget of
$20 000 annually
Sub-indicator
“n”
Figure 3-2 Sample structure of a preparedness taxonomy.
When designing indicators several factors must be taken into account to insure that they
are effective in the long run. These factors are the attributes of the indicators and they include
(O'Leary, 2004; UN/ISDR and UN/OCHA, 2008):

61
Clarity: Ambiguity in defining indicators can result in varied and undesired outcomes.
Cost-effectiveness: Indicators must be realistic in terms of cost and their outcome
can justify their investment.
Comparability/Measurability: Indicators should be designed with the ability for
comparison over time. The measurability allows for easy identification of progress
and improvement.
Relevance: Realistic and sensitive to the system in which the indicators are intended
to signify.
Reliability: The indicator must be reliable to provide a basis for confident decision
making.
Practicality: The information required for the indicator can be obtained in a
reasonable amount of time and at a reasonable cost.
Validity: The indicator must be effective in measuring its target
Before Storm
Event
During Storm
Event
After Storm
Event
Figure 3-3 Time component of preparedness indicators
The indicators will have a time component attached to it them is relative to the storm
event as shown in Figure 3-3. Indicators can describe processes occurring before a storm in
preparation, during a storm in response or after in the recovery phase. For example, evacuation
and shelter capacities are before storm indicators. Emergency response time is a during storm
event indicator while water quality may be an after storm indicator.
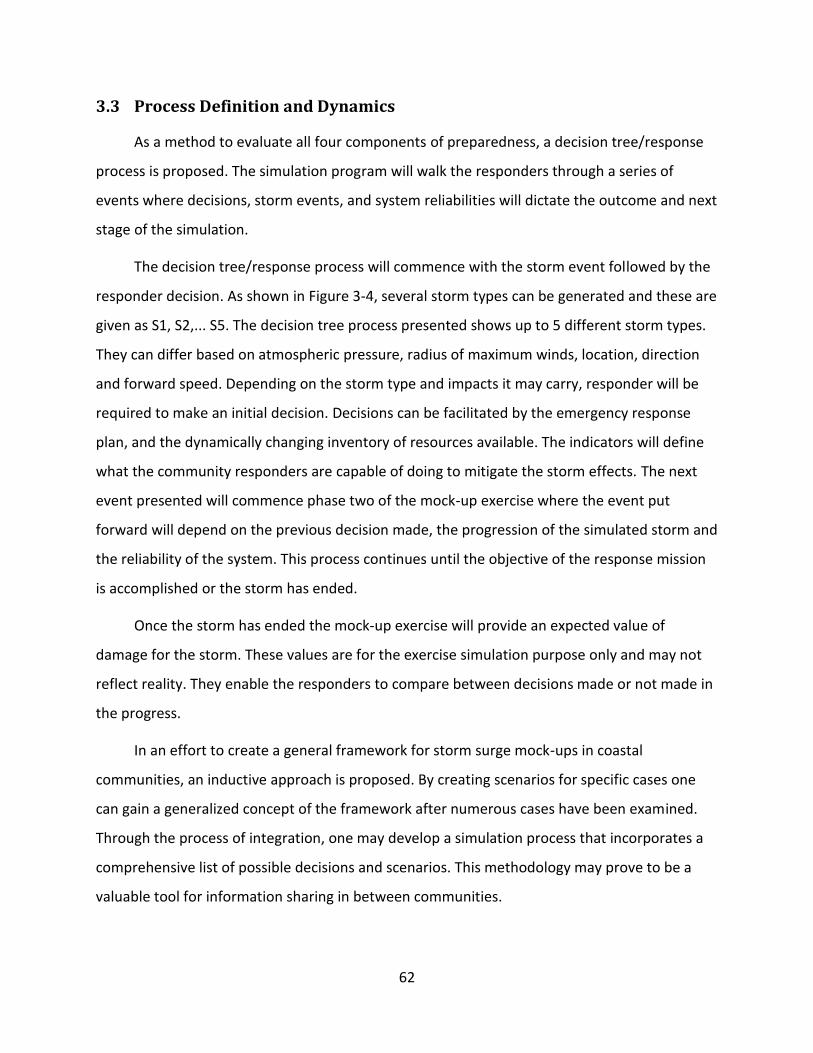
62
3.3 Process Definition and Dynamics
As a method to evaluate all four components of preparedness, a decision tree/response
process is proposed. The simulation program will walk the responders through a series of
events where decisions, storm events, and system reliabilities will dictate the outcome and next
stage of the simulation.
The decision tree/response process will commence with the storm event followed by the
responder decision. As shown in Figure 3-4, several storm types can be generated and these are
given as S1, S2,... S5. The decision tree process presented shows up to 5 different storm types.
They can differ based on atmospheric pressure, radius of maximum winds, location, direction
and forward speed. Depending on the storm type and impacts it may carry, responder will be
required to make an initial decision. Decisions can be facilitated by the emergency response
plan, and the dynamically changing inventory of resources available. The indicators will define
what the community responders are capable of doing to mitigate the storm effects. The next
event presented will commence phase two of the mock-up exercise where the event put
forward will depend on the previous decision made, the progression of the simulated storm and
the reliability of the system. This process continues until the objective of the response mission
is accomplished or the storm has ended.
Once the storm has ended the mock-up exercise will provide an expected value of
damage for the storm. These values are for the exercise simulation purpose only and may not
reflect reality. They enable the responders to compare between decisions made or not made in
the progress.
In an effort to create a general framework for storm surge mock-ups in coastal
communities, an inductive approach is proposed. By creating scenarios for specific cases one
can gain a generalized concept of the framework after numerous cases have been examined.
Through the process of integration, one may develop a simulation process that incorporates a
comprehensive list of possible decisions and scenarios. This methodology may prove to be a
valuable tool for information sharing in between communities.

63
C1
Is this a storm of concern and should
the public be notified?
C3C2
S3
Category 1
Hurricane
S4
S5
S2
S1T
ime
- P
resto
rm
YES NO
Should
auxiliary
power be
provided?
C5C4
YES NO
Call for aid
from other
jurisdictions
C9C8
YES NO
High winds
Power outages
Surge height of concern
Storm intensity increases
Public caught off guard
Many trapped
Storm dies down
Changes direction
Storm not as
severe as forecasted
Send in a
rescue team
to evacuate
those
affected?
C11C10
YES NO
Driving becomes hazardous
Roads are washed out
Community trapped
P3
Rescue
equipment
breakdown
P8 P10P9
Call off
advisory?
C7C6
YES NOTim
e -
La
nd
fall
Tim
e -
Re
co
ve
ry
P1P2
P4P5 P6 P7
Expected
outcome
Expected
outcome
Figure 3-4 Sample decision tree for the storm mock-up simulation

64
3.4 Determinant of Best Decisions
The responders at the table top simulation exercise must work together and navigate
through the storm surge simulation by selecting the appropriate branch of the decision tree.
Decision making in the time of an emergency can be stressful due to inexperience and time
constraints. This exercise allows responders to thoroughly review their decision criteria and test
it against a simulated program.
A single best decision route can be charted based on the expected values at the end of
the mock-up. However, the best decision route cannot always be selected due to the inherent
probabilistic nature of the elements involved. The storm type, reliability probabilities, and
dynamically changing resources will force the responders to be creative in navigating the
decision tree. This exercise will spur discussion and allow responders to discuss decisions at
each stage. For that reason, best decisions are situation dependent and after running the mock-
up several times a “best decision” given a situation approach can be recorded. Gaps in
emergency response plans can be identified through a tabletop discussion and guidance on
situational decision making can be added to the plan.
3.5 Process Simulation
The mock-up exercise will be constructed using Rockwell Arena Simulation software.
Arena is a discrete event simulation and automation software developed by Rockwell
automation (Kelton, Sadowski, & Swets, 2010). The parameters of the simulation model are
shown in Figure 3-5. The initial state of the countable resources and response plans will be the
tools that responders have to work with. The spatial inputs will come in the form of the
community architecture and the layout of the location. For example the number of roads
leading into area requiring assistance is a spatial input. The model outcome will be dependent
of human decisions by responders involved, the SLOSH storm simulation and the reliability of
certain processes. The reliability probability values will be generated by the mock-up simulation
designer based on a risk analysis of the response process.
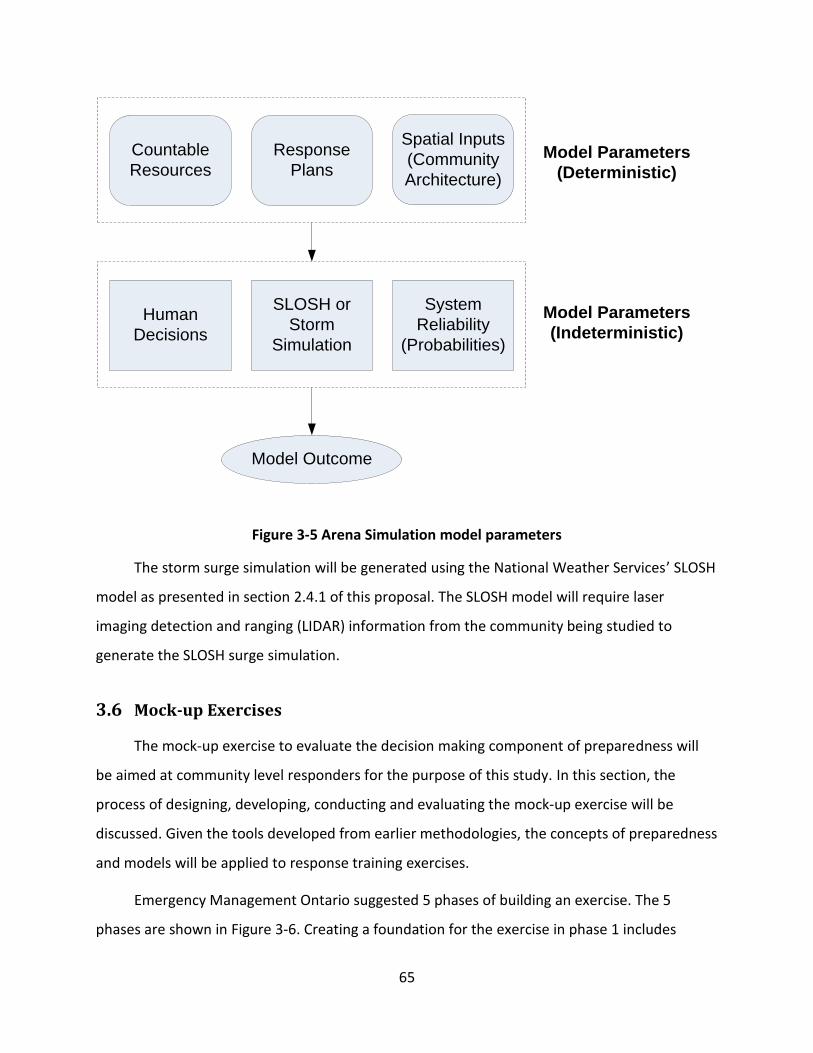
65
Countable
Resources
Response
Plans
Spatial Inputs
(Community
Architecture)
Human
Decisions
SLOSH or
Storm
Simulation
System
Reliability
(Probabilities)
Model Outcome
Model Parameters
(Deterministic)
Model Parameters
(Indeterministic)
Figure 3-5 Arena Simulation model parameters
The storm surge simulation will be generated using the National Weather Services’ SLOSH
model as presented in section 2.4.1 of this proposal. The SLOSH model will require laser
imaging detection and ranging (LIDAR) information from the community being studied to
generate the SLOSH surge simulation.
3.6 Mock-up Exercises
The mock-up exercise to evaluate the decision making component of preparedness will
be aimed at community level responders for the purpose of this study. In this section, the
process of designing, developing, conducting and evaluating the mock-up exercise will be
discussed. Given the tools developed from earlier methodologies, the concepts of preparedness
and models will be applied to response training exercises.
Emergency Management Ontario suggested 5 phases of building an exercise. The 5
phases are shown in Figure 3-6. Creating a foundation for the exercise in phase 1 includes

66
identifying a planning team, scheduling meetings with the community to be studied,
establishing project timelines and determining the availability of resources to design and
implement the exercise. At this stage it is important to establish needs and requirements of the
user (Emergency Management Ontario, 2010).
Figure 3-6 The phases of a mock-up exercise program management
In the second phase, design and development, objectives are identified and scenarios are
developed. Exercise objectives should define the specific goals of the community, provide a
framework for scenario development and provide evaluation methods. Objectives should be
limited to enable the design of a reasonable scenario. A multiple hazard approach would not
cover the details required for a thoroughly conducted exercise. The inductive approach to
mock-up designs should be noted here. A scenario is selected to provide the backdrop to the
exercise, however the scenario should not be so challenging that it overwhelms the exercise
participants. Scenarios should be hazard specific, realistic, plausible and challenging. Appendix
B provides a questionnaire/checklist to develop scenarios as conducted by Emergency
Management Ontario (Emergency Management Ontario, 2010).
1 Foundation
2 Design and
Develpoment
3 Conduct
4 Evaluation
5 Improvement
Planning
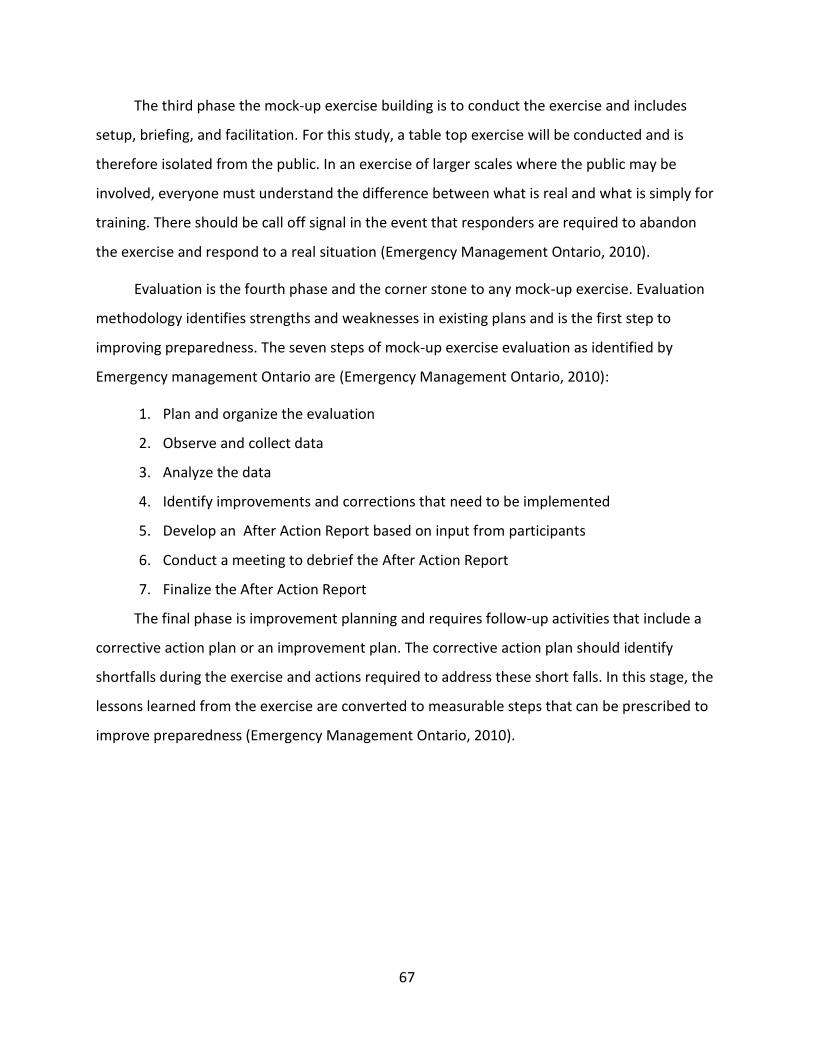
67
The third phase the mock-up exercise building is to conduct the exercise and includes
setup, briefing, and facilitation. For this study, a table top exercise will be conducted and is
therefore isolated from the public. In an exercise of larger scales where the public may be
involved, everyone must understand the difference between what is real and what is simply for
training. There should be call off signal in the event that responders are required to abandon
the exercise and respond to a real situation (Emergency Management Ontario, 2010).
Evaluation is the fourth phase and the corner stone to any mock-up exercise. Evaluation
methodology identifies strengths and weaknesses in existing plans and is the first step to
improving preparedness. The seven steps of mock-up exercise evaluation as identified by
Emergency management Ontario are (Emergency Management Ontario, 2010):
1. Plan and organize the evaluation
2. Observe and collect data
3. Analyze the data
4. Identify improvements and corrections that need to be implemented
5. Develop an After Action Report based on input from participants
6. Conduct a meeting to debrief the After Action Report
7. Finalize the After Action Report
The final phase is improvement planning and requires follow-up activities that include a
corrective action plan or an improvement plan. The corrective action plan should identify
shortfalls during the exercise and actions required to address these short falls. In this stage, the
lessons learned from the exercise are converted to measurable steps that can be prescribed to
improve preparedness (Emergency Management Ontario, 2010).

68
4 Expected Results and Analysis
In this section the expected results and analysis for this study will be discussed. The
objective of this study is to develop a framework for coastal communities to assess their level of
preparedness in the event of a storm surge. The expected results will be presented in the form
of: (1) a comprehensive definition of what it means to be prepared for storm surges using
indicators and (2) a framework for constructing tabletop storm mock-up exercises.
The comprehensive definition of what it means to be prepared will be presented with
sub-indicators that are relevant to the specific community of study. The framework for
constructing tabletop storm mock-ups will be applied to the communities of Charlottetown and
Isle Madame. Therefore one can expect to analyze the different scenarios and develop
response reliability values to populate the proposed mock-up.
Figure 4-1 Map of Petite Anse Community on Isle Madame. Source: Google Maps (2013)

69
As an example, the mock-up exercise can be applied to the case of a causeway in the
community of Petite-Anse on Isle Madame. The causeway highlighted by the red oval in Figure
4-1 proves to be a vulnerable area during storm surges. Surge waves coming in often washes
out the road leaving those living to the south of the causeway trapped.

70
5 Expected Outcomes and Recommendations
In this section the expected outcomes and recommendations following this study will be
presented. Specific to the two coastal communities involved in this project, Charlottetown and
Isle Madame, case studies will be conducted and the definitions and mock-up frameworks will
be applied to both these communities.
In an attempt to measure and evaluate emergency preparedness for storm surges, the
community of Charlottetown can expect the following outcomes and recommendations from
this proposed study.
1. A clear definition of what it means for Charlottetown to be prepared for sea level rise
and storm surges using indicators of preparedness
2. An evaluation of the Charlottetown's current emergency response plan with the
concept of decisions and systems reliability factored in
3. The construction of a SLOSH basin using LIDAR data for surge height simulation and
prediction
4. A series of tabletop mock-up exercises with scenarios specific to Charlottetown and
the threats it faces using the generated SLOSH storms to measure
The community of Isle Madame can expect the following outcomes and
recommendations from this proposed study.
1. A clear definition of what it means for Isle Madame to be prepared for sea level rise
and storm surges using indicators of preparedness
2. An evaluation of the Isle Madame's current emergency response plan with the
concept of decisions and systems reliability factored in
3. A series of tabletop mock-up exercises with scenarios specific to Isle Madame
conducted
4. An “After Action Report” to follow up on the mock-up exercises identifying gaps in
emergency response plans that can be improve upon
There is LIDAR data available for Charlottetown and therefore a SLOSH basin can be
created for simulation purposes. The tabletop mock-up exercise will be conducted for the

71
community of Isle Madame and therefore an “After Action Report” can be developed for Isle
Madame.

72
6 Timeline of Proposed Study
A timeline of the proposed study is shown in Table 6-1. The proposal, set to be completed
by April 2013, will focus on framing the research questions and reviewing literature in the
relevant field of research. The preparedness taxonomy will be created in May 2013 to identify
characteristics and indicators of preparedness. Following the process of identifying all aspects
of preparedness, a conceptual model can be developed for the storm surge mock-up starting in
June of 2013. The construction of the Charlottetown SLOSH basin will commence in the
summer of 2013 as well. The simulation modelling process will start in July 2013 and will phase
into the implementation process in October 2013. Analysis and recommendation development
will be conducted in late 2013. The dates mentioned are simply projections and may change
depending on the nature of activities along the way.
Table 6-1 Timeline of proposed study
2012 2013
Sep
-Dec
Jan
-Ap
r
May
Jun
Jul
Au
g
Sep
Oct
No
v
Dec
Proposal development
Preparedness guidelines integration and taxonomy
Storm surge mock-up conceptual model
SLOSH model development
Storm surge mock-up simulation model
Model implementation
Analysis and recommendation

73
Bibliography
Adger, W. N. (1999). Social Vulnerability to Climate Change and Extremes in Coastal Vietnam.
World Development, 27(2), 249-269.
Adger, W. N. (2003). Social Capital, Collective Action, and Adaptation to Climate Change.
Economic Geography, 79(4), 387-404.
Adger, W. N. (2006). Vulnerability. Global Environmental Change, 16, 268-281.
Adger, W. N., Arnell, N. W., & Tompkins, E. L. (2005). Successful Adaptation to Climate Change
Across Scales. Global Environmental Change, 15, 77-86.
BC Stats. (2013). Population Estimates. Retrieved March 2, 2013, from Province of British
Columbia Stats:
http://www.bcstats.gov.bc.ca/StatisticsBySubject/Demography/PopulationEstimates.as
px
Bierbaum, R., Lee, A., Smith, J., Blair, M., Carter, L., Chapin III, S., et al. (2013). US Global Change
Research Program - Climate Assessment Report. Draft, National Climate Assessment
Development Advisory Committee.
Bosello, F., Roson, R., & Tol, R. S. (2007). Economy-wide Estimates of the Implications of Climate
Change: Sea Level Rise. Environmental and Resource Economics, 37(3), 549-571.
Campbell, N. A., Reece, J. B., Urry, L. A., Cain, M. L., Wasserman, S. A., Minorsky, P. V., et al.
(2008). Biology (8th Edition ed.). San Francisco: Pearson Education Inc.
C-Change. (2010). C-Change Project Overview. Retrieved February 3, 2013, from C-Change -
Canada and the Caribbean Coastal Climate Adaptation Strategies:
http://www.coastalchange.ca/index.php/the-project/description
C-Change. (2011a). Charlottetown, Prince Edward Island. Retrieved April 4, 2013, from C-
Change: http://www.coastalchange.ca/index.php/communities/canada-community-
profiles/charlottetown-prince-edward-island
C-Change. (2011b). Isle Madame, Nova Scotia. Retrieved April 4, 2013, from C-Change:
http://www.coastalchange.ca/index.php/communities/canada-community-profiles/isle-
madame-ns
74
Cutter, S. L., Barnes, L., Berry, M., Burton, C., Evans, E., Tate, E., et al. (2008). A Place-based
Model for Understanding Community Resilience to Natural Disasters. Global
Environmental Change, 18, 598-606.
Drabek, T. E. (2005). Predicting Disaster Response Effectiveness. International Journal of Mass
Emergencies and Disasters, 23(1), 49-72.
EMBC. (2012a). The All-Hazard Plan. Retrieved March 2, 2013, from Emergency Management
British Columbia: http://embc.gov.bc.ca/em/hazard_plans/All-Hazard_Plan.pdf
EMBC. (2012b). The British Columbia Flood Reponse Plan. Retrieved March 2, 2013, from
Emergency Management British Columbia: http://embc.gov.bc.ca/em/hazard_plans/BC-
Flood_Response_Plan_2012.pdf
Emergency Management Ontario. (2010). Guidelines for the Development of an Exercise
Program. Retrieved March 16, 2013, from Emergency Management Ontario:
http://www.emergencymanagementontario.ca/english/emcommunity/program_resour
ces/exercise/exercise_guidelines_main.html
Environment Canada. (2004). The Top Ten Canadian Weather Stories For 2004. Retrieved March
16, 2013, from Environment Canada: http://www.ec.gc.ca/meteo-
weather/default.asp?lang=En&n=9CA2BD37-1
Environment Canada. (2012). Canadian Tropical Cyclone Season Summaries. Retrieved March
31, 2013, from Environment Canada: http://www.ec.gc.ca/ouragans-
hurricanes/default.asp?lang=en&n=23B1454D-1
Environment Canada. (n.d.). GEM The Global Environmental Multiscale Model. Retrieved March
31, 2013, from Environment Canada Canadian Meteorological Centre:
http://collaboration.cmc.ec.gc.ca/science/rpn/gef_html_public/index.html
Environmental Tectonics Corporation. (2012). ADMS Simulation Training Systems. Retrieved
October 21, 2012, from http://www.trainingfordisastermanagement.com/
Etkin, D., Medalye, J., & Higuchi, K. (2012). Climate Warming and Natural Disaster Management:
An Exploration of the Issues. Climatic Change, 112, 585-599.

75
FEMA. (2007a). National Preparedness Guidelines. Retrieved March 2, 2013, from Federal
Emergency Management Agency:
http://www.fema.gov/pdf/emergency/nrf/National_Preparedness_Guidelines.pdf
FEMA. (2007b). Target Capabilities List: A Companion to the National Preparedness Guidelines.
Retrieved January 15, 2013, from Federal Emergency Management Agency:
http://www.fema.gov/pdf/government/training/tcl.pdf
FEMA. (2007c). Universal Task List Version 2.1. Retrieved February 4, 2013, from Federal
Emergency Management Agency:
https://www.rkb.us/contentdetail.cfm?content_id=185590
FEMA. (2012). FEMA Incident Action Planning Guide. Retrieved March 15, 2013, from United
States Coast Guard:
http://www.uscg.mil/hq/cg5/cg534/nsarc/FEMA%20Incident%20Action%20Planning%2
0Guide%20(IAP).pdf
FEMA Private Sector Division. (2010). Emergency Planning Exercises. Retrieved March 1, 2013,
from http://www.fema.gov/emergency-planning-exercises
Flannery, T. (2005). The Weather Makers: How we are changing the climate and what it means
for life on earth. Toronto: Harper Collins.
Gillespie, D. F., & Streeter, C. L. (1987). Conceptualizing and Measuring Disaster Preparedness.
International Journal of Mass Emergencies and Disasters, 5(2), 155-176.
Glahn, B., Taylor, A., Kurkowski, N., & Shaffer, W. A. (2009, August). The Role of the SLOSH
Model in National Weather Service Storm Surge Forecasting. National Weather Digest,
33(1).
Government of British Columbia. (2013). Emergency Program Act. Retrieved from BC Laws:
http://www.bclaws.ca/EPLibraries/bclaws_new/document/ID/freeside/00_96111_01
Government of Canada. (2007). Emergency Management Act. Retrieved March 18, 2013, from
Justice Laws Website: http://laws-lois.justice.gc.ca/PDF/E-4.56.pdf
Government of Canada. (2007). Emergency Preparedness Act. Retrieved March 18, 2013, from
Justice Laws Website: http://laws-lois.justice.gc.ca/PDF/E-4.6.pdf

76
Government of Canada. (2008). Emergency Preparedness in Canada. Government of Canada,
Standing Senate Committee on National Security and Defence. Volume 1. Second
Session, 39th Parliament.
Government of Canada. (2011). Federal Emergency Response Plan. Retrieved March 31, 2013,
from Public Saftey Canada: http://www.publicsafety.gc.ca/prg/em/ferp-eng.aspx
Government of Nova Scotia. (2012). Nova Scotia Community Counts. Retrieved March 12, 2013,
from Government of Nova Scotia:
http://www.gov.ns.ca/finance/communitycounts/profiles/community/default.asp?gne
w=&table=&acctype=0&chartid=&mapid=&dcol=&sub=&ptype=geo&tid=&gview=7&gle
vel=wsp&gnum=wsp46&gnum2=wsp46&yearid=2011
Government of Nunavut. (2010). Nunavut Emergency Management. Retrieved March 2, 2013,
from Nunavut Community and Government Srvices:
http://cgs.gov.nu.ca/en/commEmergency.aspx
GPC Public Affairs. (2005). Are Canadians Prepared for an Emergency? : An Analysis of
Canadians' Preparedness for Emergency Situations and Attitudes Toward Preparing for
Them : Final Report to Public Safety and Emergency Preparedness Canada. Public Safety
Canada. Ottawa: Public Safety and Emergency Preparedness Canada.
Hartt, M. D. (2011). Geographic Information Systems and System Dynamics - Modelling the
Impacts of Storm Damage on Coastal Communities. M.Sc. Thesis, University of Ottawa,
Faculty of Graduate and Postdoctoral Studies.
Holling, C. S., Gunderson, L. H., & Ludwig, D. (2002). In Quest of a Theory of Adaptive Change. In
L. H. Gunderson, & C. S. Holling (Eds.), Panarchy Understanding Transformations in
Human and Natural Systems (pp. 3-22). Washington D.C.: Island Press.
IEMG. (2009). IEMAC Operations Manual. Retrieved March 8, 2013, from International
Emergency Management Group: http://www.iemg-gigu-web.org/PDF/GOM-e.pdf
IFRC. (2008). The Red Cross Red Crescent and the Hyogo Framework for Action: Focus on the
Asia-Pacific region. Retrieved February 5, 2013, from International Federation of Red
Cross and Red Crescent Societies:

77
http://www.ifrc.org/Global/Case%20studies/Disasters/cs-hyogo-framework-asia-pacific-
en.pdf
IPCC. (2007a). Climate Change 2007 - The Physical Science Basis. Intergovernmental Panel on
Climate Change. Cambridge: University Press.
IPCC. (2007b). Climate Change 2007 - Impacts, Adaptation, and Vulnerability.
Intergovernmental Panel on Climate Change. Cambridge: University Press.
IPCC. (2007c). Climate Change 2007: Synthesis Report. Intergovernmental Panel on Climate
Change. Geneva, Switzerland: IPCC.
IPCC. (2012). Managing the Risks of Extreme Events and Disasters to Advance Climate Change
Adaptation. Intergovernmental Panel on Climate Change. Cambridge: Cambridge
University Press.
Jackson, B. A. (2008). The Problem of Measuring Emergency Preparedness. RAND Corporation
Occasional Paper Series.
Jackson, B. A., Sullivan, K., Willis, H. H., & Goulka, J. (2009). Fault Trees and System Reliability as
Approaches for Measuring Preparedness. RAND Corporation.
Kelton, W. D., Sadowski, R. P., & Swets, N. B. (2010). Simulation with Arena (5th Edition ed.).
New York City: McGraw-Hill.
Kirschenbaum, A. (2002). Disaster Preparedness: A Conceptual and Empirical Reevaluation.
International Journal of Mass Emergencies and Disasters, 20(1), 5-28.
Klein, R. J., Nicholls, R. J., & Thomalla, F. (2003). Resilience to Natural Hazards: How Useful is
This Concept? Environmental Hazards, 5, 35-45.
Lewis, J., & Miller, K. (2010). Climate Change Adaptation Plan for Iqaluit. Retrieved April 4,
2013, from Planning for Climate Change:
http://www.planningforclimatechange.ca/wwwroot/Docs/Library/CommAdptPlans/IQA
LUIT_REPORT_E.
Lomborg, B. (2001). The Skeptical Environmentalist: Measuring the real state of the world.
Cambridge: Cambridge University Press.
McConnell, A., & Drennan, L. (2006). Mission Impossible? Planning and Preparing for Crisis.
Journal of Contingencies and Crisis Management, 14(2), 59-70.

78
MEOPAR. (2012). Marine Environmental Observation Prediction and Response Network.
Retrieved March 15, 2013, from http://meopar.ca/
Mostofi, H. (2011). Multicriteria Decision Evaluation of Adaptation Strategies for Vulnerable
Coastal Communities. M.Sc. Thesis, University of Ottawa, Faculty of Graduate and
Postdoctoral Studies.
Nadimi, I. (2012). Coastal Community-based Protocols and Guidelines for Adaptation Planning.
M.Sc. Thesis, University of Ottawa, Faculty of Graduate and Postdoctoral Studies.
Nelson, D. R., Adger, W. N., & Brown, K. (2007). Adaptation to Environmental Change:
Contributions of a Resilience Framework. Annual Review of Environment and Resources,
32, 395-419.
NOAA. (2003). SLOSH Display Training. Retrieved December 18, 2012, from National Weather
Service SLOSH: http://slosh.nws.noaa.gov/sloshPub/SLOSH-Display-Training.pdf
NOAA. (2004). StormReady / TsunamiReady - Organization and Operations Manual. Retrieved
January 28, 2013, from National Weather Services - StormReady:
http://www.stormready.noaa.gov/resources/OpsManual2005.pdf
NOAA. (2010). Dickinson County, IA, StormReady Status Credited with Minimizing Disaster.
Retrieved March 15, 2013, from National Weather Service - StormReady:
http://www.stormready.noaa.gov/success-iowa.htm
NOAA. (2011). Sea, Lake, and Overland Surges from Hurricanes (SLOSH). Retrieved March 31,
2013, from National Weather Service:
http://www.nhc.noaa.gov/ssurge/ssurge_slosh.shtml
NOAA. (2012). Sea Level Rise and Coastal Flooding Impacts. Retrieved April 5, 2013, from
Coastal Services Centre NOAA: http://www.csc.noaa.gov/slr/viewer/#
NOAA. (2013). National Weather Service StormReady. Retrieved January 15, 2013, from
National Oceanic and Atmospheric Administration: http://www.stormready.noaa.gov/
Nova Scotia EMO. (2003). A Report on the Emergency Response to Hurricane Juan. Retrieved
March 11, 2013, from Emergency Management Office Nova Scotia:
http://emo.gov.ns.ca/sites/all/themes/emo/files/report_on_the_emergency_response_
to_hurricane_juan.pdf

79
Nova Scotia EMO. (2004). Public Feedback on the Emergency Response to Hurricane Juan.
Retrieved March 11, 2013, from Emergency Management Office Nova Scotia:
http://emo.gov.ns.ca/sites/all/themes/emo/files/public_feedback_on_the_emergency_
response_to_hurricane_juan.pdf
Nova Scotia EMO. (2012). The Nova Scotia Emergency Response Plan. Retrieved March 11,
2013, from Emergency Management Office Nova Scotia:
http://emo.gov.ns.ca/sites/default/files/pdfs/the_ns_emergency_response_plan_may_
2012.pdf
O'Leary, M. (2004). Measuring Disaster Preparedness: A Practical Guide to Indicator
Development and Application. Lincoln, Nebraska: iUniverse Inc.
Paton, D., & Johnston, D. (2006). Disaster Resilience: An Integrated Approach. Springfield,
Illinois: Charles C. Thomas Publisher Ltd.
Pelling, M., & Uitto, J. I. (2001). Small Island Developing States: Natural Disaster Vulnerability.
Environmental Hazards, 3, 49-62.
Petak, W. J. (1985). Emergency Management: A Challenge for Public Administration. Public
Administration Review, 45, 3-7.
Prince Edward Island EMO. (2010). Municipal Emergency Management Guide. Retrieved March
2, 2013, from Prince Edward Island Office of Public Safety:
http://www.gov.pe.ca/photos/original/EMO_MUN_EMG.pdf
Prince Edward Island EMO. (2012). Municipal Emergency Measures Plan Template. Retrieved
March 2, 2013, from Prince Edward Island Office of Public Safety:
http://www.gov.pe.ca/photos/original/OPS-Munic-Plan.pdf
Richardson, G. R. (2010). Adapting to Climate Change: An Introduction for Canadian
Municipalities. Ottawa: Natural Resources Canada.
Richardson, G., & Otero, J. (2012). Land Use Planning Tools for Local Adaptation to Climate
Change. Government of Canada, Ottawa.
Simpson, D. M. (2008). Disaster Preparedness Measures: A Test Case Development and
Application. Disaster Prevention and Management, 17(5), 645-661.

80
Simpson, D. M., & Katirai, M. (2006). Indicator Issues and Proposed Framework for a Disaster
Preparedness Index (DPi). Retrieved March 31, 2013, from Centre for Hazards research
and Policy Development University of Louisville:
http://hazardcenter.louisville.edu/pdfs/wp0603.pdf
Smit, B., & Wandel, J. (2006). Adaptation, Adaptive Capacity and Vulnerability. Global
Environmental Change, 16, 282-292.
Sutton, J., & Tierney, K. (2006). Disaster Preparedness: Concepts, Guidance, and Research. Fritz
Institute, Sebastopol, California.
UN/ISDR. (2005). Hyogo Framework for Action 2005-2015: Building the Resilience of Nations
and Communities to Disasters. World Conference on Disaster Reduction. Kobe.
UN/ISDR. (2007). Stop Disasters - A disaster simulation game from the UN/ISDR. Retrieved
October 21, 2012, from http://www.stopdisastersgame.org/en/home.html
UN/ISDR and UN/OCHA. (2008). Disaster Preparedness for Effective Response Guidance and
Indicator Package for Implementing Priority. Geneva: United Nations secretariat of the
International Strategy for Disaster Reduction (UN/ISDR) and the United Nations Office
for Coordination of Humanitarian Affairs (UN/OCHA).
Vitousek, P. M. (1994). Beyond Global Warming: Ecology and Global Change. Ecology, 75(7),
1861-1876.
World Bank. (2012). Turn Down the Heat - Why a 4°C Warmer World Must be Avoided. Potsdam
Institute for Climate Impact Research and Climate Analytics, Washington DC.
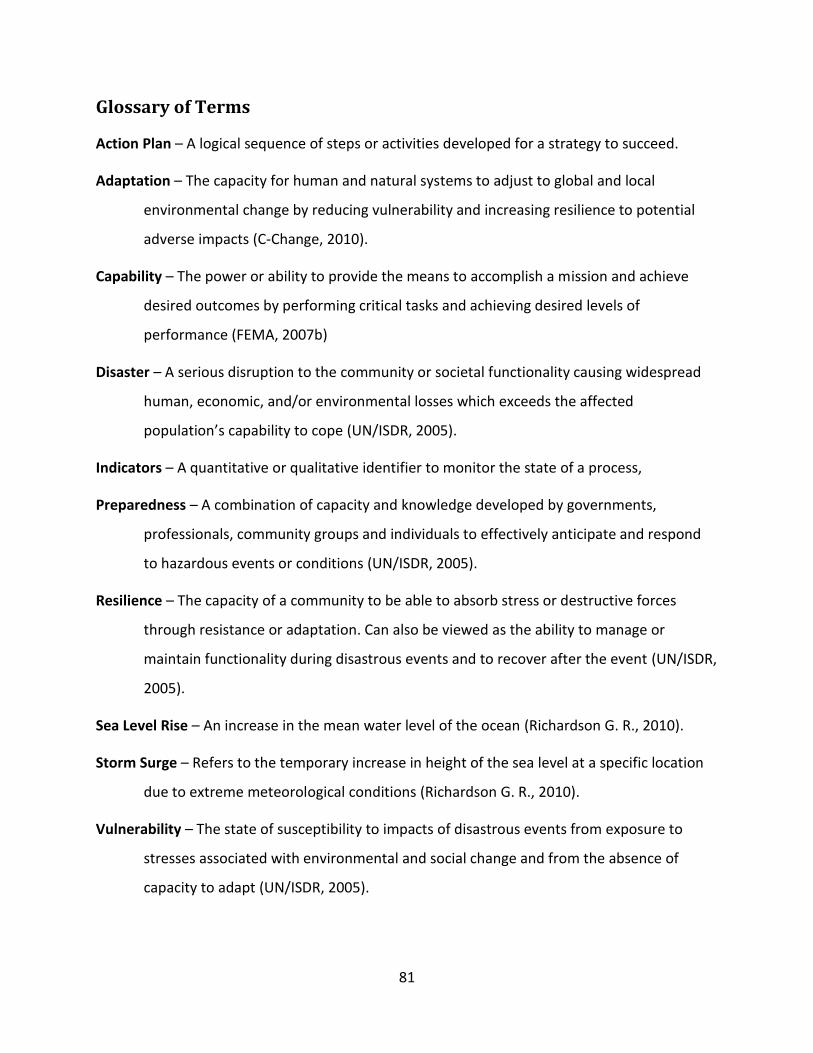
81
Glossary of Terms
Action Plan – A logical sequence of steps or activities developed for a strategy to succeed.
Adaptation – The capacity for human and natural systems to adjust to global and local
environmental change by reducing vulnerability and increasing resilience to potential
adverse impacts (C-Change, 2010).
Capability – The power or ability to provide the means to accomplish a mission and achieve
desired outcomes by performing critical tasks and achieving desired levels of
performance (FEMA, 2007b)
Disaster – A serious disruption to the community or societal functionality causing widespread
human, economic, and/or environmental losses which exceeds the affected
population’s capability to cope (UN/ISDR, 2005).
Indicators – A quantitative or qualitative identifier to monitor the state of a process,
Preparedness – A combination of capacity and knowledge developed by governments,
professionals, community groups and individuals to effectively anticipate and respond
to hazardous events or conditions (UN/ISDR, 2005).
Resilience – The capacity of a community to be able to absorb stress or destructive forces
through resistance or adaptation. Can also be viewed as the ability to manage or
maintain functionality during disastrous events and to recover after the event (UN/ISDR,
2005).
Sea Level Rise – An increase in the mean water level of the ocean (Richardson G. R., 2010).
Storm Surge – Refers to the temporary increase in height of the sea level at a specific location
due to extreme meteorological conditions (Richardson G. R., 2010).
Vulnerability – The state of susceptibility to impacts of disastrous events from exposure to
stresses associated with environmental and social change and from the absence of
capacity to adapt (UN/ISDR, 2005).

82
Appendices
A. P.E.I. Municipal Emergency Management Guide – “Exercise October”
The following is the table top exercise found in the P.E.I. Municipal Emergency
Management Guide. It provides an example of a basic exercise that provides responders with
the opportunity to discuss and evaluate their response efforts. It is important to note the
questions raised between each stage of the exercise for discussion, as this proposed study will
attempt to borrow these concepts.
Weather reports from the past two days indicate that a severe storm is expected to reach
PEI in the early morning of February 24, combined with high winds and freezing rain. Already on
the ground 30 centimetres of snow, will increase operational challenges.
The Municipal Emergency Management Coordinator feels apprehensive about the storm
and suggests a review of the instructions for setting up the MEOC. He / She should also be
prepared to discuss standard operating procedures.
Will all agency representatives be required to participate during the initial
preparations?
How and when will the EOC be activated to cope with the storm?
How will arrangements be made for communications within the EOC?
Several hours pass. Environment Canada issues a warning at 5:30 am on February 24 that
predicts the storm will affect all of PEI. Areas of the province have been experiencing strong
winds and freezing rain; there are increasing reports of damage and power outages. The wind is
from the west at 40 km/h but is predicted to increase to 100 km/h.
How should the public be warned of the storm’s severity? – note the early hour.
What areas are facing significant risks?
What can citizens do to protect themselves from the effects of the storm?
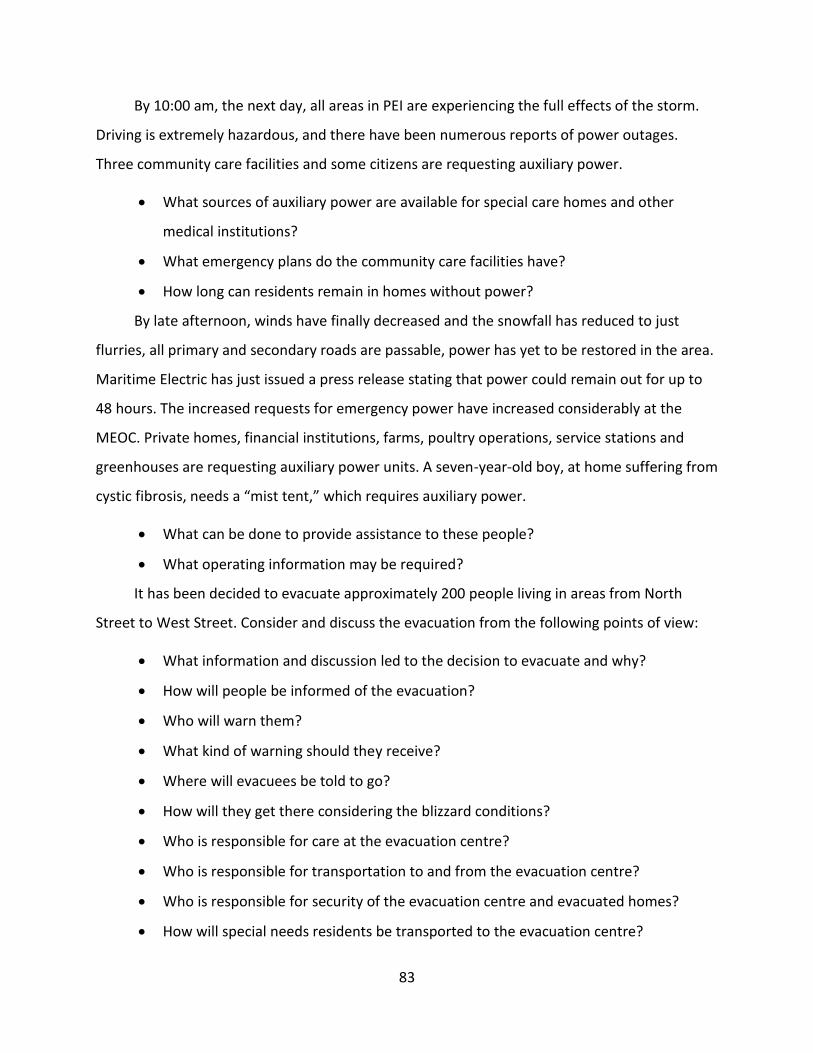
83
By 10:00 am, the next day, all areas in PEI are experiencing the full effects of the storm.
Driving is extremely hazardous, and there have been numerous reports of power outages.
Three community care facilities and some citizens are requesting auxiliary power.
What sources of auxiliary power are available for special care homes and other
medical institutions?
What emergency plans do the community care facilities have?
How long can residents remain in homes without power?
By late afternoon, winds have finally decreased and the snowfall has reduced to just
flurries, all primary and secondary roads are passable, power has yet to be restored in the area.
Maritime Electric has just issued a press release stating that power could remain out for up to
48 hours. The increased requests for emergency power have increased considerably at the
MEOC. Private homes, financial institutions, farms, poultry operations, service stations and
greenhouses are requesting auxiliary power units. A seven-year-old boy, at home suffering from
cystic fibrosis, needs a “mist tent,” which requires auxiliary power.
What can be done to provide assistance to these people?
What operating information may be required?
It has been decided to evacuate approximately 200 people living in areas from North
Street to West Street. Consider and discuss the evacuation from the following points of view:
What information and discussion led to the decision to evacuate and why?
How will people be informed of the evacuation?
Who will warn them?
What kind of warning should they receive?
Where will evacuees be told to go?
How will they get there considering the blizzard conditions?
Who is responsible for care at the evacuation centre?
Who is responsible for transportation to and from the evacuation centre?
Who is responsible for security of the evacuation centre and evacuated homes?
How will special needs residents be transported to the evacuation centre?
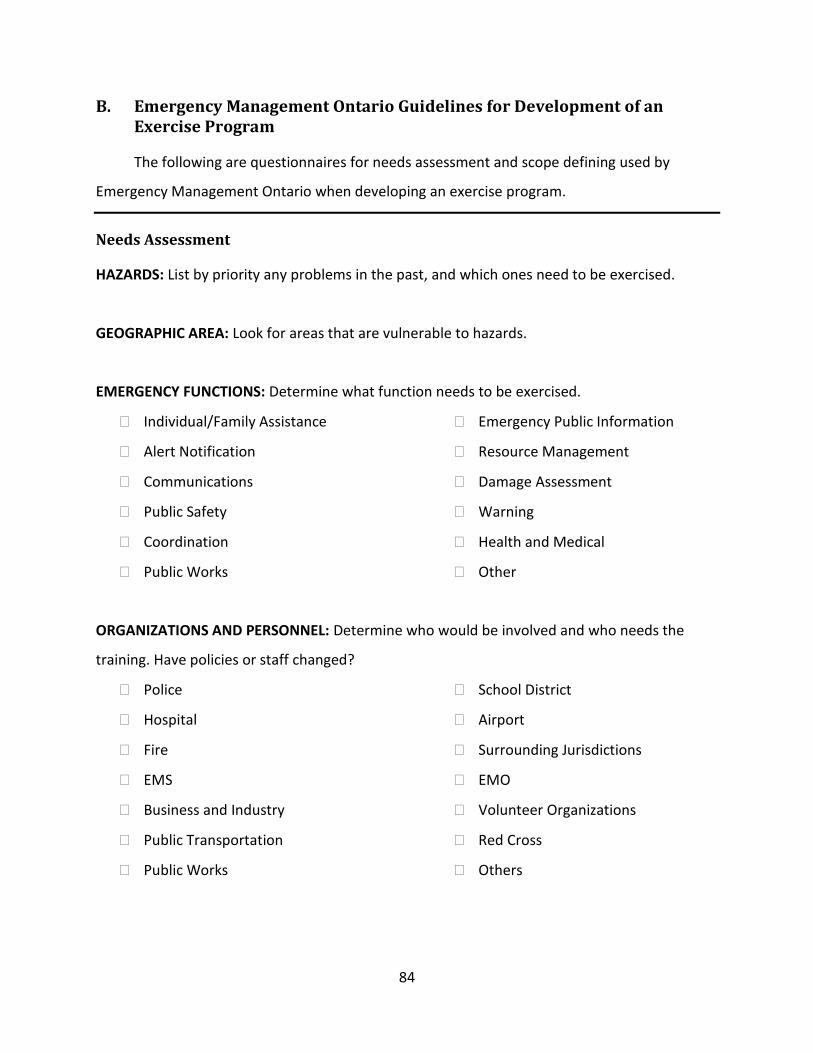
84
B. Emergency Management Ontario Guidelines for Development of an Exercise Program
The following are questionnaires for needs assessment and scope defining used by
Emergency Management Ontario when developing an exercise program.
Needs Assessment
HAZARDS: List by priority any problems in the past, and which ones need to be exercised.
GEOGRAPHIC AREA: Look for areas that are vulnerable to hazards.
EMERGENCY FUNCTIONS: Determine what function needs to be exercised.
Individual/Family Assistance
Alert Notification
Communications
Public Safety
Coordination
Public Works
Emergency Public Information
Resource Management
Damage Assessment
Warning
Health and Medical
Other
ORGANIZATIONS AND PERSONNEL: Determine who would be involved and who needs the
training. Have policies or staff changed?
Police
Hospital
Fire
EMS
Business and Industry
Public Transportation
Public Works
School District
Airport
Surrounding Jurisdictions
EMO
Volunteer Organizations
Red Cross
Others
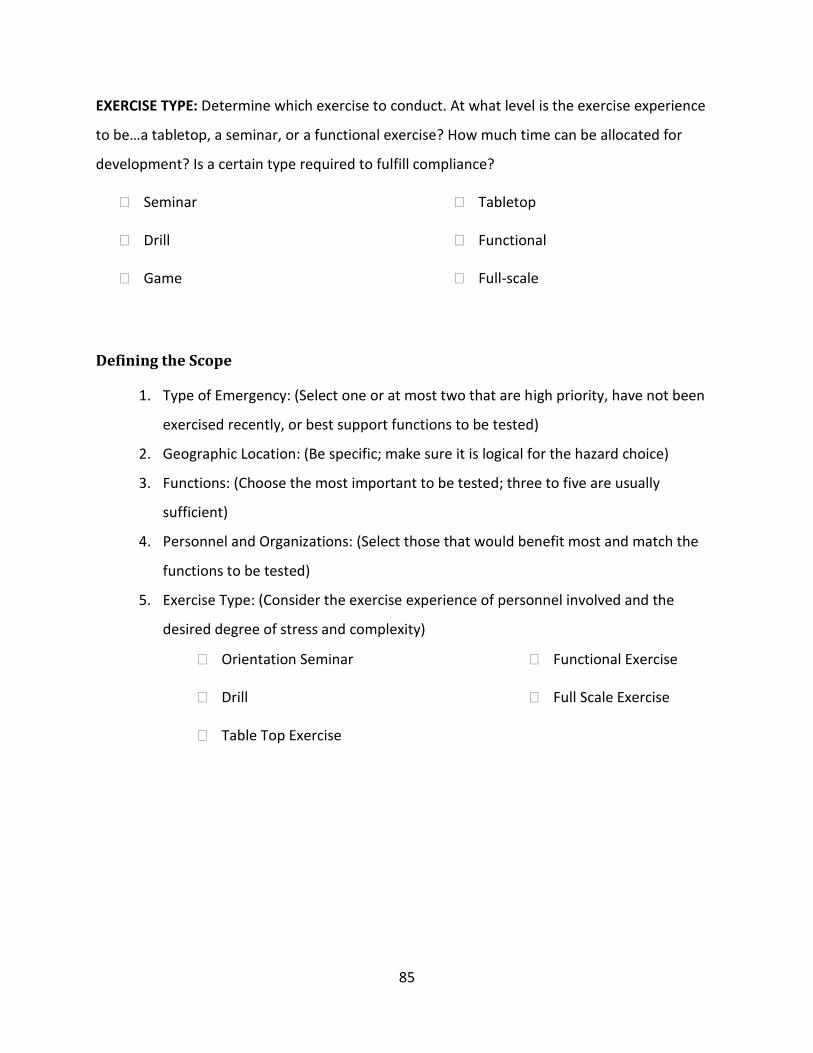
85
EXERCISE TYPE: Determine which exercise to conduct. At what level is the exercise experience
to be…a tabletop, a seminar, or a functional exercise? How much time can be allocated for
development? Is a certain type required to fulfill compliance?
Seminar
Drill
Game
Tabletop
Functional
Full-scale
Defining the Scope
1. Type of Emergency: (Select one or at most two that are high priority, have not been
exercised recently, or best support functions to be tested)
2. Geographic Location: (Be specific; make sure it is logical for the hazard choice)
3. Functions: (Choose the most important to be tested; three to five are usually
sufficient)
4. Personnel and Organizations: (Select those that would benefit most and match the
functions to be tested)
5. Exercise Type: (Consider the exercise experience of personnel involved and the
desired degree of stress and complexity)
Orientation Seminar
Drill
Table Top Exercise
Functional Exercise
Full Scale Exercise