Embed Size (px)
Citation preview
1
Emerging Heterogeneous Technologies
for High Performance Computing
Jack Dongarra
University of Tennessee
Oak Ridge National Lab
University of Manchester
MURPA (Monash Undergraduate Research Projects
Abroad)
2
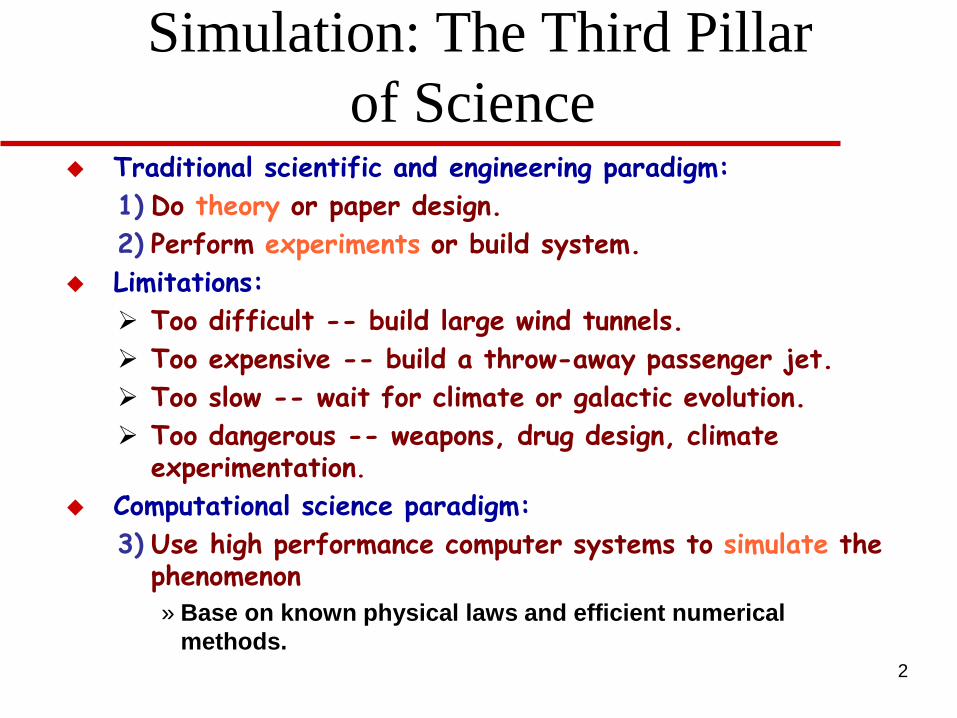
Simulation: The Third Pillar
of Science Traditional scientific and engineering paradigm:
1) Do theory or paper design.
2) Perform experiments or build system.
Limitations:
Too difficult -- build large wind tunnels.
Too expensive -- build a throw-away passenger jet.
Too slow -- wait for climate or galactic evolution.
Too dangerous -- weapons, drug design, climate experimentation.
Computational science paradigm:
3) Use high performance computer systems to simulate the phenomenon » Base on known physical laws and efficient numerical
methods.
3
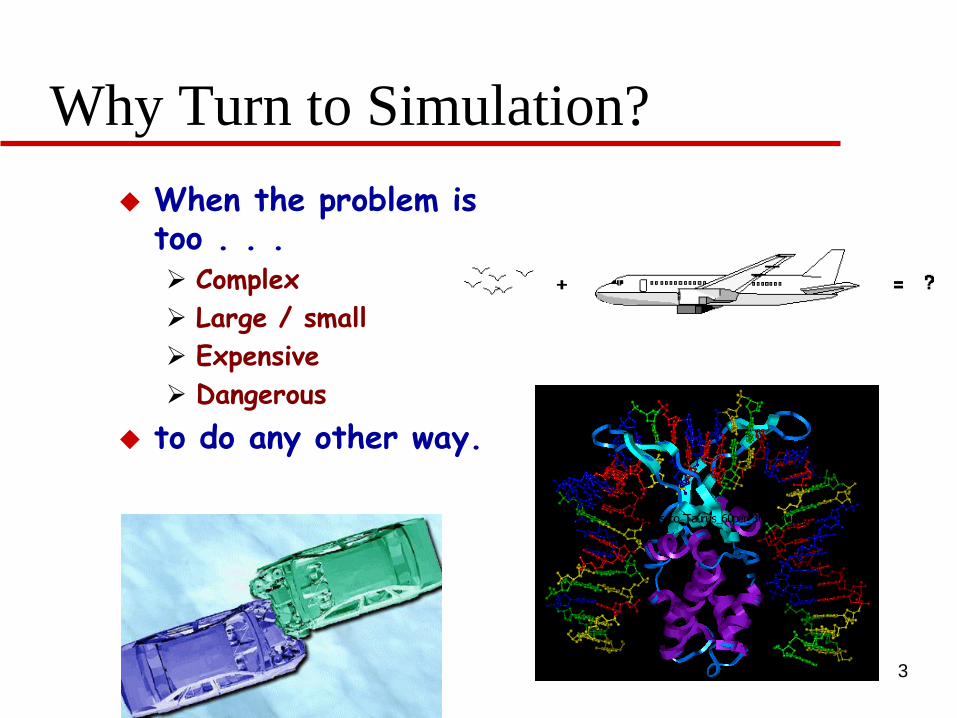
Why Turn to Simulation?
When the problem is too . . . Complex
Large / small
Expensive
Dangerous
to do any other way.
Taurus_to_Taurus_60per_30deg.mpeg
4
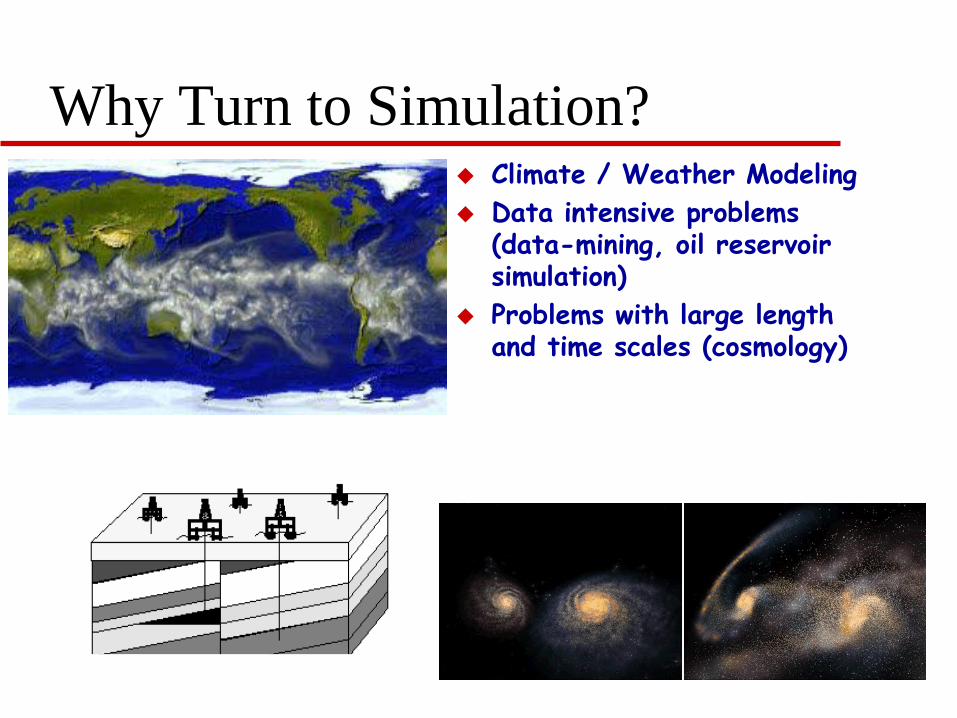
Why Turn to Simulation? Climate / Weather Modeling
Data intensive problems (data-mining, oil reservoir simulation)
Problems with large length and time scales (cosmology)
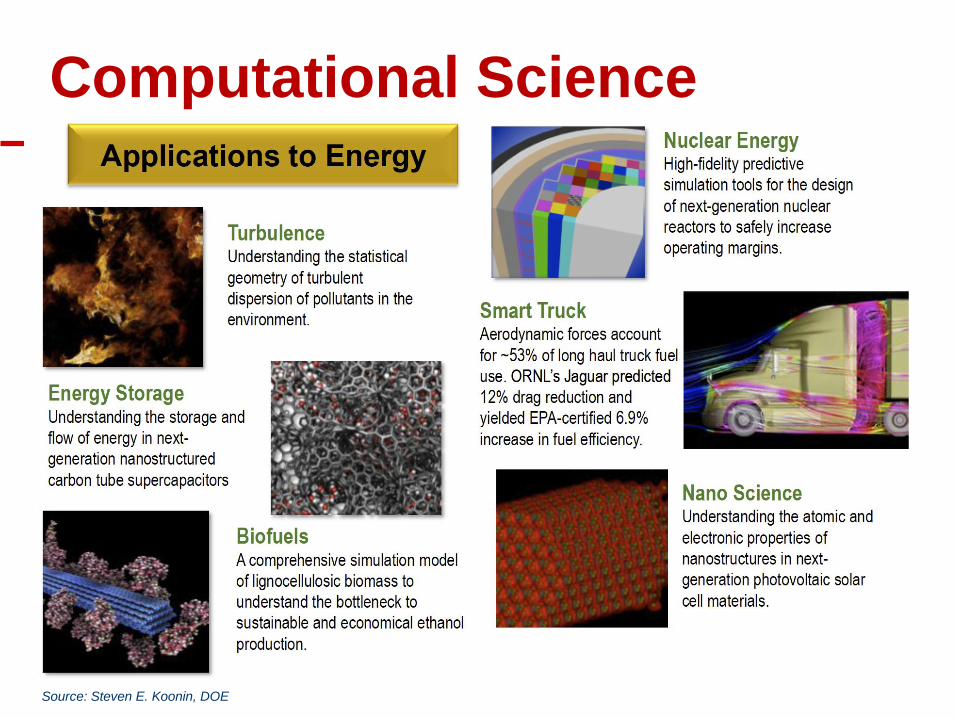
Computational Science
5
Source: Steven E. Koonin, DOE
6
High-Performance Computing
Today
In the past decade, the world has experienced one of the most exciting periods in computer development.
Microprocessors have become smaller, denser, and more powerful.
The result is that microprocessor-based supercomputing is rapidly becoming the technology of preference in attacking some of the most important problems of science and engineering.
7
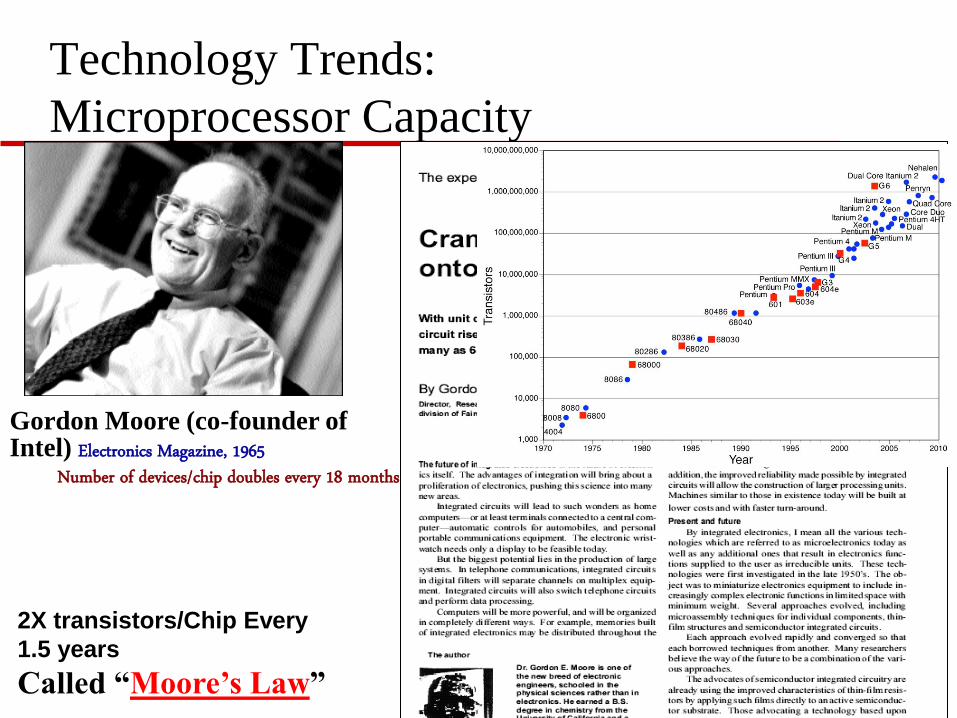
Technology Trends:
Microprocessor Capacity
2X transistors/Chip Every
1.5 years
Called “Moore’s Law”
Microprocessors have become smaller,
denser, and more powerful.
Not just processors, bandwidth,
storage, etc.
2X memory and processor speed and
½ size, cost, & power every 18
months.
Gordon Moore (co-founder of Intel) Electronics Magazine, 1965
Number of devices/chip doubles every 18 months
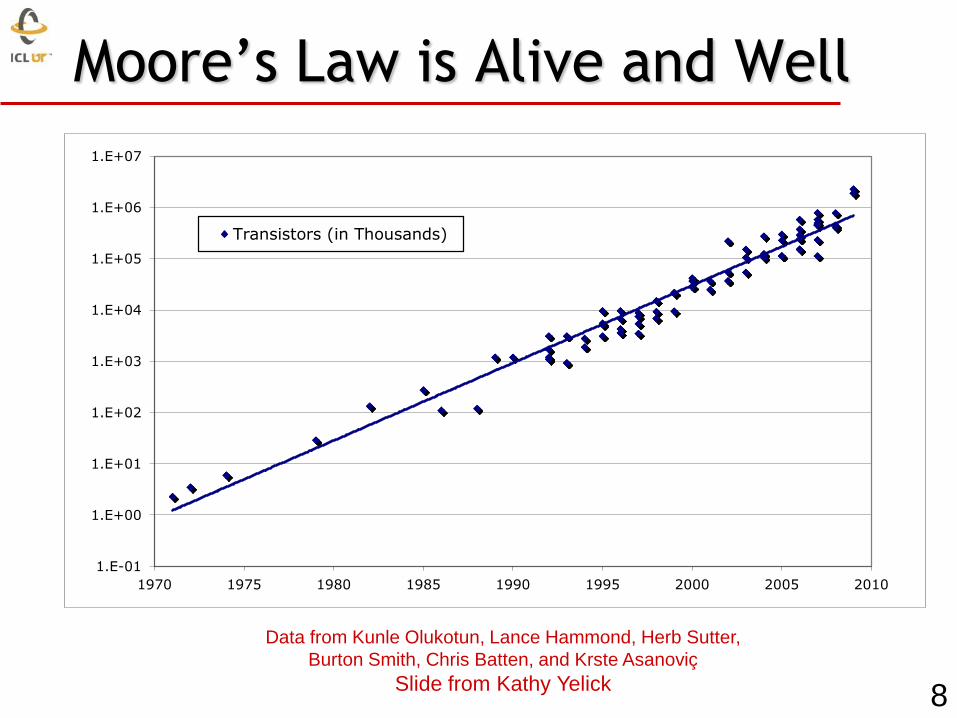
Data from Kunle Olukotun, Lance Hammond, Herb Sutter,
Burton Smith, Chris Batten, and Krste Asanoviç
Slide from Kathy Yelick
Moore’s Law is Alive and Well
1.E-01
1.E+00
1.E+01
1.E+02
1.E+03
1.E+04
1.E+05
1.E+06
1.E+07
1970 1975 1980 1985 1990 1995 2000 2005 2010
Transistors (in Thousands)
8
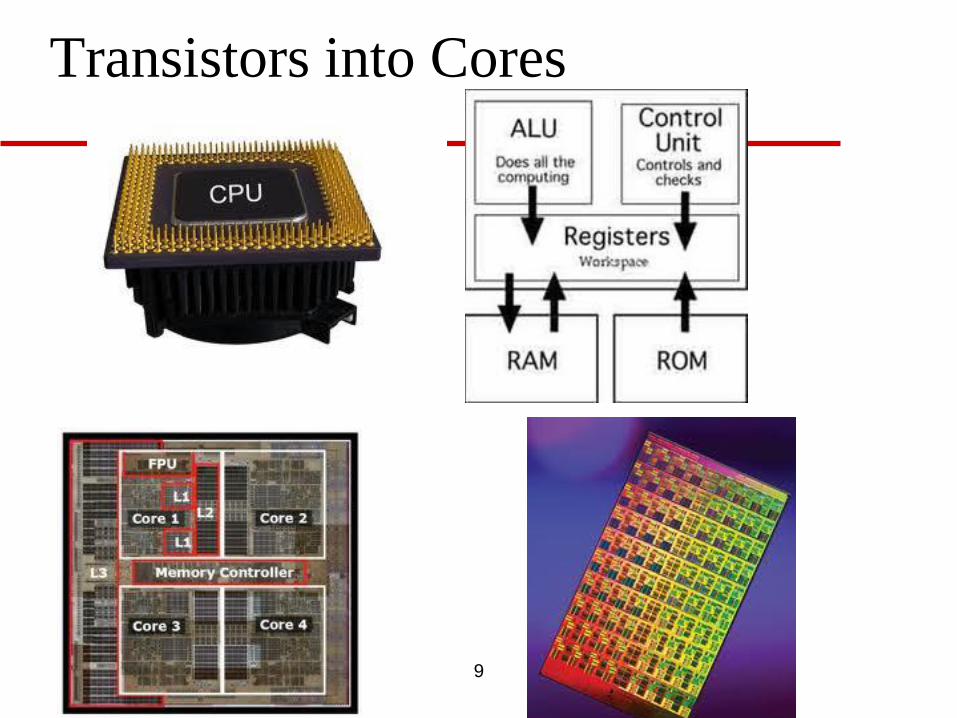
Transistors into Cores
9
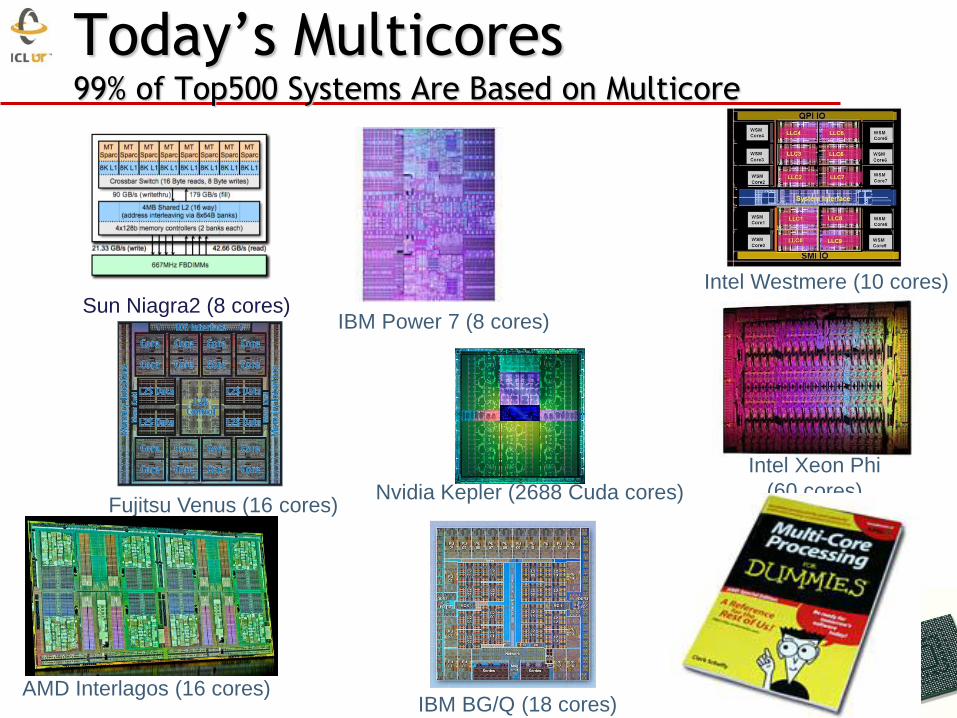
Today’s Multicores 99% of Top500 Systems Are Based on Multicore
10
Sun Niagra2 (8 cores)
Intel Xeon Phi
(60 cores)
IBM BG/Q (18 cores) AMD Interlagos (16 cores)
Intel Westmere (10 cores)
Fujitsu Venus (16 cores)
IBM Power 7 (8 cores)
Nvidia Kepler (2688 Cuda cores)
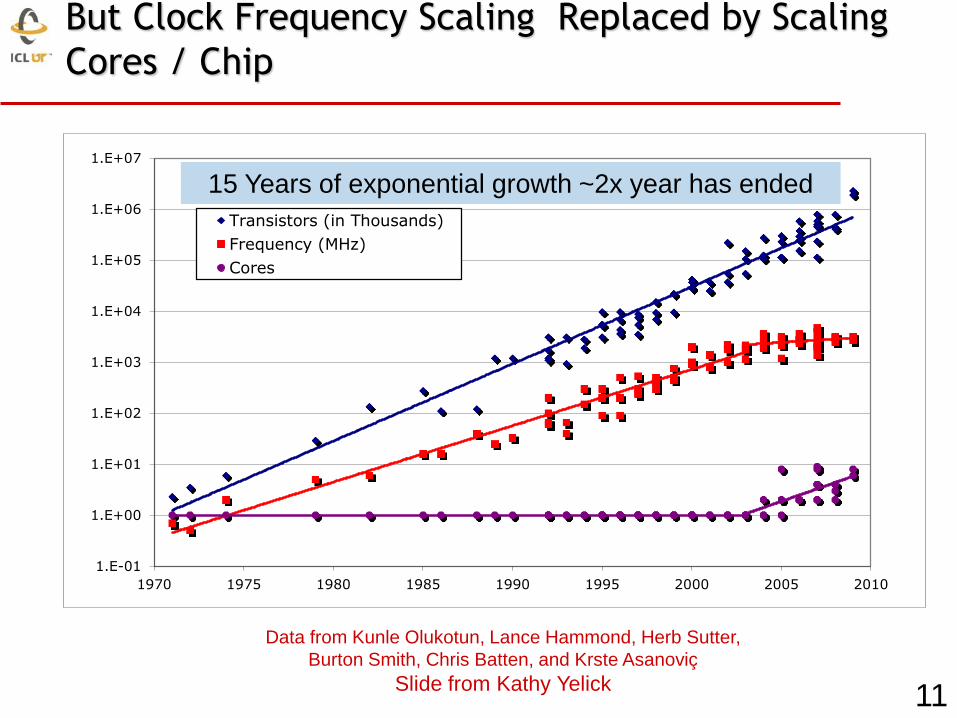
But Clock Frequency Scaling Replaced by Scaling
Cores / Chip
1.E-01
1.E+00
1.E+01
1.E+02
1.E+03
1.E+04
1.E+05
1.E+06
1.E+07
1970 1975 1980 1985 1990 1995 2000 2005 2010
Transistors (in Thousands)
Frequency (MHz)
Cores
15 Years of exponential growth ~2x year has ended
11
Data from Kunle Olukotun, Lance Hammond, Herb Sutter,
Burton Smith, Chris Batten, and Krste Asanoviç
Slide from Kathy Yelick
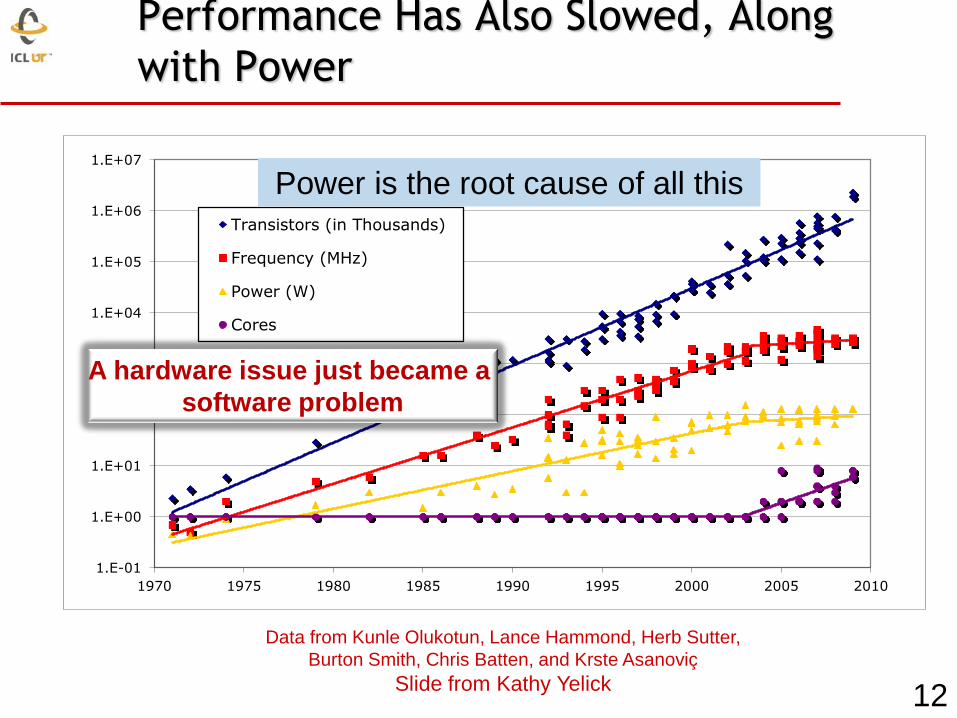
Performance Has Also Slowed, Along
with Power
1.E-01
1.E+00
1.E+01
1.E+02
1.E+03
1.E+04
1.E+05
1.E+06
1.E+07
1970 1975 1980 1985 1990 1995 2000 2005 2010
Transistors (in Thousands)
Frequency (MHz)
Power (W)
Cores
Power is the root cause of all this
A hardware issue just became a
software problem
12
Data from Kunle Olukotun, Lance Hammond, Herb Sutter,
Burton Smith, Chris Batten, and Krste Asanoviç
Slide from Kathy Yelick
13
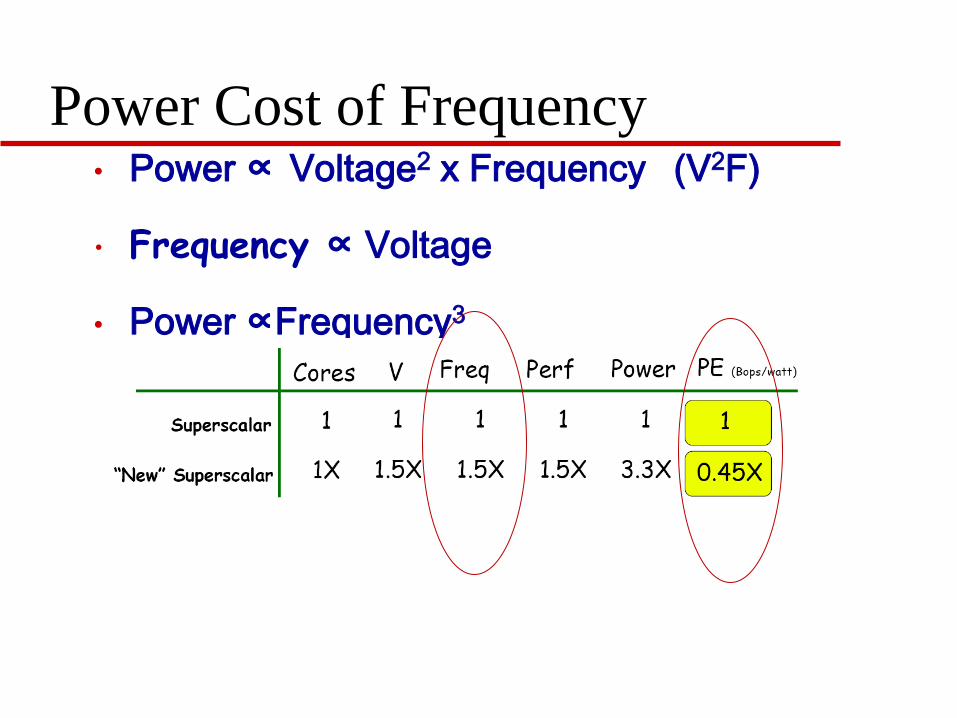
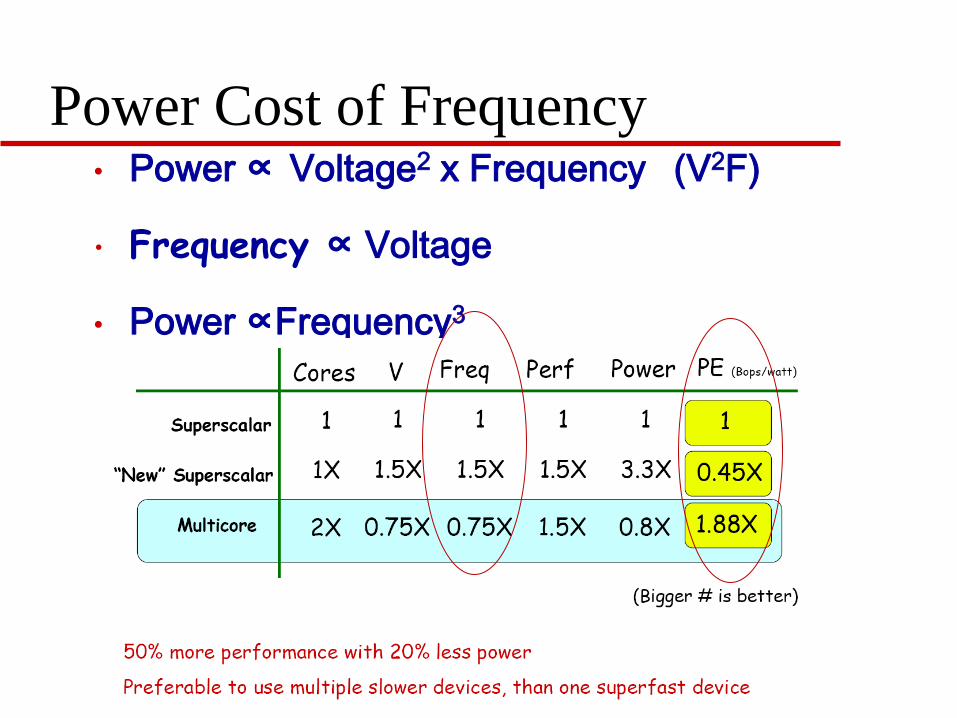
Power Cost of Frequency • Power ∝ Voltage2 x Frequency (V2F)
• Frequency ∝ Voltage
• Power ∝Frequency3
14
Power Cost of Frequency • Power ∝ Voltage2 x Frequency (V2F)
• Frequency ∝ Voltage
• Power ∝Frequency3
Look at the Fastest Computers
Strategic importance of supercomputing Essential for scientific discovery
Critical for national security
Fundamental contributor to the economy and competitiveness through use in engineering and manufacturing
Supercomputers are the tool for solving the most challenging problems through simulations
15
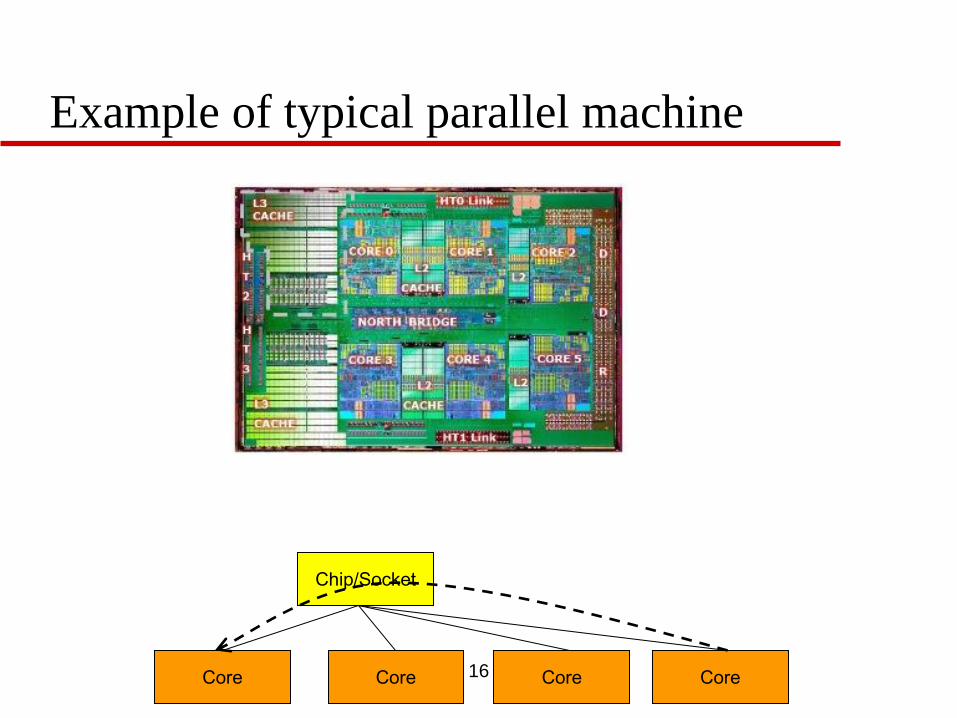
Example of typical parallel machine
Chip/Socket
Core Core Core Core 16
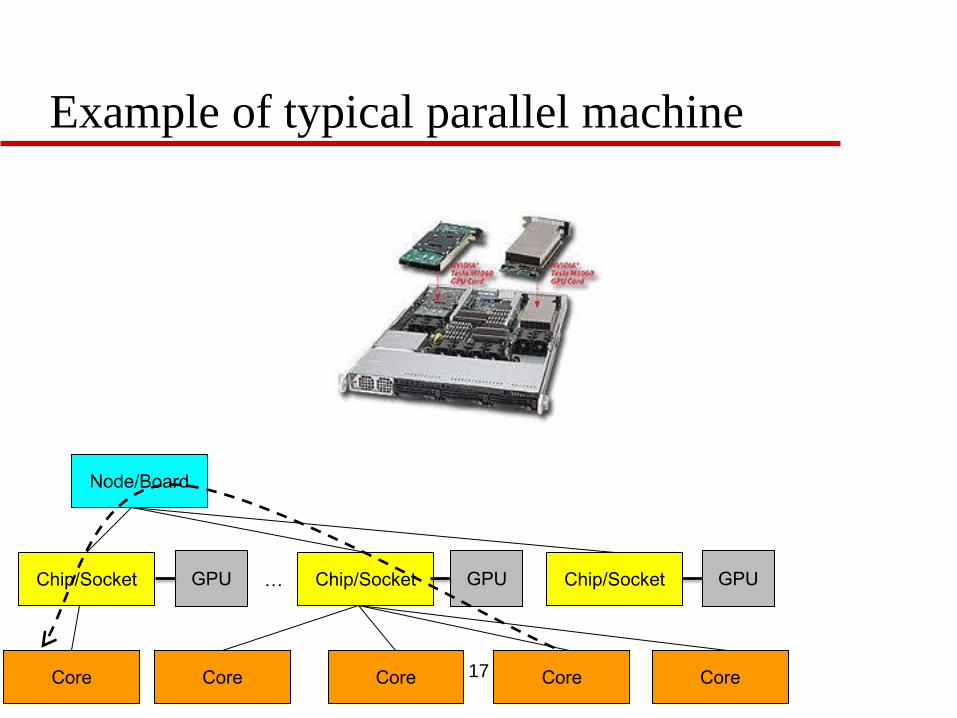
Example of typical parallel machine
Node/Board
Chip/Socket Chip/Socket Chip/Socket
Core Core Core Core
…
Core
GPU GPU GPU
17
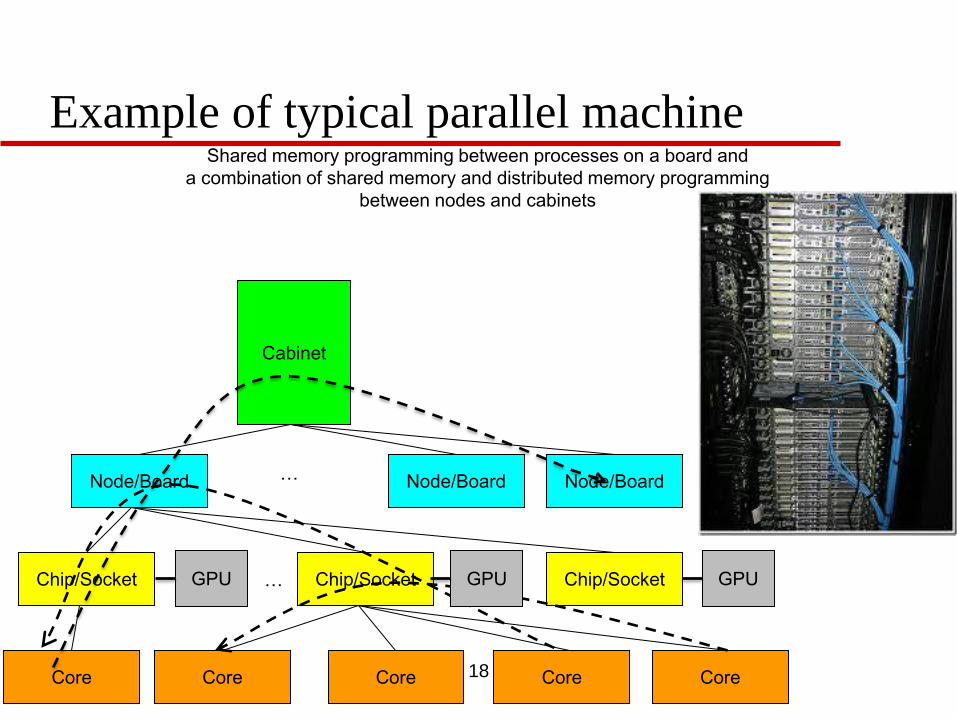
Example of typical parallel machine
Cabinet
Node/Board Node/Board Node/Board
Chip/Socket Chip/Socket Chip/Socket
Core Core Core Core
…
Core
Shared memory programming between processes on a board and
a combination of shared memory and distributed memory programming
between nodes and cabinets
… GPU GPU GPU
18
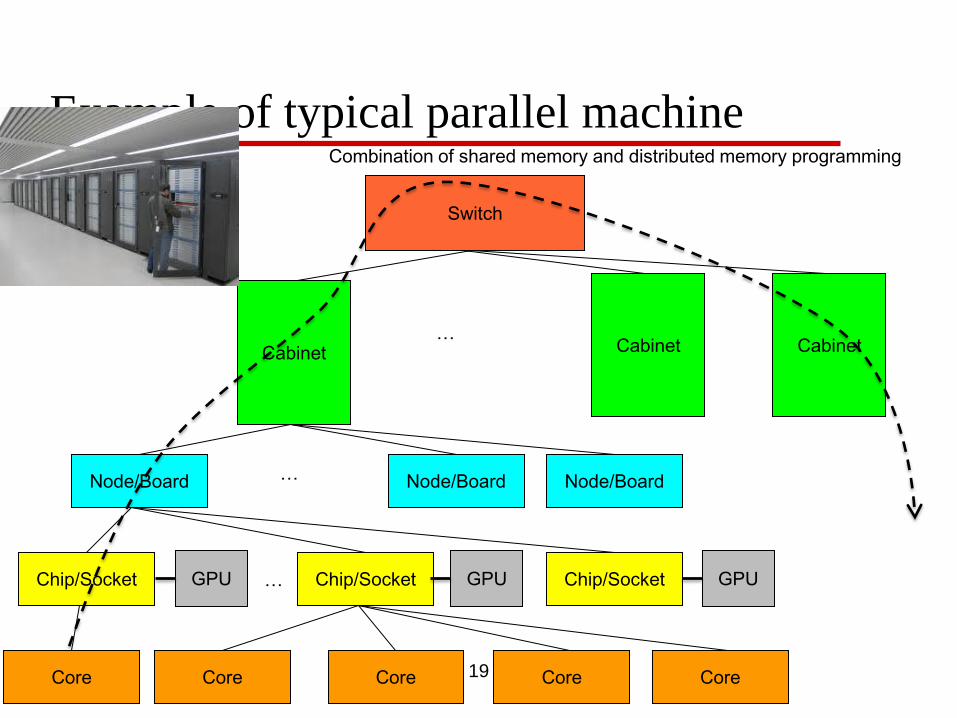
Example of typical parallel machine
Switch
Cabinet Cabinet Cabinet
Node/Board Node/Board Node/Board
Chip/Socket Chip/Socket Chip/Socket
Core Core Core Core
…
…
Core
Combination of shared memory and distributed memory programming
…
19
GPU GPU GPU
20
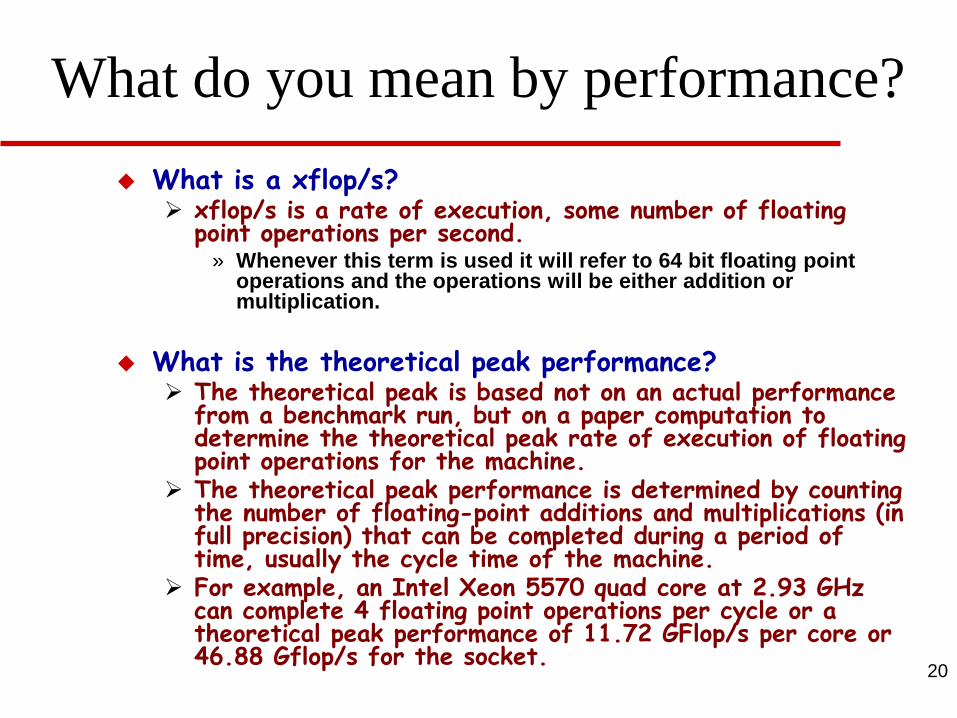
What do you mean by performance?
What is a xflop/s? xflop/s is a rate of execution, some number of floating
point operations per second. » Whenever this term is used it will refer to 64 bit floating point
operations and the operations will be either addition or multiplication.
What is the theoretical peak performance?
The theoretical peak is based not on an actual performance from a benchmark run, but on a paper computation to determine the theoretical peak rate of execution of floating point operations for the machine.
The theoretical peak performance is determined by counting the number of floating-point additions and multiplications (in full precision) that can be completed during a period of time, usually the cycle time of the machine.
For example, an Intel Xeon 5570 quad core at 2.93 GHz can complete 4 floating point operations per cycle or a theoretical peak performance of 11.72 GFlop/s per core or 46.88 Gflop/s for the socket.
21
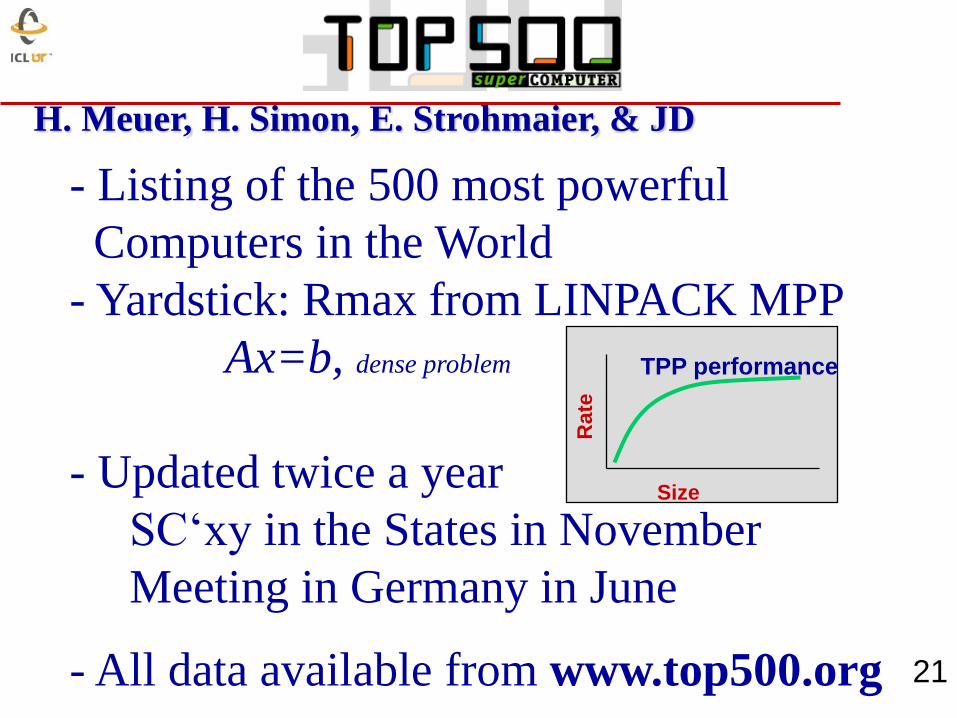
H. Meuer, H. Simon, E. Strohmaier, & JD
- Listing of the 500 most powerful
Computers in the World
- Yardstick: Rmax from LINPACK MPP
Ax=b, dense problem
- Updated twice a year
SC‘xy in the States in November
Meeting in Germany in June
- All data available from www.top500.org
Size
Rate
TPP performance
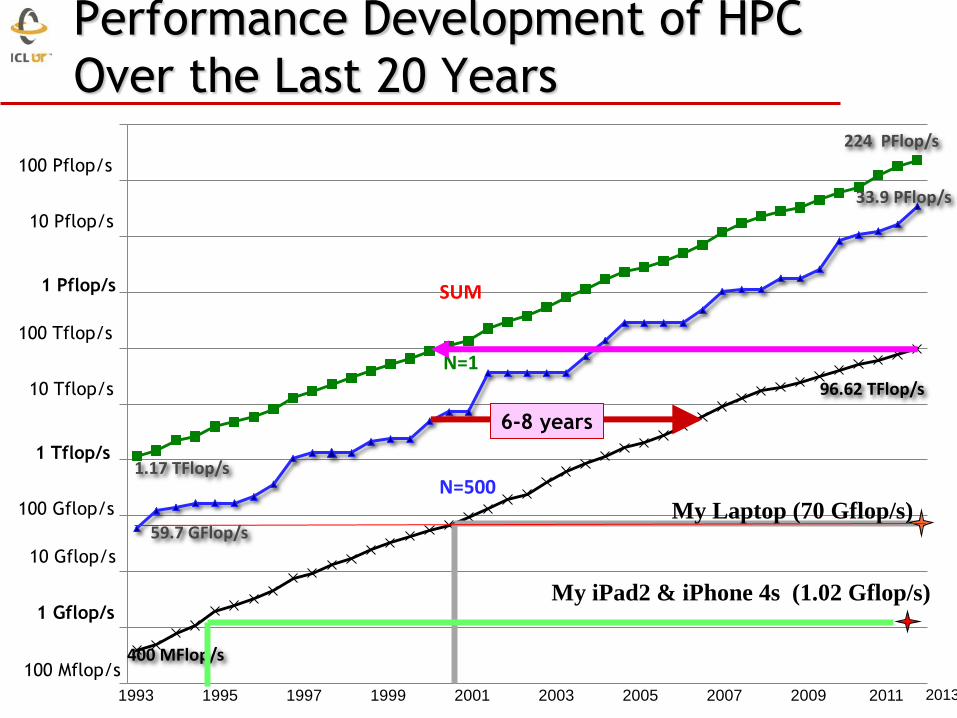
Performance Development of HPC
Over the Last 20 Years
0.1
1
10
100
1000
10000
100000
1000000
10000000
100000000
1E+09
1 Gflop/s
1 Tflop/s
100 Mflop/s
100 Gflop/s
100 Tflop/s
10 Gflop/s
10 Tflop/s
1 Pflop/s
100 Pflop/s
10 Pflop/s
59.7 GFlop/s
400 MFlop/s
1.17 TFlop/s
33.9 PFlop/s
96.62 TFlop/s
224 PFlop/s
SUM
N=1
N=500
6-8 years
My Laptop (70 Gflop/s)
1993 1995 1997 1999 2001 2003 2005 2007 2009 2011
My iPad2 & iPhone 4s (1.02 Gflop/s)
2013
1.E+00
1.E+01
1.E+02
1.E+03
1.E+04
1.E+05
1.E+06
1.E+07
1.E+08
1.E+09
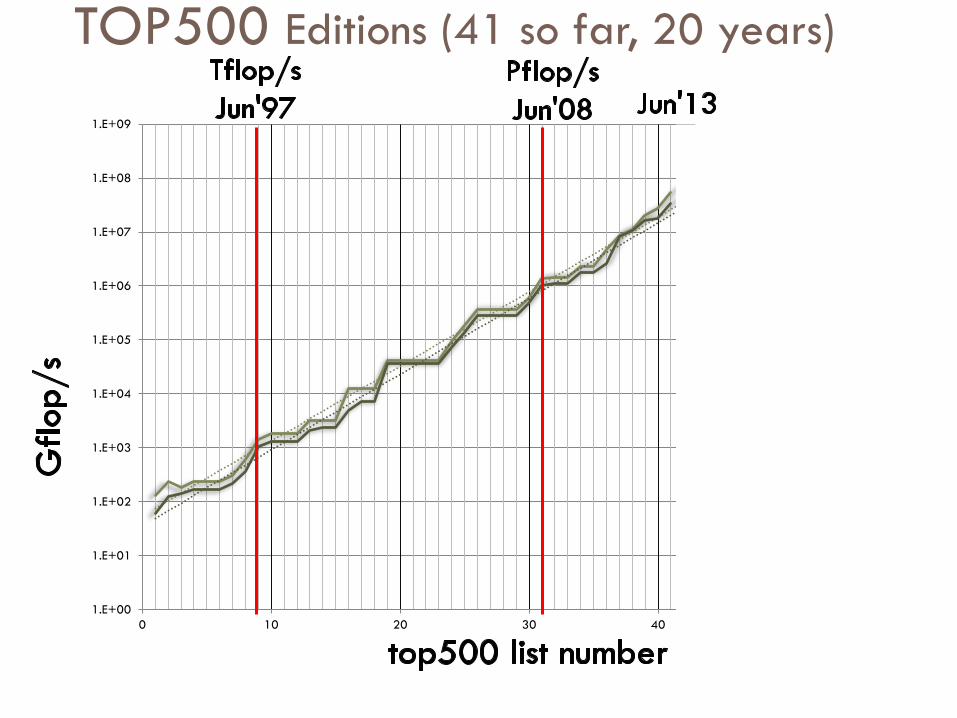
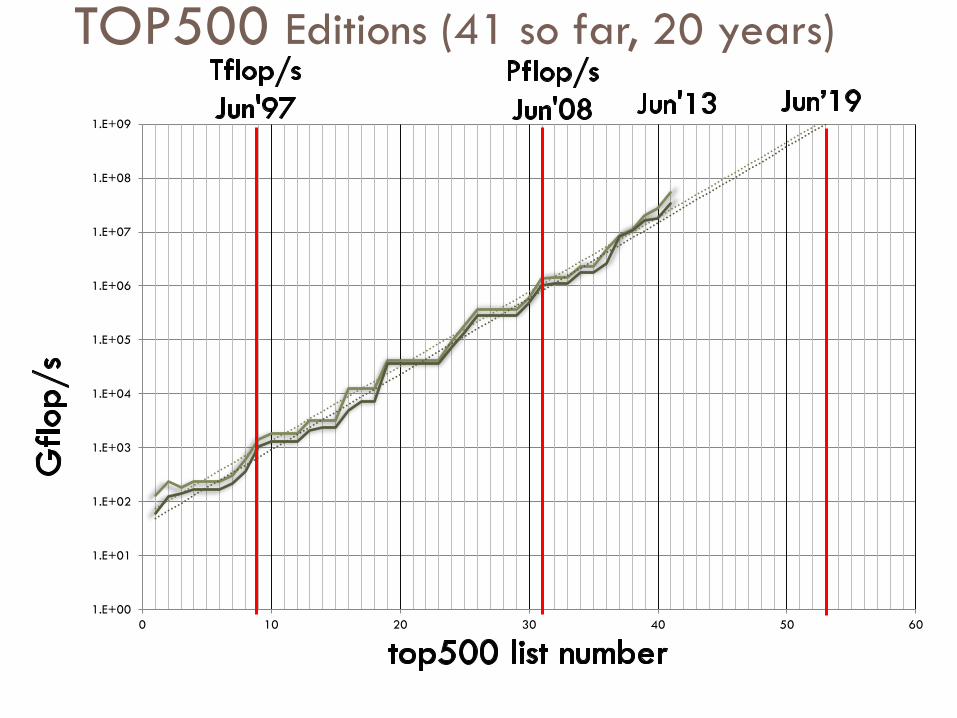
0 10 20 30 40 50 60
TOP500 Editions (41 so far, 20 years)
1.E+00
1.E+01
1.E+02
1.E+03
1.E+04
1.E+05
1.E+06
1.E+07
1.E+08
1.E+09
0 10 20 30 40 50 60
TOP500 Editions (41 so far, 20 years)
25
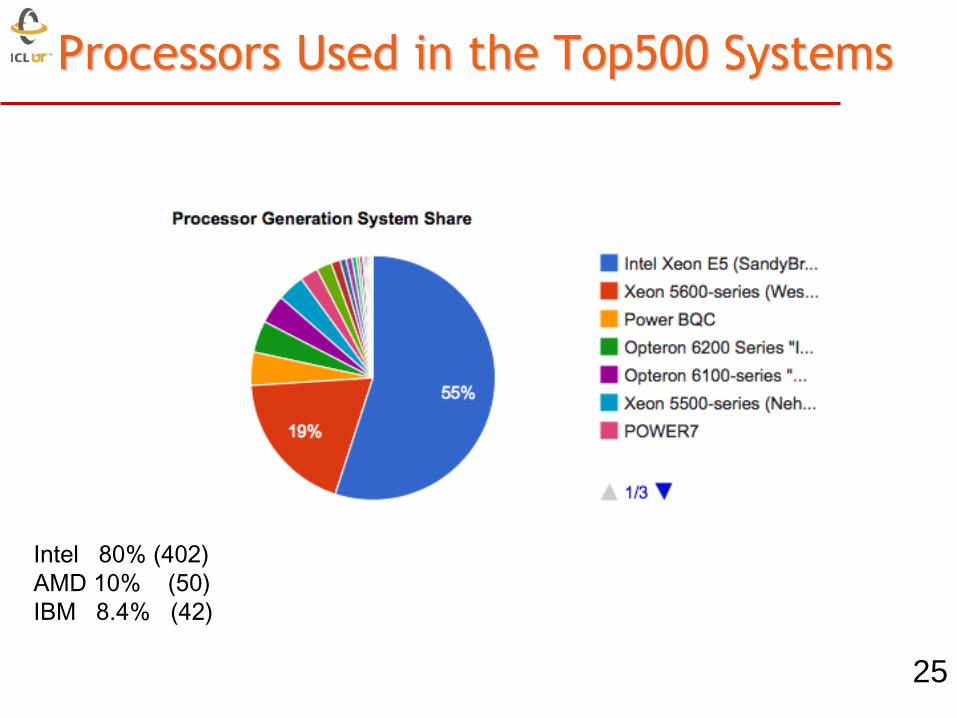
Intel 80% (402)
AMD 10% (50)
IBM 8.4% (42)
Processors Used in the Top500 Systems
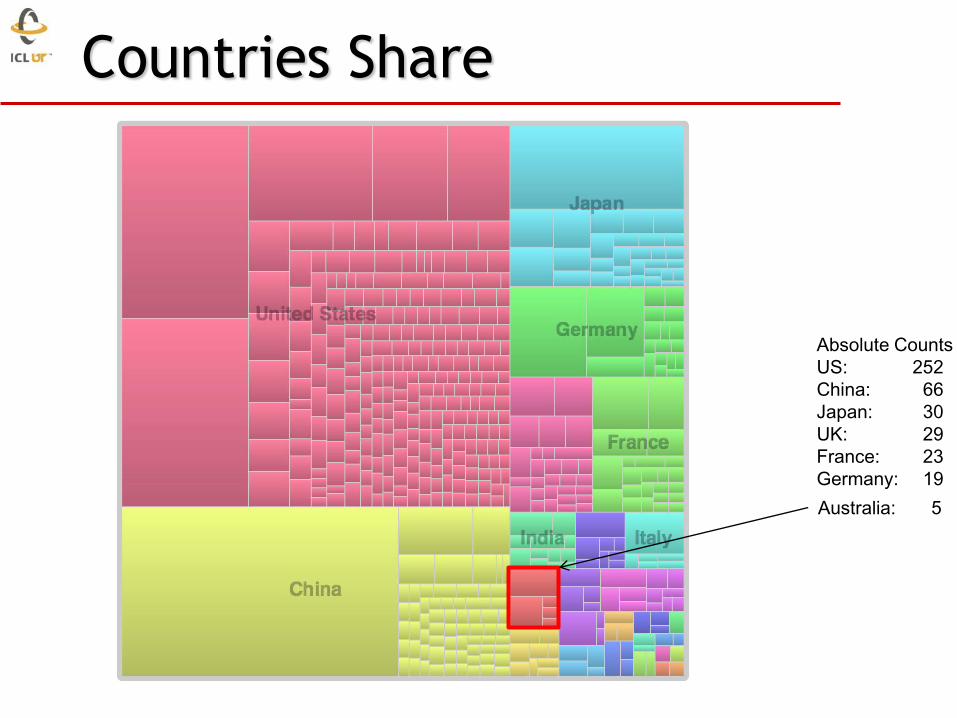
Countries Share
Absolute Counts
US: 252
China: 66
Japan: 30
UK: 29
France: 23
Germany: 19
Australia: 5
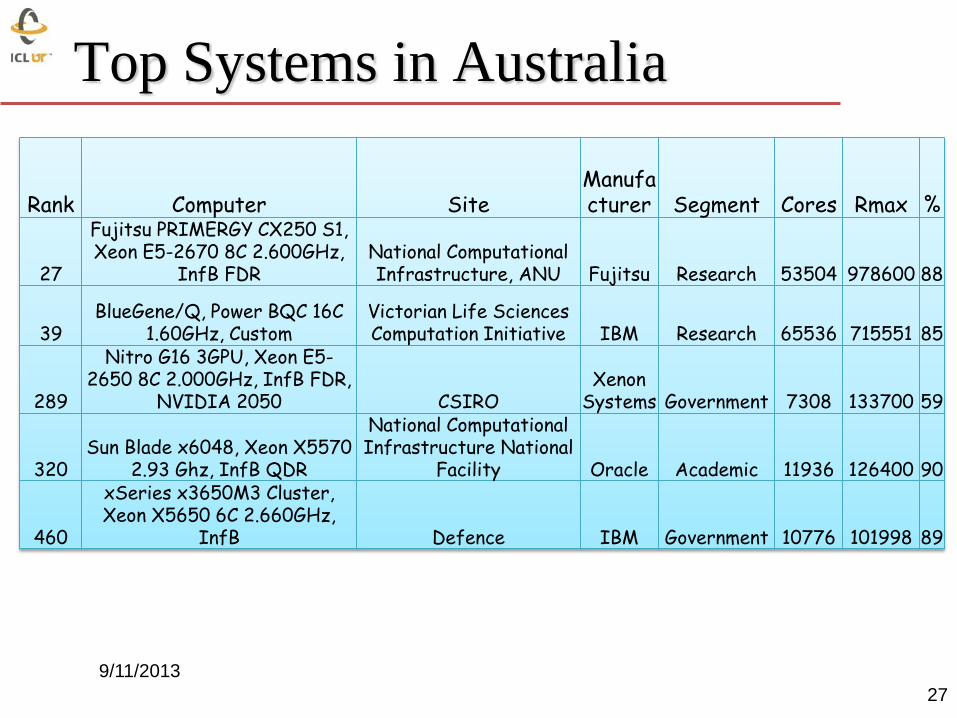
Top Systems in Australia
9/11/2013
27
Rank Computer Site
Manufacturer Segment Cores Rmax %
27
Fujitsu PRIMERGY CX250 S1, Xeon E5-2670 8C 2.600GHz,
InfB FDR
National Computational Infrastructure, ANU Fujitsu Research 53504 978600 88
39
BlueGene/Q, Power BQC 16C 1.60GHz, Custom
Victorian Life Sciences Computation Initiative IBM Research 65536 715551 85
289
Nitro G16 3GPU, Xeon E5-2650 8C 2.000GHz, InfB FDR,
NVIDIA 2050 CSIRO
Xenon Systems Government 7308 133700 59
320
Sun Blade x6048, Xeon X5570 2.93 Ghz, InfB QDR
National Computational Infrastructure National
Facility Oracle Academic 11936 126400 90
460
xSeries x3650M3 Cluster, Xeon X5650 6C 2.660GHz,
InfB Defence IBM Government 10776 101998 89
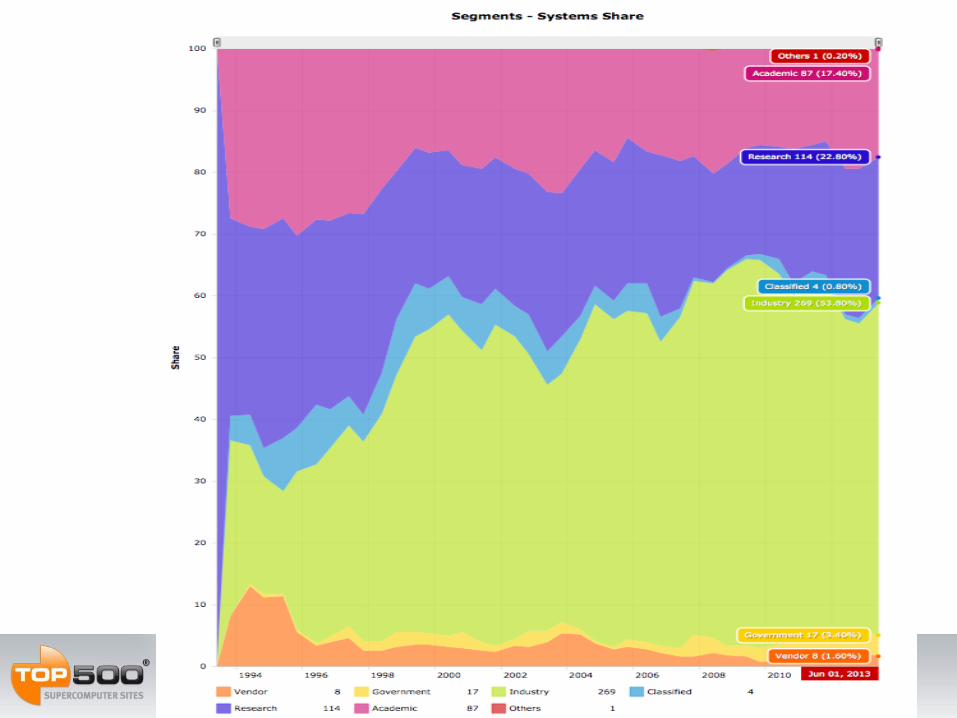
Customer Segments
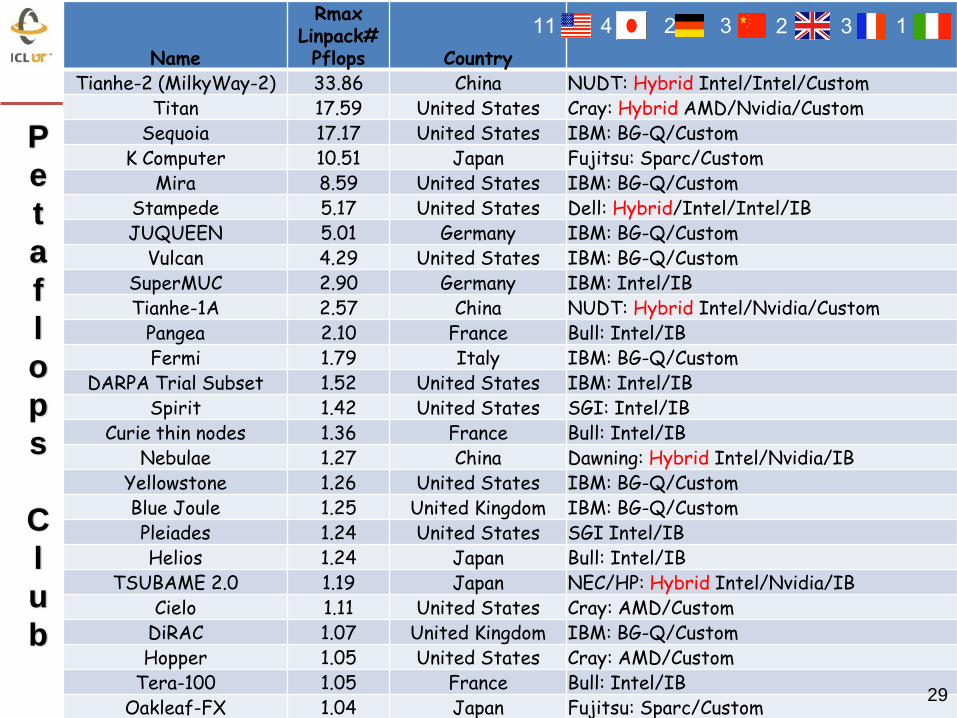
Name
Rmax Linpack# Pflops Country
Tianhe-2 (MilkyWay-2) 33.86 China NUDT: Hybrid Intel/Intel/Custom Titan 17.59 United States Cray: Hybrid AMD/Nvidia/Custom
Sequoia 17.17 United States IBM: BG-Q/Custom K Computer 10.51 Japan Fujitsu: Sparc/Custom
Mira 8.59 United States IBM: BG-Q/Custom Stampede 5.17 United States Dell: Hybrid/Intel/Intel/IB JUQUEEN 5.01 Germany IBM: BG-Q/Custom
Vulcan 4.29 United States IBM: BG-Q/Custom SuperMUC 2.90 Germany IBM: Intel/IB Tianhe-1A 2.57 China NUDT: Hybrid Intel/Nvidia/Custom
Pangea 2.10 France Bull: Intel/IB Fermi 1.79 Italy IBM: BG-Q/Custom
DARPA Trial Subset 1.52 United States IBM: Intel/IB Spirit 1.42 United States SGI: Intel/IB
Curie thin nodes 1.36 France Bull: Intel/IB Nebulae 1.27 China Dawning: Hybrid Intel/Nvidia/IB
Yellowstone 1.26 United States IBM: BG-Q/Custom Blue Joule 1.25 United Kingdom IBM: BG-Q/Custom Pleiades 1.24 United States SGI Intel/IB Helios 1.24 Japan Bull: Intel/IB
TSUBAME 2.0 1.19 Japan NEC/HP: Hybrid Intel/Nvidia/IB Cielo 1.11 United States Cray: AMD/Custom
DiRAC 1.07 United Kingdom IBM: BG-Q/Custom Hopper 1.05 United States Cray: AMD/Custom
Tera-100 1.05 France Bull: Intel/IB Oakleaf-FX 1.04 Japan Fujitsu: Sparc/Custom
29
11 4 2 3 2 3 1
P
e
t
a
f
l
o
p
s
C
l
u
b
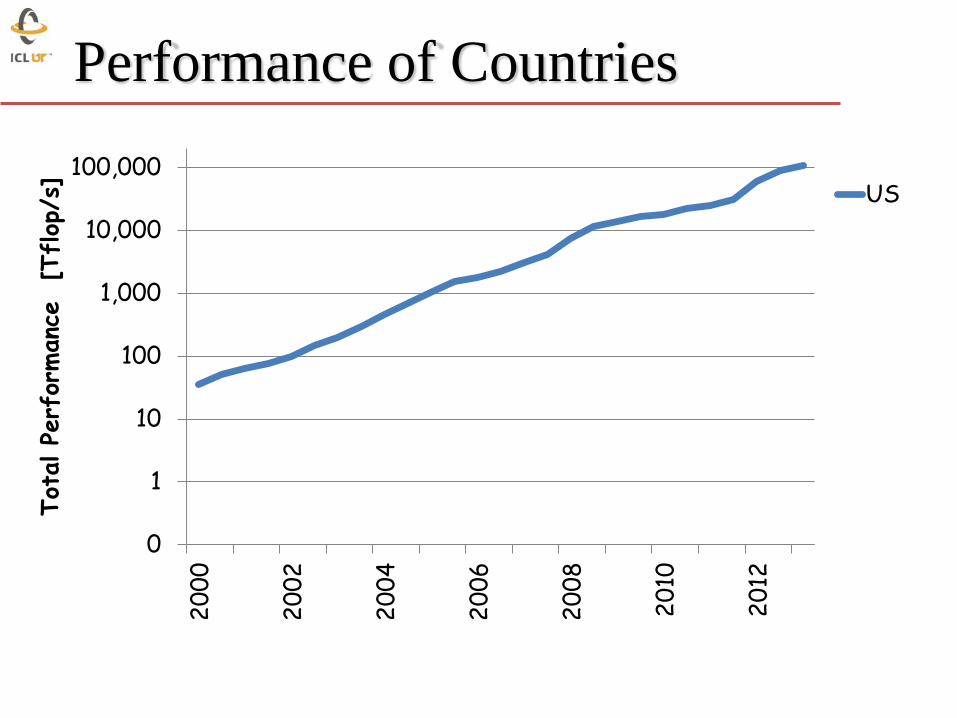
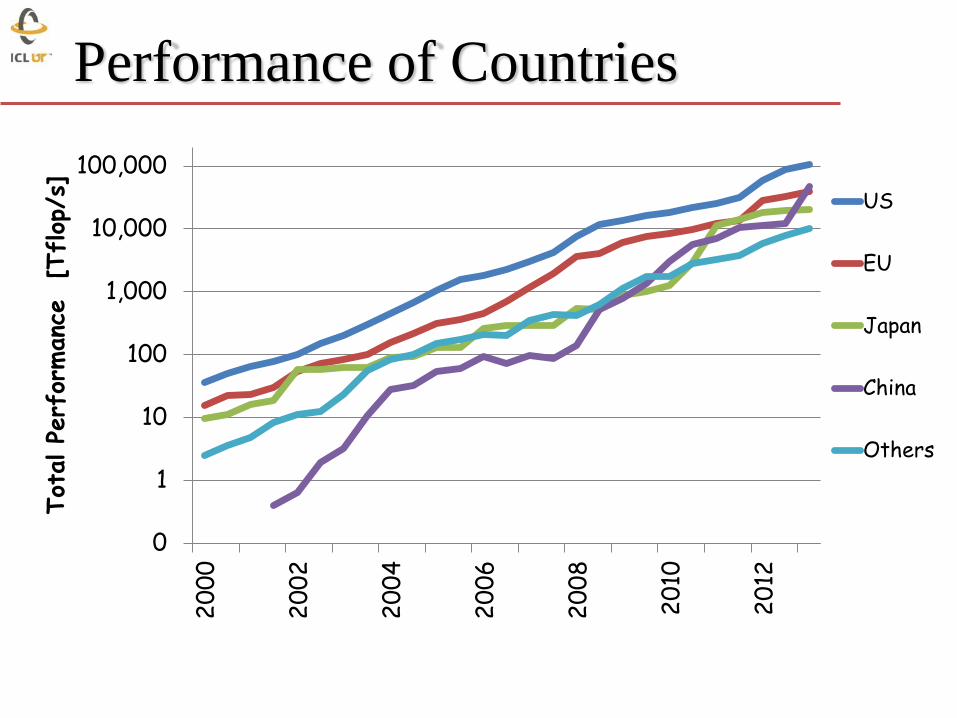
Performance of Countries
0
1
10
100
1,000
10,000
100,000
20
00
20
02
20
04
20
06
20
08
20
10
20
12
Tot
al Pe
rfor
manc
e
[Tflop
/s]
US
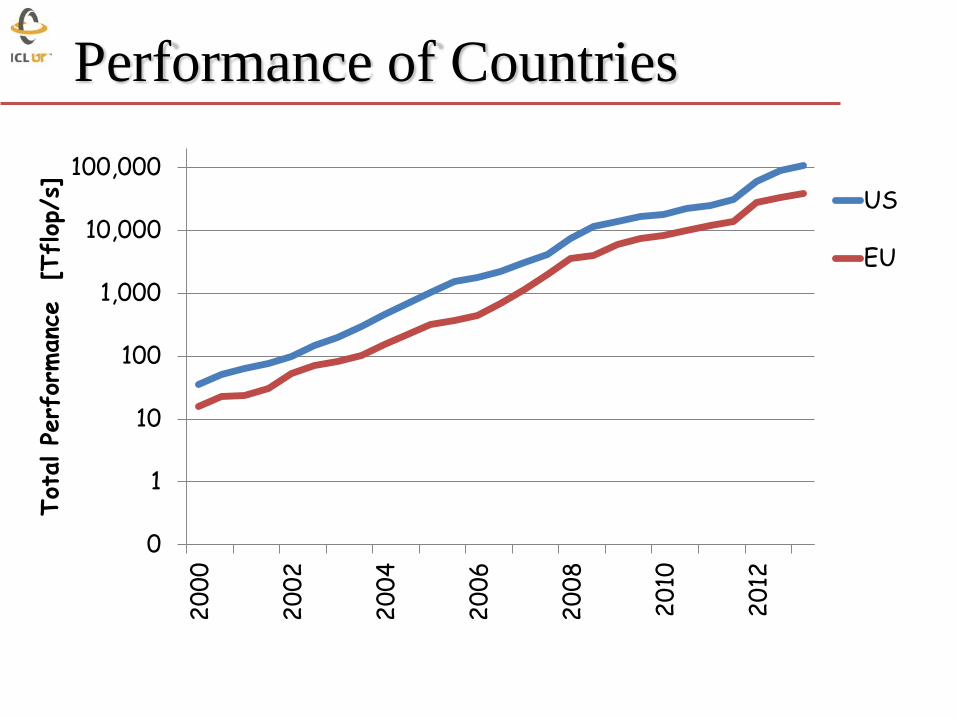
Performance of Countries
0
1
10
100
1,000
10,000
100,000
20
00
20
02
20
04
20
06
20
08
20
10
20
12
Tot
al Pe
rfor
manc
e
[Tflop
/s]
US
EU
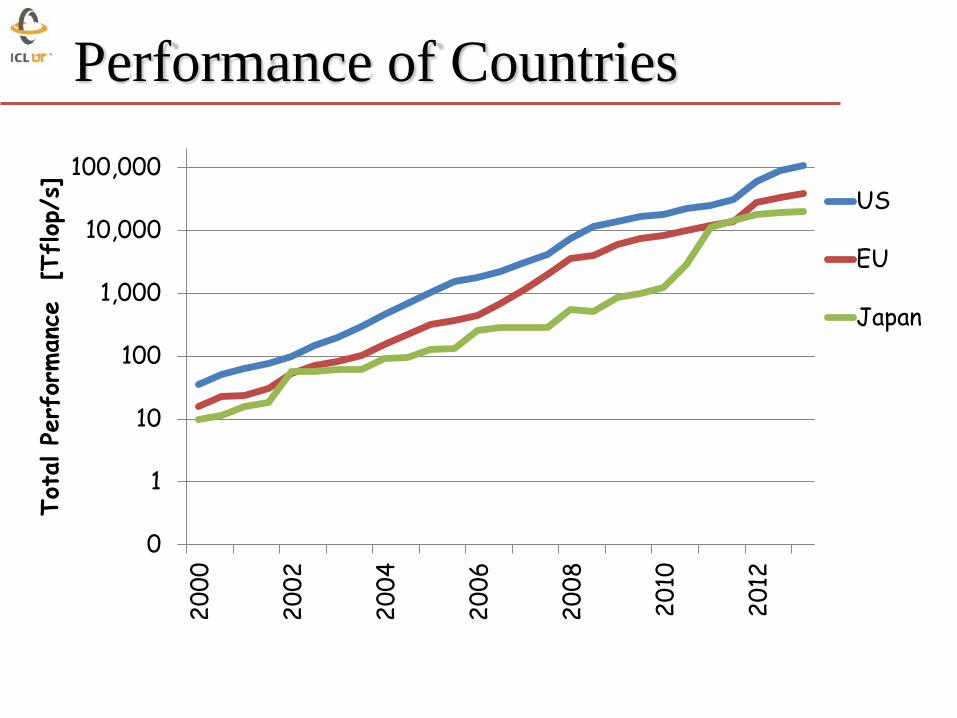
Performance of Countries
0
1
10
100
1,000
10,000
100,000
20
00
20
02
20
04
20
06
20
08
20
10
20
12
Tot
al Pe
rfor
manc
e
[Tflop
/s]
US
EU
Japan
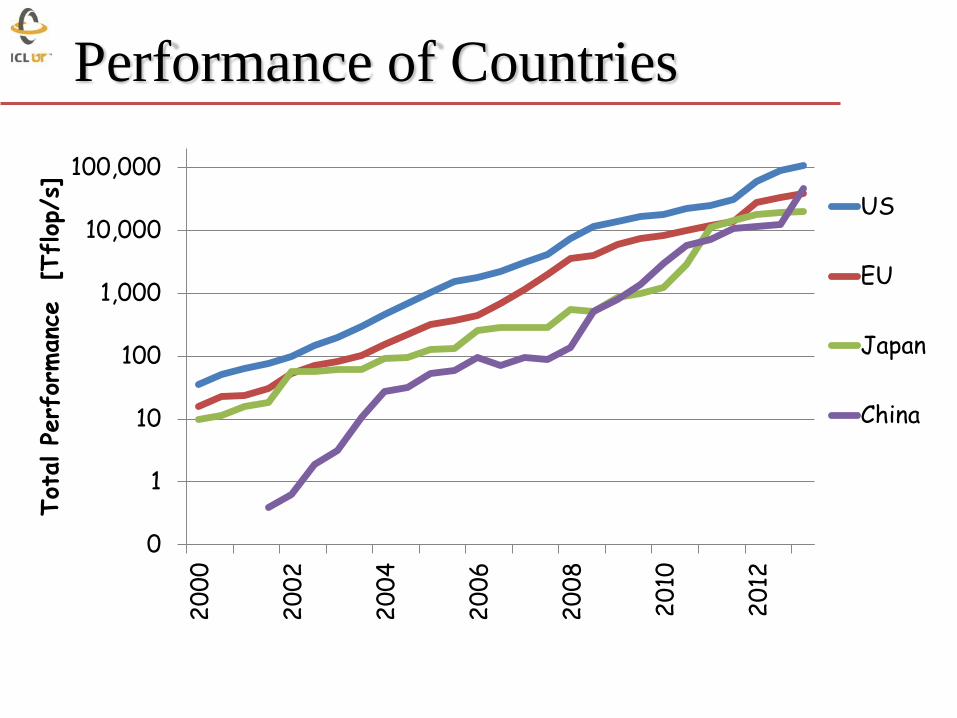
Performance of Countries
0
1
10
100
1,000
10,000
100,000
20
00
20
02
20
04
20
06
20
08
20
10
20
12
Tot
al Pe
rfor
manc
e
[Tflop
/s]
US
EU
Japan
China
Performance of Countries
0
1
10
100
1,000
10,000
100,000
20
00
20
02
20
04
20
06
20
08
20
10
20
12
Tot
al Pe
rfor
manc
e
[Tflop
/s]
US
EU
Japan
China
Others
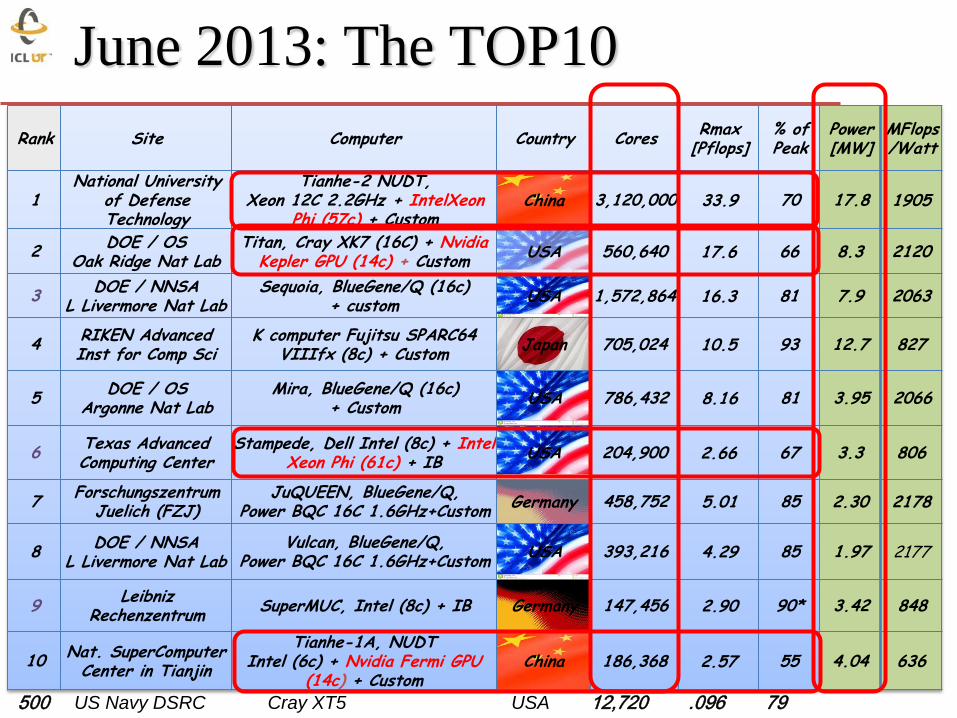
June 2013: The TOP10
Rank Site Computer Country Cores Rmax
[Pflops] % of Peak
Power [MW]
MFlops/Watt
1 National University
of Defense Technology
Tianhe-2 NUDT, Xeon 12C 2.2GHz + IntelXeon
Phi (57c) + Custom China 3,120,000 33.9 70 17.8 1905
2 DOE / OS
Oak Ridge Nat Lab Titan, Cray XK7 (16C) + Nvidia
Kepler GPU (14c) + Custom USA 560,640 17.6 66 8.3 2120
3 DOE / NNSA
L Livermore Nat Lab Sequoia, BlueGene/Q (16c)
+ custom USA 1,572,864 16.3 81 7.9 2063
4 RIKEN Advanced Inst for Comp Sci
K computer Fujitsu SPARC64 VIIIfx (8c) + Custom
Japan 705,024 10.5 93 12.7 827
5 DOE / OS
Argonne Nat Lab Mira, BlueGene/Q (16c)
+ Custom USA 786,432 8.16 81 3.95 2066
6 Texas Advanced Computing Center
Stampede, Dell Intel (8c) + Intel Xeon Phi (61c) + IB
USA 204,900 2.66 67 3.3 806
7 Forschungszentrum
Juelich (FZJ) JuQUEEN, BlueGene/Q,
Power BQC 16C 1.6GHz+Custom Germany 458,752 5.01 85 2.30 2178
8 DOE / NNSA
L Livermore Nat Lab Vulcan, BlueGene/Q,
Power BQC 16C 1.6GHz+Custom USA 393,216 4.29 85 1.97 2177
9 Leibniz
Rechenzentrum SuperMUC, Intel (8c) + IB Germany 147,456 2.90 90* 3.42 848
10 Nat. SuperComputer
Center in Tianjin
Tianhe-1A, NUDT Intel (6c) + Nvidia Fermi GPU
(14c) + Custom China 186,368 2.57 55 4.04 636
500 US Navy DSRC Cray XT5 USA 12,720 .096 79
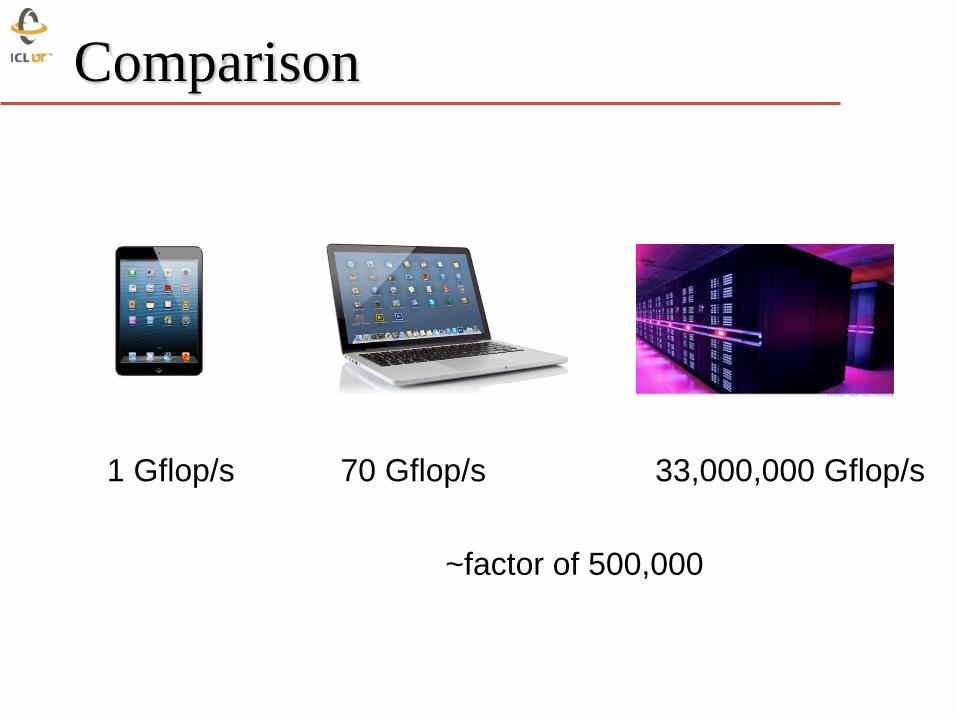
Comparison
1 Gflop/s 70 Gflop/s 33,000,000 Gflop/s
~factor of 500,000
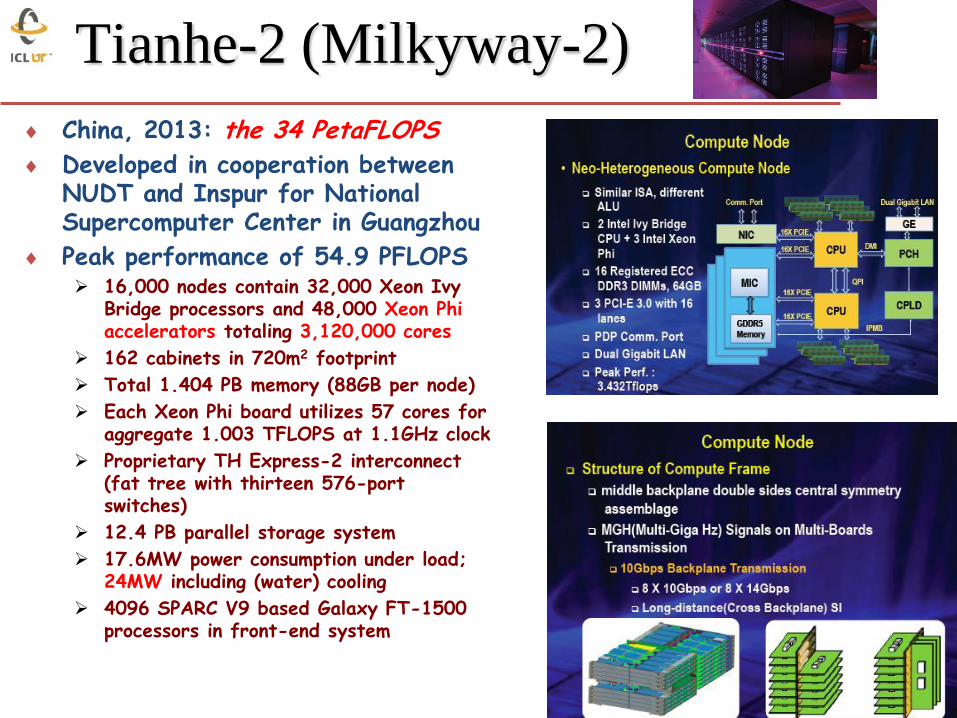
China, 2013: the 34 PetaFLOPS
Developed in cooperation between NUDT and Inspur for National Supercomputer Center in Guangzhou
Peak performance of 54.9 PFLOPS 16,000 nodes contain 32,000 Xeon Ivy
Bridge processors and 48,000 Xeon Phi accelerators totaling 3,120,000 cores
162 cabinets in 720m2 footprint
Total 1.404 PB memory (88GB per node)
Each Xeon Phi board utilizes 57 cores for aggregate 1.003 TFLOPS at 1.1GHz clock
Proprietary TH Express-2 interconnect (fat tree with thirteen 576-port switches)
12.4 PB parallel storage system
17.6MW power consumption under load; 24MW including (water) cooling
4096 SPARC V9 based Galaxy FT-1500 processors in front-end system
Tianhe-2 (Milkyway-2)
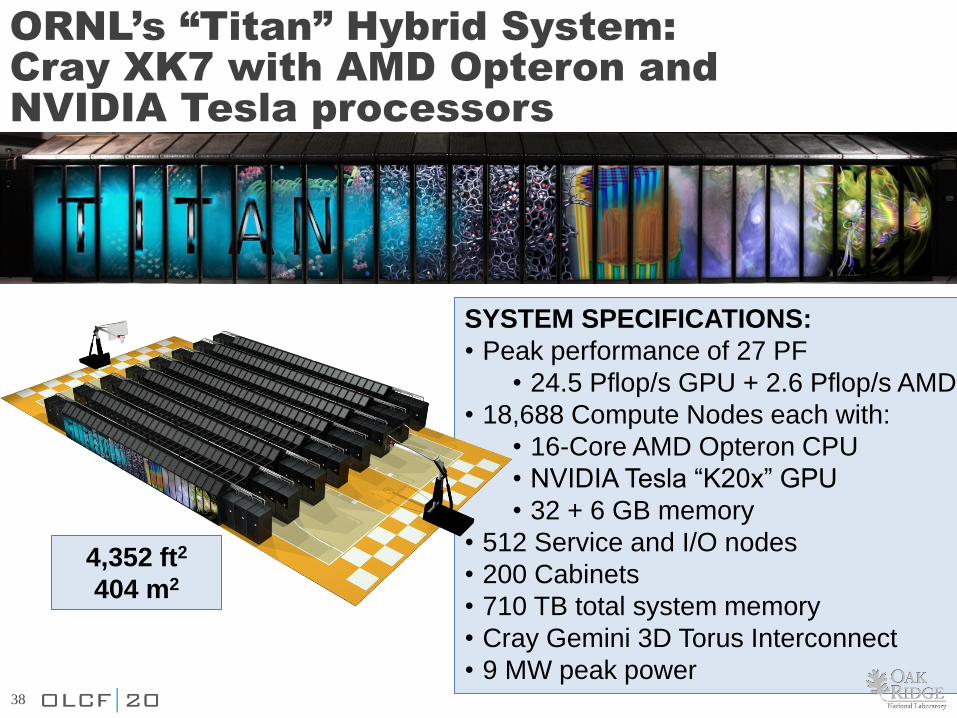
ORNL’s “Titan” Hybrid System:
Cray XK7 with AMD Opteron and
NVIDIA Tesla processors
SYSTEM SPECIFICATIONS:
• Peak performance of 27 PF
• 24.5 Pflop/s GPU + 2.6 Pflop/s AMD
• 18,688 Compute Nodes each with:
• 16-Core AMD Opteron CPU
• NVIDIA Tesla “K20x” GPU
• 32 + 6 GB memory
• 512 Service and I/O nodes
• 200 Cabinets
• 710 TB total system memory
• Cray Gemini 3D Torus Interconnect
• 9 MW peak power
4,352 ft2
404 m2
38
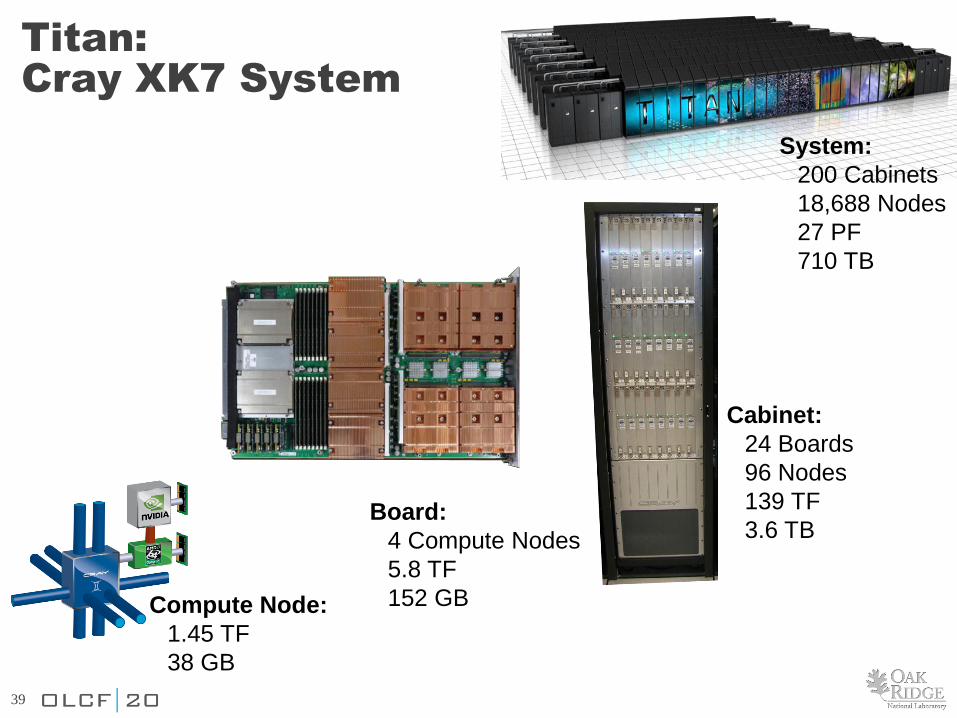
Titan:
Cray XK7 System
Board:
4 Compute Nodes
5.8 TF
152 GB
Cabinet:
24 Boards
96 Nodes
139 TF
3.6 TB
System:
200 Cabinets
18,688 Nodes
27 PF
710 TB
Compute Node:
1.45 TF
38 GB
39
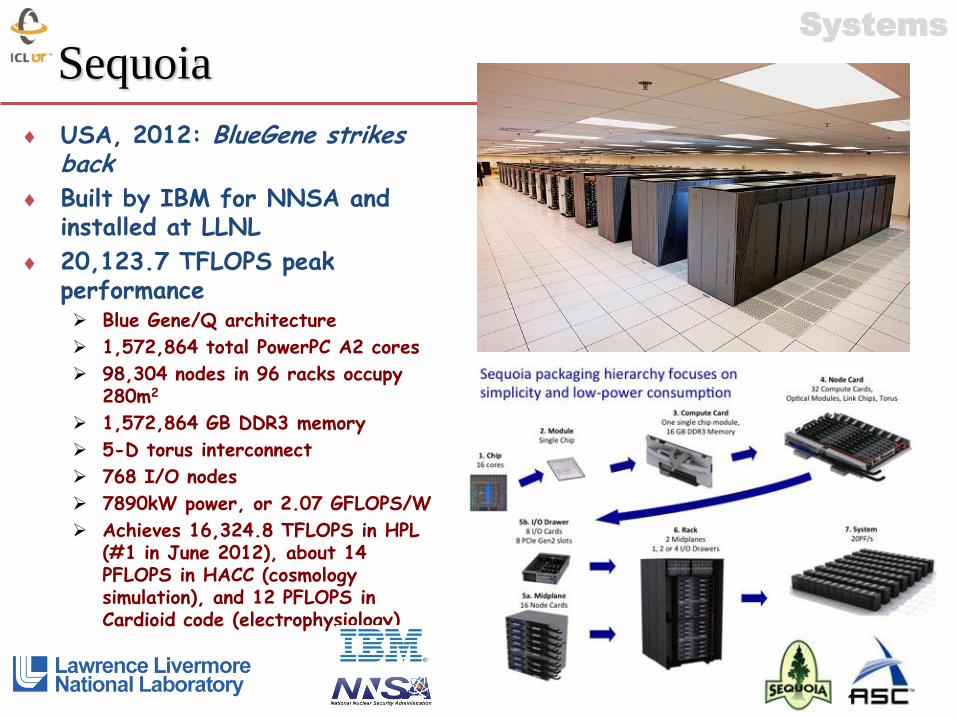
Sequoia
USA, 2012: BlueGene strikes back
Built by IBM for NNSA and installed at LLNL
20,123.7 TFLOPS peak performance Blue Gene/Q architecture
1,572,864 total PowerPC A2 cores
98,304 nodes in 96 racks occupy 280m2
1,572,864 GB DDR3 memory
5-D torus interconnect
768 I/O nodes
7890kW power, or 2.07 GFLOPS/W
Achieves 16,324.8 TFLOPS in HPL (#1 in June 2012), about 14 PFLOPS in HACC (cosmology simulation), and 12 PFLOPS in Cardioid code (electrophysiology)
Systems
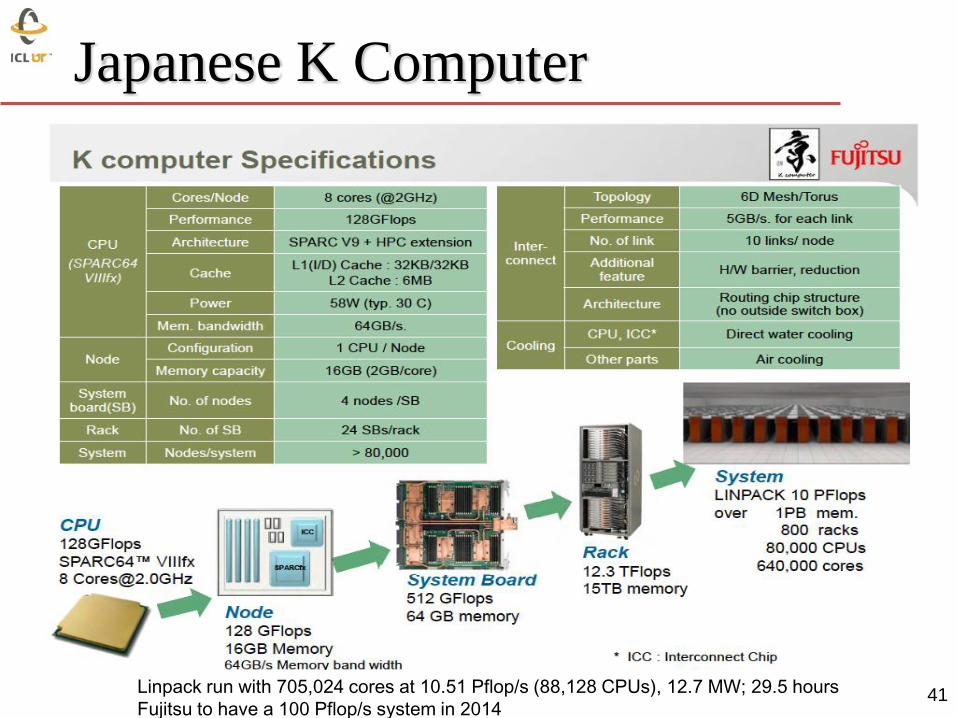
Japanese K Computer
41 Linpack run with 705,024 cores at 10.51 Pflop/s (88,128 CPUs), 12.7 MW; 29.5 hours
Fujitsu to have a 100 Pflop/s system in 2014
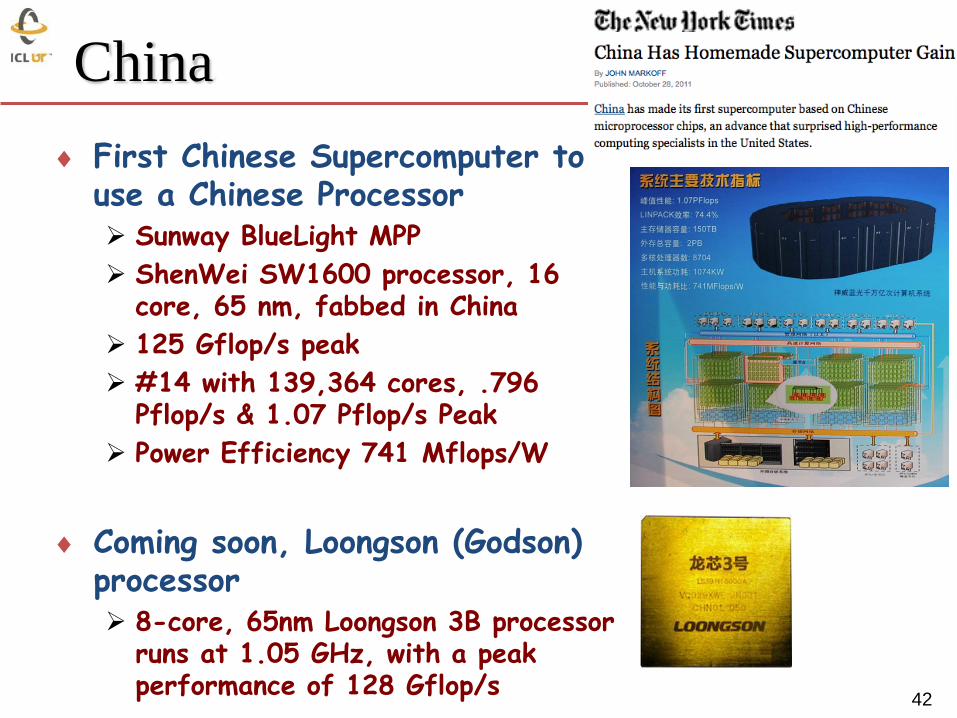
China
First Chinese Supercomputer to use a Chinese Processor Sunway BlueLight MPP
ShenWei SW1600 processor, 16 core, 65 nm, fabbed in China
125 Gflop/s peak
#14 with 139,364 cores, .796 Pflop/s & 1.07 Pflop/s Peak
Power Efficiency 741 Mflops/W
Coming soon, Loongson (Godson) processor 8-core, 65nm Loongson 3B processor
runs at 1.05 GHz, with a peak performance of 128 Gflop/s
42
43
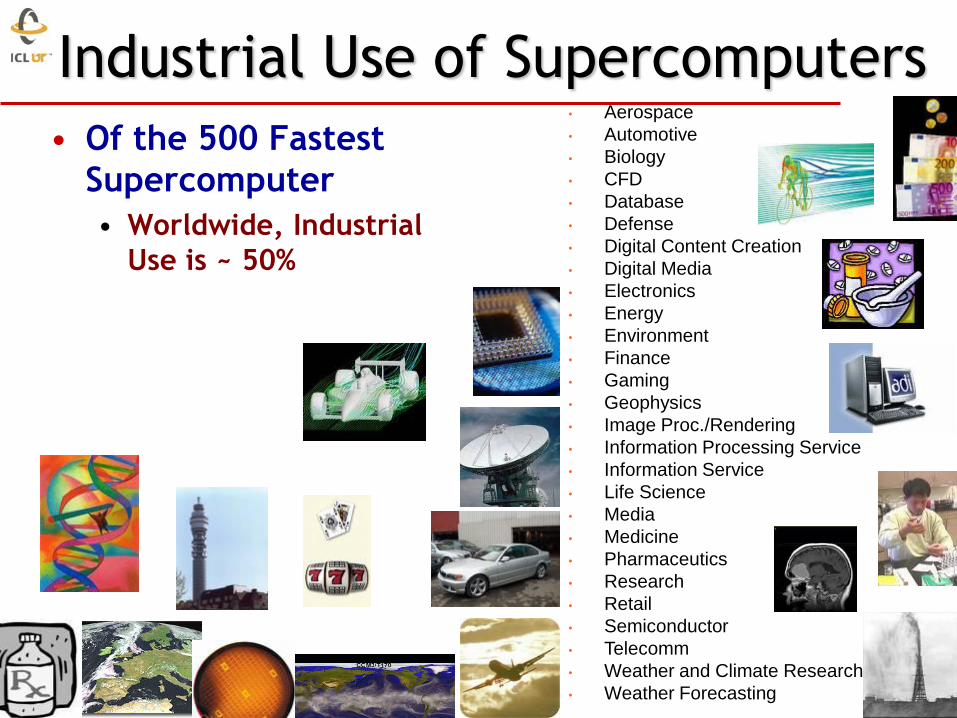
Industrial Use of Supercomputers
• Of the 500 Fastest
Supercomputer
• Worldwide, Industrial
Use is ~ 50%
• Aerospace
• Automotive
• Biology
• CFD
• Database
• Defense
• Digital Content Creation
• Digital Media
• Electronics
• Energy
• Environment
• Finance
• Gaming
• Geophysics
• Image Proc./Rendering
• Information Processing Service
• Information Service
• Life Science
• Media
• Medicine
• Pharmaceutics
• Research
• Retail
• Semiconductor
• Telecomm
• Weather and Climate Research
• Weather Forecasting
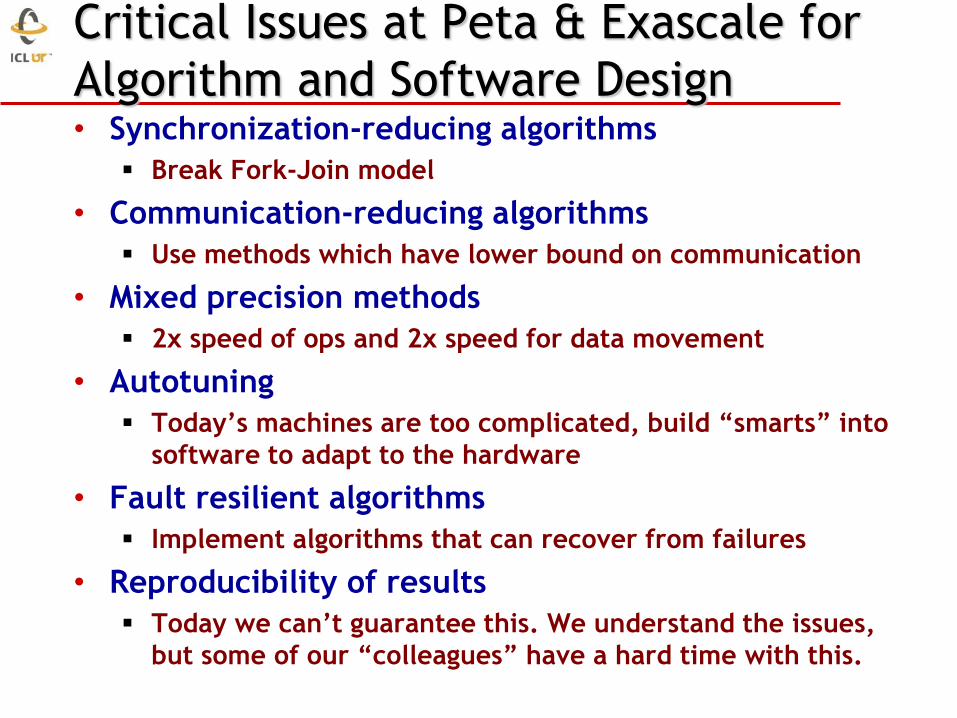
Critical Issues at Peta & Exascale for
Algorithm and Software Design • Synchronization-reducing algorithms
Break Fork-Join model
• Communication-reducing algorithms
Use methods which have lower bound on communication
• Mixed precision methods
2x speed of ops and 2x speed for data movement
• Autotuning
Today’s machines are too complicated, build “smarts” into
software to adapt to the hardware
• Fault resilient algorithms
Implement algorithms that can recover from failures
• Reproducibility of results
Today we can’t guarantee this. We understand the issues,
but some of our “colleagues” have a hard time with this.
Conclusions
• For the last decade or more, the research
investment strategy has been
overwhelmingly biased in favor of hardware.
• This strategy needs to be rebalanced -
barriers to progress are increasingly on the
software side.
• Moreover, the return on investment is more
favorable to software.
Hardware has a half-life measured in years, while
software has a half-life measured in decades. • High Performance Ecosystem out of balance
Hardware, OS, Compilers, Software, Algorithms, Applications • No Moore’s Law for software, algorithms and applications