Embed Size (px)
Citation preview
EMGS ASA – FOURTH QUARTER PRESENTATION 2012
CEO, Roar BekkerCFO, Svein Knudsen Hotel Continental, 7 February 2013
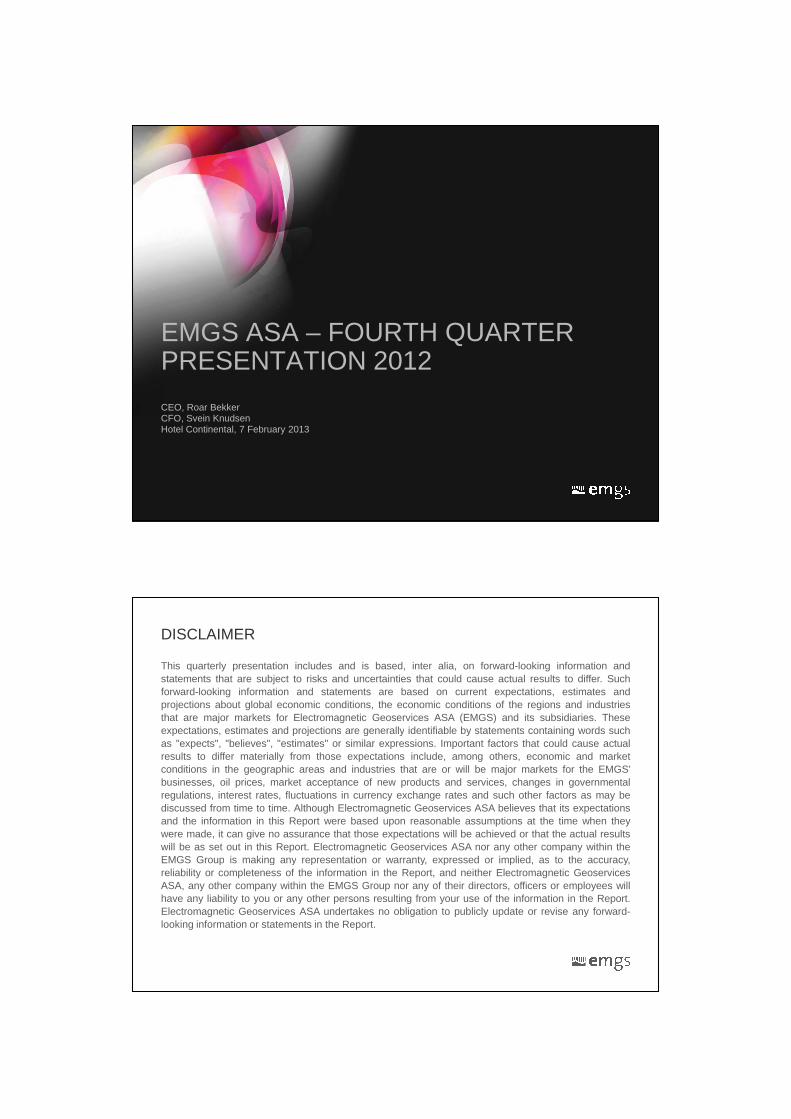
DISCLAIMER
This quarterly presentation includes and is based, inter alia, on forward-looking information andstatements that are subject to risks and uncertainties that could cause actual results to differ. Suchforward-looking information and statements are based on current expectations, estimates andprojections about global economic conditions, the economic conditions of the regions and industriesthat are major markets for Electromagnetic Geoservices ASA (EMGS) and its subsidiaries. Theseexpectations, estimates and projections are generally identifiable by statements containing words suchexpectations, estimates and projections are generally identifiable by statements containing words suchas "expects", "believes", "estimates" or similar expressions. Important factors that could cause actualresults to differ materially from those expectations include, among others, economic and marketconditions in the geographic areas and industries that are or will be major markets for the EMGS’businesses, oil prices, market acceptance of new products and services, changes in governmentalregulations, interest rates, fluctuations in currency exchange rates and such other factors as may bediscussed from time to time. Although Electromagnetic Geoservices ASA believes that its expectationsand the information in this Report were based upon reasonable assumptions at the time when theywere made, it can give no assurance that those expectations will be achieved or that the actual resultswill be as set out in this Report. Electromagnetic Geoservices ASA nor any other company within theEMGS Group is making any representation or warranty, expressed or implied, as to the accuracy,EMGS Group is making any representation or warranty, expressed or implied, as to the accuracy,reliability or completeness of the information in the Report, and neither Electromagnetic GeoservicesASA, any other company within the EMGS Group nor any of their directors, officers or employees willhave any liability to you or any other persons resulting from your use of the information in the Report.Electromagnetic Geoservices ASA undertakes no obligation to publicly update or revise any forward-looking information or statements in the Report.
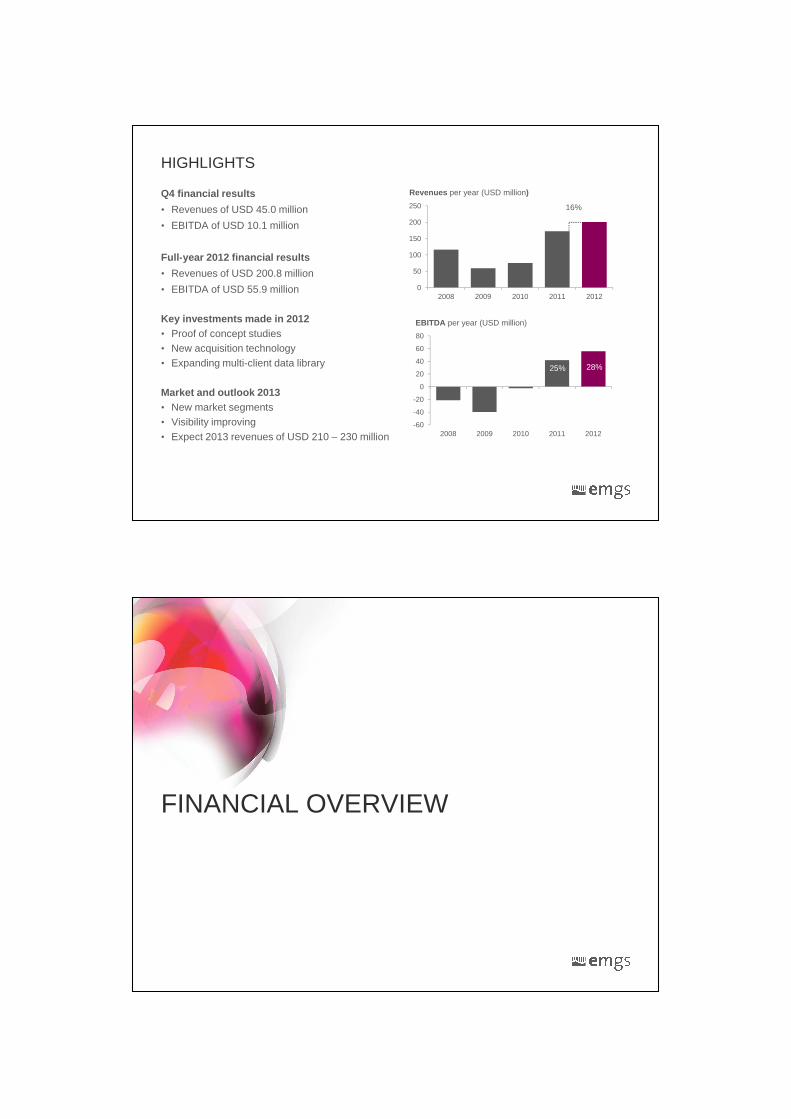
HIGHLIGHTS
Q4 financial results
• Revenues of USD 45.0 million
• EBITDA of USD 10.1 million
Full-year 2012 financial results 100
150
200
250
Revenues per year (USD million)
16%
Full-year 2012 financial results
• Revenues of USD 200.8 million
• EBITDA of USD 55.9 million
Key investments made in 2012• Proof of concept studies• New acquisition technology• Expanding multi-client data library
Market and outlook 2013
0
50
100
2008 2009 2010 2011 2012
0
20
40
60
80
EBITDA per year (USD million)
28%25%
Market and outlook 2013 • New market segments• Visibility improving • Expect 2013 revenues of USD 210 – 230 million
-60
-40
-20
0
2008 2009 2010 2011 2012
FINANCIAL OVERVIEW
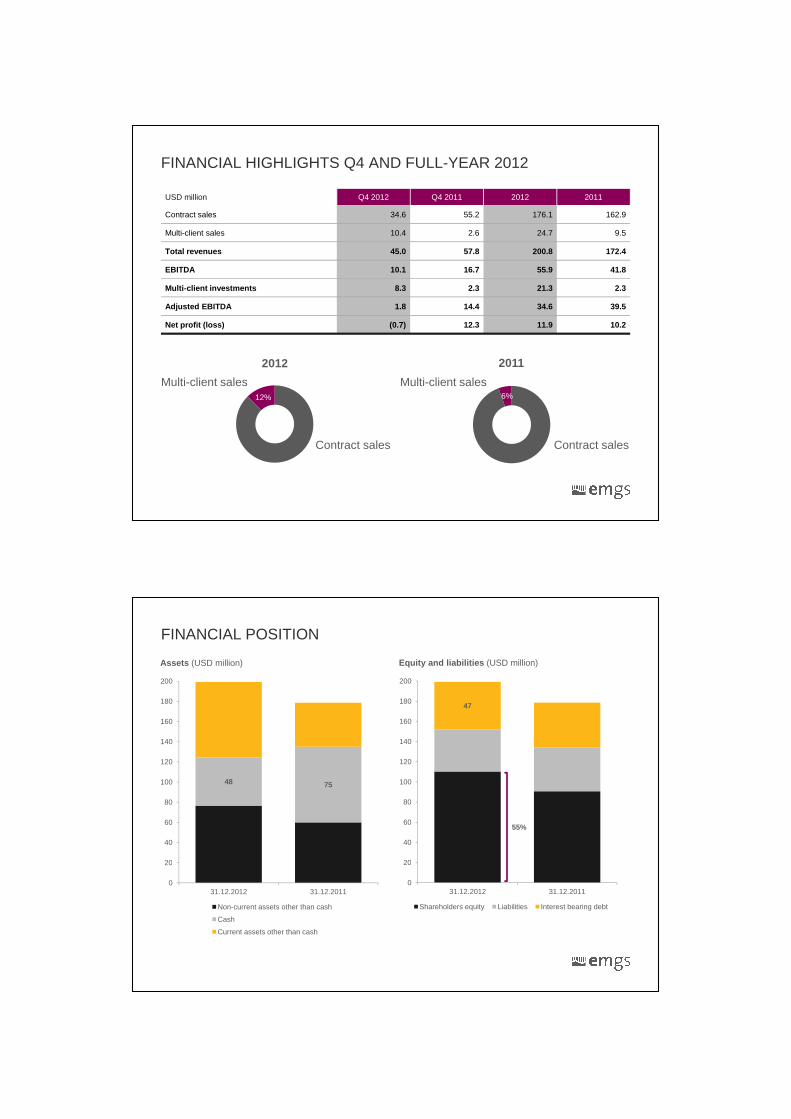
FINANCIAL HIGHLIGHTS Q4 AND FULL-YEAR 2012
USD million Q4 2012 Q4 2011 2012 2011
Contract sales 34.6 55.2 176.1 162.9
Multi-client sales 10.4 2.6 24.7 9.5
Total revenues 45.0 57.8 200.8 172.4
EBITDA 10.1 16.7 55.9 41.8
Multi-client investments 8.3 2.3 21.3 2.3
Adjusted EBITDA 1.8 14.4 34.6 39.5
Net profit (loss) (0.7) 12.3 11.9 10.2
2012 2011
Multi-client sales Multi-client sales12% 6%
Contract sales Contract sales
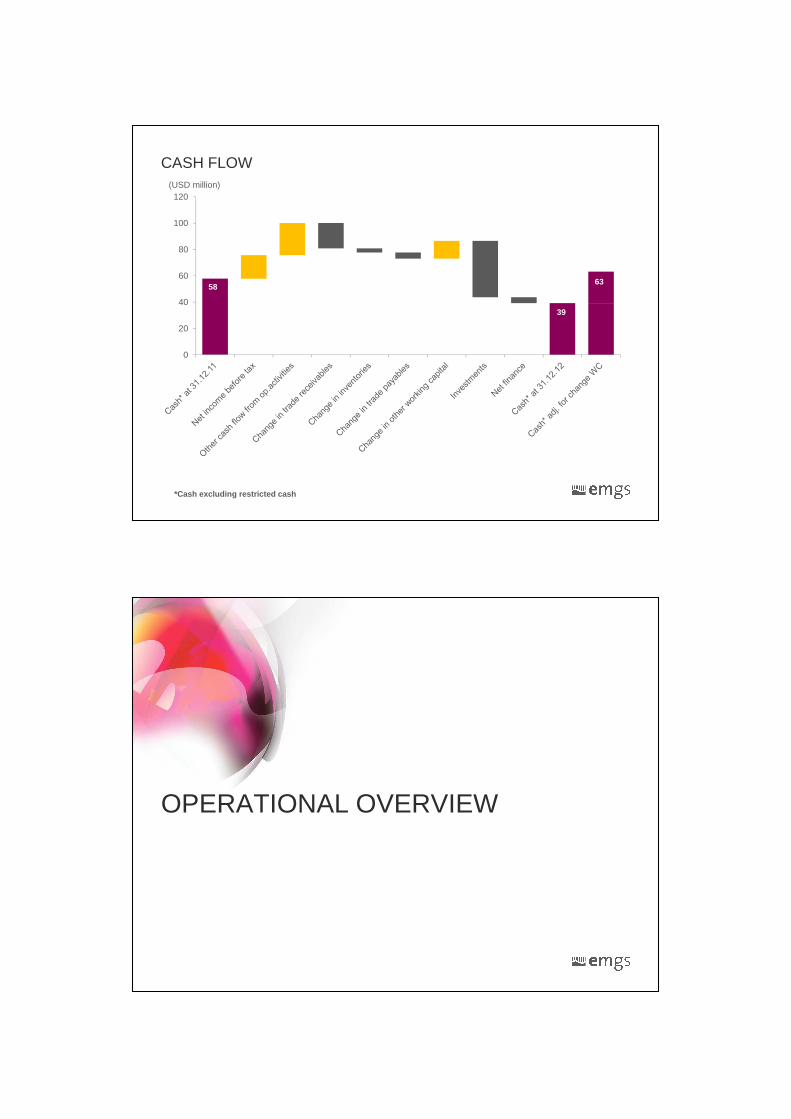
FINANCIAL POSITION
Equity and liabilities (USD million)
160
180
200
Assets (USD million)
47
160
180
200
48 75
20
40
60
80
100
120
140
20
40
60
80
100
120
140
55%
0
20
31.12.2012 31.12.2011
Non-current assets other than cash
Cash
Current assets other than cash
0
20
31.12.2012 31.12.2011
Shareholders equity Liabilities Interest bearing debt
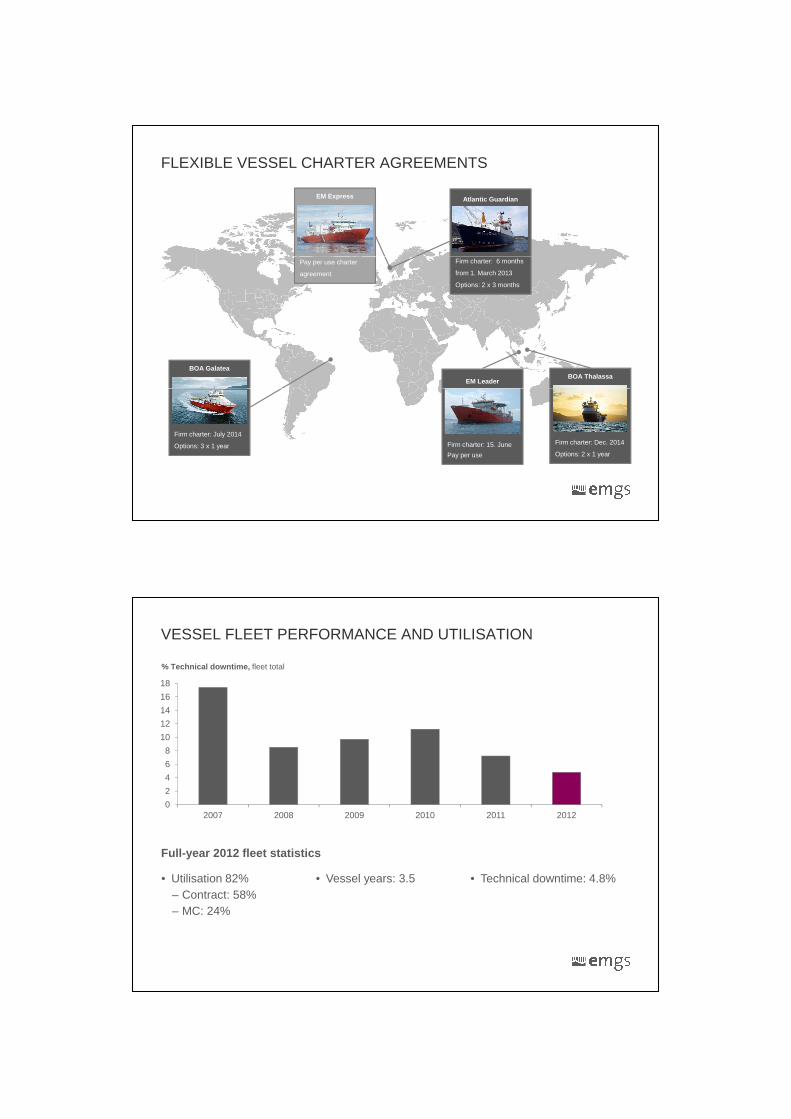
CASH FLOW
80
100
120(USD million)
0
20
40
6058
63
39
*Cash excluding restricted cash
OPERATIONAL OVERVIEW
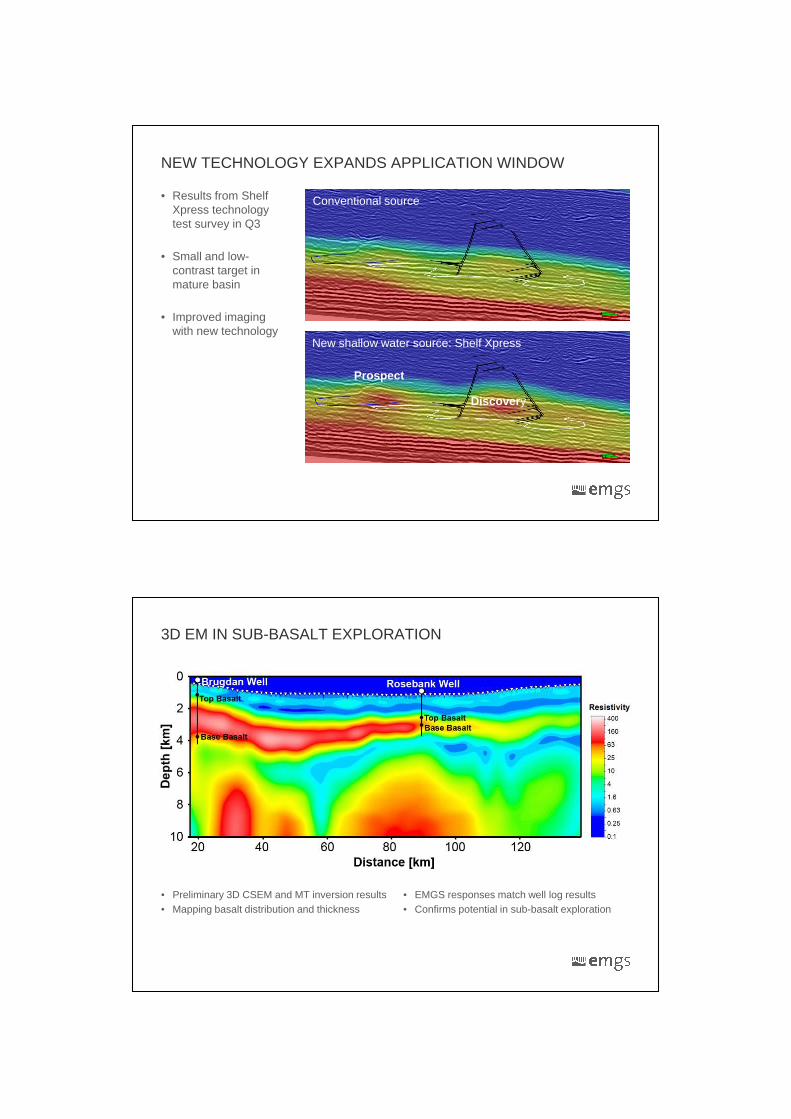
FLEXIBLE VESSEL CHARTER AGREEMENTS
EM Express Atlantic Guardian
BOA ThalassaBOA Galatea
EM Leader
Pay per use charter
agreement
Firm charter: 6 months
from 1. March 2013
Options: 2 x 3 months
Firm charter: Dec. 2014
Options: 2 x 1 year
Firm charter: July 2014
Options: 3 x 1 year Firm charter: 15. June
Pay per use
VESSEL FLEET PERFORMANCE AND UTILISATION
12
14
16
18
% Technical downtime, fleet total
Full-year 2012 fleet statistics
0
2
4
6
8
10
2007 2008 2009 2010 2011 2012
• Utilisation 82%– Contract: 58%– MC: 24%
• Vessel years: 3.5 • Technical downtime: 4.8%
NEW TECHNOLOGY EXPANDS APPLICATION WINDOW
• Results from Shelf Xpress technology test survey in Q3
• Small and low-
Conventional source
• Small and low-contrast target in mature basin
• Improved imaging with new technology
Prospect
New shallow water source: Shelf Xpress
Discovery
3D EM IN SUB-BASALT EXPLORATION
• Preliminary 3D CSEM and MT inversion results• Mapping basalt distribution and thickness
• EMGS responses match well log results• Confirms potential in sub-basalt exploration
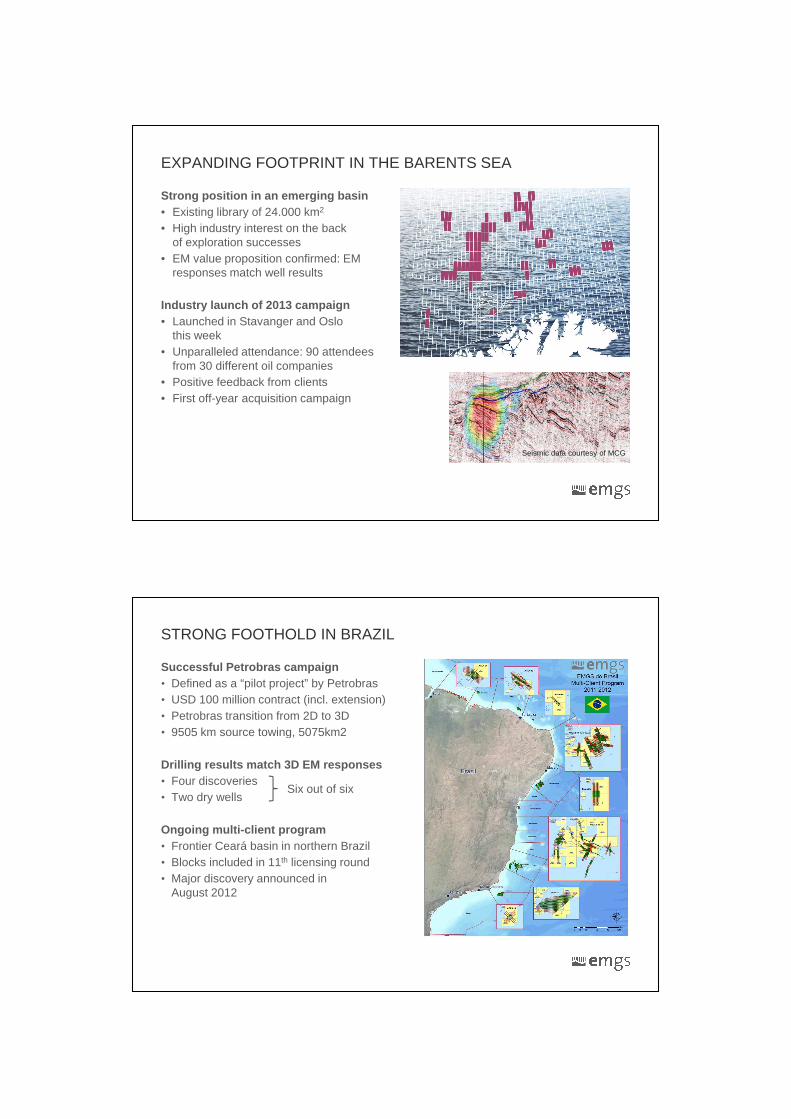
EXPANDING FOOTPRINT IN THE BARENTS SEA
Strong position in an emerging basin• Existing library of 24.000 km2
• High industry interest on the back of exploration successes
• EM value proposition confirmed: EM • EM value proposition confirmed: EM responses match well results
Industry launch of 2013 campaign• Launched in Stavanger and Oslo
this week• Unparalleled attendance: 90 attendees
from 30 different oil companies • Positive feedback from clients • First off-year acquisition campaign
Seismic data courtesy of Spectrum
Seismic data courtesy of MCG
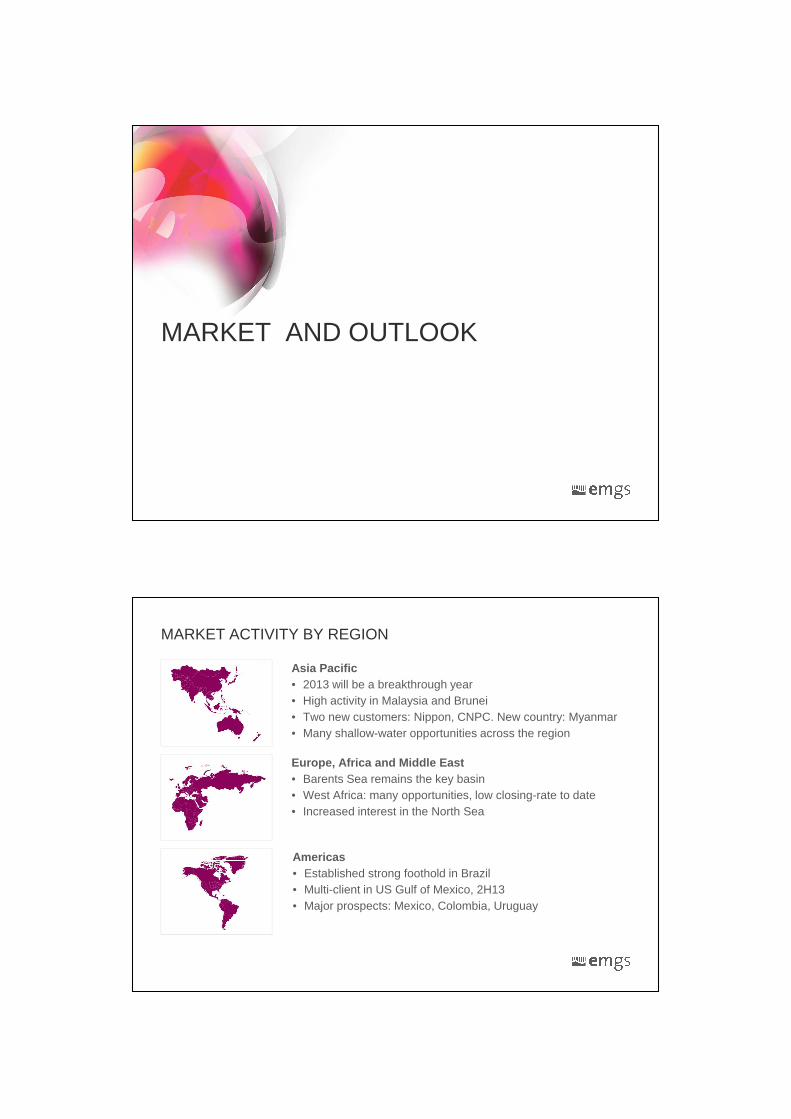
STRONG FOOTHOLD IN BRAZIL
Successful Petrobras campaign• Defined as a “pilot project” by Petrobras• USD 100 million contract (incl. extension)• Petrobras transition from 2D to 3D• 9505 km source towing, 5075km2• 9505 km source towing, 5075km2
Drilling results match 3D EM responses • Four discoveries • Two dry wells
Ongoing multi-client program• Frontier Ceará basin in northern Brazil• Blocks included in 11th licensing round
Six out of six
• Blocks included in 11th licensing round• Major discovery announced in
August 2012
MARKET AND OUTLOOK
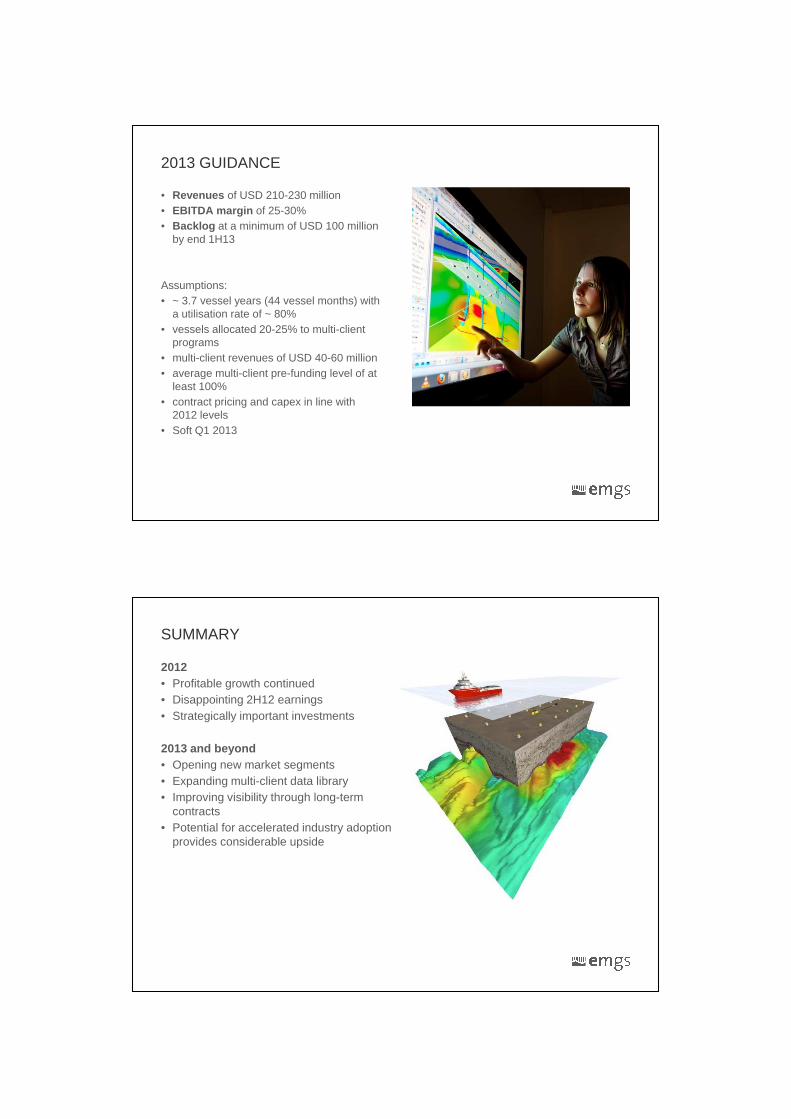
MARKET ACTIVITY BY REGION
Asia Pacific• 2013 will be a breakthrough year• High activity in Malaysia and Brunei• Two new customers: Nippon, CNPC. New country: Myanmar• Many shallow-water opportunities across the region• Many shallow-water opportunities across the region
Americas
Europe, Africa and Middle East• Barents Sea remains the key basin• West Africa: many opportunities, low closing-rate to date• Increased interest in the North Sea
Americas• Established strong foothold in Brazil• Multi-client in US Gulf of Mexico, 2H13• Major prospects: Mexico, Colombia, Uruguay
Q4 2012 Q1 2013 Q2 2013 Q3 2013
Oct Nov Dec Jan Feb Mar Apr May June July Aug Sept
VESSEL ACTIVITY AND BACKLOG
Proof of concept
Expected vessel schedule as of 7 February 2013.
BOA Thalassa
BOA Galatea
Atlantic Guardian
EM Leader
Petrobras
Norway
Proof of conceptUS Gulf of Mexico
Brunei
Brazil
Basalt WoS/NCS
Barents Sea multi-client / contract
Brazil
Asia
Brazil
Malaysia Myanmar Malaysia
EM Express
Contract: Multi-client: Contract negotiations: Steaming:
Norway
Dry dock:
(Standby at no cost in Bergen)
IMPROVING VISIBILITY
100
120
Building backlog is job number 1• As expected, backlog has diminished in
2012 due to completion of large contracts• Awarded 6-month contract and string of
small contracts in Asia
Order book (USD Million)
0
20
40
60
80
small contracts in Asia
Pursuing long-term contracts• Expect at least one long-term NOC
contract for 2H13• Targeting additional NOCs for major
projects in 2H13 and 2014
Partnering with seismic providers
21
54
• Increased interest from several companies• Joint multi-client projects for 2013
2013 GUIDANCE
• Revenues of USD 210-230 million• EBITDA margin of 25-30% • Backlog at a minimum of USD 100 million
by end 1H13
Assumptions:• ~ 3.7 vessel years (44 vessel months) with
a utilisation rate of ~ 80%• vessels allocated 20-25% to multi-client
programs• multi-client revenues of USD 40-60 million• average multi-client pre-funding level of at
least 100% least 100% • contract pricing and capex in line with
2012 levels• Soft Q1 2013
SUMMARY
2012• Profitable growth continued• Disappointing 2H12 earnings• Strategically important investments
2013 and beyond• Opening new market segments• Expanding multi-client data library• Improving visibility through long-term
contracts• Potential for accelerated industry adoption
provides considerable upside
APPENDIX
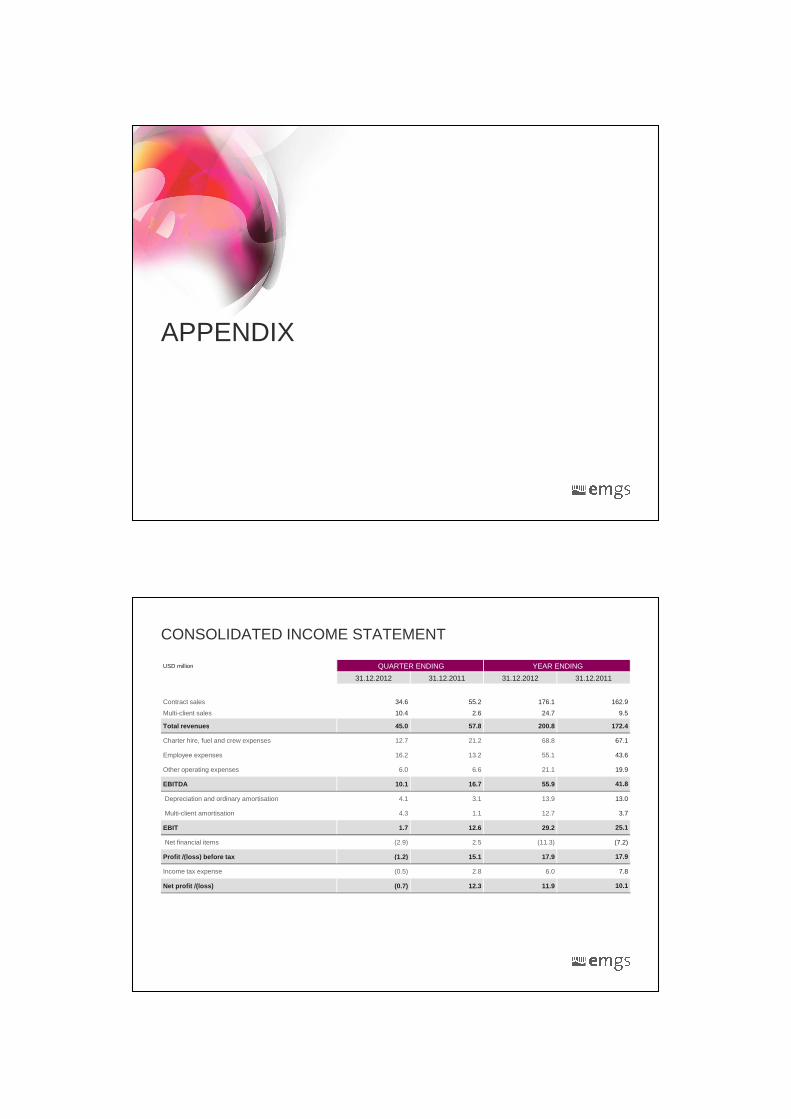
CONSOLIDATED INCOME STATEMENT
USD million QUARTER ENDING YEAR ENDING
31.12.2012 31.12.2011 31.12.2012 31.12.2011
Contract sales 34.6 55.2 176.1 162.9
Multi-client sales 10.4 2.6 24.7 9.5
Total revenues 45.0 57.8 200.8 172.4Total revenues 45.0 57.8 200.8 172.4
Charter hire, fuel and crew expenses 12.7 21.2 68.8 67.1
Employee expenses 16.2 13.2 55.1 43.6
Other operating expenses 6.0 6.6 21.1 19.9
EBITDA 10.1 16.7 55.9 41.8
Depreciation and ordinary amortisation 4.1 3.1 13.9 13.0
Multi-client amortisation 4.3 1.1 12.7 3.7
EBIT 1.7 12.6 29.2 25.1
Net financial items (2.9) 2.5 (11.3) (7.2)
Profit /(loss) before tax (1.2) 15.1 17.9 17.9
Income tax expense (0.5) 2.8 6.0 7.8
Net profit /(loss) (0.7) 12.3 11.9 10.1
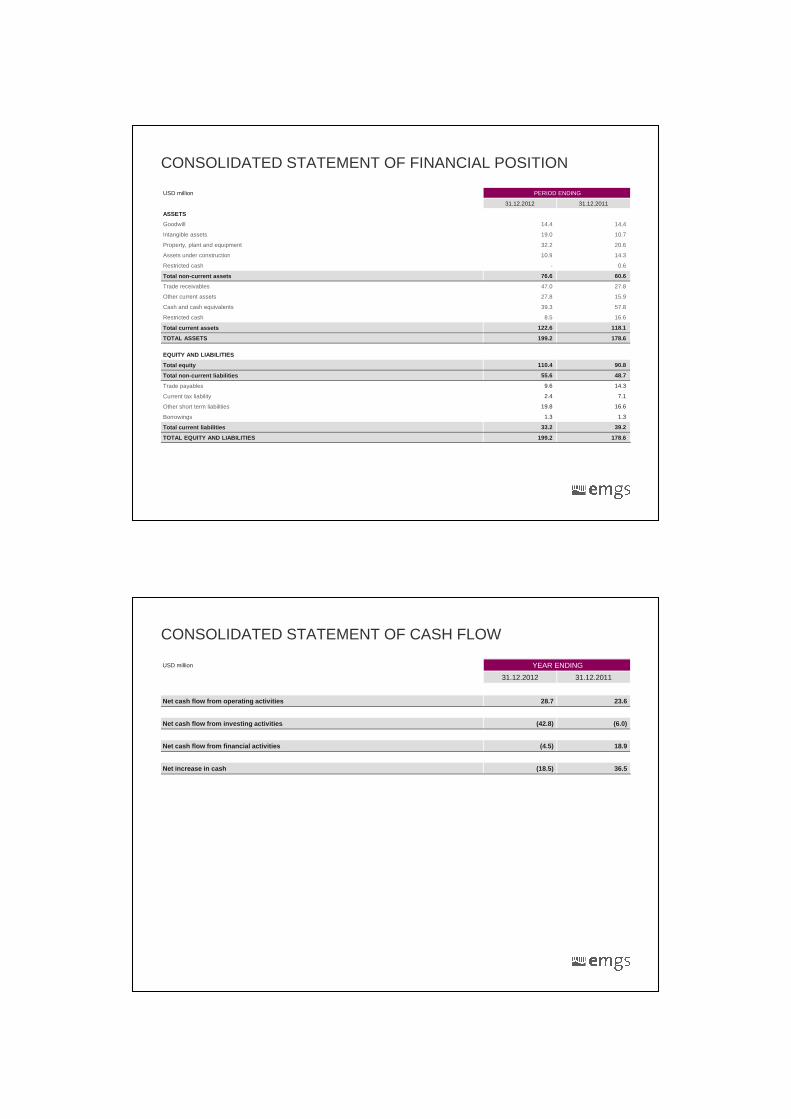
CONSOLIDATED STATEMENT OF FINANCIAL POSITION
USD million PERIOD ENDING
31.12.2012 31.12.2011
ASSETS
Goodwill 14.4 14,4
Intangible assets 19.0 10.7
Property, plant and equipment 32.2 20.6
Assets under construction 10.9 14.3Assets under construction 10.9 14.3
Restricted cash - 0.6
Total non-current assets 76.6 60.6
Trade receivables 47.0 27.8
Other current assets 27.8 15.9
Cash and cash equivalents 39.3 57.8
Restricted cash 8.5 16.6
Total current assets 122.6 118.1
TOTAL ASSETS 199.2 178.6
EQUITY AND LIABILITIES
Total equity 110.4 90.8
Total non-current liabilities 55.6 48.7
Trade payables 9.6 14.3Trade payables
Current tax liability 2.4 7.1
Other short term liabilities 19.8 16.6
Borrowings 1.3 1.3
Total current liabilities 33.2 39.2
TOTAL EQUITY AND LIABILITIES 199.2 178.6
CONSOLIDATED STATEMENT OF CASH FLOW
USD million YEAR ENDING
31.12.2012 31.12.2011
Net cash flow from operating activities 28.7 23.6
Net cash flow from investing activities (42.8) (6.0)
Net cash flow from financial activities (4.5) 18.9
Net increase in cash (18.5) 36.5
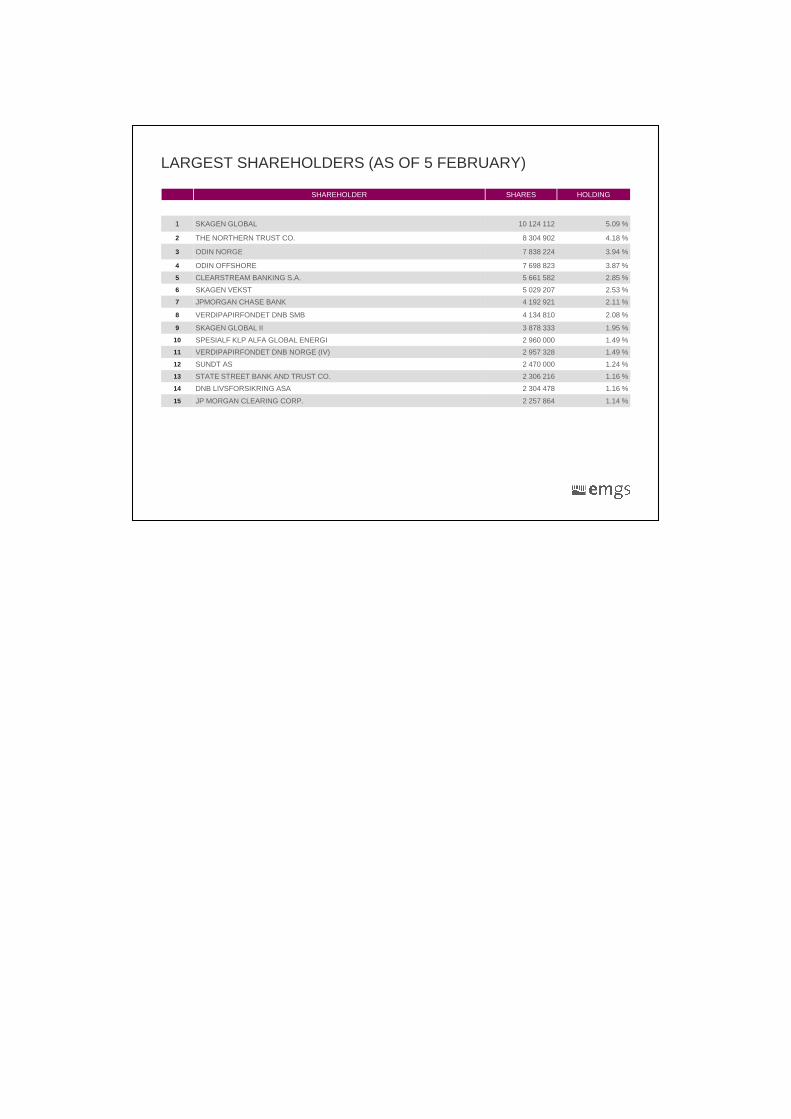
LARGEST SHAREHOLDERS (AS OF 5 FEBRUARY)
SHAREHOLDER SHARES HOLDING
1 SKAGEN GLOBAL 10 124 112 5.09 %
2 THE NORTHERN TRUST CO. 8 304 902 4.18 %
3 ODIN NORGE 7 838 224 3.94 %
4 ODIN OFFSHORE 7 698 823 3.87 %
5 CLEARSTREAM BANKING S.A. 5 661 582 2.85 %
6 SKAGEN VEKST 5 029 207 2.53 %
7 JPMORGAN CHASE BANK 4 192 921 2.11 %
8 VERDIPAPIRFONDET DNB SMB 4 134 810 2.08 %
9 SKAGEN GLOBAL II 3 878 333 1.95 %
10 SPESIALF KLP ALFA GLOBAL ENERGI 2 960 000 1.49 %
11 VERDIPAPIRFONDET DNB NORGE (IV) 2 957 328 1.49 %
12 SUNDT AS 2 470 000 1.24 %
13 STATE STREET BANK AND TRUST CO. 2 306 216 1.16 %
14 DNB LIVSFORSIKRING ASA 2 304 478 1.16 %14 DNB LIVSFORSIKRING ASA 2 304 478 1.16 %
15 JP MORGAN CLEARING CORP. 2 257 864 1.14 %