Embed Size (px)
Citation preview
Emigration behavior of resident and anadromous juvenile O. mykiss:
exploring the interaction among genetics, physiology and habitat
Sean Hayes, Chad Hanson, Morgan Bond, Devon Pearse, Andrew Jones, Carlos Garza, Bruce MacFarlane
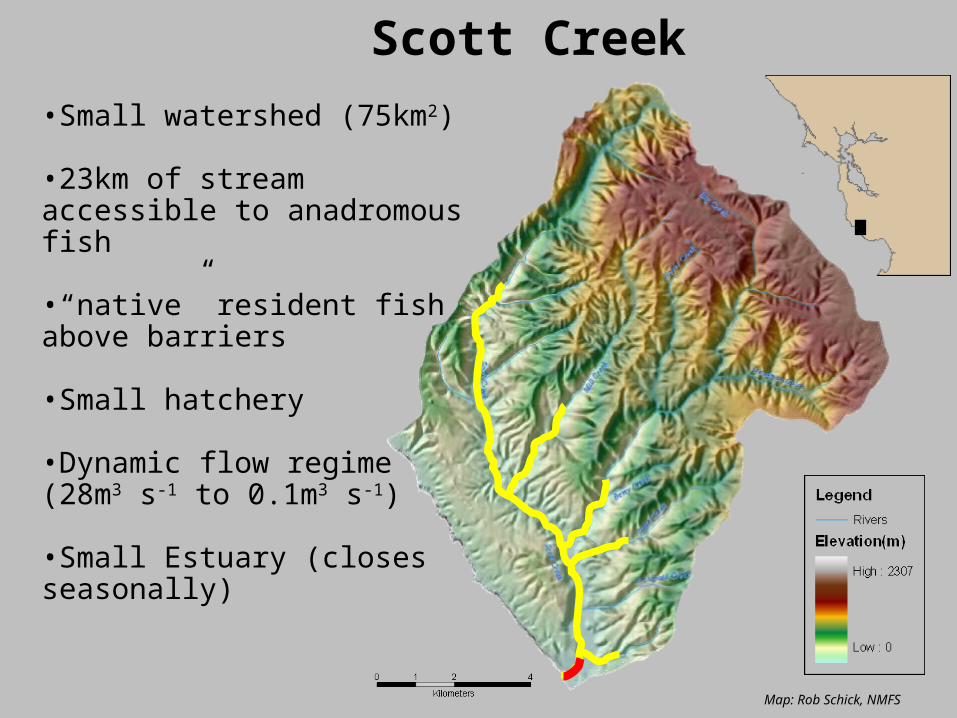
•Small watershed (75km2)
•23km of stream accessible to anadromous fish
•“native” resident fish above barriers
•Small hatchery
•Dynamic flow regime(28m3 s-1 to 0.1m3 s-1)
•Small Estuary (closes seasonally)
Scott Creek
Map: Rob Schick, NMFS
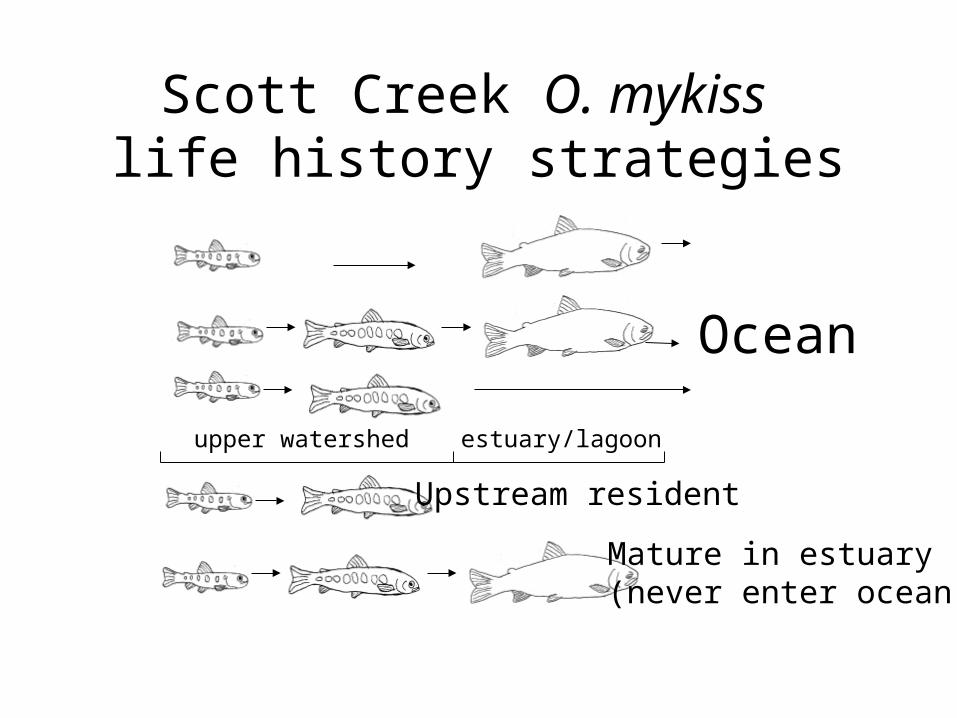
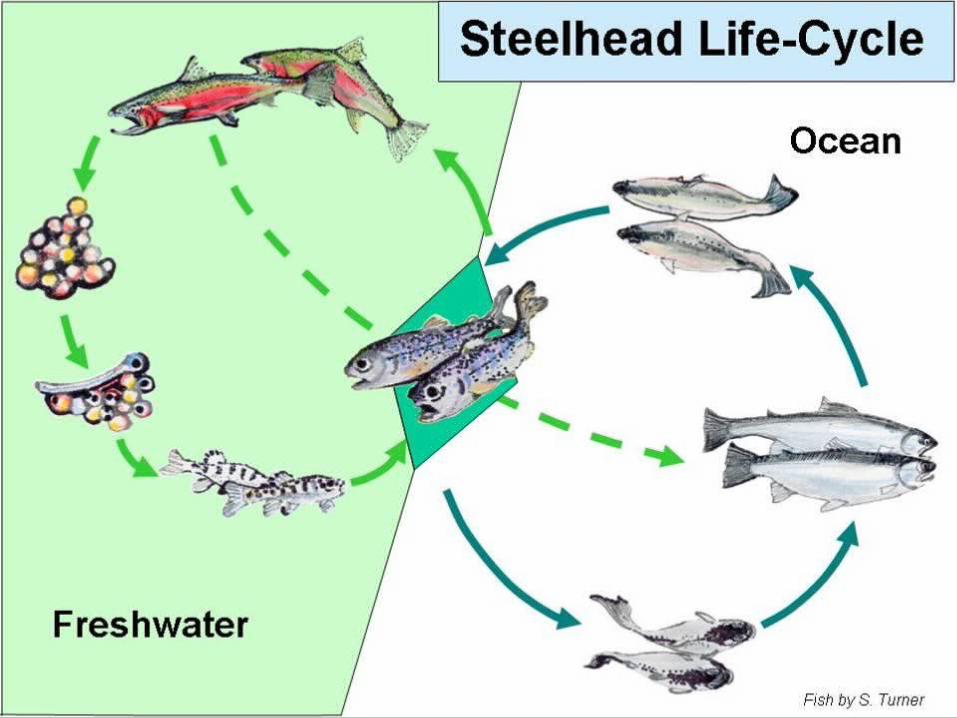
Scott Creek O. mykiss life history strategies
Ocean
upper watershed estuary/lagoon
Upstream resident
Mature in estuary(never enter ocean)
xx
x
3 km
Adultweir
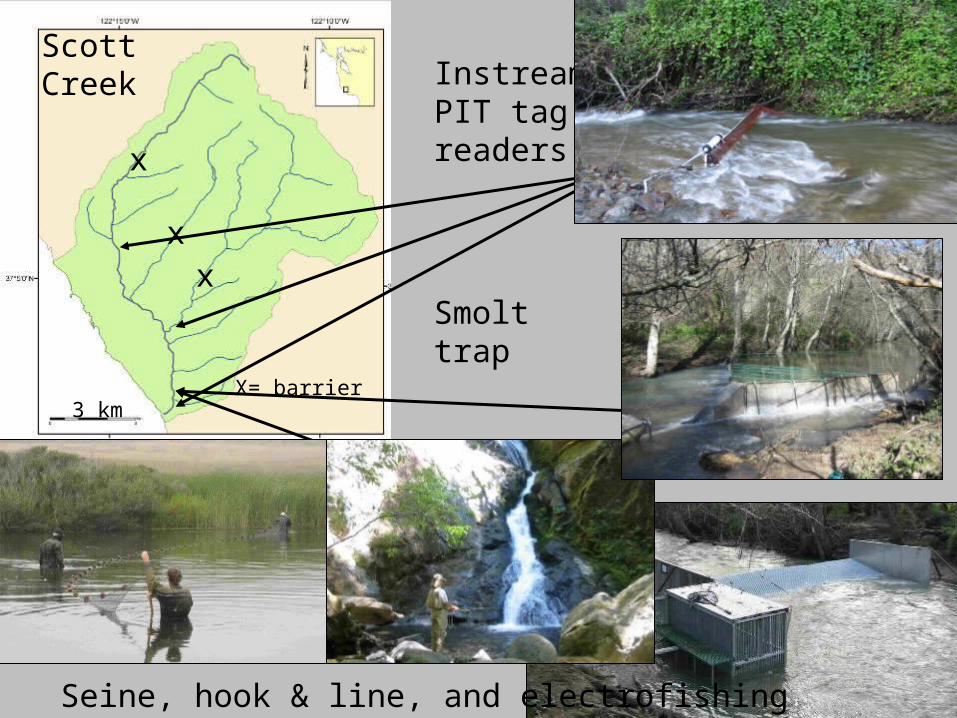
InstreamPIT tagreaders
Scott Creek
X= barrier
Seine, hook & line, and electrofishing
Smolttrap
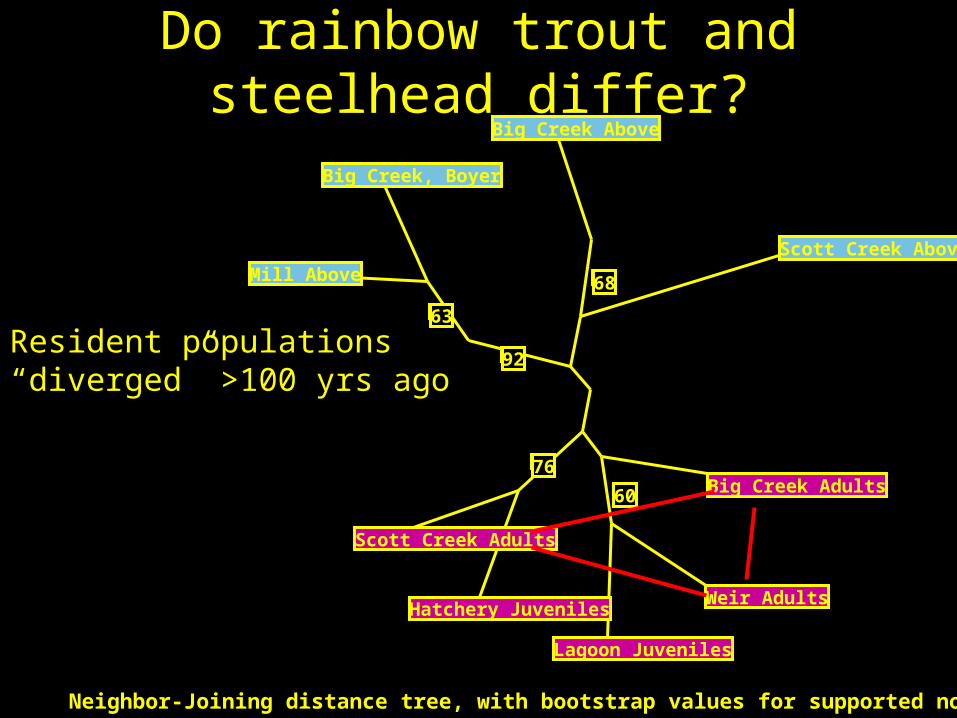
Resident populations“diverged” >100 yrs ago
Big Creek Adults
Weir Adults
Lagoon Juveniles
60
Hatchery Juveniles
Scott Creek Adults
76
Mill Above
Big Creek, Boyer
63
92
Big Creek Above
68
Scott Creek Above
Neighbor-Joining distance tree, with bootstrap values for supported nodes
Do rainbow trout and steelhead differ?
xx
x?
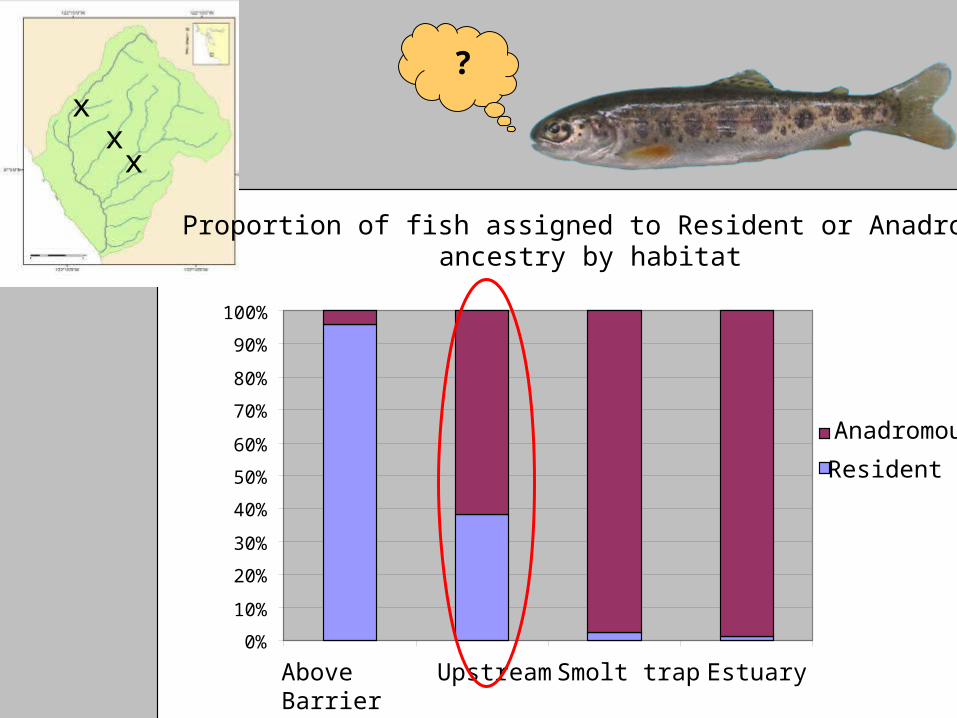
Proportion of fish assigned to Resident or Anadromous ancestry by habitat
0%
10%
20%
30%
40%
50%
60%
70%
80%
90%
100%
Above Barrier
Upstream Smolt trap Estuary
Anadromous
Resident
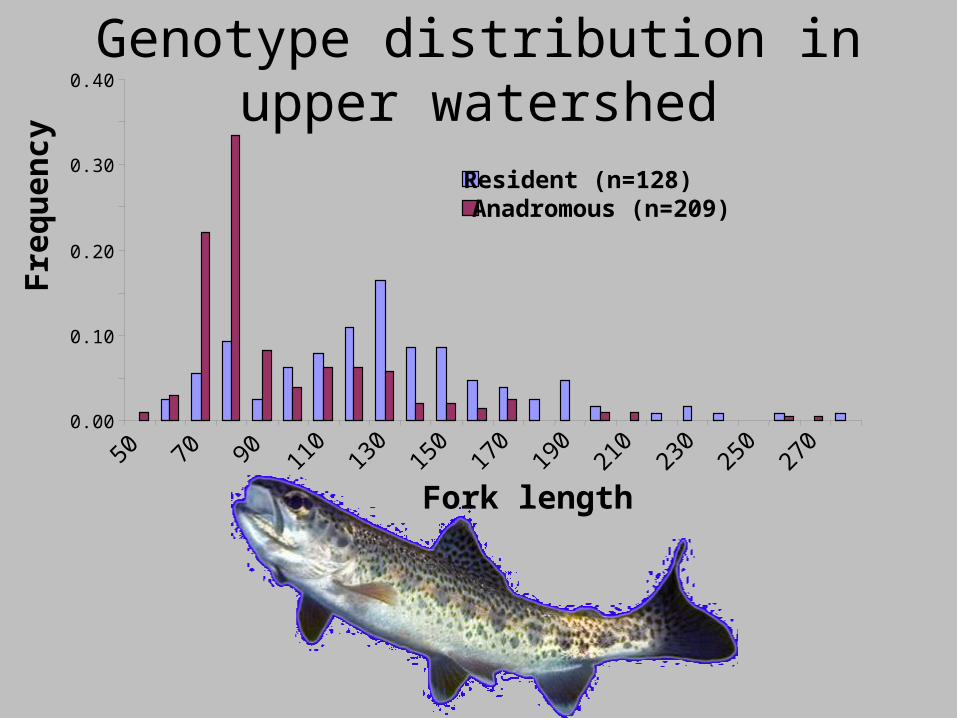
Genotype distribution in upper watershed
0.00
0.10
0.20
0.30
0.40
50 70 90 110
130
150
170
190
210
230
250
270
Fork length
Fre
qu
ency
Resident (n=128)Anadromous (n=209)
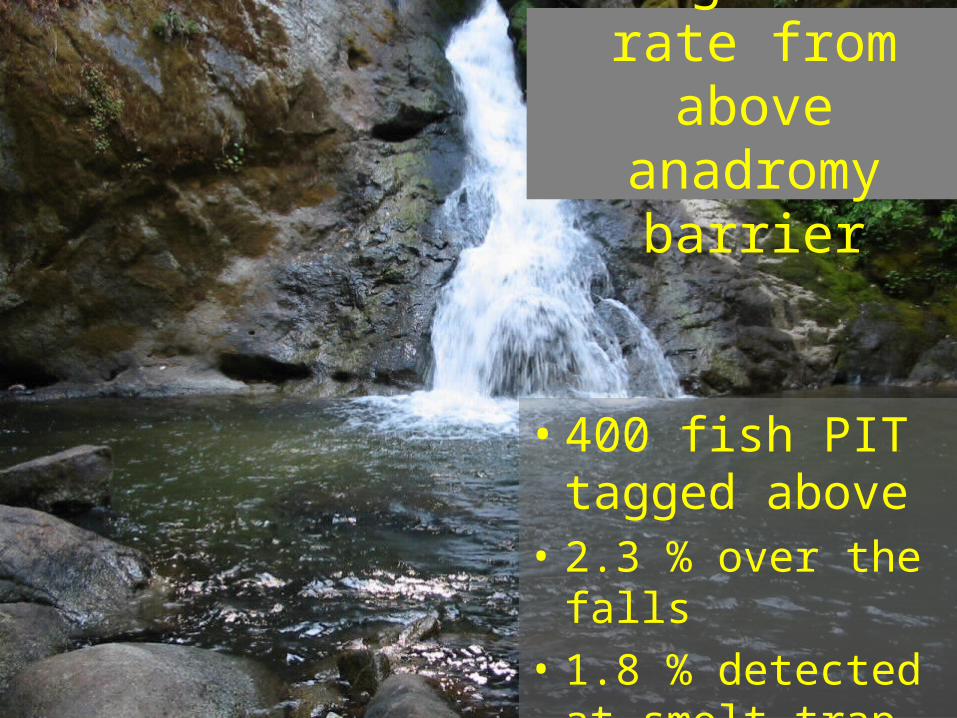
Emigration rate from above
anadromy barrier
• 400 fish PIT tagged above
• 2.3 % over the falls
• 1.8 % detected at smolt trap
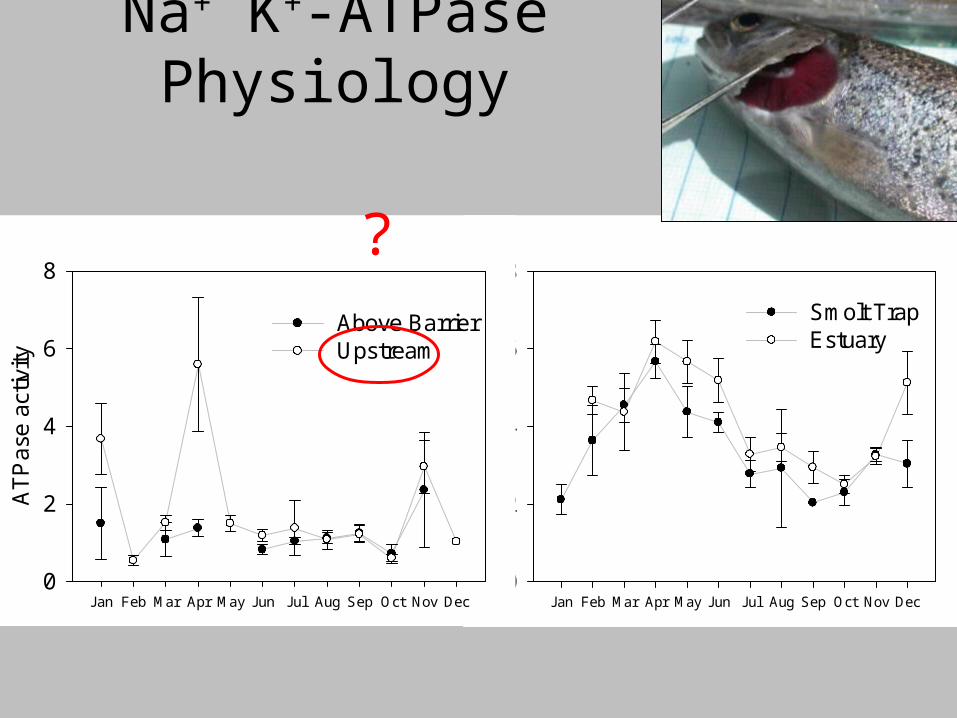
Na+ K+-ATPase Physiology
Jan Feb Mar Apr May Jun Jul Aug Sep Oct Nov Dec
AT
Pas
e ac
tivity
0
2
4
6
8
Smolt TrapEstuary
Jan Feb Mar Apr May Jun Jul Aug Sep Oct Nov Dec
AT
Pas
e ac
tivity
0
2
4
6
8
Above Barrier Upstream
?
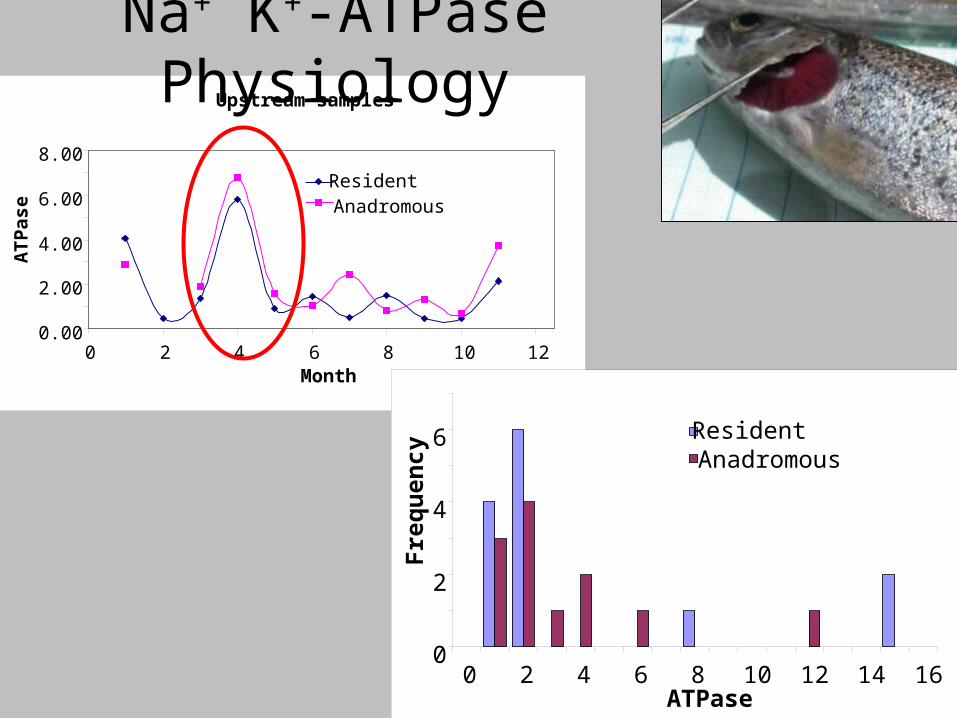
Upstream samples
0.00
2.00
4.00
6.00
8.00
0 2 4 6 8 10 12Month
AT
Pa
se
ResidentAnadromous
Na+ K+-ATPase Physiology
0
2
4
6
0 2 4 6 8 10 12 14 16ATPase
Fre
qu
ency
ResidentAnadromous

Why do wild fish migrate at such small sizes?
0
0.04
0.08
0.12
0.16
50 70 90 110
130
150
170
190
210
230
250
Fork Length (mm)
Fre
qu
ency
Typical steelhead smolt size distribution
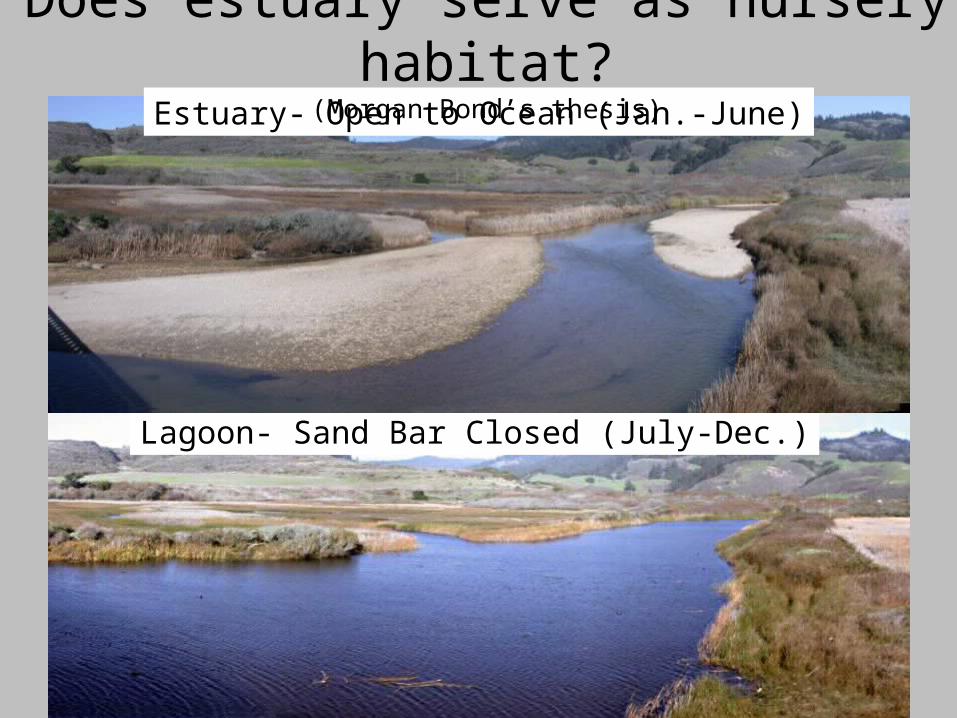
Lagoon- Sand Bar Closed (July-Dec.)
Estuary- Open to Ocean (Jan.-June)
Does estuary serve as nursery habitat?(Morgan Bond’s thesis)
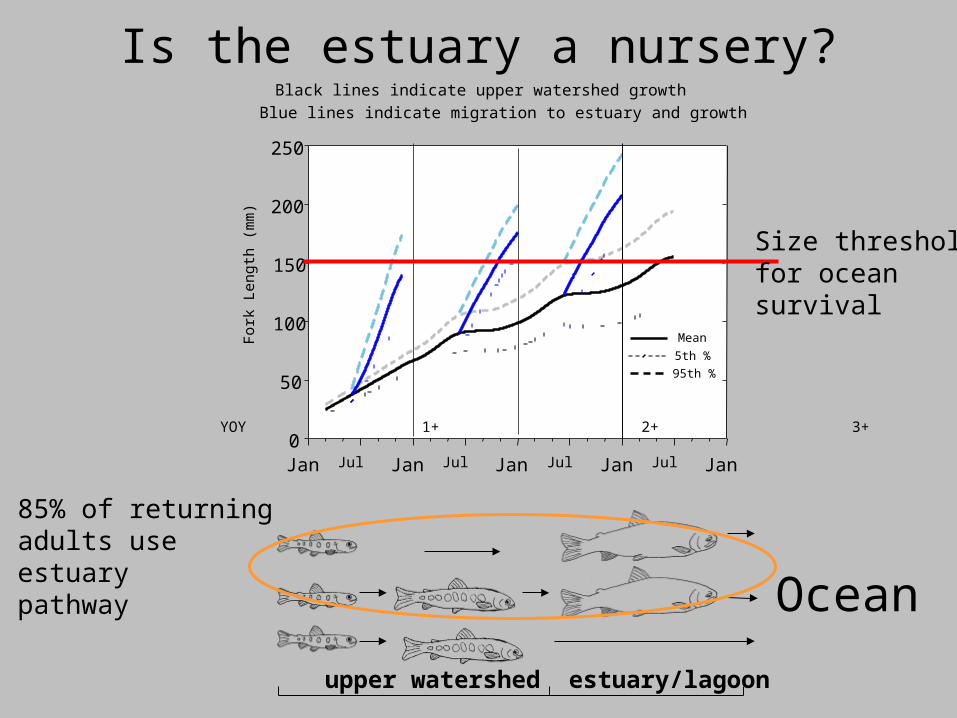
Black lines indicate upper watershed growth
Blue lines indicate migration to estuary and growth
Jan Jul Jan Jul Jan Jul Jan Jul Jan
For
k Le
ngth
(m
m)
0
50
100
150
200
250
Mean
5th %
95th %
YOY 1+ 2+ 3+
Is the estuary a nursery?
Ocean
upper watershed estuary/lagoon
85% of returningadults use estuary pathway
Size threshold for ocean survival
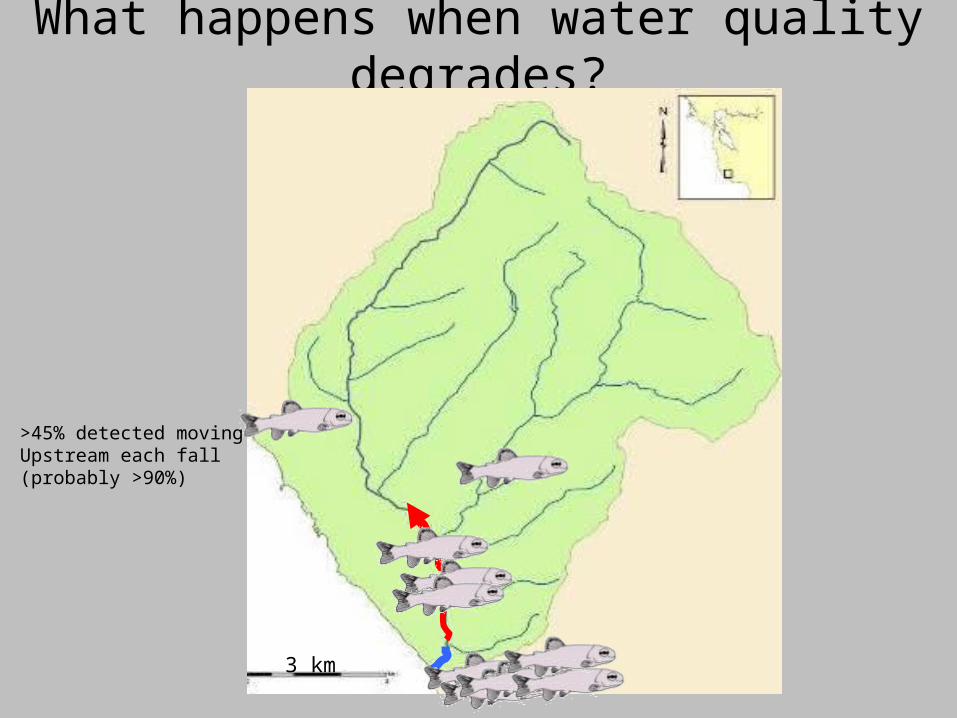
What happens when water quality degrades?
3 km
>45% detected moving Upstream each fall(probably >90%)
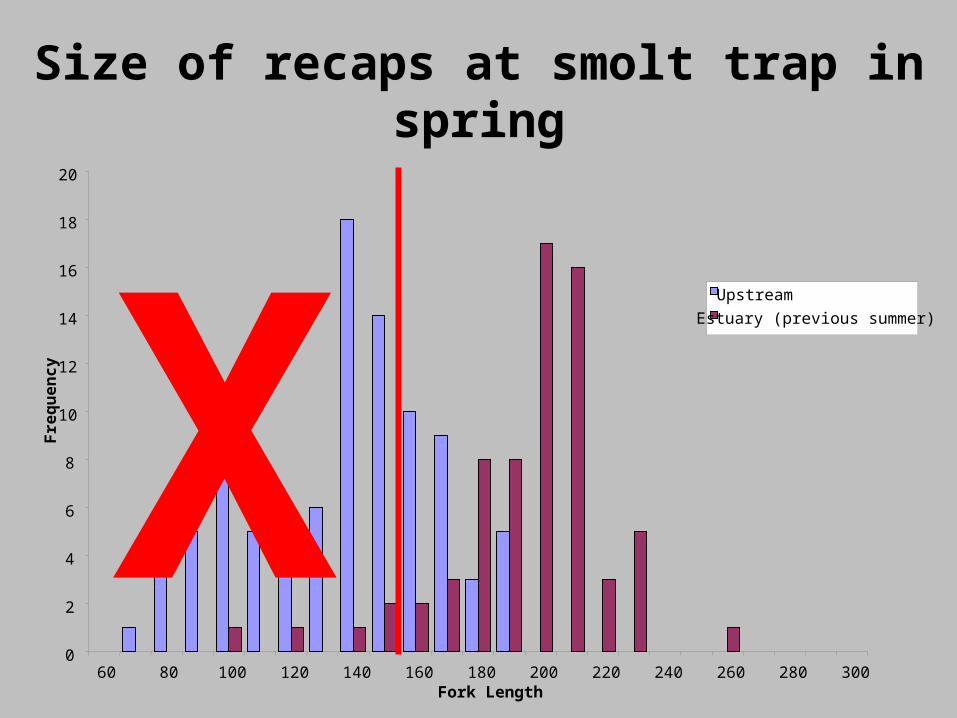
Size of recaps at smolt trap in spring
0
2
4
6
8
10
12
14
16
18
20
60 80 100 120 140 160 180 200 220 240 260 280 300Fork Length
Fre
qu
en
cy
Upstream
Estuary (previous summer)
X
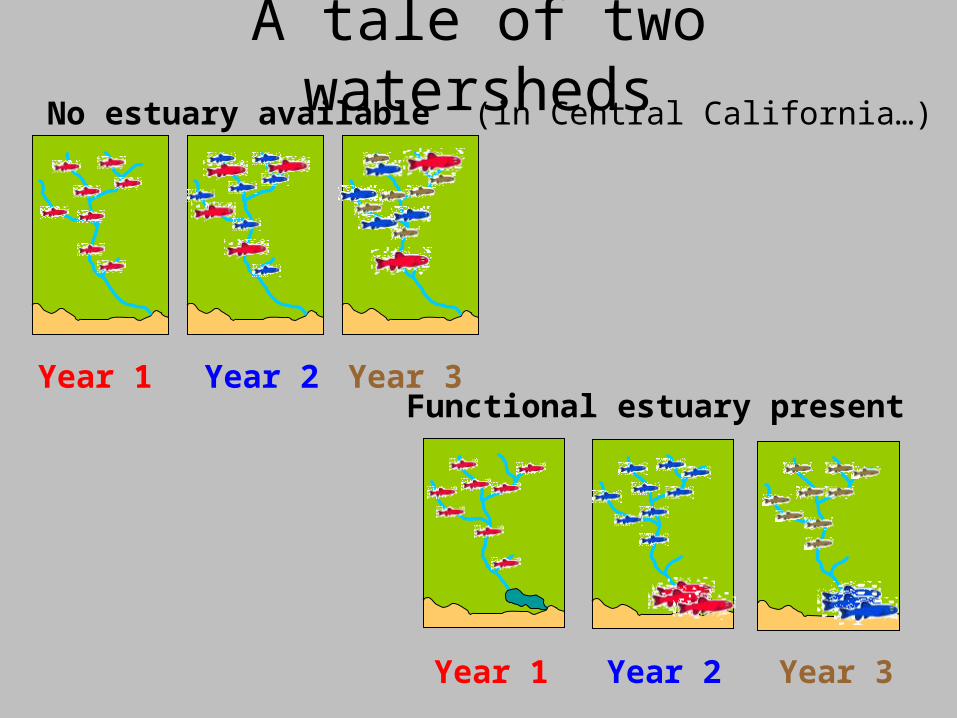
A tale of two watersheds
Functional estuary present
No estuary available
Year 1 Year 2 Year 3
Year 1 Year 2 Year 3
(in Central California…)
AcknowledgementsFunding• NMFS • DFG FRGP• NURP• California Sea Grant
Land Owner support•Big Creek Lumber Company•The Wilson Family•Monterey Bay Salmon and Trout Project•Cal Poly Swanton Ranch•Lockheed Martin
Implications of resident trout studies
• Should residents be counted in steelhead populations for delisting criteria?
• Residents may become steelhead, but this probably happens at low frequencies
• Results of resident contribution to anadromous breeding pending
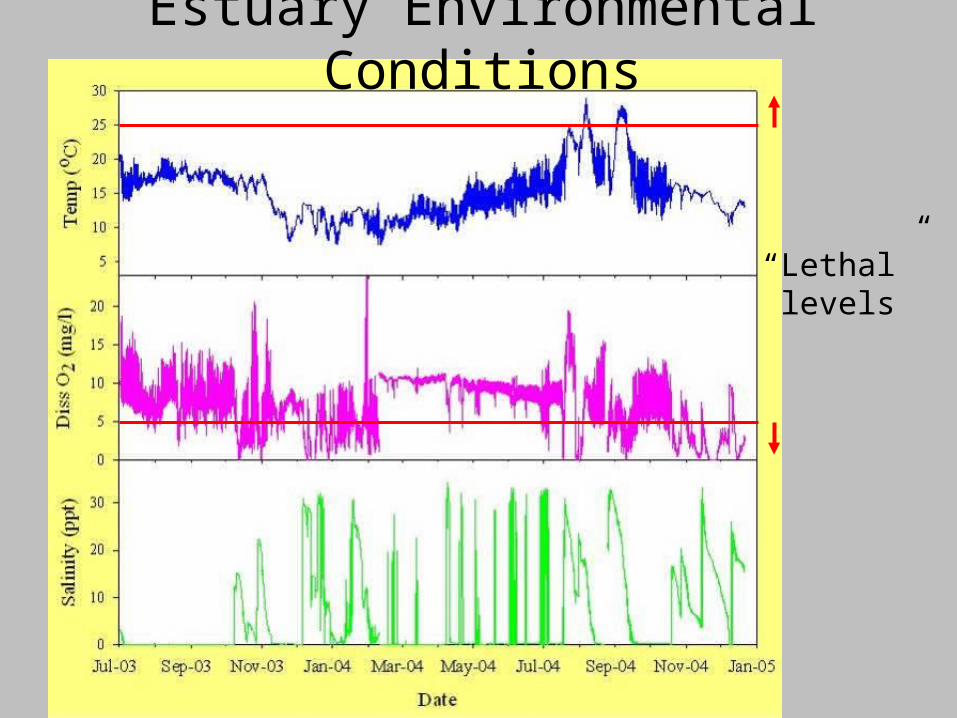
Estuary Environmental Conditions
“Lethal”levels
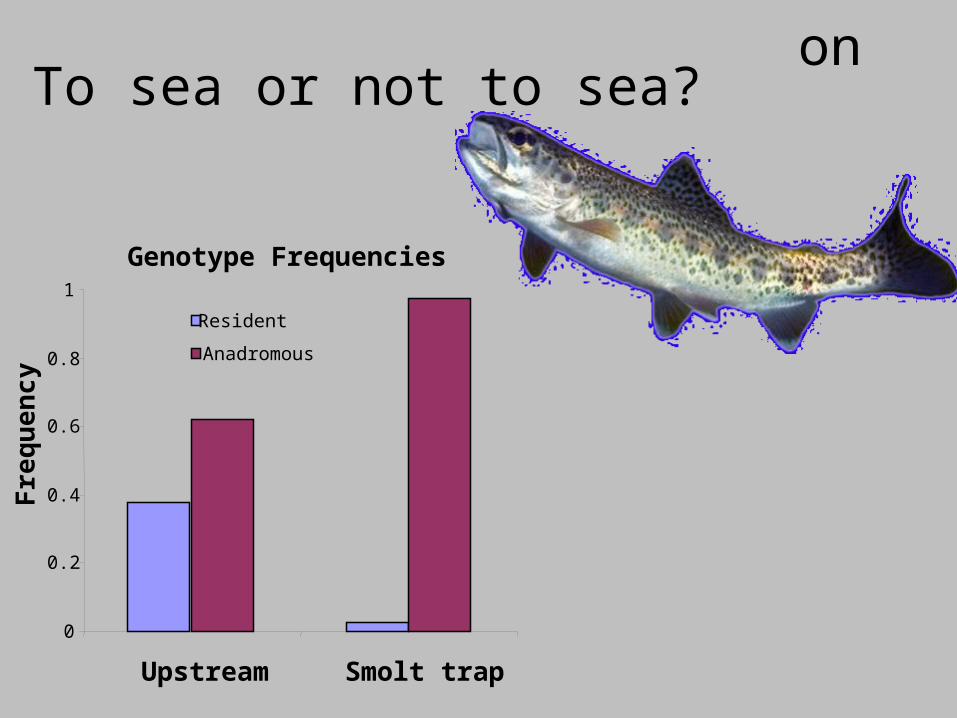
Influence of genotype on migration behaviorTo sea or not to sea?
Genotype Frequencies
0
0.2
0.4
0.6
0.8
1
Upstream Smolt trap
Fre
qu
en
cy
Resident
Anadromous
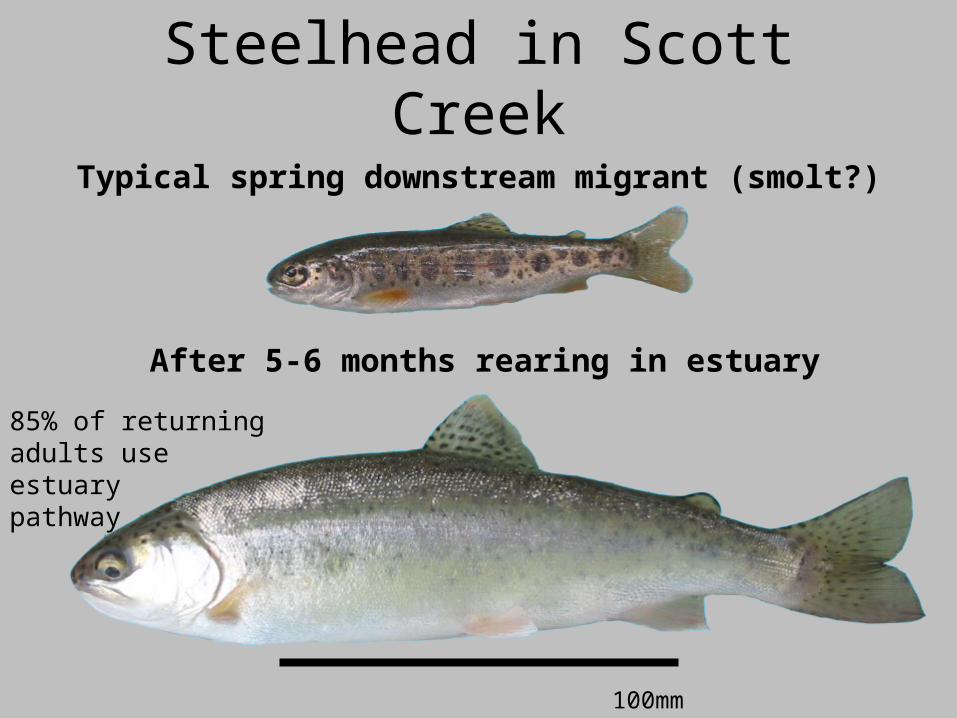
Typical spring downstream migrant (smolt?)
After 5-6 months rearing in estuary
100mm
Steelhead in Scott Creek
85% of returningadults use estuary pathway
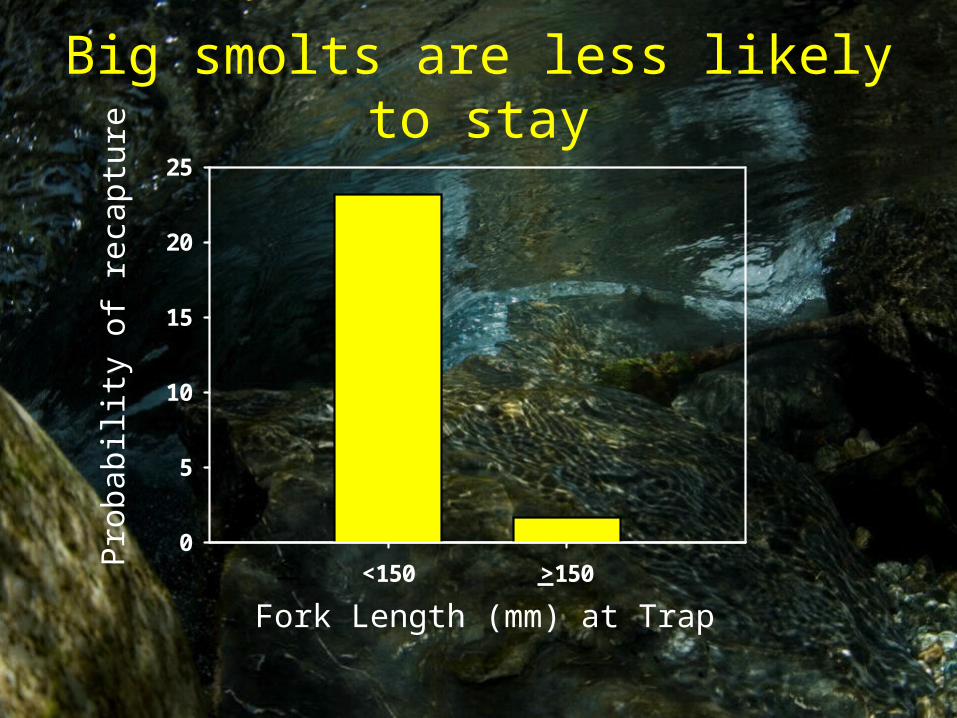
Fork Length (mm) at Trap
Big smolts are less likely to stayP
roba
b ili t
y o f
rec
aptu
re
< <150 >1500
5
10
15
20
25
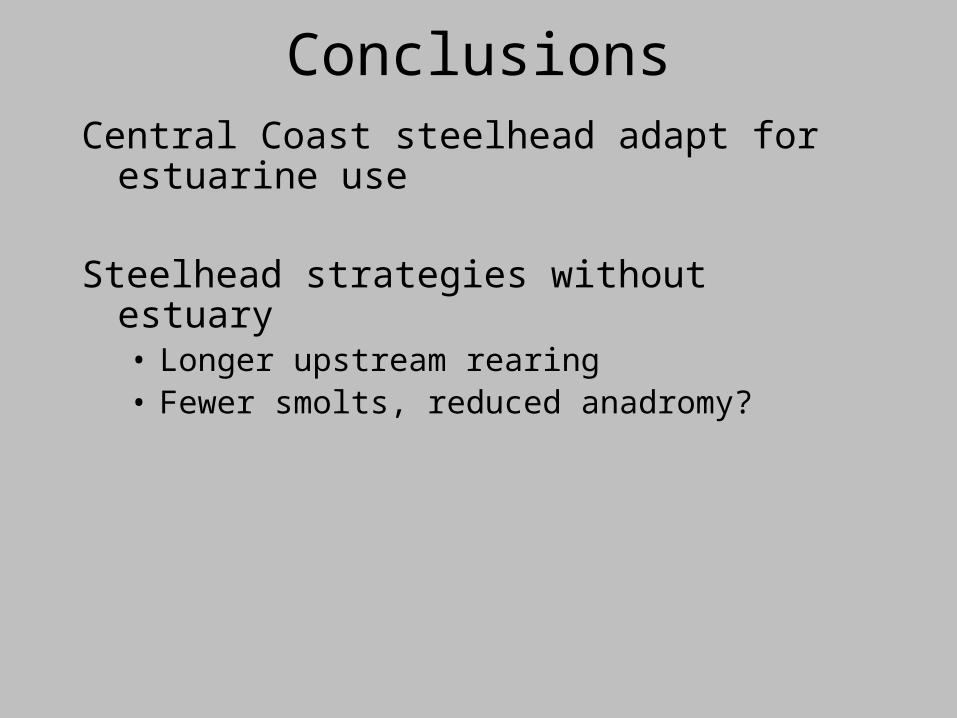
ConclusionsCentral Coast steelhead adapt for estuarine use
Steelhead strategies without estuary• Longer upstream rearing• Fewer smolts, reduced anadromy?
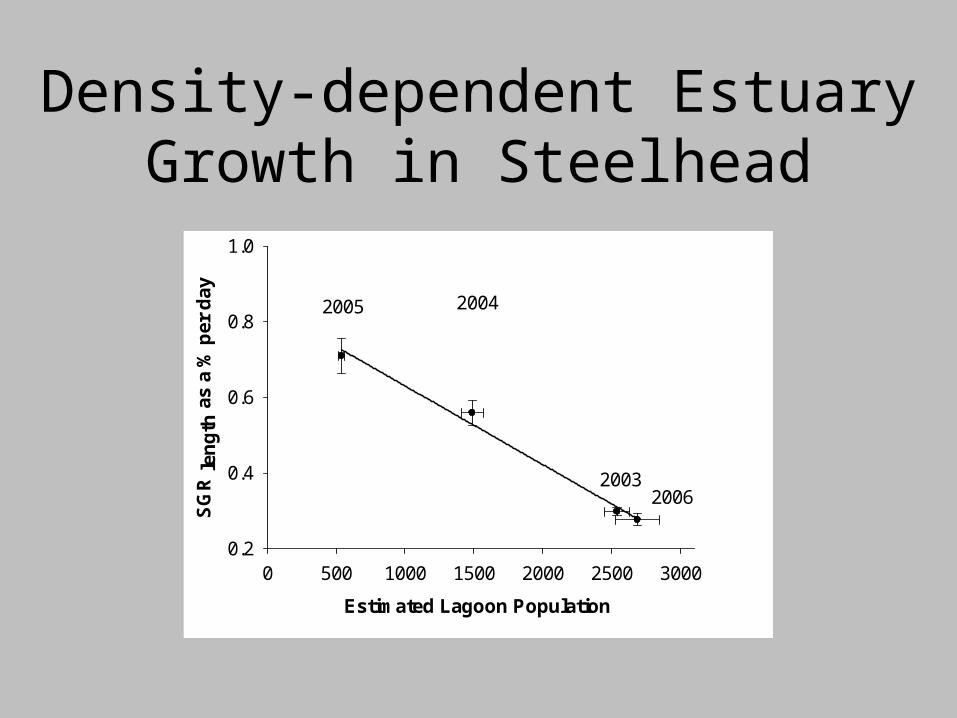
Figure 5. Estimated lagoon yearly population sizes and yearly mean growth rates from 2003-2006 (left y-axis). The bar graph (right side y-axis) represents mean fork length of fish sampled in the estuary in late fall of each year, just prior to winter storm season and lagoon opening. Years match points within labeled column. All data are means ± SE, R2=0.99. Regression P= 0.005
Estimated Lagoon Population
0 500 1000 1500 2000 2500 3000
SG
R l
eng
th a
s a
% p
er d
ay
0.2
0.4
0.6
0.8
1.0
2005 2004
20032006
Density-dependent Estuary Growth in Steelhead
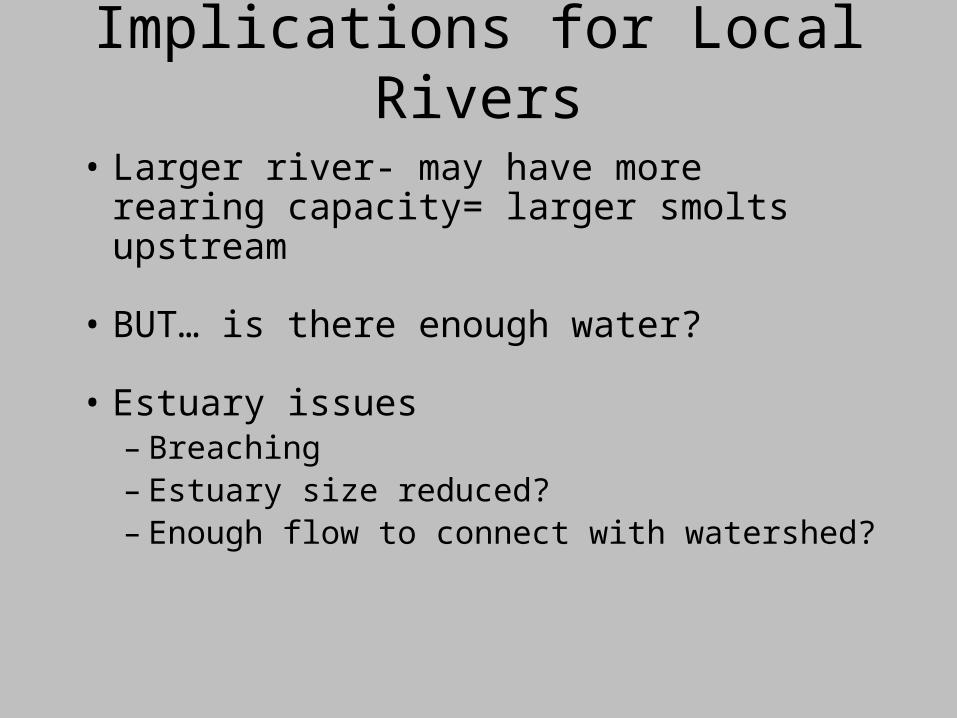
Implications for Local Rivers
• Larger river- may have more rearing capacity= larger smolts upstream
• BUT… is there enough water?
• Estuary issues– Breaching– Estuary size reduced?– Enough flow to connect with watershed?
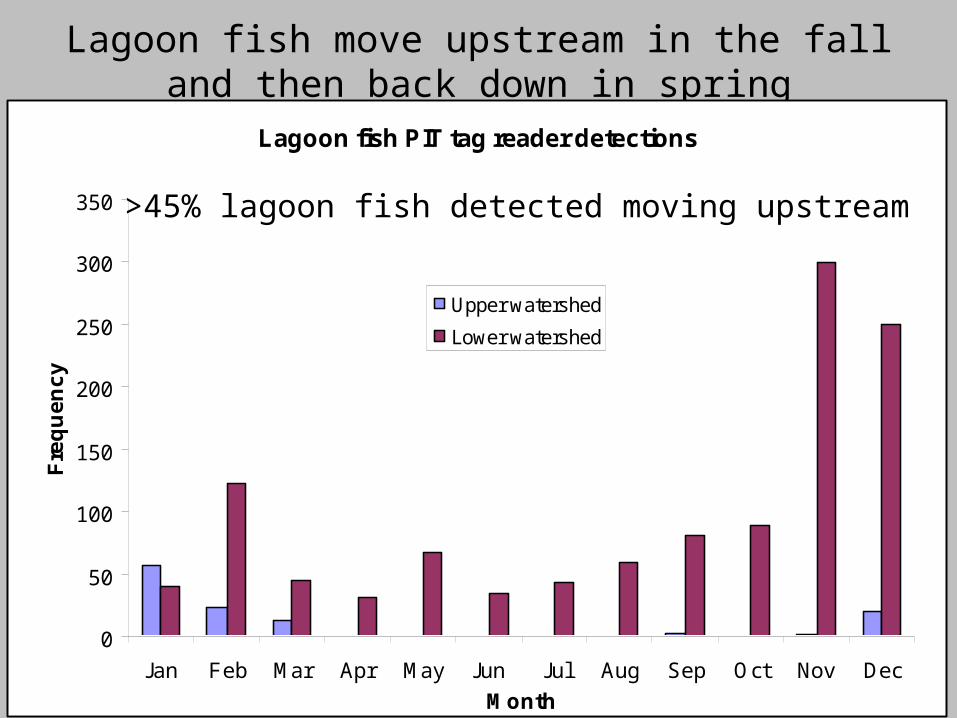
Lagoon fish move upstream in the fall and then back down in spring
Lagoon fish PIT tag reader detections
0
50
100
150
200
250
300
350
Jan Feb Mar Apr May Jun Jul Aug Sep Oct Nov Dec
Month
Fre
qu
en
cy
Upper watershed
Lower watershed
>45% lagoon fish detected moving upstream

Escapement
Early 20th century spawning population was 4-10 times larger
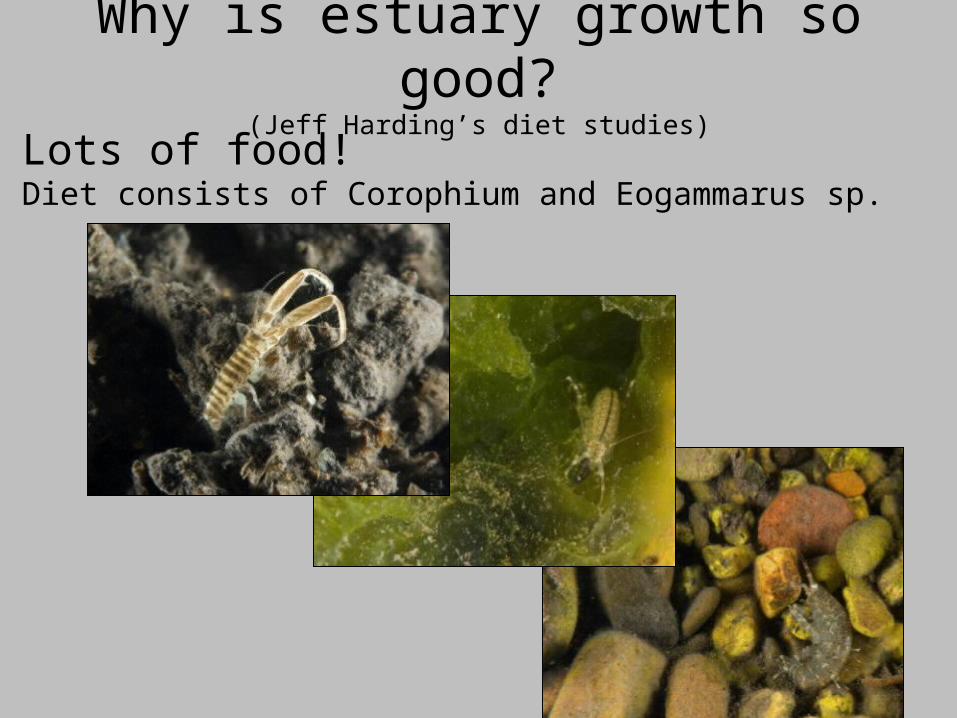
Why is estuary growth so good?(Jeff Harding’s diet studies)
Lots of food!Diet consists of Corophium and Eogammarus sp.
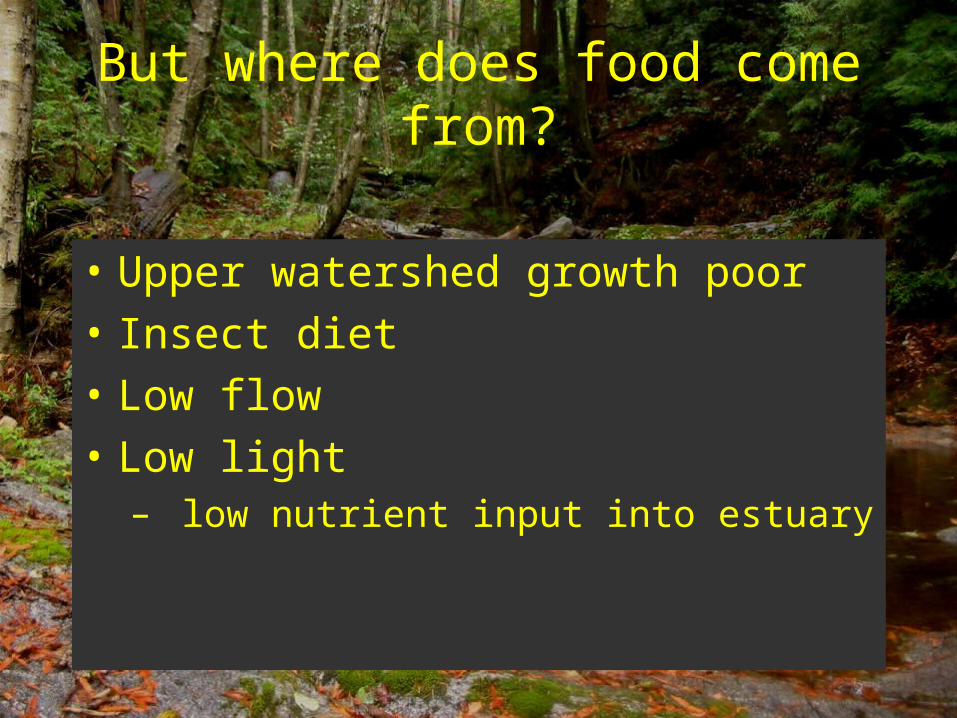
But where does food come from?
• Upper watershed growth poor
• Insect diet
• Low flow
• Low light– low nutrient input into estuary
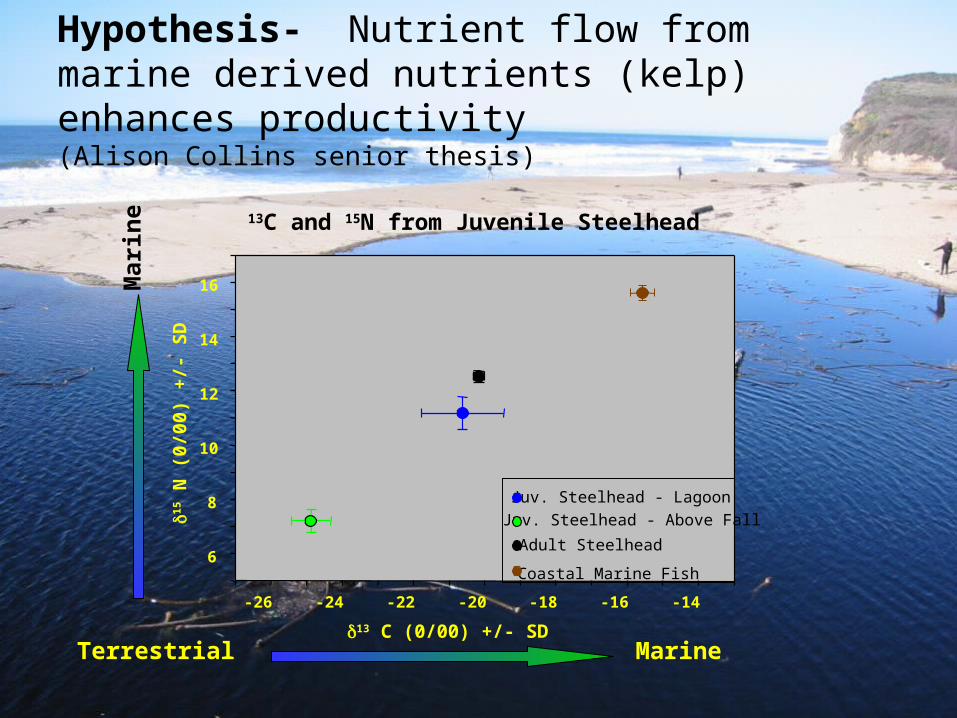
Hypothesis- Nutrient flow from marine derived nutrients (kelp) enhances productivity (Alison Collins senior thesis)
Terrestrial Marine
Mar
ine 13C and 15N from Juvenile Steelhead
13 C (0/00) +/- SD
-26 -24 -22 -20 -18 -16 -14
15 N
(0/
00)
+/-
SD
6
8
10
12
14
16
Juv. Steelhead - Lagoon
Juv. Steelhead - Above Fall
Adult Steelhead
Coastal Marine Fish
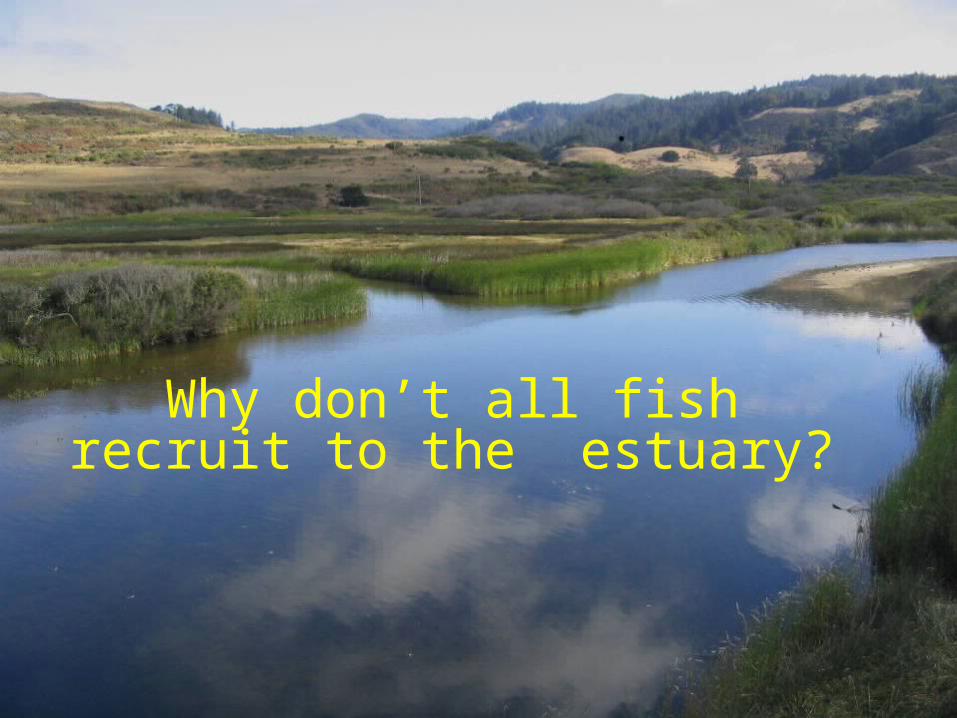
Why don’t all fish recruit to the estuary?


![THE EMIGRATION ACT, 1983epcom.org/Emigration-Act-1983.pdf · 1 THE EMIGRATION ACT, 1983 [31 of 1983, dt. 10-9-1983 ] An Act to consolidate and amend the law relating to emigration](https://img.pdfslide.net/doc/110x75/5e4809dfa0b97a0b973726e3/the-emigration-act-1-the-emigration-act-1983-31-of-1983-dt-10-9-1983-an-act.jpg)


![Bosnia Emigration[1]](https://img.pdfslide.net/doc/110x75/577d25951a28ab4e1e9f2a8f/bosnia-emigration1.jpg)