Embed Size (px)
Citation preview
0
Emission Reduction by Maintaining and Improving Energy Efficiency in Coal-fired Power Plant
Symposium on Japan - Czech future comprehensive cooperation of Energy and Environment Sector
May 4, 2009, Prague
1
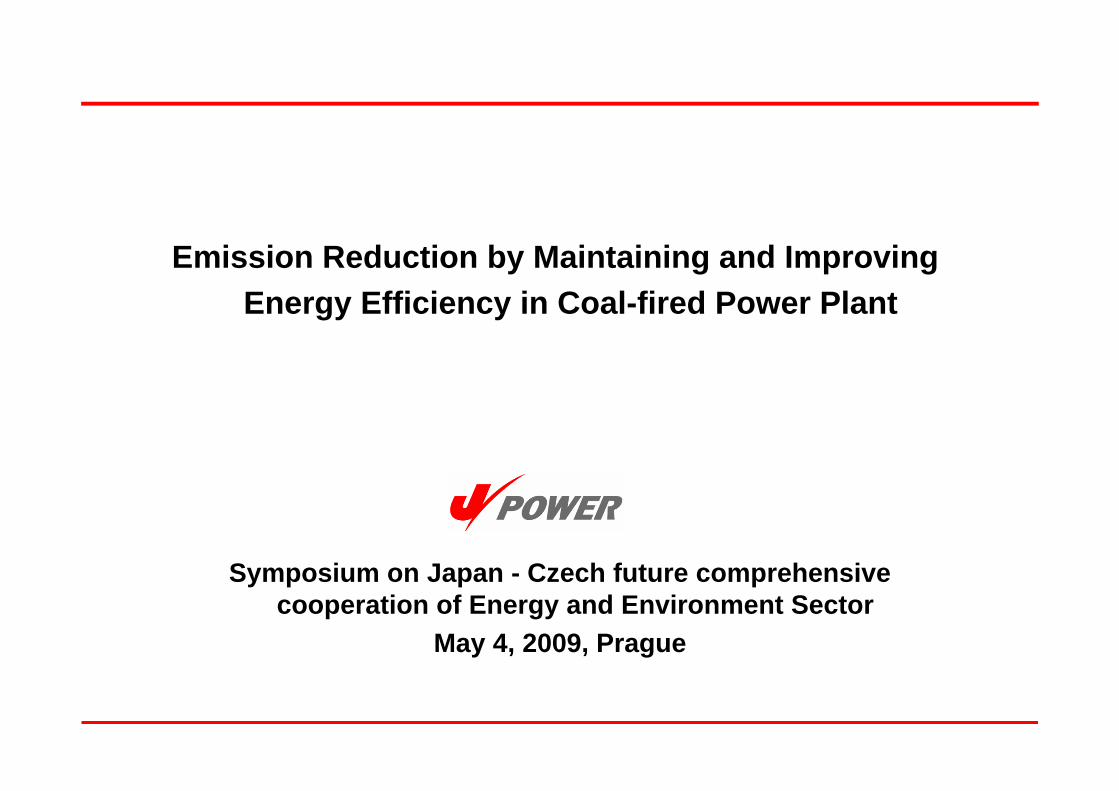
CO2 Emission in Czech Republic
4CO2 emission from coal-fired power/heat generation represents 46% of total CO2 emission in energy sector in Czech Republic
35.5%
45.6%
0
50
100
150
200
250
1990 1995 2000 2005
GHG
emiss
ion
(MtC
O2)
0%
10%
20%
30%
40%
50%
Ratio
of a
/b
d. Other GHG
c. CO2 from Non-energy Sector
b. CO2 Energy Sector other than Coal-fired Power/Heata. CO2 from Coal-fired Power/Heat
Ratio of CO2 from Coal-fired Power/Heatto Energy Sector CO2 (a/b)
Source: UNFCCC GHG Inventory Data

2
COAL59.1%
GAS2.4%
Nuclear24.8%
Hydro13.3%
OIL0.0%
Others0.3%
Total InstalledCapacity:15.16GW
2006
Energy Resource for Power Generation in Czech Republic
0
10
20
30
40
50
60
70
80
90
100
1990 2000 2002 2005 2006 2007e
TWh
OthersHydroNuclearGASOILCOAL
4 In Czech Republic, coal is the most major energy resource for electricity generation, as coal is domestic energy resource. Share of coal is about 60% both in the electricity generation (TWh) and the installed capacity (GW)
Source: Electricity Information 2008, IEA
Electricity Generation by Energy Resource in Czech Republic

3
Change of Energy Resources for Power Generation in Japan
5% 5% 10% 18% 25%
71%
43% 26% 9%9%
2%
15%22%
26%26%
3%17% 27% 34% 30%
17% 17% 12% 10% 9%2% 3% 2% 2% 1%
0%
20%
40%
60%
80%
100%
1973 1980 1990 2000 2006
OthersHydroNuclearLNGOilCoal
379 485 738 940 996 [TWh]
4 In Japan, oil used to be the major primary energy resource for power generation before the oil crisis
4 Coal has increased its share to 25% since Matsushima Power Station was built in 1981 as the first imported-coal based power plant, and as the large scale coal-fired power plant (500MW x 2) in Japan
Source: Transition of Power Generation Mix of General Electricity Utilities, “Overview of Electric Power Development 2007”, METI
Transition of Electricity Generation Composition by Energy Resources in Japan
4
3.3
1.2
3.4
1.61.4 1.4
3.4 3.5
0.7 0.8 0.8 0.6
0.2 0.20.01
0.06
0.00.51.01.52.02.53.03.54.04.55.0
米国(2005)
カナダ(2005)
英国(2005)
フランス(2005)
ドイツ(2005)
イタリア(2005)
日本(2007)
磯子(2007)
硫黄酸化物(SOx)窒素酸化物(NOx)
〔g/ kWh〕
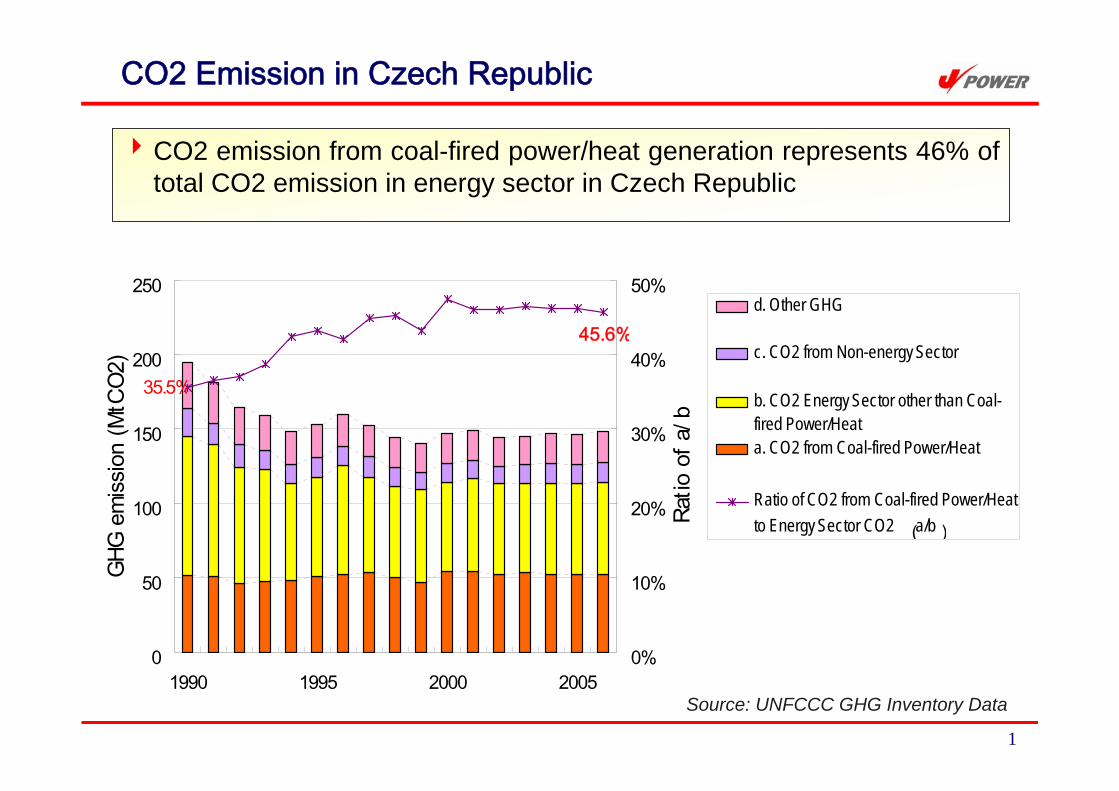
Advanced Clean Coal Technology for Coal-fired Power Generation
4 Clean coal technology in Japan has been developed intensively to lead other developed countries, to the extent that SOx and NOx emission level is as almost gas-fired level with the most advanced CCT technology in Isogo Power Station.
SOx and NOx emission in coal-fired power generation
USA Canada UK France Germany Italy Japan Isogo
Sulfur Oxide (SOx)Nitrogen Oxide (NOx)
Source: Federation of Electric Power Companies, Japan (actual data for Isogo)
J-POWER’s Isogo Power Station
5
20%
25%
30%
35%
40%
45%
1990 1992 1994 1996 1998 2000 2002 2004 2006
J- POWER
Germany
UK
USA
India
China
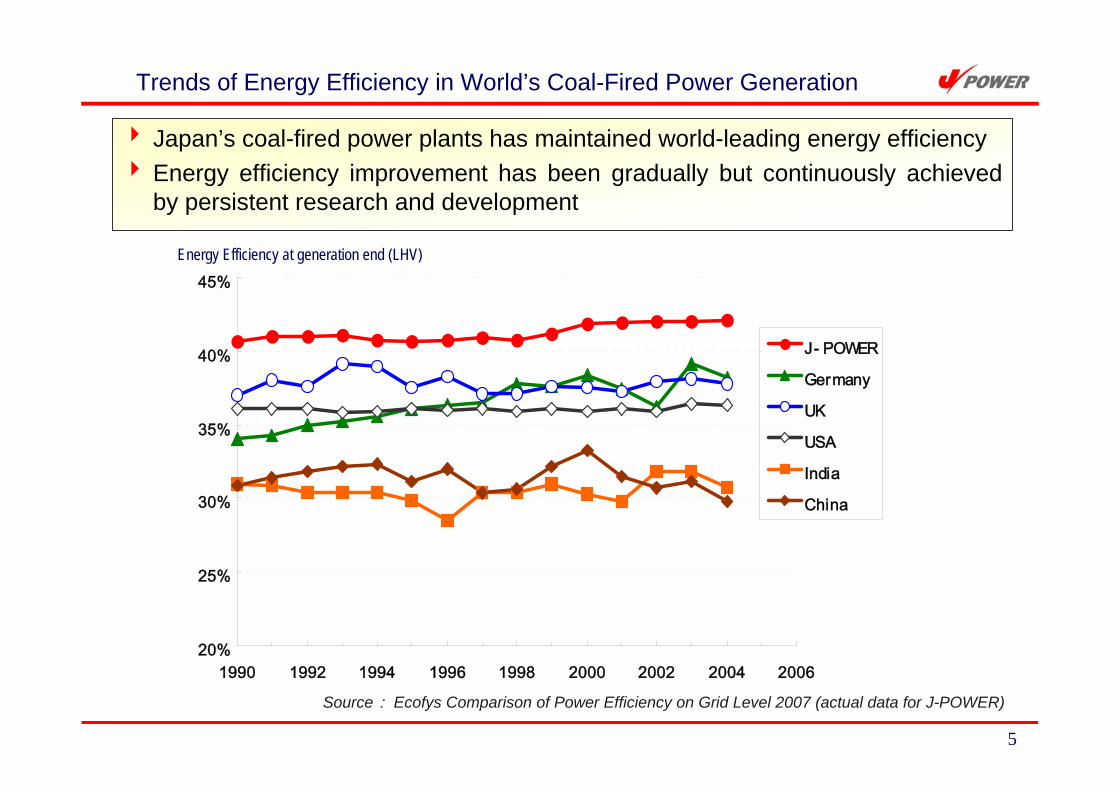
Trends of Energy Efficiency in World’s Coal-Fired Power Generation
4 Japan’s coal-fired power plants has maintained world-leading energy efficiency4 Energy efficiency improvement has been gradually but continuously achieved
by persistent research and development
Energy Efficiency at generation end (LHV)
Source: Ecofys Comparison of Power Efficiency on Grid Level 2007 (actual data for J-POWER)
6
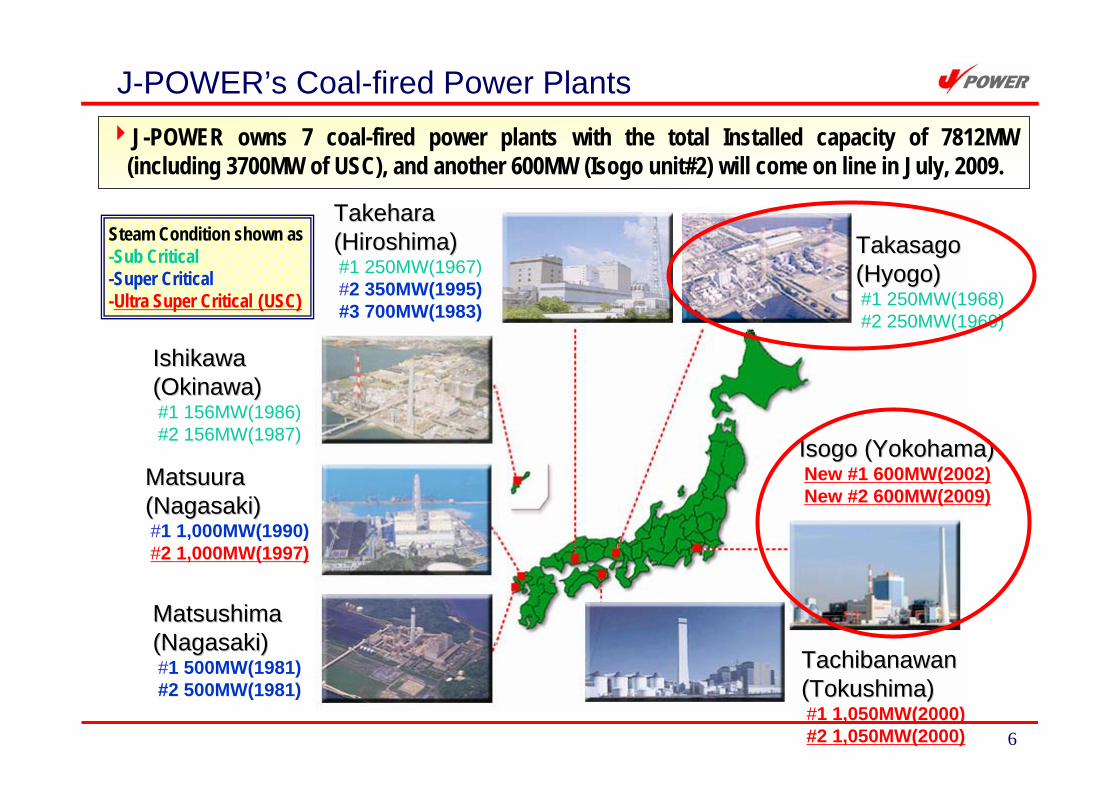
MatsuuraMatsuura((NagasakiNagasaki))#1 1,000MW(1990)#2 1,000MW(1997)
TakasagoTakasago((HyogoHyogo))#1 250MW(1968)#2 250MW(1969)
IsogoIsogo ((YokohamaYokohama))New #1 600MW(2002)New #2 600MW(2009)
TachibanawanTachibanawan((TokushimaTokushima))#1 1,050MW(2000)#2 1,050MW(2000)
TakeharaTakehara((HiroshimaHiroshima))#1 250MW(1967)#2 350MW(1995)#3 700MW(1983)
IshikawaIshikawa((OkinawaOkinawa))#1 156MW(1986)#2 156MW(1987)
MatsushimaMatsushima((NagasakiNagasaki))#1 500MW(1981)#2 500MW(1981)
Steam Condition shown as-Sub Critical-Super Critical-Ultra Super Critical (USC)
4J-POWER owns 7 coal-fired power plants with the total Installed capacity of 7812MW (including 3700MW of USC), and another 600MW (Isogo unit#2) will come on line in July, 2009.
J-POWER’s Coal-fired Power Plants
7
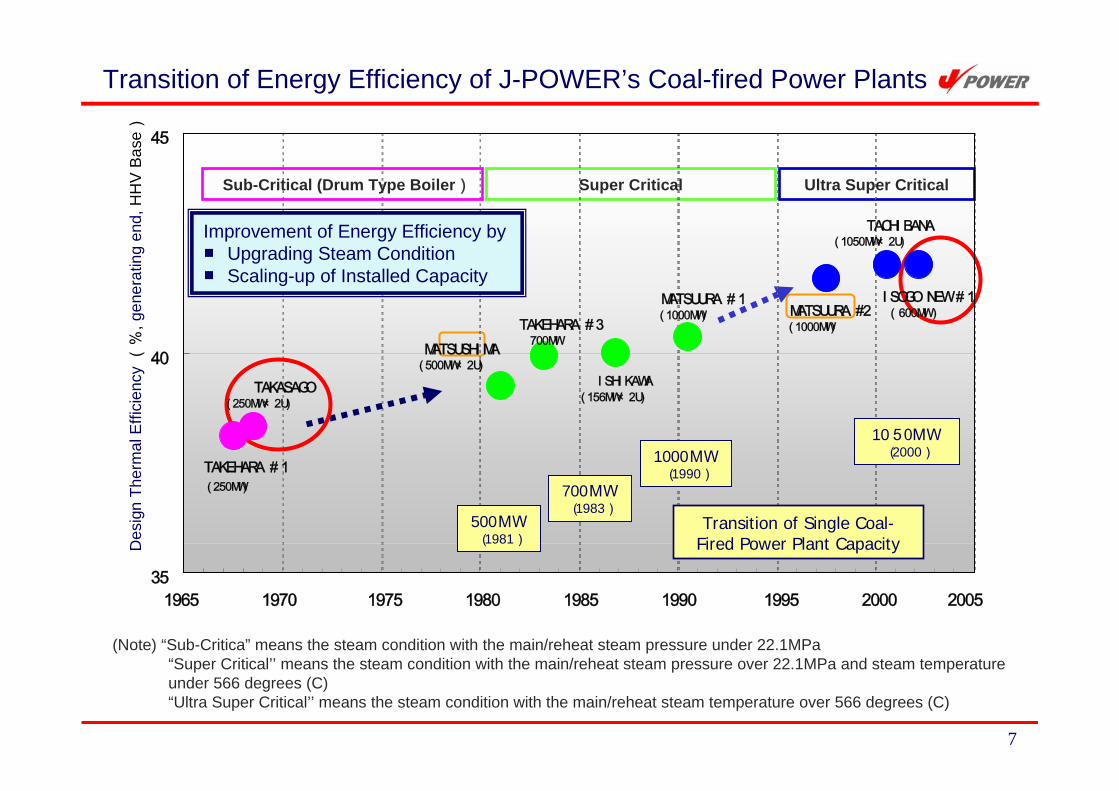
(Note) “Sub-Critica” means the steam condition with the main/reheat steam pressure under 22.1MPa“Super Critical’’ means the steam condition with the main/reheat steam pressure over 22.1MPa and steam temperature under 566 degrees (C)“Ultra Super Critical’’ means the steam condition with the main/reheat steam temperature over 566 degrees (C)
Transition of Energy Efficiency of J-POWER’s Coal-fired Power Plants
Super Critical Ultra Super CriticalSub-Critical (Drum Type Boiler)
Improvement of Energy Efficiency by■ Upgrading Steam Condition■ Scaling-up of Installed Capacity
TAKEHARA #1( 250MW)
TAKASAGO( 250MW× 2U)
MATSUSHI MA( 500MW× 2U)
TAKEHARA #3700MW
I SHI KAWA( 156MW× 2U)
MATSUURA #1( 1000MW) MATSUURA #2
( 1000MW)
TACHI BANA( 1050MW× 2U)
I SOGO NEW #1(600MW)
35
40
45
1965 1970 1975 1980 1985 1990 1995 2000 2005
Des
ign
Ther
mal
Effi
cien
cy (
%, g
ener
atin
g en
d, H
HV
Bas
e)
Transition of Single Coal-Fired Power Plant Capacity
1000MW(1990)
700MW(1983)
500MW(1981)
1050MW(2000)

8
Takasago Power Station250MW x 2units of coal-fired power station located in Hyogo
Steam Condition (main steam/reheat steam)4 Pressure: 16.57 / 3.38 MPa4 Temperature: 566 / 538 degrees (C)
Historical Event4 Jul. 1968 Unit #1 commissioned, 250MW for domestic coal4 Jan. 1969 Unit #2 commissioned, 250MW for domestic coal4 Feb. 1975 Commencement of #1 FGD (1st Full Scale FGD in Japan)4 Mar. 1976 Commencement of #2 FGD4 2001 Switched to imported coal due to closure of domestic coal minesNow, more than 80% of coal is imported.
Efficiency Maintenance in an Old Coal-fired Power Plant
9
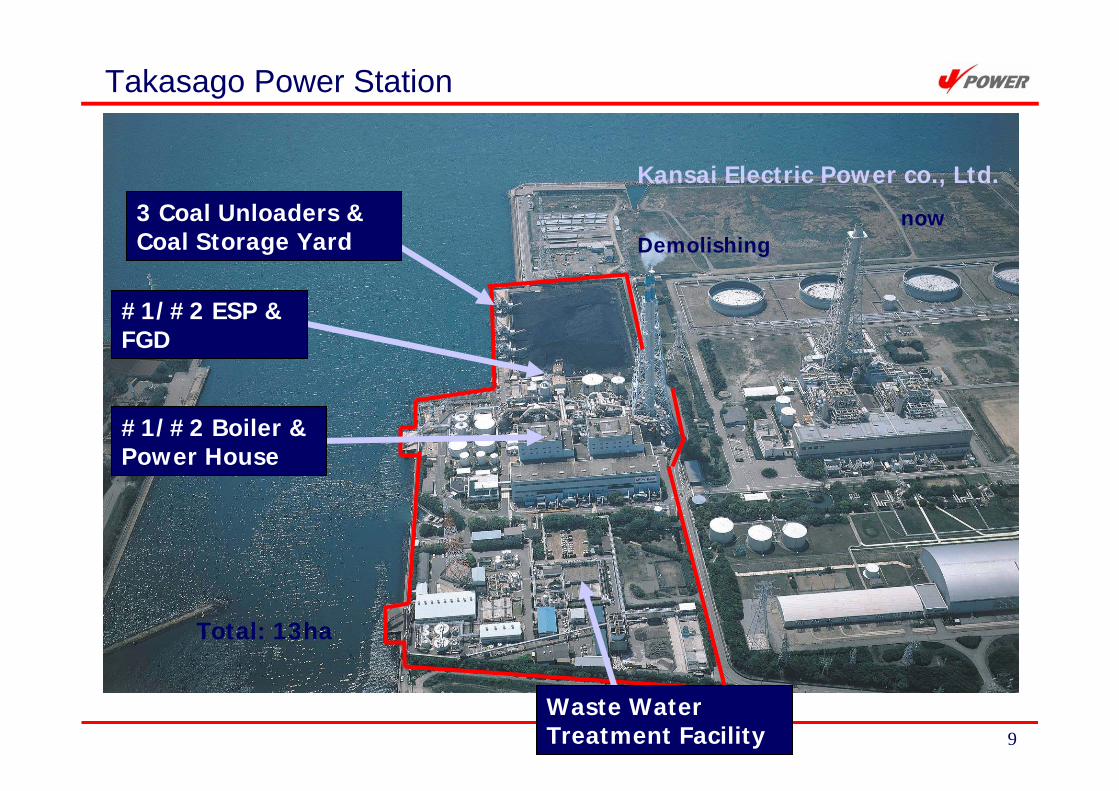
Kansai Electric Power co., Ltd.
now Demolishing
Total: 13ha
#1/#2 Boiler & Power House
#1/#2 ESP & FGD
3 Coal Unloaders & Coal Storage Yard
Waste Water Treatment Facility
Takasago Power Station
10
High Performance Maintained for 40 Years
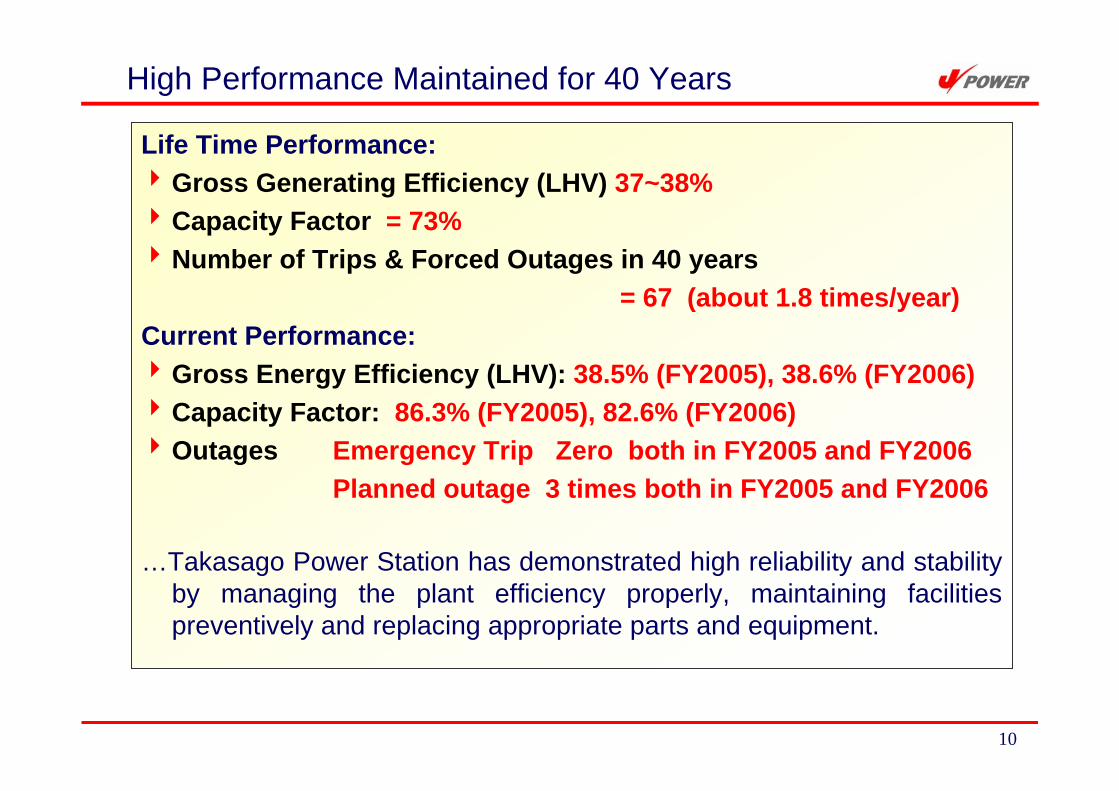
Life Time Performance:4Gross Generating Efficiency (LHV) 37~38%4Capacity Factor = 73%4Number of Trips & Forced Outages in 40 years
= 67 (about 1.8 times/year)Current Performance:4Gross Energy Efficiency (LHV): 38.5% (FY2005), 38.6% (FY2006)4Capacity Factor: 86.3% (FY2005), 82.6% (FY2006)4Outages Emergency Trip Zero both in FY2005 and FY2006
Planned outage 3 times both in FY2005 and FY2006
…Takasago Power Station has demonstrated high reliability and stability by managing the plant efficiency properly, maintaining facilities preventively and replacing appropriate parts and equipment.
11
Maintained Thermal Efficiency at its Designed Level
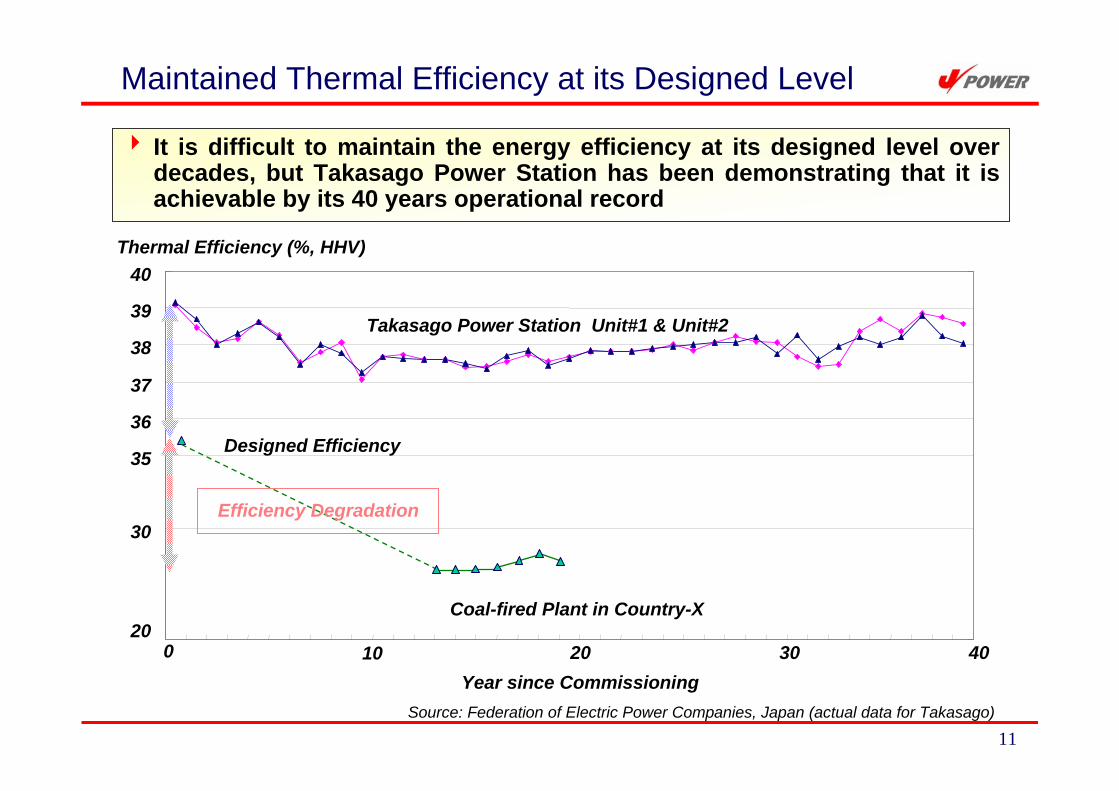
4 It is difficult to maintain the energy efficiency at its designed level over decades, but Takasago Power Station has been demonstrating that it is achievable by its 40 years operational record
20
30
35
36
37
38
39
40Thermal Efficiency (%, HHV)
0 10 20 30 40Year since Commissioning
Takasago Power Station Unit#1 & Unit#2
Coal-fired Plant in Country-X
Designed Efficiency
Efficiency Degradation
Source: Federation of Electric Power Companies, Japan (actual data for Takasago)
12
30
31
32
33
34
35
36
37
38
39
40
1968
1969
1970
1971
1972
1973
1974
1975
1976
1977
1978
1979
1980
1981
1982
1983
1984
1985
1986
1987
1988
1989
1990
1991
1992
1993
1994
1995
1996
1997
1998
1999
2000
2001
2002
2003
2004
2005
2006
30
40
50
60
70
80
90
100
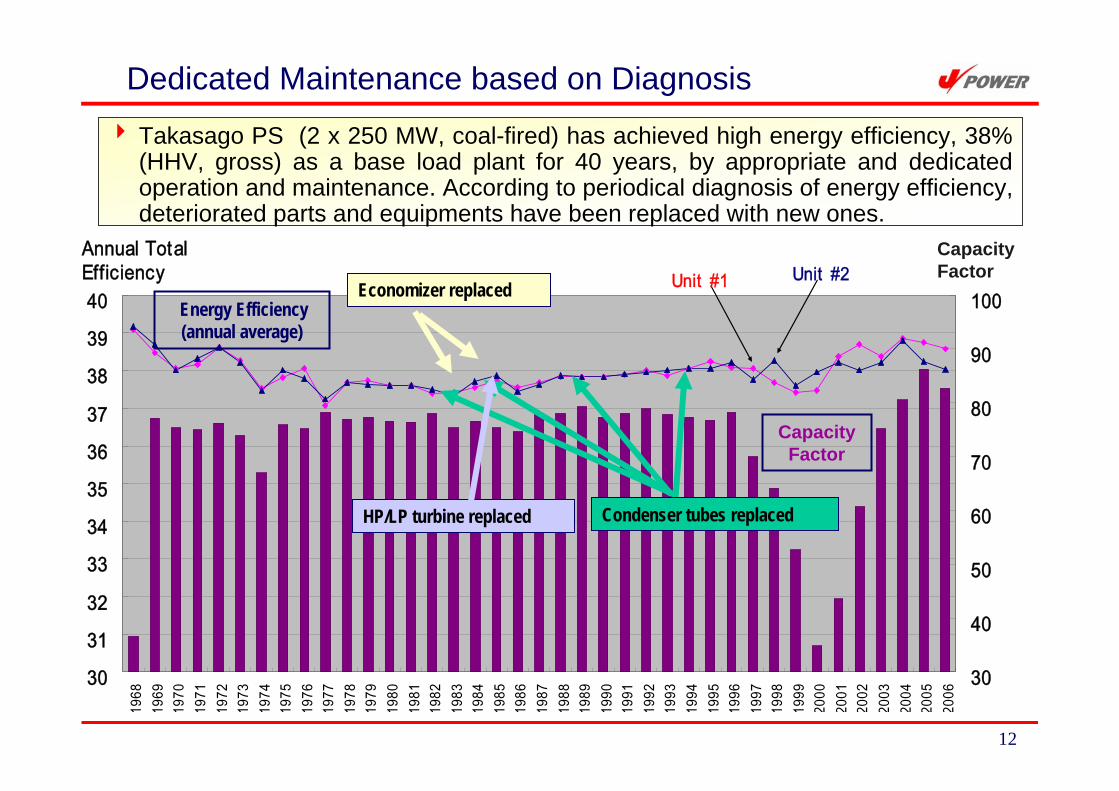
Annual TotalEfficiency Unit #1 Unit #2
Ut ilizat ionFactor
HP/LP turbine replaced Condenser tubes replaced
Economizer replacedEnergy Efficiency (annual average)
Capacity Factor
Dedicated Maintenance based on Diagnosis
Capacity Factor
4 Takasago PS (2 x 250 MW, coal-fired) has achieved high energy efficiency, 38% (HHV, gross) as a base load plant for 40 years, by appropriate and dedicated operation and maintenance. According to periodical diagnosis of energy efficiency, deteriorated parts and equipments have been replaced with new ones.
13
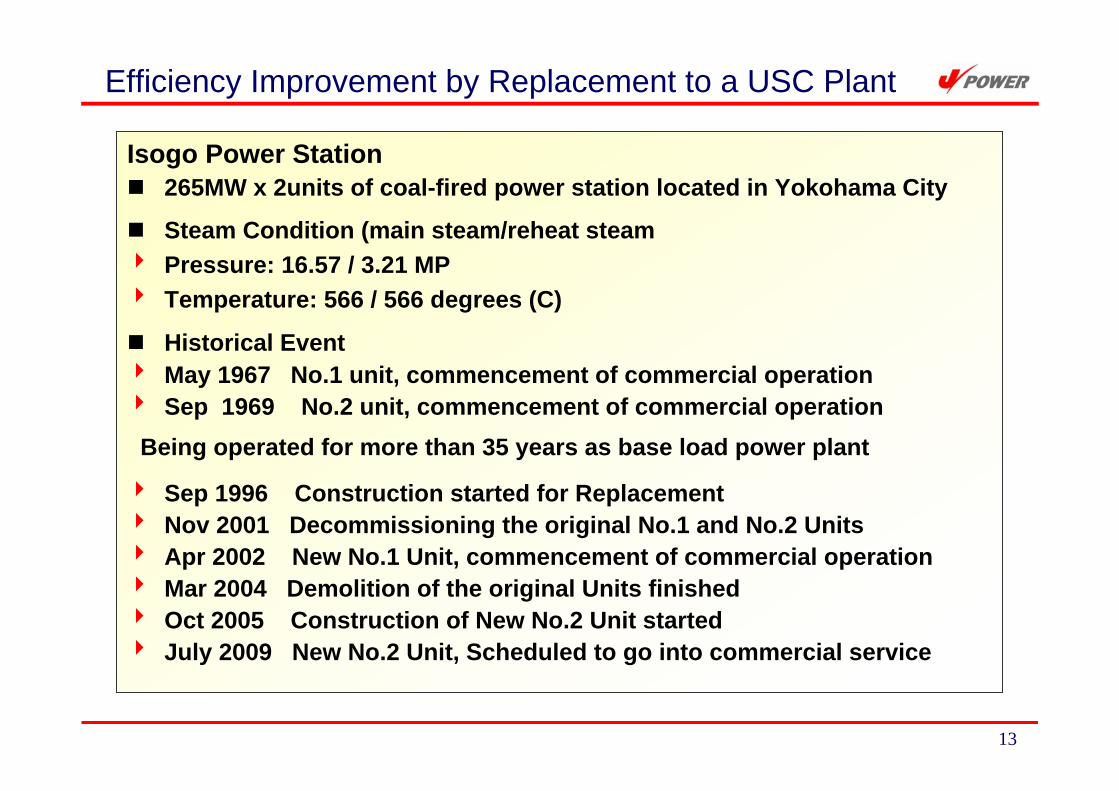
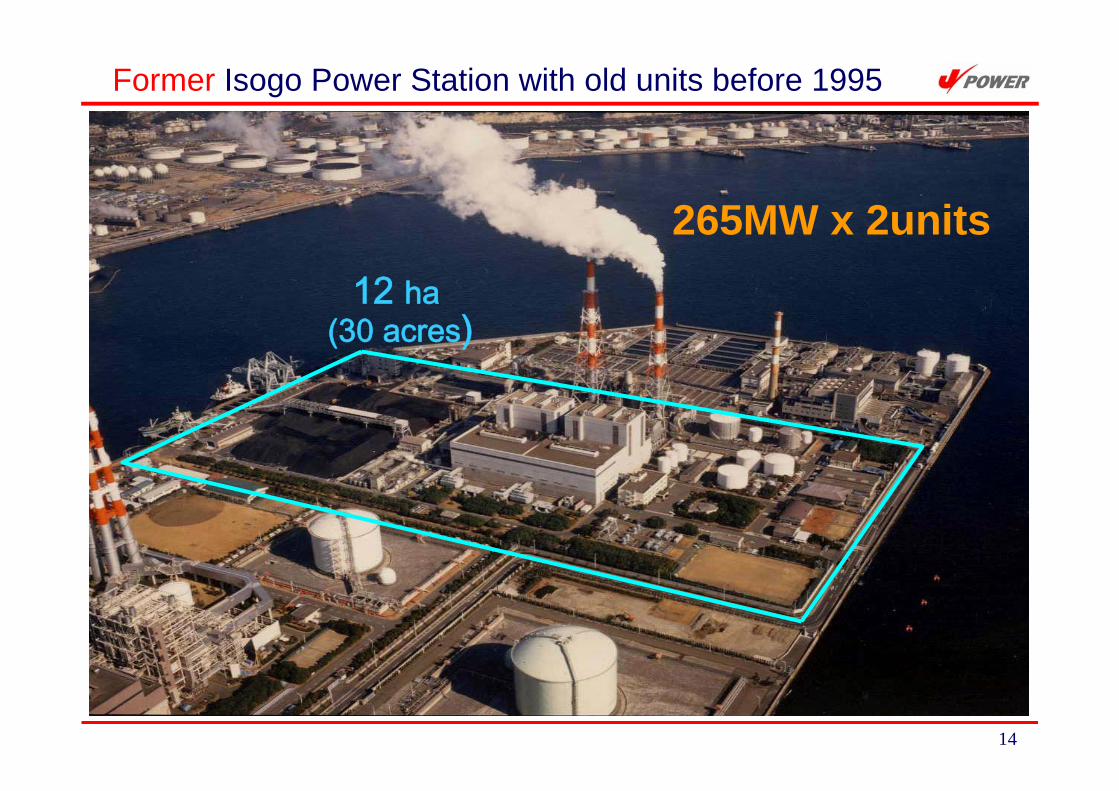
Isogo Power Station265MW x 2units of coal-fired power station located in Yokohama City
Steam Condition (main steam/reheat steam4 Pressure: 16.57 / 3.21 MP4 Temperature: 566 / 566 degrees (C)
Historical Event4 May 1967 No.1 unit, commencement of commercial operation4 Sep 1969 No.2 unit, commencement of commercial operationBeing operated for more than 35 years as base load power plant
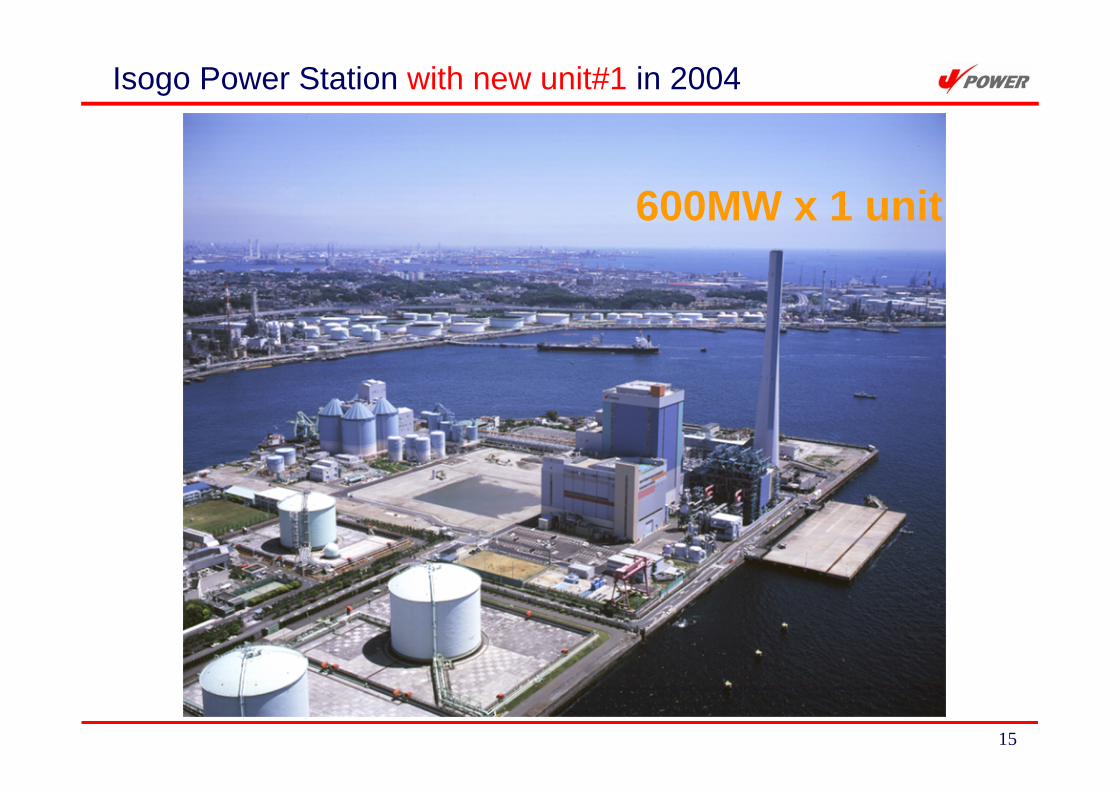
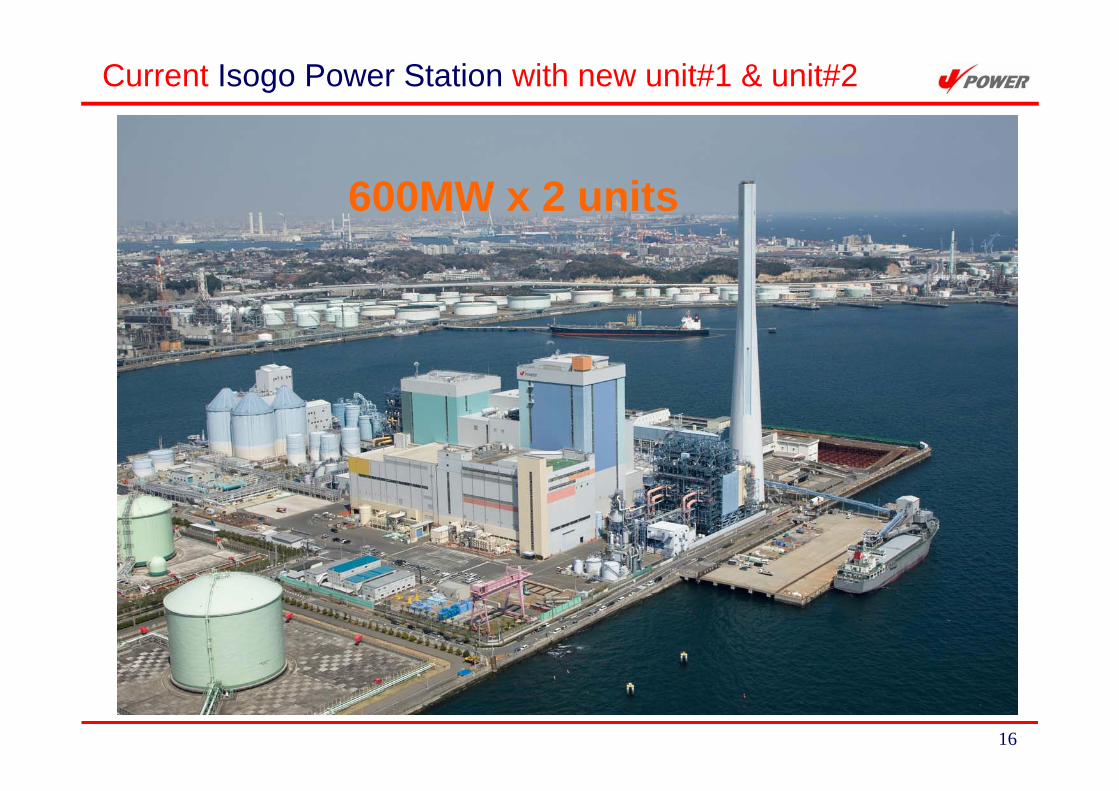
4 Sep 1996 Construction started for Replacement4 Nov 2001 Decommissioning the original No.1 and No.2 Units4 Apr 2002 New No.1 Unit, commencement of commercial operation4 Mar 2004 Demolition of the original Units finished4 Oct 2005 Construction of New No.2 Unit started4 July 2009 New No.2 Unit, Scheduled to go into commercial service
Efficiency Improvement by Replacement to a USC Plant
14
Former Isogo Power Station with old units before 1995
265MW x 2units12 ha
(30 acres)
15
Isogo Power Station with new unit#1 in 2004
600MW x 1 unit
16
Current Isogo Power Station with new unit#1 & unit#2
600MW x 2 units

17
Change of Performance before and after the replacementIsogo Coal-Fired Power Plant
commissioned in1967New Isogo Coal-Fired Power Plant
Unit #1 in 2002 and Unit#2 in 2009
3 objectivesRepoweringRepowering
Cleaner Cleaner EnvironmentEnvironment
Efficiency Efficiency ImprovementImprovement
■Generation Capacity 530MW 1200MW(264MW×2 units) (600MW×2 units)
■SOx 60ppm 20ppm (10)NOx 159ppm 20ppm (13)PM 50mg/m3N 10mg/m3N (5)
■Steam Condition Sub Critical Ultra Super CriticalEfficiency (gross % LHV) 40% 45%
■CO2 emission intensity 100 (base) 83
Numbers in ( ) are for Unit #2
New Unit#2 will be commissioned in 2009
18
0.000
0.200
0.400
0.600
0.800
1.000
1.200
1998 1999 2000 2002 2003 2004 2005 2006 2007Fiscal Year
Emiss
ion
Fact
or (k
g-CO
2/kW
h, n
et)
29.0
31.0
33.0
35.0
37.0
39.0
41.0
43.0
45.0
Ener
gy E
ffici
ency
(%, g
ross
)
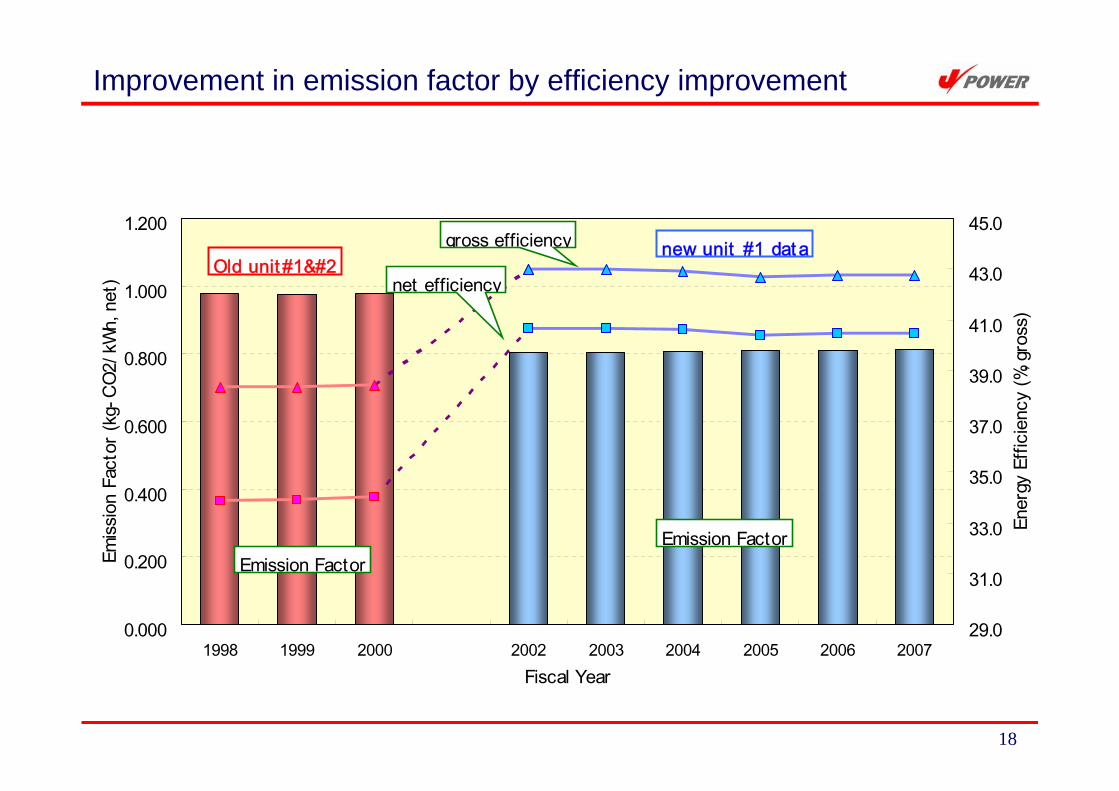
new unit #1 dat aOld unit #1
Emission Factor
gross efficiency
net efficiency
Emission Factor
Improvement in emission factor by efficiency improvement
19
CO2 Emission Reduction Potential in Coal-fired Power Generation
4Maintaining energy efficiency by dedicated maintenance in old coal-fired power plants can effectively reduce CO2 emission that willotherwise increase according to efficiency decrease by aging
4Replacement to a USC power plant with the world-highest energy efficiency has a significant effect to reduce CO2 emission for coal-fired electricity generation
4Coal is an important primary energy for the world, and major domestic energy resource for Czech Republic, therefore we should use it efficiently as possible not only to mitigate climate change but for energy sustainability.