Embed Size (px)
Citation preview
A COMPONENT UNIT OF CLARK COUNTY, NEVADAFOR FISCAL YEAR ENDED JUNE 30, 2011
WD11_CAFR_CVR_ASTP.indd 1 10/19/11 5:14 PM

The Las Vegas Valley Water District is a not-for-profit agency that began providing water to the Las Vegas Valley in 1954. The district helped build the city’s water delivery system, which includes more than 4,500 miles of water transmission pipelines,
and now provides water to more than 1 million people in Southern Nevada. Learn more at lvvwd.com.
WD11_CAFR_CVR_ASTP.indd 2 10/19/11 5:14 PM
Las Vegas Valley Water District
Comprehensive Annual Financial Report
A Component Unit of Clark County, Nevada
Fiscal Year Ended June 30, 2011
Steve Sisolak, President Mary Beth Scow, Vice President
Susan Brager Larry Brown Tom Collins
Chris Giunchigliani Lawrence Weekley
Patricia Mulroy
General Manager
John J. Entsminger Philip D. Speight, Richard B. Holmes Senior Deputy General Manager Deputy General Manager
Deputy General Manager Administration Engineering/Operations
William F. Fox Chief Financial Officer
1001 South Valley View Blvd., Las Vegas, NV 89153

DEDICATION
Cary Casey, Director of Finance for the Las Vegas Valley Water District (LVVWD) and Treasurer for the Southern Nevada Water Authority (SNWA), retired effective June 2011. He was the first Director of Finance for LVVWD, accepting that appointment in August, 1985, and had held the Treasurer role since the inception of SNWA in 1991. Mr. Casey provided strong financial leadership to both LVVWD and SNWA. Both organizations benefitted from his business acumen, which has been built by years of experience. He was able to provide a common-sense business approach in guiding the organizations through times of incredible growth and change. Mr. Casey was also deeply respected by those beyond the LVVWD and SNWA organizations. His absence will be equally felt by those members of the LVVWD and SNWA families that he worked with for over 20 years in developing a model for regional cooperation. With extreme gratitude and appreciation the staff and management of the LVVWD and SNWA dedicate the Comprehensive Annual Financial Report Fiscal year ended June 30, 2011, to Cary Casey.

Las Vegas Valley Water District Comprehensive Annual Financial Report
For The Year Ended June 30, 2011 Table of Contents
Beginning on Page No.
Introductory Section
Transmittal Letter ........................................................................................................................ 1 GFOA Certificate of Achievement ............................................................................................... 6 Organization Chart ....................................................................................................................... 7
Financial Section
Independent Auditors’ Report on Financial Statements and Supplementary Information ........................................................................................................ 8 Management’s Discussion and Analysis ...................................................................................... 9
Basic Financial Statements Balance Sheets ........................................................................................................................ 16 Statements of Revenues, Expenses and Changes in Fund Equity ..................................... 18 Statements of Cash Flows ...................................................................................................... 19 Statements of Fiduciary Net Assets ...................................................................................... 20 Statements of Changes in Fiduciary Net Assets .................................................................. 21 Notes to Basic Financial Statements
Note 1. Summary of Significant Accounting Policies ......................................... 22 Note 2. Capital Assets ............................................................................................ 27 Note 3. Short Term Debt ....................................................................................... 29 Note 4. Long Term Debt ....................................................................................... 29 Note 5. Restricted Cash, Investments, Accounts Receivable and Accounts Payable .............................................................................. 34 Note 6. Deferred Revenue ..................................................................................... 36 Note 7. Southern Nevada Water Authority (SNWA) ......................................... 36 Note 8. Southern Nevada Water System (SNWS)............................................... 37 Note 9. Enterprise Fund Investments .................................................................. 37 Note 10. Risk Management ..................................................................................... 39 Note 11. Capital Contributions............................................................................... 40 Note 12. Related Party Transactions ..................................................................... 40 Note 13. Commitments and Contingencies ............................................................ 41 Note 14. Post Employment Benefits Other Than Pension (OPEB) ..................... 42 Note 15. Termination Benefits ................................................................................ 45 Note 16. Defined Benefit Pension Plan ................................................................... 45 Note 17. Subsequent Events .................................................................................... 50
i
Las Vegas Valley Water District Comprehensive Annual Financial Report
For The Year Ended June 30, 2011
Table of Contents Beginning on
Page No. Required Supplementary Information Schedule of Employer Contribution ..................................................................................... 51 Schedule of Funding Progress ............................................................................................... 52 Schedule of Funding Progress Postemployment Benefit Plan ........................................... 53 Statistical Section (unaudited)
Fund Equity by Component ........................................................................................................ 54 Changes in Fund Equity .............................................................................................................. 55 Water Consumption, Revenue and Active Accounts ................................................................ 56
Revenue Analysis - by Class of Service ....................................................................................... 57 Water Rates – Last Ten Fiscal Years ......................................................................................... 58 2011 Municipal Water Rates Survey .......................................................................................... 65 Top Ten Principal Ratepayers - Calendar Year 2010 and Nine Years Ago ............................ 66
Ratios of Net General Obligation Debt Outstanding – Last Ten Fiscal Years ....................... 67 Net Pledged Revenue Coverage – Last Ten Fiscal Years .......................................................... 68 Outstanding Direct and Overlapping General Obligation Indebtedness ................................ 69 Demographic Statistics – Last Ten Years .................................................................................. 70 Clark County Principal Employers – Current Year and Nine Years Ago .............................. 71
Ten Largest Property-Owning Taxpayers ................................................................................. 72 Authorized Full-Time Equivalent Employees by Department ................................................. 73 Water Production by Month – Last Ten Years ......................................................................... 74 Pumpage From Wells by Months – Last Ten Years .................................................................. 75 Surface Water by Month Southern Nevada Water System – Last Ten Years ........................ 76 Water Production Maximum and Minimum Days by Month – Last Ten Years .................... 77 Annual Treated Water Delivered by The Southern Nevada Water System ........................... 78 Enterprise Fund Selected Capital Asset Statistics ..................................................................... 79 Schedule of Insurance as of June 30, 2011 ................................................................................. 80
Independent Auditors’ Report
Independent Auditors’ Report on Internal Control Over Financial Reporting and on Compliance and Other Matters Based on an Audit of Financial Statements Performed in Accordance with Government Auditing Standards ............................................. 84
ii

INTRODUCTORY SECTION
Transmittal Letter
GFOA Certificate of Achievement
Organization Chart

require that rates and charges be sufficient to provide for operation and maintenance costs, general expenses of the District and debt service payments. Day-to-day operations of the District are directed by a general manager, appointed by the Board, and three deputy general managers. The District’s vision is “People Leading the Way” and its mission is to “Partner to provide reliable, quality water, ensuring the sustainability of our desert community and serving our customers responsibly.” The Board has adopted a series of strategic goals to support the District’s vision and mission. To assist in carrying out its objectives, the District has been granted the authority to exercise eminent domain, levy taxes, create assessment districts and incur indebtedness. Although the Board may levy a tax on all taxable property within the District’s boundaries, the Board has yet to levy such a tax. The District also functions as the operating agent for the Southern Nevada Water Authority (SNWA). The SNWA is a joint powers authority created in 1991 to address Southern Nevada’s unique water needs on a regional basis. The SNWA is charged with acquiring and managing current and future resources, constructing and managing regional water facilities and promoting water conservation. The District is one of SNWA’s seven member agencies. In 1996, the SNWA assumed all assets and liabilities of the Southern Nevada Water System (SNWS) from the Colorado River Commission of Nevada (CRC). Originally financed and constructed by the State of Nevada with assistance from the federal government, the SNWS is responsible for the treatment and distribution of Colorado River water from Lake Mead. The District operates the SNWS on behalf of the SNWA as it did previously for the CRC. Additional information on the District’s relationship to the SNWS and the SNWA can be found in the notes to the basic financial statements (Notes 7, 8 and 12). As required by Nevada law, the District’s budget is approved annually by its Board following a public hearing, and a copy of the budget is submitted to the Nevada Department of Taxation. Budgetary controls are established at the levels of total estimated operating and non-operating expenses. The District is a self-supporting operation of a commercial nature and the demand for service primarily determines the level of revenues and expenditures. The budget controls District expenditures at various levels. These levels always include departments and divisions, and in some instances, sections. Most disbursements are made through the issuance of purchase orders. Purchases of new furniture, vehicles and communication equipment are administered by the Support Services Department; computer equipment purchases are administered under the authority of the Information Technology Department; and new positions are controlled by the Human Resources Department. Financial Services prepares monthly and quarterly variance reports by division, and division managers are accountable for expenditures over and under budget. Because the members of the Clark County Commission also serve as the Board of Directors for the District, the District’s financial report is included as a blended component unit within Clark County’s CAFR. A “blended component unit” means that the District’s balances and transactions are included in Clark County’s financial report in combination with Clark County’s balances and transactions.
FACTORS AFFECTING FINANCIAL CONDITION Local economy. The Southern Nevada economy has begun a long-awaited recovery, according to the Center for Business and Economic Research at the University of Nevada, Las Vegas (CBER) in their Midyear Economic Outlook: 2011 publication.
2
Visitor volume grew by 2.7 percent in 2010 to 37.4 million, an increase of 1 million over the 2009 total of 36.4 million. CBER expects visitor volume to increase at a rate of 3.8 percent to 38.8 million visitors in 2011 and another 3.6 percent to 40.1 million visitors in 2012. Clark County gross gaming revenues in 2010 rose to $8.9 billion from $8.8 billion in 2009, an approximate 1 percent increase. The Nevada Department of Training, Employment and Rehabilitation reports a preliminary unemployment rate for Clark County at June 30, 2011, of 13.8 percent. This is down 1.5 percent from the (revised) unemployment rate of 15.3 percent at June 30, 2010. Despite this improvement in the overall unemployment rate, the construction industry has not recovered, and Nevada’s unemployment rate is the highest in the West. The median price of a new home (excluding high/mid rise condominiums, apartment conversions, and condotel units) at June 30, 2011, was $197,990, an 8.1 percent increase compared to the $183,213 median price a year ago. Although the CBER report concludes that the Southern Nevada economy is improving, it cautions that “Because the Southern Nevada economy is heavily dependent on tourism, its outlook is tied to the growth of the U.S. and western states economies.” Financial policy. The District’s financial policy is to charge reasonable rates, fees and other charges sufficient to pay for water service, the costs of operation and maintenance of its facilities, the general expenses of the District, and principal and interest on all bonds and other obligations of the District. In addition, it is District policy to fix rates and charges sufficient to maintain a debt service coverage ratio in accordance with its bond covenants. The District deposits all moneys received from the sale or distribution of water or otherwise derived from the works or property of the District into the Revenue Fund. Further, the District keeps proper books of record and account in accordance with sound accounting practice; complete and correct entries are made of its works, properties, and the revenues received therefrom. The District has not deviated from its financial policy. Even though the District has substantially reduced expenditures and maintained budgetary restrictions, in December 2009 the Board of Directors, consistent with District policy to charge reasonable rates sufficient to ensure financial viability, approved a two-phase service charge increase averaging approximately 4% effective January 1, 2010, and an additional 4% effective January 1, 2011. The increases have stabilized water revenues and allowed the District to continue to provide essential water service to the community. Long Term Financial Planning. The District did not issue bonds in fiscal year 2011 except for bonds issued for the benefit, and additionally secured by the revenues, of the SNWA. (See Note 4, Long-Term Debt). However, in June 2010, the District issued refunding bonds that refunded and/or defeased certain maturities of four outstanding bond issues that reduced principal payments by $9,075,000 in fiscal year 2011 and will reduce principal payments by $9,535,000 in fiscal year 2012. Also in June 2010, the District issued $75,995,000 Taxable Direct Pay Build America Bonds (BABS) that provide a federal subsidy to the District of 35 percent of the interest expense. A substantial amount of the principal repayment is deferred toward the end of the payment schedule, preserving needed current financial resources, supporting a more level debt service structure, and maximizing the amount of the BABS interest subsidy.
3
Major initiatives. As current economic challenges continue to face our community, the District has carried out major initiatives to become a more adaptable, efficient, and responsive organization. These initiatives are outlined below.
• The District has made substantial efforts to assist customers by offering payment plans, conducting courtesy calls and by using other customer-management tools. In calendar year 2010, the District entered into about 9,000 payment arrangements with customers and another 5,342 payment arrangements through June 30, 2011. The District also educated customers on innovative ways to conserve water and to prevent water waste, as well as assisted customers with high-consumption issues. Further, the District implemented a newly installed automated dialer system that reminds customers of delinquencies. This system has increased collection rates and has helped save more than $3.5 million in costs associated with starting and stopping service.
• The District continues to review software licenses and their current business requirements with the goal of removing unused licenses to reduce operating costs. Over the past four years, the District has achieved a cumulative savings of approximately $2.5 million through these efforts.
• In fiscal year 2011, the Springs Preserve held 22 special events; provided field trips for more than 28,000 Clark County School District students; hosted more than 800 attendees as part of its garden educational offerings; and hosted more than 277 teachers as part of the Teach the Teacher Program.
• In fiscal year 2011, the District saved over $2.3 million by obtaining additional quotes on purchase requisitions, rebidding versus renewing contract requirements when possible, and negotiating all sole source contracts and contract renewals.
• The District provided technical assistance in working with the U.S. and Mexico Sections of the
International Boundary and Water Commission on an accord known as Minute 318. Importantly, the agreement helps protect water levels in Lake Mead by scheduling future water deliveries in such a fashion so as not to trigger or exacerbate any potential shortage conditions in the United States.
SEC REQUIREMENT On November 10, 1994, the U.S. Securities and Exchange Commission (SEC) amended the Securities Exchange Act of 1934, Rule 15c2-12, regarding continuing disclosure by issuers of municipal securities for the benefit of holders of such securities. Along with other requirements, the amendments require that certain annual financial information be provided to various information repositories for bond issues sold on or after July 3, 1995. The annual financial information must include an update of the same historical financial statements that are included in the final official statement issued at the time of the bond sale. The required annual financial information for the District is incorporated in the Statements of Revenues, Expenses, and Changes in Fund Equity, page 18, and in Note 4, Long Term Debt, pages 29 to 34, inclusive. Additional required information can be found in the Statistical Section on pages 54 to 83, inclusive. The District forwards its CAFR to the appropriate information repositories.
AWARDS AND ACKNOWLEDGMENTS The Government Finance Officers Association (GFOA) of the United States and Canada awarded a “Certificate of Achievement for Excellence in Financial Reporting” to the District for its CAFR for the
4
fiscal year ended June 30, 2010. This is a prestigious national award recognizing conformance with the highest standards for the preparation of state and local government financial reports.
To receive this award, a governmental unit must publish an easily readable and efficiently organized financial report that conforms to program standards. Such reports must satisfy both accounting principles generally accepted in the United States as well as other applicable legal requirements. The District has received this award for the last 31 consecutive years.
In addition, the District has also received the GFOA's "Distinguished Budget Presentation Award" for its budget documents for the previous 16 consecutive years. In order to receive this award, a governmental unit must publish a budget document that meets program criteria as an operations guide, a financial plan and a policy and communication document.
The Distinguished Budget Presentation Award is awarded on an annual basis. We believe the current budget continues to conform to program requirements and we have submitted it for award consideration.
We also believe this report continues to conform to certificate requirements and plan to submit it to the GFOA after approval from the Board.
We express our appreciation to the District' s accounting staff for their dedication in the preparation of this report, the staff members of other departments for their assistance, and the auditing firm of Piercy Bowler Taylor & Kern for their professional services. We also want to thank the members of the Board of Directors for their continued support and sound governance.
William F. Fox Chief Financial Officer
5
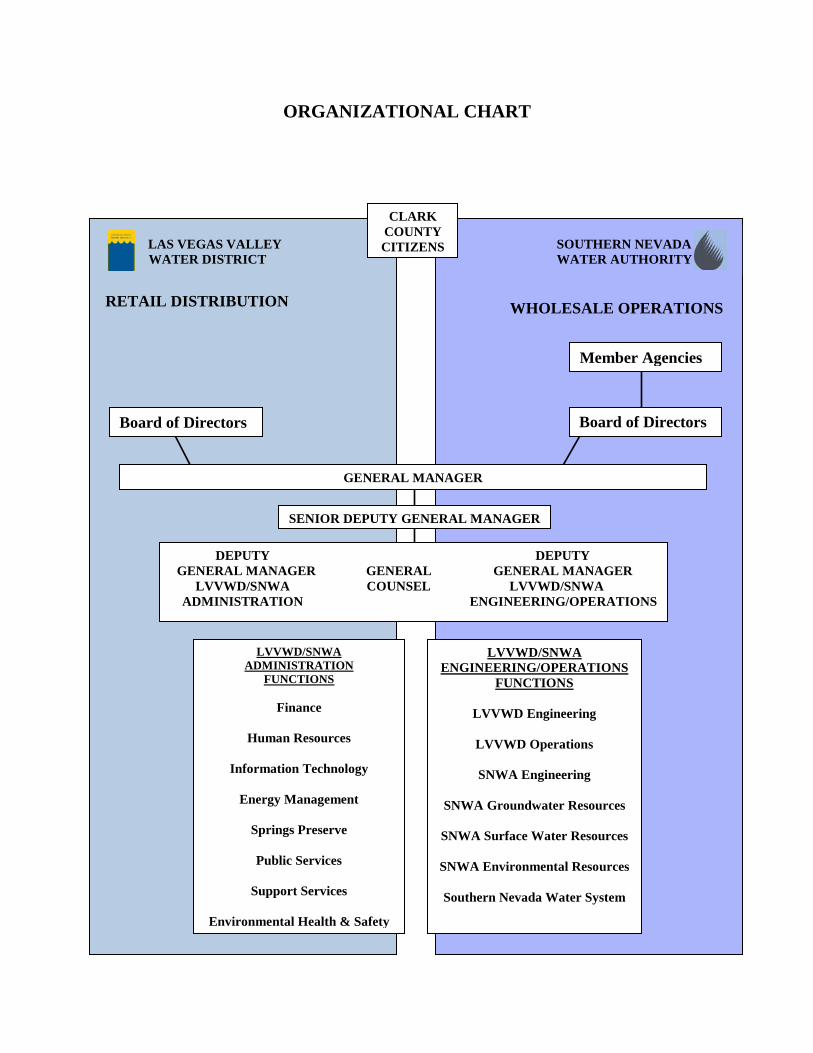
ORGANIZATIONAL CHART
SOUTHERN NEVADA WATER AUTHORITY
LAS VEGAS VALLEY WATER DISTRICT
CLARK COUNTY CITIZENS
WHOLESALE OPERATIONS RETAIL DISTRIBUTION
Member Agencies
Board of Directors Board of Directors
LVVWD/SNWA ADMINISTRATION
FUNCTIONS
Finance
Human Resources
Information Technology
Energy Management
Springs Preserve
Public Services
Support Services
Environmental Health & Safety
LVVWD/SNWA ENGINEERING/OPERATIONS
FUNCTIONS
LVVWD Engineering
LVVWD Operations
SNWA Engineering
SNWA Groundwater Resources
SNWA Surface Water Resources
SNWA Environmental Resources Southern Nevada Water System
GENERAL MANAGER
DEPUTY DEPUTY GENERAL MANAGER GENERAL GENERAL MANAGER
LVVWD/SNWA COUNSEL LVVWD/SNWA ADMINISTRATION ENGINEERING/OPERATIONS
SENIOR DEPUTY GENERAL MANAGER

THIS PAGE LEFT
INTENTIONALLY BLANK
FINANCIAL SECTION
Independent Auditors’ Report on Financial Statements and Supplementary Information
Management’s Discussion and Analysis
Basic Financial Statements
Required Supplementary Information

PBTK PIERCY BOWLER TAYLOR & KERN Certified Public Accountants
Business Advisors
Board of Directors
INDEPENDENT AUDITORS' REPORT ON FINANCIAL STATEMENTS AND SUPPLEMENTARY INFORMATION
Las Vegas Valley Water District Las Vegas, Nevada
We have audited the accompanying basic financial statements of the Las Vegas Valley Water District (the District) as of and for the years ended June 30, 2011 and 2010, as listed in the table of contents. These financial statements are the responsibility of the District's management. Our responsibility is to express an opinion on these financial statements based on our audits.
We conducted our audits in accordance with auditing standards generally accepted in the United States of America and the standards applicable to financial statement audits contained in Government Auditing Standards, issued by the Comptroller General of the United States. Those standards require that we plan and perform the audit to obtain reasonable assurance about whether the basic financial statements are free of material misstatement. An audit includes consideration of internal control over financial reporting as a basis for designing audit procedures that are appropriate in the circumstances, but not for the purpose of expressing an opinion on the effectiveness of the District's internal control over financial reporting. Accordingly, we express no such opinion. An audit includes examining, on a test basis, evidence supporting the amounts and disclosures in the basic financial statements. An audit also includes assessing the accounting principles used and significant estimates made by management, as well as evaluating the overall financial statement presentation. We believe that our audits provide a reasonable basis for our opinion.
In our opinion, the basic financial statements referred to above present fairly, in all material respects, the financial position of the District, as of June 30, 2011 and 2010, and the results of its operations and cash flows for the years then ended in conformity with accounting principles generally accepted in the United States of America.
In accordance with Government Auditing Standards, we have also issued our report dated November 9, 2011, on our consideration of the District's internal control over financial reporting and on our tests of its compliance with certain provisions of laws, regulations, contracts, and grant agreements and other matters. The purpose of that report is to describe the scope of our testing of internal control over financial reporting and compliance and the results of that testing, and not to provide an opinion on internal control over financial reporting or on compliance. That report is an integral part of an audit performed in accordance with Government Auditing Standards and should be considered in assessing the results of our audits.
The management's discussion and analysis, schedule of employer contribution and schedules of funding progress on pages 9 through 15 and 51 through 53, respectively, are not a required part of the basic financial statements but are supplementary information required by accounting principles generally accepted in the United States of America. We have applied certain limited procedures, which consisted principally of inquiries of management regarding the methods of measurement and presentation of the required supplementary information. However, we did not audit the information, and therefore, express no opinion on it.
Our audits were made for the purpose of forming an opinion on the financial statements that collectively comprise the District's basic financial statements. The introductory section and statistical section are presented for purposes of additional analysis and are not a required part of the basic financial statements and have not been subjected to the auditing procedures applied in the audits of the basic financial statements. Accordingly, we express no opinion on them.
~~~~I+{~ November 9, 2011
6100 Elton Avenu e, Ste. 1000 • Las \ 'egas, Nevada 89107 • 702-384-1120 • fax 702-87G-2474 • pbtk.com

MANAGEMENT’S DISCUSSION AND ANALYSIS We offer readers this narrative overview and analysis of the of the Las Vegas Valley Water District’s (District) financial activities for the fiscal year ended June 30, 2011. We encourage readers to consider the information presented here in conjunction with our audited basic financial statements and additional information furnished in our letter of transmittal, which can be found on pages 1-5 of this report. Unless otherwise indicated, all amounts are expressed in thousands of dollars. Fiscal Year 2011 Financial Highlights • Unrestricted Fund Equity increased by $22.9 million to $112.7 million in fiscal year 2011, primarily
reflecting reduced operating capital expenditures.
• Assets exceeded liabilities by $1.1 billion at June 30, 2011. Of this amount $112.7 million (unrestricted fund equity as noted above) may be used to meet the District’s ongoing obligations to its customers and creditors.
• Unrestricted cash and investments increased by $28.5 million at June 30, 2011, primarily attributable
to a 4% water service charge increase effective January 1, 2011, and reduced capital and bond debt expenditures.
• Operating income before depreciation for fiscal year 2011 increased by $2.7 million over fiscal year
2010, chiefly due to the 4% water service increase effective January 1, 2011.
• Net loss for fiscal year 2011 was $3.2 million more than in fiscal year 2010, primarily due to increased bond interest expense.
• Capital assets at June 30, 2011 decreased by $59.0 million because depreciation expense and
retirements exceeded capital contributions and because of significantly reduced capital expenditures. Overview of financial statements. This discussion and analysis is intended to serve as an introduction to the District’s basic financial statements. The District’s basic financial statements are comprised of three components: 1) a proprietary (enterprise) fund, 2) a fiduciary pension trust fund, and 3) notes to the basic financial statements. This report also contains supplementary and statistical information in addition to the basic financial statements. Fund financial statements. A fund is a fiscal and accounting entity with a self-balancing set of accounts recording cash and other financial resources, together with all related liabilities and residual equities or balances and changes therein, which are segregated for specific activities or objectives. The District maintains two types of funds: a proprietary fund and a fiduciary pension trust fund. Proprietary fund. The proprietary fund reports all of the District’s operations, except for pension activity. The operations are reported similar to a private-sector business enterprise. There are three components presented in the basic financial statements: 1) comparative balance sheets, 2) comparative statements of revenues, expenditures and changes in fund equity, and 3) comparative statements of cash flows. These can be found on pages 16-19 of this report. The comparative balance sheets present the District’s assets and liabilities, with the difference reported as “fund equity.” Over time, increases or decreases in fund equity may serve as a useful indicator of whether the financial position of the District is improving or deteriorating. The comparative statements of revenues, expenses and changes in fund equity outline how the District’s fund equity has changed over time. All changes in fund equity are reported as soon as the underlying event
9
giving rise to the change occurs, regardless of the timing of related cash flows. Thus, revenues and expenses are reported in this statement for some items that will result in cash flows in future fiscal years. The statements of cash flows are the third basic financial statement for the proprietary fund. The primary purpose of the statements of cash flow is to provide relevant information about the District’s cash receipts and cash payments; these are segregated between operating, capital and related financing, and investing activities. Fiduciary pension trust fund. The fiduciary pension trust fund accounts for the assets, liabilities and changes in net assets of the District’s defined benefit pension plan. The fiduciary fund is not reflected in the proprietary fund financial statement because fiduciary fund resources are not available to support District operations. The fiduciary pension trust fund is accounted for in essentially the same manner as the proprietary fund. The fiduciary pension trust fund financial statements can be found on pages 20-21 of this report. Notes to the basic financial statements. The notes provide additional information that is essential to a full understanding of the data provided in the District’s basic financial statements. The notes to the basic financial statements can be found on pages 22-50 of this report. Required supplementary information. In addition to the basic financial statements and accompanying notes, this report includes required supplementary information describing the District’s contributions to, and funding progress of, the pension plan for District employees. Also included is a schedule of funding progress for the District’s postemployment benefits other than pensions. Required supplementary information can be found on pages 51-53 of this report.
10
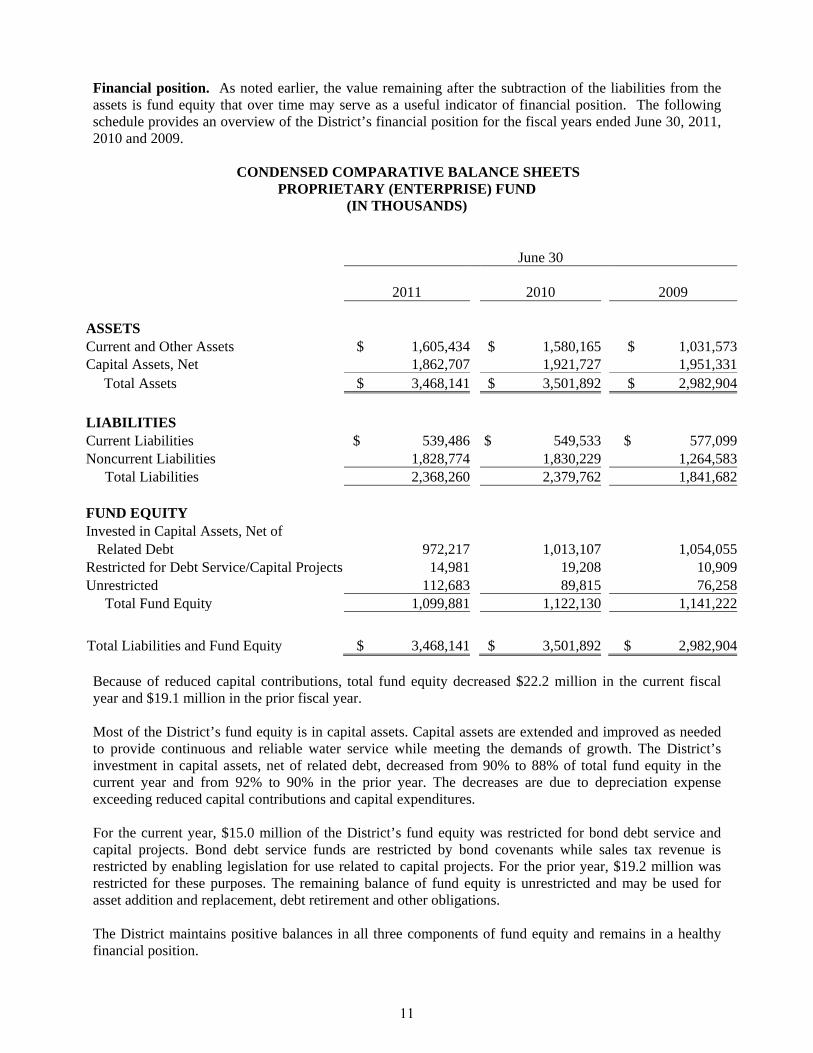
Financial position. As noted earlier, the value remaining after the subtraction of the liabilities from the assets is fund equity that over time may serve as a useful indicator of financial position. The following schedule provides an overview of the District’s financial position for the fiscal years ended June 30, 2011, 2010 and 2009.
CONDENSED COMPARATIVE BALANCE SHEETS
PROPRIETARY (ENTERPRISE) FUND (IN THOUSANDS)
June 30
2011
2010 2009
ASSETS Current and Other Assets $ 1,605,434 $ 1,580,165 $ 1,031,573 Capital Assets, Net 1,862,707 1,921,727 1,951,331 Total Assets $ 3,468,141 $ 3,501,892 $ 2,982,904
LIABILITIES Current Liabilities $ 539,486 $ 549,533 $ 577,099 Noncurrent Liabilities 1,828,774 1,830,229 1,264,583
Total Liabilities 2,368,260 2,379,762 1,841,682 FUND EQUITY Invested in Capital Assets, Net of Related Debt 972,217 1,013,107 1,054,055 Restricted for Debt Service/Capital Projects 14,981 19,208 10,909 Unrestricted 112,683 89,815 76,258
Total Fund Equity 1,099,881 1,122,130 1,141,222
Total Liabilities and Fund Equity $ 3,468,141 $ 3,501,892 $ 2,982,904 Because of reduced capital contributions, total fund equity decreased $22.2 million in the current fiscal year and $19.1 million in the prior fiscal year. Most of the District’s fund equity is in capital assets. Capital assets are extended and improved as needed to provide continuous and reliable water service while meeting the demands of growth. The District’s investment in capital assets, net of related debt, decreased from 90% to 88% of total fund equity in the current year and from 92% to 90% in the prior year. The decreases are due to depreciation expense exceeding reduced capital contributions and capital expenditures. For the current year, $15.0 million of the District’s fund equity was restricted for bond debt service and capital projects. Bond debt service funds are restricted by bond covenants while sales tax revenue is restricted by enabling legislation for use related to capital projects. For the prior year, $19.2 million was restricted for these purposes. The remaining balance of fund equity is unrestricted and may be used for asset addition and replacement, debt retirement and other obligations. The District maintains positive balances in all three components of fund equity and remains in a healthy financial position.
11
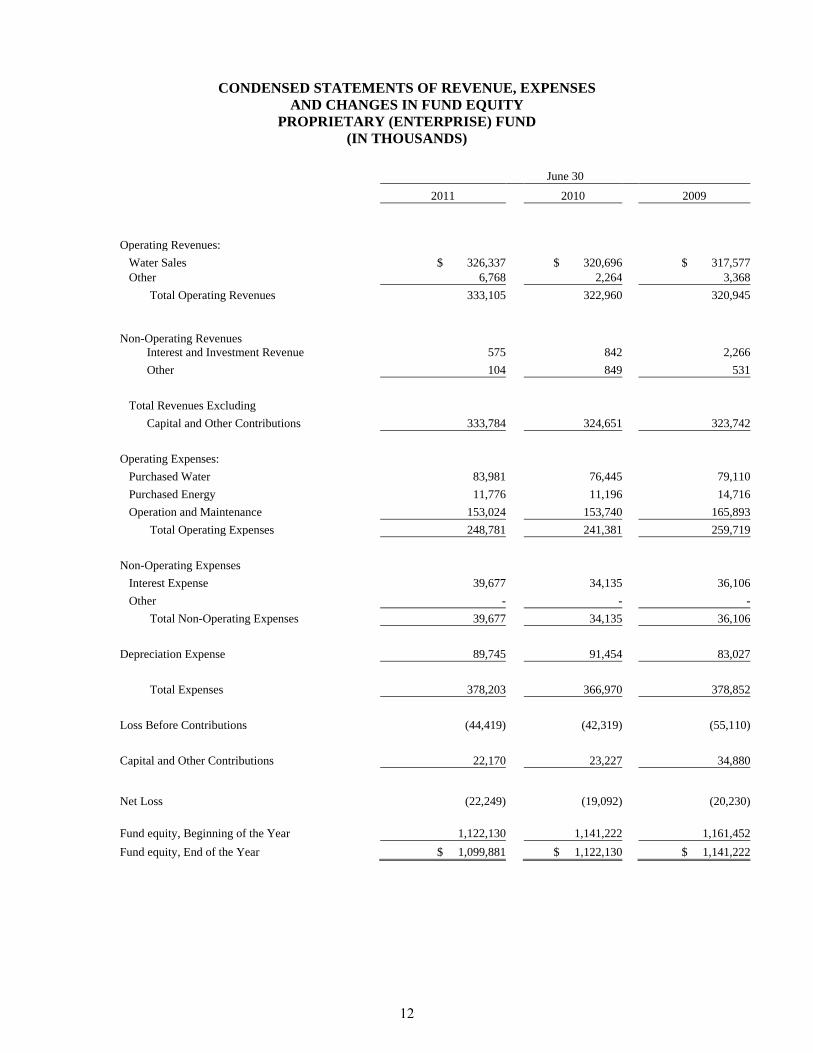
CONDENSED STATEMENTS OF REVENUE, EXPENSES AND CHANGES IN FUND EQUITY
PROPRIETARY (ENTERPRISE) FUND (IN THOUSANDS)
June 30
2011 2010 2009 Operating Revenues:
Water Sales $ 326,337 $ 320,696 $ 317,577 Other 6,768 2,264 3,368 Total Operating Revenues 333,105 322,960 320,945
Non-Operating Revenues Interest and Investment Revenue
575
842
2,266
Other 104 849 531 Total Revenues Excluding Capital and Other Contributions 333,784 324,651 323,742 Operating Expenses: Purchased Water 83,981 76,445 79,110 Purchased Energy 11,776 11,196 14,716 Operation and Maintenance 153,024 153,740 165,893 Total Operating Expenses 248,781 241,381 259,719 Non-Operating Expenses Interest Expense 39,677 34,135 36,106 Other - - - Total Non-Operating Expenses 39,677 34,135 36,106 Depreciation Expense 89,745 91,454 83,027 Total Expenses 378,203 366,970 378,852 Loss Before Contributions (44,419) (42,319) (55,110) Capital and Other Contributions 22,170 23,227 34,880
Net Loss (22,249) (19,092)
(20,230)
Fund equity, Beginning of the Year 1,122,130 1,141,222
1,161,452 Fund equity, End of the Year $ 1,099,881 $ 1,122,130 $ 1,141,222
12
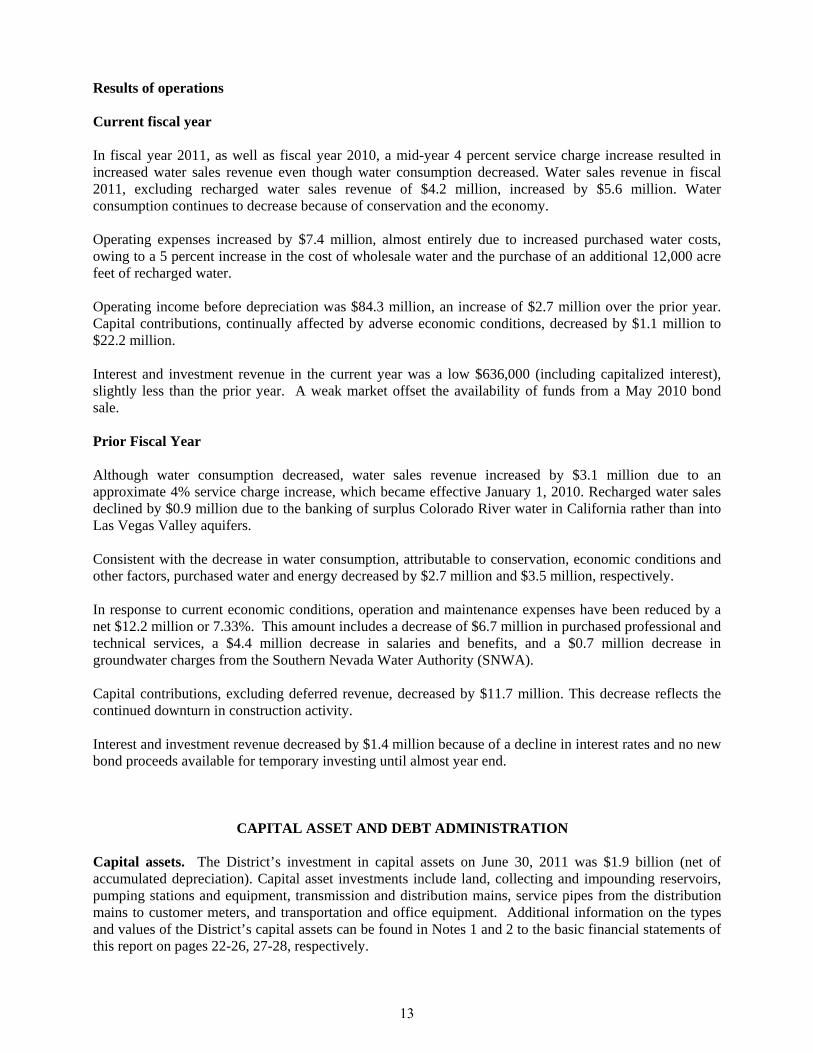
Results of operations Current fiscal year In fiscal year 2011, as well as fiscal year 2010, a mid-year 4 percent service charge increase resulted in increased water sales revenue even though water consumption decreased. Water sales revenue in fiscal 2011, excluding recharged water sales revenue of $4.2 million, increased by $5.6 million. Water consumption continues to decrease because of conservation and the economy. Operating expenses increased by $7.4 million, almost entirely due to increased purchased water costs, owing to a 5 percent increase in the cost of wholesale water and the purchase of an additional 12,000 acre feet of recharged water. Operating income before depreciation was $84.3 million, an increase of $2.7 million over the prior year. Capital contributions, continually affected by adverse economic conditions, decreased by $1.1 million to $22.2 million. Interest and investment revenue in the current year was a low $636,000 (including capitalized interest), slightly less than the prior year. A weak market offset the availability of funds from a May 2010 bond sale. Prior Fiscal Year Although water consumption decreased, water sales revenue increased by $3.1 million due to an approximate 4% service charge increase, which became effective January 1, 2010. Recharged water sales declined by $0.9 million due to the banking of surplus Colorado River water in California rather than into Las Vegas Valley aquifers. Consistent with the decrease in water consumption, attributable to conservation, economic conditions and other factors, purchased water and energy decreased by $2.7 million and $3.5 million, respectively. In response to current economic conditions, operation and maintenance expenses have been reduced by a net $12.2 million or 7.33%. This amount includes a decrease of $6.7 million in purchased professional and technical services, a $4.4 million decrease in salaries and benefits, and a $0.7 million decrease in groundwater charges from the Southern Nevada Water Authority (SNWA). Capital contributions, excluding deferred revenue, decreased by $11.7 million. This decrease reflects the continued downturn in construction activity. Interest and investment revenue decreased by $1.4 million because of a decline in interest rates and no new bond proceeds available for temporary investing until almost year end.
CAPITAL ASSET AND DEBT ADMINISTRATION Capital assets. The District’s investment in capital assets on June 30, 2011 was $1.9 billion (net of accumulated depreciation). Capital asset investments include land, collecting and impounding reservoirs, pumping stations and equipment, transmission and distribution mains, service pipes from the distribution mains to customer meters, and transportation and office equipment. Additional information on the types and values of the District’s capital assets can be found in Notes 1 and 2 to the basic financial statements of this report on pages 22-26, 27-28, respectively.
13
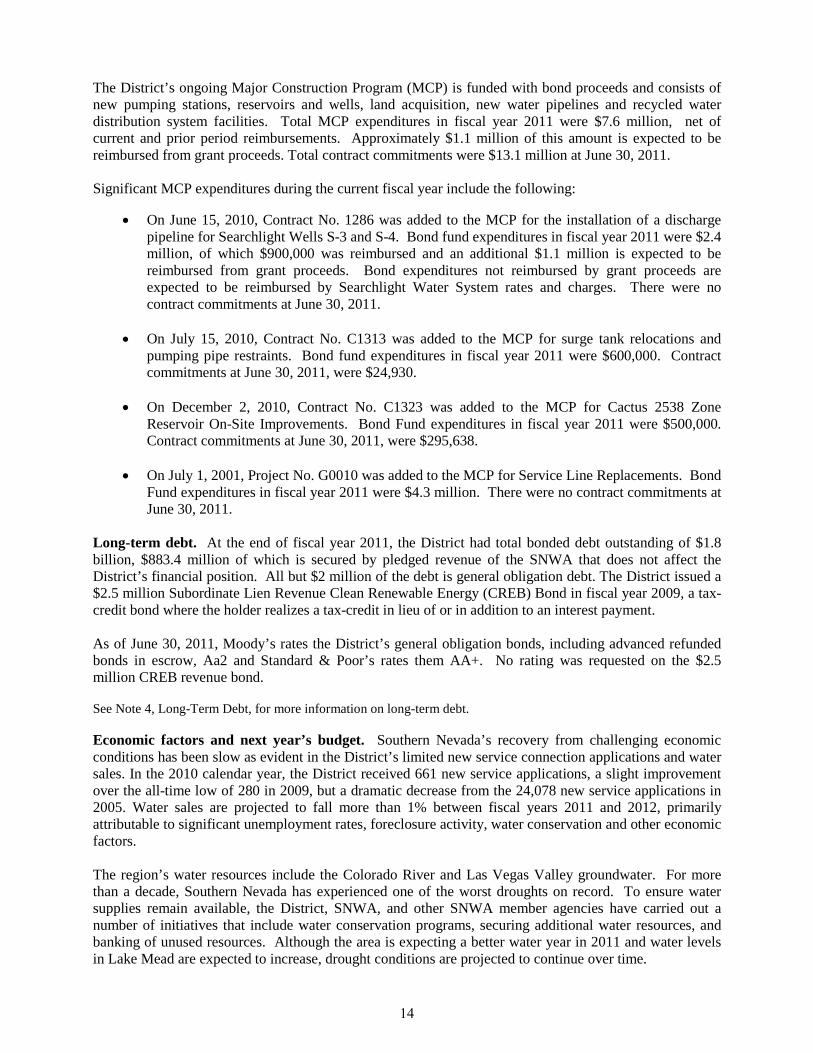
The District’s ongoing Major Construction Program (MCP) is funded with bond proceeds and consists of new pumping stations, reservoirs and wells, land acquisition, new water pipelines and recycled water distribution system facilities. Total MCP expenditures in fiscal year 2011 were $7.6 million, net of current and prior period reimbursements. Approximately $1.1 million of this amount is expected to be reimbursed from grant proceeds. Total contract commitments were $13.1 million at June 30, 2011. Significant MCP expenditures during the current fiscal year include the following:
• On June 15, 2010, Contract No. 1286 was added to the MCP for the installation of a discharge pipeline for Searchlight Wells S-3 and S-4. Bond fund expenditures in fiscal year 2011 were $2.4 million, of which $900,000 was reimbursed and an additional $1.1 million is expected to be reimbursed from grant proceeds. Bond expenditures not reimbursed by grant proceeds are expected to be reimbursed by Searchlight Water System rates and charges. There were no contract commitments at June 30, 2011.
• On July 15, 2010, Contract No. C1313 was added to the MCP for surge tank relocations and
pumping pipe restraints. Bond fund expenditures in fiscal year 2011 were $600,000. Contract commitments at June 30, 2011, were $24,930.
• On December 2, 2010, Contract No. C1323 was added to the MCP for Cactus 2538 Zone
Reservoir On-Site Improvements. Bond Fund expenditures in fiscal year 2011 were $500,000. Contract commitments at June 30, 2011, were $295,638.
• On July 1, 2001, Project No. G0010 was added to the MCP for Service Line Replacements. Bond
Fund expenditures in fiscal year 2011 were $4.3 million. There were no contract commitments at June 30, 2011.
Long-term debt. At the end of fiscal year 2011, the District had total bonded debt outstanding of $1.8 billion, $883.4 million of which is secured by pledged revenue of the SNWA that does not affect the District’s financial position. All but $2 million of the debt is general obligation debt. The District issued a $2.5 million Subordinate Lien Revenue Clean Renewable Energy (CREB) Bond in fiscal year 2009, a tax-credit bond where the holder realizes a tax-credit in lieu of or in addition to an interest payment. As of June 30, 2011, Moody’s rates the District’s general obligation bonds, including advanced refunded bonds in escrow, Aa2 and Standard & Poor’s rates them AA+. No rating was requested on the $2.5 million CREB revenue bond. See Note 4, Long-Term Debt, for more information on long-term debt. Economic factors and next year’s budget. Southern Nevada’s recovery from challenging economic conditions has been slow as evident in the District’s limited new service connection applications and water sales. In the 2010 calendar year, the District received 661 new service applications, a slight improvement over the all-time low of 280 in 2009, but a dramatic decrease from the 24,078 new service applications in 2005. Water sales are projected to fall more than 1% between fiscal years 2011 and 2012, primarily attributable to significant unemployment rates, foreclosure activity, water conservation and other economic factors.
The region’s water resources include the Colorado River and Las Vegas Valley groundwater. For more than a decade, Southern Nevada has experienced one of the worst droughts on record. To ensure water supplies remain available, the District, SNWA, and other SNWA member agencies have carried out a number of initiatives that include water conservation programs, securing additional water resources, and banking of unused resources. Although the area is expecting a better water year in 2011 and water levels in Lake Mead are expected to increase, drought conditions are projected to continue over time.
14
The budget for fiscal year 2012 reflects a continuation of strategies to restrict non-critical expenditures and streamline operations. Primary decreases will be in bond payments, payroll, energy, and capital equipment. Budgeted decreases total $9 million, a 2.7% decrease from the 2011 fiscal year budget. The 2012 budget anticipates no rate increase. Requests for information. This financial report is designed to provide a general overview of the District’s finances. Questions concerning any of the information provided in this report, or requests for additional information, should be addressed to the Office of the Chief Financial Officer, Las Vegas Valley Water District, 1001 South Valley View Blvd, Las Vegas, NV 89153 (telephone number 702-258-3106). This report is also available on our Website: http://www.lvvwd.com/about/financial_cafr.html.
15
The accompanying notes are an integral part of these basic financial statements.
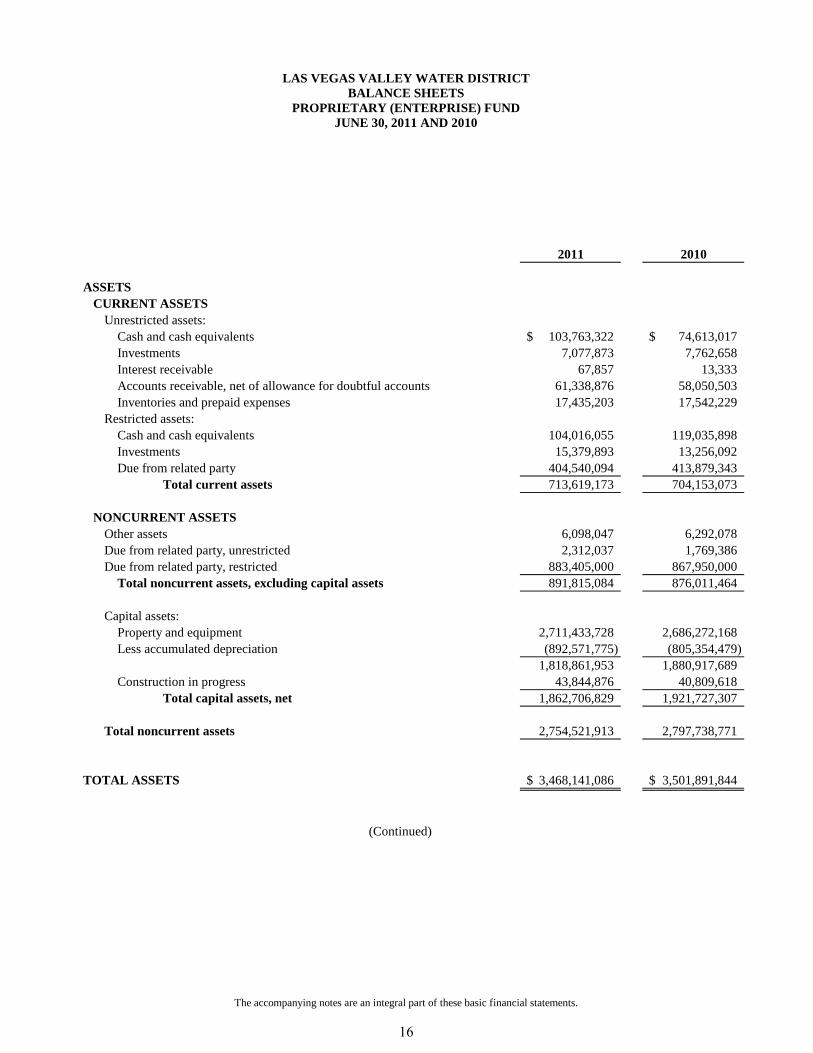
2011 2010
ASSETSCURRENT ASSETS
Unrestricted assets:Cash and cash equivalents 103,763,322$ 74,613,017$ Investments 7,077,873 7,762,658Interest receivable 67,857 13,333Accounts receivable, net of allowance for doubtful accounts 61,338,876 58,050,503Inventories and prepaid expenses 17,435,203 17,542,229
Restricted assets:Cash and cash equivalents 104,016,055 119,035,898 Investments 15,379,893 13,256,092 Due from related party 404,540,094 413,879,343
Total current assets 713,619,173 704,153,073
NONCURRENT ASSETSOther assets 6,098,047 6,292,078Due from related party, unrestricted 2,312,037 1,769,386Due from related party, restricted 883,405,000 867,950,000
Total noncurrent assets, excluding capital assets 891,815,084 876,011,464
Capital assets:Property and equipment 2,711,433,728 2,686,272,168 Less accumulated depreciation (892,571,775) (805,354,479)
1,818,861,953 1,880,917,689Construction in progress 43,844,876 40,809,618
Total capital assets, net 1,862,706,829 1,921,727,307
Total noncurrent assets 2,754,521,913 2,797,738,771
TOTAL ASSETS 3,468,141,086$ 3,501,891,844$
(Continued)
LAS VEGAS VALLEY WATER DISTRICTBALANCE SHEETS
PROPRIETARY (ENTERPRISE) FUNDJUNE 30, 2011 AND 2010
16
The accompanying notes are an integral part of these basic financial statements.
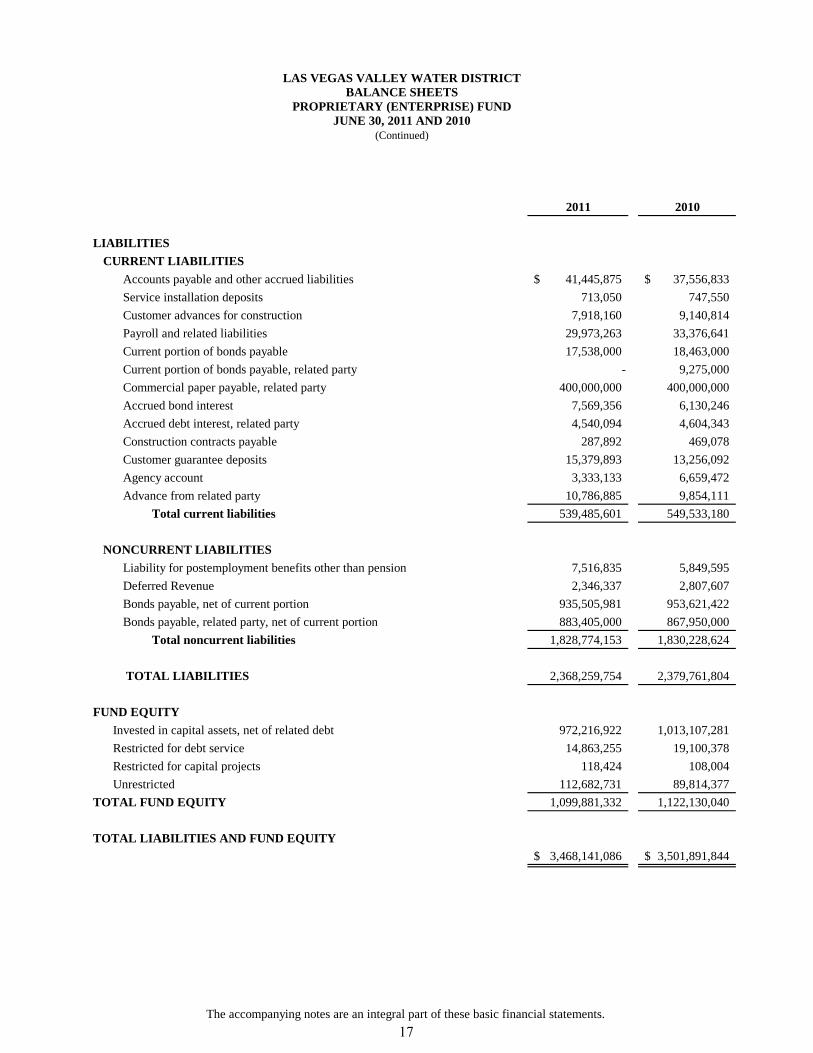
2011 2010
LIABILITIESCURRENT LIABILITIES
Accounts payable and other accrued liabilities 41,445,875$ 37,556,833$ Service installation deposits 713,050 747,550Customer advances for construction 7,918,160 9,140,814Payroll and related liabilities 29,973,263 33,376,641 Current portion of bonds payable 17,538,000 18,463,000Current portion of bonds payable, related party - 9,275,000Commercial paper payable, related party 400,000,000 400,000,000Accrued bond interest 7,569,356 6,130,246Accrued debt interest, related party 4,540,094 4,604,343Construction contracts payable 287,892 469,078Customer guarantee deposits 15,379,893 13,256,092Agency account 3,333,133 6,659,472Advance from related party 10,786,885 9,854,111
Total current liabilities 539,485,601 549,533,180
NONCURRENT LIABILITIESLiability for postemployment benefits other than pension 7,516,835 5,849,595Deferred Revenue 2,346,337 2,807,607Bonds payable, net of current portion 935,505,981 953,621,422Bonds payable, related party, net of current portion 883,405,000 867,950,000
Total noncurrent liabilities 1,828,774,153 1,830,228,624
TOTAL LIABILITIES 2,368,259,754 2,379,761,804
FUND EQUITYInvested in capital assets, net of related debt 972,216,922 1,013,107,281 Restricted for debt service 14,863,255 19,100,378Restricted for capital projects 118,424 108,004Unrestricted 112,682,731 89,814,377
TOTAL FUND EQUITY 1,099,881,332 1,122,130,040
TOTAL LIABILITIES AND FUND EQUITY3,468,141,086$ 3,501,891,844$
LAS VEGAS VALLEY WATER DISTRICTBALANCE SHEETS
PROPRIETARY (ENTERPRISE) FUNDJUNE 30, 2011 AND 2010
(Continued)
17
The accompanying notes are an integral part of these basic financial statements.
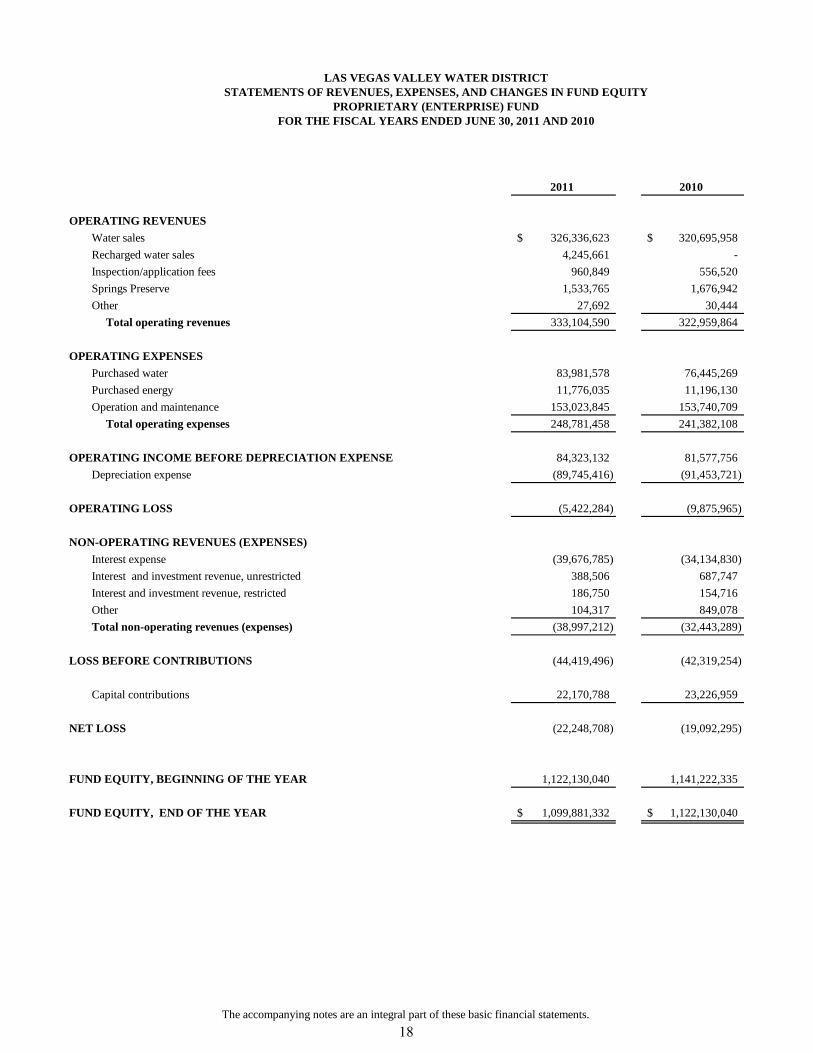
2011 2010
OPERATING REVENUESWater sales 326,336,623$ 320,695,958$ Recharged water sales 4,245,661 - Inspection/application fees 960,849 556,520Springs Preserve 1,533,765 1,676,942Other 27,692 30,444
Total operating revenues 333,104,590 322,959,864
OPERATING EXPENSESPurchased water 83,981,578 76,445,269Purchased energy 11,776,035 11,196,130Operation and maintenance 153,023,845 153,740,709
Total operating expenses 248,781,458 241,382,108
OPERATING INCOME BEFORE DEPRECIATION EXPENSE 84,323,132 81,577,756Depreciation expense (89,745,416) (91,453,721)
OPERATING LOSS (5,422,284) (9,875,965)
NON-OPERATING REVENUES (EXPENSES)Interest expense (39,676,785) (34,134,830) Interest and investment revenue, unrestricted 388,506 687,747 Interest and investment revenue, restricted 186,750 154,716Other 104,317 849,078 Total non-operating revenues (expenses) (38,997,212) (32,443,289)
LOSS BEFORE CONTRIBUTIONS (44,419,496) (42,319,254)
Capital contributions 22,170,788 23,226,959
NET LOSS (22,248,708) (19,092,295)
FUND EQUITY, BEGINNING OF THE YEAR 1,122,130,040 1,141,222,335
FUND EQUITY, END OF THE YEAR 1,099,881,332$ 1,122,130,040$
LAS VEGAS VALLEY WATER DISTRICTSTATEMENTS OF REVENUES, EXPENSES, AND CHANGES IN FUND EQUITY
PROPRIETARY (ENTERPRISE) FUNDFOR THE FISCAL YEARS ENDED JUNE 30, 2011 AND 2010
18
The accompanying notes are an integral part of these basic financial statements.
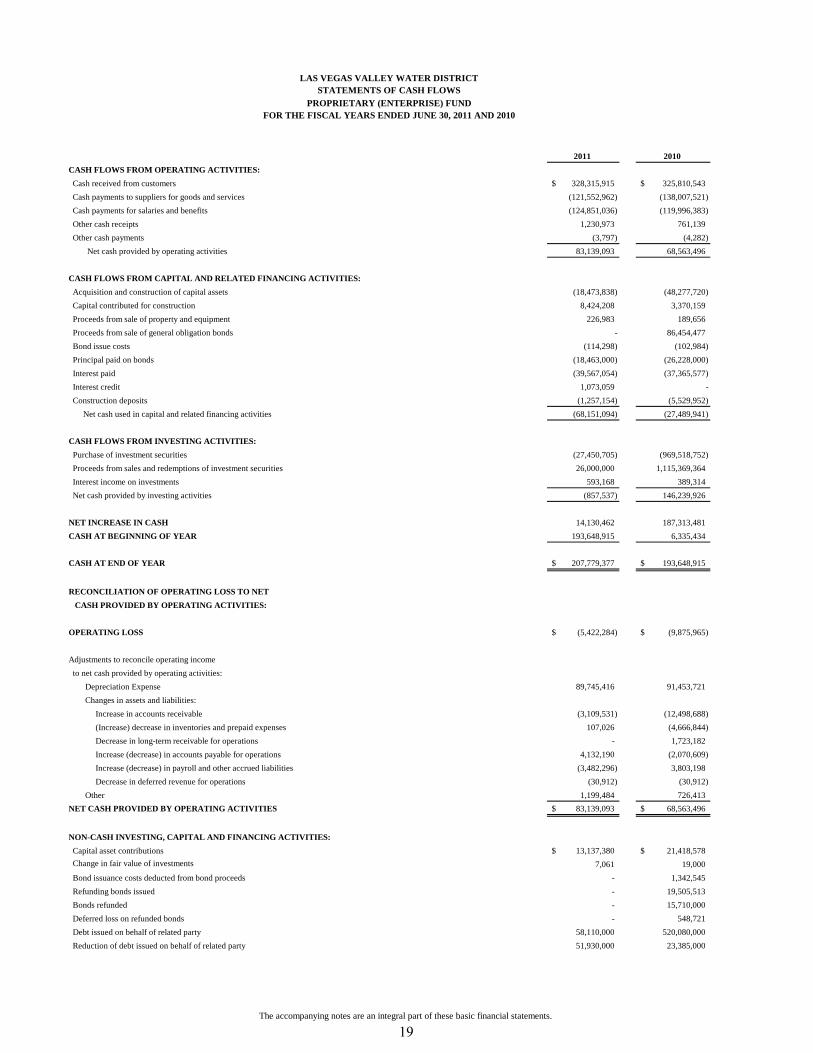
2011 2010CASH FLOWS FROM OPERATING ACTIVITIES: Cash received from customers 328,315,915$ 325,810,543$ Cash payments to suppliers for goods and services (121,552,962) (138,007,521) Cash payments for salaries and benefits (124,851,036) (119,996,383) Other cash receipts 1,230,973 761,139 Other cash payments (3,797) (4,282) Net cash provided by operating activities 83,139,093 68,563,496
CASH FLOWS FROM CAPITAL AND RELATED FINANCING ACTIVITIES: Acquisition and construction of capital assets (18,473,838) (48,277,720) Capital contributed for construction 8,424,208 3,370,159 Proceeds from sale of property and equipment 226,983 189,656 Proceeds from sale of general obligation bonds - 86,454,477 Bond issue costs (114,298) (102,984) Principal paid on bonds (18,463,000) (26,228,000) Interest paid (39,567,054) (37,365,577) Interest credit 1,073,059 - Construction deposits (1,257,154) (5,529,952) Net cash used in capital and related financing activities (68,151,094) (27,489,941)
CASH FLOWS FROM INVESTING ACTIVITIES: Purchase of investment securities (27,450,705) (969,518,752) Proceeds from sales and redemptions of investment securities 26,000,000 1,115,369,364 Interest income on investments 593,168 389,314 Net cash provided by investing activities (857,537) 146,239,926
NET INCREASE IN CASH 14,130,462 187,313,481CASH AT BEGINNING OF YEAR 193,648,915 6,335,434
CASH AT END OF YEAR 207,779,377$ 193,648,915$
RECONCILIATION OF OPERATING LOSS TO NET CASH PROVIDED BY OPERATING ACTIVITIES:
OPERATING LOSS (5,422,284)$ (9,875,965)$
Adjustments to reconcile operating income to net cash provided by operating activities: Depreciation Expense 89,745,416 91,453,721 Changes in assets and liabilities: Increase in accounts receivable (3,109,531) (12,498,688) (Increase) decrease in inventories and prepaid expenses 107,026 (4,666,844) Decrease in long-term receivable for operations - 1,723,182 Increase (decrease) in accounts payable for operations 4,132,190 (2,070,609) Increase (decrease) in payroll and other accrued liabilities (3,482,296) 3,803,198 Decrease in deferred revenue for operations (30,912) (30,912) Other 1,199,484 726,413 NET CASH PROVIDED BY OPERATING ACTIVITIES 83,139,093$ 68,563,496$
NON-CASH INVESTING, CAPITAL AND FINANCING ACTIVITIES: Capital asset contributions 13,137,380$ 21,418,578$ Change in fair value of investments 7,061 19,000 Bond issuance costs deducted from bond proceeds - 1,342,545 Refunding bonds issued - 19,505,513 Bonds refunded - 15,710,000 Deferred loss on refunded bonds - 548,721 Debt issued on behalf of related party 58,110,000 520,080,000 Reduction of debt issued on behalf of related party 51,930,000 23,385,000
LAS VEGAS VALLEY WATER DISTRICTSTATEMENTS OF CASH FLOWS
PROPRIETARY (ENTERPRISE) FUNDFOR THE FISCAL YEARS ENDED JUNE 30, 2011 AND 2010
19
The accompanying notes are an integral part of these basic financial statements.
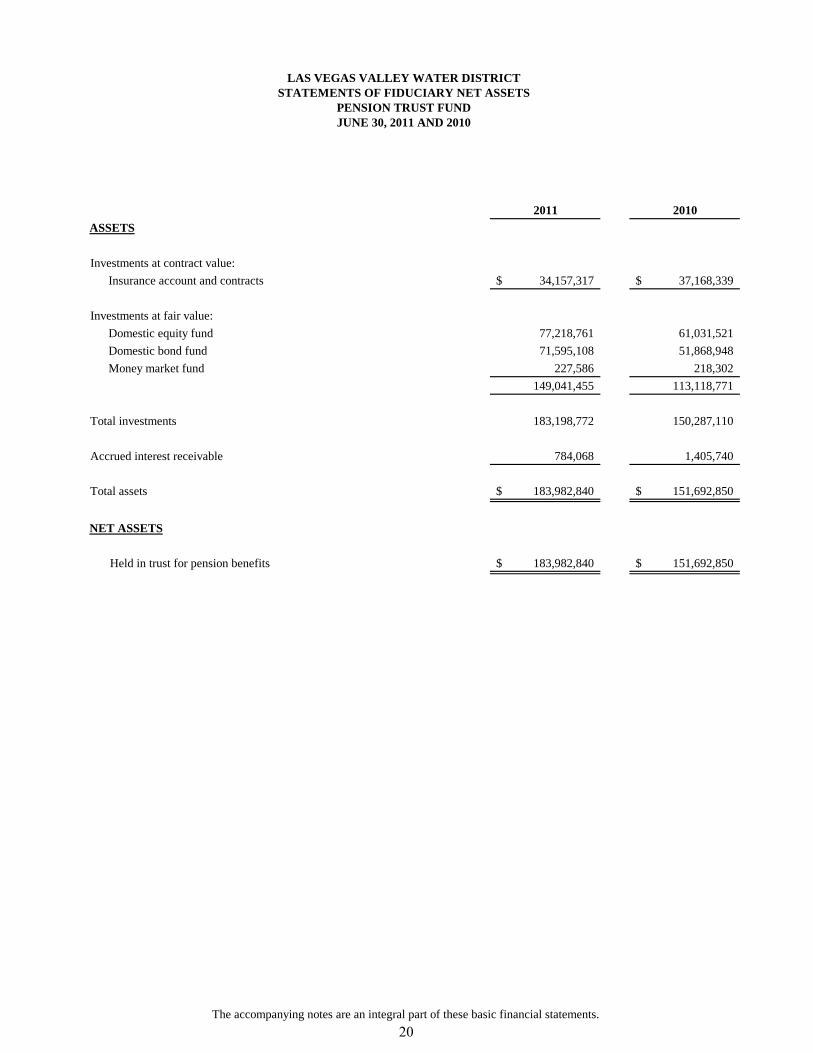
2011 2010ASSETS
Investments at contract value: Insurance account and contracts 34,157,317$ 37,168,339$
Investments at fair value: Domestic equity fund 77,218,761 61,031,521 Domestic bond fund 71,595,108 51,868,948 Money market fund 227,586 218,302
149,041,455 113,118,771
Total investments 183,198,772 150,287,110
Accrued interest receivable 784,068 1,405,740
Total assets 183,982,840$ 151,692,850$
NET ASSETS
Held in trust for pension benefits 183,982,840$ 151,692,850$
LAS VEGAS VALLEY WATER DISTRICTSTATEMENTS OF FIDUCIARY NET ASSETS
PENSION TRUST FUNDJUNE 30, 2011 AND 2010
20
The accompanying notes are an integral part of these basic financial statements.
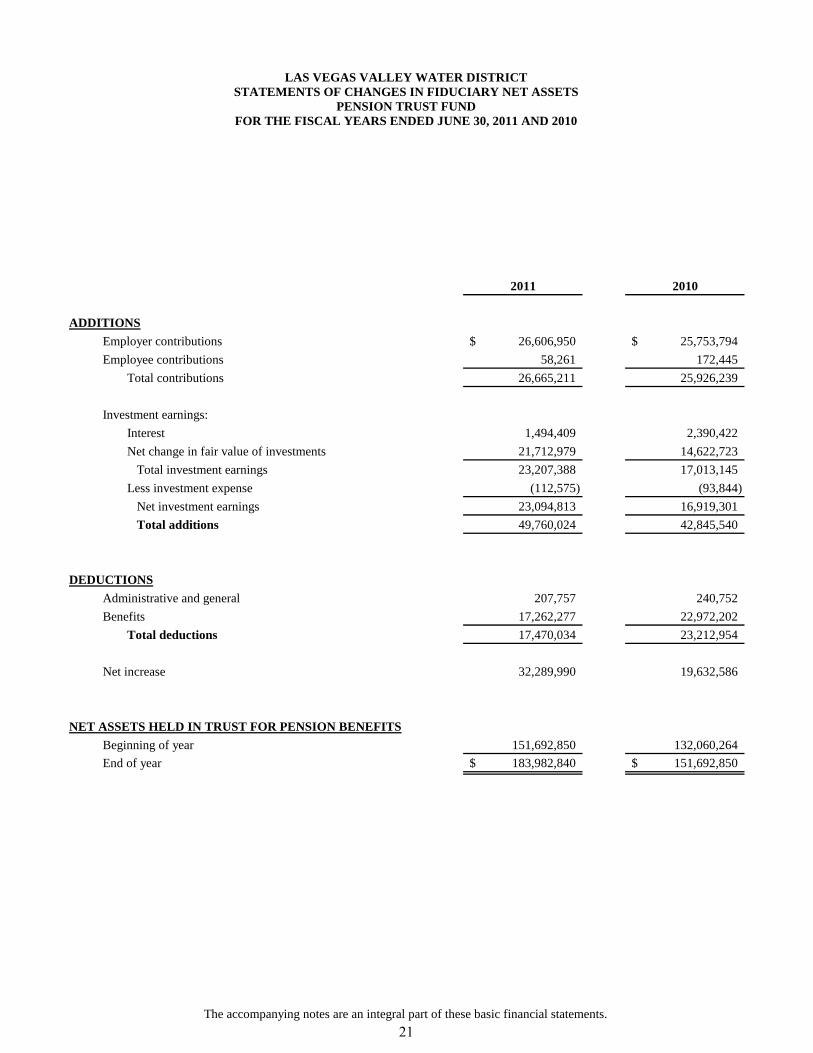
2011 2010
ADDITIONSEmployer contributions 26,606,950$ 25,753,794$ Employee contributions 58,261 172,445
Total contributions 26,665,211 25,926,239
Investment earnings:Interest 1,494,409 2,390,422 Net change in fair value of investments 21,712,979 14,622,723 Total investment earnings 23,207,388 17,013,145Less investment expense (112,575) (93,844) Net investment earnings 23,094,813 16,919,301 Total additions 49,760,024 42,845,540
DEDUCTIONSAdministrative and general 207,757 240,752 Benefits 17,262,277 22,972,202
Total deductions 17,470,034 23,212,954
Net increase 32,289,990 19,632,586
NET ASSETS HELD IN TRUST FOR PENSION BENEFITSBeginning of year 151,692,850 132,060,264 End of year 183,982,840$ 151,692,850$
LAS VEGAS VALLEY WATER DISTRICTSTATEMENTS OF CHANGES IN FIDUCIARY NET ASSETS
PENSION TRUST FUNDFOR THE FISCAL YEARS ENDED JUNE 30, 2011 AND 2010
21
LAS VEGAS VALLEY WATER DISTRICT
NOTES TO BASIC FINANCIAL STATEMENTS
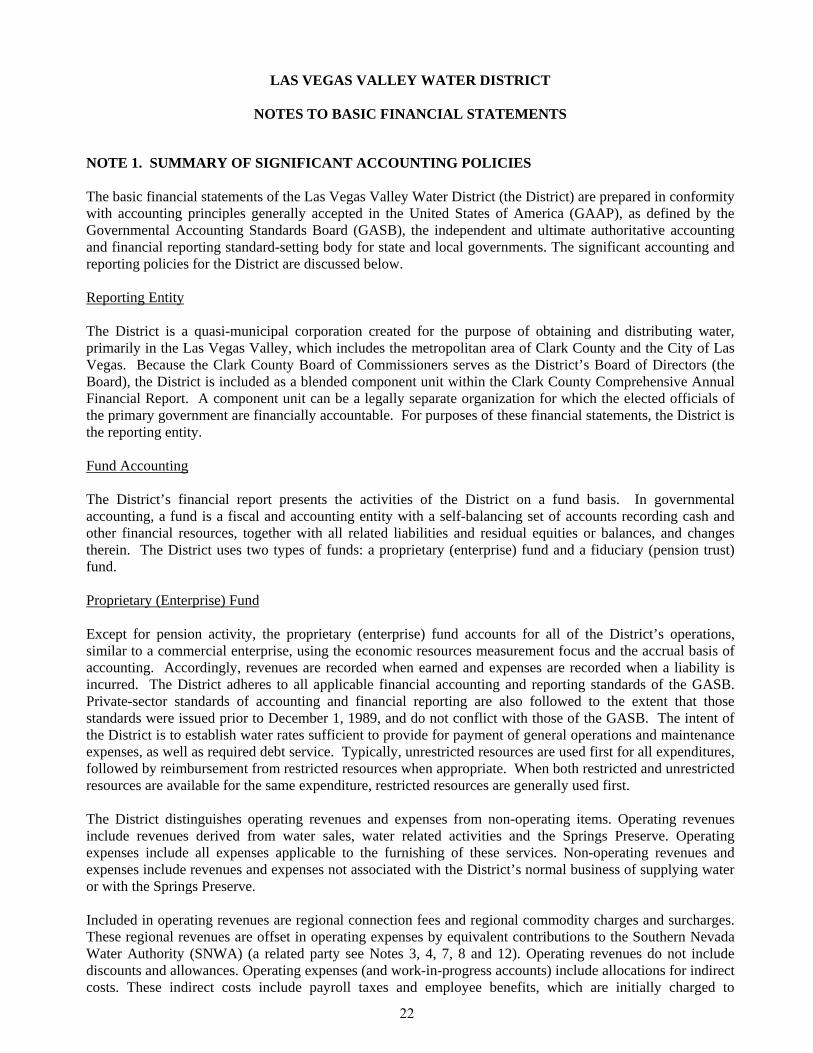
NOTE 1. SUMMARY OF SIGNIFICANT ACCOUNTING POLICIES The basic financial statements of the Las Vegas Valley Water District (the District) are prepared in conformity with accounting principles generally accepted in the United States of America (GAAP), as defined by the Governmental Accounting Standards Board (GASB), the independent and ultimate authoritative accounting and financial reporting standard-setting body for state and local governments. The significant accounting and reporting policies for the District are discussed below. Reporting Entity The District is a quasi-municipal corporation created for the purpose of obtaining and distributing water, primarily in the Las Vegas Valley, which includes the metropolitan area of Clark County and the City of Las Vegas. Because the Clark County Board of Commissioners serves as the District’s Board of Directors (the Board), the District is included as a blended component unit within the Clark County Comprehensive Annual Financial Report. A component unit can be a legally separate organization for which the elected officials of the primary government are financially accountable. For purposes of these financial statements, the District is the reporting entity. Fund Accounting The District’s financial report presents the activities of the District on a fund basis. In governmental accounting, a fund is a fiscal and accounting entity with a self-balancing set of accounts recording cash and other financial resources, together with all related liabilities and residual equities or balances, and changes therein. The District uses two types of funds: a proprietary (enterprise) fund and a fiduciary (pension trust) fund. Proprietary (Enterprise) Fund Except for pension activity, the proprietary (enterprise) fund accounts for all of the District’s operations, similar to a commercial enterprise, using the economic resources measurement focus and the accrual basis of accounting. Accordingly, revenues are recorded when earned and expenses are recorded when a liability is incurred. The District adheres to all applicable financial accounting and reporting standards of the GASB. Private-sector standards of accounting and financial reporting are also followed to the extent that those standards were issued prior to December 1, 1989, and do not conflict with those of the GASB. The intent of the District is to establish water rates sufficient to provide for payment of general operations and maintenance expenses, as well as required debt service. Typically, unrestricted resources are used first for all expenditures, followed by reimbursement from restricted resources when appropriate. When both restricted and unrestricted resources are available for the same expenditure, restricted resources are generally used first. The District distinguishes operating revenues and expenses from non-operating items. Operating revenues include revenues derived from water sales, water related activities and the Springs Preserve. Operating expenses include all expenses applicable to the furnishing of these services. Non-operating revenues and expenses include revenues and expenses not associated with the District’s normal business of supplying water or with the Springs Preserve. Included in operating revenues are regional connection fees and regional commodity charges and surcharges. These regional revenues are offset in operating expenses by equivalent contributions to the Southern Nevada Water Authority (SNWA) (a related party see Notes 3, 4, 7, 8 and 12). Operating revenues do not include discounts and allowances. Operating expenses (and work-in-progress accounts) include allocations for indirect costs. These indirect costs include payroll taxes and employee benefits, which are initially charged to
22
Las Vegas Valley Water District Notes to Basic Financial Statements (Continued)
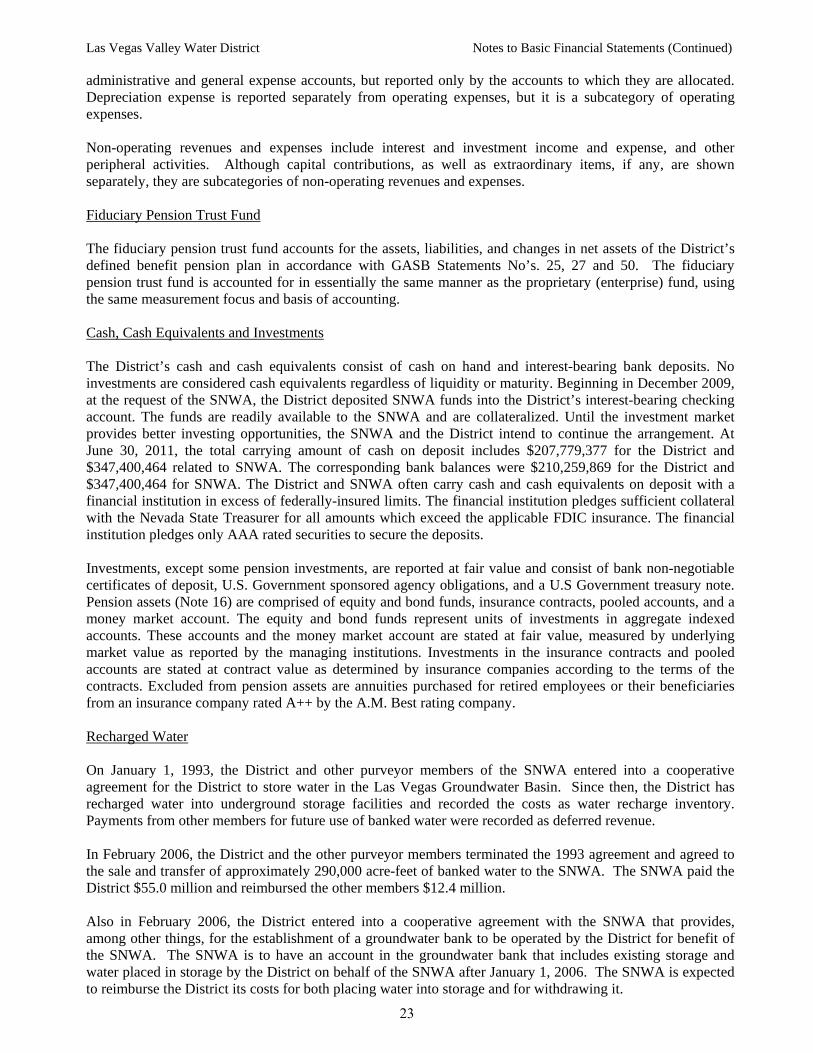
administrative and general expense accounts, but reported only by the accounts to which they are allocated. Depreciation expense is reported separately from operating expenses, but it is a subcategory of operating expenses. Non-operating revenues and expenses include interest and investment income and expense, and other peripheral activities. Although capital contributions, as well as extraordinary items, if any, are shown separately, they are subcategories of non-operating revenues and expenses. Fiduciary Pension Trust Fund The fiduciary pension trust fund accounts for the assets, liabilities, and changes in net assets of the District’s defined benefit pension plan in accordance with GASB Statements No’s. 25, 27 and 50. The fiduciary pension trust fund is accounted for in essentially the same manner as the proprietary (enterprise) fund, using the same measurement focus and basis of accounting. Cash, Cash Equivalents and Investments The District’s cash and cash equivalents consist of cash on hand and interest-bearing bank deposits. No investments are considered cash equivalents regardless of liquidity or maturity. Beginning in December 2009, at the request of the SNWA, the District deposited SNWA funds into the District’s interest-bearing checking account. The funds are readily available to the SNWA and are collateralized. Until the investment market provides better investing opportunities, the SNWA and the District intend to continue the arrangement. At June 30, 2011, the total carrying amount of cash on deposit includes $207,779,377 for the District and $347,400,464 related to SNWA. The corresponding bank balances were $210,259,869 for the District and $347,400,464 for SNWA. The District and SNWA often carry cash and cash equivalents on deposit with a financial institution in excess of federally-insured limits. The financial institution pledges sufficient collateral with the Nevada State Treasurer for all amounts which exceed the applicable FDIC insurance. The financial institution pledges only AAA rated securities to secure the deposits. Investments, except some pension investments, are reported at fair value and consist of bank non-negotiable certificates of deposit, U.S. Government sponsored agency obligations, and a U.S Government treasury note. Pension assets (Note 16) are comprised of equity and bond funds, insurance contracts, pooled accounts, and a money market account. The equity and bond funds represent units of investments in aggregate indexed accounts. These accounts and the money market account are stated at fair value, measured by underlying market value as reported by the managing institutions. Investments in the insurance contracts and pooled accounts are stated at contract value as determined by insurance companies according to the terms of the contracts. Excluded from pension assets are annuities purchased for retired employees or their beneficiaries from an insurance company rated A++ by the A.M. Best rating company. Recharged Water On January 1, 1993, the District and other purveyor members of the SNWA entered into a cooperative agreement for the District to store water in the Las Vegas Groundwater Basin. Since then, the District has recharged water into underground storage facilities and recorded the costs as water recharge inventory. Payments from other members for future use of banked water were recorded as deferred revenue. In February 2006, the District and the other purveyor members terminated the 1993 agreement and agreed to the sale and transfer of approximately 290,000 acre-feet of banked water to the SNWA. The SNWA paid the District $55.0 million and reimbursed the other members $12.4 million. Also in February 2006, the District entered into a cooperative agreement with the SNWA that provides, among other things, for the establishment of a groundwater bank to be operated by the District for benefit of the SNWA. The SNWA is to have an account in the groundwater bank that includes existing storage and water placed in storage by the District on behalf of the SNWA after January 1, 2006. The SNWA is expected to reimburse the District its costs for both placing water into storage and for withdrawing it.
23
Las Vegas Valley Water District Notes to Basic Financial Statements (Continued)
In fiscal year 2011 the District recorded $4.2 million in operating revenue for recharged water sold to the SNWA. In fiscal year 2010 no recharged water revenue was recorded. Inventories Inventories consist primarily of materials and supplies stated at the lower of market or average cost. Restricted Assets Restricted assets include amounts due from the SNWA for the repayment of the District’s notes and bonds whose proceeds were delivered to the SNWA (Notes 3 and 4). Restricted assets also include certain resources set aside to repay bond debt in accordance with bond covenants. Further, the District has restricted investments for major maintenance contingencies, customer security deposits, sales tax and oversized mains. Oversized mains are constructed to meet estimated future demands on the District’s distribution system. Note 5 provides a disaggregation of the restricted cash and investment accounts. Capital Assets Property and equipment are recorded at purchased or construction cost, except for certain facilities that were transferred to the District at approximate original cost less estimated accumulated depreciation. Developer donated facilities are recorded at engineering estimates of fair market value at the time the assets are donated. Expenditures for improvements and betterments, including labor and indirect costs, are capitalized. The capitalization threshold is generally $5,000 and an estimated useful life of at least one year following the date of acquisition. Capitalization thresholds generally are applied to individual capital assets rather than to groups of capital assets. Depreciation is computed using the straight-line method over the following estimated useful lives: Transmission and distribution mains, reservoirs and services 30 to 75 years Buildings, wells, pumping facilities and meters 20 to 30 years Transportation and office equipment 5 to 10 years Interest Expense and Income Capitalized The District capitalizes interest expense as a component of the cost of construction in progress. Consistent with its policy, the District follows FASB Statement No. 34, as amended by No. 62, and offsets capitalized interest cost with interest income related to unspent bond proceeds. Interest expense and capitalized interest expense and income for fiscal years 2011 and 2010 were as follows:
2011 2010 Bond interest $ 40,701,054 $ 36,661,692 Other interest expense 4,188 16,514 Total interest expense 40,705,242 36,678,206 Bond interest expense capitalized (1,028,457) (2,543,376) Net interest expense $ 39,676,785 $ 34,134,830
Interest income capitalized Reduction of restricted interest income $ 60,747 $ 27,411
24
Las Vegas Valley Water District Notes to Basic Financial Statements (Continued)
Accumulated Unpaid Employee Benefits Accumulated unpaid vacation and sick pay benefits are accrued based on the vested rights of the employees, using the accrual basis of accounting. Postemployment Benefits Other Than Pensions (OPEB) Effective July 1, 2007, the District implemented the provisions of GASB Statement No. 45, Accounting and Financial Reporting by Employers for Postemployment Benefits Other Than Pensions. The annual OPEB cost reported in the accompanying financial statements is equal to the annual required contributions (ARC) of the District, which are calculated using an actuarial valuation based upon the same methods and assumptions applied in determining the plan’s funding requirements, plus one year’s interest on the beginning of the year net OPEB obligation. At June 30, 2011, the OPEB obligation is determined by adding the annual OPEB cost to the OPEB obligation at the beginning of the fiscal year and deducting any contributions to the plan during the year. See Note 14 for additional information regarding the District’s OPEB obligation. Capital Contributions Capital contributions are contributions in cash to connect to the existing system and donations, or contributions in cash, services, or property from any person or governmental agency for the acquisition, relocation, improvement or construction of property, facilities, or equipment. Capital contributions include shared sales tax revenue received from the State of Nevada. The sales tax proceeds received are statutorily restricted for construction purposes in a rural area. Sales tax proceeds received in fiscal year 2011 were $35,096 and in fiscal year 2010 it was $33,897. No distinction is made between property acquired through capital contributions and property purchased from funds received through operating channels. Depreciation is recorded and the property is retired in the appropriate manner. Fund Equity Fund Equity is displayed in three components: (1) Invested in capital assets, net of related debt. This component represents the District’s fund equity in its capital assets. It reflects the cost of capital assets, less accumulated depreciation and less the outstanding principal of related debt, excluding unspent proceeds. (2) Restricted. This component reflects the carrying value of assets, less related liabilities, that are restricted by law or by other externally imposed restrictions, such as bond covenants. Assets that are restricted only because of District imposed limitations are not included in the calculation. (3) Unrestricted. This component represents the remaining fund equity balance that is available to support District operations and capital asset acquisition/construction. Legal Costs The District does not accrue for estimated future legal and defense costs, if any, to be incurred in connection with outstanding or threatened litigation and other disputed matters, but rather records such as period costs when services are rendered. New Accounting Pronouncements In June 2011, the GASB issued Statement No. 63, Financial reporting of Deferred Outflows of Resources, Deferred Inflows of Resources, and Net Position, (GASB No.63), which is effective for financial periods beginning after December 15, 2011. GASB No. 63 provides financial reporting guidance for deferred outflows of resources, deferred inflows of resources, and net position (renaming net assets and fund equity as net position) in a statement of financial position and related disclosures, amending numerous previous GASB
25
Las Vegas Valley Water District Notes to Basic Financial Statements (Continued)
Statements. The District is currently evaluating how the adoption of GASB No. 63 will affect the District’s financial position, results of operation or cash flow. In June 2011, the GASB issued Statement No. 64, Derivative Instruments: Application of Hedge Accounting Termination Provisions – an amendment of GASB Statement No. 53, effective for financial statements for periods beginning after June 15, 2011. The District does not have financial instruments within the scope of GASB Statement No. 53 and, therefore, does not expect adoption of Statement No. 64 to affect the District’s financial position, results of operation or cash flow. Reclassifications Certain minor reclassifications have been made in the fiscal 2010 basic financial statements to conform to the fiscal 2011 presentation. Estimates The preparation of financial statements in conformity with GAAP requires the use of estimates by management. Such estimates primarily relate to unsettled transactions and events as of the date of the basic financial statements. Actual results could differ from those estimates.
26

Las Vegas Valley Water District Notes to Basic Financial Statements (Continued)
NOTE 2. CAPITAL ASSETS For the year ended June 30, 2011, capital asset activity is as follows: Balance Additions and Balance
June 30, 2010 Adjustments Retirements June 30, 2011
Property and Equipment
Capital Assets, not Being Depreciated,
Excluding Construction in Progress:
Land and Land Rights $ 11,963,184 $ 2,684 $ - $ 11,965,868
Capital Assets, Being Depreciated:
Organization and Improvements 1,650,300 - - 1,650,300
Collect and Impounding Structures 816,796,248 840,362 - 817,636,610
Pumping Stations and Wells 257,072,534 4,129,375 - 261,201,909
Purification Equipment 821,204 41,248 - 862,452
Transmission/Distribution/Mains 893,072,491 13,426,291 2,918,211 903,580,571
Telemetering/Valves and Miscellaneous 45,339,631 1,112,464 - 46,452,095
Services 498,180,238 9,284,567 22,385 507,442,420
Office Furniture and Equipment 116,983,453 289,007 842,520 116,429,940
Transportation/Work/Equipment 44,392,885 962,690 1,144,012 44,211,563
Total Capital Assets, Being Depreciated 2,674,308,984 30,086,004 4,927,128 2,699,467,860
Total Capital Assets, Excluding
Construction in Progress 2,686,272,168 30,088,688 4,927,128 2,711,433,728 Construction in Progress 40,809,618
17,152,368 14,117,110 43,844,876
Total 2,727,081,786 47,241,056 19,044,238 2,755,278,604
Accumulated Depreciation
Organization and Improvements 1,340,866 31,246 - 1,372,112
Collect and Impounding Structures 242,378,086 32,041,449 - 274,419,535
Pumping Stations and Wells 107,415,671 11,785,030 - 119,200,701
Purification Equipment 439,508 29,817 - 469,325
Transmission/Distribution/Mains 153,989,464 12,107,148 528,210 165,568,402
Telemetering/Valves and Miscellaneous 12,570,745 709,524 - 13,280,269
Services 166,626,587 17,806,009 13,490 184,419,106
Office Furniture and Equipment 80,794,519 12,847,877 842,409 92,799,987
Transportation/Work/Equipment 39,799,033 2,387,316 1,144,011 41,042,338
Total
805,354,479 89,745,416 2,528,120 892,571,775
Total Capital Assets, net $ 1,921,727,307 $ (42,504,360) $ 16,516,118 $ 1,862,706,829
27
Las Vegas Valley Water District Notes to Basic Financial Statements (Continued)
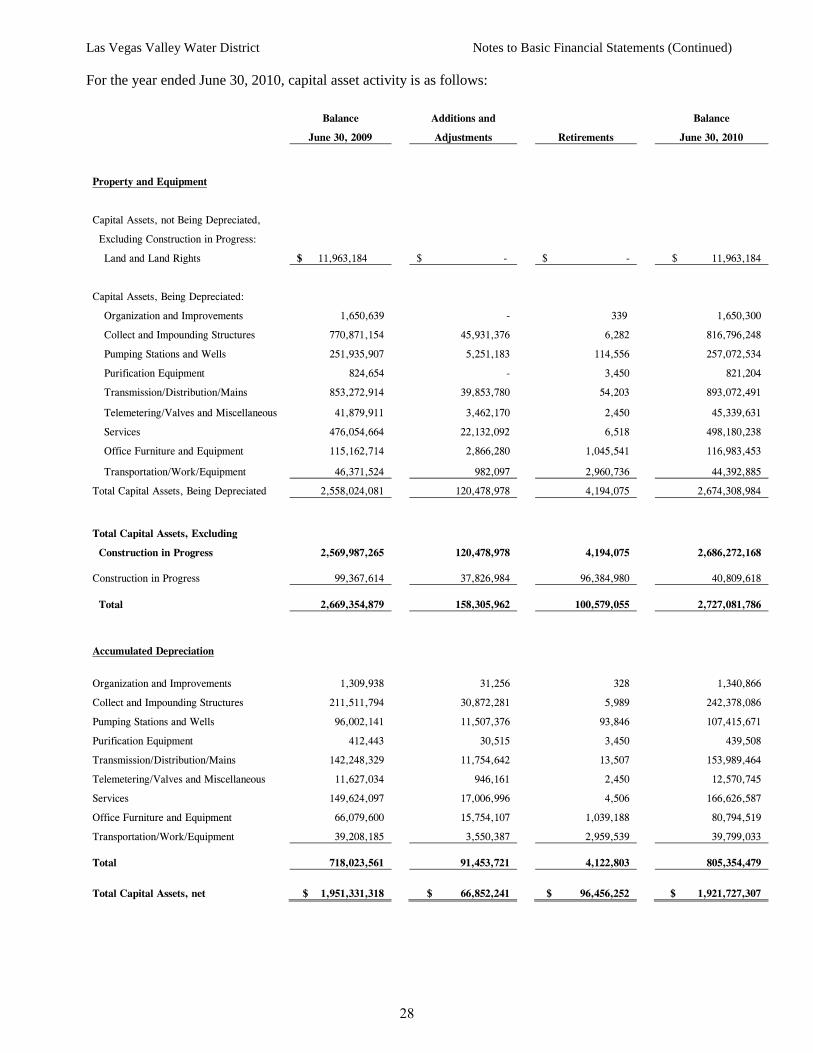
For the year ended June 30, 2010, capital asset activity is as follows: Balance Additions and Balance
June 30, 2009 Adjustments Retirements June 30, 2010
Property and Equipment
Capital Assets, not Being Depreciated,
Excluding Construction in Progress:
Land and Land Rights $ 11,963,184 $ - $ - $ 11,963,184
Capital Assets, Being Depreciated:
Organization and Improvements 1,650,639 - 339 1,650,300
Collect and Impounding Structures 770,871,154 45,931,376 6,282 816,796,248
Pumping Stations and Wells 251,935,907 5,251,183 114,556 257,072,534
Purification Equipment 824,654 - 3,450 821,204
Transmission/Distribution/Mains 853,272,914 39,853,780 54,203 893,072,491
Telemetering/Valves and Miscellaneous 41,879,911 3,462,170 2,450 45,339,631
Services 476,054,664 22,132,092 6,518 498,180,238
Office Furniture and Equipment 115,162,714 2,866,280 1,045,541 116,983,453
Transportation/Work/Equipment 46,371,524 982,097 2,960,736 44,392,885
Total Capital Assets, Being Depreciated 2,558,024,081 120,478,978 4,194,075 2,674,308,984
Total Capital Assets, Excluding
Construction in Progress 2,569,987,265 120,478,978 4,194,075 2,686,272,168 Construction in Progress
99,367,614
37,826,984 96,384,980 40,809,618
Total
2,669,354,879 158,305,962 100,579,055 2,727,081,786
Accumulated Depreciation
Organization and Improvements 1,309,938 31,256 328 1,340,866
Collect and Impounding Structures 211,511,794 30,872,281 5,989 242,378,086
Pumping Stations and Wells 96,002,141 11,507,376 93,846 107,415,671
Purification Equipment 412,443 30,515 3,450 439,508
Transmission/Distribution/Mains 142,248,329 11,754,642 13,507 153,989,464
Telemetering/Valves and Miscellaneous 11,627,034 946,161 2,450 12,570,745
Services 149,624,097 17,006,996 4,506 166,626,587
Office Furniture and Equipment 66,079,600 15,754,107 1,039,188 80,794,519
Transportation/Work/Equipment 39,208,185 3,550,387 2,959,539 39,799,033
Total
718,023,561 91,453,721 4,122,803 805,354,479
Total Capital Assets, net $ 1,951,331,318 $ 66,852,241 $ 96,456,252 $ 1,921,727,307
28
Las Vegas Valley Water District Notes to Basic Financial Statements (Continued)
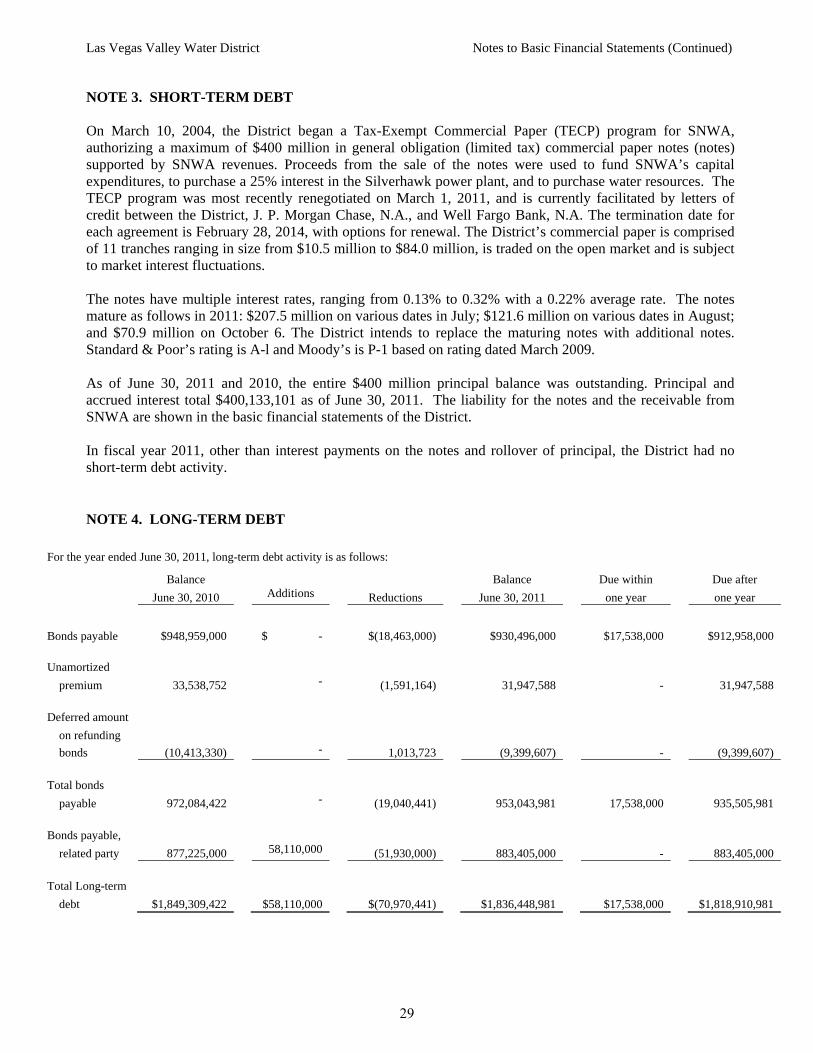
NOTE 3. SHORT-TERM DEBT On March 10, 2004, the District began a Tax-Exempt Commercial Paper (TECP) program for SNWA, authorizing a maximum of $400 million in general obligation (limited tax) commercial paper notes (notes) supported by SNWA revenues. Proceeds from the sale of the notes were used to fund SNWA’s capital expenditures, to purchase a 25% interest in the Silverhawk power plant, and to purchase water resources. The TECP program was most recently renegotiated on March 1, 2011, and is currently facilitated by letters of credit between the District, J. P. Morgan Chase, N.A., and Well Fargo Bank, N.A. The termination date for each agreement is February 28, 2014, with options for renewal. The District’s commercial paper is comprised of 11 tranches ranging in size from $10.5 million to $84.0 million, is traded on the open market and is subject to market interest fluctuations. The notes have multiple interest rates, ranging from 0.13% to 0.32% with a 0.22% average rate. The notes mature as follows in 2011: $207.5 million on various dates in July; $121.6 million on various dates in August; and $70.9 million on October 6. The District intends to replace the maturing notes with additional notes. Standard & Poor’s rating is A-l and Moody’s is P-1 based on rating dated March 2009. As of June 30, 2011 and 2010, the entire $400 million principal balance was outstanding. Principal and accrued interest total $400,133,101 as of June 30, 2011. The liability for the notes and the receivable from SNWA are shown in the basic financial statements of the District. In fiscal year 2011, other than interest payments on the notes and rollover of principal, the District had no short-term debt activity. NOTE 4. LONG-TERM DEBT
For the year ended June 30, 2011, long-term debt activity is as follows: Balance Balance Due within Due after June 30, 2010 Additions Reductions June 30, 2011 one year one year
Bonds payable $948,959,000 $ -
$(18,463,000)
$930,496,000
$17,538,000
$912,958,000 Unamortized
premium 33,538,752 - (1,591,164) 31,947,588 - 31,947,588 Deferred amount
on refunding bonds (10,413,330) - 1,013,723 (9,399,607) - (9,399,607)
Total bonds
payable 972,084,422 - (19,040,441) 953,043,981 17,538,000 935,505,981 Bonds payable,
related party 877,225,000 58,110,000 (51,930,000) 883,405,000 - 883,405,000 Total Long-term
debt $1,849,309,422 $58,110,000 $(70,970,441) $1,836,448,981 $17,538,000 $1,818,910,981
29
Las Vegas Valley Water District Notes to Basic Financial Statements (Continued)
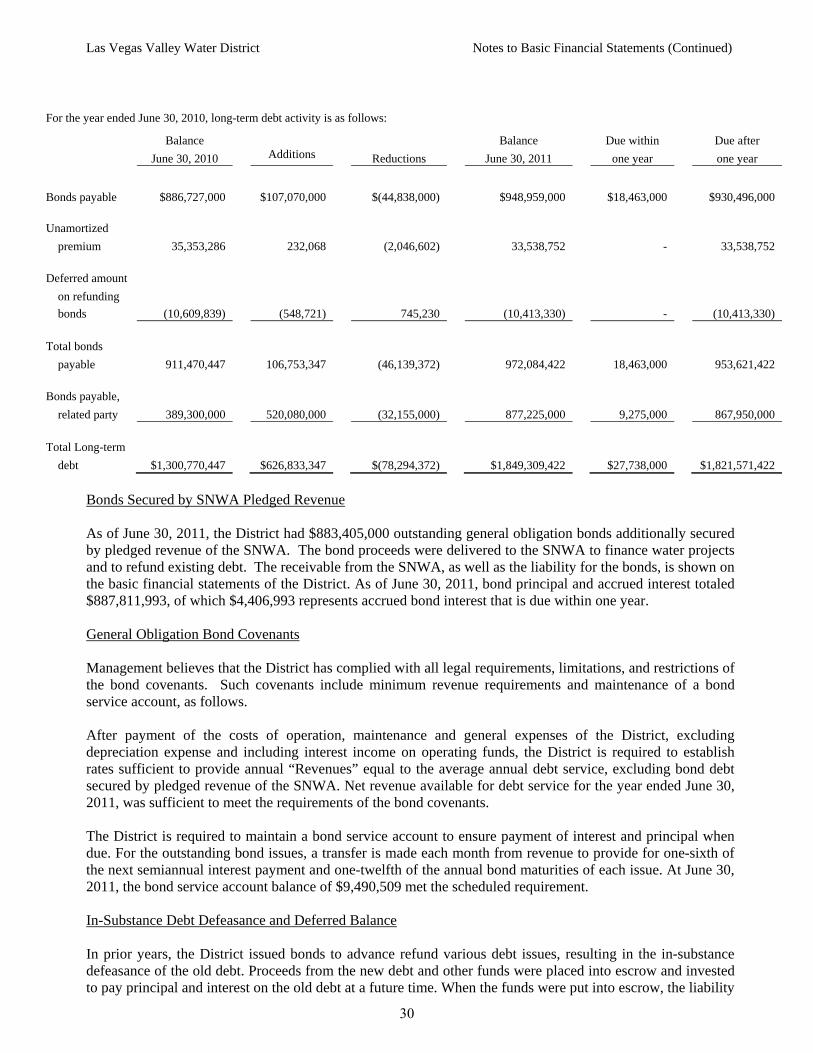
Bonds Secured by SNWA Pledged Revenue As of June 30, 2011, the District had $883,405,000 outstanding general obligation bonds additionally secured by pledged revenue of the SNWA. The bond proceeds were delivered to the SNWA to finance water projects and to refund existing debt. The receivable from the SNWA, as well as the liability for the bonds, is shown on the basic financial statements of the District. As of June 30, 2011, bond principal and accrued interest totaled $887,811,993, of which $4,406,993 represents accrued bond interest that is due within one year. General Obligation Bond Covenants Management believes that the District has complied with all legal requirements, limitations, and restrictions of the bond covenants. Such covenants include minimum revenue requirements and maintenance of a bond service account, as follows. After payment of the costs of operation, maintenance and general expenses of the District, excluding depreciation expense and including interest income on operating funds, the District is required to establish rates sufficient to provide annual “Revenues” equal to the average annual debt service, excluding bond debt secured by pledged revenue of the SNWA. Net revenue available for debt service for the year ended June 30, 2011, was sufficient to meet the requirements of the bond covenants. The District is required to maintain a bond service account to ensure payment of interest and principal when due. For the outstanding bond issues, a transfer is made each month from revenue to provide for one-sixth of the next semiannual interest payment and one-twelfth of the annual bond maturities of each issue. At June 30, 2011, the bond service account balance of $9,490,509 met the scheduled requirement. In-Substance Debt Defeasance and Deferred Balance In prior years, the District issued bonds to advance refund various debt issues, resulting in the in-substance defeasance of the old debt. Proceeds from the new debt and other funds were placed into escrow and invested to pay principal and interest on the old debt at a future time. When the funds were put into escrow, the liability
For the year ended June 30, 2010, long-term debt activity is as follows: Balance Balance Due within Due after June 30, 2010 Additions Reductions June 30, 2011 one year one year
Bonds payable $886,727,000 $107,070,000
$(44,838,000)
$948,959,000
$18,463,000
$930,496,000 Unamortized
premium 35,353,286 232,068 (2,046,602) 33,538,752 - 33,538,752 Deferred amount
on refunding bonds (10,609,839) (548,721) 745,230 (10,413,330) - (10,413,330)
Total bonds
payable 911,470,447 106,753,347 (46,139,372) 972,084,422 18,463,000 953,621,422 Bonds payable,
related party 389,300,000 520,080,000 (32,155,000) 877,225,000 9,275,000 867,950,000 Total Long-term
debt $1,300,770,447 $626,833,347 $(78,294,372) $1,849,309,422 $27,738,000 $1,821,571,422
30
Las Vegas Valley Water District Notes to Basic Financial Statements (Continued)
for the old debt was removed from the District’s balance sheet. As of June 30, 2011, outstanding in-substance defeased debt totaled $57,415,000. For current refundings (and advance refundings, the difference between the reacquisition price and the net carrying amount of the old debt is deferred and amortized as a component of interest expense over the shortest term of the related debt obligations. At June 30, 2011, the aggregate unamortized deferred balance is $9,399,607. Current Year Debt Issuances On May 26, 2011, the District issued Series 2011A $58,110,000 par value general obligation taxable bonds, additionally secured by pledged revenue of the SNWA, for a true interest cost of 4.879% (rounded). Proceeds of the 2011A bonds were used to advance refund $51,930,000 of the February 2008 District general obligation bonds (Series 2008B). The redemption price of the partially refunded 2008B bonds is 100% and the average coupon rate 5.00%. Because the liability for bonds additionally secured by pledged revenue of the SNWA are offset by an SNWA receivable, issuing the Series 2011A bonds and partially refunding the Series 2008B bonds had no effect on District operations or financial position. Adjustable Rate Bonds On July 20, 2006, the District issued $75,000,000 Adjustable Rate Bonds, Series 2006B and $75,000,000 Adjustable Rate Bonds, Series 2006C (2006BC Bonds). Each series of the 2006BC Bonds currently bear interest at a Daily Rate. While in the Daily Rate Mode, the interest rate for the 2006BC Bonds is the rate of interest per annum determined by the applicable Remarketing Agent each Business Day as the minimum rate of interest that, in the opinion of the applicable Remarketing Agent, would, under then existing market conditions, result in the sale of the 2006BC Bonds in the Daily Rate Mode on the Rate Determination Date at a price equal to the principal amount thereof, plus accrued interest, if any. At June 30, 2011, the interest rate for the 2006BC Bonds was 3.00%. As required by GASB Statement No. 38, Certain Financial Statement Note Disclosures, this rate was used to calculate future interest requirements for the 2006BC Bonds outstanding as of June 30, 2011. General obligation bonds and a subordinate lien revenue bond payable as of June 30, 2011:
GENERAL OBLIGATION IMPROVEMENT AND REFUNDING BONDS …………..(REVENUE SUPPORTED)……………
2003A 2005A 2006A 2006B Date of issue January 1, 2003 May 4, 2005 June 15, 2006 July 20, 2006 Coupon interest rate 4.0% to 5.25% 4.0% to 5.0% 4.75% to 5.0% Variable Interest payment dates 6/1 and 12/1 6/1 and 12/1 6/1 and 12/1 Monthly Principal payment date June 1 June 1 June 1 June 1 Original amount $ 168,685,000 $ 302,425,000 $ 151,555,000 $ 75,000,000 Redeemed as of 6/30/11 (35,810,000) (58,485,000) (5,340,000) (2,635,000) Advance refunded (6,925,000) (5,885,000) (2,900,000) Outstanding as of 6/30/11 125,950,000 243,940,000 140,330,000 69,465,000 Less current portion - (10,630,000) - - Portion due after one year $ 125,950,000 $ 233,310,000 $ 140,330,000 $ 69,465,000
31
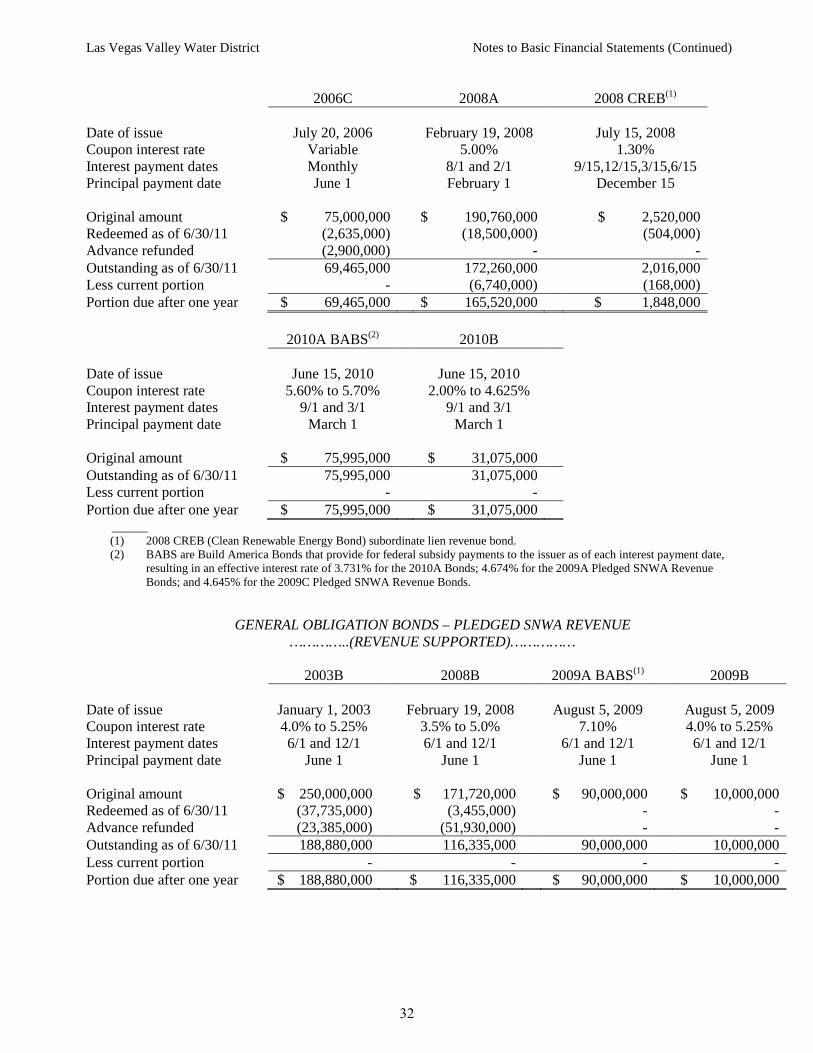
Las Vegas Valley Water District Notes to Basic Financial Statements (Continued)
2006C 2008A 2008 CREB(1) Date of issue July 20, 2006 February 19, 2008 July 15, 2008 Coupon interest rate Variable 5.00% 1.30% Interest payment dates Monthly 8/1 and 2/1 9/15,12/15,3/15,6/15 Principal payment date June 1 February 1 December 15 Original amount $ 75,000,000 $ 190,760,000 $ 2,520,000 Redeemed as of 6/30/11 (2,635,000) (18,500,000) (504,000) Advance refunded (2,900,000) - - Outstanding as of 6/30/11 69,465,000 172,260,000 2,016,000 Less current portion - (6,740,000) (168,000) Portion due after one year $ 69,465,000 $ 165,520,000 $ 1,848,000 2010A BABS(2) 2010B Date of issue June 15, 2010 June 15, 2010 Coupon interest rate 5.60% to 5.70% 2.00% to 4.625% Interest payment dates 9/1 and 3/1 9/1 and 3/1 Principal payment date March 1 March 1 Original amount $ 75,995,000 $ 31,075,000 Outstanding as of 6/30/11 75,995,000 31,075,000 Less current portion - - Portion due after one year $ 75,995,000 $ 31,075,000 ______
(1) 2008 CREB (Clean Renewable Energy Bond) subordinate lien revenue bond. (2) BABS are Build America Bonds that provide for federal subsidy payments to the issuer as of each interest payment date,
resulting in an effective interest rate of 3.731% for the 2010A Bonds; 4.674% for the 2009A Pledged SNWA Revenue Bonds; and 4.645% for the 2009C Pledged SNWA Revenue Bonds.
GENERAL OBLIGATION BONDS – PLEDGED SNWA REVENUE …………..(REVENUE SUPPORTED)……………
2003B 2008B 2009A BABS(1) 2009B Date of issue January 1, 2003 February 19, 2008 August 5, 2009 August 5, 2009 Coupon interest rate 4.0% to 5.25% 3.5% to 5.0% 7.10% 4.0% to 5.25% Interest payment dates 6/1 and 12/1 6/1 and 12/1 6/1 and 12/1 6/1 and 12/1 Principal payment date June 1 June 1 June 1 June 1 Original amount $ 250,000,000 $ 171,720,000 $ 90,000,000 $ 10,000,000 Redeemed as of 6/30/11 (37,735,000) (3,455,000) - - Advance refunded (23,385,000) (51,930,000) - - Outstanding as of 6/30/11 188,880,000 116,335,000 90,000,000 10,000,000 Less current portion - - - - Portion due after one year $ 188,880,000 $ 116,335,000 $ 90,000,000 $ 10,000,000
32
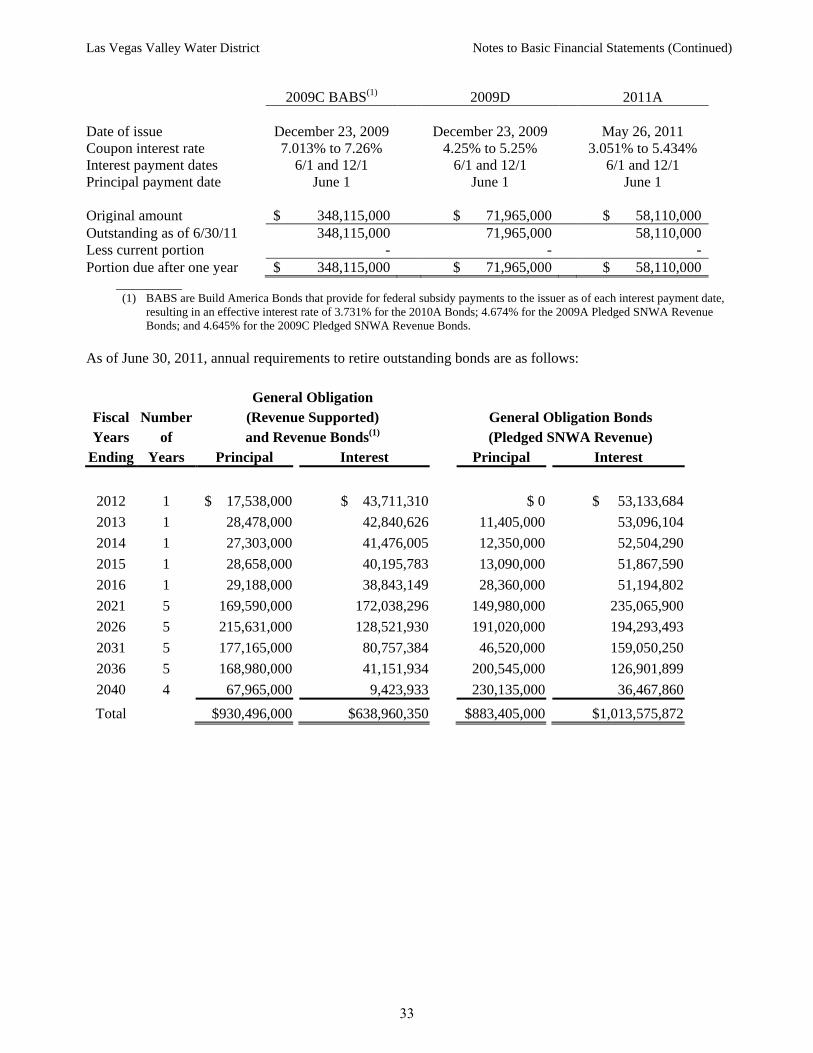
Las Vegas Valley Water District Notes to Basic Financial Statements (Continued)
2009C BABS(1) 2009D 2011A Date of issue December 23, 2009 December 23, 2009 May 26, 2011 Coupon interest rate 7.013% to 7.26% 4.25% to 5.25% 3.051% to 5.434% Interest payment dates 6/1 and 12/1 6/1 and 12/1 6/1 and 12/1 Principal payment date June 1 June 1 June 1 Original amount $ 348,115,000 $ 71,965,000 $ 58,110,000 Outstanding as of 6/30/11 348,115,000 71,965,000 58,110,000 Less current portion - - - Portion due after one year $ 348,115,000 $ 71,965,000 $ 58,110,000 ___________
(1) BABS are Build America Bonds that provide for federal subsidy payments to the issuer as of each interest payment date, resulting in an effective interest rate of 3.731% for the 2010A Bonds; 4.674% for the 2009A Pledged SNWA Revenue Bonds; and 4.645% for the 2009C Pledged SNWA Revenue Bonds.
As of June 30, 2011, annual requirements to retire outstanding bonds are as follows: General Obligation Fiscal Number (Revenue Supported) General Obligation Bonds Years of and Revenue Bonds(1) (Pledged SNWA Revenue)
Ending Years Principal Interest Principal Interest
2012 1 $ 17,538,000 $ 43,711,310 $ 0 $ 53,133,684 2013 1 28,478,000 42,840,626 11,405,000 53,096,104 2014 1 27,303,000 41,476,005 12,350,000 52,504,290 2015 1 28,658,000 40,195,783 13,090,000 51,867,590 2016 1 29,188,000 38,843,149 28,360,000 51,194,802 2021 5 169,590,000 172,038,296 149,980,000 235,065,900 2026 5 215,631,000 128,521,930 191,020,000 194,293,493 2031 5 177,165,000 80,757,384 46,520,000 159,050,250 2036 5 168,980,000 41,151,934 200,545,000 126,901,899 2040 4 67,965,000 9,423,933 230,135,000 36,467,860 Total $930,496,000 $638,960,350 $883,405,000 $1,013,575,872
33
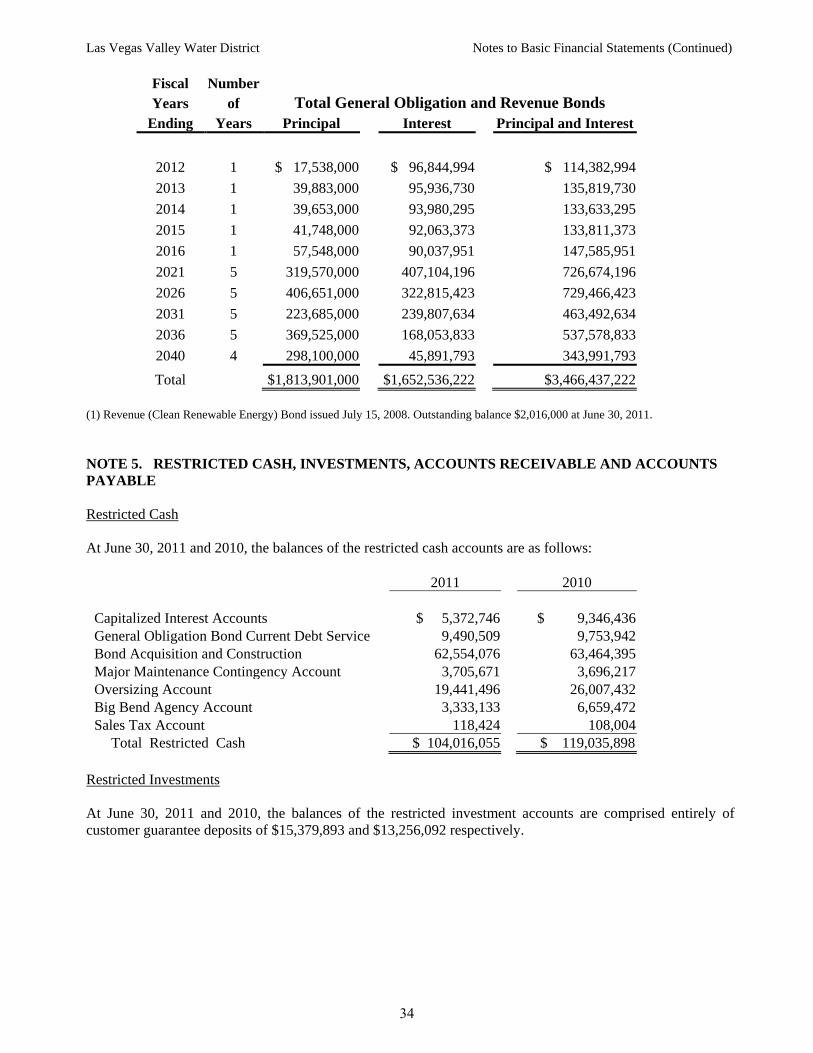
Las Vegas Valley Water District Notes to Basic Financial Statements (Continued)
Fiscal Number Years of Total General Obligation and Revenue Bonds
Ending Years Principal Interest Principal and Interest
2012 1 $ 17,538,000 $ 96,844,994 $ 114,382,994 2013 1 39,883,000 95,936,730 135,819,730 2014 1 39,653,000 93,980,295 133,633,295 2015 1 41,748,000 92,063,373 133,811,373 2016 1 57,548,000 90,037,951 147,585,951 2021 5 319,570,000 407,104,196 726,674,196 2026 5 406,651,000 322,815,423 729,466,423 2031 5 223,685,000 239,807,634 463,492,634 2036 5 369,525,000 168,053,833 537,578,833 2040 4 298,100,000 45,891,793 343,991,793 Total $1,813,901,000 $1,652,536,222 $3,466,437,222
(1) Revenue (Clean Renewable Energy) Bond issued July 15, 2008. Outstanding balance $2,016,000 at June 30, 2011. NOTE 5. RESTRICTED CASH, INVESTMENTS, ACCOUNTS RECEIVABLE AND ACCOUNTS PAYABLE Restricted Cash At June 30, 2011 and 2010, the balances of the restricted cash accounts are as follows: 2011 2010 Capitalized Interest Accounts $ 5,372,746 $ 9,346,436 General Obligation Bond Current Debt Service 9,490,509 9,753,942 Bond Acquisition and Construction 62,554,076 63,464,395 Major Maintenance Contingency Account 3,705,671 3,696,217 Oversizing Account 19,441,496 26,007,432 Big Bend Agency Account 3,333,133 6,659,472 Sales Tax Account 118,424 108,004
Total Restricted Cash $ 104,016,055 $ 119,035,898 Restricted Investments At June 30, 2011 and 2010, the balances of the restricted investment accounts are comprised entirely of customer guarantee deposits of $15,379,893 and $13,256,092 respectively.
34
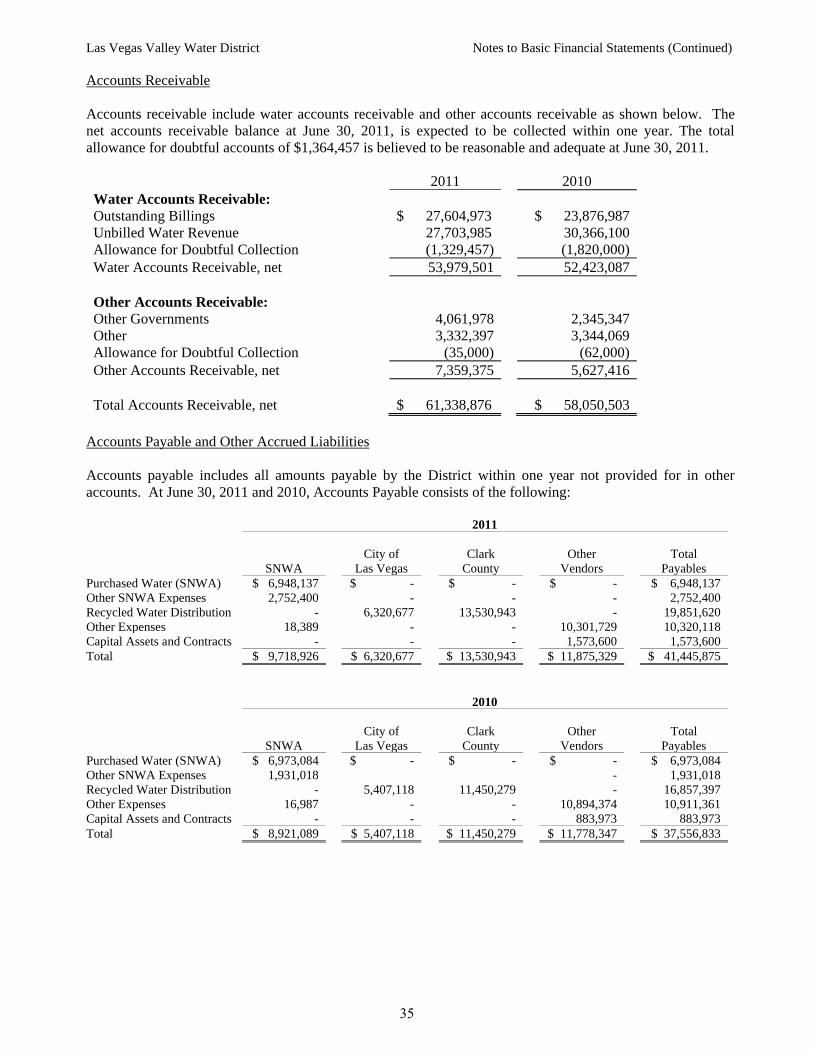
Las Vegas Valley Water District Notes to Basic Financial Statements (Continued)
Accounts Receivable Accounts receivable include water accounts receivable and other accounts receivable as shown below. The net accounts receivable balance at June 30, 2011, is expected to be collected within one year. The total allowance for doubtful accounts of $1,364,457 is believed to be reasonable and adequate at June 30, 2011. 2011 2010 Water Accounts Receivable: Outstanding Billings $ 27,604,973 $ 23,876,987 Unbilled Water Revenue 27,703,985 30,366,100 Allowance for Doubtful Collection (1,329,457) (1,820,000) Water Accounts Receivable, net 53,979,501 52,423,087 Other Accounts Receivable: Other Governments 4,061,978 2,345,347 Other 3,332,397 3,344,069 Allowance for Doubtful Collection (35,000) (62,000) Other Accounts Receivable, net 7,359,375 5,627,416 Total Accounts Receivable, net $ 61,338,876 $ 58,050,503
Accounts Payable and Other Accrued Liabilities Accounts payable includes all amounts payable by the District within one year not provided for in other accounts. At June 30, 2011 and 2010, Accounts Payable consists of the following: 2011 City of Clark Other Total SNWA Las Vegas County Vendors Payables Purchased Water (SNWA) $ 6,948,137 $ - $ - $ - $ 6,948,137 Other SNWA Expenses 2,752,400 - - - 2,752,400 Recycled Water Distribution - 6,320,677 13,530,943 - 19,851,620 Other Expenses 18,389 - - 10,301,729 10,320,118 Capital Assets and Contracts - - - 1,573,600 1,573,600 Total $ 9,718,926 $ 6,320,677 $ 13,530,943 $ 11,875,329 $ 41,445,875 2010 City of Clark Other Total SNWA Las Vegas County Vendors Payables Purchased Water (SNWA) $ 6,973,084 $ - $ - $ - $ 6,973,084 Other SNWA Expenses 1,931,018 - 1,931,018 Recycled Water Distribution - 5,407,118 11,450,279 - 16,857,397 Other Expenses 16,987 - - 10,894,374 10,911,361 Capital Assets and Contracts - - - 883,973 883,973 Total $ 8,921,089 $ 5,407,118 $ 11,450,279 $ 11,778,347 $ 37,556,833
35
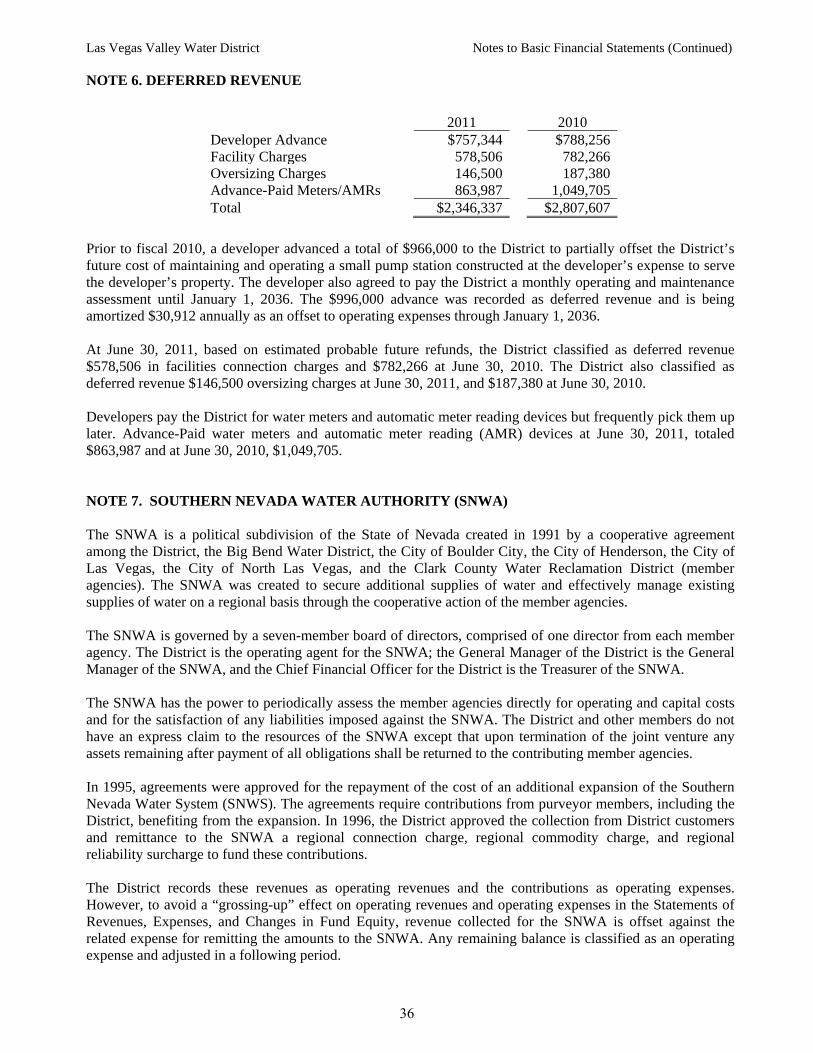
Las Vegas Valley Water District Notes to Basic Financial Statements (Continued)
NOTE 6. DEFERRED REVENUE Prior to fiscal 2010, a developer advanced a total of $966,000 to the District to partially offset the District’s future cost of maintaining and operating a small pump station constructed at the developer’s expense to serve the developer’s property. The developer also agreed to pay the District a monthly operating and maintenance assessment until January 1, 2036. The $996,000 advance was recorded as deferred revenue and is being amortized $30,912 annually as an offset to operating expenses through January 1, 2036. At June 30, 2011, based on estimated probable future refunds, the District classified as deferred revenue $578,506 in facilities connection charges and $782,266 at June 30, 2010. The District also classified as deferred revenue $146,500 oversizing charges at June 30, 2011, and $187,380 at June 30, 2010. Developers pay the District for water meters and automatic meter reading devices but frequently pick them up later. Advance-Paid water meters and automatic meter reading (AMR) devices at June 30, 2011, totaled $863,987 and at June 30, 2010, $1,049,705. NOTE 7. SOUTHERN NEVADA WATER AUTHORITY (SNWA) The SNWA is a political subdivision of the State of Nevada created in 1991 by a cooperative agreement among the District, the Big Bend Water District, the City of Boulder City, the City of Henderson, the City of Las Vegas, the City of North Las Vegas, and the Clark County Water Reclamation District (member agencies). The SNWA was created to secure additional supplies of water and effectively manage existing supplies of water on a regional basis through the cooperative action of the member agencies.
The SNWA is governed by a seven-member board of directors, comprised of one director from each member agency. The District is the operating agent for the SNWA; the General Manager of the District is the General Manager of the SNWA, and the Chief Financial Officer for the District is the Treasurer of the SNWA. The SNWA has the power to periodically assess the member agencies directly for operating and capital costs and for the satisfaction of any liabilities imposed against the SNWA. The District and other members do not have an express claim to the resources of the SNWA except that upon termination of the joint venture any assets remaining after payment of all obligations shall be returned to the contributing member agencies. In 1995, agreements were approved for the repayment of the cost of an additional expansion of the Southern Nevada Water System (SNWS). The agreements require contributions from purveyor members, including the District, benefiting from the expansion. In 1996, the District approved the collection from District customers and remittance to the SNWA a regional connection charge, regional commodity charge, and regional reliability surcharge to fund these contributions. The District records these revenues as operating revenues and the contributions as operating expenses. However, to avoid a “grossing-up” effect on operating revenues and operating expenses in the Statements of Revenues, Expenses, and Changes in Fund Equity, revenue collected for the SNWA is offset against the related expense for remitting the amounts to the SNWA. Any remaining balance is classified as an operating expense and adjusted in a following period.
2011 2010 Developer Advance $757,344 $788,256 Facility Charges 578,506 782,266 Oversizing Charges 146,500 187,380 Advance-Paid Meters/AMRs 863,987 1,049,705 Total $2,346,337 $2,807,607
36
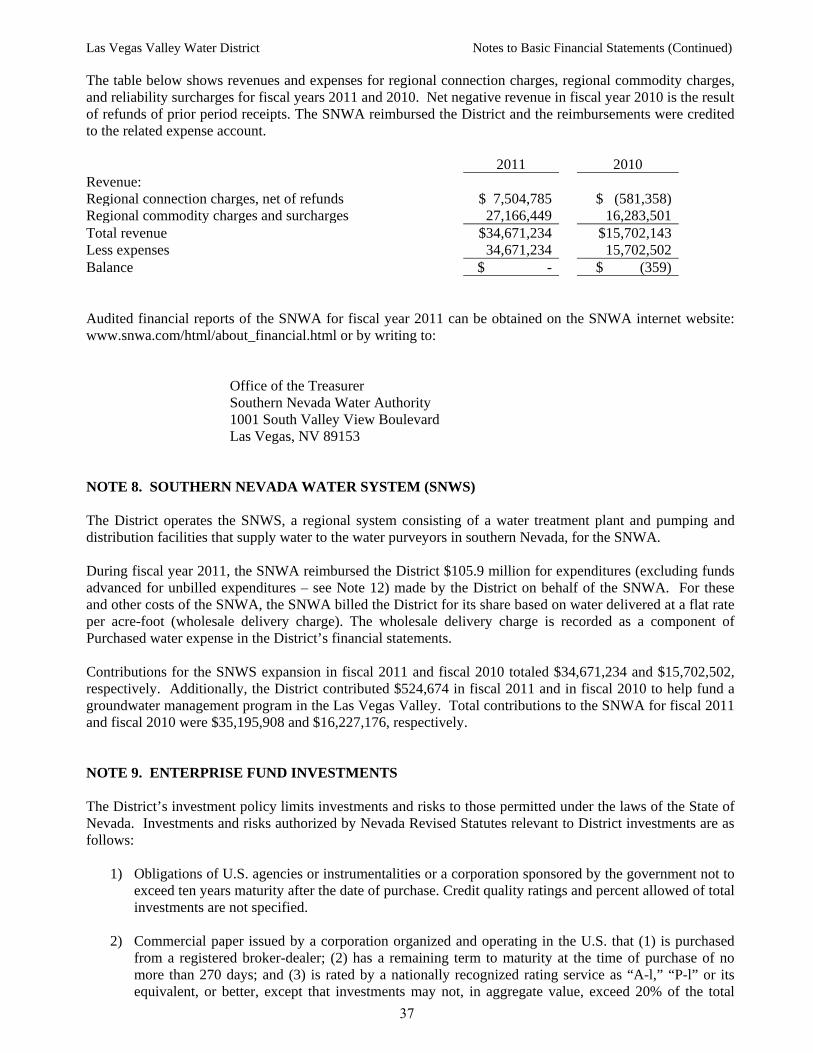
Las Vegas Valley Water District Notes to Basic Financial Statements (Continued)
The table below shows revenues and expenses for regional connection charges, regional commodity charges, and reliability surcharges for fiscal years 2011 and 2010. Net negative revenue in fiscal year 2010 is the result of refunds of prior period receipts. The SNWA reimbursed the District and the reimbursements were credited to the related expense account. 2011 2010 Revenue: Regional connection charges, net of refunds $ 7,504,785 $ (581,358) Regional commodity charges and surcharges 27,166,449 16,283,501 Total revenue $34,671,234 $15,702,143 Less expenses 34,671,234 15,702,502 Balance $ - $ (359) Audited financial reports of the SNWA for fiscal year 2011 can be obtained on the SNWA internet website: www.snwa.com/html/about_financial.html or by writing to:
Office of the Treasurer Southern Nevada Water Authority
1001 South Valley View Boulevard Las Vegas, NV 89153 NOTE 8. SOUTHERN NEVADA WATER SYSTEM (SNWS) The District operates the SNWS, a regional system consisting of a water treatment plant and pumping and distribution facilities that supply water to the water purveyors in southern Nevada, for the SNWA. During fiscal year 2011, the SNWA reimbursed the District $105.9 million for expenditures (excluding funds advanced for unbilled expenditures – see Note 12) made by the District on behalf of the SNWA. For these and other costs of the SNWA, the SNWA billed the District for its share based on water delivered at a flat rate per acre-foot (wholesale delivery charge). The wholesale delivery charge is recorded as a component of Purchased water expense in the District’s financial statements. Contributions for the SNWS expansion in fiscal 2011 and fiscal 2010 totaled $34,671,234 and $15,702,502, respectively. Additionally, the District contributed $524,674 in fiscal 2011 and in fiscal 2010 to help fund a groundwater management program in the Las Vegas Valley. Total contributions to the SNWA for fiscal 2011 and fiscal 2010 were $35,195,908 and $16,227,176, respectively. NOTE 9. ENTERPRISE FUND INVESTMENTS The District’s investment policy limits investments and risks to those permitted under the laws of the State of Nevada. Investments and risks authorized by Nevada Revised Statutes relevant to District investments are as follows:
1) Obligations of U.S. agencies or instrumentalities or a corporation sponsored by the government not to exceed ten years maturity after the date of purchase. Credit quality ratings and percent allowed of total investments are not specified.
2) Commercial paper issued by a corporation organized and operating in the U.S. that (1) is purchased
from a registered broker-dealer; (2) has a remaining term to maturity at the time of purchase of no more than 270 days; and (3) is rated by a nationally recognized rating service as “A-l,” “P-l” or its equivalent, or better, except that investments may not, in aggregate value, exceed 20% of the total
37
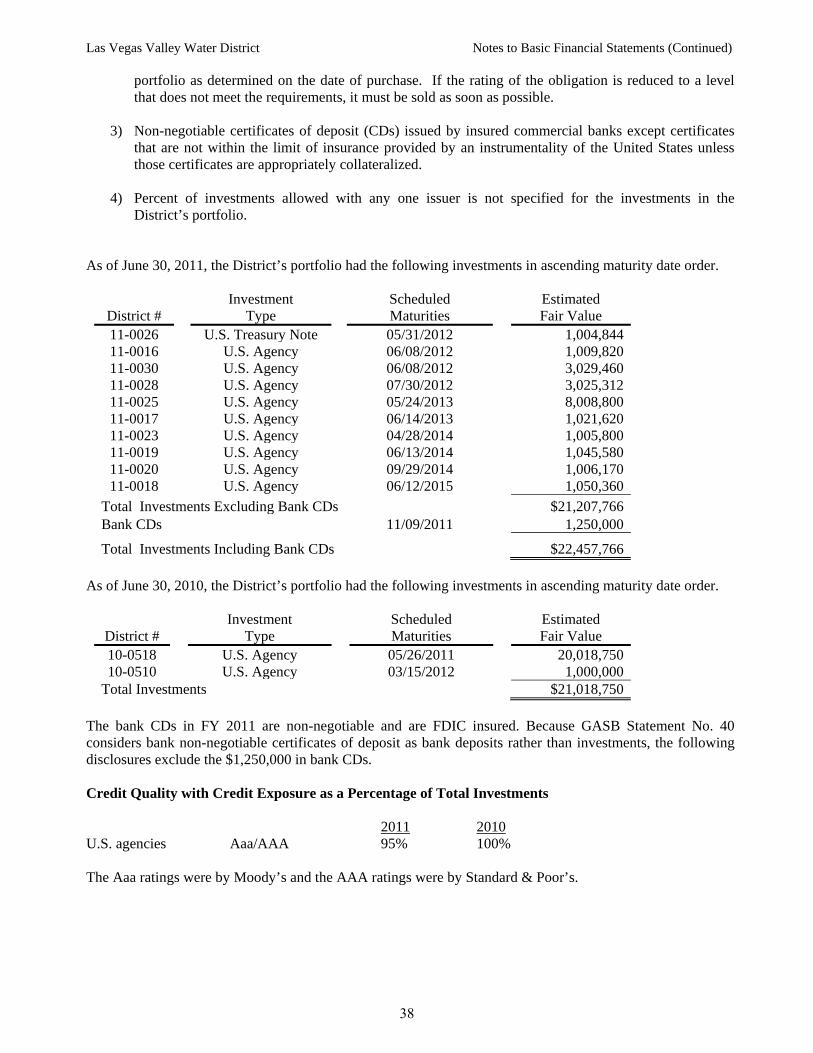
Las Vegas Valley Water District Notes to Basic Financial Statements (Continued)
portfolio as determined on the date of purchase. If the rating of the obligation is reduced to a level that does not meet the requirements, it must be sold as soon as possible.
3) Non-negotiable certificates of deposit (CDs) issued by insured commercial banks except certificates that are not within the limit of insurance provided by an instrumentality of the United States unless those certificates are appropriately collateralized.
4) Percent of investments allowed with any one issuer is not specified for the investments in the
District’s portfolio. As of June 30, 2011, the District’s portfolio had the following investments in ascending maturity date order.
District #
Investment Type
Scheduled Maturities
Estimated Fair Value
11-0026 U.S. Treasury Note 05/31/2012 1,004,844 11-0016 U.S. Agency 06/08/2012 1,009,820 11-0030 U.S. Agency 06/08/2012 3,029,460 11-0028 U.S. Agency 07/30/2012 3,025,312 11-0025 U.S. Agency 05/24/2013 8,008,800 11-0017 U.S. Agency 06/14/2013 1,021,620 11-0023 U.S. Agency 04/28/2014 1,005,800 11-0019 U.S. Agency 06/13/2014 1,045,580 11-0020 U.S. Agency 09/29/2014 1,006,170 11-0018 U.S. Agency 06/12/2015 1,050,360
Total Investments Excluding Bank CDs $21,207,766 Bank CDs 11/09/2011 1,250,000
Total Investments Including Bank CDs $22,457,766 As of June 30, 2010, the District’s portfolio had the following investments in ascending maturity date order.
District #
Investment Type
Scheduled Maturities
Estimated Fair Value
10-0518 U.S. Agency 05/26/2011 20,018,750 10-0510 U.S. Agency 03/15/2012 1,000,000
Total Investments $21,018,750 The bank CDs in FY 2011 are non-negotiable and are FDIC insured. Because GASB Statement No. 40 considers bank non-negotiable certificates of deposit as bank deposits rather than investments, the following disclosures exclude the $1,250,000 in bank CDs. Credit Quality with Credit Exposure as a Percentage of Total Investments 2011 2010 U.S. agencies Aaa/AAA 95% 100% The Aaa ratings were by Moody’s and the AAA ratings were by Standard & Poor’s.
38
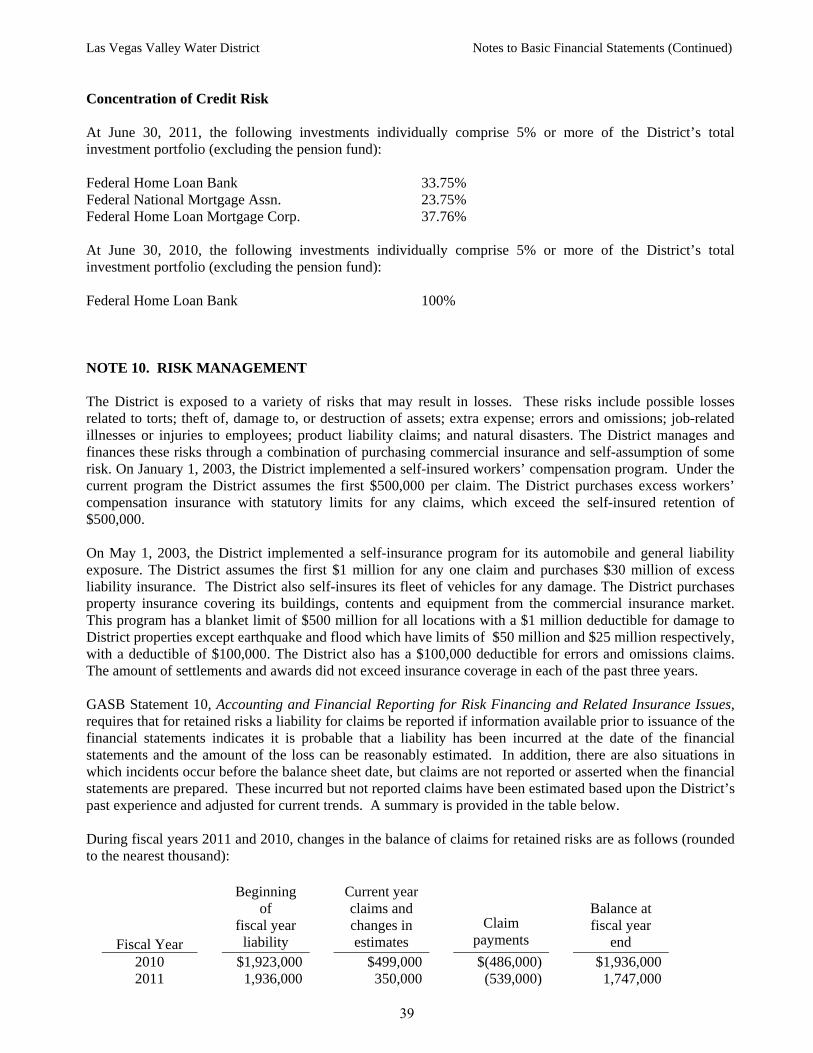
Las Vegas Valley Water District Notes to Basic Financial Statements (Continued)
Concentration of Credit Risk At June 30, 2011, the following investments individually comprise 5% or more of the District’s total investment portfolio (excluding the pension fund): Federal Home Loan Bank 33.75% Federal National Mortgage Assn. 23.75% Federal Home Loan Mortgage Corp. 37.76% At June 30, 2010, the following investments individually comprise 5% or more of the District’s total investment portfolio (excluding the pension fund): Federal Home Loan Bank 100% NOTE 10. RISK MANAGEMENT The District is exposed to a variety of risks that may result in losses. These risks include possible losses related to torts; theft of, damage to, or destruction of assets; extra expense; errors and omissions; job-related illnesses or injuries to employees; product liability claims; and natural disasters. The District manages and finances these risks through a combination of purchasing commercial insurance and self-assumption of some risk. On January 1, 2003, the District implemented a self-insured workers’ compensation program. Under the current program the District assumes the first $500,000 per claim. The District purchases excess workers’ compensation insurance with statutory limits for any claims, which exceed the self-insured retention of $500,000. On May 1, 2003, the District implemented a self-insurance program for its automobile and general liability exposure. The District assumes the first $1 million for any one claim and purchases $30 million of excess liability insurance. The District also self-insures its fleet of vehicles for any damage. The District purchases property insurance covering its buildings, contents and equipment from the commercial insurance market. This program has a blanket limit of $500 million for all locations with a $1 million deductible for damage to District properties except earthquake and flood which have limits of $50 million and $25 million respectively, with a deductible of $100,000. The District also has a $100,000 deductible for errors and omissions claims. The amount of settlements and awards did not exceed insurance coverage in each of the past three years. GASB Statement 10, Accounting and Financial Reporting for Risk Financing and Related Insurance Issues, requires that for retained risks a liability for claims be reported if information available prior to issuance of the financial statements indicates it is probable that a liability has been incurred at the date of the financial statements and the amount of the loss can be reasonably estimated. In addition, there are also situations in which incidents occur before the balance sheet date, but claims are not reported or asserted when the financial statements are prepared. These incurred but not reported claims have been estimated based upon the District’s past experience and adjusted for current trends. A summary is provided in the table below. During fiscal years 2011 and 2010, changes in the balance of claims for retained risks are as follows (rounded to the nearest thousand):
Fiscal Year
Beginning of
fiscal year liability
Current year claims and changes in estimates
Claim payments
Balance at fiscal year
end 2010 $1,923,000 $499,000 $(486,000) $1,936,000 2011 1,936,000 350,000 (539,000) 1,747,000
39
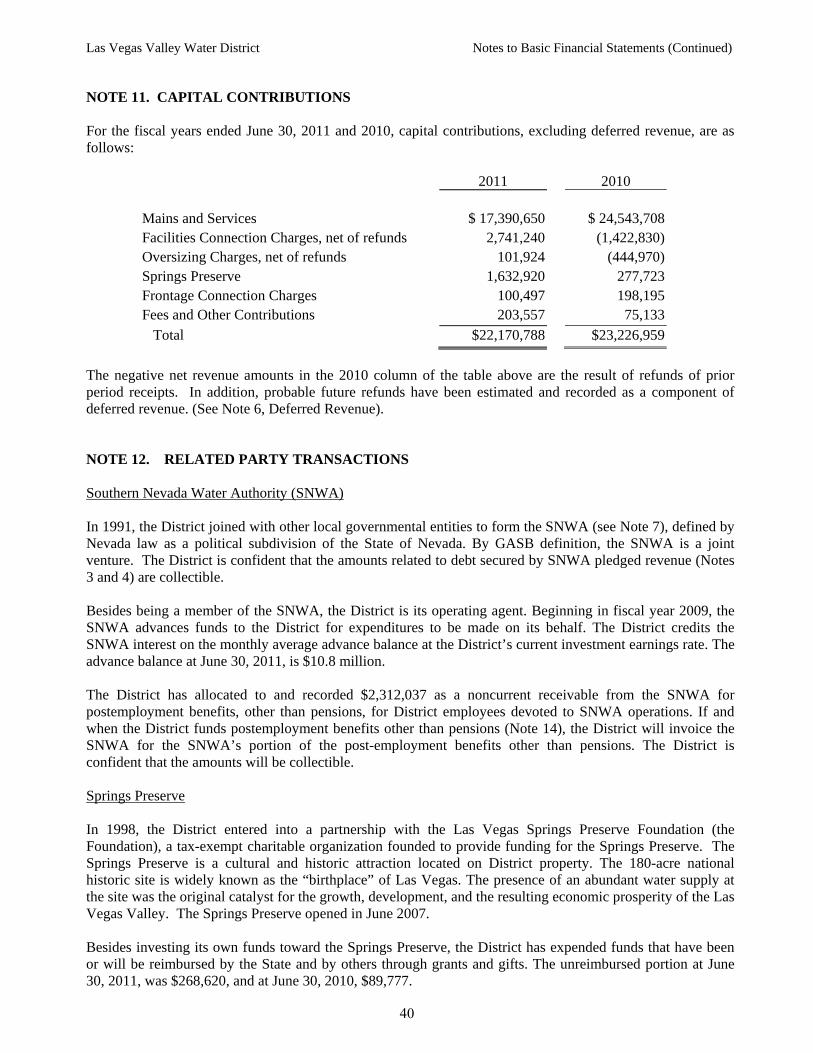
Las Vegas Valley Water District Notes to Basic Financial Statements (Continued)
NOTE 11. CAPITAL CONTRIBUTIONS For the fiscal years ended June 30, 2011 and 2010, capital contributions, excluding deferred revenue, are as follows:
2011
2010
Mains and Services $ 17,390,650 $ 24,543,708 Facilities Connection Charges, net of refunds 2,741,240 (1,422,830) Oversizing Charges, net of refunds 101,924 (444,970) Springs Preserve 1,632,920 277,723 Frontage Connection Charges 100,497 198,195 Fees and Other Contributions 203,557 75,133 Total $22,170,788 $23,226,959
The negative net revenue amounts in the 2010 column of the table above are the result of refunds of prior period receipts. In addition, probable future refunds have been estimated and recorded as a component of deferred revenue. (See Note 6, Deferred Revenue). NOTE 12. RELATED PARTY TRANSACTIONS Southern Nevada Water Authority (SNWA) In 1991, the District joined with other local governmental entities to form the SNWA (see Note 7), defined by Nevada law as a political subdivision of the State of Nevada. By GASB definition, the SNWA is a joint venture. The District is confident that the amounts related to debt secured by SNWA pledged revenue (Notes 3 and 4) are collectible. Besides being a member of the SNWA, the District is its operating agent. Beginning in fiscal year 2009, the SNWA advances funds to the District for expenditures to be made on its behalf. The District credits the SNWA interest on the monthly average advance balance at the District’s current investment earnings rate. The advance balance at June 30, 2011, is $10.8 million. The District has allocated to and recorded $2,312,037 as a noncurrent receivable from the SNWA for postemployment benefits, other than pensions, for District employees devoted to SNWA operations. If and when the District funds postemployment benefits other than pensions (Note 14), the District will invoice the SNWA for the SNWA’s portion of the post-employment benefits other than pensions. The District is confident that the amounts will be collectible. Springs Preserve In 1998, the District entered into a partnership with the Las Vegas Springs Preserve Foundation (the Foundation), a tax-exempt charitable organization founded to provide funding for the Springs Preserve. The Springs Preserve is a cultural and historic attraction located on District property. The 180-acre national historic site is widely known as the “birthplace” of Las Vegas. The presence of an abundant water supply at the site was the original catalyst for the growth, development, and the resulting economic prosperity of the Las Vegas Valley. The Springs Preserve opened in June 2007. Besides investing its own funds toward the Springs Preserve, the District has expended funds that have been or will be reimbursed by the State and by others through grants and gifts. The unreimbursed portion at June 30, 2011, was $268,620, and at June 30, 2010, $89,777.
40
Las Vegas Valley Water District Notes to Basic Financial Statements (Continued)
Big Bend Water District On September 2, 2008, the District became the operating agent for the Big Bend Water District (BBWD), located in Laughlin, Nevada, 95 miles south of Las Vegas. The BBWD is a general improvement district and a political subdivision of the State of Nevada. It is also a member agency of the SNWA. The BBWD is governed by a seven-member Board of Trustees whose members also serve as the Board of Clark County Commissioners. NOTE 13. COMMITMENTS AND CONTINGENCIES The United States is experiencing a widespread decline in residential real estate sales, mortgage lending and related construction activity. This, accompanied by inflationary trends, emerging weakness in the commercial and investment banking systems, and ongoing war activities are likely to have far-reaching effects on the economic activity in the country for an indeterminate period. The long-term impact of these factors on the Nevada economy and the District’s operations cannot be predicted at this time, but may be substantial. The District is a defendant in various lawsuits. Although the outcome of these lawsuits is not presently determinable, it is the opinion of management and the District's attorney that the resolution of these matters will not have a material adverse effect on the future financial condition, results of operations and cash flows of the District. At June 30, 2011, commitments for unperformed work on outstanding contracts totaled $13,791,854. Forward Energy Contracts The District and SNWA actively manage a portfolio of energy resources. The agencies adhere to a strict set of energy risk management procedures established by a Risk Management Committee that serves to fulfill the Energy Risk Management Policy adopted by the District's Board. To provide energy at a known and budgeted cost, the District has entered into forward energy contracts with the SNWA. Because Las Vegas is uphill from its major water supply, reliable electrical service is essential to the District's ability to deliver water. To better manage energy reliability and costs, the District manages a significant portion of its energy supply, rather than purchasing energy from the local regulated investor-owned utilities under tariff rates approved by the Nevada Public Utilities Commission. The portfolio exists solely for the purpose of providing the District's projected energy requirements through December 2015, at a known and budgetable cost, while incorporating renewable energy where appropriate. Under current accounting standards, these forward energy contracts, for which the District neither paid nor was paid anything at inception, are accounted for as "normal purchases and normal sales" contracts and not as investments. The primary risks associated with these forward energy contracts are counter-party credit and termination risks. Currently, there is no intent to terminate these contracts with offsetting contracts. As of June 30, 2011, the District had commitments totaling $19,890,383 related to its forward energy contracts. Arbitrage Rebate Requirement The federal Tax Reform Act of 1986 imposes a rebate requirement with respect to some bonds issued by the District. Under this Act, an amount may be required to be rebated to the United States Treasury (called “arbitrage”) for interest on the bonds to qualify for exclusion from gross income for federal income tax purposes. Rebatable arbitrage is computed as of each installment computation date. The arbitrage rebate calculation as of the most recent such date indicates that no amount is due. Future calculations might result in adjustments to this determination.
41
Las Vegas Valley Water District Notes to Basic Financial Statements (Continued)
Operating Lease The District entered into a sublease agreement with the SNWA for office space and parking for a term of no longer than 20 years, commencing September 1, 2007. The lease agreement includes the right to sublease and a purchase option. In December 2007, the SNWA purchased part of the premises, including part of the premises subleased to the District. Under the terms of the sublease agreement, the sublease will continue as a lease on any space purchased by the SNWA as long as the space is not needed by the SNWA. The sublease agreement may be terminated by the SNWA if breached by the District. Cancellation of the sublease at any time by the District is not prohibited. The sublease agreement provides for the District to sublease about 34,000 square feet of office space with an option to sublease up to an additional 16,000 square feet. During fiscal years 2010 and 2011 the District occupied about 36,000 square feet of the office space for a total cost of $1,564,881 in fiscal year 2010 and 2011. The sublease agreement contains provisions for contingent rentals (rentals in which amounts are dependent upon some factor other than the passage of time). The District is responsible for paying, and does pay $11,406 monthly, for the amortized value of tenant improvements during the time that the improved space is occupied by the District. Should the SNWA assign designated parking spaces to the District, the District will pay to the SNWA an additional $75.00 per space per month for each such parking space designated. The District had no contingent rental expenditures in fiscal years 2010 and 2011. The District must comply with all applicable and appropriate provisions of the lease and will take no action or fail to act in such a way that would cause the SNWA to be in breach of any provision, rule or regulation of the lease agreement. Further, the District shall not enter into any assignments or subleases of the premises without the written consent of the SNWA. Following is a schedule by fiscal year of estimated future minimum rental payments under the sublease:
2012 $1,564,881 2013 1,564,881 2014 1,564,881 2015 1,564,881 2016 1,564,881 Later years 17,474,506 Total $25,298,911
NOTE 14. POSTEMPLOYMENT BENEFITS OTHER THAN PENSIONS (OPEB) From the accrual accounting perspective, the cost of postemployment healthcare benefits, like the cost of pension benefits, generally should be associated with the periods in which the costs occurs, rather than in the future years when it will be paid. Following the requirements of GASB Statement No. 45, Accounting and Financial Reporting by Employers for Postemployment Benefits Other than Pensions (GASB Statement No. 45), the District recognizes the cost of postemployment healthcare in the year when the employee services are received by reporting the accumulated liability from the prior years, and providing useful information in assessing potential demands on the District’s future cash flows. Plan Description The District contributes to a single-employer defined benefit “other postemployment benefit plan” (OPEB plan) as explained below. Benefit provisions are established and may be amended by the District’s Board subject to collective bargaining agreements. Unlike the pension plan (Note 16), the OPEB plan is administered
42

Las Vegas Valley Water District Notes to Basic Financial Statements (Continued)
by the District and not by a trust or equivalent arrangement. The OPEB plan does not issue a stand-alone financial report. Under the OPEB plan, the District pays 100% of life insurance and group health insurance premiums for eligible retirees and 85% for their dependents until the retirees become eligible for Medicare. The District’s insurance provider (Clark County) charges the District the same premiums for retirees who are not yet eligible for Medicare as for active employees. Therefore, the retiree premium rates are subsidized by the inclusion of current employees in setting rates. Funding Policy Subject to collective bargaining agreements, the contribution requirements of plan members and the District are established and may be amended by the District’s Board. There are no legal or contractual maximum contribution rates. The required contribution is based on pay-as-you-go financing requirements. For fiscal year 2011, actuarial projected age-adjusted premiums totaled $802,111. Retirees receiving benefits contributed $24,874, approximately 3%, resulting in District contributions of $777,237. The District’s annual OPEB cost (expense) is calculated based on the annual required contribution (ARC), an amount actuarially determined in accordance with the parameters of GASB Statement No. 45. The ARC represents a level of funding that, if paid on an ongoing basis, is projected to cover the normal costs each year and amortize any unfunded actuarial liabilities (or funding excess) over a period not to exceed thirty years. For the fiscal year ended June 30, 2011, the following table shows the components of the District’s annual OPEB cost (expense) for the year, the amount contributed to the plan, and changes in the District’s net OPEB obligation.
Annual Required Contribution (ARC) $2,524,896 Interest on net OPEB obligation 263,232 Adjustment to annual required contribution (343,651) Annual OPEB cost 2,444,477 Contributions made (777,237) Increase in net OPEB obligation 1,667,240 Net OPEB obligation, beginning of the year 5,849,595 Net OPEB obligation, end of the year $7,516,835
The District’s annual OPEB cost, the percentage of annual OPEB cost contributed to the plan, and the net OPEB obligation for three fiscal years are shown below.
Percentage of Net Fiscal Annual Annual OPEB OPEB Year OPEB Cost Cost Contributed Obligation 2009 $ 2,927,054 25.9% $4,037,408 2010 2,518,831 28.1% 5,849,595 2011 2,444,477 31.8% 7,516,835
Funded Status and Funding Progress As of July 1, 2010, the most recent actuarial valuation date, the plan was zero percent funded. The actuarial accrued liability for benefits was $23.4 million and the actuarial value of assets was $0, resulting in an unfunded actuarial accrued liability (UAAL) of $23.4 million. The covered payroll (annual payroll of active employees covered by the plan) was $119.7 million and the ratio of the UAAL to the covered payroll was 19.6%. Actuarial valuations involve estimates of the value of reported amounts and assumptions about the probability of occurrence of events far into the future. Examples include assumptions about future employment, mortality,
43
Las Vegas Valley Water District Notes to Basic Financial Statements (Continued)
and the healthcare costs. Amounts determined regarding the funded status of the plan and the annual required contributions of the employer are subject to continual revision as actual results are compared with past expectations and new estimates are made about the future. The schedule of funding progress, presented as required supplementary information (RSI) immediately following the notes to the financial statements, will present in subsequent years, as additional valuations are obtained, multiyear trend information about whether the actuarial value of plan assets is increasing or decreasing over time relative to the actuarial accrued liability for benefits. The reference to the schedule of funding progress presented as RSI does not represent or imply incorporation of the schedule into the notes to the basic financial statements. Actuarial Methods and Assumptions Projections of benefits for financial reporting purposes are based on the substantive plan (the plan as understood by the employer and the plan members) and include the types of benefits provided at the time of each valuation and the historical pattern of sharing of benefit costs between the employer and plan members to that point. The actuarial methods and assumptions used include techniques that are designed to reduce the effects of short-term volatility in actuarial accrued liabilities and the actuarial value of assets, consistent with the long-term perspective of the calculations. In the July 1, 2010, actuarial valuation, the Projected Unit Credit Cost Method was used. Under this method, the actuarial present value of projected benefits is the value of benefits expected to be paid for current employees and retirees. The economic assumptions include a 4.5% discount rate (unfunded), based on the expected long-term investment return on the District’s assets and an initial healthcare inflation rate of 6.25%, grading down over 68 years to an ultimate rate of 5.00%. The Actuarial Accrued Liability (AAL) is the actuarial present value of benefits attributed to employee service rendered prior to the valuation date. The AAL equals the present value of benefits multiplied by a fraction equal to service to date over service at expected retirement. The Normal Cost is the actuarial present value of benefits attributed to one year of service. This equals the present value of benefits divided by service at expected retirement. Since retirees are not accruing any more service, their normal cost is zero. In determining the ARC, the Unfunded Actuarial Accrued Liability (UAAL) is amortized as a level dollar amount over 30 years on an open period. At June 30, 2011, the remaining amortization period is 30 years. Insured Benefit GASB Statement No. 45 defines an insured benefit as an OPEB financing arrangement whereby an employer pays premiums to an insurance company, while employees are in active service, in return for which the insurance company unconditionally undertakes an obligation to pay the postemployment benefits of those employees or their beneficiaries, as defined in the employer’s plan. Insured benefits are excluded from the calculation of annual OPEB cost and the net OPEB obligation. The District provides long-term disability benefits for totally or partially disabled employees earning less than 20% of their indexed total monthly earnings by paying premiums to an insurer while the employees are in active service for covered events that occur during the premium period. Generally, benefits are paid only to totally disabled-separated employees. Subject to collective bargaining agreements, benefit provisions are established and may be amended by the District’s Board. The obligation to pay the benefits has been effectively transferred from the District to an insurance company. The District has not guaranteed benefits in the event of the insurance company’s insolvency. For fiscal years 2011 and 2010, the District paid premiums of $750,664 and $794,826, respectively.
44
Las Vegas Valley Water District Notes to Basic Financial Statements (Continued)
NOTE 15. TERMINATION BENEFITS GASB Statement No. 47, Accounting for Termination Benefits, requires accrual of termination benefits if an offer for voluntary termination benefits is accepted or a plan for involuntary termination has been approved. During fiscal year 2011 the District offered a voluntary separation plan for regular full-time or part-time employees who had at least 15 years of service and were eligible to retire with a full or reduced pension benefit. These employees were eligible to receive an incentive equal to 25% of their accrued disability leave at retirement if application were made prior to March 30, 2011, and the desired date of retirement was by June 30, 2012. The District reserved the right to approve exceptions to the criteria. Since eligible terminating employees normally receive 75% of unused disability leave, employees retiring under the voluntary separation plan will receive 100%. During fiscal 2011, the District paid $196,434 in voluntary separation benefits to 16 employees and estimates an additional $266,000 will be paid to 20 employees in fiscal 2012 and $42,000 to 2 employees in fiscal 2013. Because the liability for disability leave is already accrued at 100%, no additional accrual was necessary at June 30, 2011. Although the employees retiring under the voluntary separation plan in fiscal 2012 and 2013 will earn and may use disability leave after June 30, 2011, the net amount is estimated not to be material. During fiscal 2010, the District did not have an involuntary termination plan, did not offer benefits for voluntary early termination of service, and did not have outstanding balances for previous years at the respective year end. NOTE 16. DEFINED BENEFIT PENSION PLAN Plan Description The District contributes to the Las Vegas Valley Water District Pension Plan (the Plan), a single-employer defined benefit pension trust fund established by the District to provide pension benefits solely for the employees of the District. A Board of Trustees, comprised of the District’s Board, has the authority to establish and amend the benefit provisions of the Plan and the contribution requirements of the District and its employees. Employee contributions are not required or permitted, except under certain conditions employees may purchase additional years of service for eligibility and increased benefits. During fiscal years 2011 and 2010, employee contributions for this purpose were $58,261 and $172,445, respectively. The Plan was amended effective February 15, 2005, to provide the following: (1) Increase the annual service credit of 2% to 2.17% for years of service after July 1, 2001 (service credit is the accumulation of pension plan years an employee was in paid status at the District); (2) change the benefit formula to increase the calculation of highest average pay by approximately 10% as currently prescribed in the Nevada Revised Statutes; and (3) add shift differential and standby pay to the total compensation counted toward the pension benefit.
Other than cost of living adjustments, the Plan does not provide ad hoc postretirement benefit increases nor does it administer postemployment healthcare plans. The Plan does not issue a stand-alone financial report. All District employees are eligible to participate in the Plan after attaining age 20 and completing six months of employment. Subject to a maximum pension benefit, normally 60% of average monthly compensation, District employees who retire at age 65 are entitled to an annual retirement benefit, payable monthly for life, of an amount equal to 2% of their average monthly compensation multiplied for the years of service prior to July 1, 2001, and 2.17% of their average monthly compensation multiplied for the years of service after July 1, 2001. For the purposes of calculating the pension benefit, average monthly compensation means the average of a member’s 36 consecutive months of highest compensation, after excluding certain elements, times approximately 110%, while participating in the Plan.
45
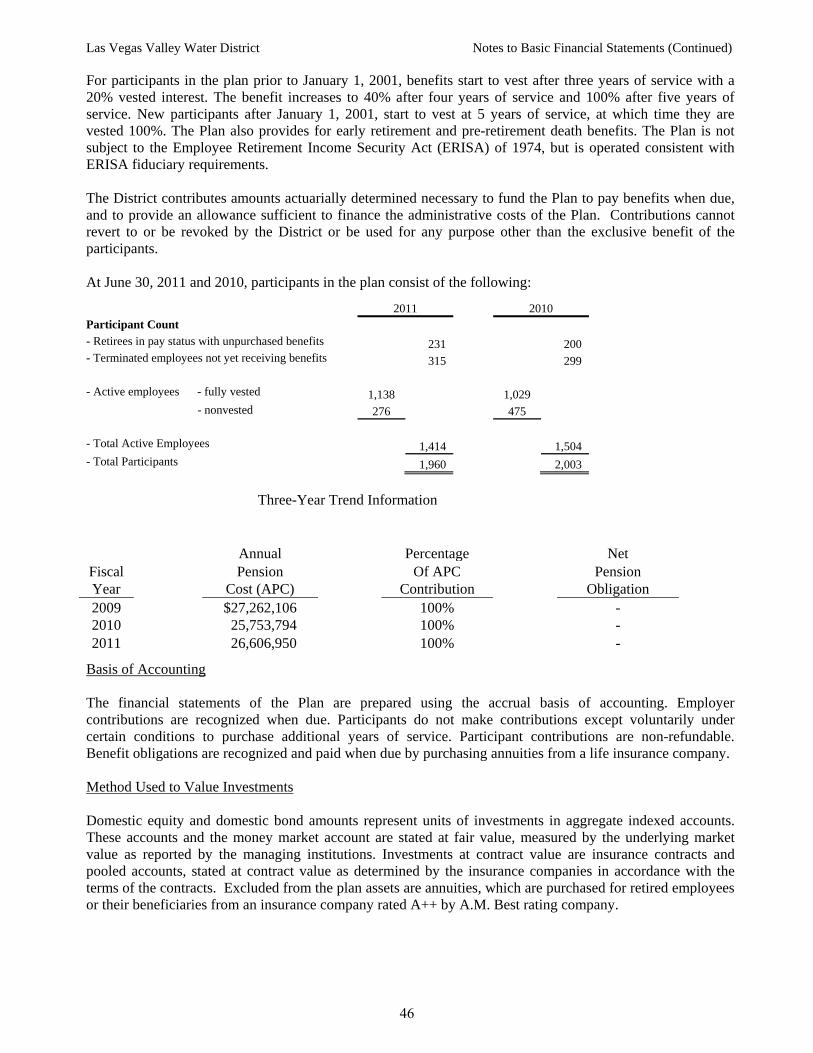
Las Vegas Valley Water District Notes to Basic Financial Statements (Continued)
For participants in the plan prior to January 1, 2001, benefits start to vest after three years of service with a 20% vested interest. The benefit increases to 40% after four years of service and 100% after five years of service. New participants after January 1, 2001, start to vest at 5 years of service, at which time they are vested 100%. The Plan also provides for early retirement and pre-retirement death benefits. The Plan is not subject to the Employee Retirement Income Security Act (ERISA) of 1974, but is operated consistent with ERISA fiduciary requirements. The District contributes amounts actuarially determined necessary to fund the Plan to pay benefits when due, and to provide an allowance sufficient to finance the administrative costs of the Plan. Contributions cannot revert to or be revoked by the District or be used for any purpose other than the exclusive benefit of the participants. At June 30, 2011 and 2010, participants in the plan consist of the following:
Basis of Accounting The financial statements of the Plan are prepared using the accrual basis of accounting. Employer contributions are recognized when due. Participants do not make contributions except voluntarily under certain conditions to purchase additional years of service. Participant contributions are non-refundable. Benefit obligations are recognized and paid when due by purchasing annuities from a life insurance company. Method Used to Value Investments Domestic equity and domestic bond amounts represent units of investments in aggregate indexed accounts. These accounts and the money market account are stated at fair value, measured by the underlying market value as reported by the managing institutions. Investments at contract value are insurance contracts and pooled accounts, stated at contract value as determined by the insurance companies in accordance with the terms of the contracts. Excluded from the plan assets are annuities, which are purchased for retired employees or their beneficiaries from an insurance company rated A++ by A.M. Best rating company.
2011 2010 Participant Count - Retirees in pay status with unpurchased benefits 231 200 - Terminated employees not yet receiving benefits 315 299 - Active employees - fully vested 1,138 1,029
- nonvested 276 475 - Total Active Employees 1,414 1,504 - Total Participants 1,960 2,003
Three-Year Trend Information
Annual Percentage Net Fiscal Pension Of APC Pension Year Cost (APC) Contribution Obligation 2009 $27,262,106 100% - 2010 25,753,794 100% - 2011 26,606,950 100% -
46
Las Vegas Valley Water District Notes to Basic Financial Statements (Continued)
Annual Required Contribution, Annual Pension Cost and Net Pension Obligation The District’s policy is to pay the current year’s annual required contribution when due. Thus, the annual required contribution, annual pension cost and net pension obligation are the same. These costs were $26,606,950 for the year ended June 30, 2011, and $25,753,794 for the year ended June 30, 2010. Funded Status and Funding Progress As of July 1, 2010, the most recent actuarial valuation date, the plan was 51.3% funded. The actuarial accrued liability was $322.9 million, and the actuarial value of assets was $165.5 million, resulting in an unfunded actuarial accrued liability (UAAL) of $157.4 million. The covered payroll (annual payroll of active employees covered by the plan) was $119.7 million, and the ratio of the UAAL to the covered payroll was 131.5%. Actuarial valuations of an ongoing plan involve estimates of the value of reported amounts and assumptions about the probability of occurrence of events far into the future. Amounts determined regarding the funded status of the plan and the annual required contributions of the District are subject to continual revision as actual results are compared with past expectations and new estimates are made about the future. The schedule of funding progress, presented as required supplementary information (RSI) following the notes to the financial statements, presents multiyear trend information about whether the actuarial value of plan assets is increasing or decreasing over time relative to the actuarial accrued liabilities. However, because fiscal year 2008 was a transition year for calculating the plan’s funded status and funding progress using the entry age normal actuarial cost method, only three years are available for display. The reference to the schedule of funding progress presented as RSI does not represent or imply incorporation of the schedule into the notes to the basic financial statements. Actuarial Methods and Assumptions Valuation date July 1, 2010. An actuarial valuation has been performed at the beginning of
each plan year since February 1987. Actuarial cost method Entry Age Actuarial Cost Method. Entry Age is the date the employee
officially enters the plan, which is July 1 on or after the attainment of age 20 and ½ year service.
Asset valuation method The actuarial value of assets was determined using techniques that smooth
the effects of short-term volatility in the market value of investments over a five-year period.
Amortization period For UAAL 30 years Amortization period type Closed – Level percent of pay Investment return 7.50% compounded annually Individual salary increases 5.25% Total payroll increases 5.00% Healthcare inflation rate 6.25% grading down over 68 years to an ultimate rate of 5.00%
47
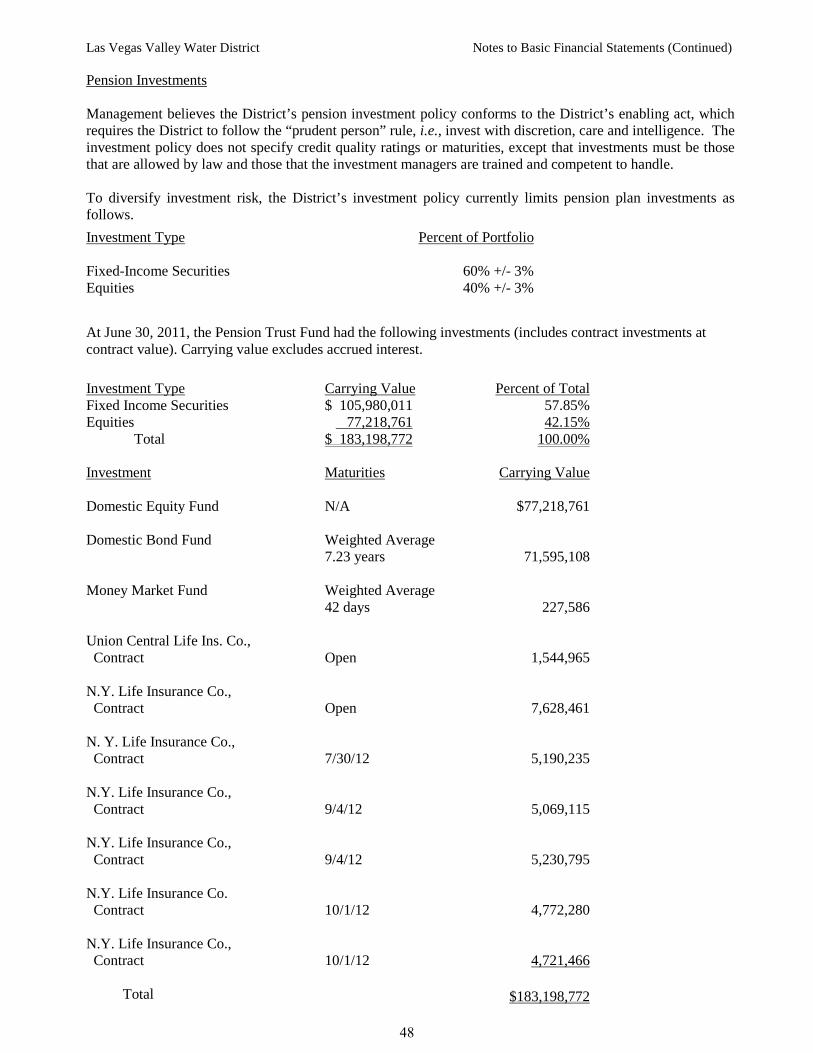
Las Vegas Valley Water District Notes to Basic Financial Statements (Continued)
Pension Investments Management believes the District’s pension investment policy conforms to the District’s enabling act, which requires the District to follow the “prudent person” rule, i.e., invest with discretion, care and intelligence. The investment policy does not specify credit quality ratings or maturities, except that investments must be those that are allowed by law and those that the investment managers are trained and competent to handle. To diversify investment risk, the District’s investment policy currently limits pension plan investments as follows.
At June 30, 2011, the Pension Trust Fund had the following investments (includes contract investments at contract value). Carrying value excludes accrued interest.
Investment Maturities Carrying Value Domestic Equity Fund N/A $77,218,761 Domestic Bond Fund Weighted Average 7.23 years 71,595,108 Money Market Fund Weighted Average 42 days 227,586 Union Central Life Ins. Co., Contract Open 1,544,965 N.Y. Life Insurance Co., Contract Open 7,628,461 N. Y. Life Insurance Co., Contract 7/30/12 5,190,235 N.Y. Life Insurance Co., Contract 9/4/12 5,069,115 N.Y. Life Insurance Co., Contract 9/4/12 5,230,795 N.Y. Life Insurance Co. Contract 10/1/12 4,772,280 N.Y. Life Insurance Co., Contract 10/1/12 4,721,466 Total $183,198,772
Investment Type Percent of Portfolio Fixed-Income Securities 60% +/- 3% Equities 40% +/- 3%
Investment Type Carrying Value Percent of Total Fixed Income Securities $ 105,980,011 57.85% Equities 77,218,761 42.15% Total $ 183,198,772 100.00%
48
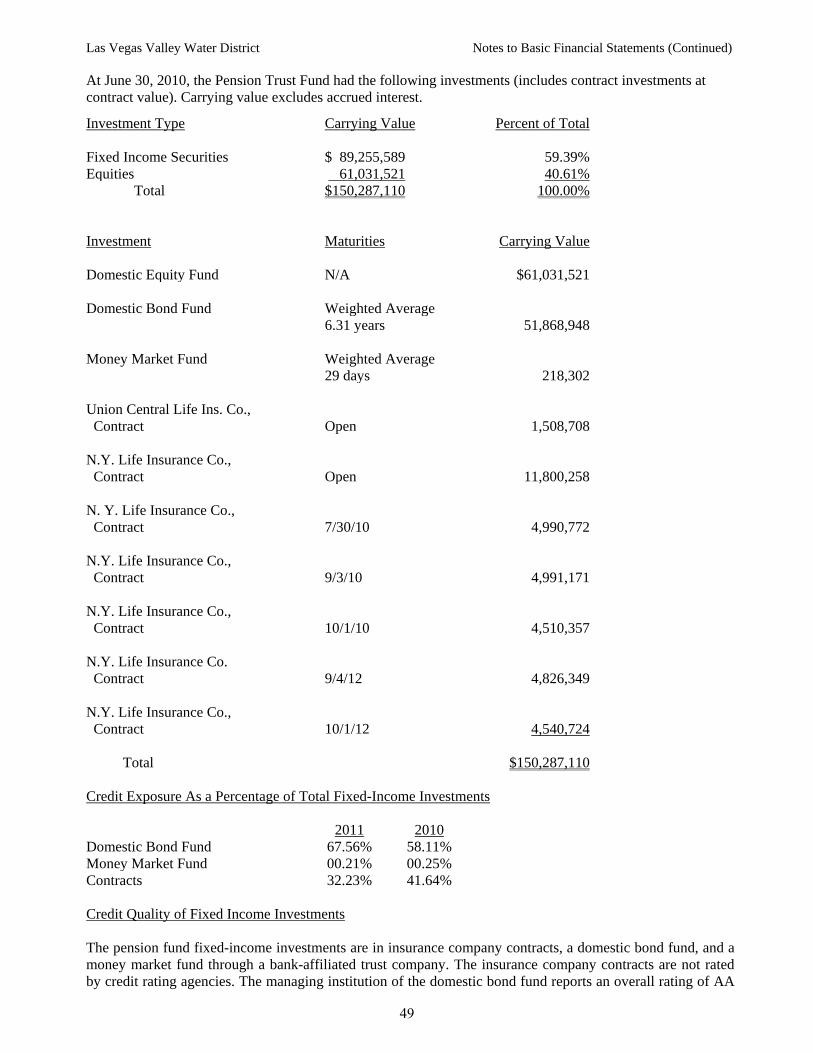
Las Vegas Valley Water District Notes to Basic Financial Statements (Continued)
At June 30, 2010, the Pension Trust Fund had the following investments (includes contract investments at contract value). Carrying value excludes accrued interest.
Investment Maturities Carrying Value Domestic Equity Fund N/A $61,031,521 Domestic Bond Fund Weighted Average 6.31 years 51,868,948 Money Market Fund Weighted Average 29 days 218,302 Union Central Life Ins. Co., Contract Open 1,508,708 N.Y. Life Insurance Co., Contract Open 11,800,258 N. Y. Life Insurance Co., Contract 7/30/10 4,990,772 N.Y. Life Insurance Co., Contract 9/3/10 4,991,171 N.Y. Life Insurance Co., Contract 10/1/10 4,510,357 N.Y. Life Insurance Co. Contract 9/4/12 4,826,349 N.Y. Life Insurance Co., Contract 10/1/12 4,540,724 Total $150,287,110 Credit Exposure As a Percentage of Total Fixed-Income Investments 2011 2010 Domestic Bond Fund 67.56% 58.11% Money Market Fund 00.21% 00.25% Contracts 32.23% 41.64% Credit Quality of Fixed Income Investments The pension fund fixed-income investments are in insurance company contracts, a domestic bond fund, and a money market fund through a bank-affiliated trust company. The insurance company contracts are not rated by credit rating agencies. The managing institution of the domestic bond fund reports an overall rating of AA
Investment Type
Carrying Value Percent of Total
Fixed Income Securities $ 89,255,589 59.39% Equities 61,031,521 40.61% Total $150,287,110 100.00%
49
Las Vegas Valley Water District Notes to Basic Financial Statements (Continued)
at June 30, 2011 and at June 30, 2010, for the underlying securities. The fund is benchmarked off the Capital Aggregate Bond Index; therefore, the fund uses Barclays rating methodology. The methodology uses the middle rating of Moody’s, Standard & Poors, and Fitch after dropping the highest and lowest available ratings. The money market fund, Federated Treasury Obligations, reports ratings of AAA by Standard & Poors and Aaa by Moody’s, at June 30, 2011, and 2010. Concentration of Credit Risk – Excluding Money Market and Mutual Funds The pension investment policy does not restrict the amount that may be invested with any one issuer as long as the prudent man rule is followed. More than 5% of the pension investments, other than the money market and domestic equity and bond funds, were as follows: New York Life Insurance Company at June 30, 2011 and 2010 was 18% and 24%, respectively. NOTE 17. SUBSEQUENT EVENTS On October 19, 2011, the District issued the following bonds: Series 2011B, $129,650,000 general obligation refunding bonds, additionally secured by SNWA pledged revenues, with a true interest cost of 4.29%; Series 2011C, $267,815,000 general obligation refunding bonds, additionally secured by SNWA pledged revenues, with a true interest cost of 4.04%; and Series 2011D, $78,680,000 general obligation refunding bonds with a true interest cost of 3.57%. The 2011B Bond proceeds advance and currently refund certain SNWA bond issues. A portion of the 2011C Bond proceeds advance refund the $188,880,000 remaining balance of the District's 2003B bonds. The 2011D Bond proceeds advance refund $81,990,000 of the District's 2003A bonds.
50
Required Supplementary Information

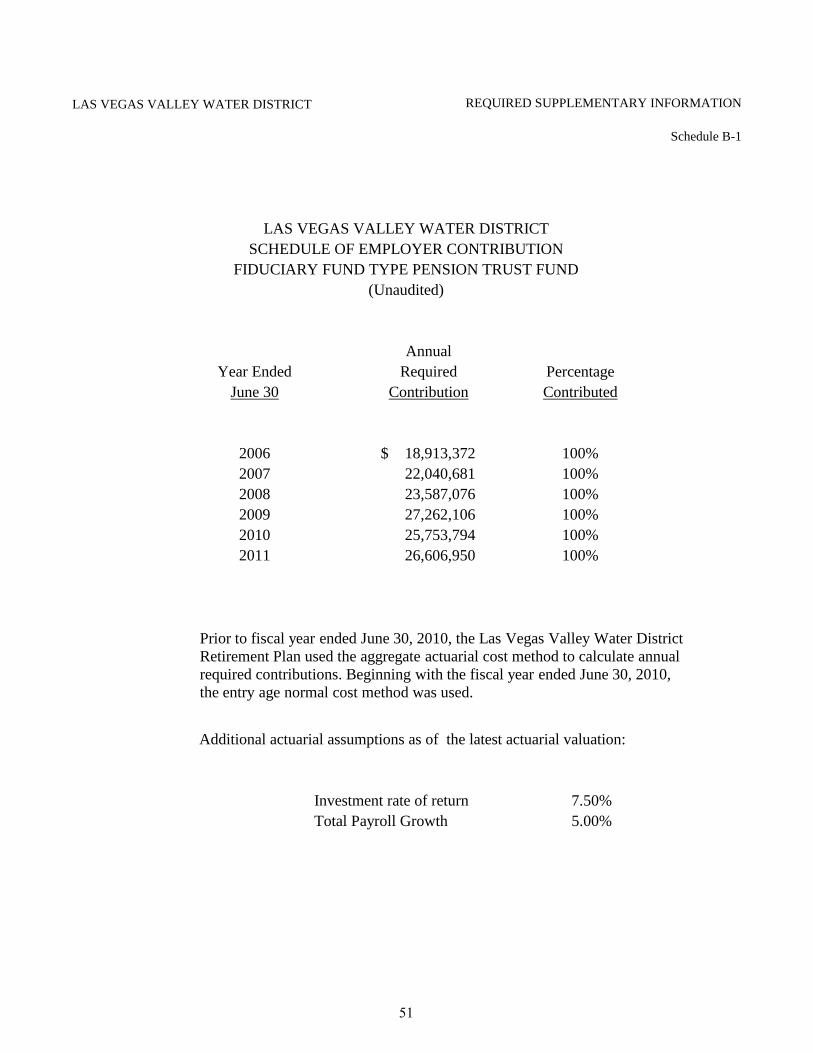
LAS VEGAS VALLEY WATER DISTRICT REQUIRED SUPPLEMENTARY INFORMATION
Schedule B-1
AnnualYear Ended Required Percentage
June 30 Contribution Contributed
2006 18,913,372$ 100%2007 22,040,681 100%2008 23,587,076 100%2009 27,262,106 100%2010 25,753,794 100%2011 26,606,950 100%
Additional actuarial assumptions as of the latest actuarial valuation:
Investment rate of return 7.50%Total Payroll Growth 5.00%
LAS VEGAS VALLEY WATER DISTRICTSCHEDULE OF EMPLOYER CONTRIBUTION
FIDUCIARY FUND TYPE PENSION TRUST FUND(Unaudited)
Prior to fiscal year ended June 30, 2010, the Las Vegas Valley Water District Retirement Plan used the aggregate actuarial cost method to calculate annual required contributions. Beginning with the fiscal year ended June 30, 2010, the entry age normal cost method was used.
51
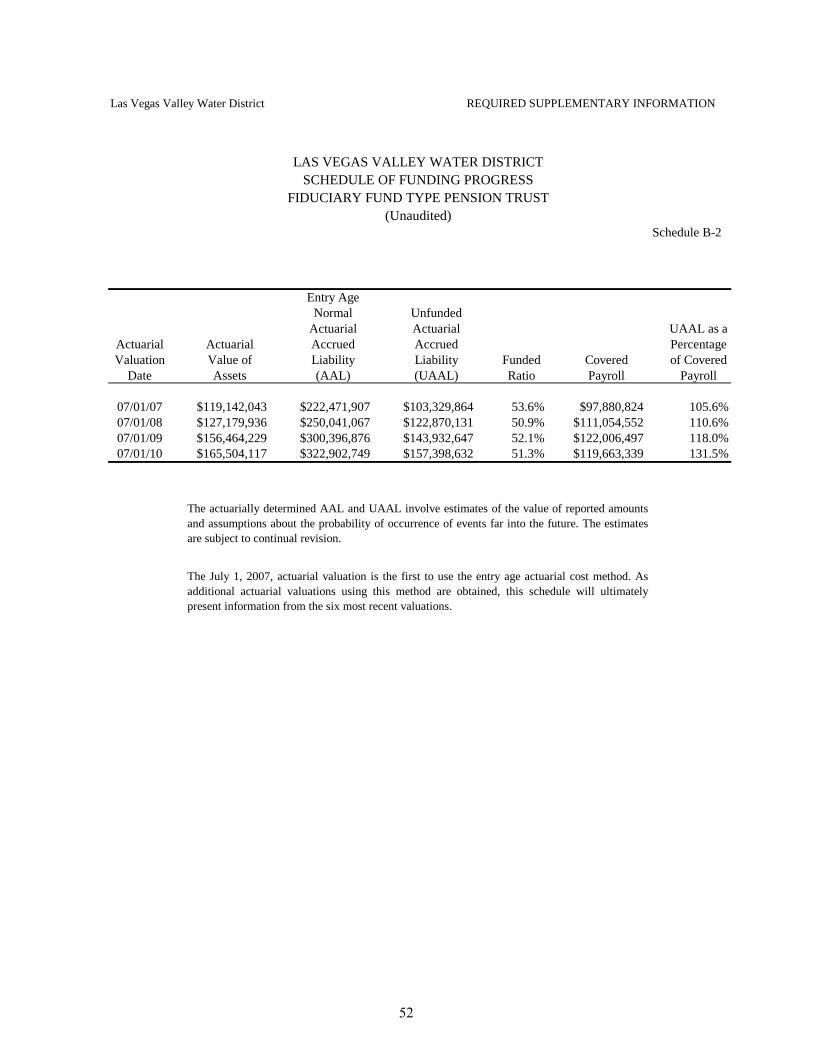
Las Vegas Valley Water District REQUIRED SUPPLEMENTARY INFORMATION
Entry AgeNormal Unfunded
Actuarial Actuarial UAAL as aActuarial Actuarial Accrued Accrued PercentageValuation Value of Liability Liability Funded Covered of Covered
Date Assets (AAL) (UAAL) Ratio Payroll Payroll
07/01/07 $119,142,043 $222,471,907 $103,329,864 53.6% $97,880,824 105.6%07/01/08 $127,179,936 $250,041,067 $122,870,131 50.9% $111,054,552 110.6%07/01/09 $156,464,229 $300,396,876 $143,932,647 52.1% $122,006,497 118.0%07/01/10 $165,504,117 $322,902,749 $157,398,632 51.3% $119,663,339 131.5%
Schedule B-2
LAS VEGAS VALLEY WATER DISTRICTSCHEDULE OF FUNDING PROGRESS
FIDUCIARY FUND TYPE PENSION TRUST
The actuarially determined AAL and UAAL involve estimates of the value of reported amountsand assumptions about the probability of occurrence of events far into the future. The estimatesare subject to continual revision.
(Unaudited)
The July 1, 2007, actuarial valuation is the first to use the entry age actuarial cost method. Asadditional actuarial valuations using this method are obtained, this schedule will ultimatelypresent information from the six most recent valuations.
52
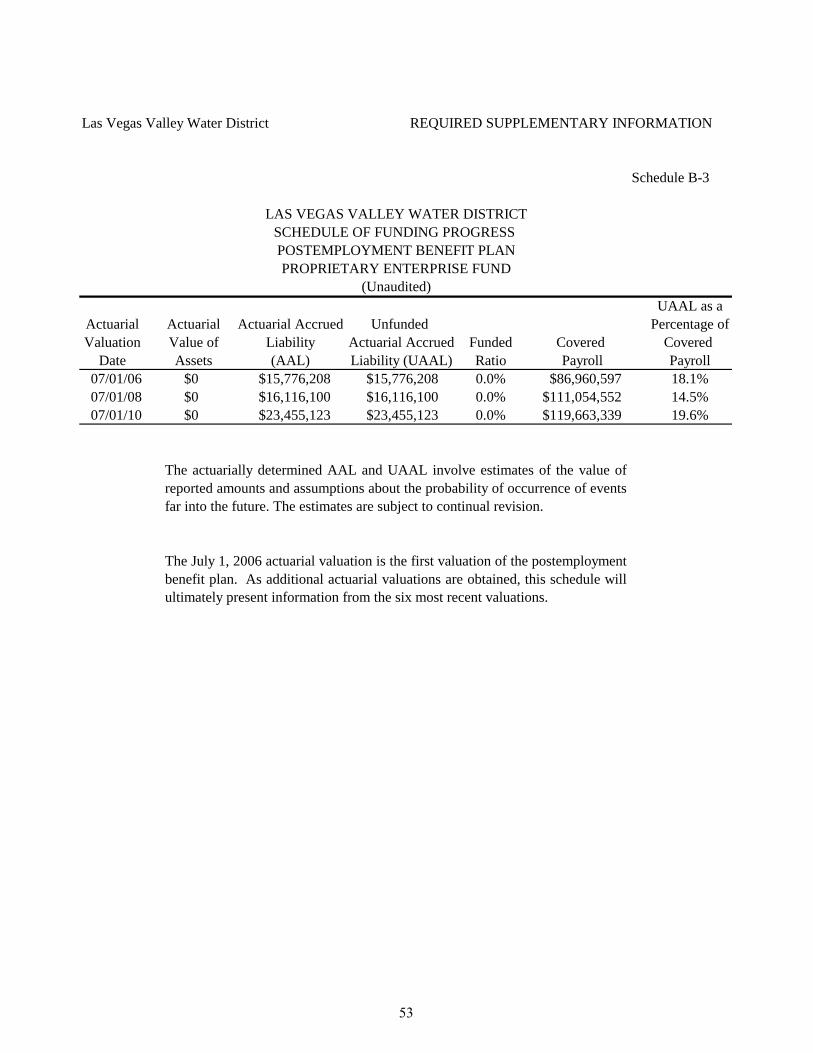
Las Vegas Valley Water District REQUIRED SUPPLEMENTARY INFORMATION
Schedule B-3
UAAL as a
Actuarial Actuarial Actuarial Accrued Unfunded Percentage ofValuation Value of Liability Actuarial Accrued Funded Covered Covered
Date Assets (AAL) Liability (UAAL) Ratio Payroll Payroll07/01/06 $0 $15,776,208 $15,776,208 0.0% $86,960,597 18.1%07/01/08 $0 $16,116,100 $16,116,100 0.0% $111,054,552 14.5%07/01/10 $0 $23,455,123 $23,455,123 0.0% $119,663,339 19.6%
The actuarially determined AAL and UAAL involve estimates of the value ofreported amounts and assumptions about the probability of occurrence of eventsfar into the future. The estimates are subject to continual revision.
The July 1, 2006 actuarial valuation is the first valuation of the postemploymentbenefit plan. As additional actuarial valuations are obtained, this schedule willultimately present information from the six most recent valuations.
SCHEDULE OF FUNDING PROGRESS LAS VEGAS VALLEY WATER DISTRICT
(Unaudited)
POSTEMPLOYMENT BENEFIT PLANPROPRIETARY ENTERPRISE FUND
53

THIS PAGE LEFT
INTENTIONALLY BLANK
STATISTICAL SECTION (UNAUDITED)
Financial Trends These schedules contain trend information to help the reader understand how the District’s financial performance and well-being have changed over time.
Revenue Capacity These schedules contain information to help the reader assess the District’s revenue sources and rate structures.
Debt Capacity These schedules contain information to help the reader assess the affordability of the District’s current levels of outstanding debt and the District’s ability to issue additional debt in the future.
Demographic and Economic Information These schedules offer demographic, economic and District indicators to help the reader understand the environment within which the District financial activities take place.
Operating Information These schedules contain service and infrastructure data to help the reader understand how the information in the District’s financial report relates to the services the District provides and the activities it performs.

FINANCIAL TReNDS SECTION
Fund Equity by Component
Changes in Fund Equity

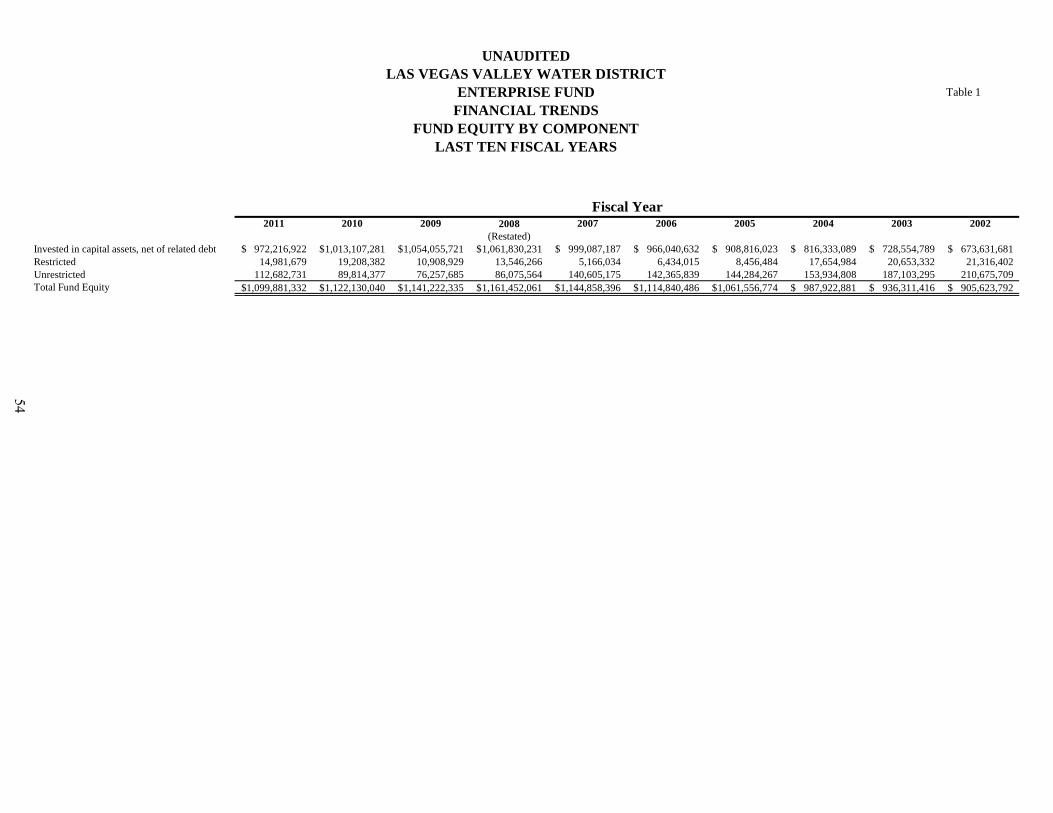
UNAUDITEDLAS VEGAS VALLEY WATER DISTRICT
ENTERPRISE FUNDFINANCIAL TRENDS
FUND EQUITY BY COMPONENTLAST TEN FISCAL YEARS
Table 1
2011 2010 2009 2008 2007 2006 2005 2004 2003 2002(Restated)
Invested in capital assets, net of related debt 972,216,922$ 1,013,107,281$ 1,054,055,721$ 1,061,830,231$ 999,087,187$ 966,040,632$ 908,816,023$ 816,333,089$ 728,554,789$ 673,631,681$ Restricted 14,981,679 19,208,382 10,908,929 13,546,266 5,166,034 6,434,015 8,456,484 17,654,984 20,653,332 21,316,402 Unrestricted 112,682,731 89,814,377 76,257,685 86,075,564 140,605,175 142,365,839 144,284,267 153,934,808 187,103,295 210,675,709 Total Fund Equity 1,099,881,332$ 1,122,130,040$ 1,141,222,335$ 1,161,452,061$ 1,144,858,396$ 1,114,840,486$ 1,061,556,774$ 987,922,881$ 936,311,416$ 905,623,792$
Fiscal Year
54
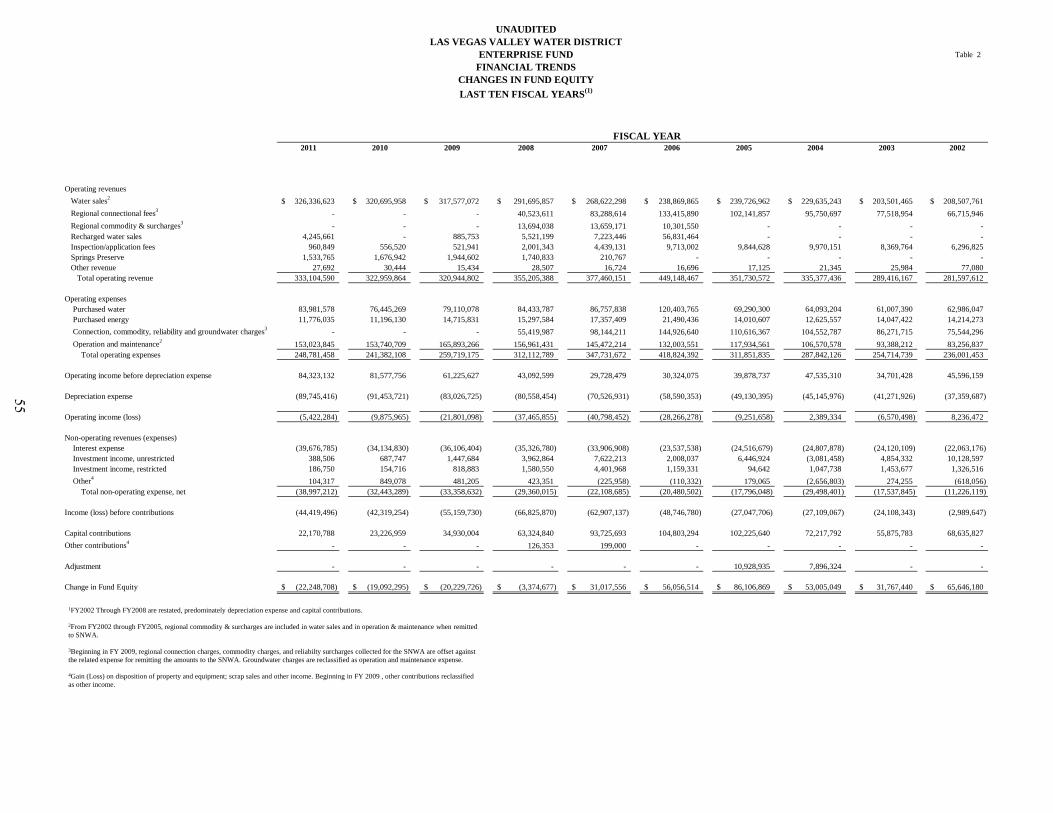
UNAUDITEDLAS VEGAS VALLEY WATER DISTRICT
ENTERPRISE FUNDFINANCIAL TRENDS
CHANGES IN FUND EQUITYLAST TEN FISCAL YEARS(1)
Table 2
FISCAL YEAR2011 2010 2009 2008 2007 2006 2005 2004 2003 2002
Operating revenues Water sales2 326,336,623$ 320,695,958$ 317,577,072$ 291,695,857$ 268,622,298$ 238,869,865$ 239,726,962$ 229,635,243$ 203,501,465$ 208,507,761$ Regional connectional fees3 - - - 40,523,611 83,288,614 133,415,890 102,141,857 95,750,697 77,518,954 66,715,946 Regional commodity & surcharges3 - - - 13,694,038 13,659,171 10,301,550 - - - - Recharged water sales 4,245,661 - 885,753 5,521,199 7,223,446 56,831,464 - - - - Inspection/application fees 960,849 556,520 521,941 2,001,343 4,439,131 9,713,002 9,844,628 9,970,151 8,369,764 6,296,825 Springs Preserve 1,533,765 1,676,942 1,944,602 1,740,833 210,767 - - - - - Other revenue 27,692 30,444 15,434 28,507 16,724 16,696 17,125 21,345 25,984 77,080 Total operating revenue 333,104,590 322,959,864 320,944,802 355,205,388 377,460,151 449,148,467 351,730,572 335,377,436 289,416,167 281,597,612
Operating expenses Purchased water 83,981,578 76,445,269 79,110,078 84,433,787 86,757,838 120,403,765 69,290,300 64,093,204 61,007,390 62,986,047 Purchased energy 11,776,035 11,196,130 14,715,831 15,297,584 17,357,409 21,490,436 14,010,607 12,625,557 14,047,422 14,214,273 Connection, commodity, reliability and groundwater charges3 - - - 55,419,987 98,144,211 144,926,640 110,616,367 104,552,787 86,271,715 75,544,296 Operation and maintenance2 153,023,845 153,740,709 165,893,266 156,961,431 145,472,214 132,003,551 117,934,561 106,570,578 93,388,212 83,256,837 Total operating expenses 248,781,458 241,382,108 259,719,175 312,112,789 347,731,672 418,824,392 311,851,835 287,842,126 254,714,739 236,001,453
Operating income before depreciation expense 84,323,132 81,577,756 61,225,627 43,092,599 29,728,479 30,324,075 39,878,737 47,535,310 34,701,428 45,596,159
Depreciation expense (89,745,416) (91,453,721) (83,026,725) (80,558,454) (70,526,931) (58,590,353) (49,130,395) (45,145,976) (41,271,926) (37,359,687)
Operating income (loss) (5,422,284) (9,875,965) (21,801,098) (37,465,855) (40,798,452) (28,266,278) (9,251,658) 2,389,334 (6,570,498) 8,236,472
Non-operating revenues (expenses) Interest expense (39,676,785) (34,134,830) (36,106,404) (35,326,780) (33,906,908) (23,537,538) (24,516,679) (24,807,878) (24,120,109) (22,063,176) Investment income, unrestricted 388,506 687,747 1,447,684 3,962,864 7,622,213 2,008,037 6,446,924 (3,081,458) 4,854,332 10,128,597 Investment income, restricted 186,750 154,716 818,883 1,580,550 4,401,968 1,159,331 94,642 1,047,738 1,453,677 1,326,516 Other4 104,317 849,078 481,205 423,351 (225,958) (110,332) 179,065 (2,656,803) 274,255 (618,056) Total non-operating expense, net (38,997,212) (32,443,289) (33,358,632) (29,360,015) (22,108,685) (20,480,502) (17,796,048) (29,498,401) (17,537,845) (11,226,119)
Income (loss) before contributions (44,419,496) (42,319,254) (55,159,730) (66,825,870) (62,907,137) (48,746,780) (27,047,706) (27,109,067) (24,108,343) (2,989,647)
Capital contributions 22,170,788 23,226,959 34,930,004 63,324,840 93,725,693 104,803,294 102,225,640 72,217,792 55,875,783 68,635,827 Other contributions4 - - - 126,353 199,000 - - - - -
Adjustment - - - - - - 10,928,935 7,896,324 - -
Change in Fund Equity (22,248,708)$ (19,092,295)$ (20,229,726)$ (3,374,677)$ 31,017,556$ 56,056,514$ 86,106,869$ 53,005,049$ 31,767,440$ 65,646,180$
1FY2002 Through FY2008 are restated, predominately depreciation expense and capital contributions.
2From FY2002 through FY2005, regional commodity & surcharges are included in water sales and in operation & maintenance when remitted to SNWA. 3Beginning in FY 2009, regional connection charges, commodity charges, and reliabilty surcharges collected for the SNWA are offset against the related expense for remitting the amounts to the SNWA. Groundwater charges are reclassified as operation and maintenance expense. 4Gain (Loss) on disposition of property and equipment; scrap sales and other income. Beginning in FY 2009 , other contributions reclassified as other income.
55
ReveNUe CApACITY SECTION
Water Consumption, Revenue and Active Accounts
Revenue Analysis by Class of Service
Water Rates Last Ten Fiscal Years
2011 Municipal Water Rates Survey
Top Ten Principal Ratepayers Calendar Year 2010 and Nine Years Ago

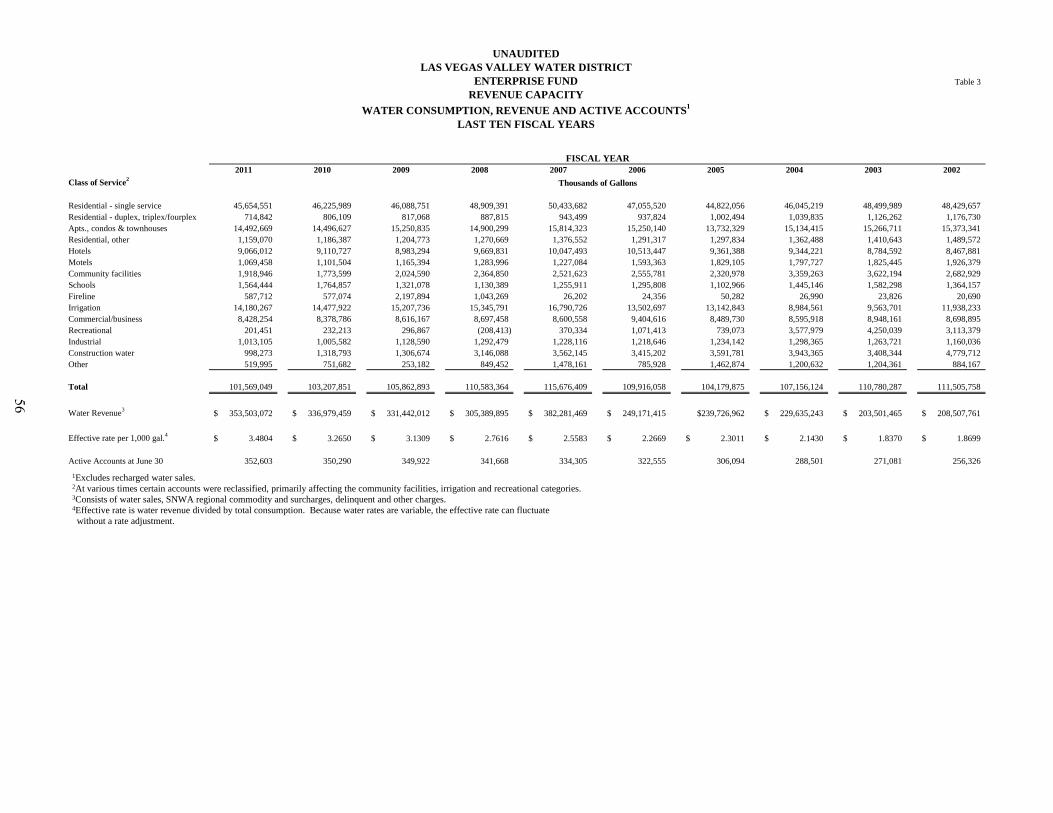
UNAUDITEDLAS VEGAS VALLEY WATER DISTRICT
ENTERPRISE FUNDREVENUE CAPACITY
WATER CONSUMPTION, REVENUE AND ACTIVE ACCOUNTS1
LAST TEN FISCAL YEARS
Table 3
2011 2010 2009 2008 2007 2006 2005 2004 2003 2002Class of Service2
Residential - single service 45,654,551 46,225,989 46,088,751 48,909,391 50,433,682 47,055,520 44,822,056 46,045,219 48,499,989 48,429,657 Residential - duplex, triplex/fourplex 714,842 806,109 817,068 887,815 943,499 937,824 1,002,494 1,039,835 1,126,262 1,176,730 Apts., condos & townhouses 14,492,669 14,496,627 15,250,835 14,900,299 15,814,323 15,250,140 13,732,329 15,134,415 15,266,711 15,373,341 Residential, other 1,159,070 1,186,387 1,204,773 1,270,669 1,376,552 1,291,317 1,297,834 1,362,488 1,410,643 1,489,572 Hotels 9,066,012 9,110,727 8,983,294 9,669,831 10,047,493 10,513,447 9,361,388 9,344,221 8,784,592 8,467,881 Motels 1,069,458 1,101,504 1,165,394 1,283,996 1,227,084 1,593,363 1,829,105 1,797,727 1,825,445 1,926,379 Community facilities 1,918,946 1,773,599 2,024,590 2,364,850 2,521,623 2,555,781 2,320,978 3,359,263 3,622,194 2,682,929 Schools 1,564,444 1,764,857 1,321,078 1,130,389 1,255,911 1,295,808 1,102,966 1,445,146 1,582,298 1,364,157 Fireline 587,712 577,074 2,197,894 1,043,269 26,202 24,356 50,282 26,990 23,826 20,690 Irrigation 14,180,267 14,477,922 15,207,736 15,345,791 16,790,726 13,502,697 13,142,843 8,984,561 9,563,701 11,938,233 Commercial/business 8,428,254 8,378,786 8,616,167 8,697,458 8,600,558 9,404,616 8,489,730 8,595,918 8,948,161 8,698,895 Recreational 201,451 232,213 296,867 (208,413) 370,334 1,071,413 739,073 3,577,979 4,250,039 3,113,379 Industrial 1,013,105 1,005,582 1,128,590 1,292,479 1,228,116 1,218,646 1,234,142 1,298,365 1,263,721 1,160,036 Construction water 998,273 1,318,793 1,306,674 3,146,088 3,562,145 3,415,202 3,591,781 3,943,365 3,408,344 4,779,712 Other 519,995 751,682 253,182 849,452 1,478,161 785,928 1,462,874 1,200,632 1,204,361 884,167
Total 101,569,049 103,207,851 105,862,893 110,583,364 115,676,409 109,916,058 104,179,875 107,156,124 110,780,287 111,505,758
Water Revenue3 353,503,072$ 336,979,459$ 331,442,012$ 305,389,895$ 382,281,469$ 249,171,415$ $239,726,962 229,635,243$ 203,501,465$ 208,507,761$
Effective rate per 1,000 gal.4 3.4804$ 3.2650$ 3.1309$ 2.7616$ 2.5583$ 2.2669$ 2.3011$ 2.1430$ 1.8370$ 1.8699$
Active Accounts at June 30 352,603 350,290 349,922 341,668 334,305 322,555 306,094 288,501 271,081 256,326
FISCAL YEAR
Thousands of Gallons
1Excludes recharged water sales. 2At various times certain accounts were reclassified, primarily affecting the community facilities, irrigation and recreational categories. 3Consists of water sales, SNWA regional commodity and surcharges, delinquent and other charges. 4Effective rate is water revenue divided by total consumption. Because water rates are variable, the effective rate can fluctuate without a rate adjustment.
56
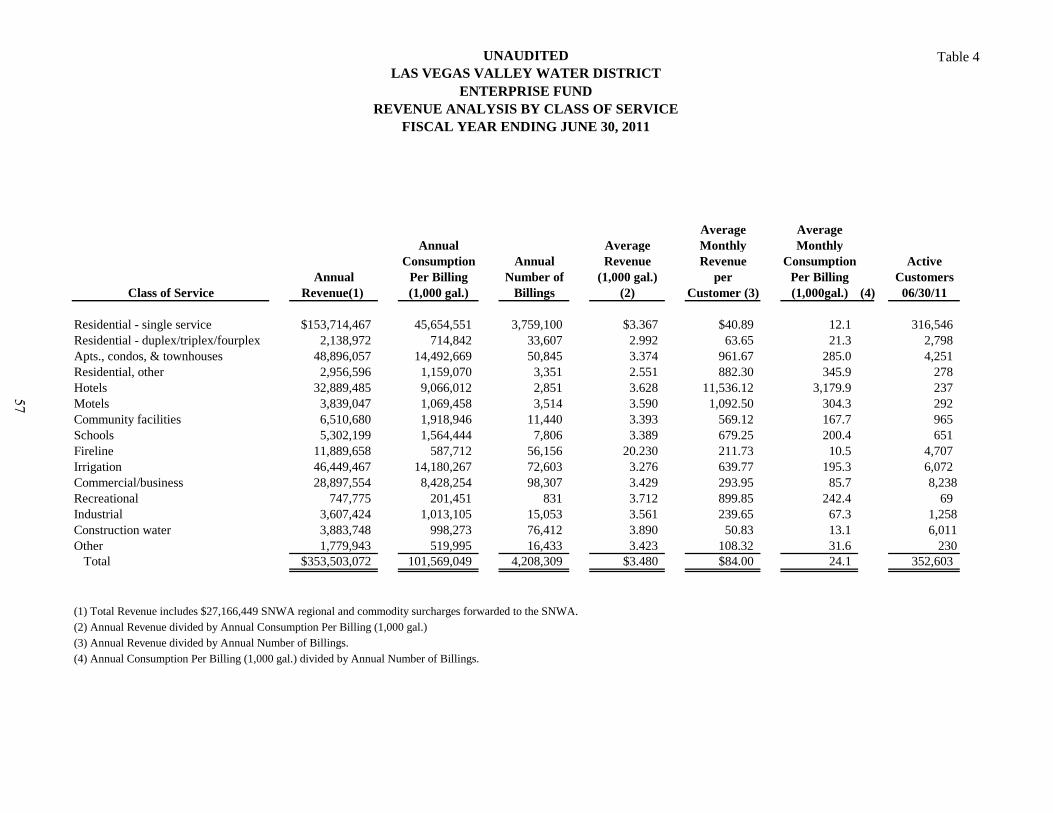
UNAUDITEDLAS VEGAS VALLEY WATER DISTRICT
ENTERPRISE FUND REVENUE ANALYSIS BY CLASS OF SERVICE
FISCAL YEAR ENDING JUNE 30, 2011
Table 4
Average Average Annual Average Monthly Monthly
Consumption Annual Revenue Revenue Consumption Active Annual Per Billing Number of (1,000 gal.) per Per Billing Customers
Class of Service Revenue(1) (1,000 gal.) Billings (2) Customer (3) (1,000gal.) (4) 06/30/11
Residential - single service $153,714,467 45,654,551 3,759,100 $3.367 $40.89 12.1 316,546Residential - duplex/triplex/fourplex 2,138,972 714,842 33,607 2.992 63.65 21.3 2,798Apts., condos, & townhouses 48,896,057 14,492,669 50,845 3.374 961.67 285.0 4,251Residential, other 2,956,596 1,159,070 3,351 2.551 882.30 345.9 278Hotels 32,889,485 9,066,012 2,851 3.628 11,536.12 3,179.9 237Motels 3,839,047 1,069,458 3,514 3.590 1,092.50 304.3 292Community facilities 6,510,680 1,918,946 11,440 3.393 569.12 167.7 965Schools 5,302,199 1,564,444 7,806 3.389 679.25 200.4 651Fireline 11,889,658 587,712 56,156 20.230 211.73 10.5 4,707Irrigation 46,449,467 14,180,267 72,603 3.276 639.77 195.3 6,072Commercial/business 28,897,554 8,428,254 98,307 3.429 293.95 85.7 8,238Recreational 747,775 201,451 831 3.712 899.85 242.4 69Industrial 3,607,424 1,013,105 15,053 3.561 239.65 67.3 1,258Construction water 3,883,748 998,273 76,412 3.890 50.83 13.1 6,011Other 1,779,943 519,995 16,433 3.423 108.32 31.6 230 Total $353,503,072 101,569,049 4,208,309 $3.480 $84.00 24.1 352,603
(1) Total Revenue includes $27,166,449 SNWA regional and commodity surcharges forwarded to the SNWA.(2) Annual Revenue divided by Annual Consumption Per Billing (1,000 gal.)(3) Annual Revenue divided by Annual Number of Billings.(4) Annual Consumption Per Billing (1,000 gal.) divided by Annual Number of Billings.
57
Unaudited Las Vegas Valley Water District
Enterprise Fund Revenue Capacity
Water Rates
Water rates for the last ten fiscal years are displayed on the following pages. The ⅝” and ¾” meter diameter services are primarily residential. Monthly water costs vary based on the number of days in the billing period. Water rates are structured to promote conservation, pay operating expenses and bond debt service, and fund expenditures for utility plant not funded by bond proceeds.
58

THIS PAGE LEFT
INTENTIONALLY BLANK

UNAUDITEDLAS VEGAS VALLEY WATER DISTRICT
ENTERPRISE FUNDREVENUE CAPACITY
WATER RATES¹JANUARY 1, 2011 TO JUNE 30, 2011
Table 5
Rate Meter Size Service Charge Non-Residential Single Family Residential
(inches) Daily (In Gallons) (In Gallons) Per 1,000 gallonsFirst 167 First 167 $1.16
5/8 $0.3355 Next 167 Next 167 $2.08Next 333 Next 333 $3.09Over 667 Over 667 $4.58First 250 First 222 $1.16
3/4 $0.3863 Next 250 Next 222 $2.08Next 500 Next 444 $3.09
Over 1,000 Over 889 $4.58First 417 First 334 $1.16
1 $0.4880 Next 417 Next 334 $2.08Next 1,666 Next 1,222 $3.09Over 2,500 Over 1,889 $4.58First 833 First 611 $1.16
1 1/2 $0.7419 Next 833 Next 611 $2.08Next 6,667 Next 4,556 $3.09Over 8,333 Over 5,778 $4.58First 1,333 First 944 $1.16
2 $1.0472 Next 1,333 Next 944 $2.08Next 16,000 Next 10,778 $3.09Over 18,666 Over 12,666 $4.58
$1.163 $1.8609 $2.08
$3.09$4.58$1.16
4 $2.7761 $2.08$3.09$4.58$1.16
6 $5.3186 $2.08$3.09$4.58$1.16
8 $8.3696 $2.08$3.09$4.58$1.16
10 $11.9289 $2.08$3.09$4.58$1.16
12 $17.5224 $2.08$3.09$4.58
Continued
Next 1,926,667Over 1,983,333
First 19,167Next 19,167
Next 1,303,333Over 1,341,667
First 28,333Next 28,333
Next 400,000Over 416,666First 13,333Next 13,333
Next 773,337Over 800,000
First 4,167Next 4,167
Next 125,000Over 133,334
First 8,333Next 8,333
Rate ThresholdsAvg. Daily Use
First 2,667Next 2,667Next 42,666Over 48,000
¹ Excluded: (a) Rates for outlying areas areas and mobile home parks; (b) Special purpose rates and charges, such as for private fire protection water and metered construction water; (c) SNWA reliability surcharge on residential class customers at .25% of the total water bill and 2.5% for all other customer classes; In effect since March 1, 1998; (d) SNWA commodity charge (not charged to outlying areas): $0.05/1,000 gallons from July 1, 1999 to October 31, 2005; $0.10/1,000 gallons from November 1, 2005 to December 31, 2009; $0.20/1,000 gallons from January 1, 2010 to December 31, 2010; $0.30/1,000 gallons from January 1, 2011 to June 30, 2011.
59
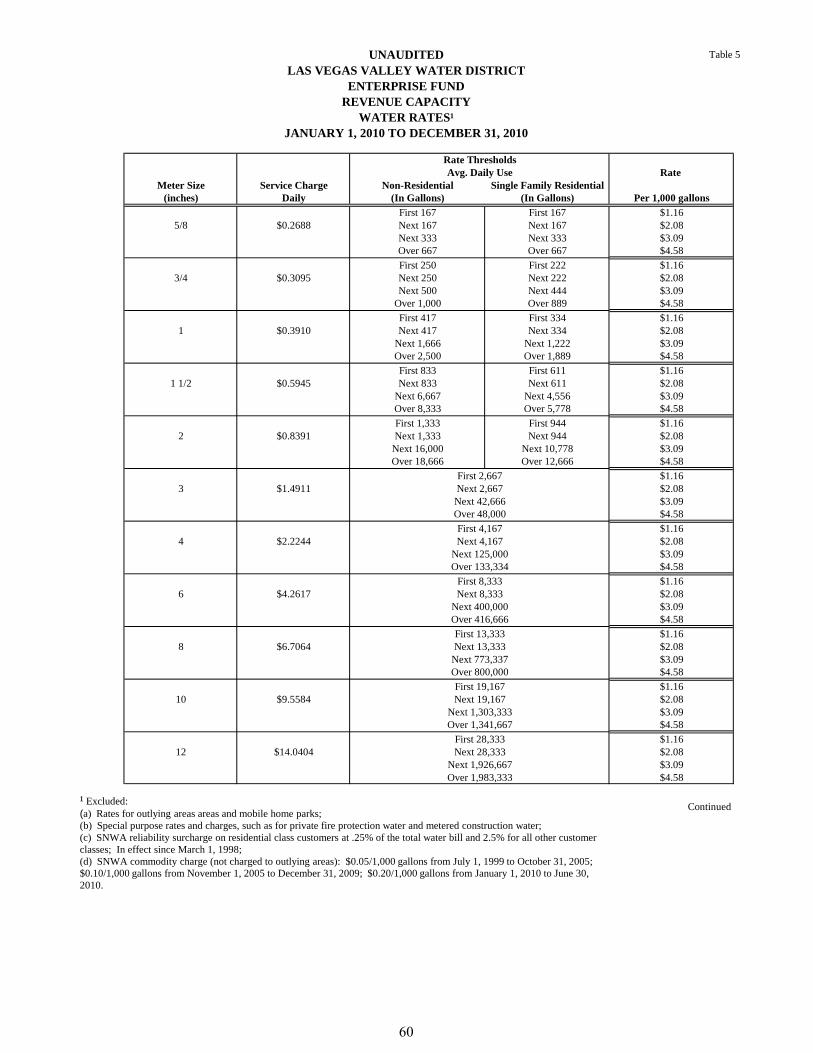
UNAUDITEDLAS VEGAS VALLEY WATER DISTRICT
ENTERPRISE FUNDREVENUE CAPACITY
WATER RATES¹JANUARY 1, 2010 TO DECEMBER 31, 2010
Table 5
Rate Meter Size Service Charge Non-Residential Single Family Residential
(inches) Daily (In Gallons) (In Gallons) Per 1,000 gallonsFirst 167 First 167 $1.16
5/8 $0.2688 Next 167 Next 167 $2.08Next 333 Next 333 $3.09Over 667 Over 667 $4.58First 250 First 222 $1.16
3/4 $0.3095 Next 250 Next 222 $2.08Next 500 Next 444 $3.09
Over 1,000 Over 889 $4.58First 417 First 334 $1.16
1 $0.3910 Next 417 Next 334 $2.08Next 1,666 Next 1,222 $3.09Over 2,500 Over 1,889 $4.58First 833 First 611 $1.16
1 1/2 $0.5945 Next 833 Next 611 $2.08Next 6,667 Next 4,556 $3.09Over 8,333 Over 5,778 $4.58First 1,333 First 944 $1.16
2 $0.8391 Next 1,333 Next 944 $2.08Next 16,000 Next 10,778 $3.09Over 18,666 Over 12,666 $4.58
$1.163 $1.4911 $2.08
$3.09$4.58$1.16
4 $2.2244 $2.08$3.09$4.58$1.16
6 $4.2617 $2.08$3.09$4.58$1.16
8 $6.7064 $2.08$3.09$4.58$1.16
10 $9.5584 $2.08$3.09$4.58$1.16
12 $14.0404 $2.08$3.09$4.58
Continued
Next 125,000Over 133,334
First 8,333Next 8,333
Rate ThresholdsAvg. Daily Use
First 2,667
Next 4,167
Next 2,667Next 42,666Over 48,000First 4,167
Next 773,337Over 800,000First 19,167Next 19,167
Next 400,000Over 416,666First 13,333Next 13,333
Next 1,926,667Over 1,983,333
Next 1,303,333Over 1,341,667
First 28,333Next 28,333
¹ Excluded: (a) Rates for outlying areas areas and mobile home parks; (b) Special purpose rates and charges, such as for private fire protection water and metered construction water; (c) SNWA reliability surcharge on residential class customers at .25% of the total water bill and 2.5% for all other customer classes; In effect since March 1, 1998; (d) SNWA commodity charge (not charged to outlying areas): $0.05/1,000 gallons from July 1, 1999 to October 31, 2005; $0.10/1,000 gallons from November 1, 2005 to December 31, 2009; $0.20/1,000 gallons from January 1, 2010 to June 30, 2010.
60
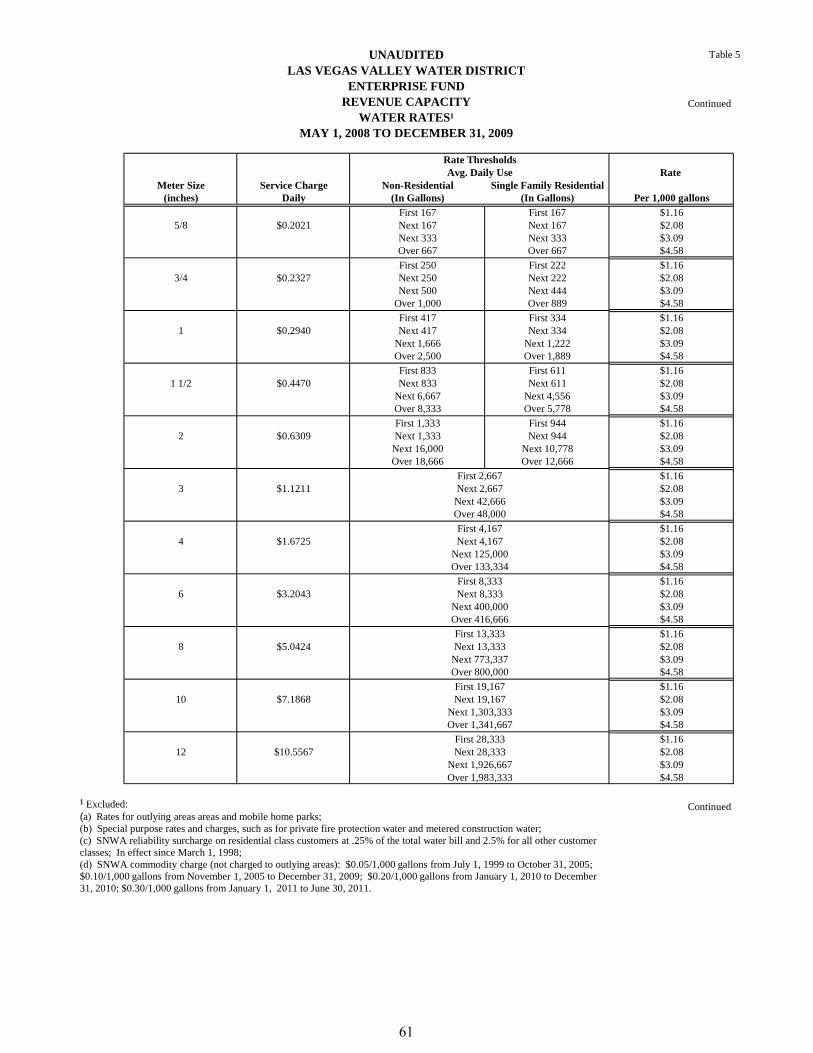
UNAUDITEDLAS VEGAS VALLEY WATER DISTRICT
ENTERPRISE FUNDREVENUE CAPACITY
WATER RATES¹MAY 1, 2008 TO DECEMBER 31, 2009
Table 5
Continued
Rate Meter Size Service Charge Non-Residential Single Family Residential
(inches) Daily (In Gallons) (In Gallons) Per 1,000 gallonsFirst 167 First 167 $1.16
5/8 $0.2021 Next 167 Next 167 $2.08Next 333 Next 333 $3.09Over 667 Over 667 $4.58First 250 First 222 $1.16
3/4 $0.2327 Next 250 Next 222 $2.08Next 500 Next 444 $3.09
Over 1,000 Over 889 $4.58First 417 First 334 $1.16
1 $0.2940 Next 417 Next 334 $2.08Next 1,666 Next 1,222 $3.09Over 2,500 Over 1,889 $4.58First 833 First 611 $1.16
1 1/2 $0.4470 Next 833 Next 611 $2.08Next 6,667 Next 4,556 $3.09Over 8,333 Over 5,778 $4.58First 1,333 First 944 $1.16
2 $0.6309 Next 1,333 Next 944 $2.08Next 16,000 Next 10,778 $3.09Over 18,666 Over 12,666 $4.58
$1.163 $1.1211 $2.08
$3.09$4.58$1.16
4 $1.6725 $2.08$3.09$4.58$1.16
6 $3.2043 $2.08$3.09$4.58$1.16
8 $5.0424 $2.08$3.09$4.58$1.16
10 $7.1868 $2.08$3.09$4.58$1.16
12 $10.5567 $2.08$3.09$4.58
Continued
Next 1,926,667Over 1,983,333
Next 1,303,333Over 1,341,667
First 28,333Next 28,333
First 13,333Next 13,333
Next 773,337Over 800,000First 19,167Next 19,167
Next 125,000Over 133,334
First 8,333Next 8,333
Next 400,000Over 416,666
Rate ThresholdsAvg. Daily Use
First 2,667
Next 4,167
Next 2,667Next 42,666Over 48,000First 4,167
¹ Excluded: (a) Rates for outlying areas areas and mobile home parks; (b) Special purpose rates and charges, such as for private fire protection water and metered construction water; (c) SNWA reliability surcharge on residential class customers at .25% of the total water bill and 2.5% for all other customer classes; In effect since March 1, 1998; (d) SNWA commodity charge (not charged to outlying areas): $0.05/1,000 gallons from July 1, 1999 to October 31, 2005; $0.10/1,000 gallons from November 1, 2005 to December 31, 2009; $0.20/1,000 gallons from January 1, 2010 to December 31, 2010; $0.30/1,000 gallons from January 1, 2011 to June 30, 2011.
61
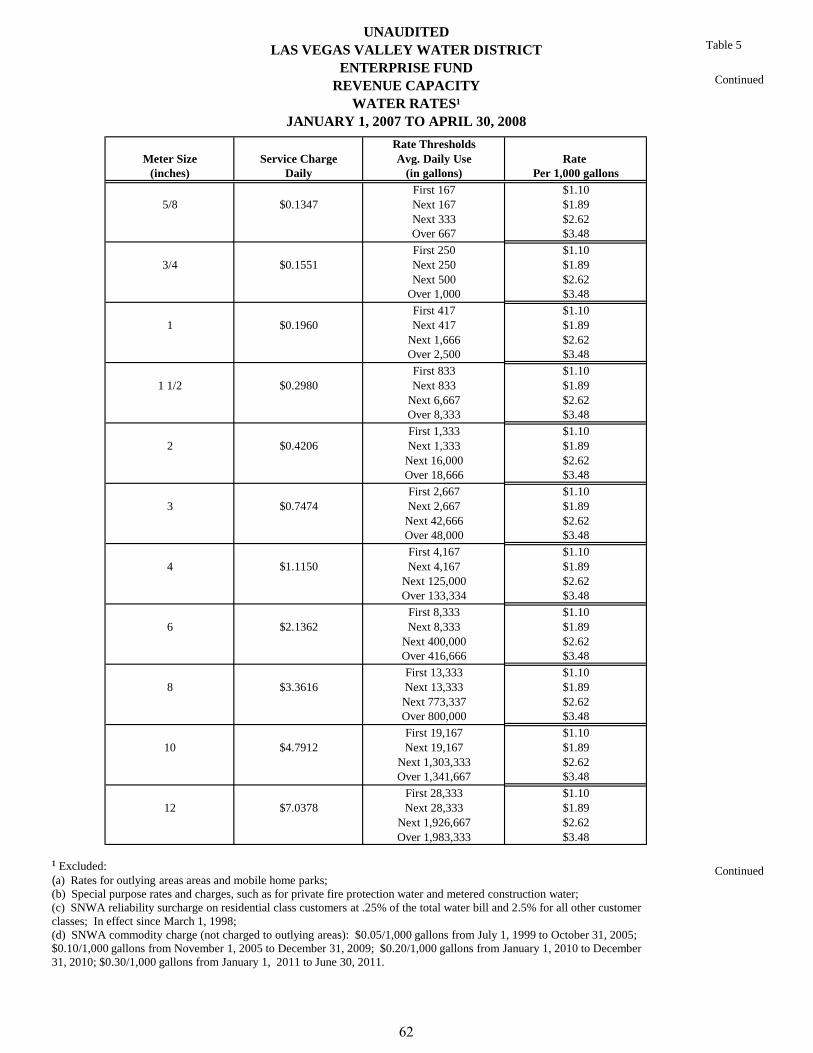
UNAUDITEDLAS VEGAS VALLEY WATER DISTRICT
ENTERPRISE FUNDREVENUE CAPACITY
WATER RATES¹JANUARY 1, 2007 TO APRIL 30, 2008
Table 5
Continued
Rate ThresholdsMeter Size Service Charge Avg. Daily Use Rate
(inches) Daily (in gallons) Per 1,000 gallonsFirst 167 $1.10
5/8 $0.1347 Next 167 $1.89Next 333 $2.62Over 667 $3.48First 250 $1.10
3/4 $0.1551 Next 250 $1.89Next 500 $2.62
Over 1,000 $3.48First 417 $1.10
1 $0.1960 Next 417 $1.89Next 1,666 $2.62Over 2,500 $3.48First 833 $1.10
1 1/2 $0.2980 Next 833 $1.89Next 6,667 $2.62Over 8,333 $3.48First 1,333 $1.10
2 $0.4206 Next 1,333 $1.89Next 16,000 $2.62Over 18,666 $3.48First 2,667 $1.10
3 $0.7474 Next 2,667 $1.89Next 42,666 $2.62Over 48,000 $3.48First 4,167 $1.10
4 $1.1150 Next 4,167 $1.89Next 125,000 $2.62Over 133,334 $3.48
First 8,333 $1.106 $2.1362 Next 8,333 $1.89
Next 400,000 $2.62Over 416,666 $3.48First 13,333 $1.10
8 $3.3616 Next 13,333 $1.89Next 773,337 $2.62Over 800,000 $3.48First 19,167 $1.10
10 $4.7912 Next 19,167 $1.89Next 1,303,333 $2.62Over 1,341,667 $3.48
First 28,333 $1.1012 $7.0378 Next 28,333 $1.89
Next 1,926,667 $2.62Over 1,983,333 $3.48
Continued¹ Excluded: (a) Rates for outlying areas areas and mobile home parks; (b) Special purpose rates and charges, such as for private fire protection water and metered construction water; (c) SNWA reliability surcharge on residential class customers at .25% of the total water bill and 2.5% for all other customer classes; In effect since March 1, 1998; (d) SNWA commodity charge (not charged to outlying areas): $0.05/1,000 gallons from July 1, 1999 to October 31, 2005; $0.10/1,000 gallons from November 1, 2005 to December 31, 2009; $0.20/1,000 gallons from January 1, 2010 to December 31, 2010; $0.30/1,000 gallons from January 1, 2011 to June 30, 2011.
62
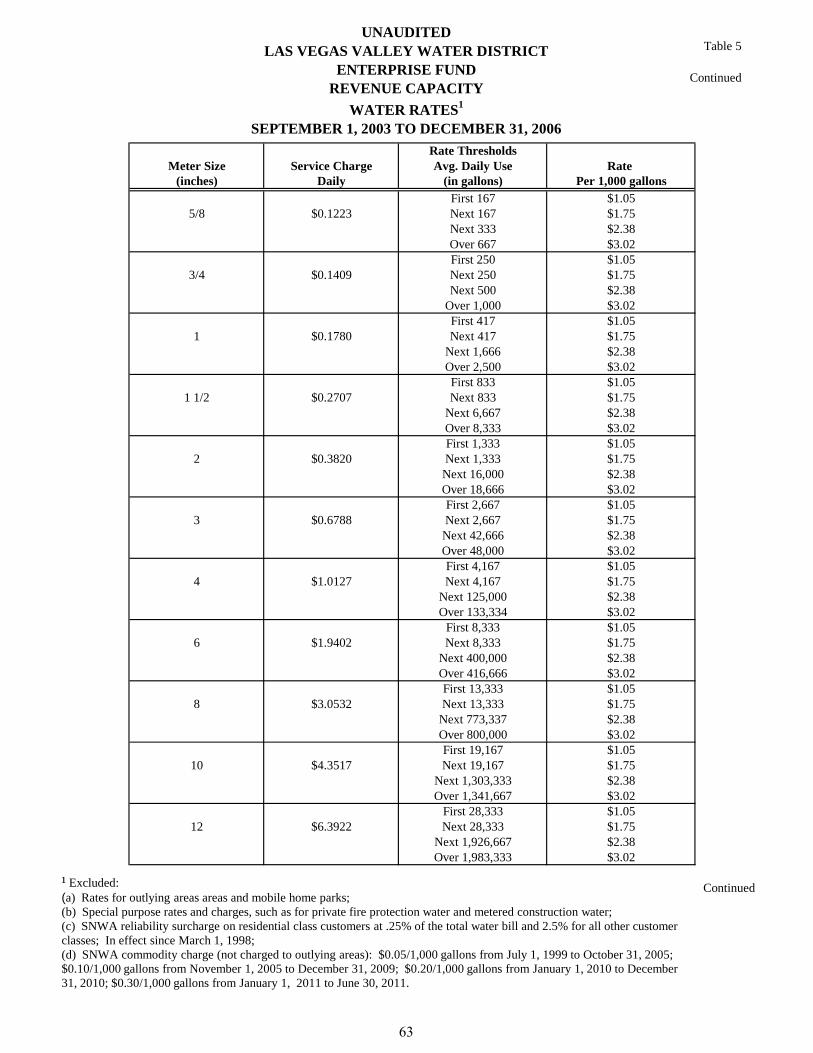
UNAUDITEDLAS VEGAS VALLEY WATER DISTRICT
ENTERPRISE FUNDREVENUE CAPACITY
WATER RATES1
SEPTEMBER 1, 2003 TO DECEMBER 31, 2006
Table 5
Continued
Rate ThresholdsMeter Size Service Charge Avg. Daily Use Rate
(inches) Daily (in gallons) Per 1,000 gallonsFirst 167 $1.05
5/8 $0.1223 Next 167 $1.75Next 333 $2.38Over 667 $3.02First 250 $1.05
3/4 $0.1409 Next 250 $1.75Next 500 $2.38
Over 1,000 $3.02First 417 $1.05
1 $0.1780 Next 417 $1.75Next 1,666 $2.38Over 2,500 $3.02First 833 $1.05
1 1/2 $0.2707 Next 833 $1.75Next 6,667 $2.38Over 8,333 $3.02First 1,333 $1.05
2 $0.3820 Next 1,333 $1.75Next 16,000 $2.38Over 18,666 $3.02First 2,667 $1.05
3 $0.6788 Next 2,667 $1.75Next 42,666 $2.38Over 48,000 $3.02First 4,167 $1.05
4 $1.0127 Next 4,167 $1.75Next 125,000 $2.38Over 133,334 $3.02
First 8,333 $1.056 $1.9402 Next 8,333 $1.75
Next 400,000 $2.38Over 416,666 $3.02First 13,333 $1.05
8 $3.0532 Next 13,333 $1.75Next 773,337 $2.38Over 800,000 $3.02First 19,167 $1.05
10 $4.3517 Next 19,167 $1.75Next 1,303,333 $2.38Over 1,341,667 $3.02
First 28,333 $1.0512 $6.3922 Next 28,333 $1.75
Next 1,926,667 $2.38Over 1,983,333 $3.02
Continued¹ Excluded: (a) Rates for outlying areas areas and mobile home parks; (b) Special purpose rates and charges, such as for private fire protection water and metered construction water; (c) SNWA reliability surcharge on residential class customers at .25% of the total water bill and 2.5% for all other customer classes; In effect since March 1, 1998; (d) SNWA commodity charge (not charged to outlying areas): $0.05/1,000 gallons from July 1, 1999 to October 31, 2005; $0.10/1,000 gallons from November 1, 2005 to December 31, 2009; $0.20/1,000 gallons from January 1, 2010 to December 31, 2010; $0.30/1,000 gallons from January 1, 2011 to June 30, 2011.
63
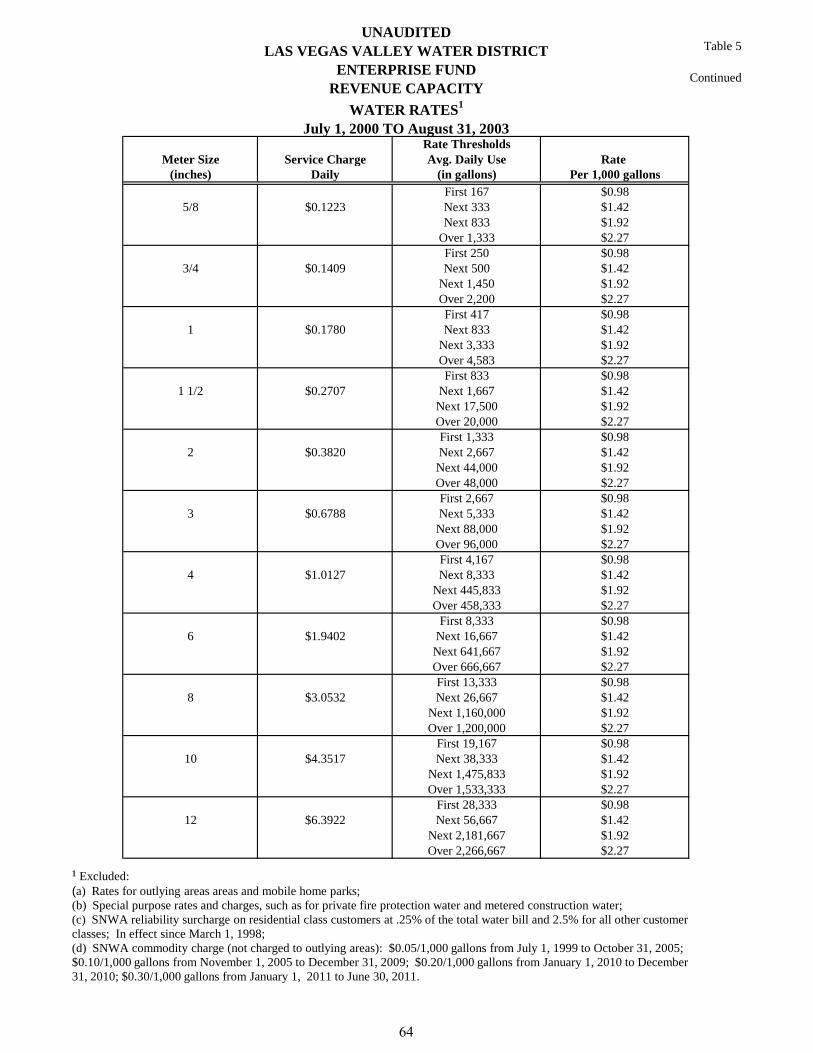
UNAUDITEDLAS VEGAS VALLEY WATER DISTRICT
ENTERPRISE FUNDREVENUE CAPACITY
WATER RATES1
July 1, 2000 TO August 31, 2003
Table 5
Continued
Rate ThresholdsMeter Size Service Charge Avg. Daily Use Rate
(inches) Daily (in gallons) Per 1,000 gallonsFirst 167 $0.98
5/8 $0.1223 Next 333 $1.42Next 833 $1.92
Over 1,333 $2.27First 250 $0.98
3/4 $0.1409 Next 500 $1.42Next 1,450 $1.92Over 2,200 $2.27First 417 $0.98
1 $0.1780 Next 833 $1.42Next 3,333 $1.92Over 4,583 $2.27First 833 $0.98
1 1/2 $0.2707 Next 1,667 $1.42Next 17,500 $1.92Over 20,000 $2.27First 1,333 $0.98
2 $0.3820 Next 2,667 $1.42Next 44,000 $1.92Over 48,000 $2.27First 2,667 $0.98
3 $0.6788 Next 5,333 $1.42Next 88,000 $1.92Over 96,000 $2.27First 4,167 $0.98
4 $1.0127 Next 8,333 $1.42Next 445,833 $1.92Over 458,333 $2.27
First 8,333 $0.986 $1.9402 Next 16,667 $1.42
Next 641,667 $1.92Over 666,667 $2.27First 13,333 $0.98
8 $3.0532 Next 26,667 $1.42Next 1,160,000 $1.92Over 1,200,000 $2.27
First 19,167 $0.9810 $4.3517 Next 38,333 $1.42
Next 1,475,833 $1.92Over 1,533,333 $2.27
First 28,333 $0.9812 $6.3922 Next 56,667 $1.42
Next 2,181,667 $1.92Over 2,266,667 $2.27
¹ Excluded: (a) Rates for outlying areas areas and mobile home parks; (b) Special purpose rates and charges, such as for private fire protection water and metered construction water; (c) SNWA reliability surcharge on residential class customers at .25% of the total water bill and 2.5% for all other customer classes; In effect since March 1, 1998; (d) SNWA commodity charge (not charged to outlying areas): $0.05/1,000 gallons from July 1, 1999 to October 31, 2005; $0.10/1,000 gallons from November 1, 2005 to December 31, 2009; $0.20/1,000 gallons from January 1, 2010 to December 31, 2010; $0.30/1,000 gallons from January 1, 2011 to June 30, 2011.
64
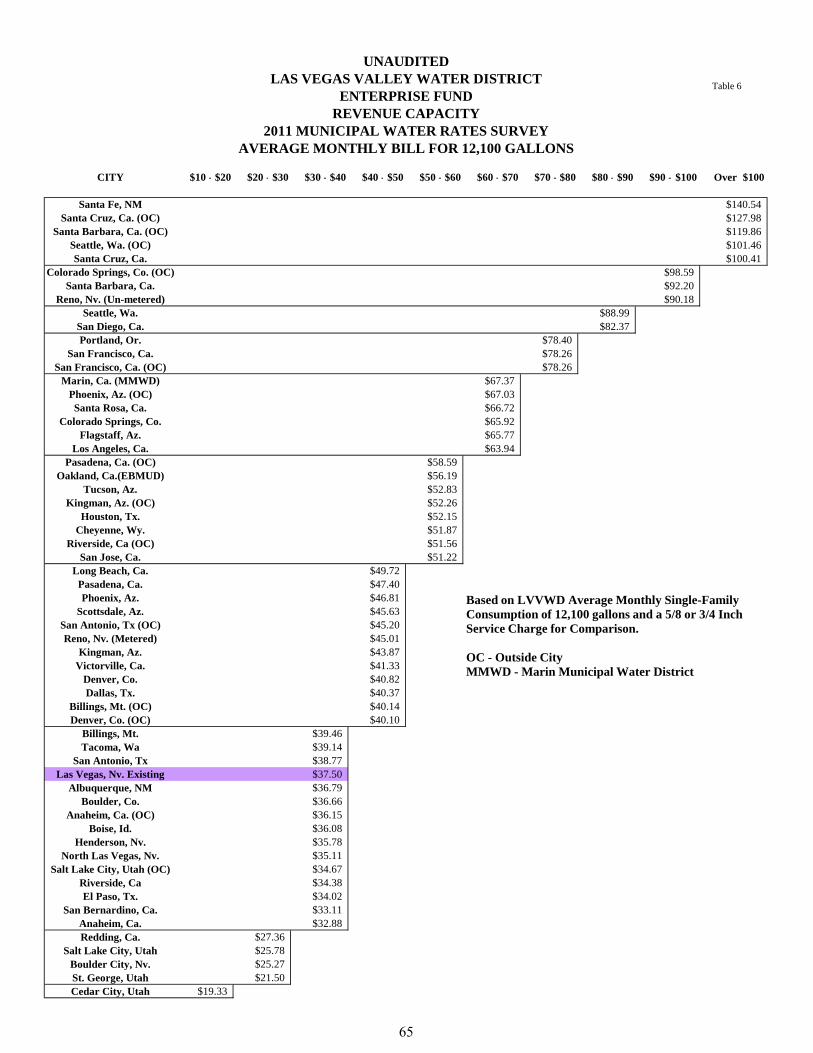
Table 6
CITY $10 - $20 $20 - $30 $30 - $40 $40 - $50 $50 - $60 $60 - $70 $70 - $80 $80 - $90 $90 - $100 Over $100
Santa Fe, NMSanta Cruz, Ca. (OC)
Santa Barbara, Ca. (OC)Seattle, Wa. (OC)Santa Cruz, Ca.
Colorado Springs, Co. (OC)Santa Barbara, Ca.
Reno, Nv. (Un-metered)Seattle, Wa.
San Diego, Ca.Portland, Or.
San Francisco, Ca.San Francisco, Ca. (OC)
Marin, Ca. (MMWD)Phoenix, Az. (OC)Santa Rosa, Ca.
Colorado Springs, Co.Flagstaff, Az.
Los Angeles, Ca.Pasadena, Ca. (OC)
Oakland, Ca.(EBMUD)Tucson, Az.
Kingman, Az. (OC)Houston, Tx.
Cheyenne, Wy.Riverside, Ca (OC)
San Jose, Ca.Long Beach, Ca.
Pasadena, Ca.Phoenix, Az.
Scottsdale, Az.San Antonio, Tx (OC)Reno, Nv. (Metered)
Kingman, Az.Victorville, Ca.
Denver, Co.Dallas, Tx.
Billings, Mt. (OC)Denver, Co. (OC)
Billings, Mt.Tacoma, Wa
San Antonio, TxLas Vegas, Nv. Existing
Albuquerque, NMBoulder, Co.
Anaheim, Ca. (OC)Boise, Id.
Henderson, Nv.North Las Vegas, Nv.
Salt Lake City, Utah (OC)Riverside, CaEl Paso, Tx.
San Bernardino, Ca.Anaheim, Ca.Redding, Ca.
Salt Lake City, UtahBoulder City, Nv.St. George, UtahCedar City, Utah
UNAUDITED
ENTERPRISE FUNDREVENUE CAPACITY
$92.20$90.18
$127.98$119.86$101.46$100.41
$140.54
LAS VEGAS VALLEY WATER DISTRICT
2011 MUNICIPAL WATER RATES SURVEYAVERAGE MONTHLY BILL FOR 12,100 GALLONS
$98.59
$88.99
$78.40$82.37
$78.26$78.26
$67.37$67.03$66.72$65.92$65.77$63.94
$58.59$56.19$52.83$52.26$52.15$51.87$51.56$51.22
$49.72$47.40$46.81$45.63$45.20$45.01$43.87$41.33$40.82$40.37$40.14$40.10
$39.46$39.14$38.77$37.50$36.79$36.66$36.15$36.08$35.78$35.11$34.67$34.38$34.02$33.11$32.88
$27.36$25.78
$21.50$25.27
$19.33
Based on LVVWD Average Monthly Single-Family Consumption of 12,100 gallons and a 5/8 or 3/4 Inch Service Charge for Comparison. OC - Outside City MMWD - Marin Municipal Water District
65
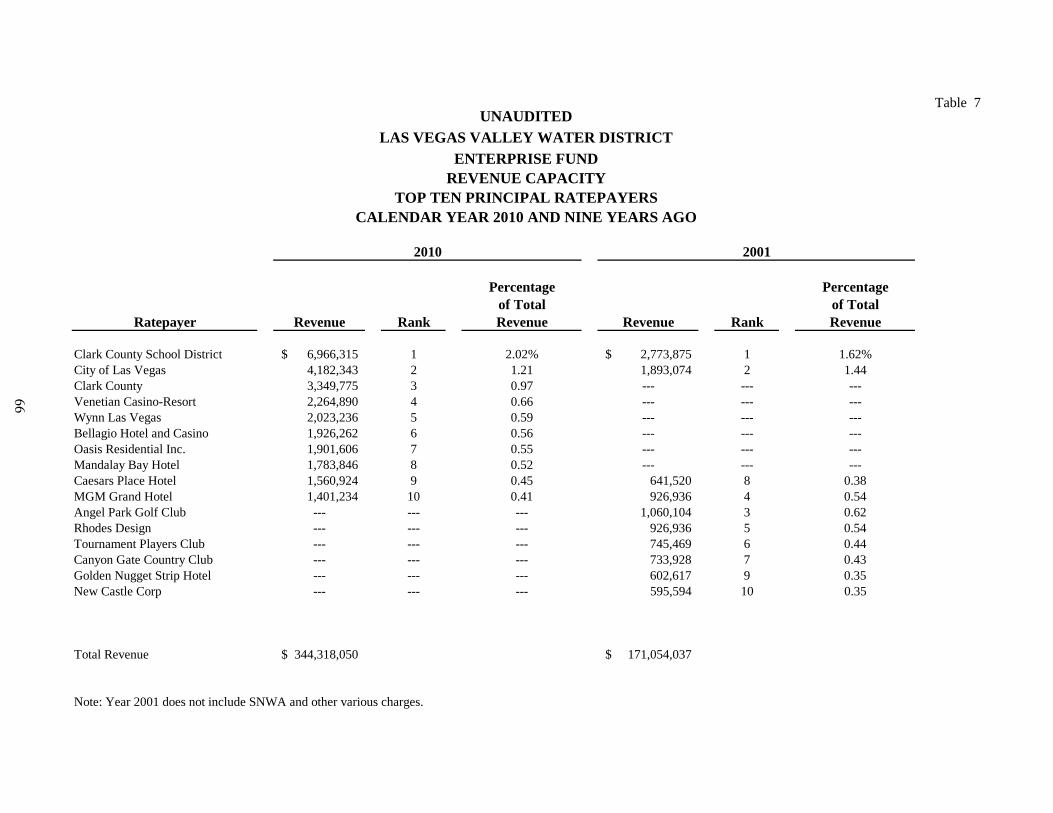
Table 7
Percentage Percentageof Total of Total
Ratepayer Revenue Rank Revenue Revenue Rank Revenue
Clark County School District 6,966,315$ 1 2.02% 2,773,875$ 1 1.62%City of Las Vegas 4,182,343 2 1.21 1,893,074 2 1.44Clark County 3,349,775 3 0.97 --- --- --- Venetian Casino-Resort 2,264,890 4 0.66 --- --- --- Wynn Las Vegas 2,023,236 5 0.59 --- --- --- Bellagio Hotel and Casino 1,926,262 6 0.56 --- --- --- Oasis Residential Inc. 1,901,606 7 0.55 --- --- ---Mandalay Bay Hotel 1,783,846 8 0.52 --- --- ---Caesars Place Hotel 1,560,924 9 0.45 641,520 8 0.38MGM Grand Hotel 1,401,234 10 0.41 926,936 4 0.54Angel Park Golf Club --- --- --- 1,060,104 3 0.62Rhodes Design --- --- --- 926,936 5 0.54Tournament Players Club --- --- --- 745,469 6 0.44Canyon Gate Country Club --- --- --- 733,928 7 0.43Golden Nugget Strip Hotel --- --- --- 602,617 9 0.35New Castle Corp --- --- --- 595,594 10 0.35
Total Revenue 344,318,050$ 171,054,037$
Note: Year 2001 does not include SNWA and other various charges.
2010 2001
UNAUDITEDLAS VEGAS VALLEY WATER DISTRICT
TOP TEN PRINCIPAL RATEPAYERSREVENUE CAPACITY
CALENDAR YEAR 2010 AND NINE YEARS AGO
ENTERPRISE FUND
66
DebT CApACITY SECTION
Ratios of Net General Obligation Debt Outstanding Last Ten Fiscal Years
Net Pledged Revenue Coverage Last Ten Fiscal Years
Outstanding Direct and Overlapping General Obligation Indebtedness

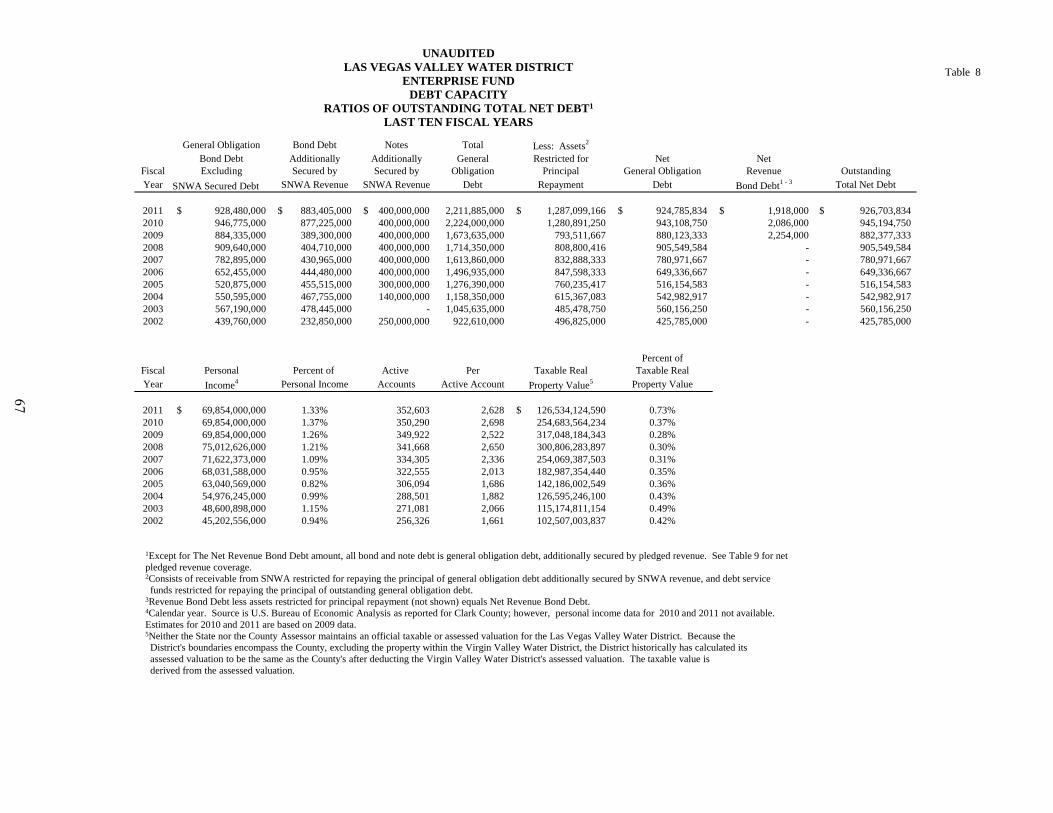
Table 8
General Obligation Bond Debt Notes Total Less: Assets2
Bond Debt Additionally Additionally General Restricted for Net NetFiscal Excluding Secured by Secured by Obligation Principal General Obligation Revenue OutstandingYear SNWA Secured Debt SNWA Revenue SNWA Revenue Debt Repayment Debt Bond Debt1 - 3 Total Net Debt
2011 928,480,000$ 883,405,000$ 400,000,000$ 2,211,885,000 1,287,099,166$ 924,785,834$ 1,918,000$ 926,703,834$ 2010 946,775,000 877,225,000 400,000,000 2,224,000,000 1,280,891,250 943,108,750 2,086,000 945,194,750 2009 884,335,000 389,300,000 400,000,000 1,673,635,000 793,511,667 880,123,333 2,254,000 882,377,333 2008 909,640,000 404,710,000 400,000,000 1,714,350,000 808,800,416 905,549,584 - 905,549,584 2007 782,895,000 430,965,000 400,000,000 1,613,860,000 832,888,333 780,971,667 - 780,971,667 2006 652,455,000 444,480,000 400,000,000 1,496,935,000 847,598,333 649,336,667 - 649,336,667 2005 520,875,000 455,515,000 300,000,000 1,276,390,000 760,235,417 516,154,583 - 516,154,583 2004 550,595,000 467,755,000 140,000,000 1,158,350,000 615,367,083 542,982,917 - 542,982,917 2003 567,190,000 478,445,000 - 1,045,635,000 485,478,750 560,156,250 - 560,156,250 2002 439,760,000 232,850,000 250,000,000 922,610,000 496,825,000 425,785,000 - 425,785,000
Percent of Fiscal Personal Percent of Active Per Taxable Real Taxable Real Year Income4 Personal Income Accounts Active Account Property Value5 Property Value
2011 69,854,000,000$ 1.33% 352,603 2,628 126,534,124,590$ 0.73%2010 69,854,000,000 1.37% 350,290 2,698 254,683,564,234 0.37% 2009 69,854,000,000 1.26% 349,922 2,522 317,048,184,343 0.28% 2008 75,012,626,000 1.21% 341,668 2,650 300,806,283,897 0.30% 2007 71,622,373,000 1.09% 334,305 2,336 254,069,387,503 0.31% 2006 68,031,588,000 0.95% 322,555 2,013 182,987,354,440 0.35% 2005 63,040,569,000 0.82% 306,094 1,686 142,186,002,549 0.36% 2004 54,976,245,000 0.99% 288,501 1,882 126,595,246,100 0.43% 2003 48,600,898,000 1.15% 271,081 2,066 115,174,811,154 0.49% 2002 45,202,556,000 0.94% 256,326 1,661 102,507,003,837 0.42%
1Except for The Net Revenue Bond Debt amount, all bond and note debt is general obligation debt, additionally secured by pledged revenue. See Table 9 for net pledged revenue coverage. 2Consists of receivable from SNWA restricted for repaying the principal of general obligation debt additionally secured by SNWA revenue, and debt service funds restricted for repaying the principal of outstanding general obligation debt. 3Revenue Bond Debt less assets restricted for principal repayment (not shown) equals Net Revenue Bond Debt. 4Calendar year. Source is U.S. Bureau of Economic Analysis as reported for Clark County; however, personal income data for 2010 and 2011 not available. Estimates for 2010 and 2011 are based on 2009 data. 5Neither the State nor the County Assessor maintains an official taxable or assessed valuation for the Las Vegas Valley Water District. Because the District's boundaries encompass the County, excluding the property within the Virgin Valley Water District, the District historically has calculated its assessed valuation to be the same as the County's after deducting the Virgin Valley Water District's assessed valuation. The taxable value is derived from the assessed valuation.
UNAUDITED LAS VEGAS VALLEY WATER DISTRICT
ENTERPRISE FUND DEBT CAPACITY
RATIOS OF OUTSTANDING TOTAL NET DEBT1 LAST TEN FISCAL YEARS
67
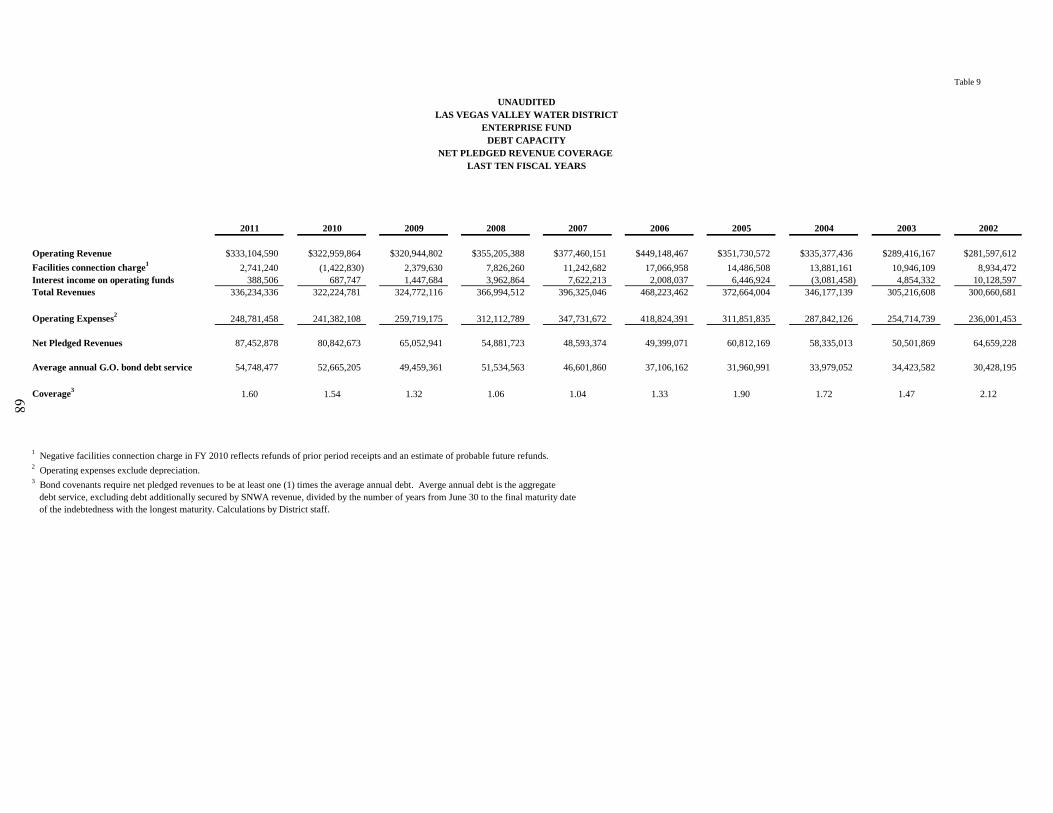
Table 9
2011 2010 2009 2008 2007 2006 2005 2004 2003 2002
Operating Revenue $333,104,590 $322,959,864 $320,944,802 $355,205,388 $377,460,151 $449,148,467 $351,730,572 $335,377,436 $289,416,167 $281,597,612Facilities connection charge1 2,741,240 (1,422,830) 2,379,630 7,826,260 11,242,682 17,066,958 14,486,508 13,881,161 10,946,109 8,934,472Interest income on operating funds 388,506 687,747 1,447,684 3,962,864 7,622,213 2,008,037 6,446,924 (3,081,458) 4,854,332 10,128,597Total Revenues 336,234,336 322,224,781 324,772,116 366,994,512 396,325,046 468,223,462 372,664,004 346,177,139 305,216,608 300,660,681
Operating Expenses2 248,781,458 241,382,108 259,719,175 312,112,789 347,731,672 418,824,391 311,851,835 287,842,126 254,714,739 236,001,453
Net Pledged Revenues 87,452,878 80,842,673 65,052,941 54,881,723 48,593,374 49,399,071 60,812,169 58,335,013 50,501,869 64,659,228
Average annual G.O. bond debt service 54,748,477 52,665,205 49,459,361 51,534,563 46,601,860 37,106,162 31,960,991 33,979,052 34,423,582 30,428,195
Coverage3 1.60 1.54 1.32 1.06 1.04 1.33 1.90 1.72 1.47 2.12
1 Negative facilities connection charge in FY 2010 reflects refunds of prior period receipts and an estimate of probable future refunds.2 Operating expenses exclude depreciation.3 Bond covenants require net pledged revenues to be at least one (1) times the average annual debt. Averge annual debt is the aggregate debt service, excluding debt additionally secured by SNWA revenue, divided by the number of years from June 30 to the final maturity date
of the indebtedness with the longest maturity. Calculations by District staff.
UNAUDITEDLAS VEGAS VALLEY WATER DISTRICT
LAST TEN FISCAL YEARSNET PLEDGED REVENUE COVERAGE
DEBT CAPACITYENTERPRISE FUND
68
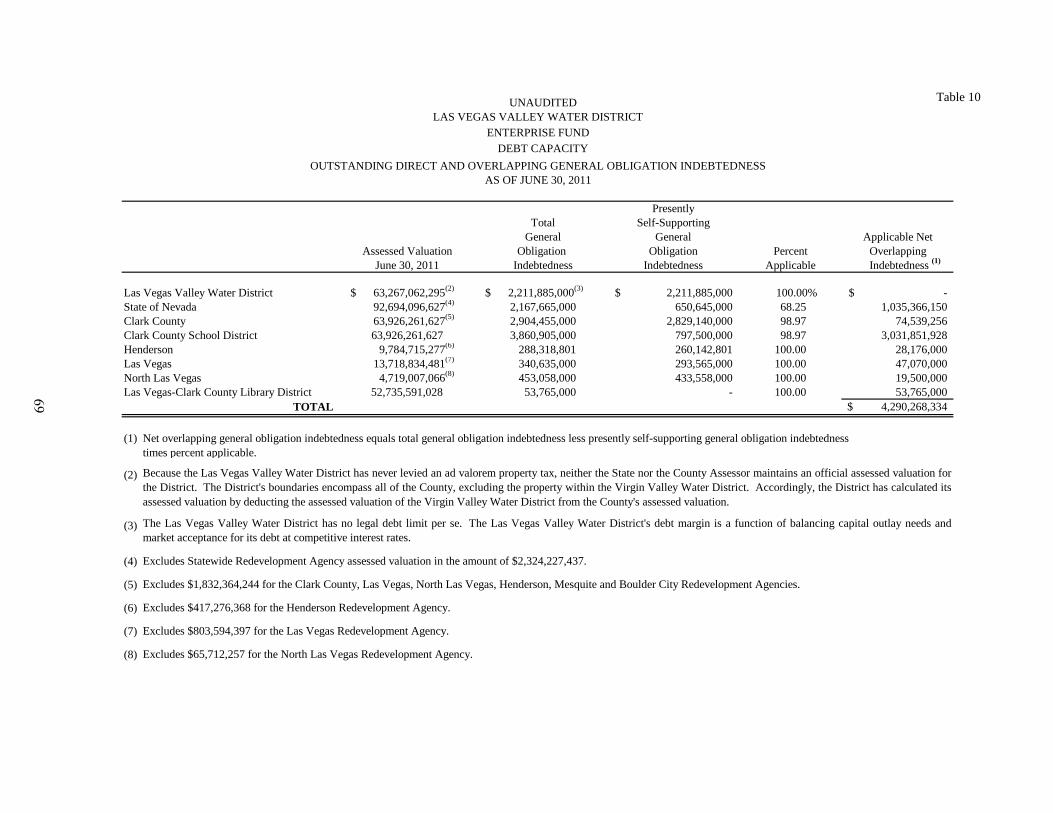
Table 10UNAUDITED
DEBT CAPACITY
PresentlyTotal Self-Supporting
General General Applicable NetAssessed Valuation Obligation Obligation Percent Overlapping
June 30, 2011 Indebtedness Indebtedness Applicable Indebtedness (1)
$ 63,267,062,295(2) $ 2,211,885,000(3) 2,211,885,000$ 100.00% -$ 92,694,096,627(4) 2,167,665,000 650,645,000 68.25 1,035,366,150 63,926,261,627(5) 2,904,455,000 2,829,140,000 98.97 74,539,256
63,926,261,627 3,860,905,000 797,500,000 98.97 3,031,851,928 9,784,715,277(6) 288,318,801 260,142,801 100.00 28,176,000
13,718,834,481(7) 340,635,000 293,565,000 100.00 47,070,000 4,719,007,066(8) 453,058,000 433,558,000 100.00 19,500,000 52,735,591,028 53,765,000 - 100.00 53,765,000
4,290,268,334$
(1)
(2)
(3)
(4)
(5)
(6)
(7)
(8)
LAS VEGAS VALLEY WATER DISTRICTENTERPRISE FUND
OUTSTANDING DIRECT AND OVERLAPPING GENERAL OBLIGATION INDEBTEDNESSAS OF JUNE 30, 2011
Las Vegas-Clark County Library DistrictTOTAL
North Las VegasLas VegasHenderson
Clark County
Because the Las Vegas Valley Water District has never levied an ad valorem property tax, neither the State nor the County Assessor maintains an official assessed valuation forthe District. The District's boundaries encompass all of the County, excluding the property within the Virgin Valley Water District. Accordingly, the District has calculated itsassessed valuation by deducting the assessed valuation of the Virgin Valley Water District from the County's assessed valuation.
The Las Vegas Valley Water District has no legal debt limit per se. The Las Vegas Valley Water District's debt margin is a function of balancing capital outlay needs andmarket acceptance for its debt at competitive interest rates.
State of NevadaLas Vegas Valley Water District
Net overlapping general obligation indebtedness equals total general obligation indebtedness less presently self-supporting general obligation indebtednesstimes percent applicable.
Clark County School District
Excludes $65,712,257 for the North Las Vegas Redevelopment Agency.
Excludes $417,276,368 for the Henderson Redevelopment Agency.
Excludes $803,594,397 for the Las Vegas Redevelopment Agency.
Excludes $1,832,364,244 for the Clark County, Las Vegas, North Las Vegas, Henderson, Mesquite and Boulder City Redevelopment Agencies.
Excludes Statewide Redevelopment Agency assessed valuation in the amount of $2,324,227,437.
69

THIS PAGE LEFT
INTENTIONALLY BLANK
DemOgRAphIC AND eCONOmIC INFORmATION SECTION
Demographic Statistics Last Ten Fiscal Years
Clark County Principal Employers Current Year and Nine Years Ago
Ten Largest Property Owning Taxpayers

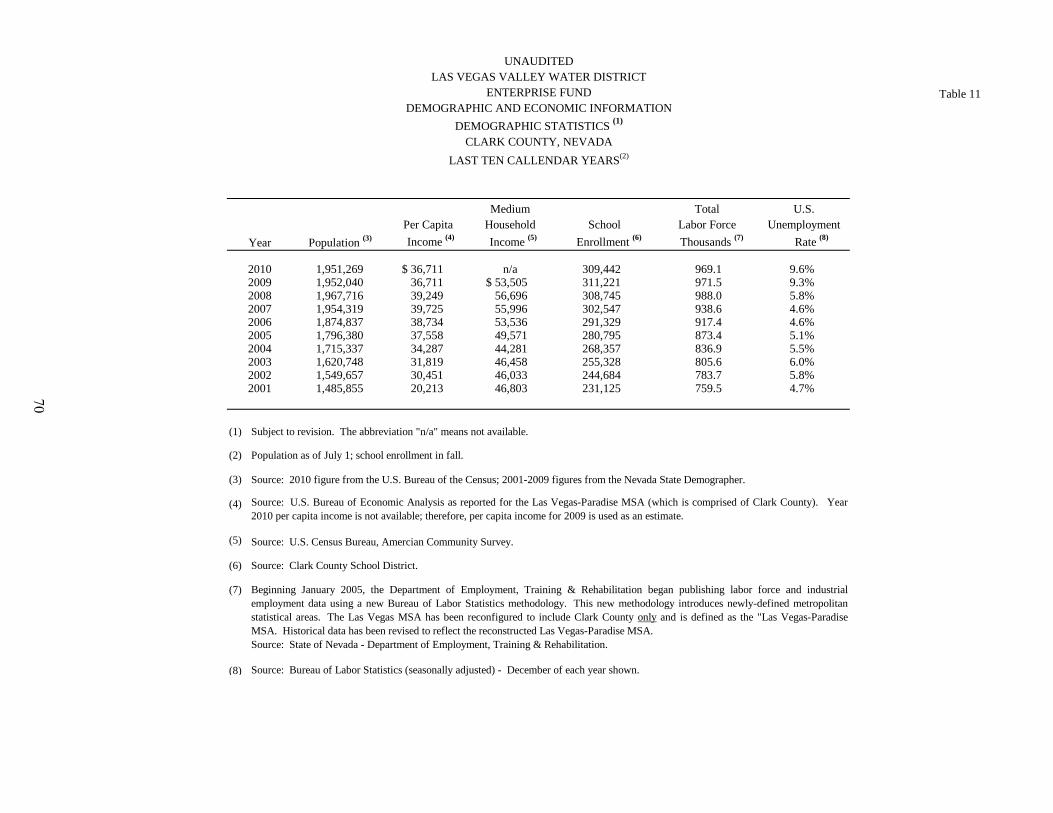
Table 11
Medium Total U.S.Per Capita Household School Labor Force Unemployment Income (4) Income (5) Enrollment (6) Thousands (7) Rate (8)
1,951,269 $ 36,711 n/a 309,442 969.1 9.6%1,952,040 36,711 $ 53,505 311,221 971.5 9.3%1,967,716 39,249 56,696 308,745 988.0 5.8%1,954,319 39,725 55,996 302,547 938.6 4.6%1,874,837 38,734 53,536 291,329 917.4 4.6%1,796,380 37,558 49,571 280,795 873.4 5.1%1,715,337 34,287 44,281 268,357 836.9 5.5%1,620,748 31,819 46,458 255,328 805.6 6.0%1,549,657 30,451 46,033 244,684 783.7 5.8%1,485,855 20,213 46,803 231,125 759.5 4.7%
(1)
(2)
(3)
(4)
(5)
(6)
(7)
(8)
Population as of July 1; school enrollment in fall.
2001
2004
CLARK COUNTY, NEVADA
Year Population (3)
UNAUDITED
20082009
LAS VEGAS VALLEY WATER DISTRICT
DEMOGRAPHIC STATISTICS (1)
20062005
20032002
2010
Source: Bureau of Labor Statistics (seasonally adjusted) - December of each year shown.
Beginning January 2005, the Department of Employment, Training & Rehabilitation began publishing labor force and industrialemployment data using a new Bureau of Labor Statistics methodology. This new methodology introduces newly-defined metropolitanstatistical areas. The Las Vegas MSA has been reconfigured to include Clark County only and is defined as the "Las Vegas-ParadiseMSA. Historical data has been revised to reflect the reconstructed Las Vegas-Paradise MSA.Source: State of Nevada - Department of Employment, Training & Rehabilitation.
Source: Clark County School District.
Source: 2010 figure from the U.S. Bureau of the Census; 2001-2009 figures from the Nevada State Demographer.
Subject to revision. The abbreviation "n/a" means not available.
DEMOGRAPHIC AND ECONOMIC INFORMATIONENTERPRISE FUND
Source: U.S. Bureau of Economic Analysis as reported for the Las Vegas-Paradise MSA (which is comprised of Clark County). Year2010 per capita income is not available; therefore, per capita income for 2009 is used as an estimate.
Source: U.S. Census Bureau, Amercian Community Survey.
LAST TEN CALLENDAR YEARS(2)
2007
70
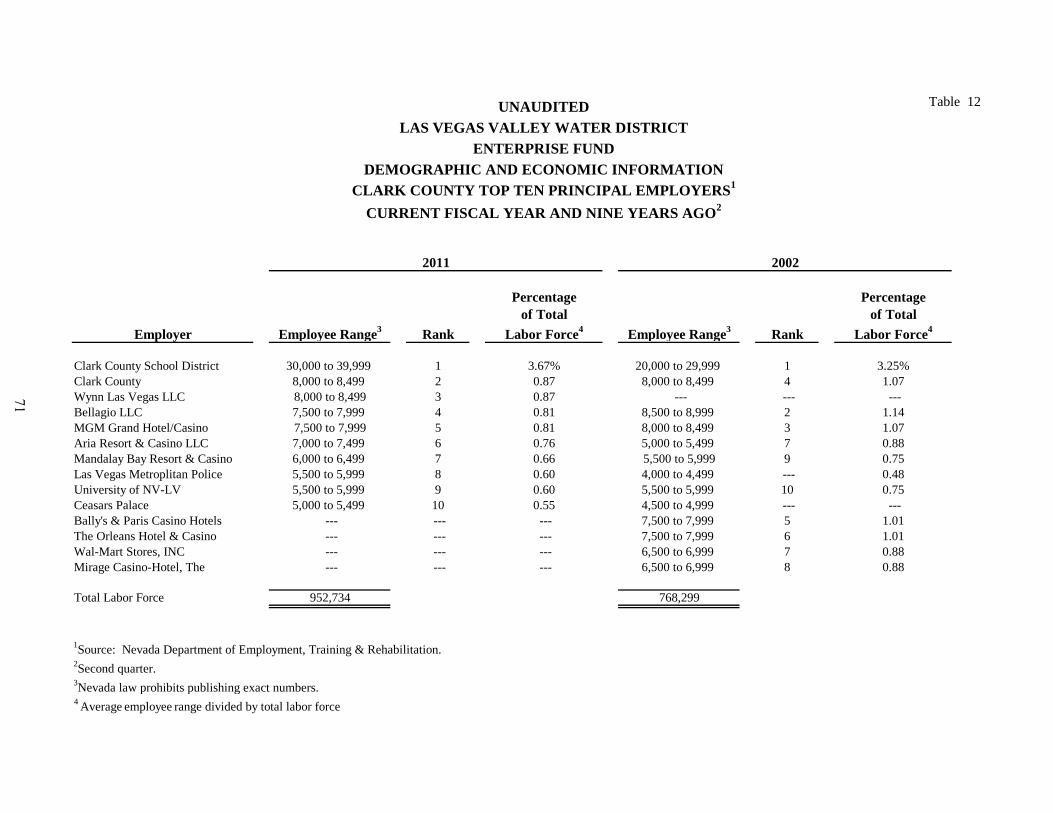
Table 12
Percentage Percentageof Total of Total
Employer Employee Range3 Rank Labor Force4 Employee Range3 Rank Labor Force4
Clark County School District 30,000 to 39,999 1 3.67% 20,000 to 29,999 1 3.25%Clark County 8,000 to 8,499 2 0.87 8,000 to 8,499 4 1.07Wynn Las Vegas LLC 8,000 to 8,499 3 0.87 --- --- ---Bellagio LLC 7,500 to 7,999 4 0.81 8,500 to 8,999 2 1.14MGM Grand Hotel/Casino 7,500 to 7,999 5 0.81 8,000 to 8,499 3 1.07Aria Resort & Casino LLC 7,000 to 7,499 6 0.76 5,000 to 5,499 7 0.88Mandalay Bay Resort & Casino 6,000 to 6,499 7 0.66 5,500 to 5,999 9 0.75Las Vegas Metroplitan Police 5,500 to 5,999 8 0.60 4,000 to 4,499 --- 0.48University of NV-LV 5,500 to 5,999 9 0.60 5,500 to 5,999 10 0.75Ceasars Palace 5,000 to 5,499 10 0.55 4,500 to 4,999 --- ---Bally's & Paris Casino Hotels --- --- --- 7,500 to 7,999 5 1.01The Orleans Hotel & Casino --- --- --- 7,500 to 7,999 6 1.01Wal-Mart Stores, INC --- --- --- 6,500 to 6,999 7 0.88Mirage Casino-Hotel, The --- --- --- 6,500 to 6,999 8 0.88
Total Labor Force 952,734 768,299
1Source: Nevada Department of Employment, Training & Rehabilitation.2Second quarter.3Nevada law prohibits publishing exact numbers.4 Average employee range divided by total labor force
2011 2002
UNAUDITEDLAS VEGAS VALLEY WATER DISTRICT
CURRENT FISCAL YEAR AND NINE YEARS AGO2CLARK COUNTY TOP TEN PRINCIPAL EMPLOYERS1
DEMOGRAPHIC AND ECONOMIC INFORMATIONENTERPRISE FUND
71
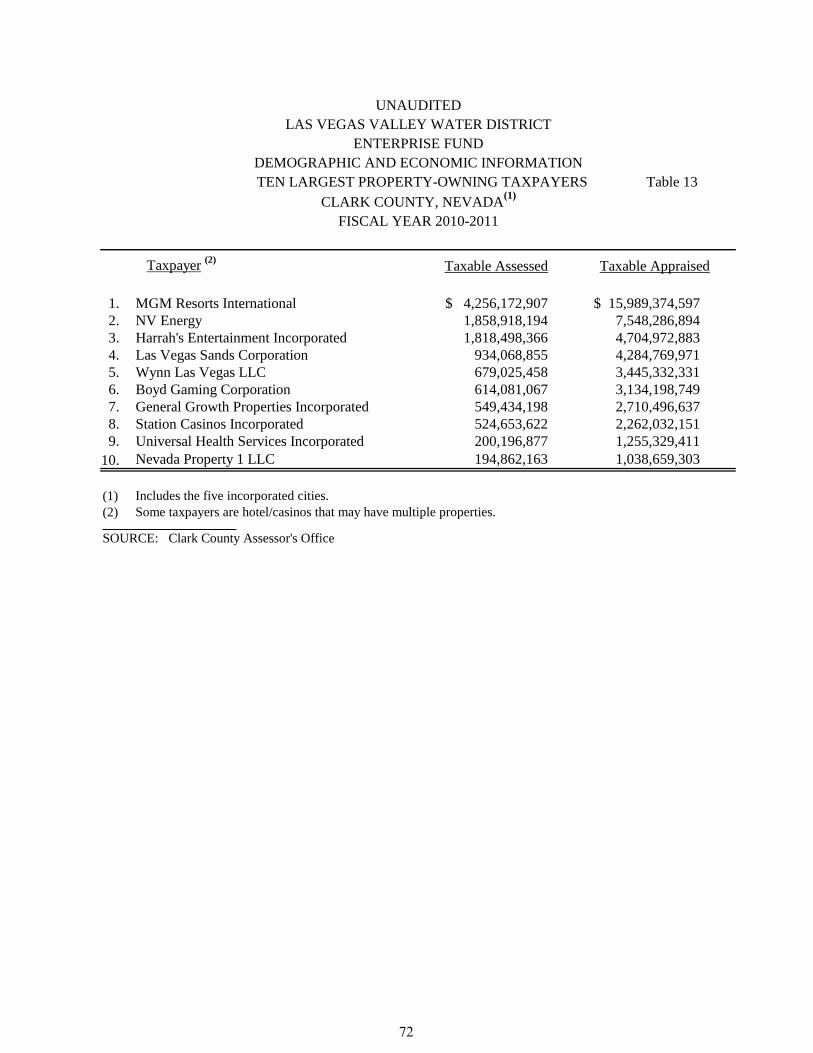
Taxpayer (2) Taxable Assessed Taxable Appraised
1. MGM Resorts International $ 4,256,172,907 $ 15,989,374,5972. NV Energy 1,858,918,194 7,548,286,8943. Harrah's Entertainment Incorporated 1,818,498,366 4,704,972,8834. Las Vegas Sands Corporation 934,068,855 4,284,769,9715. Wynn Las Vegas LLC 679,025,458 3,445,332,3316. Boyd Gaming Corporation 614,081,067 3,134,198,7497. General Growth Properties Incorporated 549,434,198 2,710,496,6378. Station Casinos Incorporated 524,653,622 2,262,032,1519. Universal Health Services Incorporated 200,196,877 1,255,329,411
10. Nevada Property 1 LLC 194,862,163 1,038,659,303
(1)(2)
SOURCE: Clark County Assessor's Office
LAS VEGAS VALLEY WATER DISTRICT
Some taxpayers are hotel/casinos that may have multiple properties.
TEN LARGEST PROPERTY-OWNING TAXPAYERS Table 13CLARK COUNTY, NEVADA(1)
FISCAL YEAR 2010-2011
DEMOGRAPHIC AND ECONOMIC INFORMATIONENTERPRISE FUND
UNAUDITED
Includes the five incorporated cities.
72

THIS PAGE LEFT
INTENTIONALLY BLANK
OpeRATINg INFORmATION SECTION
Authorized Full-Time Equivalent Employees by Department
Water Production by Month Last Ten Years
Pumpage From Wells by Months Last Ten Years
Surface Water by Month Southern Nevada Water System Last Ten Years
Water Production Maximum and Minimum Days by Month Last Ten Years
Annual Treated Water Delivered by the Southern Nevada Water System
Enterprise Fund Selected Capital Asset Statistics
Schedule of Insurance as of June 30, 2011

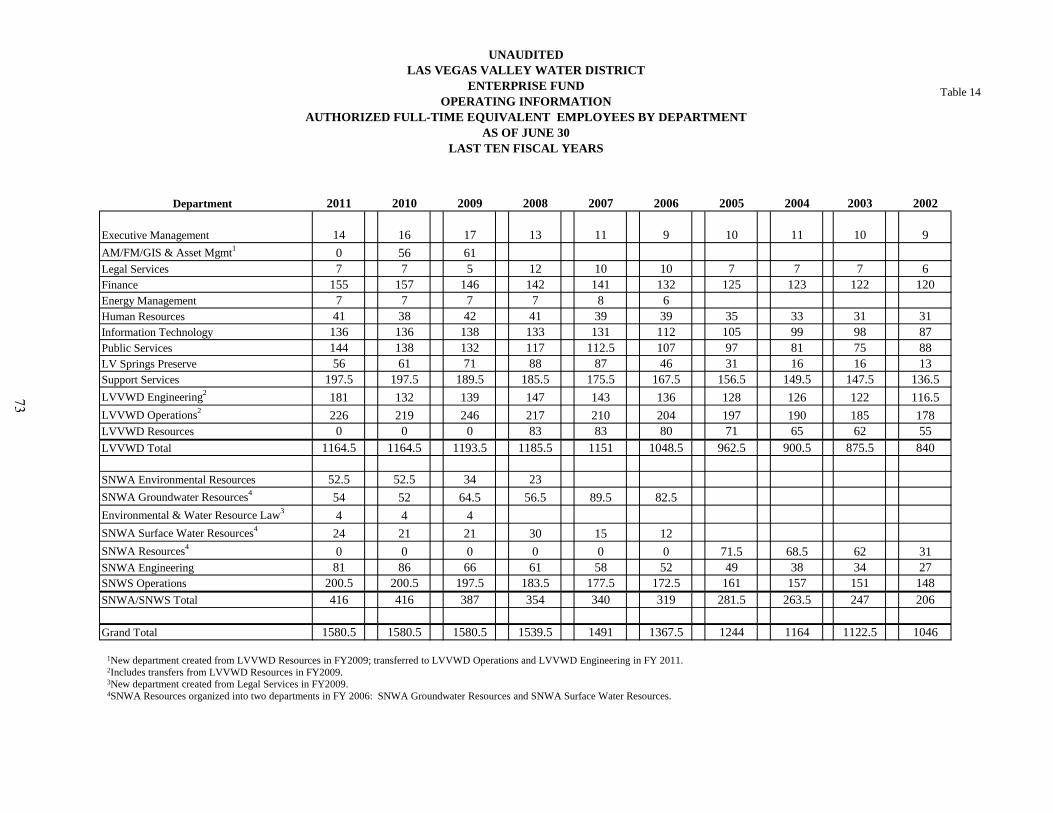
UNAUDITEDLAS VEGAS VALLEY WATER DISTRICT
ENTERPRISE FUNDOPERATING INFORMATION
AUTHORIZED FULL-TIME EQUIVALENT EMPLOYEES BY DEPARTMENTAS OF JUNE 30
LAST TEN FISCAL YEARS
Table 14
Department 2011 2010 2009 2008 2007 2006 2005 2004 2003 2002
Executive Management 14 16 17 13 11 9 10 11 10 9AM/FM/GIS & Asset Mgmt1 0 56 61Legal Services 7 7 5 12 10 10 7 7 7 6Finance 155 157 146 142 141 132 125 123 122 120Energy Management 7 7 7 7 8 6Human Resources 41 38 42 41 39 39 35 33 31 31Information Technology 136 136 138 133 131 112 105 99 98 87Public Services 144 138 132 117 112.5 107 97 81 75 88LV Springs Preserve 56 61 71 88 87 46 31 16 16 13Support Services 197.5 197.5 189.5 185.5 175.5 167.5 156.5 149.5 147.5 136.5LVVWD Engineering2 181 132 139 147 143 136 128 126 122 116.5LVVWD Operations2 226 219 246 217 210 204 197 190 185 178LVVWD Resources 0 0 0 83 83 80 71 65 62 55LVVWD Total 1164.5 1164.5 1193.5 1185.5 1151 1048.5 962.5 900.5 875.5 840
SNWA Environmental Resources 52.5 52.5 34 23SNWA Groundwater Resources4 54 52 64.5 56.5 89.5 82.5Environmental & Water Resource Law3 4 4 4SNWA Surface Water Resources4 24 21 21 30 15 12SNWA Resources4 0 0 0 0 0 0 71.5 68.5 62 31SNWA Engineering 81 86 66 61 58 52 49 38 34 27SNWS Operations 200.5 200.5 197.5 183.5 177.5 172.5 161 157 151 148SNWA/SNWS Total 416 416 387 354 340 319 281.5 263.5 247 206
Grand Total 1580.5 1580.5 1580.5 1539.5 1491 1367.5 1244 1164 1122.5 1046
1New department created from LVVWD Resources in FY2009; transferred to LVVWD Operations and LVVWD Engineering in FY 2011. 2Includes transfers from LVVWD Resources in FY2009. 3New department created from Legal Services in FY2009. 4SNWA Resources organized into two departments in FY 2006: SNWA Groundwater Resources and SNWA Surface Water Resources.
73
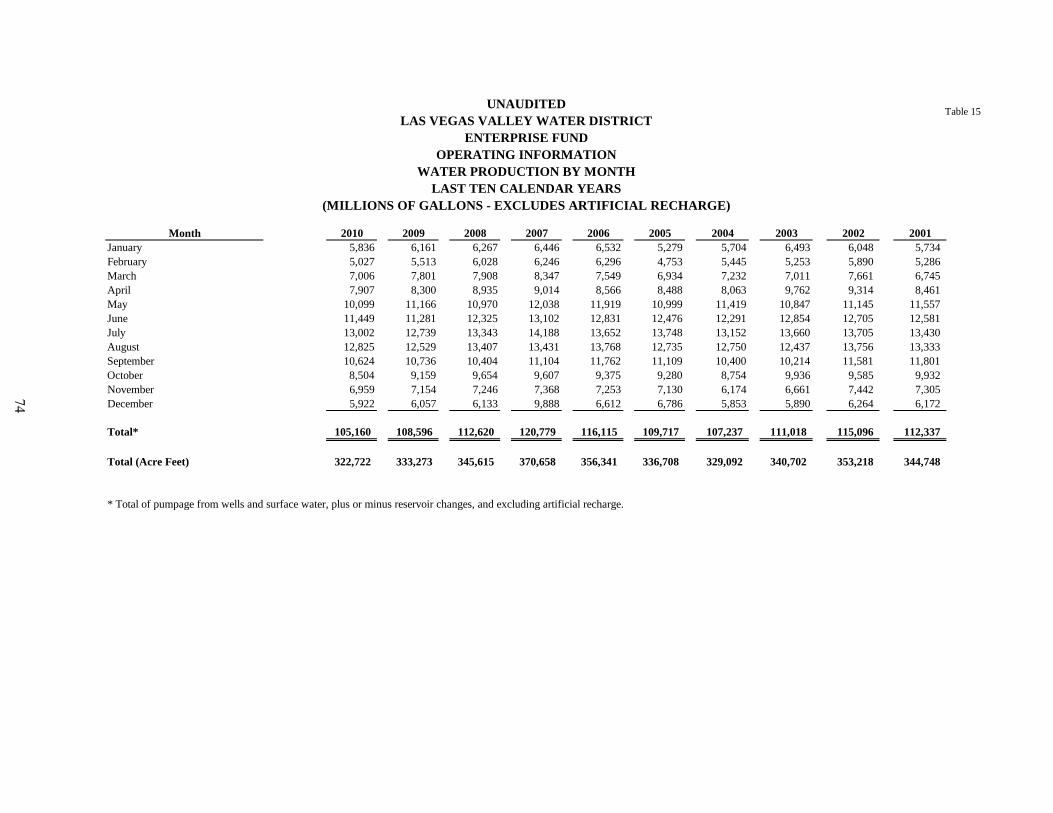
Table 15
WATER PRODUCTION BY MONTHLAST TEN CALENDAR YEARS
(MILLIONS OF GALLONS - EXCLUDES ARTIFICIAL RECHARGE)
Month 2010 2009 2008 2007 2006 2005 2004 2003 2002 2001January 5,836 6,161 6,267 6,446 6,532 5,279 5,704 6,493 6,048 5,734 February 5,027 5,513 6,028 6,246 6,296 4,753 5,445 5,253 5,890 5,286 March 7,006 7,801 7,908 8,347 7,549 6,934 7,232 7,011 7,661 6,745 April 7,907 8,300 8,935 9,014 8,566 8,488 8,063 9,762 9,314 8,461 May 10,099 11,166 10,970 12,038 11,919 10,999 11,419 10,847 11,145 11,557 June 11,449 11,281 12,325 13,102 12,831 12,476 12,291 12,854 12,705 12,581 July 13,002 12,739 13,343 14,188 13,652 13,748 13,152 13,660 13,705 13,430 August 12,825 12,529 13,407 13,431 13,768 12,735 12,750 12,437 13,756 13,333 September 10,624 10,736 10,404 11,104 11,762 11,109 10,400 10,214 11,581 11,801 October 8,504 9,159 9,654 9,607 9,375 9,280 8,754 9,936 9,585 9,932 November 6,959 7,154 7,246 7,368 7,253 7,130 6,174 6,661 7,442 7,305 December 5,922 6,057 6,133 9,888 6,612 6,786 5,853 5,890 6,264 6,172
Total* 105,160 108,596 112,620 120,779 116,115 109,717 107,237 111,018 115,096 112,337
Total (Acre Feet) 322,722 333,273 345,615 370,658 356,341 336,708 329,092 340,702 353,218 344,748
* Total of pumpage from wells and surface water, plus or minus reservoir changes, and excluding artificial recharge.
UNAUDITEDLAS VEGAS VALLEY WATER DISTRICT
OPERATING INFORMATIONENTERPRISE FUND
74
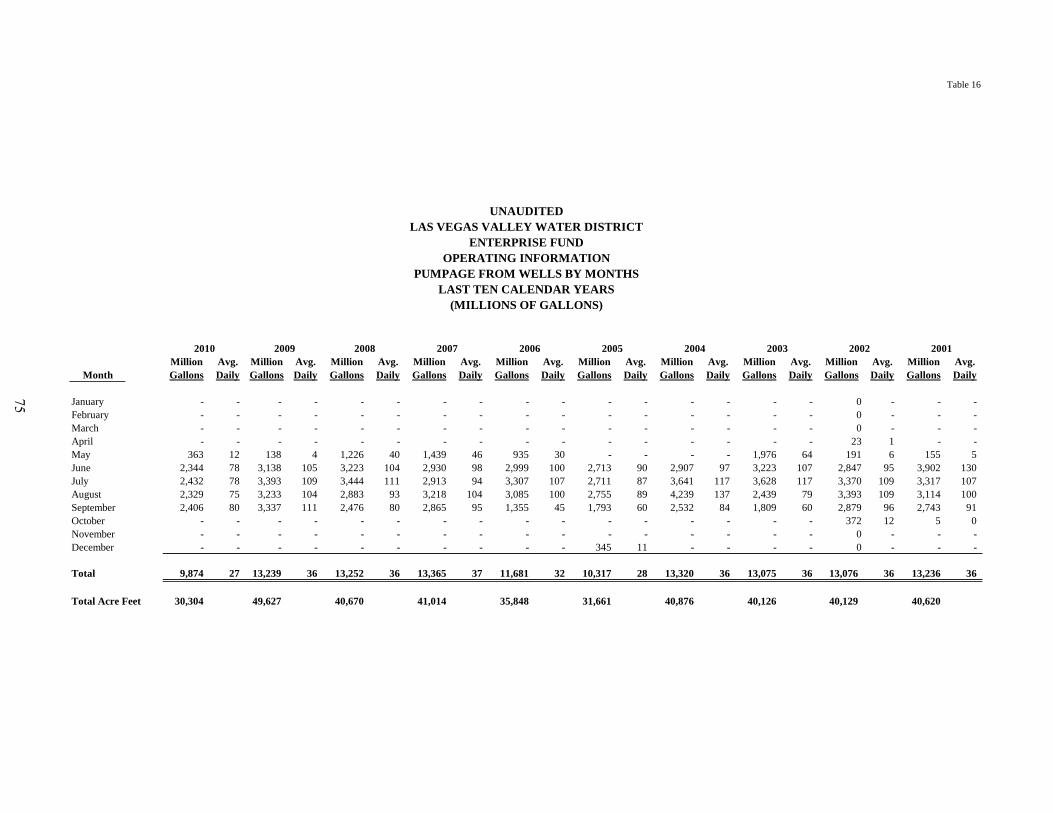
Table 16
PUMPAGE FROM WELLS BY MONTHSLAST TEN CALENDAR YEARS
(MILLIONS OF GALLONS)
2010 2009 2008 2007 2006 2005 2004 2003 2002 2001Million Avg. Million Avg. Million Avg. Million Avg. Million Avg. Million Avg. Million Avg. Million Avg. Million Avg. Million Avg.
Month Gallons Daily Gallons Daily Gallons Daily Gallons Daily Gallons Daily Gallons Daily Gallons Daily Gallons Daily Gallons Daily Gallons Daily
January - - - - - - - - - - - - - - - - 0 - - - February - - - - - - - - - - - - - - - - 0 - - - March - - - - - - - - - - - - - - - - 0 - - - April - - - - - - - - - - - - - - - - 23 1 - - May 363 12 138 4 1,226 40 1,439 46 935 30 - - - - 1,976 64 191 6 155 5 June 2,344 78 3,138 105 3,223 104 2,930 98 2,999 100 2,713 90 2,907 97 3,223 107 2,847 95 3,902 130 July 2,432 78 3,393 109 3,444 111 2,913 94 3,307 107 2,711 87 3,641 117 3,628 117 3,370 109 3,317 107 August 2,329 75 3,233 104 2,883 93 3,218 104 3,085 100 2,755 89 4,239 137 2,439 79 3,393 109 3,114 100 September 2,406 80 3,337 111 2,476 80 2,865 95 1,355 45 1,793 60 2,532 84 1,809 60 2,879 96 2,743 91 October - - - - - - - - - - - - - - - - 372 12 5 0 November - - - - - - - - - - - - - - - - 0 - - - December - - - - - - - - - - 345 11 - - - - 0 - - -
Total 9,874 27 13,239 36 13,252 36 13,365 37 11,681 32 10,317 28 13,320 36 13,075 36 13,076 36 13,236 36
Total Acre Feet 30,304 49,627 40,670 41,014 35,848 31,661 40,876 40,126 40,129 40,620
UNAUDITEDLAS VEGAS VALLEY WATER DISTRICT
OPERATING INFORMATIONENTERPRISE FUND
75
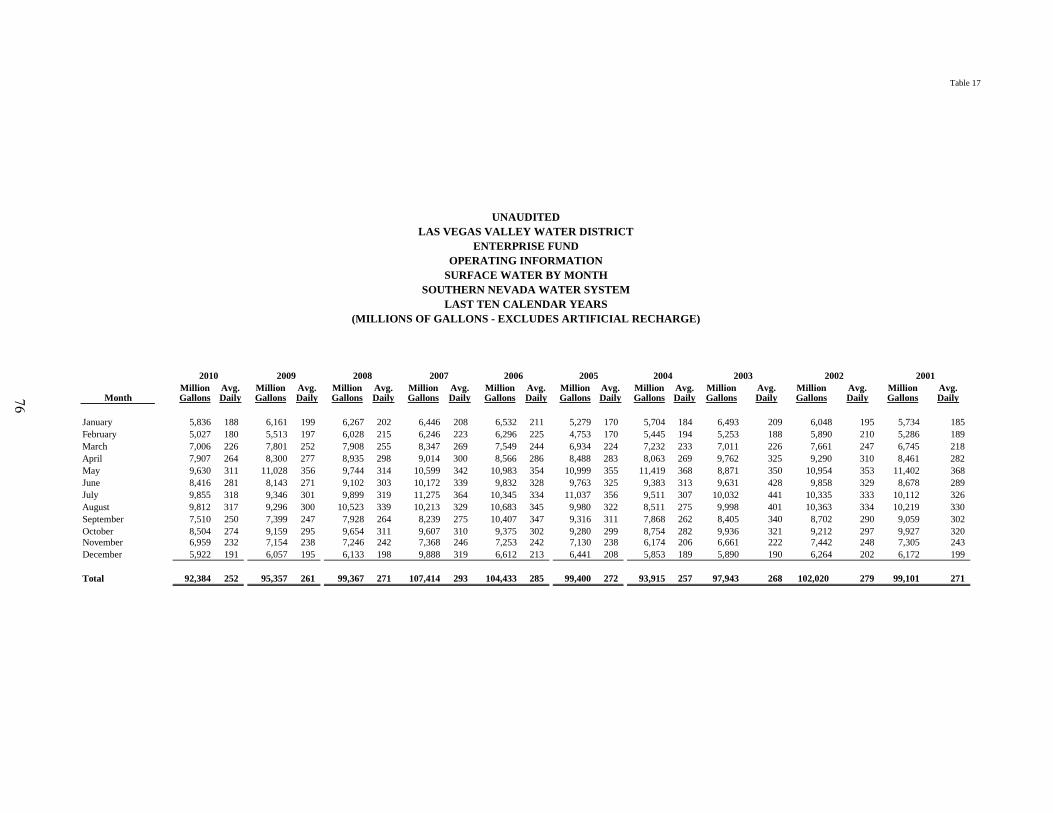
Table 17
SOUTHERN NEVADA WATER SYSTEMLAST TEN CALENDAR YEARS
(MILLIONS OF GALLONS - EXCLUDES ARTIFICIAL RECHARGE)
2010 2009 2008 2007 2006 2005 2004 2003 2002 2001Million Avg. Million Avg. Million Avg. Million Avg. Million Avg. Million Avg. Million Avg. Million Avg. Million Avg. Million Avg.
Month Gallons Daily Gallons Daily Gallons Daily Gallons Daily Gallons Daily Gallons Daily Gallons Daily Gallons Daily Gallons Daily Gallons Daily
January 5,836 188 6,161 199 6,267 202 6,446 208 6,532 211 5,279 170 5,704 184 6,493 209 6,048 195 5,734 185 February 5,027 180 5,513 197 6,028 215 6,246 223 6,296 225 4,753 170 5,445 194 5,253 188 5,890 210 5,286 189 March 7,006 226 7,801 252 7,908 255 8,347 269 7,549 244 6,934 224 7,232 233 7,011 226 7,661 247 6,745 218 April 7,907 264 8,300 277 8,935 298 9,014 300 8,566 286 8,488 283 8,063 269 9,762 325 9,290 310 8,461 282 May 9,630 311 11,028 356 9,744 314 10,599 342 10,983 354 10,999 355 11,419 368 8,871 350 10,954 353 11,402 368 June 8,416 281 8,143 271 9,102 303 10,172 339 9,832 328 9,763 325 9,383 313 9,631 428 9,858 329 8,678 289 July 9,855 318 9,346 301 9,899 319 11,275 364 10,345 334 11,037 356 9,511 307 10,032 441 10,335 333 10,112 326 August 9,812 317 9,296 300 10,523 339 10,213 329 10,683 345 9,980 322 8,511 275 9,998 401 10,363 334 10,219 330 September 7,510 250 7,399 247 7,928 264 8,239 275 10,407 347 9,316 311 7,868 262 8,405 340 8,702 290 9,059 302 October 8,504 274 9,159 295 9,654 311 9,607 310 9,375 302 9,280 299 8,754 282 9,936 321 9,212 297 9,927 320 November 6,959 232 7,154 238 7,246 242 7,368 246 7,253 242 7,130 238 6,174 206 6,661 222 7,442 248 7,305 243 December 5,922 191 6,057 195 6,133 198 9,888 319 6,612 213 6,441 208 5,853 189 5,890 190 6,264 202 6,172 199
Total 92,384 252 95,357 261 99,367 271 107,414 293 104,433 285 99,400 272 93,915 257 97,943 268 102,020 279 99,101 271
SURFACE WATER BY MONTH
UNAUDITEDLAS VEGAS VALLEY WATER DISTRICT
ENTERPRISE FUNDOPERATING INFORMATION
76
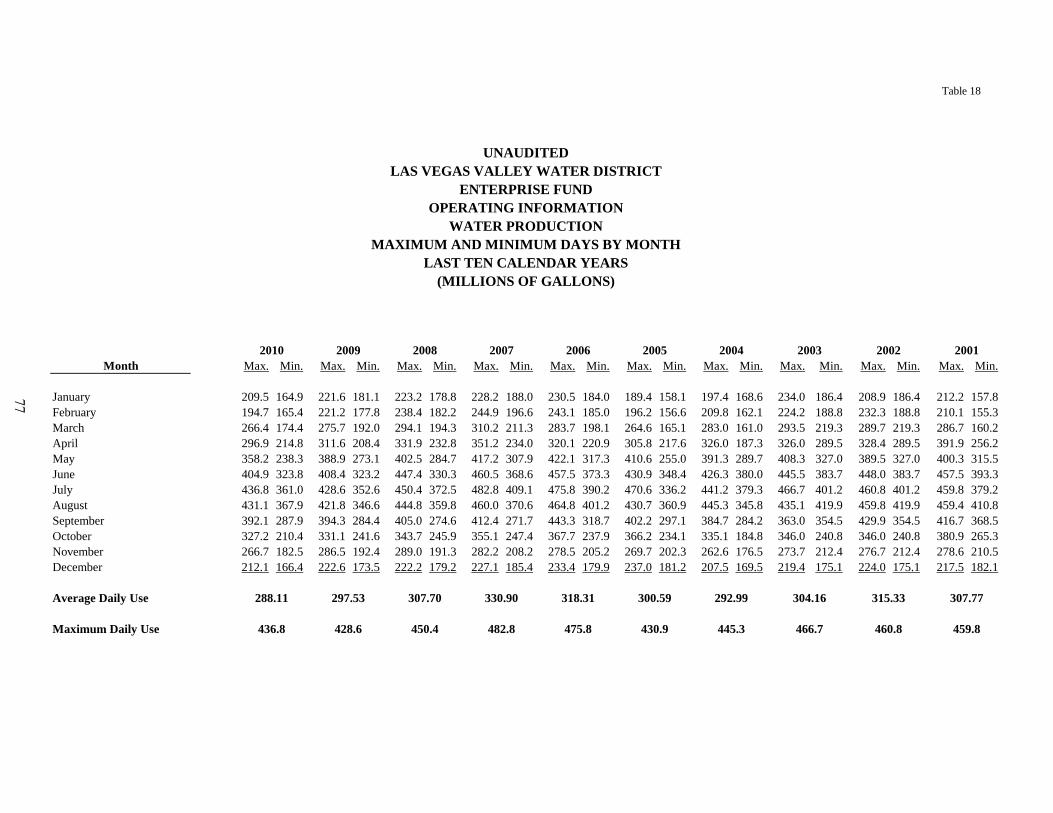
Table 18
WATER PRODUCTIONMAXIMUM AND MINIMUM DAYS BY MONTH
LAST TEN CALENDAR YEARS(MILLIONS OF GALLONS)
2010 2009 2008 2007 2006 2005 2004 2003 2002 2001Month Max. Min. Max. Min. Max. Min. Max. Min. Max. Min. Max. Min. Max. Min. Max. Min. Max. Min. Max. Min.
January 209.5 164.9 221.6 181.1 223.2 178.8 228.2 188.0 230.5 184.0 189.4 158.1 197.4 168.6 234.0 186.4 208.9 186.4 212.2 157.8February 194.7 165.4 221.2 177.8 238.4 182.2 244.9 196.6 243.1 185.0 196.2 156.6 209.8 162.1 224.2 188.8 232.3 188.8 210.1 155.3March 266.4 174.4 275.7 192.0 294.1 194.3 310.2 211.3 283.7 198.1 264.6 165.1 283.0 161.0 293.5 219.3 289.7 219.3 286.7 160.2April 296.9 214.8 311.6 208.4 331.9 232.8 351.2 234.0 320.1 220.9 305.8 217.6 326.0 187.3 326.0 289.5 328.4 289.5 391.9 256.2May 358.2 238.3 388.9 273.1 402.5 284.7 417.2 307.9 422.1 317.3 410.6 255.0 391.3 289.7 408.3 327.0 389.5 327.0 400.3 315.5June 404.9 323.8 408.4 323.2 447.4 330.3 460.5 368.6 457.5 373.3 430.9 348.4 426.3 380.0 445.5 383.7 448.0 383.7 457.5 393.3July 436.8 361.0 428.6 352.6 450.4 372.5 482.8 409.1 475.8 390.2 470.6 336.2 441.2 379.3 466.7 401.2 460.8 401.2 459.8 379.2August 431.1 367.9 421.8 346.6 444.8 359.8 460.0 370.6 464.8 401.2 430.7 360.9 445.3 345.8 435.1 419.9 459.8 419.9 459.4 410.8September 392.1 287.9 394.3 284.4 405.0 274.6 412.4 271.7 443.3 318.7 402.2 297.1 384.7 284.2 363.0 354.5 429.9 354.5 416.7 368.5October 327.2 210.4 331.1 241.6 343.7 245.9 355.1 247.4 367.7 237.9 366.2 234.1 335.1 184.8 346.0 240.8 346.0 240.8 380.9 265.3November 266.7 182.5 286.5 192.4 289.0 191.3 282.2 208.2 278.5 205.2 269.7 202.3 262.6 176.5 273.7 212.4 276.7 212.4 278.6 210.5December 212.1 166.4 222.6 173.5 222.2 179.2 227.1 185.4 233.4 179.9 237.0 181.2 207.5 169.5 219.4 175.1 224.0 175.1 217.5 182.1
Average Daily Use 288.11 297.53 307.70 330.90 318.31 300.59 292.99 304.16 315.33 307.77
Maximum Daily Use 436.8 428.6 450.4 482.8 475.8 430.9 445.3 466.7 460.8 459.8
UNAUDITEDLAS VEGAS VALLEY WATER DISTRICT
OPERATING INFORMATIONENTERPRISE FUND
77
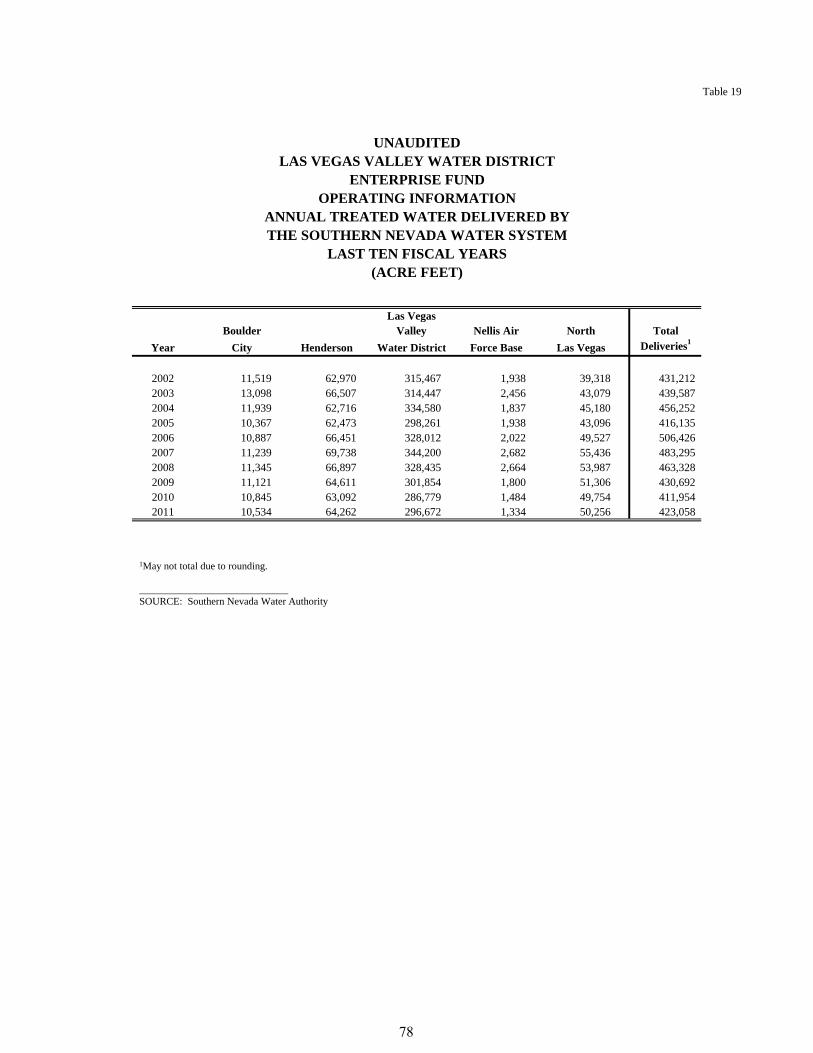
Table 19
Las VegasBoulder Valley Nellis Air North Total
Year City Henderson Water District Force Base Las Vegas Deliveries1
2002 11,519 62,970 315,467 1,938 39,318 431,212 2003 13,098 66,507 314,447 2,456 43,079 439,587 2004 11,939 62,716 334,580 1,837 45,180 456,252 2005 10,367 62,473 298,261 1,938 43,096 416,135 2006 10,887 66,451 328,012 2,022 49,527 506,426 2007 11,239 69,738 344,200 2,682 55,436 483,295 2008 11,345 66,897 328,435 2,664 53,987 463,328 2009 11,121 64,611 301,854 1,800 51,306 430,692 2010 10,845 63,092 286,779 1,484 49,754 411,954 2011 10,534 64,262 296,672 1,334 50,256 423,058
ANNUAL TREATED WATER DELIVERED BYTHE SOUTHERN NEVADA WATER SYSTEM
(ACRE FEET)
UNAUDITEDLAS VEGAS VALLEY WATER DISTRICT
LAST TEN FISCAL YEARS
OPERATING INFORMATIONENTERPRISE FUND
1May not total due to rounding. _____________________________ SOURCE: Southern Nevada Water Authority
78
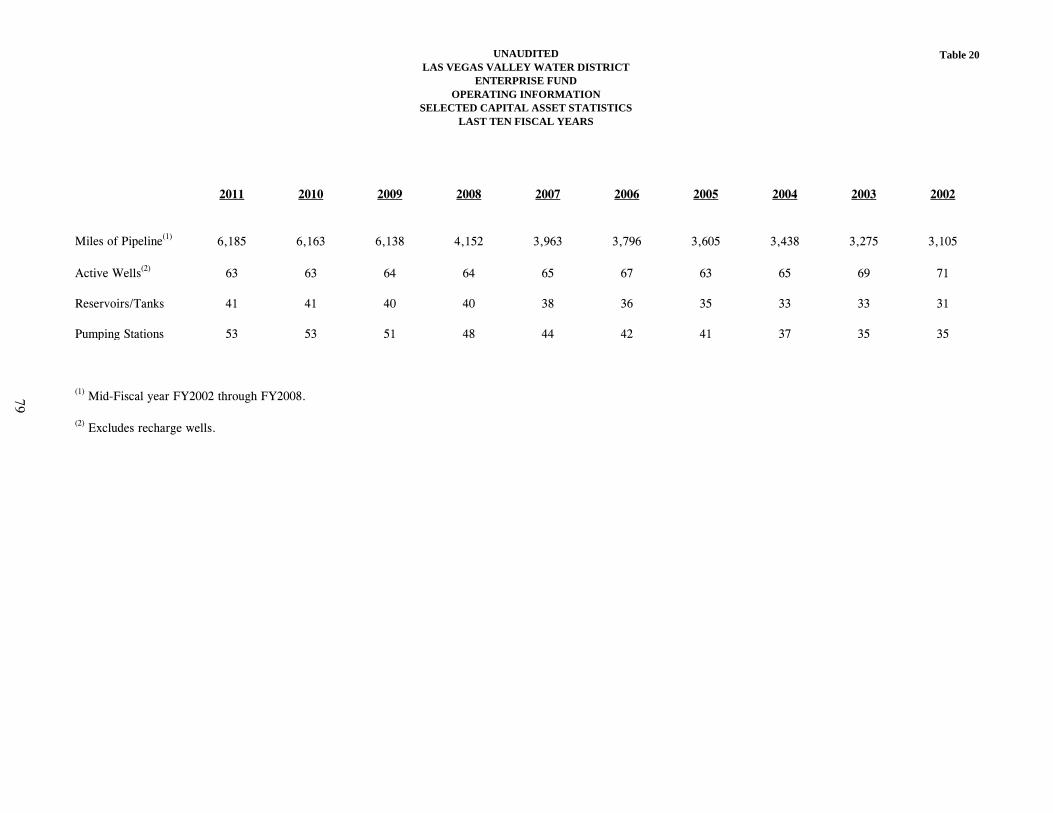
UNAUDITEDLAS VEGAS VALLEY WATER DISTRICT
ENTERPRISE FUNDOPERATING INFORMATION
SELECTED CAPITAL ASSET STATISTICS LAST TEN FISCAL YEARS
Table 20
2011 2010 2009 2008 2007 2006 2005 2004 2003 2002
Miles of Pipeline(1) 6,185 6,163 6,138 4,152 3,963 3,796 3,605 3,438 3,275 3,105
Active Wells(2) 63 63 64 64 65 67 63 65 69 71
Reservoirs/Tanks 41 41 40 40 38 36 35 33 33 31
Pumping Stations 53 53 51 48 44 42 41 37 35 35
(2) Excludes recharge wells.
(1) Mid-Fiscal year FY2002 through FY2008. 79
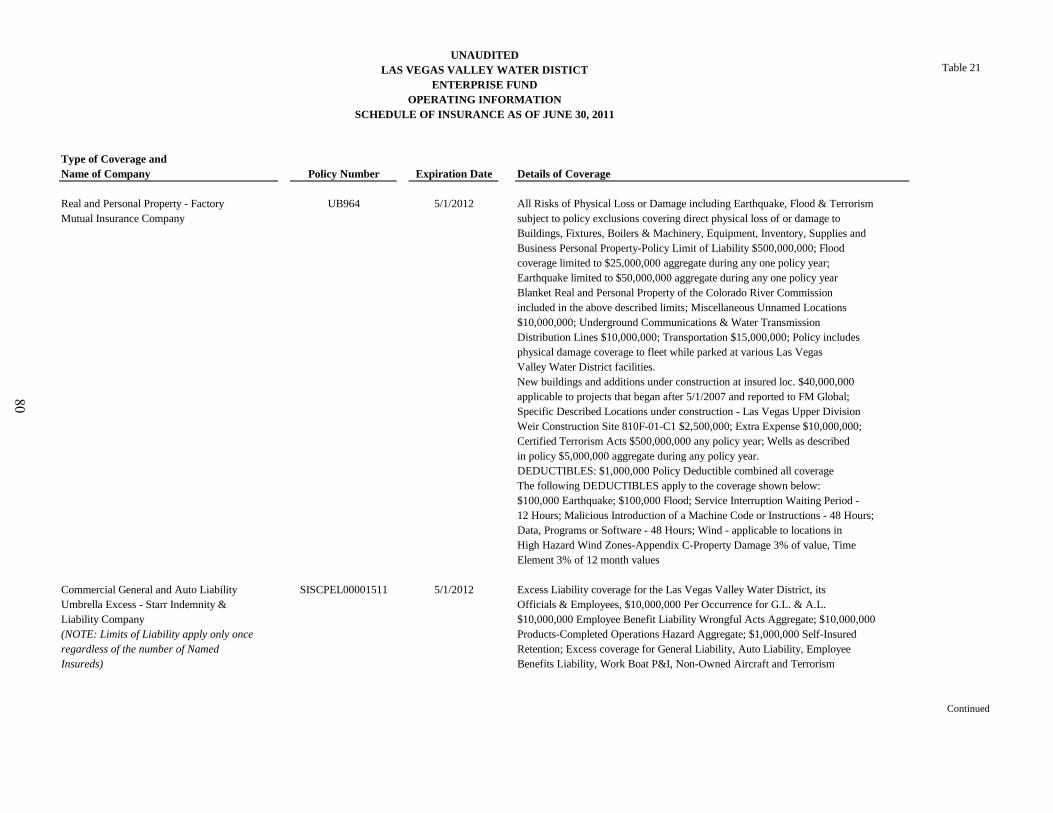
Table 21
Type of Coverage andName of Company Policy Number Expiration Date Details of Coverage
Real and Personal Property - Factory UB964 5/1/2012 All Risks of Physical Loss or Damage including Earthquake, Flood & TerrorismMutual Insurance Company subject to policy exclusions covering direct physical loss of or damage to
Buildings, Fixtures, Boilers & Machinery, Equipment, Inventory, Supplies andBusiness Personal Property-Policy Limit of Liability $500,000,000; Floodcoverage limited to $25,000,000 aggregate during any one policy year;Earthquake limited to $50,000,000 aggregate during any one policy yearBlanket Real and Personal Property of the Colorado River Commissionincluded in the above described limits; Miscellaneous Unnamed Locations$10,000,000; Underground Communications & Water TransmissionDistribution Lines $10,000,000; Transportation $15,000,000; Policy includesphysical damage coverage to fleet while parked at various Las Vegas Valley Water District facilities.New buildings and additions under construction at insured loc. $40,000,000applicable to projects that began after 5/1/2007 and reported to FM Global;Specific Described Locations under construction - Las Vegas Upper DivisionWeir Construction Site 810F-01-C1 $2,500,000; Extra Expense $10,000,000;Certified Terrorism Acts $500,000,000 any policy year; Wells as describedin policy $5,000,000 aggregate during any policy year.DEDUCTIBLES: $1,000,000 Policy Deductible combined all coverageThe following DEDUCTIBLES apply to the coverage shown below:$100,000 Earthquake; $100,000 Flood; Service Interruption Waiting Period -12 Hours; Malicious Introduction of a Machine Code or Instructions - 48 Hours;Data, Programs or Software - 48 Hours; Wind - applicable to locations inHigh Hazard Wind Zones-Appendix C-Property Damage 3% of value, TimeElement 3% of 12 month values
Commercial General and Auto Liability SISCPEL00001511 5/1/2012 Excess Liability coverage for the Las Vegas Valley Water District, itsUmbrella Excess - Starr Indemnity & Officials & Employees, $10,000,000 Per Occurrence for G.L. & A.L.Liability Company $10,000,000 Employee Benefit Liability Wrongful Acts Aggregate; $10,000,000(NOTE: Limits of Liability apply only once Products-Completed Operations Hazard Aggregate; $1,000,000 Self-Insuredregardless of the number of Named Retention; Excess coverage for General Liability, Auto Liability, EmployeeInsureds) Benefits Liability, Work Boat P&I, Non-Owned Aircraft and Terrorism
Continued
LAS VEGAS VALLEY WATER DISTICT
SCHEDULE OF INSURANCE AS OF JUNE 30, 2011
UNAUDITED
ENTERPRISE FUNDOPERATING INFORMATION
80
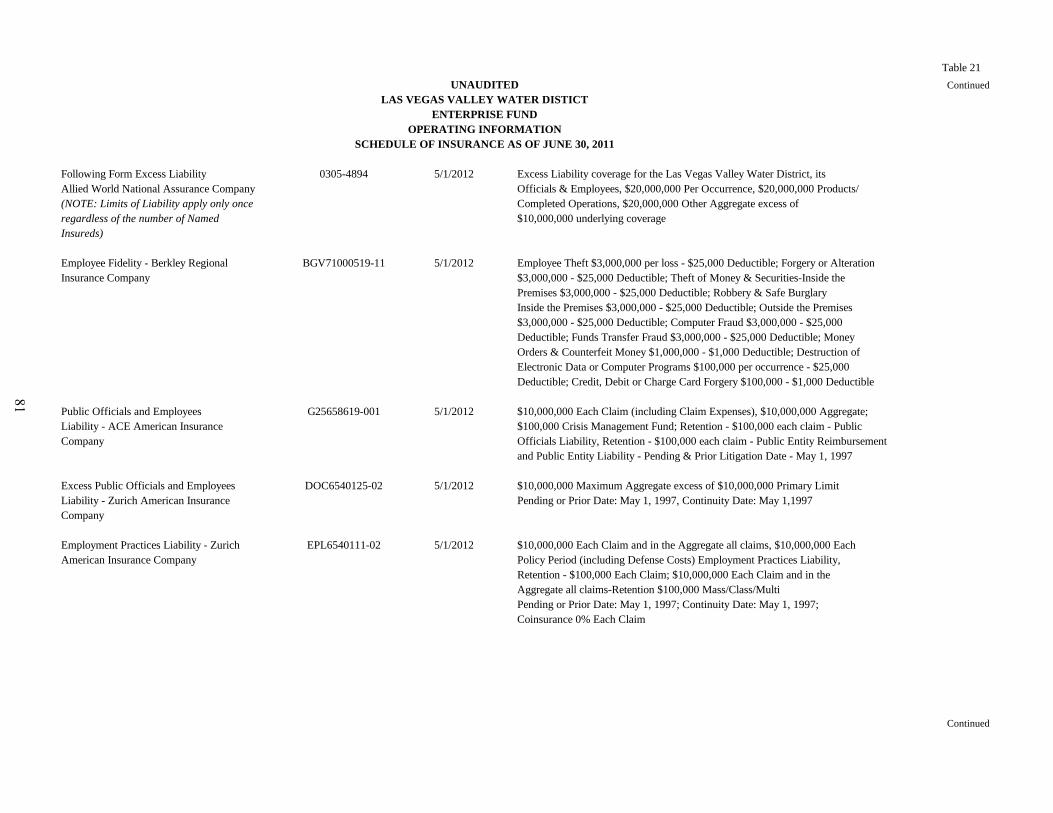
Table 21Continued
Following Form Excess Liability 0305-4894 5/1/2012 Excess Liability coverage for the Las Vegas Valley Water District, itsAllied World National Assurance Company Officials & Employees, $20,000,000 Per Occurrence, $20,000,000 Products/(NOTE: Limits of Liability apply only once Completed Operations, $20,000,000 Other Aggregate excess of regardless of the number of Named $10,000,000 underlying coverageInsureds)
Employee Fidelity - Berkley Regional BGV71000519-11 5/1/2012 Employee Theft $3,000,000 per loss - $25,000 Deductible; Forgery or AlterationInsurance Company $3,000,000 - $25,000 Deductible; Theft of Money & Securities-Inside the
Premises $3,000,000 - $25,000 Deductible; Robbery & Safe BurglaryInside the Premises $3,000,000 - $25,000 Deductible; Outside the Premises$3,000,000 - $25,000 Deductible; Computer Fraud $3,000,000 - $25,000Deductible; Funds Transfer Fraud $3,000,000 - $25,000 Deductible; MoneyOrders & Counterfeit Money $1,000,000 - $1,000 Deductible; Destruction ofElectronic Data or Computer Programs $100,000 per occurrence - $25,000Deductible; Credit, Debit or Charge Card Forgery $100,000 - $1,000 Deductible
Public Officials and Employees G25658619-001 5/1/2012 $10,000,000 Each Claim (including Claim Expenses), $10,000,000 Aggregate;Liability - ACE American Insurance $100,000 Crisis Management Fund; Retention - $100,000 each claim - PublicCompany Officials Liability, Retention - $100,000 each claim - Public Entity Reimbursement
and Public Entity Liability - Pending & Prior Litigation Date - May 1, 1997
Excess Public Officials and Employees DOC6540125-02 5/1/2012 $10,000,000 Maximum Aggregate excess of $10,000,000 Primary LimitLiability - Zurich American Insurance Pending or Prior Date: May 1, 1997, Continuity Date: May 1,1997Company
Employment Practices Liability - Zurich EPL6540111-02 5/1/2012 $10,000,000 Each Claim and in the Aggregate all claims, $10,000,000 EachAmerican Insurance Company Policy Period (including Defense Costs) Employment Practices Liability,
Retention - $100,000 Each Claim; $10,000,000 Each Claim and in theAggregate all claims-Retention $100,000 Mass/Class/MultiPending or Prior Date: May 1, 1997; Continuity Date: May 1, 1997;Coinsurance 0% Each Claim
Continued
LAS VEGAS VALLEY WATER DISTICTENTERPRISE FUND
OPERATING INFORMATIONSCHEDULE OF INSURANCE AS OF JUNE 30, 2011
UNAUDITED
81
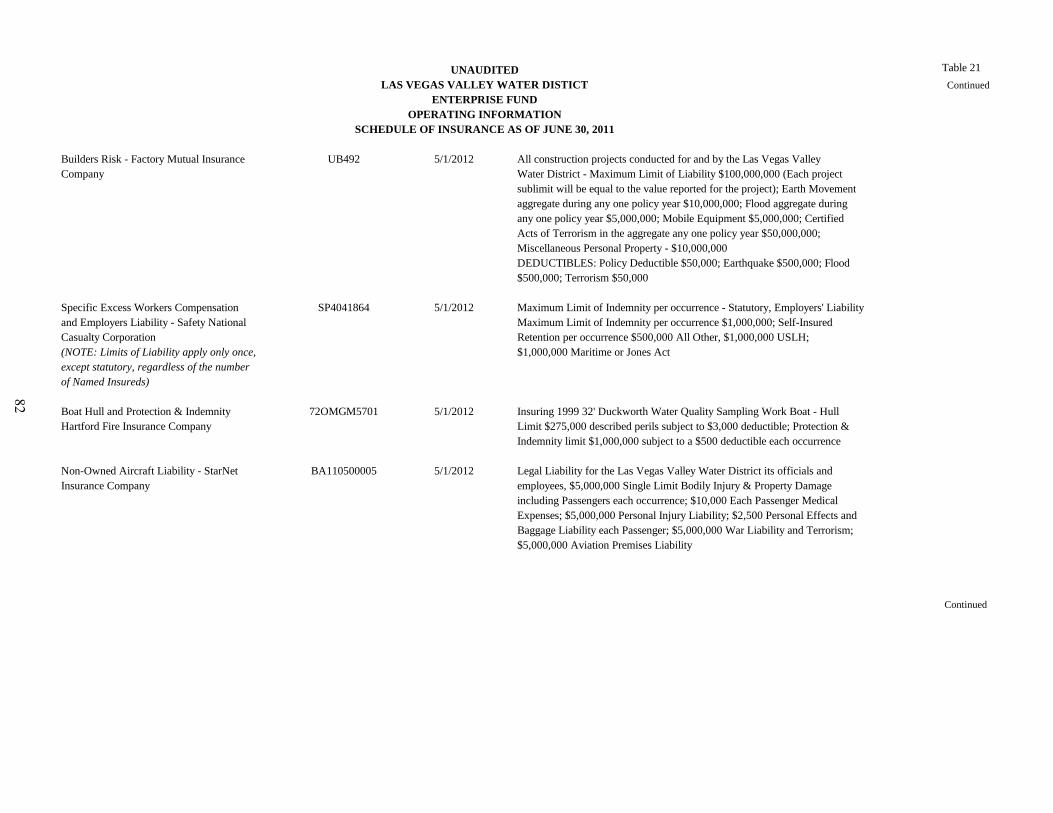
Table 21Continued
Builders Risk - Factory Mutual Insurance UB492 5/1/2012 All construction projects conducted for and by the Las Vegas ValleyCompany Water District - Maximum Limit of Liability $100,000,000 (Each project
sublimit will be equal to the value reported for the project); Earth Movement aggregate during any one policy year $10,000,000; Flood aggregate during
any one policy year $5,000,000; Mobile Equipment $5,000,000; CertifiedActs of Terrorism in the aggregate any one policy year $50,000,000;Miscellaneous Personal Property - $10,000,000DEDUCTIBLES: Policy Deductible $50,000; Earthquake $500,000; Flood$500,000; Terrorism $50,000
Specific Excess Workers Compensation SP4041864 5/1/2012 Maximum Limit of Indemnity per occurrence - Statutory, Employers' Liabilityand Employers Liability - Safety National Maximum Limit of Indemnity per occurrence $1,000,000; Self-Insured Casualty Corporation Retention per occurrence $500,000 All Other, $1,000,000 USLH;(NOTE: Limits of Liability apply only once, $1,000,000 Maritime or Jones Actexcept statutory, regardless of the numberof Named Insureds)
Boat Hull and Protection & Indemnity 72OMGM5701 5/1/2012 Insuring 1999 32' Duckworth Water Quality Sampling Work Boat - HullHartford Fire Insurance Company Limit $275,000 described perils subject to $3,000 deductible; Protection &
Indemnity limit $1,000,000 subject to a $500 deductible each occurrence
Non-Owned Aircraft Liability - StarNet BA110500005 5/1/2012 Legal Liability for the Las Vegas Valley Water District its officials andInsurance Company employees, $5,000,000 Single Limit Bodily Injury & Property Damage
including Passengers each occurrence; $10,000 Each Passenger MedicalExpenses; $5,000,000 Personal Injury Liability; $2,500 Personal Effects andBaggage Liability each Passenger; $5,000,000 War Liability and Terrorism;$5,000,000 Aviation Premises Liability
Continued
OPERATING INFORMATIONSCHEDULE OF INSURANCE AS OF JUNE 30, 2011
UNAUDITEDLAS VEGAS VALLEY WATER DISTICT
ENTERPRISE FUND
82
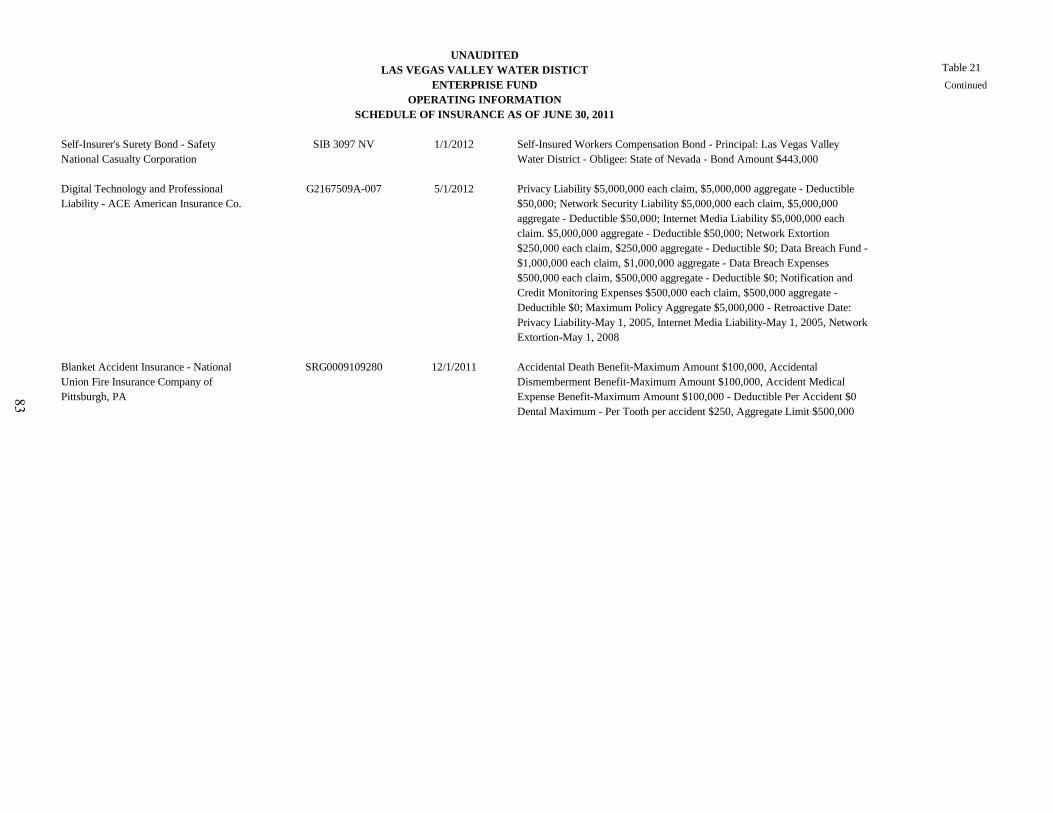
Table 21Continued
Self-Insurer's Surety Bond - Safety SIB 3097 NV 1/1/2012 Self-Insured Workers Compensation Bond - Principal: Las Vegas ValleyNational Casualty Corporation Water District - Obligee: State of Nevada - Bond Amount $443,000
Digital Technology and Professional G2167509A-007 5/1/2012 Privacy Liability $5,000,000 each claim, $5,000,000 aggregate - DeductibleLiability - ACE American Insurance Co. $50,000; Network Security Liability $5,000,000 each claim, $5,000,000
aggregate - Deductible $50,000; Internet Media Liability $5,000,000 eachclaim. $5,000,000 aggregate - Deductible $50,000; Network Extortion$250,000 each claim, $250,000 aggregate - Deductible $0; Data Breach Fund -$1,000,000 each claim, $1,000,000 aggregate - Data Breach Expenses$500,000 each claim, $500,000 aggregate - Deductible $0; Notification andCredit Monitoring Expenses $500,000 each claim, $500,000 aggregate -Deductible $0; Maximum Policy Aggregate $5,000,000 - Retroactive Date:Privacy Liability-May 1, 2005, Internet Media Liability-May 1, 2005, NetworkExtortion-May 1, 2008
Blanket Accident Insurance - National SRG0009109280 12/1/2011 Accidental Death Benefit-Maximum Amount $100,000, Accidental Union Fire Insurance Company of Dismemberment Benefit-Maximum Amount $100,000, Accident MedicalPittsburgh, PA Expense Benefit-Maximum Amount $100,000 - Deductible Per Accident $0
Dental Maximum - Per Tooth per accident $250, Aggregate Limit $500,000
ENTERPRISE FUNDOPERATING INFORMATION
SCHEDULE OF INSURANCE AS OF JUNE 30, 2011
UNAUDITEDLAS VEGAS VALLEY WATER DISTICT
83

THIS PAGE LEFT
INTENTIONALLY BLANK
INDepeNDeNT AUDITOR S’ RepORT ON INTeRNAL CONTROL OveR FINANCIAL RepORTINg AND ON COmpLIANCe AND OTheR mATTeR S bA SeD ON AN AUDIT OF FINANCIAL STATemeNTS

PBTK PIERCY BOWLER TAYLOR & KERN Certified Public Accountants
Business Advisors
INDEPENDENT AUDITORS' REPORT ON INTERNAL CONTROL OVER FINANCIAL REPORTING AND ON COMPLIANCE AND
OTHER MATTERS BASED ON AN AUDIT OF FINANCIAL STATEMENTS PERFORMED IN ACCORDANCE WITH
GOVERNMENT AUDITING STANDARDS
Board of Directors Las Vegas Valley Water District Las Vegas, Nevada
We have audited the basic financial statements ofthe Las Vegas Valley Water District (the District) as of and for the year ended June 30, 2011, and have issued our report thereon dated November 9, 2011. We conducted our audit in accordance with auditing standards generally accepted in the United States of America and the standards applicable to fmancial audits contained in Government Auditing Standards, issued by the Comptroller General of the United States.
Internal Control over Financial Reporting. Management of the District is responsible for establishing and maintaining effective internal control over financial reporting. In planning and performing our audit, we considered the District's internal control over financial reporting as a basis for designing our auditing procedures for the purpose of expressing an opinion on the basic financial statements, but not for the purpose of expressing an opinion on the effectiveness of the District's internal control over financial reporting. Accordingly, we do not express an opinion on the effectiveness of the District's internal control over fmancial reporting.
A deficiency in internal control exists when the design or operation of a control does not allow management or employees, in the normal course of performing their assigned functions, to prevent, or detect and correct misstatements on a timely basis. A material weakness is a deficiency, or a combination of deficiencies, in internal control such that there is a reasonable possibility that a material misstatement of the entity's financial statements will not be prevented, or detected and corrected on a timely basis. A significant deficiency is a deficiency or a combination of deficiencies in internal control that is less severe than a material weakness, yet important enough to merit attention by those charged with governance.
Our consideration of internal control over financial reporting was for the limited purpose described in the first paragraph of this section and was not designed to identify all deficiencies in internal control over financial reporting that might be deficiencies, significant deficiencies or material weaknesses. We did not identify any deficiencies in internal control over financial reporting that we consider to be material weaknesses, as defined above.
Compliance and other matters. As part of obtaining reasonable assurance about whether the District's financial statements are free of material misstatement, we performed tests of its compliance with certain provisions of laws, regulations, contracts, and grant agreements, noncompliance with which could have a direct and material effect on the determination of basic financial statement amounts. However, providing an opinion on compliance with those provisions was not an objective of our audit and, accordingly, we do not express such an opinion. The results of our tests disclosed no instances of noncompliance or other matters that are required to be reported under Government Auditing Standards.
6100 Elton Avenue, Ste. 1000 • Las Yegas, Nevada 89107 • 702-384-lUO • fax 702-870-2474 , pbtk.com

THIS PAGE LEFT
INTENTIONALLY BLANK