Embed Size (px)
Citation preview
Las Vegas Valley Executive SummaryOffice Market l 4th Quarter 2013
HUGHES CENTER
BELTWAY BUSINESS CENTER
January 23, 2014
Re: Commercial Real Estate Survey: 4th Quarter, 2013
Dear Reader,
RCG Economics and the UNLV Lied Institute for Real Estate Studies are excited to produced the Lied-RCGCommercial Real Estate Survey (“the Survey”) containing the most comprehensive, timely and accurate data andanalysis on the Las Vegas Valley’s industrial, speculative office and anchored retail markets.
RCG Economics has partnered with the Lied Institute to produce objective and independent quarterly surveys on thehealth and state of the commercial real estate market. RCG is a leader in real estate market research and analysis,including commercial real estate, and in economic forecasting. The Lied Institute seeks to advance real estate knowl-edge through research, student scholarship, and community outreach activities.
The Survey is born of our commitment to excellence in serving those organizations requiring superior up-to-date mar-ket analysis and data to make key decisions. Developing this Private-Public Partnership to collect, analyze and releaseunbiased information is further proof of this commitment. Equally important, the data herein is collected as close aspossible to the end of each quarter.
This survey documents historical and current market conditions at the Valley and submarket levels. The data containedherein are organized and tracked by our in-house research analysts and economists to provide the best analysis of LasVegas’ commercial real estate markets. The survey contains a variety of meaningful market indicators, including:
l Total existing inventoryl New and planned construction activityl Vacancy and occupancy levelsl Net Absorptionl “Coupon” or quoted monthly rents
Further, our three commercial (industrial, office and retail) databases contain benchmark building data, by submarket,dating back to 1996. This information allows us to develop “custom” studies for our readers and clients. It is throughthis survey and our other services and products, that we remain the “Source for Decision Makers.”
Regards,
John Restrepo Marcus ConklinRCG Economics Lied Institute for Real Estate Studies-UNLV
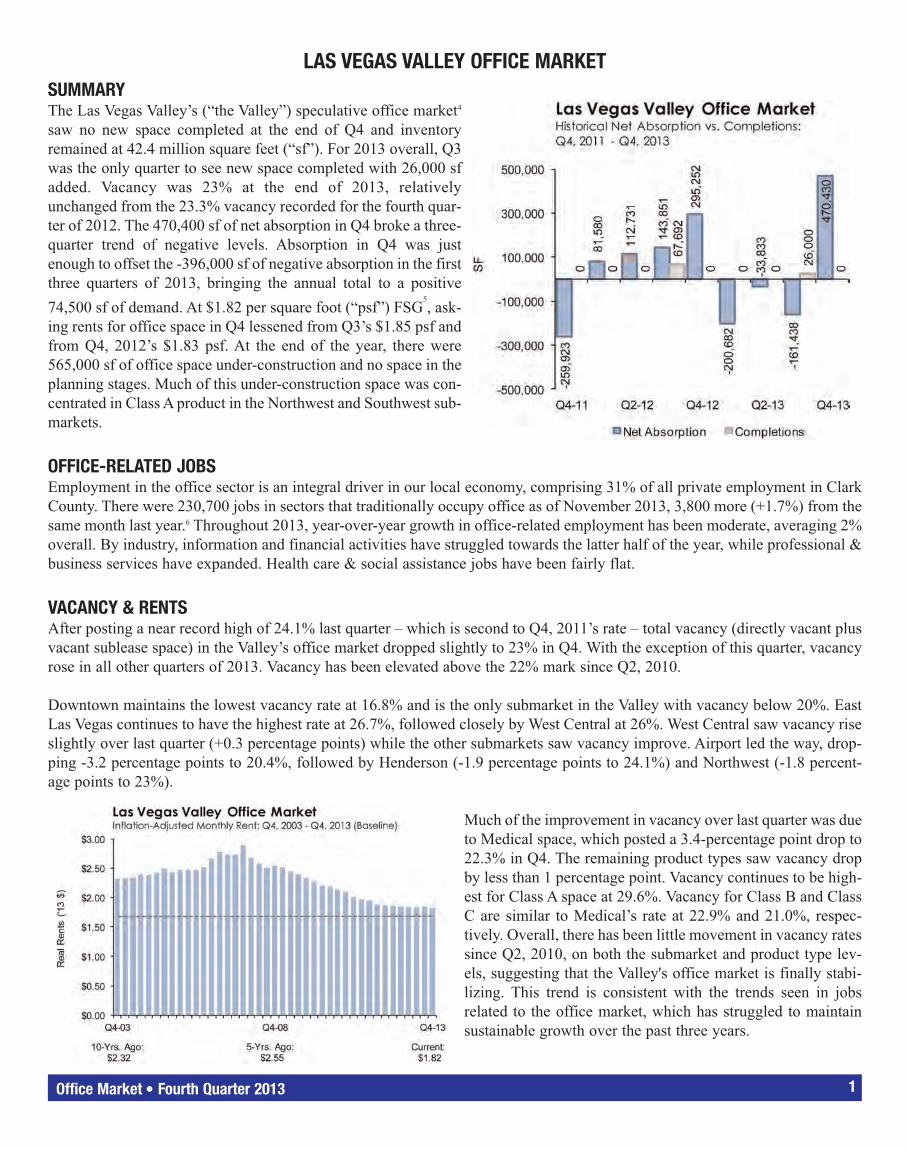
LAS VEGAS VALLEY OFFICE MARKETSUMMARYThe Las Vegas Valley’s (“the Valley”) speculative office market4
saw no new space completed at the end of Q4 and inventoryremained at 42.4 million square feet (“sf”). For 2013 overall, Q3was the only quarter to see new space completed with 26,000 sfadded. Vacancy was 23% at the end of 2013, relativelyunchanged from the 23.3% vacancy recorded for the fourth quar-ter of 2012. The 470,400 sf of net absorption in Q4 broke a three-quarter trend of negative levels. Absorption in Q4 was justenough to offset the -396,000 sf of negative absorption in the firstthree quarters of 2013, bringing the annual total to a positive74,500 sf of demand. At $1.82 per square foot (“psf”) FSG
5, ask-
ing rents for office space in Q4 lessened from Q3’s $1.85 psf andfrom Q4, 2012’s $1.83 psf. At the end of the year, there were565,000 sf of office space under-construction and no space in theplanning stages. Much of this under-construction space was con-centrated in Class A product in the Northwest and Southwest sub-markets.
OFFICE-RELATED JOBSEmployment in the office sector is an integral driver in our local economy, comprising 31% of all private employment in ClarkCounty. There were 230,700 jobs in sectors that traditionally occupy office as of November 2013, 3,800 more (+1.7%) from thesame month last year.6 Throughout 2013, year-over-year growth in office-related employment has been moderate, averaging 2%overall. By industry, information and financial activities have struggled towards the latter half of the year, while professional &business services have expanded. Health care & social assistance jobs have been fairly flat.
VACANCY & RENTSAfter posting a near record high of 24.1% last quarter – which is second to Q4, 2011’s rate – total vacancy (directly vacant plusvacant sublease space) in the Valley’s office market dropped slightly to 23% in Q4. With the exception of this quarter, vacancyrose in all other quarters of 2013. Vacancy has been elevated above the 22% mark since Q2, 2010.
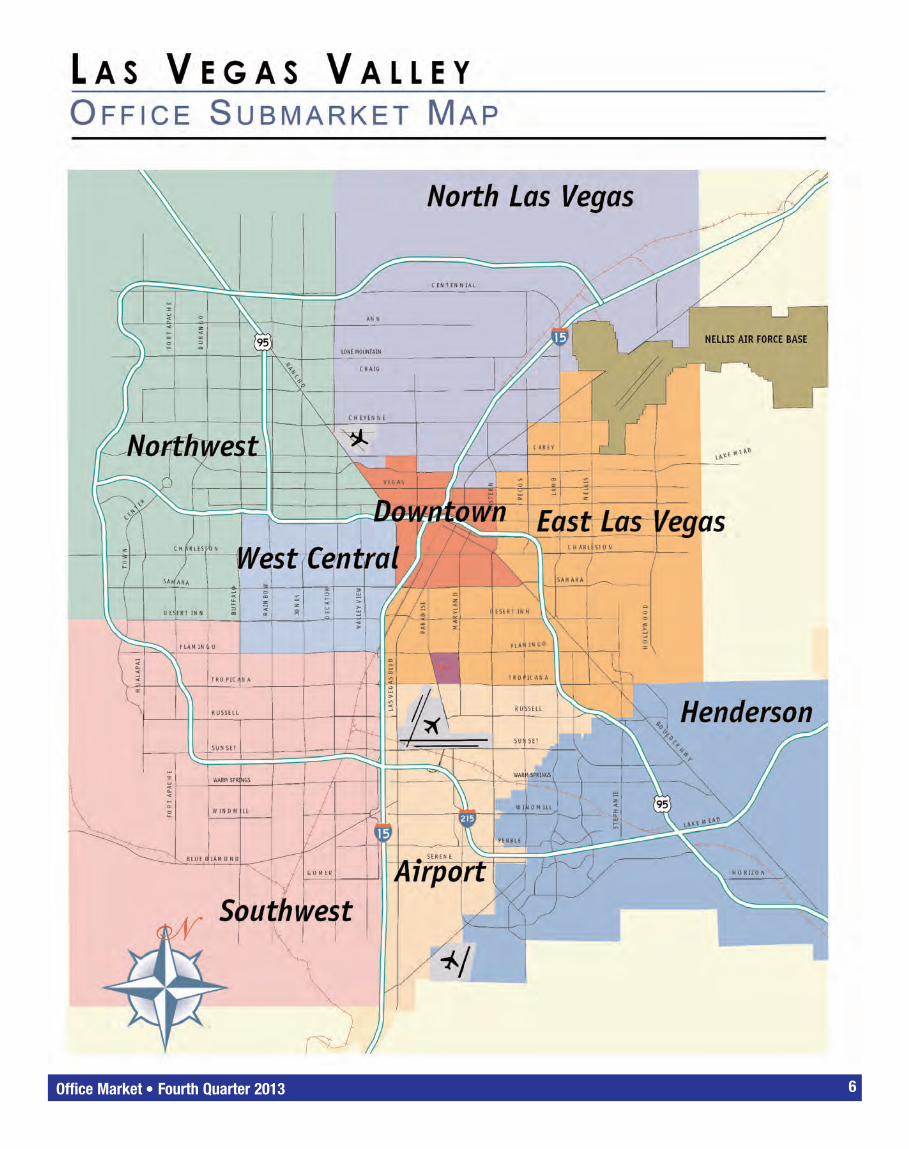
Downtown maintains the lowest vacancy rate at 16.8% and is the only submarket in the Valley with vacancy below 20%. EastLas Vegas continues to have the highest rate at 26.7%, followed closely by West Central at 26%. West Central saw vacancy riseslightly over last quarter (+0.3 percentage points) while the other submarkets saw vacancy improve. Airport led the way, drop-ping -3.2 percentage points to 20.4%, followed by Henderson (-1.9 percentage points to 24.1%) and Northwest (-1.8 percent-age points to 23%).
Much of the improvement in vacancy over last quarter was dueto Medical space, which posted a 3.4-percentage point drop to22.3% in Q4. The remaining product types saw vacancy dropby less than 1 percentage point. Vacancy continues to be high-est for Class A space at 29.6%. Vacancy for Class B and ClassC are similar to Medical’s rate at 22.9% and 21.0%, respec-tively. Overall, there has been little movement in vacancy ratessince Q2, 2010, on both the submarket and product type lev-els, suggesting that the Valley's office market is finally stabi-lizing. This trend is consistent with the trends seen in jobsrelated to the office market, which has struggled to maintainsustainable growth over the past three years.
Office Market l Fourth Quarter 2013 1
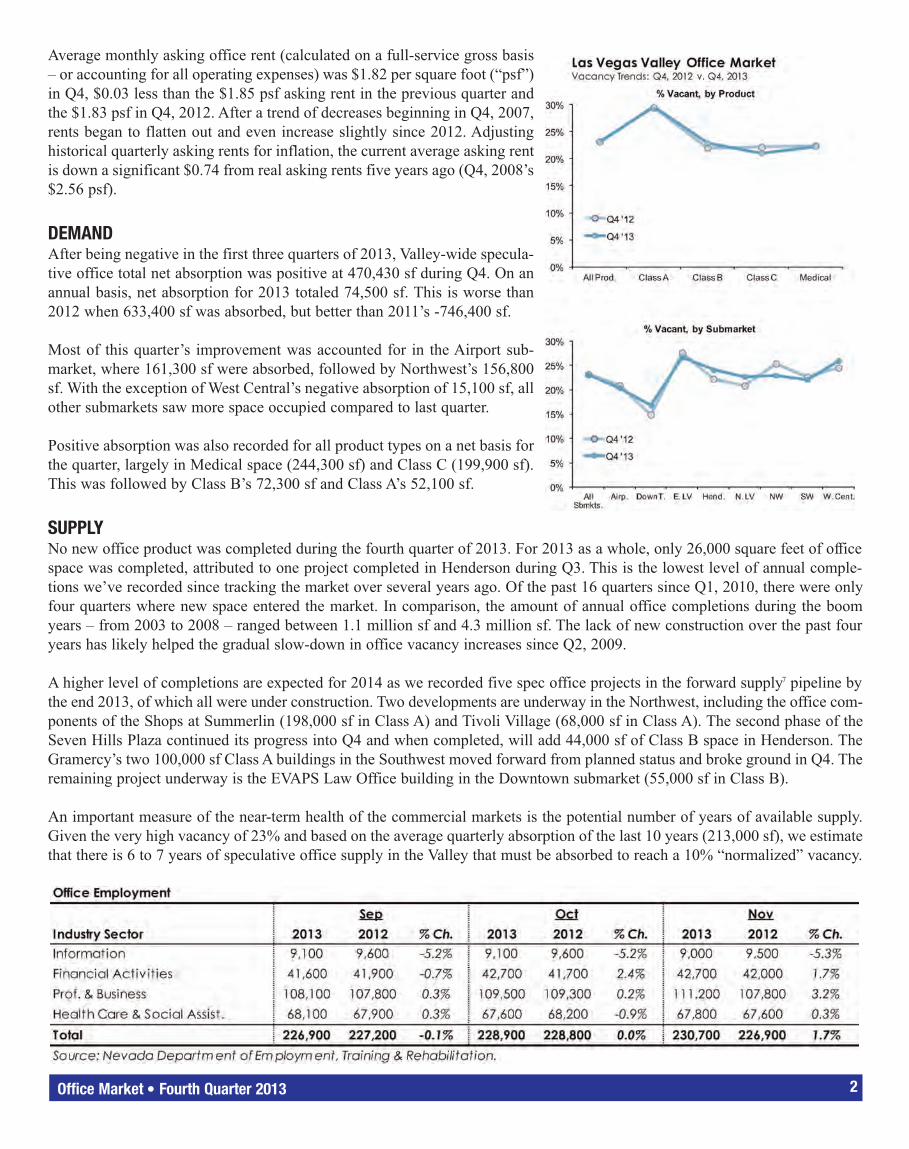
Average monthly asking office rent (calculated on a full-service gross basis– or accounting for all operating expenses) was $1.82 per square foot (“psf”)in Q4, $0.03 less than the $1.85 psf asking rent in the previous quarter andthe $1.83 psf in Q4, 2012. After a trend of decreases beginning in Q4, 2007,rents began to flatten out and even increase slightly since 2012. Adjustinghistorical quarterly asking rents for inflation, the current average asking rentis down a significant $0.74 from real asking rents five years ago (Q4, 2008’s$2.56 psf).
DEMANDAfter being negative in the first three quarters of 2013, Valley-wide specula-tive office total net absorption was positive at 470,430 sf during Q4. On anannual basis, net absorption for 2013 totaled 74,500 sf. This is worse than2012 when 633,400 sf was absorbed, but better than 2011’s -746,400 sf.
Most of this quarter’s improvement was accounted for in the Airport sub-market, where 161,300 sf were absorbed, followed by Northwest’s 156,800sf. With the exception of West Central’s negative absorption of 15,100 sf, allother submarkets saw more space occupied compared to last quarter.
Positive absorption was also recorded for all product types on a net basis forthe quarter, largely in Medical space (244,300 sf) and Class C (199,900 sf).This was followed by Class B’s 72,300 sf and Class A’s 52,100 sf.
SUPPLYNo new office product was completed during the fourth quarter of 2013. For 2013 as a whole, only 26,000 square feet of officespace was completed, attributed to one project completed in Henderson during Q3. This is the lowest level of annual comple-tions we’ve recorded since tracking the market over several years ago. Of the past 16 quarters since Q1, 2010, there were onlyfour quarters where new space entered the market. In comparison, the amount of annual office completions during the boomyears – from 2003 to 2008 – ranged between 1.1 million sf and 4.3 million sf. The lack of new construction over the past fouryears has likely helped the gradual slow-down in office vacancy increases since Q2, 2009.
A higher level of completions are expected for 2014 as we recorded five spec office projects in the forward supply7 pipeline bythe end 2013, of which all were under construction. Two developments are underway in the Northwest, including the office com-ponents of the Shops at Summerlin (198,000 sf in Class A) and Tivoli Village (68,000 sf in Class A). The second phase of theSeven Hills Plaza continued its progress into Q4 and when completed, will add 44,000 sf of Class B space in Henderson. TheGramercy’s two 100,000 sf Class A buildings in the Southwest moved forward from planned status and broke ground in Q4. Theremaining project underway is the EVAPS Law Office building in the Downtown submarket (55,000 sf in Class B).
An important measure of the near-term health of the commercial markets is the potential number of years of available supply.Given the very high vacancy of 23% and based on the average quarterly absorption of the last 10 years (213,000 sf), we estimatethat there is 6 to 7 years of speculative office supply in the Valley that must be absorbed to reach a 10% “normalized” vacancy.
Office Market l Fourth Quarter 2013 2
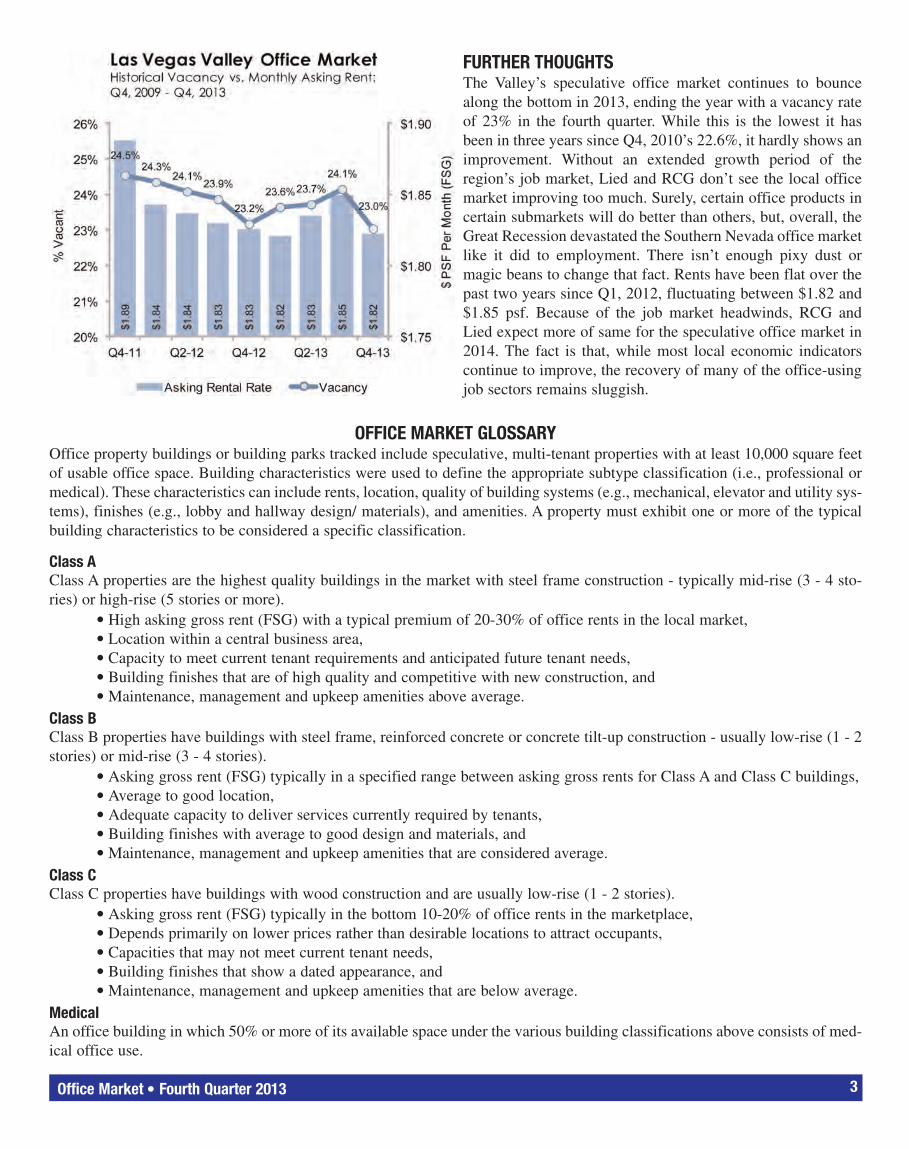
FURTHER THOUGHTSThe Valley’s speculative office market continues to bouncealong the bottom in 2013, ending the year with a vacancy rateof 23% in the fourth quarter. While this is the lowest it hasbeen in three years since Q4, 2010’s 22.6%, it hardly shows animprovement. Without an extended growth period of theregion’s job market, Lied and RCG don’t see the local officemarket improving too much. Surely, certain office products incertain submarkets will do better than others, but, overall, theGreat Recession devastated the Southern Nevada office marketlike it did to employment. There isn’t enough pixy dust ormagic beans to change that fact. Rents have been flat over thepast two years since Q1, 2012, fluctuating between $1.82 and$1.85 psf. Because of the job market headwinds, RCG andLied expect more of same for the speculative office market in2014. The fact is that, while most local economic indicatorscontinue to improve, the recovery of many of the office-usingjob sectors remains sluggish.
OFFICE MARKET GLOSSARYOffice property buildings or building parks tracked include speculative, multi-tenant properties with at least 10,000 square feetof usable office space. Building characteristics were used to define the appropriate subtype classification (i.e., professional ormedical). These characteristics can include rents, location, quality of building systems (e.g., mechanical, elevator and utility sys-tems), finishes (e.g., lobby and hallway design/ materials), and amenities. A property must exhibit one or more of the typicalbuilding characteristics to be considered a specific classification.
Class AClass A properties are the highest quality buildings in the market with steel frame construction - typically mid-rise (3 - 4 sto-ries) or high-rise (5 stories or more).
l High asking gross rent (FSG) with a typical premium of 20-30% of office rents in the local market,l Location within a central business area,l Capacity to meet current tenant requirements and anticipated future tenant needs,l Building finishes that are of high quality and competitive with new construction, and l Maintenance, management and upkeep amenities above average.
Class BClass B properties have buildings with steel frame, reinforced concrete or concrete tilt-up construction - usually low-rise (1 - 2stories) or mid-rise (3 - 4 stories).
l Asking gross rent (FSG) typically in a specified range between asking gross rents for Class A and Class C buildings,l Average to good location,l Adequate capacity to deliver services currently required by tenants,l Building finishes with average to good design and materials, andl Maintenance, management and upkeep amenities that are considered average.
Class CClass C properties have buildings with wood construction and are usually low-rise (1 - 2 stories).
l Asking gross rent (FSG) typically in the bottom 10-20% of office rents in the marketplace,l Depends primarily on lower prices rather than desirable locations to attract occupants,l Capacities that may not meet current tenant needs,l Building finishes that show a dated appearance, and l Maintenance, management and upkeep amenities that are below average.
MedicalAn office building in which 50% or more of its available space under the various building classifications above consists of med-ical office use.
Office Market l Fourth Quarter 2013 3
Office Market l Fourth Quarter 2013 4
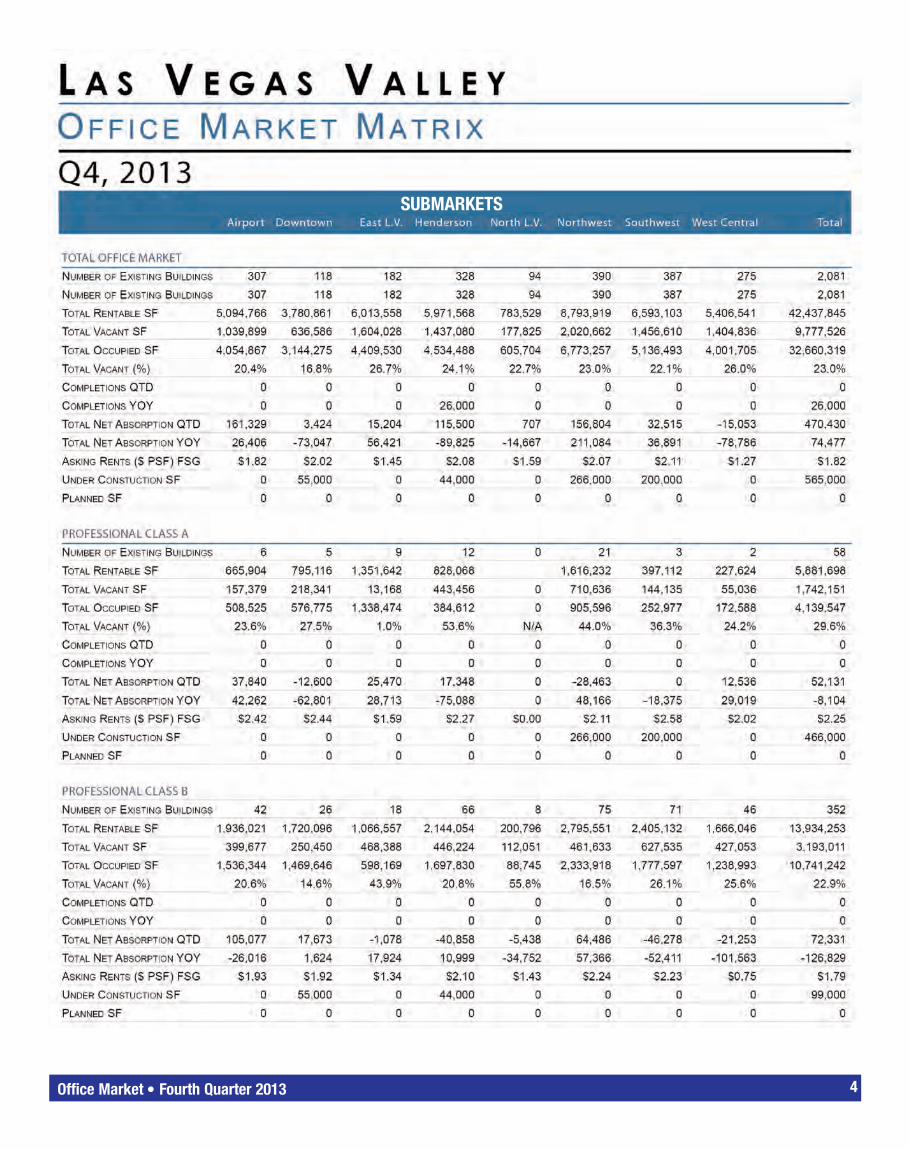
SUBMARKETS

Office Market l Fourth Quarter 2013 5
SUBMARKETS
Office Market l Fourth Quarter 2013 6