Embed Size (px)
Citation preview
National Institute of Environmental Health Sciences
EMMMA: A Web-based System for Environmental Mercury Mapping, Modeling, and Analysis
By Paul P. Hearn, Jr.1, Stephen P. Wente2, David I. Donato1, and John J. Aguinaldo3
Report Series 2006-1086
U.S. Department of the Interior U.S. Geological Survey
1Geography Discipline, Eastern Geographic Science Center, U.S. Geological Survey, Reston, VA, USA; 2Minnesota Water Science Center, U.S. Geological Survey, Mounds View, MN, USA; 3Harris Technical Services Corporation, Falls Church, VA, USA

ii
U.S. Department of the Interior Gale A. Norton, Secretary
U.S. Geological Survey P. Patrick Leahy, Acting Director
U.S. Geological Survey, Reston, Virginia 2006
For product and ordering information: World Wide Web: http://www.usgs.gov/pubprod Telephone: 1-888-ASK-USGS
For more information on the USGS—the Federal source for science about the Earth, its natural and living resources, natural hazards, and the environment: World Wide Web: http://www.usgs.gov Telephone: 1-888-ASK-USGS
Suggested citation: Hearn, Paul., Wente, Stephen, 2006, Title of the publication: OFR 2006-1086, page numbers
Any use of trade, product, or firm names is for descriptive purposes only and does not imply endorsement by the U.S. Government.
Although this report is in the public domain, permission must be secured from the individual copyright owners to reproduce any copyrighted material contained within this report.
iii
Contents Abstract................................................................................................................................................................................1 Background – Environmental Mercury as a Hazard to Human Health .................................................................................1 Mercury in Food Fish: Complexities of the Problem .............................................................................................................2 Increasing Research and Management Efficiency................................................................................................................3 Mercury Databases Available through EMMMA .................................................................................................................3 Model Predictions Available through EMMMA....................................................................................................................4
The National Descriptive Model for Mercury in Fish........................................................................................................4 Enhanced Analysis of Geographic and Temporal Trends .................................................................................................5 Development of Fish Consumption Advisories .................................................................................................................8 Cost Savings to Agencies that Monitor Fish-tissue Mercury .........................................................................................10
Using EMMMA ....................................................................................................................................................................10
The EMMMA Data Mapper.............................................................................................................................................10 The EMMMA Graphing Tool............................................................................................................................................12
Next Steps for EMMMA......................................................................................................................................................12 References ...........................................................................................................................................................................13
Figures Figure 1. Comparison of geographic trends in observed fish-tissue mercury concentrations (a) that appear to emphasize concentration differences between samples collected in North Carolina (north of red line in 1a) and South Carolina (south of red line in 1a) and model-standardized fish-tissue mercury concentrations (b) that appear to show concentration differences between physiographic zones of southeastern United States...................................................................................................................................................6 Figure 2. Comparison of temporal trends identified from observed (a) and NDMMF standardized (b) fish-tissue mercury concentrations. ......................................................................................................................................7 Figure 3. Hypothetical fish consumption advisory developed using the predictions of the NDMMF and the EMMMA website. ...........................................................................................................................................................9 Figure 4. Many interactive mapping features are available through EMMMA’s data mapper (a) including point data display over topographic maps (b) and 1-meter-resolution aerial photography (c)..........................11

iv
Abbreviations
COALQUAL – National Coal Resources Data System Coal Quality Database
EMMMA – Environmental Mercury Mapping, Modeling, and Analysis website (http://emmma.usgs.gov)
MAS/MILS - Mineral Availability System/Mineral Industry Locator System
MDN – Mercury Deposition Network
NDMMF – National Descriptive Model of Mercury in Fish
NEI – National Emission Inventory
USGS – United States Geological Survey
USEPA – United States Environmental Protection Agency

1
EMMMA: A Web-based System for Environmental Mercury Mapping, Modeling, and Analysis
By Paul P. Hearn, Jr., Stephen P. Wente, David I. Donato, and John J. Aguinaldo
Abstract Mercury in our environment – in our air, water, soil, and especially our food – poses significant
hazards to human health, particularly for developing fetuses and young children. Because of the importance of this issue and the length of time it has been studied, large and complex data sets of mercury concentrations in various media and associated ancillary data have been generated by many Federal, State, Tribal, and local agencies. To facilitate efficient and effective use of these data in managing and mitigating human and wildlife exposure to mercury, the U.S. Geological Survey (USGS) and the National Institute of Environmental Health Sciences have developed a website for visualizing and studying the distribution of mercury in our environment. The Environmental Mercury Mapping, Modeling, and Analysis (EMMMA) website (http://emmma.usgs.gov) provides health and environmental researchers, managers, and other decision-makers the ability to:
• Interactively view and access a nationwide collection of environmental mercury data (fish tissue, atmospheric emissions and deposition, stream sediments, soils, and coal) and mercury-related data (mine locations);
• Interactively view and access predictions of the National Descriptive Model of Mercury in Fish (NDMMF) at 4,976 sites and 6,829 sampling events (events are unique combinations of site and sampling date) across the United States; and
• Use interactive mapping and graphing capabilities to visualize spatial and temporal trends and study relationships between mercury and other variables.
Background – Environmental Mercury as a Hazard to Human Health The world was shocked by the severity of the birth defects and community-wide illness seen
in the 1950s at Minimata Bay, Japan, in the first documented case of dramatic human illness resulting from an ongoing industrial release of mercury and the accumulation of that mercury in food fish (Tsubaki and Irukayama 1977). Subsequent studies have revealed dramatic adverse effects on fetal brain development resulting from exposure to relatively low levels of methylmercury in utero (Gilbert and Grant-Webster 1995). Today, researchers and public-health officials at all levels of government recognize that the most significant human exposure to environmental mercury occurs through the consumption of fish, and that the populations at greatest risk from exposure to methylmercury include developing fetuses and young children (USEPA 1997).

2
Mercury is typically released into the atmosphere from both natural and anthropogenic sources in its less toxic inorganic form (Mason et al. 1994). Natural sources of mercury include relatively continuous inputs from weathering (slow breakdown over time) of rock and soil particles as well as specific and often dramatic events such as volcanic eruptions and wildfires. Anthropogenic sources include coal-fired power plants, mining, and various industrial activities. Depending on the inorganic forms of the mercury released, mercury may be dispersed over scales that range from local to global (USEPA 1997). Eventually though, this mercury is deposited back to the earth’s surface. As long as the airborne or deposited mercury remains in a dispersed (low concentration) inorganic form, there is little chance for significant adverse health impacts. However, inorganic mercury, which is deposited directly or washed by rainwater into aquatic environments, can be converted into the more-toxic organic form of mercury – methylmercury (Ridley et al. 1977).
Although methylmercury typically occurs in very low concentrations in water, it accumulates into the lowest trophic levels of aquatic food chains (algae, bacteria, etc.) and subsequently biomagnifies as it passes through each step in the food chain (e.g., as insects eat algae, small fish eat insects, and so on). In this way large predator fish can have methylmercury concentrations that are a million times greater than the concentration in the water in which they live (Watras et al. 1994). It is the toxicity of methylmercury in conjunction with its ability to biomagnify through food chains that makes methylmercury in food fish such a potent health threat.
Mercury in Food Fish: Complexities of the Problem Managing the health threat of human exposure to mercury is complex because exposure
varies with many factors. The characteristics of the fish tissue consumed affect human and wildlife exposure because (1) different species at the same site accumulate different levels of mercury in their tissues (MacCrimmon et al. 1983; Suns et al. 1987; Cope et al. 1990; Kim and Burggraaf 1999), (2) different tissues in the same fish accumulate different levels of mercury (Giblin and Massaro 1973; Boudou and Ribeyre 1983; Harrison et al. 1990), and (3) individual fish accumulate more mercury as they grow (Wiener and Spry 1996; Huckabee et al. 1979). Different water bodies produce fish of differing mercury concentrations due to the amount of mercury reaching the water body, the ability of the individual water body to convert inorganic mercury to methylmercury, and the mass and trophic levels of the organisms residing in the water body throughout which the methylmercury is distributed (Wiener et al. 2002). When a fish is caught also affects its tissue concentration because mercury levels change over time due to the interaction of natural environmental factors and human controls (such as regulations on emissions). Finally, the frequency of consumption and amount of fish consumed determine that person’s long-term methylmercury exposure (USEPA 2000).
The abundant data on the distribution of mercury in various media and associated ancillary data should aid the management and mitigation of this health threat in a scientifically sound manner. However, major obstacles to using these data are that: the data are often stored at, and must be retrieved from, the agencies that originally collected the data; and the data are in various, and often incompatible, formats. Acquiring data, converting data sets into compatible formats, managing data, generating maps and graphs, and calibrating and interpreting models are time-consuming activities that often require individuals with specialized skills. For researchers and agency project managers working on tight budgets, the cost of these activities alone may make many mercury-related projects infeasible.

3
Increasing Research and Management Efficiency The EMMMA website was conceived as a tool for making mercury research and
management more efficient by providing access to mercury and mercury-related data sets as well as the predictions of the NDMMF. For example, using EMMMA, researchers can use interactive mapping and graphing tools to formulate hypotheses, evaluate the availability of data to test hypotheses, and generate maps and graphs for discussing and refining hypotheses with colleagues. Although EMMMA does not help with all phases of the research and management process, the site does produce maps and graphs of sufficient quality for internal agency issue papers and proposals. For producing external proposal submissions, sophisticated research applications, and preparation of final reports, data can be downloaded from EMMMA and imported into the user’s software.
Mercury Databases Available through EMMMA The EMMMA site provides access to a broad range of data related to the distribution of
mercury in the environment. These data can also be displayed using EMMMA’s interactive mapping functions. (Approximately 79% of the fish-tissue mercury records have associated geographic coordinates and therefore can be displayed on maps. All records in the other data sets have complete sets of geographic coordinates.) Included in the EMMMA site are the following data sets:
• Mercury in Fish Tissue – More than 45,000 fish-tissue mercury records were compiled from National, State and local agencies. To be suitable for use in the NDMMF, all records were required to have (1) a valid mercury concentration and species identifier; (2) a tissue type of whole fish, skin-on fillet, skin-off fillet, carcass, edible portion, eggs, liver, or viscera (samples identified only as ‘fillet’ were rejected); and (3) a length measurement that is appropriate for the sampled species.
• Mercury Emissions – Data for point-source emissions of mercury (~24,000 sites) were extracted from the U.S. Environmental Protection Agency's (USEPA) National Emission Inventory (NEI) database (1999 NEI Point-Source Facility Summary). All NEI data and documentation are available at: http://www.epa.gov/ttn/chief/net/1999inventory.html
• Mercury Deposition Network – The Mercury Deposition Network (MDN) is a network of monitoring stations included in the National Atmospheric Deposition Program (http://nadp.sws.uiuc.edu/mdn/). The EMMMA site contains a map file with locations of MDN monitoring sites and links to MDN data.
• Mercury in Stream Sediments and Soils – Data for stream sediments (~33,000 samples) and soils (~11,000 samples) were extracted from the USGS National Geochemical Survey Database. The complete database is accessible at: http://tin.er.usgs.gov/geochem/.
• Mercury and other Mines – Data for 1100 mercury mine locations were extracted from the USGS Mineral Availability System/Mineral Industry Locator System (MAS/MILS) database. The file available on the EMMMA site contains data from selected fields of five tables in the MAS/MILS database. A separate file containing all MAS/MILS mine locations (188,000 records) is also included because mercury occurs as an accessory component in many ore

4
deposits and has been widely used to refine gold ore. For more information see: http://tin.er.usgs.gov/mrds/
• Coal – Mercury data for ~7,200 samples of U.S. coals were extracted from USGS's National Coal Resources Data System Coal Quality Database (COALQUAL). For more information see: http://energy.er.usgs.gov/products/databases/CoalQual/intro.htm
Model Predictions Available through EMMMA EMMMA has the capability to present the predictions of models in a variety of formats, and
even allows comparison between a model’s predictions and the data to which the model was calibrated. Currently, EMMMA provides a web-enabled version of the NDMMF, described below, together with a variety of tools for on-the-fly generation of maps and graphs. This model is described in the next section and is used to illustrate many of the capabilities of EMMMA’s visualization tools in subsequent sections. However, EMMMA could be used to present the predictions of many other relevant models addressing the distribution and exposure effects of environmental toxic substances. In this sense, EMMMA should be thought of as infrastructure for providing access to, and visualization of, any model’s predictions and not as a set of tools that are tied to any particular model.
The National Descriptive Model for Mercury in Fish
The NDMMF is distinguished from other modeling approaches for estimating fish-tissue mercury concentrations in two major ways. First, the NDMMF is an empirically based, statistical model that is currently calibrated to, and validated by, a large data set of 45,605 measurements of fish-tissue mercury concentrations collected throughout the United States over the past 35 years (Wente 2004). Therefore, the NDMMF is very comprehensive in terms of its geographic breadth and temporal coverage as well as the diversity of sample characteristics (number of species, tissue types, and range of fish lengths) described by the model. Second, the NDMMF partitions or separates the variation in fish-tissue mercury concentrations in the calibration data set into concentration variation due to sample characteristics (species, tissue type, and length of fish) and spatiotemporal variation (concentration changes over location and time). This partitioning allows fish-tissue mercury concentrations to be validly estimated for combinations of fish characteristics that were not sampled at a particular site and time (sampling event) from the combinations of fish characteristics that were sampled. (Readers may view a detailed description of, and measures of accuracy for, the model at http://water.usgs.gov/pubs/sir/2004/5199/.)
To understand why the NDMMF is useful for interpreting fish-tissue mercury concentration data, it is important to understand what information is sought from this data and the physical and financial constraints on sampling programs. The information sought is the answers to three basic questions:
1. How do fish-tissue mercury concentrations vary spatially? Often this question is phrased as “which sites are most contaminated;” or “where should I or shouldn’t I fish?”
2. How do fish-tissue mercury concentrations vary temporally? This information is useful for environmental regulatory purposes and for determining when fish consumption advisories should be strengthened or relaxed.
3. Which fish (at a specific site and time) are safe to eat? This information is used for fish consumption advisories that provide consumers of wild-caught fish with advice for minimizing their exposure to toxic chemicals through the consumption of fish.

5
Answering questions 1 and 2, which require comparison of fish-tissue mercury concentrations from fish of similar characteristics (same species, length, etc.) across sampling events, is impeded by the difficulty of obtaining fish with similar characteristics during those sampling events. Answering question 3, which requires estimation of fish-tissue mercury concentrations across broad range of fish characteristics at each sampling event, is impeded by constraints on the number of fish-tissue mercury measurements (typically, 3 to 8) that can be collected at each sampling event.
Because the NDMMF can validly estimate fish-tissue mercury concentrations for a wide range of fish sample characteristics at each sampling event, this model can be used to answer all three questions at all sampling events. To answer questions 1 and 2, the model is used to predict a standardized (same species, tissue type and length) fish mercury concentration for each sampling event from the samples collected from each sampling event. Comparing standardized fish-tissue mercury concentrations for sampling events from a narrow range of time, but at different locations, depicts spatial variation in fish-tissue mercury concentrations. Similarly, comparing standardized fish-tissue mercury concentrations for sampling events from the same site, but on different dates, depicts the temporal trend at that site. To answer question 3, the model is used to predict fish tissue mercury concentrations across all of the fish characteristics (all species and full range of lengths) occurring at the site. Comparing these predicted fish-tissue mercury concentrations for a particular sampling event to established consumption advisory limits allows comprehensive advice on fish consumption to be given for a site, even for species, tissue types, and lengths of fish that were not sampled during the sampling event. Performing these tasks using the EMMMA website is illustrated in the following sections.
Enhanced Analysis of Geographic and Temporal Trends
Natural variations in fish-tissue mercury concentrations due to differences in species, tissue type, and length of fish may obscure significant spatial or temporal trends. By factoring out variation due to these variables (standardizing data), the NDMMF transforms the data into a form more suitable for spatial (geographic) and temporal analysis and for detection of trends that otherwise would not have been apparent.
Figure 1 shows the utility of the NDMMF and EMMMA for detection of geographic trends by comparing observed and model standardized fish-tissue mercury data from southeastern United States using maps generated with EMMMA’s data mapper. Figure 1a shows the observed fish-tissue mercury concentrations as reported. A cursory examination of these data shows what appears to be a large difference in fish-tissue mercury concentrations between the states of North and South Carolina. This difference likely reflects differences in the characteristics (species, tissue type, or fish length) of the fish selected for analysis in these two states rather than an environmental gradient in fish-tissue mercury concentrations. This hypothesis appears to be borne out in figure 1b, which shows the same data standardized to skin-off-fillet samples of 14-inch largemouth bass (Micropterus salmoides) across all of the sites shown in figure 1a using the NDMMF.

6
The geographic trend of standardized fish-tissue mercury concentrations suggest a pattern related to physiographic zones. High concentrations appear to occur in the coastal plain (south and east of solid red line in 1b) and possibly along the line of contact between the Blue Ridge (north and west of the dashed red line in 1b) and Piedmont (between the dashed and solid red lines in 1b) physiographic zones. Relatively lower concentrations appear to occur within the Blue Ridge and Piedmont zones. Being able to identify geographic trends in fish-tissue mercury concentrations as depicted in Figure 2b has important implications for future research (e.g., do other portions of the coastal plain show similar concentrations, do populations that consume large quantities of fish from the coastal plain have elevated blood or hair mercury levels, etc.) and management issues (e.g., tailoring fish consumption advice to physiographic zones, regulating coastal plain mercury emitters) in this region.
> 1.5 1.2 – 1.5 0.9 – 1.2 0.6 – 0.9 0.3 – 0.6
< 0.3
PPM Hg
b
a
Figure 1. Comparison of geographic trends in observed fish-tissue mercury concentrations (a) that appear to emphasize concentration differences between samples collected in North Carolina (north of red line in 1a) and South Carolina (south of red line in 1a) and model-standardized fish-tissue mercury concentrations (b) that appear to show concentration differences between physiographic zones of southeastern United States.
7
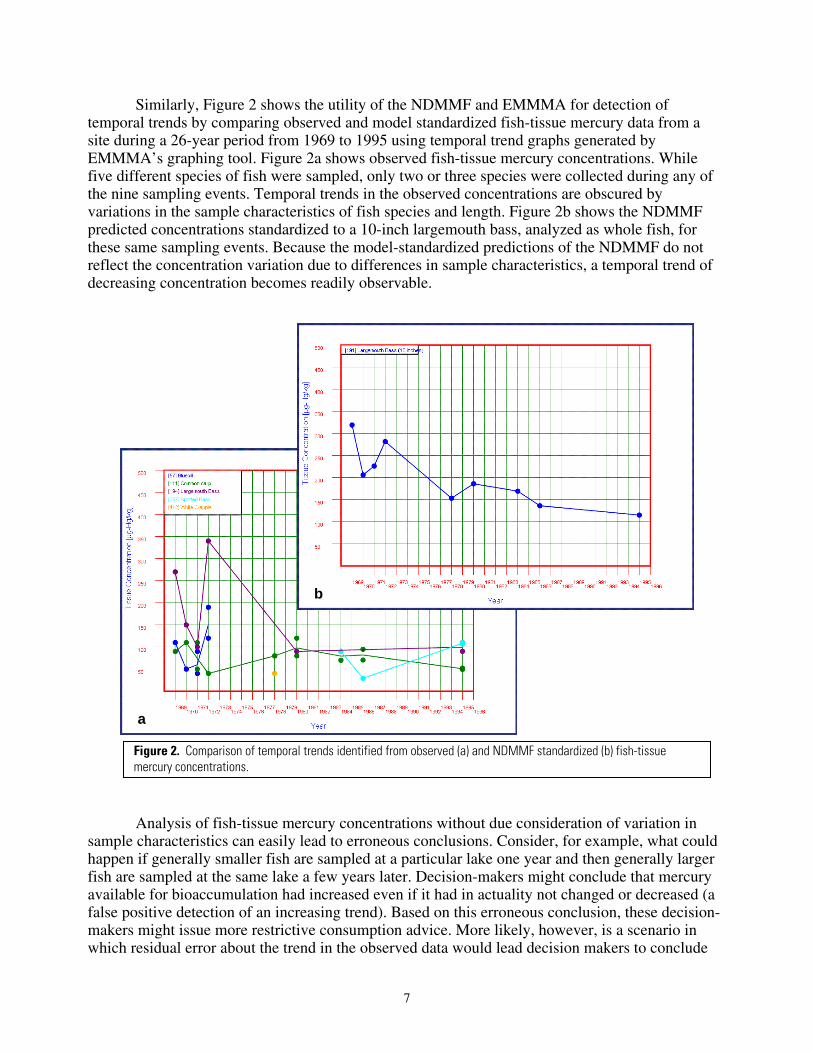
Similarly, Figure 2 shows the utility of the NDMMF and EMMMA for detection of temporal trends by comparing observed and model standardized fish-tissue mercury data from a site during a 26-year period from 1969 to 1995 using temporal trend graphs generated by EMMMA’s graphing tool. Figure 2a shows observed fish-tissue mercury concentrations. While five different species of fish were sampled, only two or three species were collected during any of the nine sampling events. Temporal trends in the observed concentrations are obscured by variations in the sample characteristics of fish species and length. Figure 2b shows the NDMMF predicted concentrations standardized to a 10-inch largemouth bass, analyzed as whole fish, for these same sampling events. Because the model-standardized predictions of the NDMMF do not reflect the concentration variation due to differences in sample characteristics, a temporal trend of decreasing concentration becomes readily observable.
Analysis of fish-tissue mercury concentrations without due consideration of variation in
sample characteristics can easily lead to erroneous conclusions. Consider, for example, what could happen if generally smaller fish are sampled at a particular lake one year and then generally larger fish are sampled at the same lake a few years later. Decision-makers might conclude that mercury available for bioaccumulation had increased even if it had in actuality not changed or decreased (a false positive detection of an increasing trend). Based on this erroneous conclusion, these decision-makers might issue more restrictive consumption advice. More likely, however, is a scenario in which residual error about the trend in the observed data would lead decision makers to conclude
b
a
Figure 2. Comparison of temporal trends identified from observed (a) and NDMMF standardized (b) fish-tissue mercury concentrations.

8
that no trend can be detected at sites where an increasing or decreasing trend may actually exist (a false negative result). By decreasing the amount of residual variation left unexplained by a trend line (i.e., factoring out the variation due to differences in fish size or other sample characteristics), use of the NDMMF should reduce the occurrence of both false positive and negative conclusions.
This same argument applies to the potential for misinterpreting geographic trends with the exception that comparison of fish from different sites typically will involve greater variation in sample characteristics than comparison of fish from the same site over time. Use of the NDMMF, therefore, should be of even greater benefit to detection of geographic trends than it is for detection of temporal trends.
As a final point about trend detection, trends that are not evaluated can not be detected. Without a tool like EMMMA, the first step in detecting a geographic or temporal trend, creating a map or temporal trend graph, can be a time consuming process. By greatly reducing the effort involved in completing this first step and providing access to the standardized fish-tissue mercury concentration predictions of the NDMMF, EMMMA greatly increases the likelihood that trends will be identified and accurately evaluated.
Development of Fish Consumption Advisories
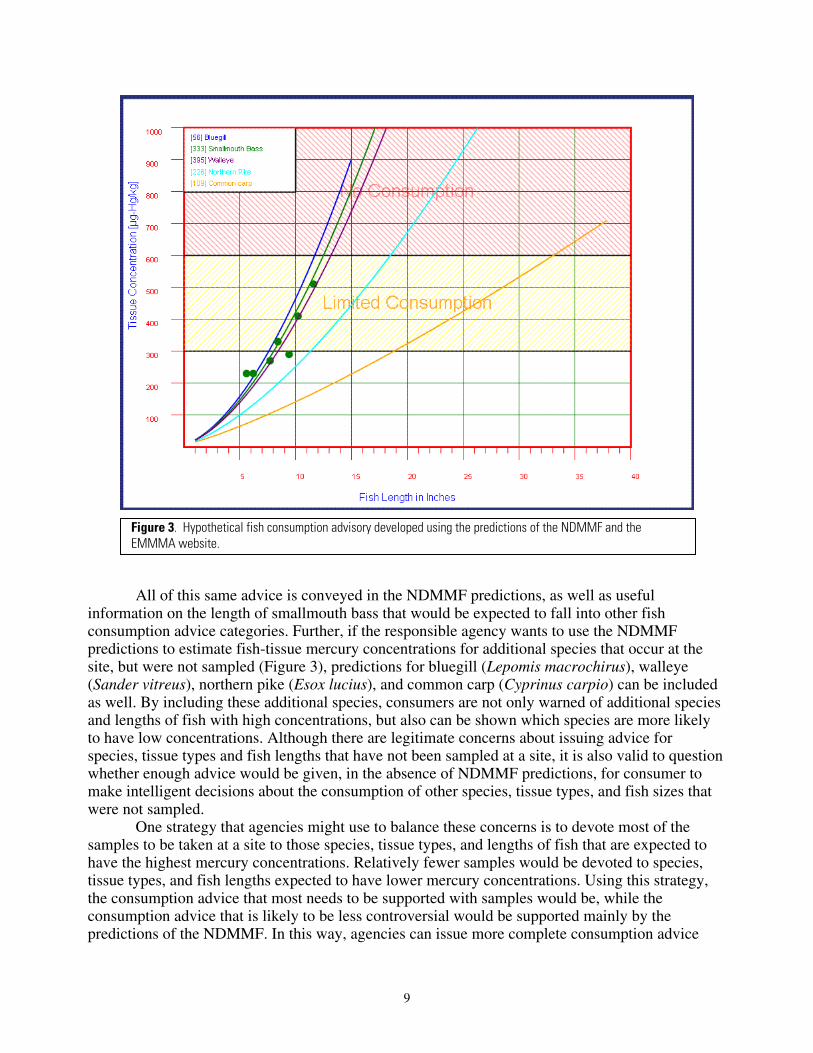
A key benefit of the NDMMF is its use as a decision-support tool for state and local fisheries managers charged with developing fish consumption advisories. This utility is demonstrated in Figure 3, which depicts both the observed and predicted fish-tissue mercury concentrations plotted over arbitrarily defined consumption advisory limits (these limits were arbitrarily chosen for demonstration purposes only and should not be construed as any kind of recommendation or endorsement of any particular consumption limits). For this sampling event, only seven fish-tissue mercury observations are available. Without using the predictions of the NDMMF, very little consumption advice could be given for this site. For smallmouth bass (Micropterus dolomieu), the responsible agency might recommend limited consumption for one size class (7 to 12 inches) and unlimited consumption for another size class (less than 7 inches). Additionally, general advice might be given for all sites encouraging fish consumers to avoid larger fish and possibly provide a list of species that tend to have lower fish-tissue mercury concentrations.
9
All of this same advice is conveyed in the NDMMF predictions, as well as useful information on the length of smallmouth bass that would be expected to fall into other fish consumption advice categories. Further, if the responsible agency wants to use the NDMMF predictions to estimate fish-tissue mercury concentrations for additional species that occur at the site, but were not sampled (Figure 3), predictions for bluegill (Lepomis macrochirus), walleye (Sander vitreus), northern pike (Esox lucius), and common carp (Cyprinus carpio) can be included as well. By including these additional species, consumers are not only warned of additional species and lengths of fish with high concentrations, but also can be shown which species are more likely to have low concentrations. Although there are legitimate concerns about issuing advice for species, tissue types and fish lengths that have not been sampled at a site, it is also valid to question whether enough advice would be given, in the absence of NDMMF predictions, for consumer to make intelligent decisions about the consumption of other species, tissue types, and fish sizes that were not sampled.
One strategy that agencies might use to balance these concerns is to devote most of the samples to be taken at a site to those species, tissue types, and lengths of fish that are expected to have the highest mercury concentrations. Relatively fewer samples would be devoted to species, tissue types, and fish lengths expected to have lower mercury concentrations. Using this strategy, the consumption advice that most needs to be supported with samples would be, while the consumption advice that is likely to be less controversial would be supported mainly by the predictions of the NDMMF. In this way, agencies can issue more complete consumption advice
Figure 3. Hypothetical fish consumption advisory developed using the predictions of the NDMMF and the EMMMA website.

10
without expanding their sampling programs and minimize the generation of controversial consumption advice.
Because each agency that issues fish consumption advice may reasonably come to different conclusions about issuing advice based on the NDMMF predictions, EMMMA is designed to offer enough flexibility so an agency can use EMMMA no matter how much or how little the NDMMF predictions are used to generate that agency’s advice. Agency personnel that have suggestions for modifications to the fish consumption advisory graphing tool to aid agencies in developing fish consumption advisories are encouraged to contact the corresponding author.
Cost Savings to Agencies that Monitor Fish-tissue Mercury
Using the NDMMF, Federal, State, Tribal, and local agencies can also reduce the cost of their fish-tissue sampling programs. Without the NDMMF, it may be necessary to catch and process specimens across a range of sizes for each important sport or commercial species at each location to be able to estimate current fish-tissue mercury levels. With the NDMMF, however, a smaller set of samples may be adequate to estimate mercury levels at each site, even for species, tissue types, and lengths of fish not sampled.
Using the NDMMF does not, of course, eliminate the need for ongoing sampling programs. The NDMMF does not predict fish-tissue mercury for any times and locations not sampled for fish. However, use of the NDMMF does allow a much wider range of species, tissue types, and fish lengths to be validly estimated from the samples that were collected. In this way, the agencies that sample fish for mercury can lower their analytical costs (by analyzing fewer samples) or sample a larger number of sites for the same cost (by spreading the same number of samples across more sites).
Those users who wish to have their fish-tissue data modeled using the NDMMF and displayed on EMMMA will need to submit those data in a specific format and contact the corresponding author for instructions and a data template. Many of the state fish-tissue mercury data sets that appear in EMMMA were obtained from USEPA’s National Listing of Fish and Wildlife Advisories database. Many data records in this data set were missing key data fields deemed necessary for inclusion in EMMMA. Federal, State, Tribal and local agency personnel and other researchers who have fish-tissue mercury data that does not appear in the EMMMA data mapper or appears to be erroneous in the EMMMA data files or mapper are also encouraged to contact the corresponding author.
Using EMMMA EMMMA is a relatively user friendly website which should not present difficulties to most
users. Two features, the data mapper and graphing tools, are discussed in the following sections to better show the breadth of EMMMA’s capabilities. In the future, it is anticipated that both the data mapper and graphing tools will obtain additional capabilities beyond those described here.
The EMMMA Data Mapper
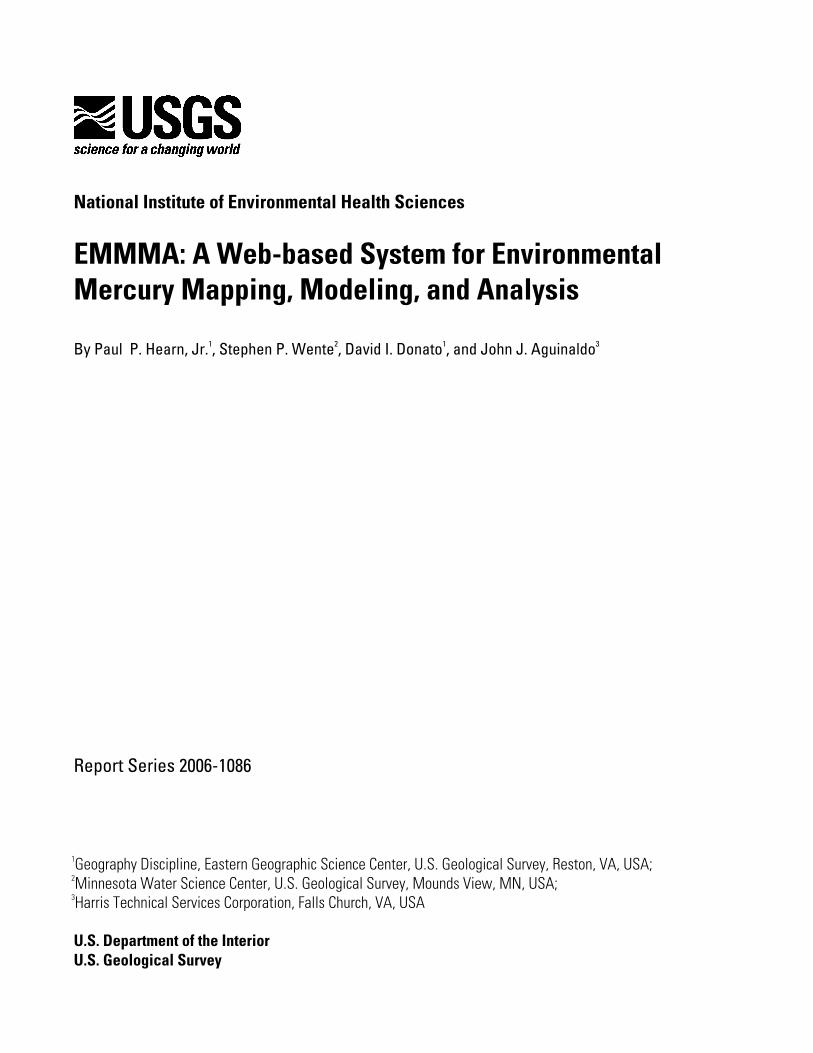
The data mapper is an online web mapping service that integrates mercury data with USGS maps, satellite images, aerial photographs, land-cover data, and other thematic data. Figure 4 uses data from the NEI to illustrate how the EMMMA data mapper displays data against a backdrop of USGS maps and images, and how the background images change with map scale. Figure 4a shows the distribution NEI data across the continental United States over a background of global land cover data and state boundaries. Figure 4b shows the location of an NEI emissions source, a coal-

11
fired power plant in eastern Tennessee, displayed against a USGS 1:100,000-scale topographic map. Zooming in further changes the map background to a larger-scale USGS 1:24,000-scale topographic map (not depicted). Zooming in even further changes the backdrop to a 1-meter-resolution aerial photograph (Figure 4c). Notice that the data point from the NEI database now appears in front of the power station. Although the data submitted to the NEI represent mercury emitted from the station’s smoke stacks, the map shows the agreement between coordinates in the NEI database and the background images is quite good. However, it is important to realize that all spatial data contain some degree of error in location and users need to make sure that the spatial accuracy of the data set is appropriate for the scale of map being generated (especially, when working at large scales such as Figure 4c).
Combining environmental mercury data with maps and other thematic data in a geographic
context facilitates the recognition of geographic trends and the formulation of preliminary hypotheses (i.e., Figure 1b). Multiple backgrounds (land use, hydrography, etc.) are available at any scale so that point data can be compared with many types of background data. Further, multiple point data sets can be combined such as NEI data and standardized fish-tissue mercury concentrations over various backgrounds. Additionally at any scale, individual records or groups of
a
b c
Figure 4. Many interactive mapping features are available through EMMMA’s data mapper (a) including point data display over topographic maps (b) and 1-meter-resolution aerial photography (c)

12
records may be located, selected, and downloaded as a zipped .dbf file from the EMMMA data mapper.
The EMMMA Graphing Tool
The graphing tool currently works with fish-tissue mercury data only and produces two basic types of graphs, temporal trend (Figure 2) and sampling event (Figure 3) graphs. Through the graphing tool, temporal trend and sampling event graphs can be created that display observed or NDMMF predicted concentrations for one or more species, tissue types, and lengths of fish. Display of observed data is restricted to those species sampled from a specific site for temporal trend graphs or sampling event for sampling event graphs. Display of NDMMF predictions is restricted to those species and tissue types in the NDMMF calibration data set (currently, 428 combinations of species and tissue type) for either type of graph. When creating graphs of NDMMF predictions, care should be taken to select species that are appropriate for the site or sampling event being graphed. Consumption advisory limits can be displayed as background as in Figure 4 for either type of graph. Only sampling event graphs allow observed and NDMMF predicted concentrations to be displayed on the same graph as in figure 3.
Next Steps for EMMMA
The approach taken in developing the EMMMA website for mercury is equally applicable to other environmental contaminants. It is true that specific contaminants are often unique with regard to their behavior in the environment, and require specific models and supporting data to characterize their distribution, transport, and human exposure vectors. Nonetheless, the general approach of Web-based integration of contaminant data with relevant thematic data, detailed maps, and online analytical tools is a flexible approach, and certainly one which can be customized to support studies of a wide range of contaminants.

13
References Boudou A, Ribeyre F. 1983. Contamination of aquatic biocenoses by mercury compounds— an
experimental ecotoxicological approach. in: Aquatic Toxicology (Nriagu JO, ed). New York:John Wiley and Sons, 73-116.
Cope WG, Wiener JG, Rada RG. 1990. Mercury accumulation in yellow perch in Wisconsin
seepage lakes—Relation to lake characteristics. Environ Toxicol Chem 9:931-940. Giblin FJ, Massaro EJ. 1973. Pharmacodynamics of methyl mercury in the rainbow trout (Salmo
gairdneri)—Tissue uptake, distribution and excretion. Toxicol Appl Pharmacol 24:81-91. Gilbert SG, Grant-Webster KS. 1995. Neurobehavioral effects of developmental methylmercury
exposure. Environ Health Perspect 103(Suppl. 6):135-142. Harrison SE, Klaverkamp JF, Hesslein RH. 1990. Fates of metal radiotracers added to a whole
lake—Accumulation in fathead minnow (Pimephales promelas) and lake trout (Salvelinus namaycush). Water Air Soil Pollut 52:277-293.
Huckabee JW, Elwood JW, Hildebrand SG. 1979. Accumulation of mercury in freshwater biota. in:
Biogeochemistry of Mercury in the Environment (Nriagu, J.O., ed). New York:Elsevier/North-Holland Biomedical Press, 277-302.
Kim JP, Burggraaf S. 1999. Mercury bioaccumulation in rainbow trout (Oncorhynchus mykiss) and
the trout food web in lakes Okareka, Okaro, Tarawera, Rotomahana and Rotorua, New Zealand. Water Air Soil Pollut 115:535-546.
MacCrimmon HR, Wren CD, Gots BL. 1983. Mercury uptake by lake trout, Salvelinus namaycush,
relative to age growth, and diet in Tadenac Lake with comparative data from other Precambrian Shield Lakes. Can J Fish Aquat Sci 40:114-120.
Mason RP, Fitzgerald WF, Morel, FMM. 1994. The biogeochemical cycling of elemental mercury:
anthropogenic influences. Geochim Cosmochim Acta 58:3191-3198. Ridley WP, Dizikes LJ, Wood JM. 1977. Biomethylation of toxic elements in the environment.
Science 197:329-330. Suns K, Hitchin G, Loescher B, Pastorek E, Pearce R. 1987. Metal accumulations in fishes from
Muskoka-Haliburton lakes in Ontario (1978-1984). Rexdale, Ontario:Ontario Ministry of the Environment.
Tsubaki T, Irukayama K, eds. 1977. Minamata Disease: Methylmercury Poisoning in Minamata
and Niigata, Japan. Amsterdam:Elsevier.