Embed Size (px)
Citation preview
DI
SC
US
SI
ON
P
AP
ER
S
ER
IE
S
Forschungsinstitut zur Zukunft der ArbeitInstitute for the Study of Labor
Employed and Unemployed Job Seekers:Are They Substitutes?
IZA DP No. 5827
June 2011
Simonetta LonghiMark Taylor
Employed and Unemployed Job Seekers:
Are They Substitutes?
Simonetta Longhi ISER, University of Essex
and IZA
Mark Taylor ISER, University of Essex
Discussion Paper No. 5827 June 2011
IZA
P.O. Box 7240 53072 Bonn
Germany
Phone: +49-228-3894-0 Fax: +49-228-3894-180
E-mail: [email protected]
Any opinions expressed here are those of the author(s) and not those of IZA. Research published in this series may include views on policy, but the institute itself takes no institutional policy positions. The Institute for the Study of Labor (IZA) in Bonn is a local and virtual international research center and a place of communication between science, politics and business. IZA is an independent nonprofit organization supported by Deutsche Post Foundation. The center is associated with the University of Bonn and offers a stimulating research environment through its international network, workshops and conferences, data service, project support, research visits and doctoral program. IZA engages in (i) original and internationally competitive research in all fields of labor economics, (ii) development of policy concepts, and (iii) dissemination of research results and concepts to the interested public. IZA Discussion Papers often represent preliminary work and are circulated to encourage discussion. Citation of such a paper should account for its provisional character. A revised version may be available directly from the author.
IZA Discussion Paper No. 5827 June 2011
ABSTRACT
Employed and Unemployed Job Seekers: Are They Substitutes?* The job search literature suggests that on-the-job search reduces the probability of unemployed people finding a job. However, there is no evidence that employed and unemployed job seekers are similar or apply for the same jobs. We combine the Labour Force Survey and the British Household Panel Survey to compare employed and unemployed job seekers in terms of individual characteristics, preferences over working hours, job-search strategies, and employment histories. We find substantial differences, which persist over the business cycle and remain after controlling for unobserved heterogeneity. We conclude that the unemployed do not directly compete with employed job seekers. JEL Classification: J29, J60 Keywords: on-the-job search, unemployment, job competition, employment histories,
panel data Corresponding author: Simonetta Longhi Institute for Social and Economic Research University of Essex Colchester Essex C04 3SQ United Kingdom E-mail: [email protected]
* This paper forms part of the project “Job search in the UK 1990-2006”, funded by the Leverhulme Trust Grant no. F/00 213/O; it also forms part of a programme of research funded by the Economic and Social Research Council through their grant to the Research Centre on Micro-social Change in ISER. The support provided by the ESRC and the University of Essex is gratefully acknowledged. LFS and BHPS data are available from the Data Archive at the University of Essex (www.data-archive.ac.uk).
1
INTRODUCTION
Workers move from job to job and into and out of employment as they attempt to maximise
their wages and find a suitable employer. According to job search theory, employed workers
seek better paying jobs while the unemployed seek jobs that offer wages exceeding their
reservation wage (Burdett and Mortensen 1998). Most models assume that job seekers are
homogeneous, with employed and unemployed job seekers differing only in their labour
market status and search intensity and effectiveness. However there is little empirical
evidence that employed and unemployed job seekers have similar observed characteristics,
which prompts the question of whether the employed and unemployed compete for the same
jobs. Our contribution to the literature is to compare the characteristics and behaviour of
employed and unemployed job seekers. If they are observationally different, then in contrast
to the assumptions made in the theoretical literature we cannot conclude that they directly
compete with each other for the same job vacancies, or that the experience and decisions of
one group will influence the outcomes of the other.
In models such as Burdett and Mortensen (1998) and van den Berg and Ridder
(1998), both employed and unemployed job seekers apply for the same jobs. As potential
employers cannot observe the productivity of job applicants, they may interpret previous or
current unemployment as a signal of low productivity. Hence, when receiving applications
from employed and unemployed job seekers, employers prefer job applicants who are
employed (Eriksson and Gottfries 2005). Consequently the presence of employed job seekers
should reduce the chances of unemployed people finding work (Rogerson et al. 2005).
The empirical literature supports the theoretical predictions that employers prefer
hiring applicants who are already in work (Eckstein and van den Berg 2007). Some authors
reach this conclusion by estimating matching functions using aggregate data on hirings and
flows out of unemployment (e.g. Anderson and Burgess 2000), with a higher proportion of
employed job seekers reducing the probability of unemployed people finding a job (Burgess
1993). Furthermore, Robson (2001) suggests that regional differences in outflows from
unemployment are related to differences in the competitiveness of unemployed compared to
employed job seekers. In this sense, employed and unemployed job seekers are seen as
substitutes.
Studies using micro-data also find that employed job seekers receive more job offers
than the unemployed (Blau and Robins 1990), although this is partly explained by differences
in individual characteristics (Eriksson and Lagerstrom 2006). Andrews et al. (2001) conclude
that employers rank job seekers by their labour market state, although the extent to which
2
employed and unemployed job seekers apply for the same vacancies is still not clear.
Pissarides and Wadsworth (1994) model the sequential decision of whether to search for a
job, followed by the decision of whether to search while employed or unemployed. They
compare employed people who search and who do not search, but do not assess differences
between employed and unemployed job seekers. By focusing on employers’ perceptions of
their job applicants, the recruiting literature suggests that there might be important
differences between unemployed and employed job applicants in terms of experience and
qualifications (e.g. Atkinson et al. 1996).
There is evidence that current employment is strongly related to past unemployment
even when allowing for observed and unobserved differences between individuals
(Arulampalam et al. 2000; Gregg 2001). Such unemployment persistence indicates that
employed and unemployed people have very different job and employment histories, which
need to be incorporated into comparisons of employed and unemployed job seekers.
Employed and unemployed job seekers may also differ in unobservable ways. For example,
the unemployed may be less flexible than employed job seekers in terms of the jobs they find
acceptable, either because they have higher reservation wages or because they have stricter
requirements in terms of other job characteristics (e.g. occupation, permanency, etc.).
The level of competition between employed and unemployed job seekers may also
vary over the business cycle. Empirical research tends to assume that on-the-job search falls
during recessions, and competition for jobs is more likely to come from the unemployed in
economic downturns than during periods of economic growth (Burgess 1993; Pissarides
1994). However, if employed and unemployed job seekers are different, there is no reason to
assume that unemployed people will be more negatively affected by the presence of
employed job seekers in periods of growth than in downturns. No single dataset allows
analysis of all these questions. The quarterly Labour Force Survey (LFS) directly identifies
employed workers engaging in on-the-job search, but has a very limited panel dimension.
The British Household Panel Survey (BHPS) contains a long panel element but does not ask
questions about on-the-job search activities. We use the quarterly LFS to identify (1)
observable factors associated with the probability that employees engage in on-the-job
search; and (2) whether employed and unemployed job seekers have similar individual
characteristics, preferences over working hours, and job-search strategies. We then combine
the quarterly LFS with the BHPS to identify (3) the impact of differences in past employment
histories on the employment status of job seekers and (4) to account for unobserved
individual-specific heterogeneity. Finally, we combine the quarterly and annual LFS to have
3
a sufficiently long time-series to analyse (5) differences between unemployed and employed
job seekers over the business cycle.
We find that unemployed and employed job seekers differ significantly in their
individual characteristics, past employment histories, preferences over working hours, and
job-search strategies, and that such differences persist over the business cycle. Our evidence
is consistent with a no-pay low-pay cycle where workers become locked in a sequence of
unemployment and low quality jobs. We conclude that in contrast to the assumptions made in
the theoretical literature, the unemployed are unlikely to directly compete with employed job
seekers.
I. THEORETICAL BACKGROUND
While many theoretical models of job search assume that employed and unemployed job
seekers are substitutes and apply to the same vacancies (e.g. Burdett and Mortensen 1998;
van den Berg and Ridder 1998) others indirectly suggest otherwise. For example Pissarides
(1994) characterises the labour market by ‘good’ and ‘bad’ jobs, where employed job seekers
only apply for and accept jobs that are better than their current one. The unemployed are
more likely to be hired in ‘bad’ jobs and to engage in on-the-job search after accepting the
‘bad’ job. Consequently ‘good’ jobs should be filled by employed people who do not engage
in on-the-job search, ‘bad’ jobs should be filled by employed people looking for a ‘good’ job,
and the unemployed should mostly apply to ‘bad’ jobs. Employed and unemployed job
seekers do not directly compete with each other, as they apply to different types of jobs.
There are other reasons why employed and unemployed job seekers may not directly
compete with each other. Unemployment is higher among people with low rather than high
education, and the probability of on-the-job search also varies with education (Pissarides and
Wadsworth 1994). If employed job seekers have high levels of education, while the
unemployed have low levels of education, they are unlikely to apply to the same vacancies.
Furthermore, the literature on unemployment persistence suggests that current employment is
strongly related to past unemployment (e.g. Arulampalam et al. 2000; Gregg 2001), even
when allowing for observed and unobserved differences between individuals. Hence,
unemployed and employed are also likely to have very different job and employment
histories. Furthermore, employed and unemployed job seekers may differ in other
unobservable ways, for example in terms of the jobs they find acceptable.
Less is known about characteristics of jobs sought, or search methods used. Van Ours
(1995) argues that employers introduce competition between employed and unemployed job
4
seekers by using different recruitment channels for the same vacancy, while Gorter et al.
(1993) and Lindeboom et al. (1994) find that the use of particular recruitment channels
reduces the probability that the vacancy is filled by an unemployed job applicant. Weber and
Mahringer (2008) find self-selection among job seekers in terms of search methods and that
the effectiveness of different methods is related to the labour market status of the job seeker.
Even when applying for the same jobs, if employed job seekers are preferred to the
unemployed because of, for example, more occupation-specific human capital (Rosholm and
Svarer 2004), differences in the quality of jobs obtained may be partly due to differences in
previous experience. Employers may interpret unemployment as a negative signal, thus partly
explaining differences in outcomes. Unemployed job seekers are recruited into low quality
jobs with a high rate of destruction, resulting in unstable employment trajectories and
repeated spells of unemployment (Böheim and Taylor 2002; Stewart 2007). However, there is
more scope to discriminate against the unemployed in periods of growth when unemployment
is low, while discrimination is harder in periods of recession when most job seekers are
unemployed. Also high-quality workers may lose their job during recessions, raising the
average quality of unemployed job seekers. If so we expect differences between employed
and unemployed job seekers to fall, and competition between them to increase, in periods of
recession. If only employed job seekers with the highest probability of finding a job search
during a recession, the average quality of employed job seekers will increase, and differences
between employed and unemployed job seekers will persist over the business cycle.
Employed and unemployed job seekers will then never directly compete with each other.
II. DATA
We use data from the LFS and the BHPS, each of which have strengths and weaknesses. In
particular, the LFS collects detailed information on job search behaviour by the employed
and unemployed, while the BHPS is a panel dataset that collects information on employment
histories.
The LFS is a nationally representative household survey which collects data on a large
number of individual and household characteristics, focussing in particular on employment
status, education, and job characteristics. It has been collected annually from 1984 to 1991
and quarterly since 1992.3 We use data up to the fourth quarter of 2009. The advantage of the
LFS is that it asks questions on job search to both employed and unemployed respondents.
3 Although LFS data were collected biannually between 1975 and 1983, we use only data from 1984 onwards as prior to 1984 unemployment was not defined according to the ILO standard.
5
This allows us to compare observed characteristics of employees who do and do not search
for a new job, as well as of employed and unemployed job seekers. Although there are
comparability issues between the annual and quarterly data, the questions on job search
activities were similar over time. However, fewer details about the type of job sought were
asked before 1992.
We define job seekers in the LFS as those who: (1) are looking for paid employment;
(2) have looked for work in the last four weeks; and (3) mention at least one method of job
search. We focus on men and women of working age (16–59/64) who are either employed or
unemployed. The self-employed, people in government training programs, unpaid family
workers and inactive people (about 6% of all job seekers), and the small proportion (less than
1%) of unemployed people who do not satisfy the three conditions are excluded from our
analysis. The quarterly LFS data have a rotating panel structure in which people are
interviewed for up to five successive quarters. To avoid repeated observations per individual,
in most models we only use data from the first interview within the quarterly panel structure
(to avoid problems of attrition); the exception is in models analysing the determinants of on-
the-job search for which we only use data from the fifth interview (when questions are asked
on wages).
The BHPS is a nationally representative panel of households living in the UK, in
which each household member is interviewed annually. The survey started in 1991 and the
most recent wave available to date refers to 2007. Our BHPS analysis also focuses on people
of working age (16–59/64) who are employed or unemployed. The BHPS has two advantages
over the LFS. Firstly it collects job and employment histories, allowing us to identify
differences in previous employment experiences between employed and unemployed job
seekers. It collects retrospective information on job and (un)employment spells that
individuals experience between two waves of data (or in the previous 12 months). We use
this to identify previous changes in occupation and unemployment and inactivity spells.
Secondly it is a panel dataset, allowing us to account for unobserved differences across
individuals in estimation. Although it includes a large quantity of information on individual,
household and job characteristics, like many datasets the BHPS collects data on job search
activity only from people who are currently unemployed.
As we do not directly observe job search among the employed in the BHPS, we use
information in the quarterly LFS to construct a model of job search which we use to predict
job search among employees in the BHPS. This step only uses job characteristics that are
available – and comparable – in both datasets. Current wages are likely to be key
6
determinants of engaging in on-the-job search and this is only available in the LFS from 1993
onwards. Therefore this part of our analysis is restricted to the period 1993–2007.
III. DESCRIPTIVE STATISTICS
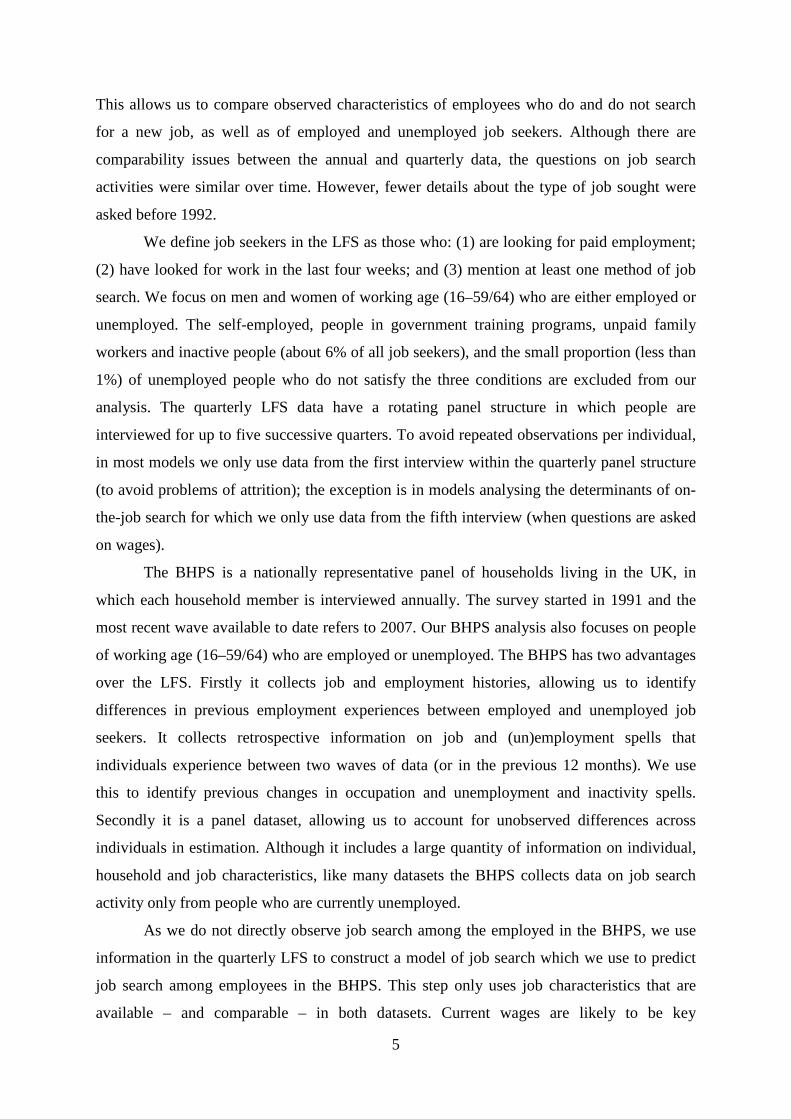
Figure 1 shows the proportion of employees in the LFS who are looking for a job. The right
panel shows the quarterly data, and the left shows the annual series, in which the 1992-2009
quarters are aggregated by calendar year. In a given year or quarter, between 5% and 7% of
employees engage in on-the-job search, consistent with Pissarides and Wadsworth (1994).
This proportion remains stable over time, and its variation does not coincide with the
business cycle. This casts doubt on the common assumption that on-the-job search increases
in periods of growth and falls in a recession (Mumford and Smith 1999; Anderson and
Burgess 2000).
FIGURE 1 ABOUT HERE
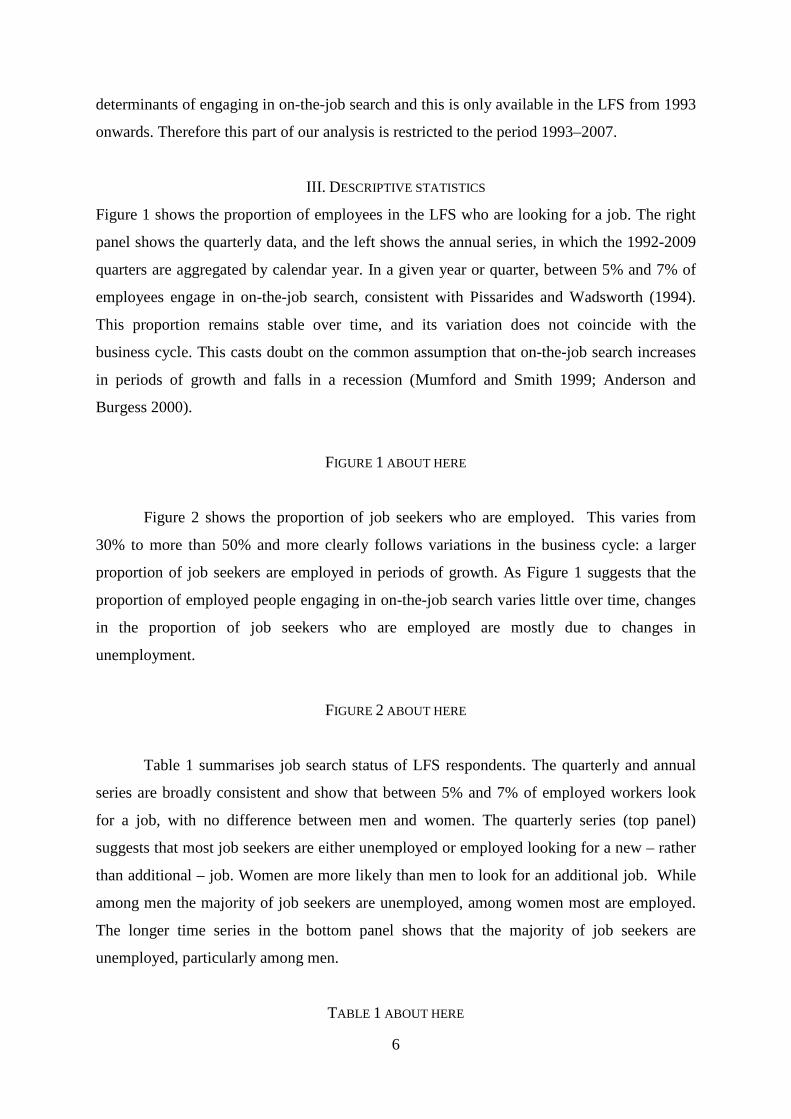
Figure 2 shows the proportion of job seekers who are employed. This varies from
30% to more than 50% and more clearly follows variations in the business cycle: a larger
proportion of job seekers are employed in periods of growth. As Figure 1 suggests that the
proportion of employed people engaging in on-the-job search varies little over time, changes
in the proportion of job seekers who are employed are mostly due to changes in
unemployment.
FIGURE 2 ABOUT HERE
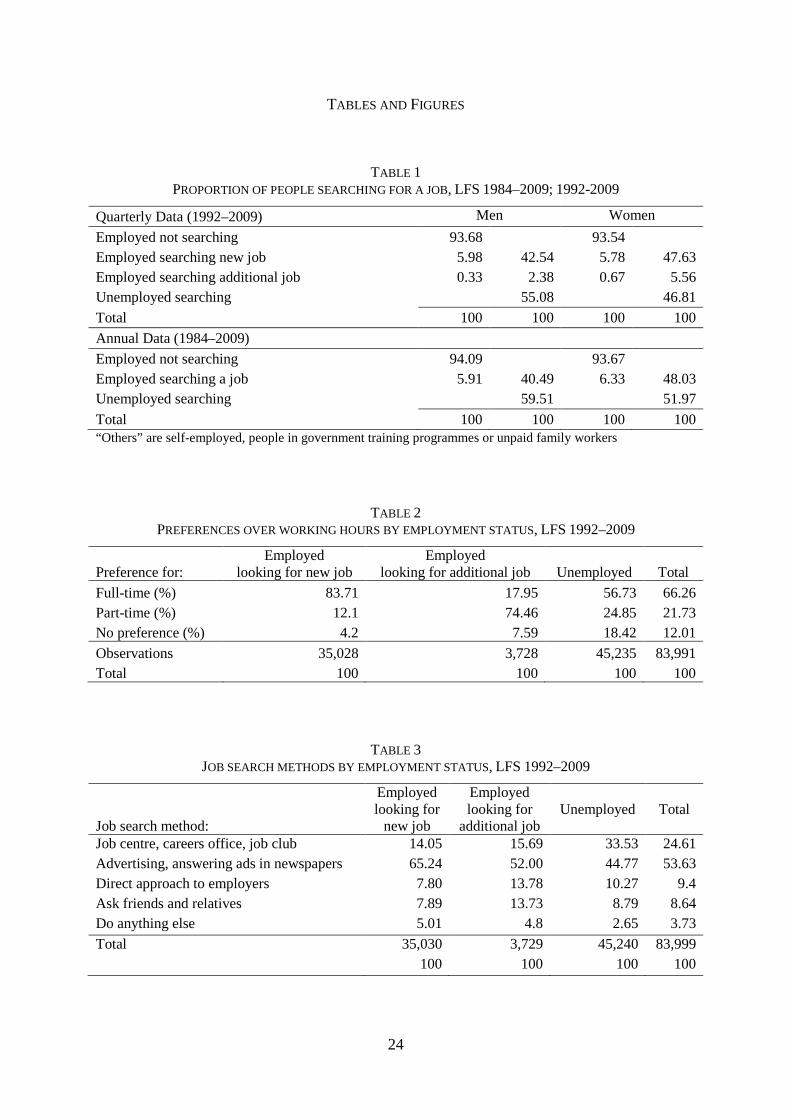
Table 1 summarises job search status of LFS respondents. The quarterly and annual
series are broadly consistent and show that between 5% and 7% of employed workers look
for a job, with no difference between men and women. The quarterly series (top panel)
suggests that most job seekers are either unemployed or employed looking for a new – rather
than additional – job. Women are more likely than men to look for an additional job. While
among men the majority of job seekers are unemployed, among women most are employed.
The longer time series in the bottom panel shows that the majority of job seekers are
unemployed, particularly among men.
TABLE 1 ABOUT HERE
7
Table 2 shows clear differences between types of job seekers in terms of preferences
over working hours. 84% of employed job seekers looking for a new job prefer a full-time
job, while 75% of prefer a part-time one. Among the unemployed, 25% prefer a part-time
job, 57% prefer a full-time job, while 18% are indifferent between the two.
TABLE 2 ABOUT HERE
Job seekers also differ in terms of the main job search method used. Responding to
advertisements is the main method of 65% of employed job seekers looking for a new job,
52% of employed job seekers looking for an additional job, and 45% of unemployed people.
A larger proportion of unemployed than employed job seekers use job centres, career offices,
and job clubs (34% compared with 15%). Direct approach to employers is used by 8% and
14% of employed job seekers looking for a new and additional job respectively; similar
proportions ask friends or relatives. Among the unemployed, about 10% directly approach
employers, while fewer than 9% ask friends or relatives.
TABLE 3 ABOUT HERE
These descriptives suggest differences between employed and unemployed job seekers in
terms of the type o job sought and search methods used, which we now investigate more
rigorously.
IV. MODELLING STRATEGY
Our estimation strategy involves six distinct steps. The first examines factors associated with
employees engaging in on-the-job search, while the second examines factors associated with
being an employed rather than an unemployed job seeker. In the third step we examine
whether employed and unemployed job seekers look for the same types of job (part- or full-
time), and use the same main method of search. These models are estimated using the
quarterly series of the LFS from 1992 to 2009.
We then analyse whether differences in observable characteristics between
unemployed and employed job seekers persist after controlling for employment histories and
unobserved individual-specific characteristics, which involves the combination of the BHPS
and LFS. Therefore the fourth step is to identify job seekers in the BHPS from models
8
estimated using LFS data, and the fifth is to use this information to model the employment
status of job seekers incorporating employment histories and unobserved individual-specific
characteristics. Finally, the sixth step is to establish whether or not these patterns vary over
the business cycle by combining the annual and quarterly LFS.
WHO SEARCHES ON THE JOB?
We first examine factors associated with employees engaging in on-the-job search. Pissarides
(1994) suggests that workers who engage in on-the-job search are in worse jobs, with lower
wages and less permanent positions than those who do not search. If so then differences
between employed and unemployed job seekers do not merely reflect differences between
employed and unemployed people in general. To analyse the determinants of searching on-
the-job we use a multinomial probit model conditional on being employed. We model, via the
latent variable *ity , the probability of employees being in one of three mutually exclusive
states j: 0 = not searching; 1 = searching for a new job; 2 = searching for an additional job:
ijijijjijiit PENEWXy εββββ ++++= 432'
1'* (1)
where ijε are i.i.d. and follow a multivariate normal distribution. The probability of
observing individual i in state q is the probability that yiq > yij for each j ≠ q.
Explanatory variables include both individual (Xi) and job (Wi) characteristics.
Individual characteristics include age, household structure and education. Job characteristics
include employment type (temporary or permanent), sector (private or public), occupation,
job tenure, wages and hours worked. The models also include two variables aggregated at the
regional level:4 the quarterly change in the number of employees in the region (NEi), and the
proportion of job seekers that are employed in the quarter and region (PEi). These capture
local labour market conditions which we expect to influence the decision to engage in on-the-
job search. Region, year and quarter identifiers are also included.
DIFFERENCES BETWEEN EMPLOYED AND UNEMPLOYED JOB SEEKERS
We analyse factors associated with being an employed rather than an unemployed job seeker
using a multinomial probit model conditional on search. We model the probability that the
job seeker is in one of three mutually exclusive states j: 1 = employed looking for a new job;
4 Regional variations are important, Robson (2001) suggests that regional differences in the outflow from unemployment are mostly due to differences in the relative competitiveness of unemployed job seekers rather than in regional variations in hirings.
9
2 = employed looking for an additional job; 3 = unemployed looking for a job; via the latent
variable *itz :
ijijjiit NEXz ξαα ++= 21'* (2)
where ξij are i.i.d. and follow a multivariate normal distribution. The probability of observing
individual i in status q is the probability that ziq > zij for each j ≠ q. Explanatory variables
include individual characteristics and the quarterly change in the number of employees in the
region.5
PREFERENCES AND SEARCH BEHAVIOUR OF EMPLOYED AND UNEMPLOYED JOB SEEKERS
If employed and unemployed job seekers have different job preferences they are unlikely to
directly compete for the same jobs. We investigate whether they have similar preferences in
terms of working hours using a multinomial probit model in which the dependent variable
distinguishes between three states: 1 = preference for a full-time job, 2 = preference for a
part-time job, or 3 = no preference, via the latent variable *ijp :
ijijijjiit AJNJXp ηγγγ +++= 321'* (3)
where ηij are i.i.d. and follow a multivariate normal distribution. The probability of observing
individual i having preference q is the probability that piq > pij for each j ≠ q. Explanatory
variables include the individual characteristics. Differences between job seekers are captured
using variables identifying whether a respondent is employed looking for a new job (NJi) or
employed looking for an additional job (AJi), with unemployed being the reference group.
A similar model is used to identify whether employed and unemployed job seekers
use the same search methods. If they use different methods which have different levels of
effectiveness, those using the least effective method will be disadvantaged in their job search.
Alternatively, if different types of jobs are advertised using different methods, the choice of
search method might be related to the type of job sought. Our dependent variable
distinguishes between five search methods: 1 = job centre, careers office or private
employment agency; 2 = direct approach to employers; 3 = ask friends and relatives;
4 = do anything else; with 5 = advertising and answering adverts in newspapers etc. as the
reference group.6 This is modelled via the latent variable *ijm :
5 Since we are not interested in the outcome of the search, search intensity is not relevant in this context. 6 Using the internet to search for a job is not one of the possible options. It is likely that people using the internet classify this as ‘advertising and answering adverts in newspapers’ or in the group ‘do anything else’.
10
ijijijjiit AJNJXm µδδδ +++= 321'* (4)
where µij are i.i.d. and follow a multivariate normal distribution. The probability of observing
individual i using search method q is the probability that miq >mij for each j ≠ q.
IDENTIFYING EMPLOYED JOB SEEKERS IN THE BHPS
We next incorporate employment histories and individual-specific unobserved effects into
our analysis using BHPS data. Employed job seekers are not directly identified in the BHPS.
Therefore we predict who among employed BHPS respondents are most likely to engage in
on-the-job search using models estimated on LFS data from 1993 to 2009. Given the random,
nationally representative nature of both data sets, it seems reasonable to assume that the
relationship between on-the-job search and job characteristics estimated using the LFS
sample can also be applied to respondents in the BHPS sample. We estimate a probit model
for engaging in on-the-job search similar to equation (1) using the LFS sample. The
dependent variable distinguishes between employed people not searching and employed
people searching for a new job. Explanatory variables that are available and comparable in
both datasets include whether the job is temporary, part-time, in the public sector, occupation
dummies, job tenure, weekly earnings, and hours of work.7 The model also includes the
proportion of job seekers who are employed by quarter and region to capture local labour
market conditions. Region, year and quarter identifiers are also included.
We use estimates from this model to predict the probability that each employed
respondent in the BHPS engages in on-the-job search. As shown in Figure 1, about 6% of
employees engage in on-the-job search and this varies little over the business cycle.
Therefore for each year we identify employed job seekers in the BHPS as those 6% of
respondents with the highest probability of engaging in on-the-job search.
THE IMPACT OF EMPLOYMENT HISTORIES ON JOB SEARCH
Having identified the group of employed job seekers in the BHPS, we next examine the
impact of past employment histories on the probability of being an unemployed rather than an
employed job seeker. We account for individual unobserved heterogeneity by estimating a
random effects logit model, and relax the typical (and restrictive) assumption of
independence between observed characteristics and unobservables by including within-
7 Sensitivity analyses show that excluding individual characteristics from the model does not reduce its predictive power. While job tenure is likely to be endogenous, we use this purely to identify BHPS respondents most likely to engage in on-the-job rather than to identify causal effects.
11
individual means of the time-varying covariates (Mundlak 1978). We model the probability
that the job seeker is unemployed (j =1) rather than employed (j = 0) at time t via the latent
variable *itU :
itiiitit vuxxU +++= γβ ''* (5)
where *itU denotes the unobservable propensity for the job seeker to be unemployed at time t,
and x is a vector of observable characteristics that influence *itU . A job seeker is observed in
unemployment when his/her propensity to be unemployed is greater than zero. ix refers to
the vector of individual means of time-varying covariates over time, iu denotes the
individual-specific unobservable effects and v is a random error, which is i.i.d. and follows a
logistic distribution. Explanatory variables in x include age, household structure and
education, region and year identifiers, plus a set of variables summarising the previous
(un)employment and job history of the job seeker. These capture whether or not the job
seeker had an unemployment or inactivity spell in the previous 12 months (distinguishing
between spells that were shorter and longer than 3 months), variables capturing earlier
unemployment or inactivity spells that lasted longer than three months; and recent and earlier
occupational change.
We identify BHPS respondents engaging in on-the-job search with error. At the
extreme none of the employees we identify as job seekers will engage in on-the-job search,
and our models would compare employment histories of employed and unemployed people.
Therefore differences between employed and unemployed job seekers may be overestimated
if employed job seekers are more similar than the employed who do not search to
unemployed people. We check the robustness of our results to different definitions of
employed job seekers, one of which identifies job seekers within the BHPS as people who
move from job to job within the following 12 months without an intervening employment
interruption (and who therefore must have engaged in some form of on-the-job search).
DIFFERENCES OVER THE BUSINESS CYCLE
Finally, to estimate whether differences between employed and unemployed job seekers vary
over the business cycle, we combine the annual and the quarterly series of the LFS by
grouping the quarterly data into years and keeping one observation per individual. We then
re-estimate equations (2) and (4) separately for periods when unemployment rates were
increasing and decreasing. This allows us to identify whether the unemployment stock is
12
more similar to that of employed job seekers in economic downtowns than in periods of
economic growth. Periods of increasing unemployment include 1984, 1991, 1992, 1993, and
the years between 2005 and 2009; all other years are classified as periods of falling
unemployment.8 Model specifications differ slightly from those described previously because
of inconsistencies over time in data availability.
V. EMPIRICAL RESULTS
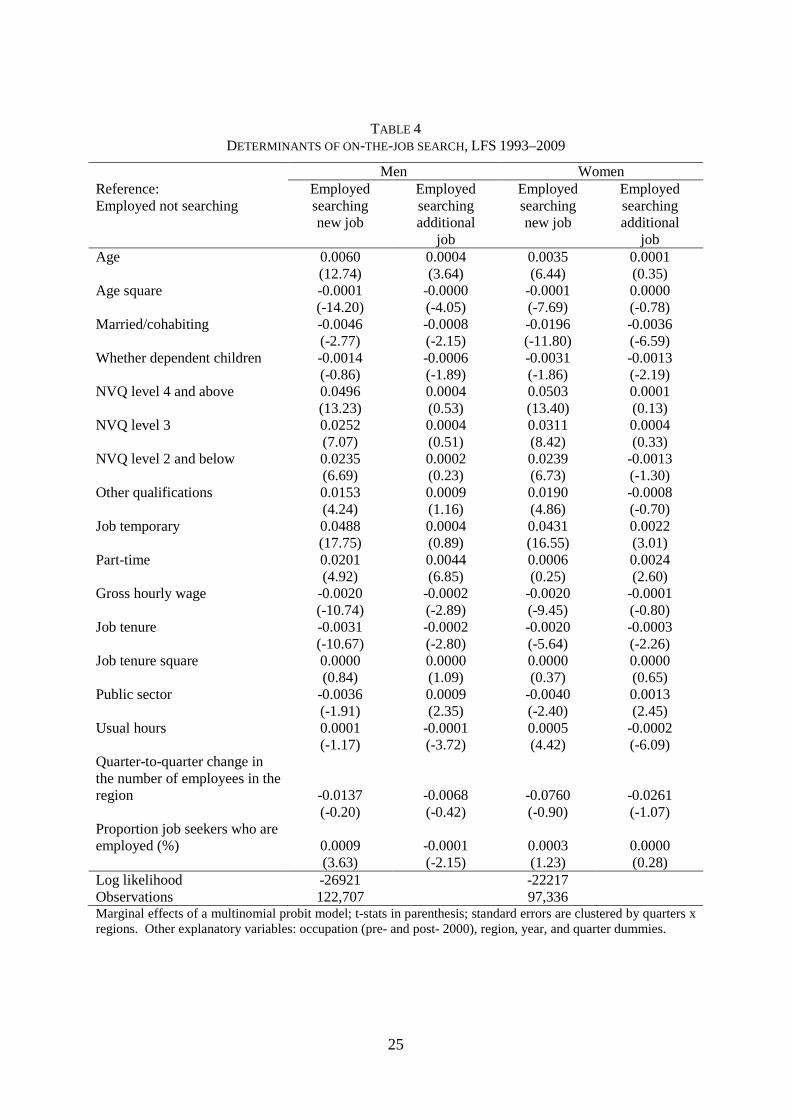
DETERMINANTS OF ON-THE-JOB SEARCH
Table 4 presents results from models of the determinants of being an employed job seeker
(equation (1)), estimated separately for men and women using LFS data from 1993–2009.
Consistent with the literature, the probability of engaging in on-the-job search falls with
wages and job tenure. Earning £10 more per hour is associated with a reduction of two
percentage points in the probability of engaging in on-the-job search. Ten more years of job
tenure reduces the probability by three percentage points for men and two percentage points
for women. On-the-job search is also more likely among older workers (although this
relationship is non-linear). Married women are two percentage points less likely than single
women to look for a new job, and 0.4 percentage points less likely to look for an additional
job, but marriage reduces these probabilities by only 0.5 and 0.08 percentage points for men.
Dependent children reduce on-the-job search but only for women. For both men and women,
the probability of looking for a new (but not an additional) job increases with education.
TABLE 4 ABOUT HERE
Having a temporary job increases the probability of looking for a new job by between
four and five percentage points, while men in part-time jobs are more likely than those in
full-time jobs to look for a new or additional job. This suggests that the part-time job is
unsatisfactory in terms of labour supply preferences, and is consistent with non-standard
8 We also estimated the models separately for periods with high or low – rather than increasing or decreasing – unemployment. If we use as a threshold an unemployment rate of 7%, then we classify the years between 1998 and 2008 as periods of low unemployment, and all the remaining years (from 1984 to 1997, plus 2009) as periods of high unemployment. The results are not sensitive to such changes in the definition of business cycles. It can also be argued that the most recent recession is essentially different from previous ones as it is the first in which the UK has a flexible labour market. We have estimated the models using the quarterly data, and excluding previous recessions. Here the period of decreasing unemployment runs from the first quarter of 1994 to the second quarter of 2005, while the period of increasing unemployment runs from the third quarter of 2005 to the most recent quarter. Again, the estimated regression coefficients change only marginally from those presented.
13
forms of employment such as part-time and temporary jobs being ‘bad’ jobs (McGovern et al.
2004). Workers may accept part-time jobs to escape unemployment, even though they
preferred a full-time job.9
Public sector employees are less likely than those in the private sector to look for a
new job but more likely to look for an additional job. Working more hours is associated with
a lower probability of looking for an additional job and, for women, a higher probability of
looking for a new job. The probability of on-the-job search is independent of total
employment, although more (fewer) men look for a new (additional) job when a larger
proportion of job seekers are employed.
These results suggest that, consistent with theory, workers engaging in on-the-job
search are in worse jobs than those not searching. They have lower wages and are more likely
to be in temporary or part-time work.10
FACTORS ASSOCIATED WITH THE EMPLOYMENT STATUS OF JOB SEEKERS
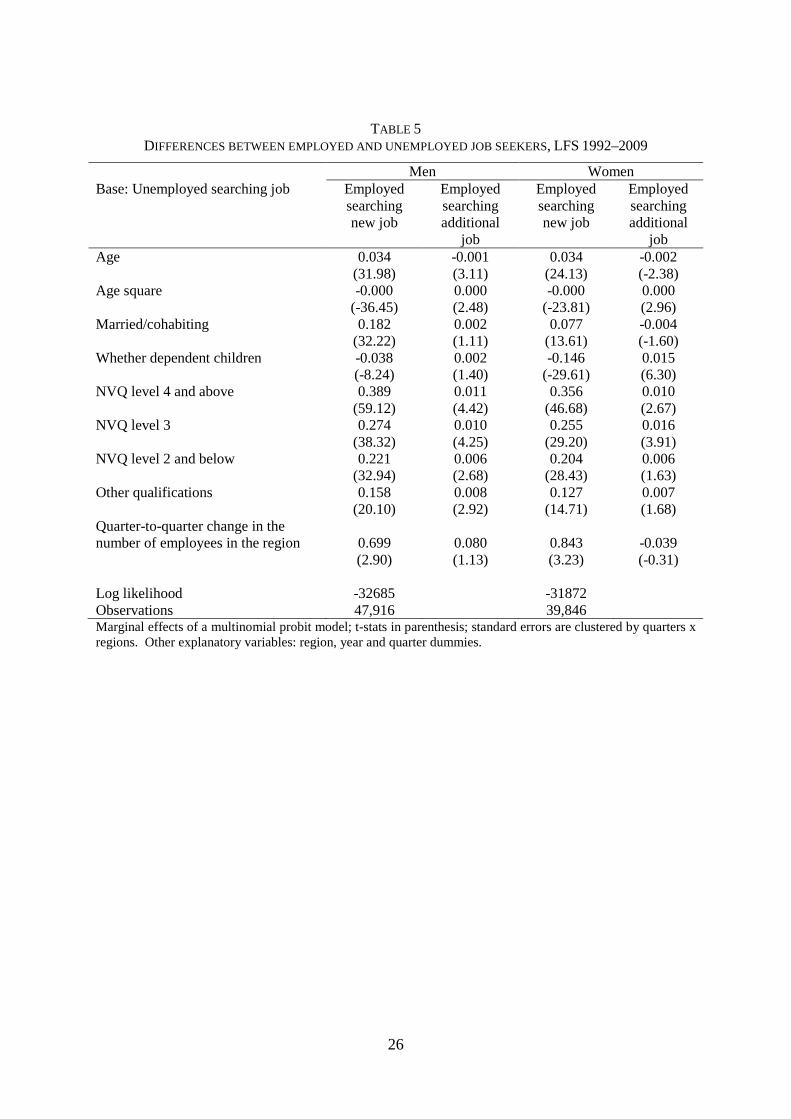
Table 5 presents estimates of factors associated with being an employed rather than an
unemployed job seeker (equation (2)). The results show that the unemployed are on average
younger than employed job seekers looking for a new job, although the relationship is non-
linear. The probability of being an employed rather than an unemployed job seeker is higher
if married (by 18 percentage points for men and 8 percentage points for women), and
increases with education (by up to 40 percentage points). The latter is consistent with studies
of recruitment behaviour, which find that one of the reasons why the unemployed do not get a
particular job is that they do not meet the job requirements in terms of qualification and
experience levels (e.g. Gorter et al. 1993; Behrenz 2001). Dependent children reduce the
probability of being an employed job seeker by 15 percentage points for women. These
factors have a larger impact on the probability of being an employee searching for a new
rather than an additional job relative to being unemployed. In terms of education, for
example, men with the highest levels of education (NVQ level 4 and above) are 39
percentage points more likely to be employed and looking for a new job rather than
9 Descriptive statistics from the LFS are consistent with this: 18% of unemployed people who were looking for a full-time job accepted a part-time job, while 12% of those looking for a part-time job accepted a full-time job. Less than 10% of job-to-job movers were looking for full-time work but accepted a part-time job, while 19% of those looking for a part-time job accepted a full-time job. 10 Results in Table 4 are robust to changes in model specification. For example excluding job tenure (which is potentially endogenous) has only a small impact on the estimated coefficients. Using a one quarter lag of the proportion of job seekers who are employed, or excluding the variable altogether, has no impact on the estimates.
14
unemployed than those with no qualifications, and women 36 percentage points more likely.
However they are just one percentage point more likely to be employees looking for an
additional job rather than unemployed.
TABLE 5 ABOUT HERE
PREFERENCES IN WORKING HOURS
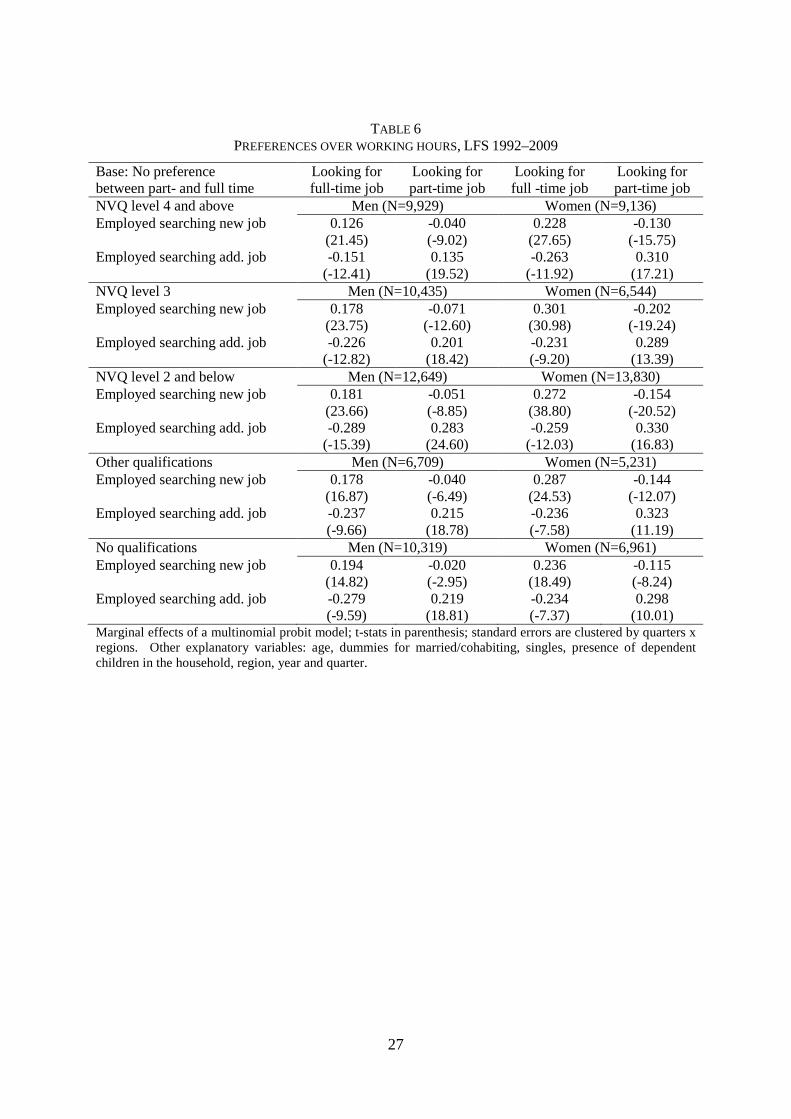
Table 6 presents results from modelling the impact of being an employed and unemployed
job seeker on preferences over working hours (equation (3)). Since education has a large
impact on the employment status of job seekers, we estimate models of work hour
preferences (and of search methods used) separately by education. For brevity, we only
present the marginal effects on the variables of interest, which identify the type of job seeker.
The estimated effects are similar across levels of education. Employees looking for a
new job have a strong preference for full-time jobs, such men are between 13 and 19
percentage points more likely than unemployed men to prefer a full-time job (25–30
percentage points among women). In contrast employees looking for an additional job are
more likely than unemployed job seekers to prefer a part-time job, and less likely to prefer a
full-time job. Being unemployed increases the probability of having no preference between
part- and full-time jobs (the reference category), which suggests that the unemployed may be
more likely than employees to apply for and accept ‘bad’ jobs, and therefore not be in direct
competition.11
TABLE 6 ABOUT HERE
Descriptive statistics on job-to-job transitions from the LFS provide further support
for this conclusion. The unemployed are more likely than job-to-job movers to enter a
temporary or a part-time job (34% for a temporary and 41% for a part-time job compared
with 23% and 20%). They are also more likely to engage in on-the-job search in the new job
(15% compared with 8.5%). This is in line with Booth et al. (2002) who find that, though
undesirable, temporary jobs are stepping stones to better jobs.
11 We have investigated if these differences vary with length of search. Adding interaction terms between search duration and the type of job seeker shows no clear pattern. (These results are available from the authors on request.) This is cross-sectional data and so we are unable to disentangle whether differences between people who search for different lengths of time are due to adaptation to circumstances or are the results of self-selection.
15
DIFFERENCES IN JOB SEARCH METHODS
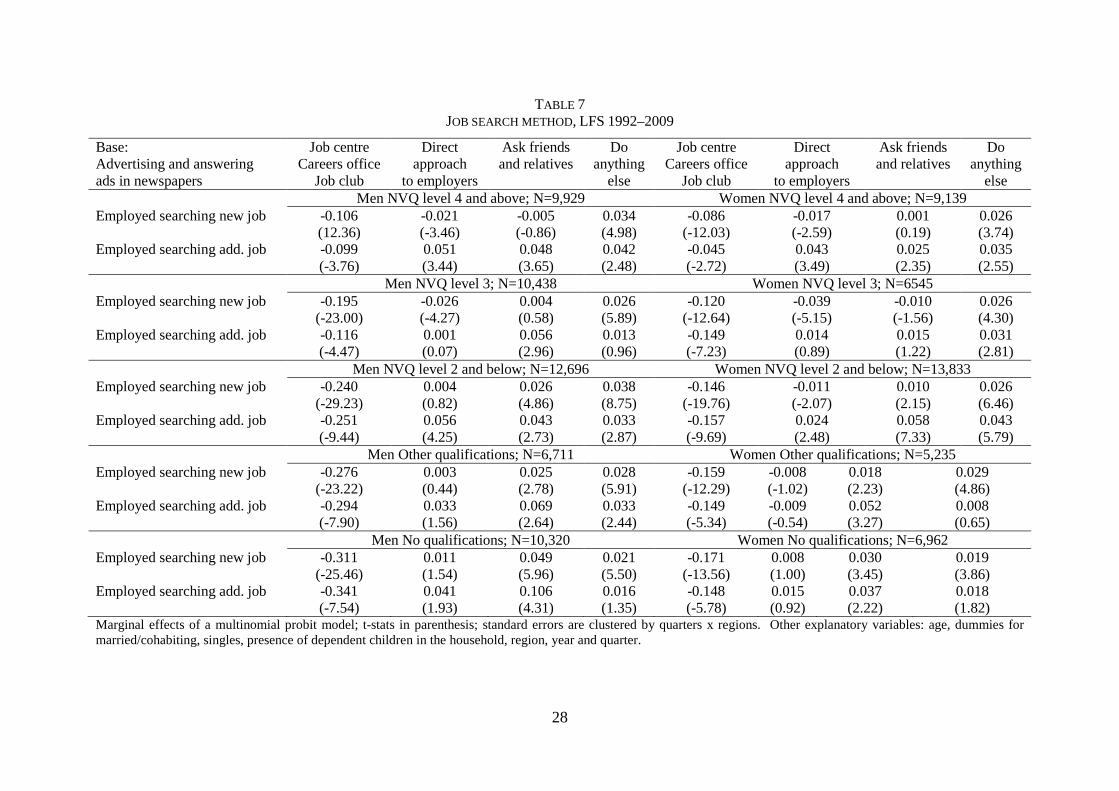
Table 7 shows the impact of being an employed rather than unemployed job seeker on the
main search method used, again estimated separately by education level. Results indicate that
employed job seekers are less likely than the unemployed to use job centres, career offices or
job clubs. However these differences are smaller for more highly educated job seekers (with
at least NVQ Level 4) than for less educated job seekers (10 percentage points for men and
women with the highest education compared to 30 percentage points for men and 15-20
percentage points for women with no education). Among highly educated job seekers, the
employed looking for an additional job are more likely than the unemployed to directly
approach potential employers, ask friends and relatives, and do ‘anything else’. Although we
have no information on search intensity, this suggests that unemployed people rely more on
employment agencies and formal job search channels rather than engaging in proactive job
search behaviour.
These estimates also suggest that differences in search methods used by employed and
unemployed job seekers are smaller for women than for men, thus indicating that direct
competition between employed and unemployed job seekers is higher for women than men.
TABLE 7 ABOUT HERE
INTRODUCING EMPLOYMENT HISTORIES AND UNOBSERVED INDIVIDUAL-SPECIFIC EFFECTS
We now extend the analysis to introduce previous employment experiences and unobserved
individual-specific effects. The first stage is to identify employed job seekers in the BHPS by
estimating models of on-the-job search using LFS data and applying the estimated
coefficients to BHPS respondents. The impact of job characteristics on the probability of
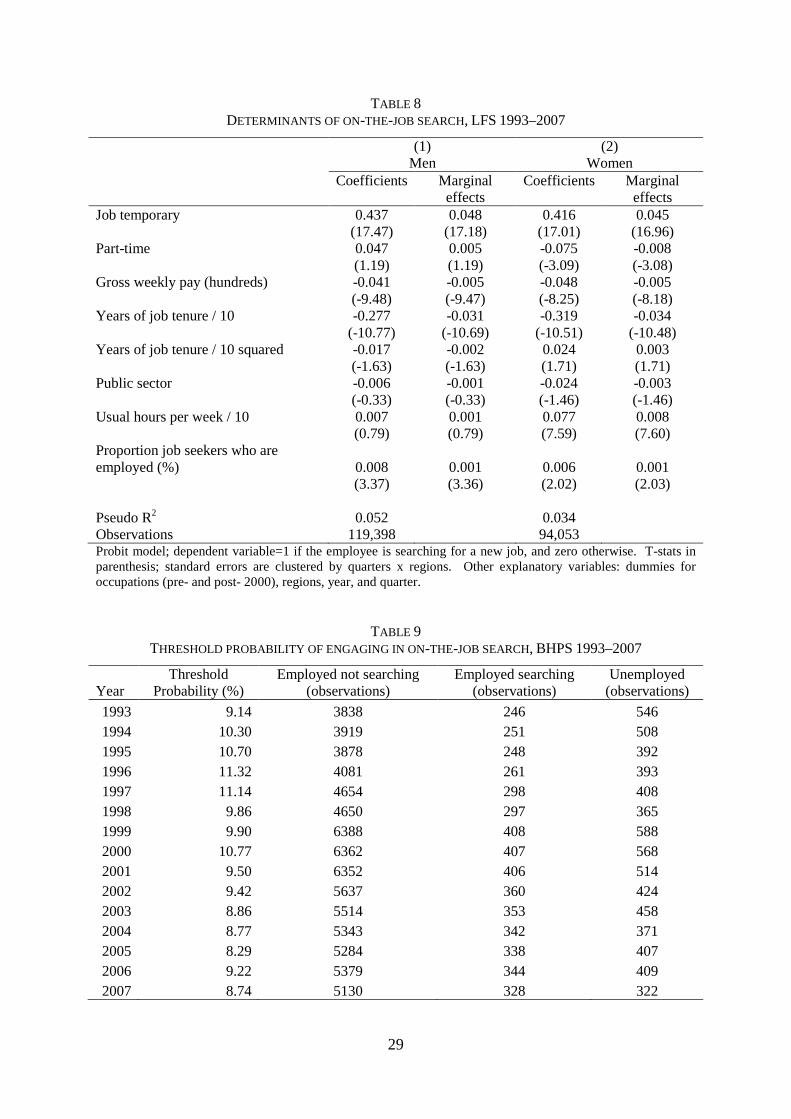
engaging in on the-job search, estimated using the LFS, is shown in Table 8. These are
largely consistent with those in Table 4, and for brevity are not discussed here.12
TABLE 8 ABOUT HERE
We use these estimated coefficients to predict who among employed BHPS
respondents are most likely to engage in on-the-job search. The individual probability of
12 The only notable difference between Tables 4 and 8 is that the impact of part-time shifts from positive to zero for men and from zero to negative for women.
16
engaging in on-the-job search varies over time, not only because of potential changes in the
characteristics of the job but also because of the macroeconomic climate captured in the
model by year and quarter identifiers and the proportion of job seekers who are employed by
quarter and region.
The predicted probabilities of BHPS respondents engaging in on-the-job search range
from almost zero to a maximum of 27%, with a median of 4.5% (Figure 3). Such low
predicted probabilities are not surprising, given that the LFS data indicate that only 6% of
employed people engage in on-the-job search. For each year of BHPS data we rank men and
women according to their predicted probability of being an employed job seeker, and
categorise as employed job seekers the 6% of employees with the highest probability. Hence
the threshold probability used to identify employed job seekers varies by year, and ranges
from 8% to 11%. Table 9 shows how the threshold probability varies over time, and the
corresponding BHPS sample sizes.
FIGURE 3 ABOUT HERE
TABLE 9 ABOUT HERE
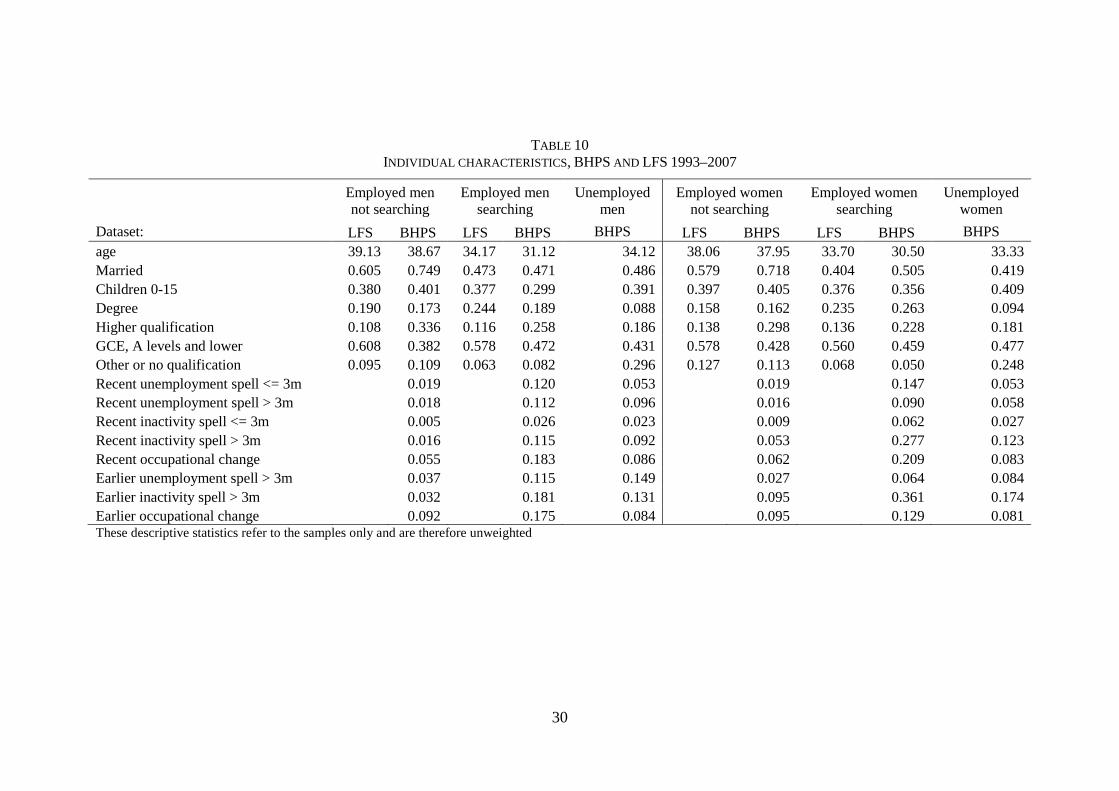
Table 10 compares individual characteristics of employees searching and not
searching in the LFS with employees in the BHPS that we define as searching and not
searching. For comparison the characteristics of the unemployed in the BHPS are also
included. The average characteristics of men and women identified as employed job seekers
and non-seekers in the two surveys are similar. For example employed job seekers are on
average younger than non-seekers and are less likely to be married. They are also better
educated. Table 10 also indicates that in the BHPS sample unemployed people have lower
levels of education than employed people; this is especially true for men.
TABLE 10 ABOUT HERE
In this table we also make an initial comparison of previous experiences of
unemployment and economic inactivity between employed and unemployed job seekers and
employed people who do not engage in on-the-job search using BHPS data. This indicates
that employed job seekers are more likely to have experienced unemployment or inactivity
17
spells in the previous 12 months; these spells have also been longer.13 Employed job seekers
are also more likely to have had occupational changes in the past, perhaps indicating a less
stable employment trajectory. The unemployed are more likely than the others to have
experienced earlier unemployment spells, and less likely to have experienced previous
occupational changes, and have employment histories that are between those of employed
people not searching and employed people searching for a new job.
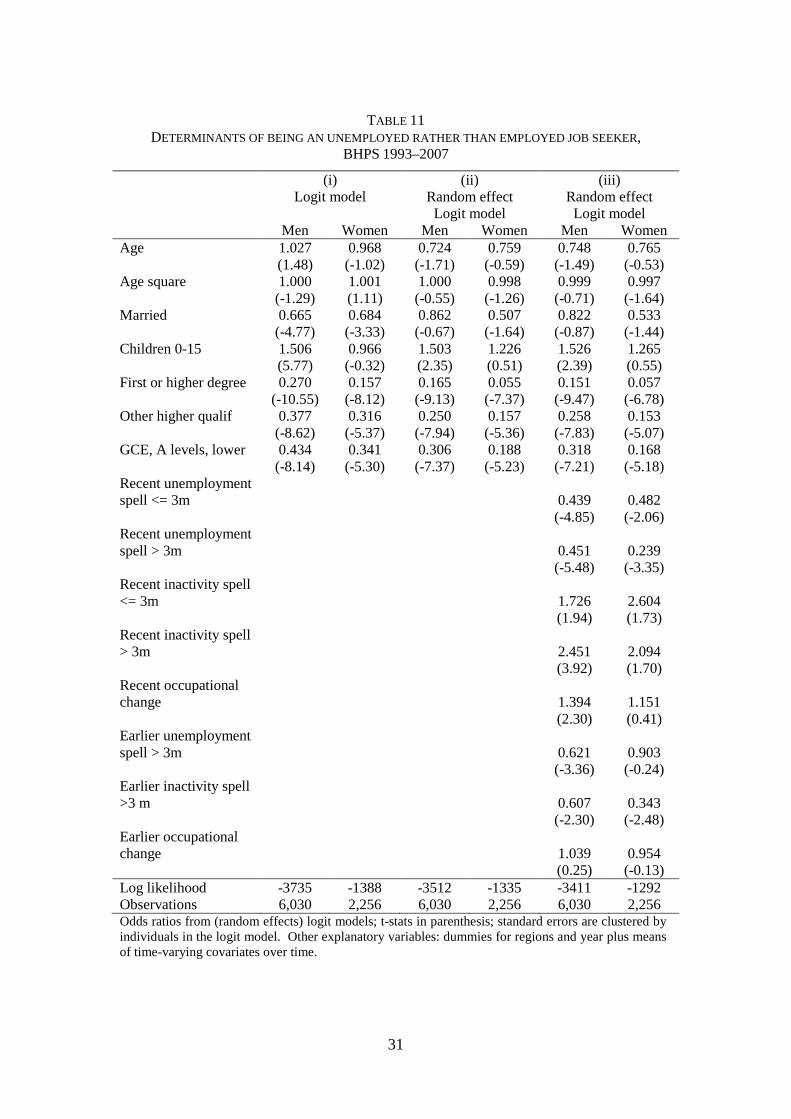
To analyse the role played by unobserved individual heterogeneity and past
employment histories in shaping differences between employed and unemployed job seekers,
we initially estimate a logit model pooling observations over the years. Table 11 presents
odds ratios, so that an estimated effect of less than (more than) one indicates that the
characteristics reduces (increases) the probability of a job seeker being unemployed. The
results, shown in column (i), are consistent with our previous analysis. Married people are
less likely than single people to be unemployed rather than employed job seekers. The
probability of being an unemployed rather than employed job seeker is lower for the more
highly educated.
The results of random effect logit models which incorporate time-invariant
unobserved effects are shown in column (ii). Although some of the individual characteristics
(such as age and marital status) lose their explanatory power, the impact of the level of
education remains statistically significant. Therefore education affects the probability of
being an unemployed rather than employed job seeker even when accounting for unobserved
individual characteristics. This could be related to the lower probability of highly qualified
people experiencing unemployment. We examine this in column (iii), which adds information
on employment histories. However the estimates on the education variables in column (iii)
are very similar to those in column (ii), indicating that the impact of education is not related
to differences in employment histories of people with different educational outcomes. It is
clear that education still plays a statistically – and economically – significant role.
The coefficients on the previous labour market experience variables show that past
experiences of unemployment reduce the probability that the job seeker is unemployed rather
than employed: those who had an unemployment spell in the past are more likely to be
currently employed and seeking a new job. This is consistent with the idea that there is some
turnover in unemployment: the unemployed are able to find a job, but then keep searching
while in the new job. Those who did not experience unemployment are likely to be employed
13 Although note that the unemployed here includes a small proportion of long-term unemployed, who cannot have had another recent spell of unemployment or economic inactivity.
18
people who are not searching (see also below). The table also shows that – at least for women
– the impact on the status of job seekers of longer unemployment spells is larger than the
impact of shorter unemployment spells, and that earlier spells are less important than recent
ones. A recent inactivity spell increases the probability that a male job seeker is unemployed
rather than employed. This may indicate that men move from economic inactivity into
unemployment and then from unemployment into a (bad) job in which they keep searching
for a new (good) job. Once again, longer spells have larger impacts than shorter spells.
Earlier spells of inactivity have negative effects for both men and women: people who had an
inactivity spell more than one year ago are more likely to be employed job seekers rather than
unemployed job seekers. For men, recent occupational changes increase the probability that
the job seeker is unemployed rather than employed, thus suggesting and unstable career path,
while previous occupational changes are not statistically significant.14
TABLE 11 ABOUT HERE
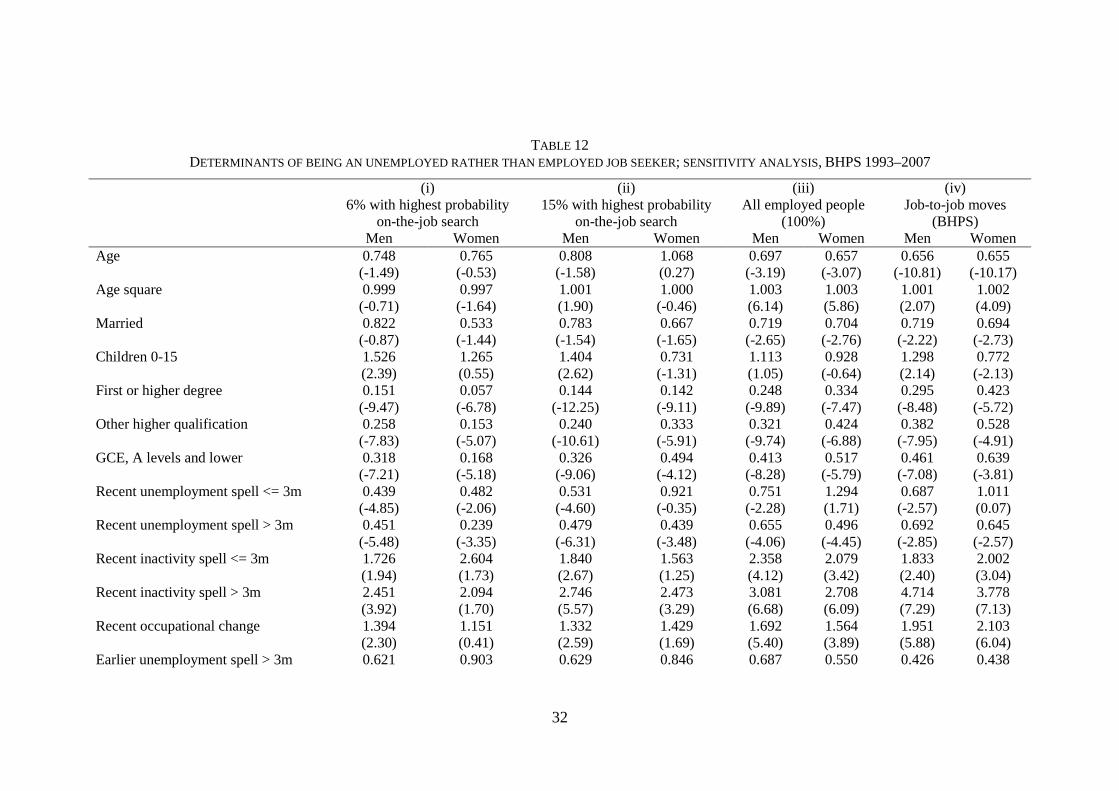
SENSITIVITY CHECKS
The validity of our results relies crucially on our ability to accurately identify employed
people in the BHPS who engage in on-the-job search. Failure to do so results in models that
simply compare the unemployed with the employed. As robustness checks, we compare
results using different strategies to identify on-the-job search, shown in Table 12. For
comparison, the first two columns report estimates from the last two columns of Table 11,
where employed job seekers are defined as the 6% of employed people in the BHPS with the
highest probability of engaging in on-the-job search. The remaining columns of the table
present results from first changing the threshold from 6% to 15% (column (ii)); and secondly
of moving the threshold from 15% to 100% and comparing all employed people to the
unemployed (column (iii)).
A comparison of the estimates across columns indicates that the coefficients on
individual characteristics do change, and some gain statistical significance in column (iii).
The impact of qualifications changes little when moving from column (i) to column (ii), but
becomes much smaller in column (iii). Hence the differences identified in column (i) and
discussed previously are genuine differences between unemployed and employed job seekers
14 As education is a key factor determining whether the job seeker is unemployed or employed, we have re-estimated the models separately by qualification level. Results confirm the main findings of Table 11. For all qualification levels previous unemployment significantly reduces the probability of being an unemployed job seeker, recent inactivity increases it, while earlier inactivity reduces it.
19
(rather than between employed and unemployed people), suggesting that employees
searching for a new job are more similar to unemployed people than to employees who do not
search. For example, they might have higher risk of losing their job and have low chances to
find a ‘good’ job (and therefore to become employed not searching). Also the impacts of
previous unemployment spells are smaller when we move from column (i) to column (iii),
while the effect of inactivity remains.
TABLE 12 ABOUT HERE
It seems reasonable to assume that employed people who move between jobs without
any intervening spell of non-employment were searching while in their previous job. An
alternative way to identify employed job seekers is therefore to use job-to-job moves with no
intervening non-employment. Although job-to-job moves can be identified from the BHPS,
this only identifies those who are successful in their search (i.e. people who subsequently
experience a job-to-job move). This may be a highly selected group of all employees who
engage in on-the-job search. The models comparing successful employed job seekers to the
unemployed are in column (iv) of Table 12, and the results are more consistent with those in
column (iii) than those in columns (i) and (ii). The only difference is in the role of
occupational changes, which increase the probability of moving from job-to-job relative to
being unemployed. Generally however the similarity of the estimates in columns (iii) and (iv)
suggests that job-to-job moves are not a good way to identify employed people engaging in
on-the-job search; at least when interviews are one year apart.
DIFFERENCES OVER THE BUSINESS CYCLE
Our final contribution is to use the combined annual and quarterly LFS to examine whether
differences between employed and unemployed job seekers vary over the business cycle.
Table 13 presents estimates from probit models comparing individual characteristics of
employed and unemployed job seekers, where the dependent variable takes the value one if
the job seeker is employed and zero if unemployed. Table 14 presents estimates from models
of search method used. These are estimated for the whole period (1984-2009), and separately
for the sub-periods of increasing and decreasing unemployment.
The results in Table 13 are consistent with those using quarterly data in Table 5. The
probability of being an employed rather than unemployed job seeker increases with age (at a
declining rate), with education and with marriage (although the effect is not statistically
20
significant for women). Job seekers with no qualifications are more likely to be unemployed
rather than employed. This again confirms the low degree of substitution between
unemployed and employed job seekers. Although estimates suggest that differences between
employed and unemployed job seekers in terms of education are smaller in periods of
increasing than in periods of decreasing unemployment, these are marginal.
TABLE 13 ABOUT HERE
In terms of job search methods used, the results in Table 14 are consistent with those
using the quarterly data (Table 7). Employees looking for a new job are more likely than the
unemployed to answer advertisements in newspapers etc., and do anything else, and less
likely to use all other methods. Estimates do vary in periods of decreasing and increasing
unemployment – differences between employed and unemployed job seekers in search
method used are generally lower in periods of increasing than falling unemployment.
However such differences are small.
TABLE 14 ABOUT HERE
Results suggest that differences between employed and unemployed job seekers are
marginally smaller during recessions but they remain statistically significant. The persistence
in differences over the business cycle suggests that the low degree of substitution between
employed and unemployed of job seekers does not change with economic conditions or with
the stock of unemployed.15
VI. CONCLUSIONS
We use the data from the LFS from 1984 to 2009 and from the BHPS 1991 to 2007 to
analyse the extent to which employed and unemployed job seekers have similar individual
characteristics (including employment histories), preferences over working hours, and job
15 The comparison of consecutive quarters in the LFS suggests that the proportion of employees who start searching is similar in periods of growth and recession. However in periods of recession fewer employees stop searching (e.g. because they found a better job), and a larger proportion keep searching in both quarters. Similarly in periods of recession a smaller proportion of the unemployed move into work (from which to engage in on-the-job search) while a larger proportion remains unemployed. If only the best candidates find a suitable job, we can conclude that the average quality of employed and unemployed job seekers changes in the same direction. Both in periods of growth and recession, the unemployed are in a different market and therefore do not compete with employed job seekers.
21
search strategies. The job search literature suggests that competition with employed job
seekers reduces the job opportunities available to the unemployed, and assumes that both
have similar individual characteristics and apply to the same jobs.
Our initial analysis suggests that employed job seekers are in worse jobs than
employees who do not search. There is some evidence that the unemployed apply to and
accept different (worse) jobs than employed job seekers, but then keep searching for better
opportunities once employed. We also find significant differences in the characteristics of job
seekers. For example, the more highly educated are much more likely to be employed rather
than unemployed job seekers (even when accounting for individual-specific unobserved
effects) and, conditional on the level of education, employed and unemployed job seekers
also have different preferences in terms of working hours. Employees looking for a new job
have much stronger preferences toward full-time jobs than the unemployed. This is consistent
with the unemployed having lower expectations in terms of job sought than employees, and
suggests that employed and unemployed job seekers are unlikely to be close substitutes and
to apply to similar jobs. Employed and unemployed job seekers also use different search
methods. These differences do not change substantially over the business cycle.
Employed and unemployed job seekers also have different employment histories. Our
results suggest that the unemployed transit into ‘bad’ jobs from which they keep looking for a
‘good’ job. Employed job seekers might have accepted job offers which were not ideal in
order to exit unemployment, and are likely to engage in on-the-job search when in the new
job. However, job seekers who search for a new job also seem to be in unstable jobs, with
few chances to find a ‘good’ job and therefore to stop searching. Such people might be
locked in a sequence of unemployment and bad jobs (a low-pay no-pay cycle), while others,
with comparatively worse individual characteristics, might never find a job at all.
Contrary to what often assumed in the literature, we find evidence that employed and
unemployed job seekers are systematically different and unlikely to be directly in competition
with each other. As a result, job search activities of employees are unlikely to affect
unemployed job seekers.
22
REFERENCES
Anderson, P.M. and Burgess, S.M. (2000) Empirical Matching Functions: Estimation and Interpretation Using State-Level Data. The Review of Economic and Statistics 82(1): 93-102.
Andrews, M.J., Bradley, S. and Upward, R. (2001) Estimating the Probability of a Match Using Microeconomic Data for the Youth Labour Market. Labour Economics 8: 335-357.
Arulampalam, W., Booth, A.L. and Taylor, M.P. (2000) Unemployment Persistence. Oxford Economic Papers 52(1): 24-50.
Atkinson, J., Giles, L. and Meager, N. (1996) Employers, Recruitment and the Unemployed, Institute for Employment Studies Report 325.
Blau, D.M. and Robins, P.K. (1990) Job Search Outcomes for the Employed and Unemployed. Journal of Political Economy 98(3): 637-655.
Booth, A.L., Francesconi, M. and Frank, J. (2002) Temporary Jobs: Stepping Stones or Dead Ends? The Economic Journal 112(480): F189-F213.
Burdett, K. and Mortensen, D.T. (1998) Wage Differentials, Employer Size, and Unemployment. International Economic Review 39(2): 257-273.
Burgess, S.M. (1993) A Model of Competition between Unemployed and Employed Job Searchers: An Application to the Unemployment Outflow Rate in Britain. The Economic Journal 103(420): 1190-1204.
Eriksson, S. and Gottfries, N. (2005) Ranking of Job Applicants, on-the-Job Search, and Persistent Unemployment. Labour Economics 12: 407-428.
Eriksson, S. and Lagerstrom, J. (2006) Competition between Employed and Unemployed Job Applicants: Swedish Evidence. Scandinavian Journal of Economics 108(3): 373-396.
Gorter, C., Nijkamp, P. and Rietveld, P. (1993) The Impact of Employers' Recruitment Behaviour on the Allocation of Vacant Jobs to Unemployed Job Seekers. Empirical Economics 18(2): 251-269.
Gregg, P. (2001) The Impact of Youth Unemployment on Adult Unemployment in the Ncds. The Economic Journal 111(475): F626-F653.
Lindeboom, M., van Ours, J.C. and Renes, G. (1994) Matching Employers and Workers: An Empirical Analysis on the Effectiveness of Search. Oxford Economic Papers 46(1): 45-67.
McGovern, P., Smeaton, D. and Hill, S. (2004) Bad Jobs in Britain: Nonstandard Employment and Job Quality. Work and Occupations 31(2): 225-249.
Mumford, K. and Smith, P.N. (1999) The Hiring Function Reconsidered: On Closing the Circle. Oxford Bulletin of Economics and Statistics 61(3): 343-364.
Mundlak, Y. (1978) On the Pooling of Time Series and Cross Section Data. Econometrica 46(1): 69-85.
Pissarides, C.A. (1994) Search Unemployment with on-the-Job Search. Review of Economic Studies 61: 457-475.
Pissarides, C.A. and Wadsworth, J. (1994) On-the-Job Search. Some Empirical Evidence from Britain. European Economic Review 38: 385-401.
Robson, M.T. (2001) Regional Variations in the Competitiveness of Unemployed Job-Seekers and the Rate of Outflows from Unemployment. Oxford Bulletin of Economics and Statistics 63(1): 61-90.
Rogerson, R., Shimer, R. and Wright, R. (2005) Search-Theoretic Models of the Labor Market: A Survey. Journal of Economic Literature 43(December): 959-988.
Rosholm, M. and Svarer, M. (2004) Endogenous Wage Dispersion in a Search-Matching Model. Labour Economics 11: 623-645.

23
van den Berg, G.J. and Ridder, G. (1998) An Empirical Equilibrium Search Model of the Labor Market. Econometrica 66(5): 1183-1221.
van Ours, J.C. (1995) An Empirical Note on Employed and Unemployed Job Search. Economics Letters 49: 447-452.
Weber, A. and Mahringer, H. (2008) Choice and Success of Job Search Methods. Empirical Economics 35: 153-178.
24
TABLES AND FIGURES
TABLE 1 PROPORTION OF PEOPLE SEARCHING FOR A JOB, LFS 1984–2009; 1992-2009
Quarterly Data (1992–2009) Men Women
Employed not searching 93.68 93.54 Employed searching new job 5.98 42.54 5.78 47.63 Employed searching additional job 0.33 2.38 0.67 5.56 Unemployed searching 55.08 46.81
Total 100 100 100 100
Annual Data (1984–2009)
Employed not searching 94.09 93.67 Employed searching a job 5.91 40.49 6.33 48.03 Unemployed searching 59.51 51.97
Total 100 100 100 100 “Others” are self-employed, people in government training programmes or unpaid family workers
TABLE 2 PREFERENCES OVER WORKING HOURS BY EMPLOYMENT STATUS, LFS 1992–2009
Preference for: Employed
looking for new job Employed
looking for additional job Unemployed Total
Full-time (%) 83.71 17.95 56.73 66.26 Part-time (%) 12.1 74.46 24.85 21.73 No preference (%) 4.2 7.59 18.42 12.01
Observations 35,028 3,728 45,235 83,991 Total 100 100 100 100
TABLE 3 JOB SEARCH METHODS BY EMPLOYMENT STATUS, LFS 1992–2009
Job search method:
Employed looking for
new job
Employed looking for
additional job Unemployed
Total
Job centre, careers office, job club 14.05 15.69 33.53 24.61 Advertising, answering ads in newspapers 65.24 52.00 44.77 53.63 Direct approach to employers 7.80 13.78 10.27 9.4 Ask friends and relatives 7.89 13.73 8.79 8.64 Do anything else 5.01 4.8 2.65 3.73
Total 35,030 3,729 45,240 83,999 100 100 100 100
25
TABLE 4 DETERMINANTS OF ON-THE-JOB SEARCH, LFS 1993–2009
Men Women Reference: Employed not searching
Employed searching new job
Employed searching additional
job
Employed searching new job
Employed searching additional
job Age 0.0060 0.0004 0.0035 0.0001 (12.74) (3.64) (6.44) (0.35) Age square -0.0001 -0.0000 -0.0001 0.0000 (-14.20) (-4.05) (-7.69) (-0.78) Married/cohabiting -0.0046 -0.0008 -0.0196 -0.0036 (-2.77) (-2.15) (-11.80) (-6.59) Whether dependent children -0.0014 -0.0006 -0.0031 -0.0013 (-0.86) (-1.89) (-1.86) (-2.19) NVQ level 4 and above 0.0496 0.0004 0.0503 0.0001 (13.23) (0.53) (13.40) (0.13) NVQ level 3 0.0252 0.0004 0.0311 0.0004 (7.07) (0.51) (8.42) (0.33) NVQ level 2 and below 0.0235 0.0002 0.0239 -0.0013 (6.69) (0.23) (6.73) (-1.30) Other qualifications 0.0153 0.0009 0.0190 -0.0008 (4.24) (1.16) (4.86) (-0.70) Job temporary 0.0488 0.0004 0.0431 0.0022 (17.75) (0.89) (16.55) (3.01) Part-time 0.0201 0.0044 0.0006 0.0024 (4.92) (6.85) (0.25) (2.60) Gross hourly wage -0.0020 -0.0002 -0.0020 -0.0001 (-10.74) (-2.89) (-9.45) (-0.80) Job tenure -0.0031 -0.0002 -0.0020 -0.0003 (-10.67) (-2.80) (-5.64) (-2.26) Job tenure square 0.0000 0.0000 0.0000 0.0000 (0.84) (1.09) (0.37) (0.65) Public sector -0.0036 0.0009 -0.0040 0.0013 (-1.91) (2.35) (-2.40) (2.45) Usual hours 0.0001 -0.0001 0.0005 -0.0002 (-1.17) (-3.72) (4.42) (-6.09) Quarter-to-quarter change in the number of employees in the region -0.0137 -0.0068 -0.0760 -0.0261 (-0.20) (-0.42) (-0.90) (-1.07) Proportion job seekers who are employed (%) 0.0009 -0.0001 0.0003 0.0000 (3.63) (-2.15) (1.23) (0.28) Log likelihood -26921 -22217 Observations 122,707 97,336 Marginal effects of a multinomial probit model; t-stats in parenthesis; standard errors are clustered by quarters x regions. Other explanatory variables: occupation (pre- and post- 2000), region, year, and quarter dummies.
26
TABLE 5 DIFFERENCES BETWEEN EMPLOYED AND UNEMPLOYED JOB SEEKERS, LFS 1992–2009
Men Women Base: Unemployed searching job Employed
searching new job
Employed searching additional
job
Employed searching new job
Employed searching additional
job Age 0.034 -0.001 0.034 -0.002 (31.98) (3.11) (24.13) (-2.38) Age square -0.000 0.000 -0.000 0.000 (-36.45) (2.48) (-23.81) (2.96) Married/cohabiting 0.182 0.002 0.077 -0.004 (32.22) (1.11) (13.61) (-1.60) Whether dependent children -0.038 0.002 -0.146 0.015 (-8.24) (1.40) (-29.61) (6.30) NVQ level 4 and above 0.389 0.011 0.356 0.010 (59.12) (4.42) (46.68) (2.67) NVQ level 3 0.274 0.010 0.255 0.016 (38.32) (4.25) (29.20) (3.91) NVQ level 2 and below 0.221 0.006 0.204 0.006 (32.94) (2.68) (28.43) (1.63) Other qualifications 0.158 0.008 0.127 0.007 (20.10) (2.92) (14.71) (1.68) Quarter-to-quarter change in the number of employees in the region 0.699 0.080 0.843 -0.039 (2.90) (1.13) (3.23) (-0.31) Log likelihood -32685 -31872 Observations 47,916 39,846 Marginal effects of a multinomial probit model; t-stats in parenthesis; standard errors are clustered by quarters x regions. Other explanatory variables: region, year and quarter dummies.
27
TABLE 6 PREFERENCES OVER WORKING HOURS, LFS 1992–2009
Base: No preference between part- and full time
Looking for full-time job
Looking for part-time job
Looking for full -time job
Looking for part-time job
NVQ level 4 and above Men (N=9,929) Women (N=9,136) Employed searching new job 0.126 -0.040 0.228 -0.130 (21.45) (-9.02) (27.65) (-15.75) Employed searching add. job -0.151 0.135 -0.263 0.310 (-12.41) (19.52) (-11.92) (17.21) NVQ level 3 Men (N=10,435) Women (N=6,544) Employed searching new job 0.178 -0.071 0.301 -0.202 (23.75) (-12.60) (30.98) (-19.24) Employed searching add. job -0.226 0.201 -0.231 0.289 (-12.82) (18.42) (-9.20) (13.39) NVQ level 2 and below Men (N=12,649) Women (N=13,830) Employed searching new job 0.181 -0.051 0.272 -0.154 (23.66) (-8.85) (38.80) (-20.52) Employed searching add. job -0.289 0.283 -0.259 0.330 (-15.39) (24.60) (-12.03) (16.83) Other qualifications Men (N=6,709) Women (N=5,231) Employed searching new job 0.178 -0.040 0.287 -0.144 (16.87) (-6.49) (24.53) (-12.07) Employed searching add. job -0.237 0.215 -0.236 0.323 (-9.66) (18.78) (-7.58) (11.19) No qualifications Men (N=10,319) Women (N=6,961) Employed searching new job 0.194 -0.020 0.236 -0.115 (14.82) (-2.95) (18.49) (-8.24) Employed searching add. job -0.279 0.219 -0.234 0.298 (-9.59) (18.81) (-7.37) (10.01) Marginal effects of a multinomial probit model; t-stats in parenthesis; standard errors are clustered by quarters x regions. Other explanatory variables: age, dummies for married/cohabiting, singles, presence of dependent children in the household, region, year and quarter.
28
TABLE 7 JOB SEARCH METHOD, LFS 1992–2009
Base: Advertising and answering ads in newspapers
Job centre Careers office
Job club
Direct approach
to employers
Ask friends and relatives
Do anything
else
Job centre Careers office
Job club
Direct approach
to employers
Ask friends and relatives
Do anything
else Men NVQ level 4 and above; N=9,929 Women NVQ level 4 and above; N=9,139 Employed searching new job -0.106 -0.021 -0.005 0.034 -0.086 -0.017 0.001 0.026 (12.36) (-3.46) (-0.86) (4.98) (-12.03) (-2.59) (0.19) (3.74) Employed searching add. job -0.099 0.051 0.048 0.042 -0.045 0.043 0.025 0.035 (-3.76) (3.44) (3.65) (2.48) (-2.72) (3.49) (2.35) (2.55) Men NVQ level 3; N=10,438 Women NVQ level 3; N=6545 Employed searching new job -0.195 -0.026 0.004 0.026 -0.120 -0.039 -0.010 0.026 (-23.00) (-4.27) (0.58) (5.89) (-12.64) (-5.15) (-1.56) (4.30) Employed searching add. job -0.116 0.001 0.056 0.013 -0.149 0.014 0.015 0.031 (-4.47) (0.07) (2.96) (0.96) (-7.23) (0.89) (1.22) (2.81) Men NVQ level 2 and below; N=12,696 Women NVQ level 2 and below; N=13,833 Employed searching new job -0.240 0.004 0.026 0.038 -0.146 -0.011 0.010 0.026 (-29.23) (0.82) (4.86) (8.75) (-19.76) (-2.07) (2.15) (6.46) Employed searching add. job -0.251 0.056 0.043 0.033 -0.157 0.024 0.058 0.043 (-9.44) (4.25) (2.73) (2.87) (-9.69) (2.48) (7.33) (5.79) Men Other qualifications; N=6,711 Women Other qualifications; N=5,235 Employed searching new job -0.276 0.003 0.025 0.028 -0.159 -0.008 0.018 0.029 (-23.22) (0.44) (2.78) (5.91) (-12.29) (-1.02) (2.23) (4.86) Employed searching add. job -0.294 0.033 0.069 0.033 -0.149 -0.009 0.052 0.008 (-7.90) (1.56) (2.64) (2.44) (-5.34) (-0.54) (3.27) (0.65) Men No qualifications; N=10,320 Women No qualifications; N=6,962 Employed searching new job -0.311 0.011 0.049 0.021 -0.171 0.008 0.030 0.019 (-25.46) (1.54) (5.96) (5.50) (-13.56) (1.00) (3.45) (3.86) Employed searching add. job -0.341 0.041 0.106 0.016 -0.148 0.015 0.037 0.018 (-7.54) (1.93) (4.31) (1.35) (-5.78) (0.92) (2.22) (1.82) Marginal effects of a multinomial probit model; t-stats in parenthesis; standard errors are clustered by quarters x regions. Other explanatory variables: age, dummies for married/cohabiting, singles, presence of dependent children in the household, region, year and quarter.
29
TABLE 8 DETERMINANTS OF ON-THE-JOB SEARCH, LFS 1993–2007
(1) Men
(2) Women
Coefficients Marginal effects
Coefficients Marginal effects
Job temporary 0.437 0.048 0.416 0.045 (17.47) (17.18) (17.01) (16.96) Part-time 0.047 0.005 -0.075 -0.008 (1.19) (1.19) (-3.09) (-3.08) Gross weekly pay (hundreds) -0.041 -0.005 -0.048 -0.005 (-9.48) (-9.47) (-8.25) (-8.18) Years of job tenure / 10 -0.277 -0.031 -0.319 -0.034 (-10.77) (-10.69) (-10.51) (-10.48) Years of job tenure / 10 squared -0.017 -0.002 0.024 0.003 (-1.63) (-1.63) (1.71) (1.71) Public sector -0.006 -0.001 -0.024 -0.003 (-0.33) (-0.33) (-1.46) (-1.46) Usual hours per week / 10 0.007 0.001 0.077 0.008 (0.79) (0.79) (7.59) (7.60) Proportion job seekers who are employed (%)
0.008
0.001
0.006
0.001
(3.37) (3.36) (2.02) (2.03) Pseudo R2 0.052 0.034 Observations 119,398 94,053 Probit model; dependent variable=1 if the employee is searching for a new job, and zero otherwise. T-stats in parenthesis; standard errors are clustered by quarters x regions. Other explanatory variables: dummies for occupations (pre- and post- 2000), regions, year, and quarter.
TABLE 9 THRESHOLD PROBABILITY OF ENGAGING IN ON-THE-JOB SEARCH, BHPS 1993–2007
Year Threshold
Probability (%) Employed not searching
(observations) Employed searching
(observations) Unemployed (observations)
1993 9.14 3838 246 546 1994 10.30 3919 251 508 1995 10.70 3878 248 392 1996 11.32 4081 261 393 1997 11.14 4654 298 408 1998 9.86 4650 297 365 1999 9.90 6388 408 588 2000 10.77 6362 407 568 2001 9.50 6352 406 514 2002 9.42 5637 360 424 2003 8.86 5514 353 458 2004 8.77 5343 342 371 2005 8.29 5284 338 407 2006 9.22 5379 344 409 2007 8.74 5130 328 322
30
TABLE 10
INDIVIDUAL CHARACTERISTICS, BHPS AND LFS 1993–2007
Employed men not searching
Employed men searching
Unemployed men
Employed women not searching
Employed women searching
Unemployed women
Dataset: LFS BHPS LFS BHPS BHPS LFS BHPS LFS BHPS BHPS age 39.13 38.67 34.17 31.12 34.12 38.06 37.95 33.70 30.50 33.33 Married 0.605 0.749 0.473 0.471 0.486 0.579 0.718 0.404 0.505 0.419 Children 0-15 0.380 0.401 0.377 0.299 0.391 0.397 0.405 0.376 0.356 0.409 Degree 0.190 0.173 0.244 0.189 0.088 0.158 0.162 0.235 0.263 0.094 Higher qualification 0.108 0.336 0.116 0.258 0.186 0.138 0.298 0.136 0.228 0.181 GCE, A levels and lower 0.608 0.382 0.578 0.472 0.431 0.578 0.428 0.560 0.459 0.477 Other or no qualification 0.095 0.109 0.063 0.082 0.296 0.127 0.113 0.068 0.050 0.248 Recent unemployment spell <= 3m 0.019 0.120 0.053 0.019 0.147 0.053 Recent unemployment spell > 3m 0.018 0.112 0.096 0.016 0.090 0.058 Recent inactivity spell <= 3m 0.005 0.026 0.023 0.009 0.062 0.027 Recent inactivity spell > 3m 0.016 0.115 0.092 0.053 0.277 0.123 Recent occupational change 0.055 0.183 0.086 0.062 0.209 0.083 Earlier unemployment spell > 3m 0.037 0.115 0.149 0.027 0.064 0.084 Earlier inactivity spell > 3m 0.032 0.181 0.131 0.095 0.361 0.174 Earlier occupational change 0.092 0.175 0.084 0.095 0.129 0.081 These descriptive statistics refer to the samples only and are therefore unweighted
31
TABLE 11
DETERMINANTS OF BEING AN UNEMPLOYED RATHER THAN EMPLOYED JOB SEEKER, BHPS 1993–2007
(i) Logit model
(ii) Random effect Logit model
(iii) Random effect Logit model
Men Women Men Women Men Women Age 1.027 0.968 0.724 0.759 0.748 0.765 (1.48) (-1.02) (-1.71) (-0.59) (-1.49) (-0.53) Age square 1.000 1.001 1.000 0.998 0.999 0.997 (-1.29) (1.11) (-0.55) (-1.26) (-0.71) (-1.64) Married 0.665 0.684 0.862 0.507 0.822 0.533 (-4.77) (-3.33) (-0.67) (-1.64) (-0.87) (-1.44) Children 0-15 1.506 0.966 1.503 1.226 1.526 1.265 (5.77) (-0.32) (2.35) (0.51) (2.39) (0.55) First or higher degree 0.270 0.157 0.165 0.055 0.151 0.057 (-10.55) (-8.12) (-9.13) (-7.37) (-9.47) (-6.78) Other higher qualif 0.377 0.316 0.250 0.157 0.258 0.153 (-8.62) (-5.37) (-7.94) (-5.36) (-7.83) (-5.07) GCE, A levels, lower 0.434 0.341 0.306 0.188 0.318 0.168 (-8.14) (-5.30) (-7.37) (-5.23) (-7.21) (-5.18) Recent unemployment spell <= 3m
0.439
0.482
(-4.85) (-2.06) Recent unemployment spell > 3m
0.451
0.239
(-5.48) (-3.35) Recent inactivity spell <= 3m
1.726
2.604
(1.94) (1.73) Recent inactivity spell > 3m
2.451
2.094
(3.92) (1.70) Recent occupational change
1.394
1.151
(2.30) (0.41) Earlier unemployment spell > 3m
0.621
0.903
(-3.36) (-0.24) Earlier inactivity spell >3 m
0.607
0.343
(-2.30) (-2.48) Earlier occupational change
1.039
0.954
(0.25) (-0.13) Log likelihood -3735 -1388 -3512 -1335 -3411 -1292 Observations 6,030 2,256 6,030 2,256 6,030 2,256 Odds ratios from (random effects) logit models; t-stats in parenthesis; standard errors are clustered by individuals in the logit model. Other explanatory variables: dummies for regions and year plus means of time-varying covariates over time.
32
TABLE 12
DETERMINANTS OF BEING AN UNEMPLOYED RATHER THAN EMPLOYED JOB SEEKER; SENSITIVITY ANALYSIS, BHPS 1993–2007
(i) 6% with highest probability
on-the-job search
(ii) 15% with highest probability
on-the-job search
(iii) All employed people
(100%)
(iv) Job-to-job moves
(BHPS) Men Women Men Women Men Women Men Women Age 0.748 0.765 0.808 1.068 0.697 0.657 0.656 0.655 (-1.49) (-0.53) (-1.58) (0.27) (-3.19) (-3.07) (-10.81) (-10.17) Age square 0.999 0.997 1.001 1.000 1.003 1.003 1.001 1.002 (-0.71) (-1.64) (1.90) (-0.46) (6.14) (5.86) (2.07) (4.09) Married 0.822 0.533 0.783 0.667 0.719 0.704 0.719 0.694 (-0.87) (-1.44) (-1.54) (-1.65) (-2.65) (-2.76) (-2.22) (-2.73) Children 0-15 1.526 1.265 1.404 0.731 1.113 0.928 1.298 0.772 (2.39) (0.55) (2.62) (-1.31) (1.05) (-0.64) (2.14) (-2.13) First or higher degree 0.151 0.057 0.144 0.142 0.248 0.334 0.295 0.423 (-9.47) (-6.78) (-12.25) (-9.11) (-9.89) (-7.47) (-8.48) (-5.72) Other higher qualification 0.258 0.153 0.240 0.333 0.321 0.424 0.382 0.528 (-7.83) (-5.07) (-10.61) (-5.91) (-9.74) (-6.88) (-7.95) (-4.91) GCE, A levels and lower 0.318 0.168 0.326 0.494 0.413 0.517 0.461 0.639 (-7.21) (-5.18) (-9.06) (-4.12) (-8.28) (-5.79) (-7.08) (-3.81) Recent unemployment spell <= 3m 0.439 0.482 0.531 0.921 0.751 1.294 0.687 1.011 (-4.85) (-2.06) (-4.60) (-0.35) (-2.28) (1.71) (-2.57) (0.07) Recent unemployment spell > 3m 0.451 0.239 0.479 0.439 0.655 0.496 0.692 0.645 (-5.48) (-3.35) (-6.31) (-3.48) (-4.06) (-4.45) (-2.85) (-2.57) Recent inactivity spell <= 3m 1.726 2.604 1.840 1.563 2.358 2.079 1.833 2.002 (1.94) (1.73) (2.67) (1.25) (4.12) (3.42) (2.40) (3.04) Recent inactivity spell > 3m 2.451 2.094 2.746 2.473 3.081 2.708 4.714 3.778 (3.92) (1.70) (5.57) (3.29) (6.68) (6.09) (7.29) (7.13) Recent occupational change 1.394 1.151 1.332 1.429 1.692 1.564 1.951 2.103 (2.30) (0.41) (2.59) (1.69) (5.40) (3.89) (5.88) (6.04) Earlier unemployment spell > 3m 0.621 0.903 0.629 0.846 0.687 0.550 0.426 0.438
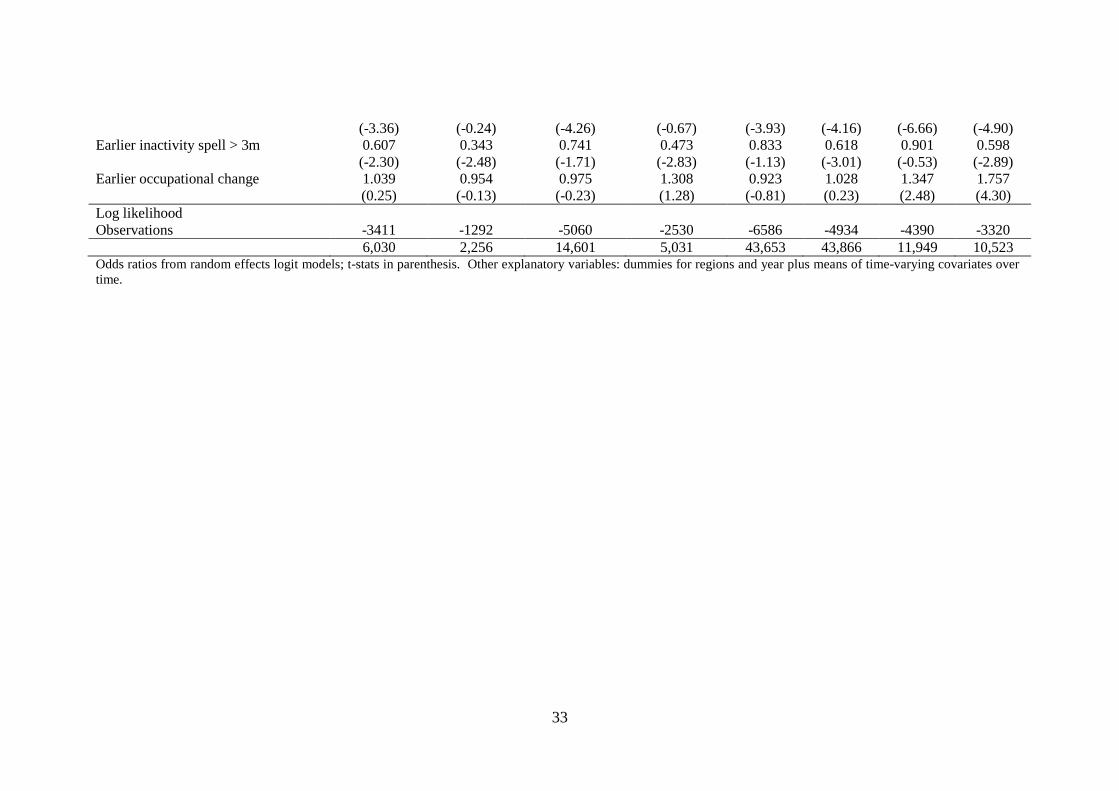
33
(-3.36) (-0.24) (-4.26) (-0.67) (-3.93) (-4.16) (-6.66) (-4.90) Earlier inactivity spell > 3m 0.607 0.343 0.741 0.473 0.833 0.618 0.901 0.598 (-2.30) (-2.48) (-1.71) (-2.83) (-1.13) (-3.01) (-0.53) (-2.89) Earlier occupational change 1.039 0.954 0.975 1.308 0.923 1.028 1.347 1.757 (0.25) (-0.13) (-0.23) (1.28) (-0.81) (0.23) (2.48) (4.30) Log likelihood Observations -3411 -1292 -5060 -2530 -6586 -4934 -4390 -3320 6,030 2,256 14,601 5,031 43,653 43,866 11,949 10,523 Odds ratios from random effects logit models; t-stats in parenthesis. Other explanatory variables: dummies for regions and year plus means of time-varying covariates over time.
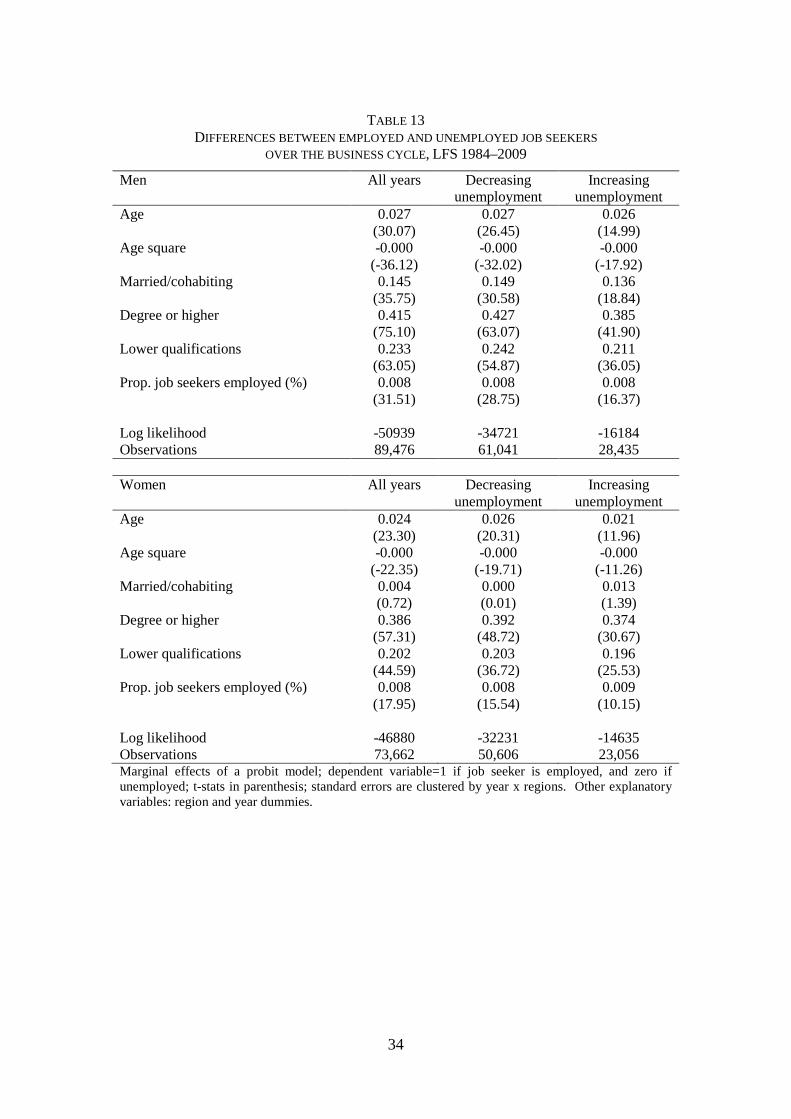
34
TABLE 13
DIFFERENCES BETWEEN EMPLOYED AND UNEMPLOYED JOB SEEKERS OVER THE BUSINESS CYCLE, LFS 1984–2009
Men
All years Decreasing unemployment
Increasing unemployment
Age 0.027 0.027 0.026 (30.07) (26.45) (14.99) Age square -0.000 -0.000 -0.000 (-36.12) (-32.02) (-17.92) Married/cohabiting 0.145 0.149 0.136 (35.75) (30.58) (18.84) Degree or higher 0.415 0.427 0.385 (75.10) (63.07) (41.90) Lower qualifications 0.233 0.242 0.211 (63.05) (54.87) (36.05) Prop. job seekers employed (%) 0.008 0.008 0.008 (31.51) (28.75) (16.37) Log likelihood -50939 -34721 -16184 Observations 89,476 61,041 28,435 Women
All years Decreasing unemployment
Increasing unemployment
Age 0.024 0.026 0.021 (23.30) (20.31) (11.96) Age square -0.000 -0.000 -0.000 (-22.35) (-19.71) (-11.26) Married/cohabiting 0.004 0.000 0.013 (0.72) (0.01) (1.39) Degree or higher 0.386 0.392 0.374 (57.31) (48.72) (30.67) Lower qualifications 0.202 0.203 0.196 (44.59) (36.72) (25.53) Prop. job seekers employed (%) 0.008 0.008 0.009 (17.95) (15.54) (10.15) Log likelihood -46880 -32231 -14635 Observations 73,662 50,606 23,056 Marginal effects of a probit model; dependent variable=1 if job seeker is employed, and zero if unemployed; t-stats in parenthesis; standard errors are clustered by year x regions. Other explanatory variables: region and year dummies.
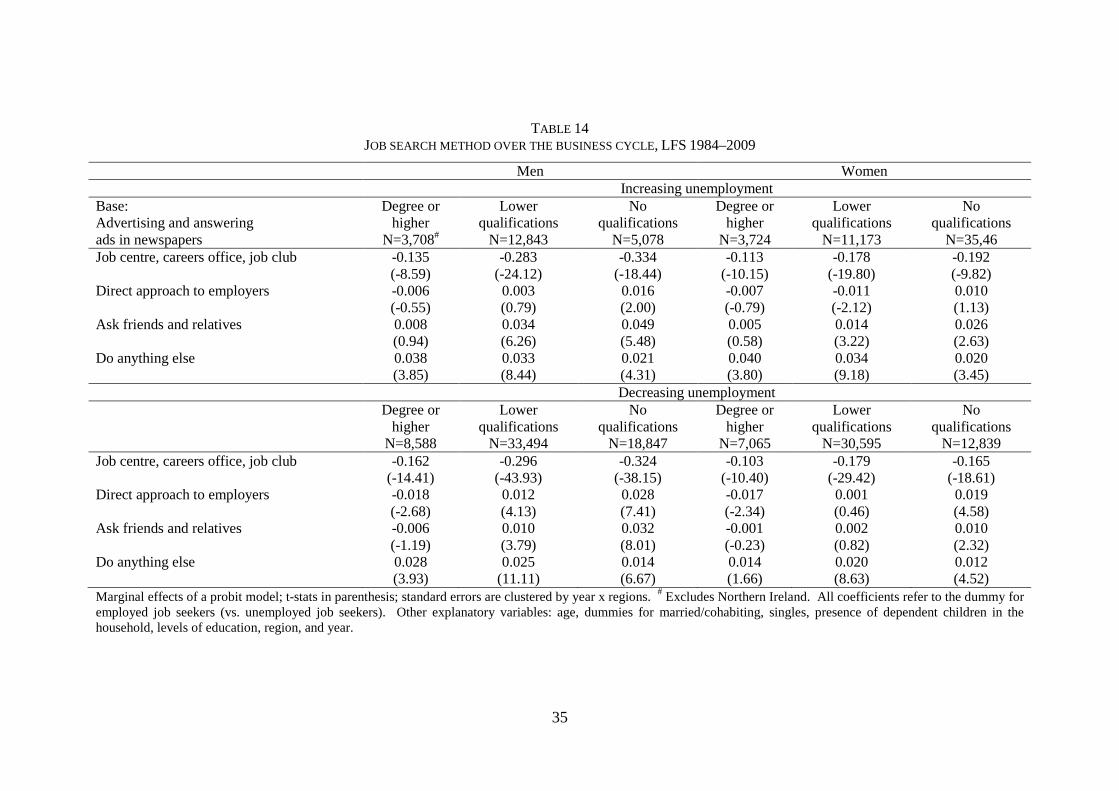
35
TABLE 14 JOB SEARCH METHOD OVER THE BUSINESS CYCLE, LFS 1984–2009
Men Women Increasing unemployment
Base: Advertising and answering ads in newspapers
Degree or higher
N=3,708#
Lower qualifications
N=12,843
No qualifications
N=5,078
Degree or higher
N=3,724
Lower qualifications
N=11,173
No qualifications
N=35,46 Job centre, careers office, job club -0.135 -0.283 -0.334 -0.113 -0.178 -0.192 (-8.59) (-24.12) (-18.44) (-10.15) (-19.80) (-9.82) Direct approach to employers -0.006 0.003 0.016 -0.007 -0.011 0.010 (-0.55) (0.79) (2.00) (-0.79) (-2.12) (1.13) Ask friends and relatives 0.008 0.034 0.049 0.005 0.014 0.026 (0.94) (6.26) (5.48) (0.58) (3.22) (2.63) Do anything else 0.038 0.033 0.021 0.040 0.034 0.020 (3.85) (8.44) (4.31) (3.80) (9.18) (3.45)
Decreasing unemployment Degree or
higher N=8,588
Lower qualifications
N=33,494
No qualifications
N=18,847
Degree or higher
N=7,065
Lower qualifications
N=30,595
No qualifications
N=12,839 Job centre, careers office, job club -0.162 -0.296 -0.324 -0.103 -0.179 -0.165 (-14.41) (-43.93) (-38.15) (-10.40) (-29.42) (-18.61) Direct approach to employers -0.018 0.012 0.028 -0.017 0.001 0.019 (-2.68) (4.13) (7.41) (-2.34) (0.46) (4.58) Ask friends and relatives -0.006 0.010 0.032 -0.001 0.002 0.010 (-1.19) (3.79) (8.01) (-0.23) (0.82) (2.32) Do anything else 0.028 0.025 0.014 0.014 0.020 0.012 (3.93) (11.11) (6.67) (1.66) (8.63) (4.52) Marginal effects of a probit model; t-stats in parenthesis; standard errors are clustered by year x regions. # Excludes Northern Ireland. All coefficients refer to the dummy for employed job seekers (vs. unemployed job seekers). Other explanatory variables: age, dummies for married/cohabiting, singles, presence of dependent children in the household, levels of education, region, and year.
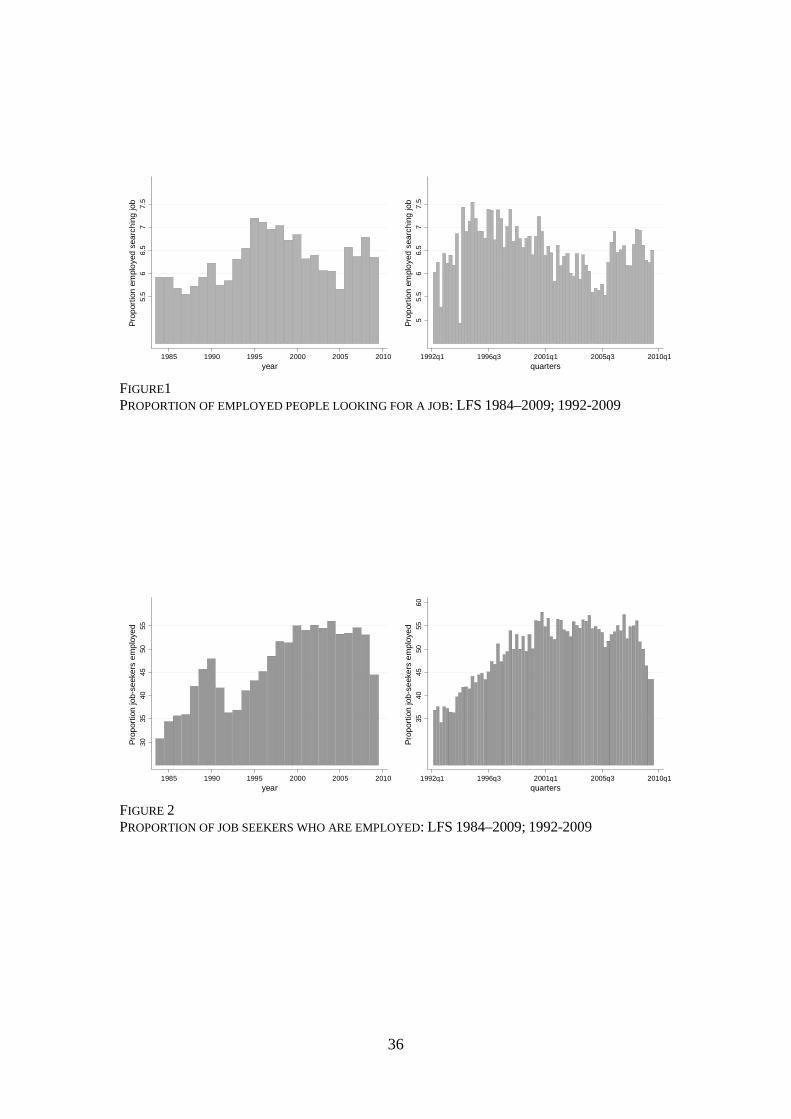
36
5.5
66.
57
7.5
Pro
port
ion
empl
oye
d s
earc
hing
job
1985 1990 1995 2000 2005 2010year
55.
56
6.5
77.
5P
ropo
rtio
n em
plo
yed
sea
rchi
ng jo
b
1992q1 1996q3 2001q1 2005q3 2010q1quarters
FIGURE1 PROPORTION OF EMPLOYED PEOPLE LOOKING FOR A JOB: LFS 1984–2009; 1992-2009
3035
4045
5055
Pro
port
ion
job-
seek
ers
em
ploy
ed
1985 1990 1995 2000 2005 2010year
3540
4550
5560
Pro
port
ion
job-
seek
ers
em
ploy
ed
1992q1 1996q3 2001q1 2005q3 2010q1quarters
FIGURE 2 PROPORTION OF JOB SEEKERS WHO ARE EMPLOYED: LFS 1984–2009; 1992-2009
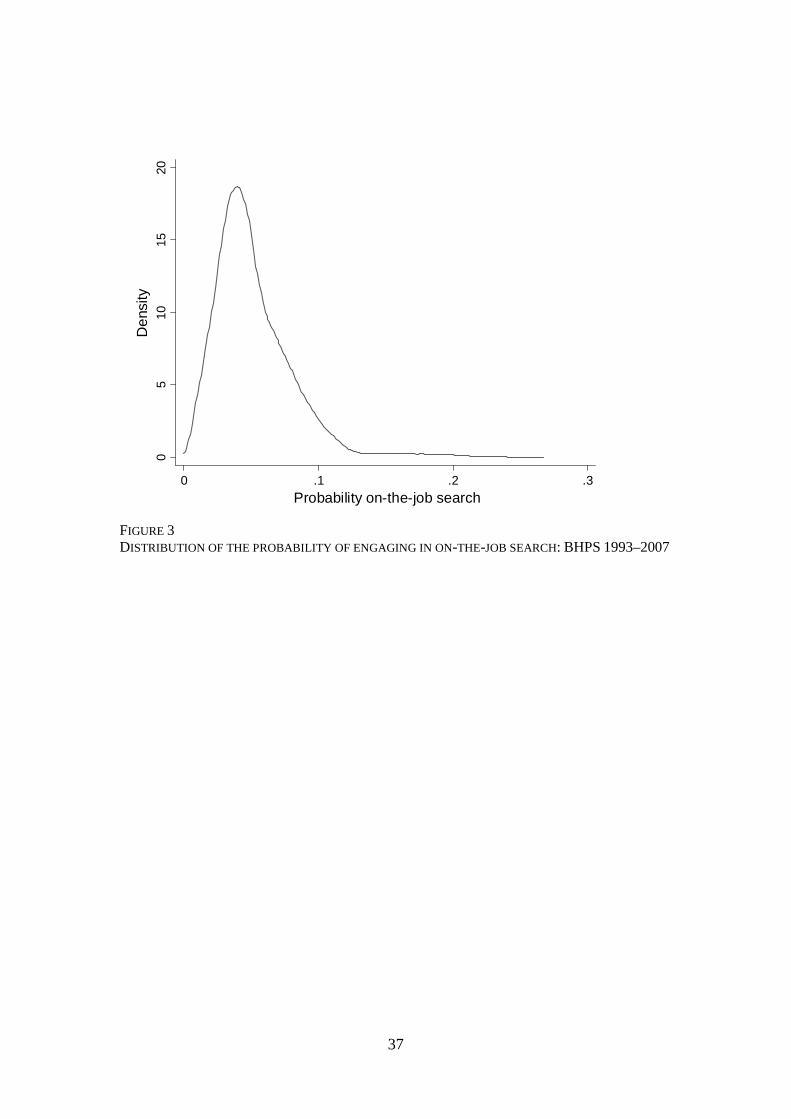
37
05
1015
20
Den
sity
0 .1 .2 .3Probability on-the-job search
FIGURE 3 DISTRIBUTION OF THE PROBABILITY OF ENGAGING IN ON-THE-JOB SEARCH: BHPS 1993–2007


![[halshs-00451621, v1] Time Preferences and Job Search ... · Bassem BEN HALIMA - Mohamed Ali BEN HALIMA Abstract. Increasing impatience reduces search efforts of unemployed job seekers](https://img.pdfslide.net/doc/110x75/5ed41c73d0f41f76d007182f/halshs-00451621-v1-time-preferences-and-job-search-bassem-ben-halima-mohamed.jpg)