Embed Size (px)
Citation preview
1
Employee Compensation and Small Business
January 2016
Holly S. Wade, Director of Research and Policy Analysis Michael J. Chow, Senior Data Analyst
2
Employee Compensation and Small Business Employee compensation is one of the most—if not the most—important points of negotiation between employers and employees. Employers offer and negotiate compensation plans using a variety of wage structures and benefits to attract candidates for open positions and to retain employees. Small employers offer compensation plans that account for the unique and varied characteristics of their business. These characteristics include industry, size of business, and years in operation, to name a few, although none are as important as business profitability. The Great Recession reinforced the importance of business profitability as it relates to compensation, with small employers quickly slashing wages and benefits to survive during the downturn and gradually reversing course when profits improved.0F
1
As an expense category, employee compensation is one of the largest for businesses, and it is therefore closely monitored. According to the Society for Human Resource Management, the metric of salaries as a percentage of operating expenses for businesses across all industries and size groups is 41 percent.1F
2 The large percentage share that employee compensation constitutes of key income statement benchmarks like operating expense and gross profit makes the evaluation and examination of employee compensation critical to understanding the operations and health of a business. The below exposition explores employee compensation, both pecuniary and non-pecuniary, in detail within the context of reporting the results of new nationally-representative survey on employee compensation at small businesses, defined here as employer firms with fewer than 250 employees.2F
3 Financial Compensation for Full-time and Part-time Employees Employee compensation takes many different forms. When thinking of compensation, the type that most frequently comes to mind is cash, which may take the form of salaries, wages, commissions, or income received via a profit-sharing arrangement. There is considerable variation in how employees receive the pecuniary portion of their compensation, depending upon whether the employee is employed on a full-time or part-time basis as well as upon the size of the employer (as defined by the number of employees working at the business). Among small firms, the prevalence of salaried employees as a majority share of full-time employees tends to decrease as the size of the business increases.3F
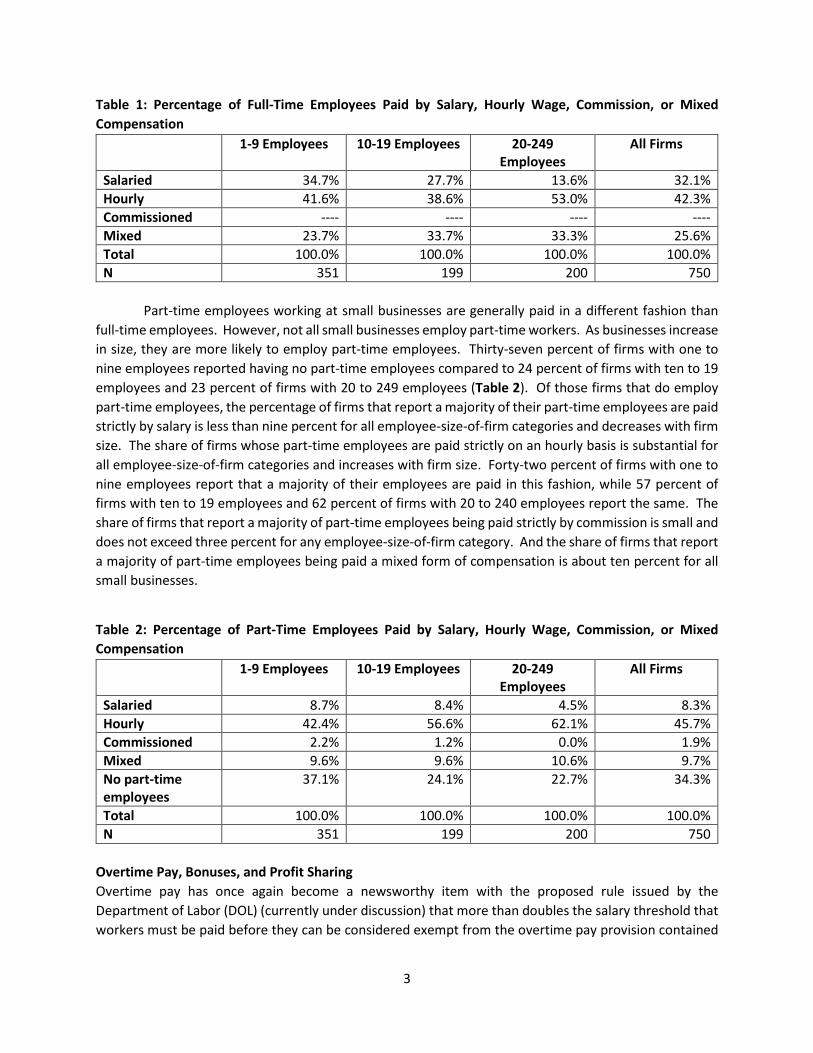
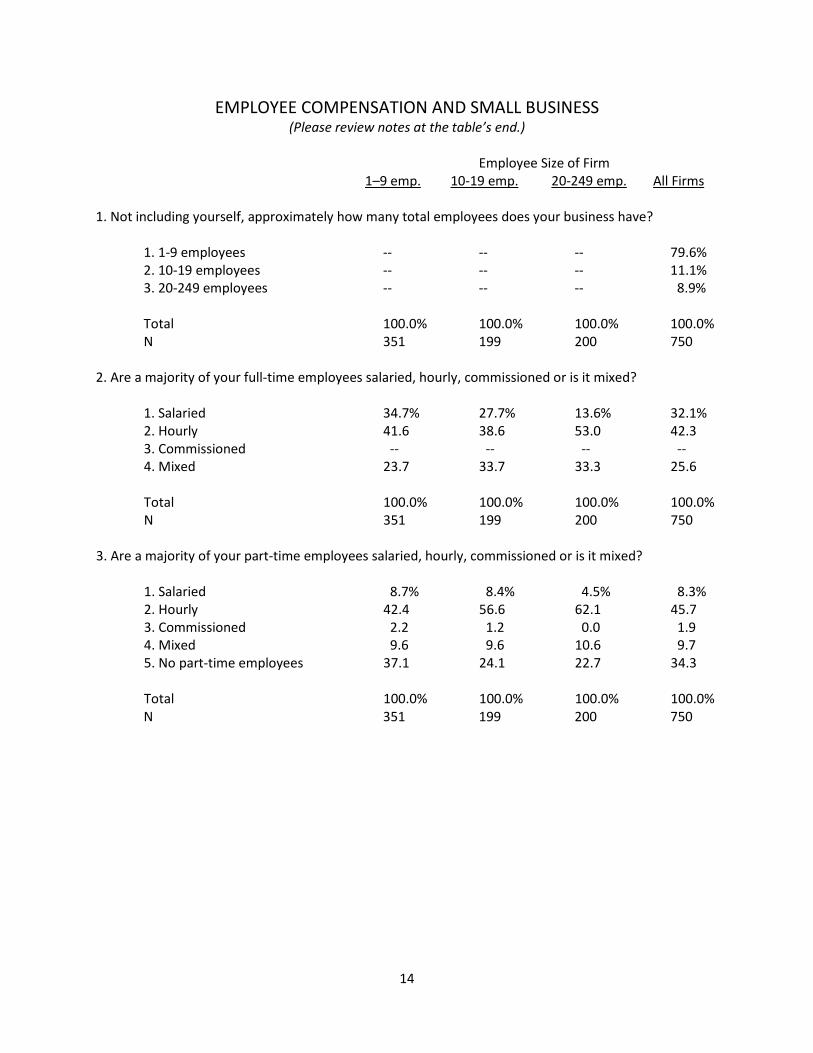
4 Thirty-five percent of firms with one to nine employees report that a majority of their full-time employees are salaried, compared to 28 percent at firms with ten to 19 employees, and 14 percent at firms with 20 to 249 employees (Table 1 and Q#2). The prevalence of hourly full-time employees as a majority share of full-time employees also varies with firm size, but not in a monotonic fashion. Forty-two percent of firms with one to nine employees report that a majority of their employees are paid hourly wages (Q#3). This percentage is slightly higher than the share of firms with ten to 19 employees (39 percent), but considerably lower than the share with 20 to 249 employees (53 percent). The share of businesses reporting that a majority of their full-time employees receive a mixed form of financial compensation (some combination of salary, hourly wage, and commission) is substantially lower for the smallest firms (24 percent) than it is for firms with ten or more employees (about 33 percent) which typically have more complex business structures.
1 Small Business Economic Trends, (ids.) William C. Dunkelberg and Holly Wade, NFIB Research Foundation. 2 Society for Human Resource Management 2015 Customized Benchmarking Database (unpublished data). 3 Full methodology on page 26 of this report. 4 Throughout this report, a business’ size is defined strictly by the number of employees employed by that business, and not by any other metrics such as total assets, receipts, market capitalization, etc.
3
Table 1: Percentage of Full-Time Employees Paid by Salary, Hourly Wage, Commission, or Mixed Compensation
1-9 Employees 10-19 Employees 20-249 Employees
All Firms
Salaried 34.7% 27.7% 13.6% 32.1% Hourly 41.6% 38.6% 53.0% 42.3% Commissioned ---- ---- ---- ---- Mixed 23.7% 33.7% 33.3% 25.6% Total 100.0% 100.0% 100.0% 100.0% N 351 199 200 750
Part-time employees working at small businesses are generally paid in a different fashion than full-time employees. However, not all small businesses employ part-time workers. As businesses increase in size, they are more likely to employ part-time employees. Thirty-seven percent of firms with one to nine employees reported having no part-time employees compared to 24 percent of firms with ten to 19 employees and 23 percent of firms with 20 to 249 employees (Table 2). Of those firms that do employ part-time employees, the percentage of firms that report a majority of their part-time employees are paid strictly by salary is less than nine percent for all employee-size-of-firm categories and decreases with firm size. The share of firms whose part-time employees are paid strictly on an hourly basis is substantial for all employee-size-of-firm categories and increases with firm size. Forty-two percent of firms with one to nine employees report that a majority of their employees are paid in this fashion, while 57 percent of firms with ten to 19 employees and 62 percent of firms with 20 to 240 employees report the same. The share of firms that report a majority of part-time employees being paid strictly by commission is small and does not exceed three percent for any employee-size-of-firm category. And the share of firms that report a majority of part-time employees being paid a mixed form of compensation is about ten percent for all small businesses.
Table 2: Percentage of Part-Time Employees Paid by Salary, Hourly Wage, Commission, or Mixed Compensation
1-9 Employees 10-19 Employees 20-249 Employees
All Firms
Salaried 8.7% 8.4% 4.5% 8.3% Hourly 42.4% 56.6% 62.1% 45.7% Commissioned 2.2% 1.2% 0.0% 1.9% Mixed 9.6% 9.6% 10.6% 9.7% No part-time employees
37.1% 24.1% 22.7% 34.3%
Total 100.0% 100.0% 100.0% 100.0% N 351 199 200 750
Overtime Pay, Bonuses, and Profit Sharing Overtime pay has once again become a newsworthy item with the proposed rule issued by the Department of Labor (DOL) (currently under discussion) that more than doubles the salary threshold that workers must be paid before they can be considered exempt from the overtime pay provision contained
4
in the Fair Labor Standards Act. At present, the salary threshold for overtime pay eligibility is $455 per week, or $23,660 per year. The new rule sets the salary threshold for overtime pay eligibility at the 40th percentile of earnings for full-time salaried workers, as determined by the Department of Labor’s Bureau of Labor Statistics (BLS). Based on current BLS data, that amount is projected to be $970 per week in 2016, or $50,440 per year.
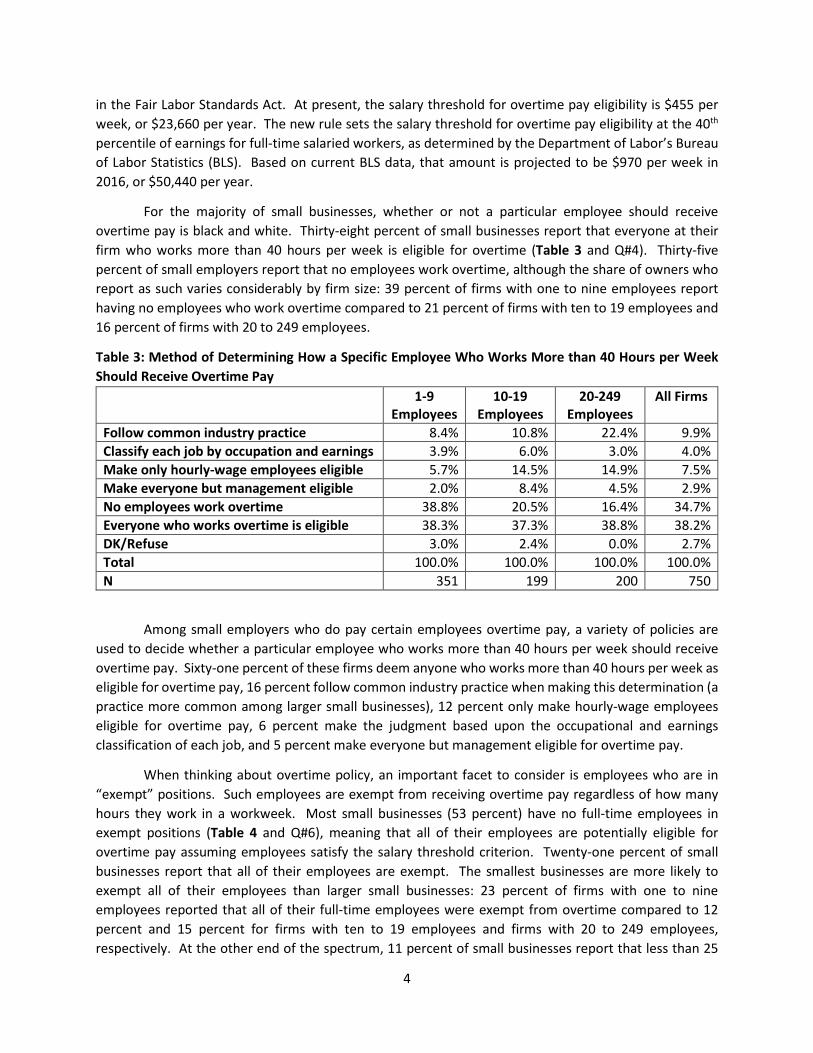
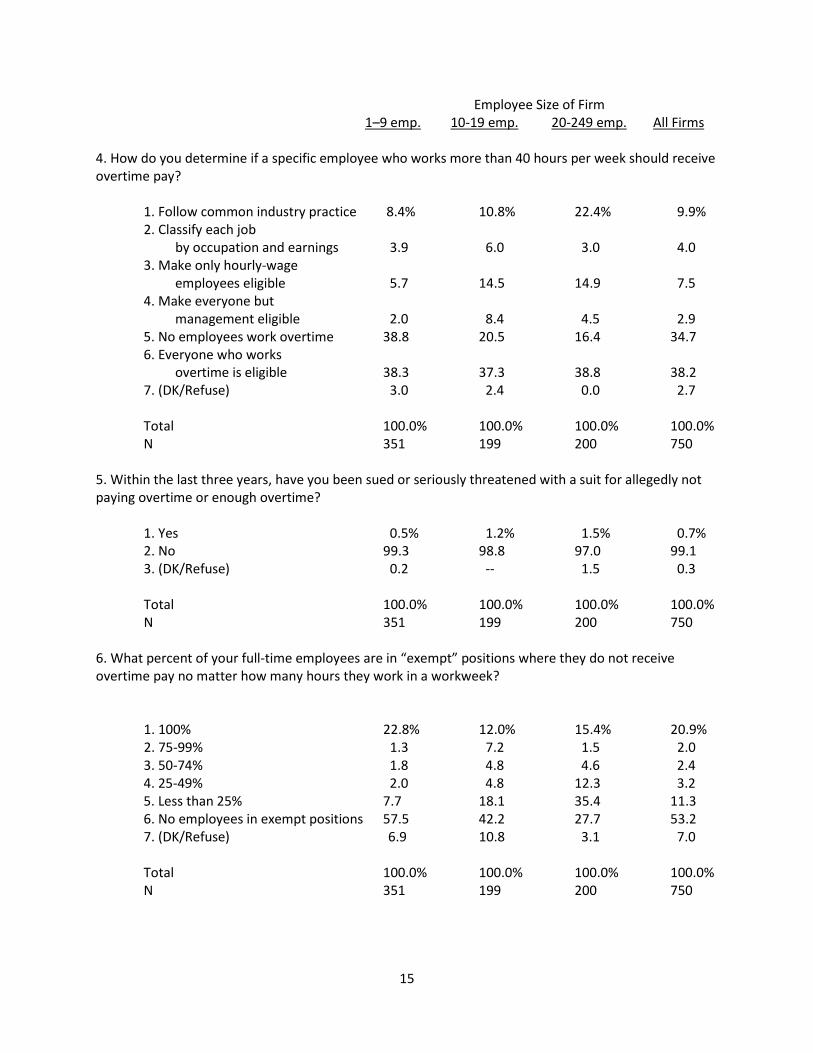
For the majority of small businesses, whether or not a particular employee should receive overtime pay is black and white. Thirty-eight percent of small businesses report that everyone at their firm who works more than 40 hours per week is eligible for overtime (Table 3 and Q#4). Thirty-five percent of small employers report that no employees work overtime, although the share of owners who report as such varies considerably by firm size: 39 percent of firms with one to nine employees report having no employees who work overtime compared to 21 percent of firms with ten to 19 employees and 16 percent of firms with 20 to 249 employees.
Table 3: Method of Determining How a Specific Employee Who Works More than 40 Hours per Week Should Receive Overtime Pay
1-9 Employees
10-19 Employees
20-249 Employees
All Firms
Follow common industry practice 8.4% 10.8% 22.4% 9.9% Classify each job by occupation and earnings 3.9% 6.0% 3.0% 4.0% Make only hourly-wage employees eligible 5.7% 14.5% 14.9% 7.5% Make everyone but management eligible 2.0% 8.4% 4.5% 2.9% No employees work overtime 38.8% 20.5% 16.4% 34.7% Everyone who works overtime is eligible 38.3% 37.3% 38.8% 38.2% DK/Refuse 3.0% 2.4% 0.0% 2.7% Total 100.0% 100.0% 100.0% 100.0% N 351 199 200 750
Among small employers who do pay certain employees overtime pay, a variety of policies are used to decide whether a particular employee who works more than 40 hours per week should receive overtime pay. Sixty-one percent of these firms deem anyone who works more than 40 hours per week as eligible for overtime pay, 16 percent follow common industry practice when making this determination (a practice more common among larger small businesses), 12 percent only make hourly-wage employees eligible for overtime pay, 6 percent make the judgment based upon the occupational and earnings classification of each job, and 5 percent make everyone but management eligible for overtime pay.
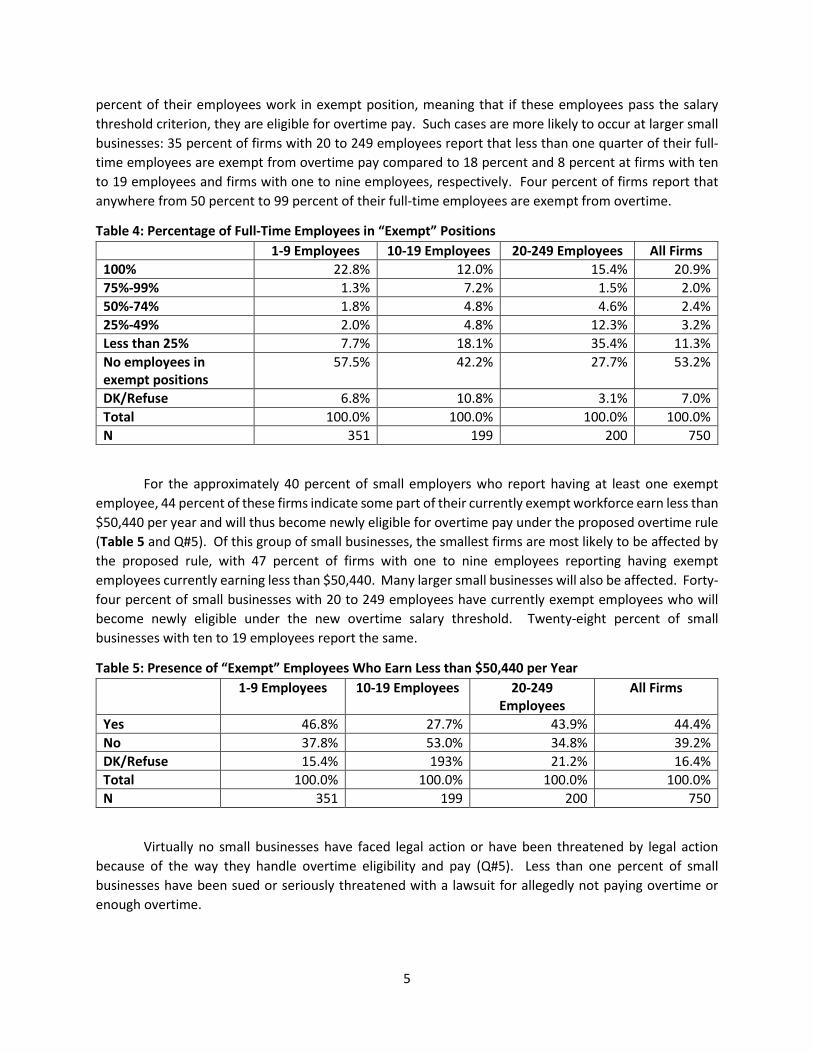
When thinking about overtime policy, an important facet to consider is employees who are in “exempt” positions. Such employees are exempt from receiving overtime pay regardless of how many hours they work in a workweek. Most small businesses (53 percent) have no full-time employees in exempt positions (Table 4 and Q#6), meaning that all of their employees are potentially eligible for overtime pay assuming employees satisfy the salary threshold criterion. Twenty-one percent of small businesses report that all of their employees are exempt. The smallest businesses are more likely to exempt all of their employees than larger small businesses: 23 percent of firms with one to nine employees reported that all of their full-time employees were exempt from overtime compared to 12 percent and 15 percent for firms with ten to 19 employees and firms with 20 to 249 employees, respectively. At the other end of the spectrum, 11 percent of small businesses report that less than 25
5
percent of their employees work in exempt position, meaning that if these employees pass the salary threshold criterion, they are eligible for overtime pay. Such cases are more likely to occur at larger small businesses: 35 percent of firms with 20 to 249 employees report that less than one quarter of their full-time employees are exempt from overtime pay compared to 18 percent and 8 percent at firms with ten to 19 employees and firms with one to nine employees, respectively. Four percent of firms report that anywhere from 50 percent to 99 percent of their full-time employees are exempt from overtime.
Table 4: Percentage of Full-Time Employees in “Exempt” Positions 1-9 Employees 10-19 Employees 20-249 Employees All Firms 100% 22.8% 12.0% 15.4% 20.9% 75%-99% 1.3% 7.2% 1.5% 2.0% 50%-74% 1.8% 4.8% 4.6% 2.4% 25%-49% 2.0% 4.8% 12.3% 3.2% Less than 25% 7.7% 18.1% 35.4% 11.3% No employees in exempt positions
57.5% 42.2% 27.7% 53.2%
DK/Refuse 6.8% 10.8% 3.1% 7.0% Total 100.0% 100.0% 100.0% 100.0% N 351 199 200 750
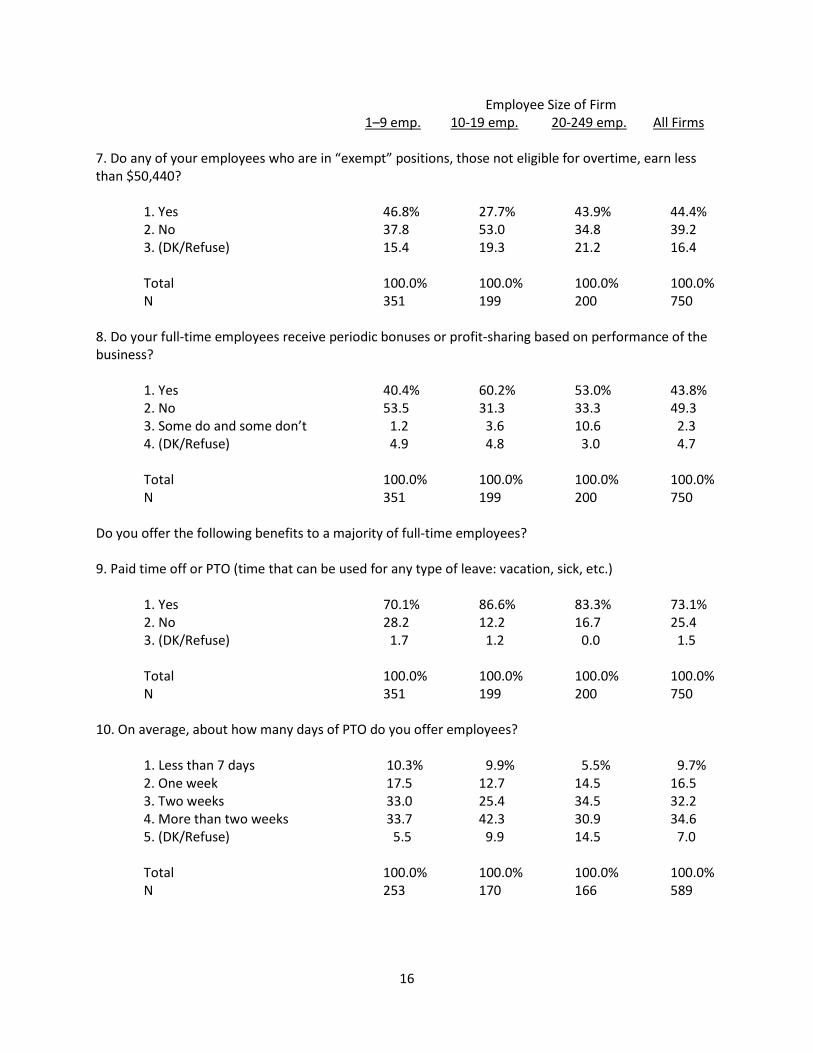
For the approximately 40 percent of small employers who report having at least one exempt employee, 44 percent of these firms indicate some part of their currently exempt workforce earn less than $50,440 per year and will thus become newly eligible for overtime pay under the proposed overtime rule (Table 5 and Q#5). Of this group of small businesses, the smallest firms are most likely to be affected by the proposed rule, with 47 percent of firms with one to nine employees reporting having exempt employees currently earning less than $50,440. Many larger small businesses will also be affected. Forty-four percent of small businesses with 20 to 249 employees have currently exempt employees who will become newly eligible under the new overtime salary threshold. Twenty-eight percent of small businesses with ten to 19 employees report the same.
Table 5: Presence of “Exempt” Employees Who Earn Less than $50,440 per Year 1-9 Employees 10-19 Employees 20-249
Employees All Firms
Yes 46.8% 27.7% 43.9% 44.4% No 37.8% 53.0% 34.8% 39.2% DK/Refuse 15.4% 193% 21.2% 16.4% Total 100.0% 100.0% 100.0% 100.0% N 351 199 200 750
Virtually no small businesses have faced legal action or have been threatened by legal action because of the way they handle overtime eligibility and pay (Q#5). Less than one percent of small businesses have been sued or seriously threatened with a lawsuit for allegedly not paying overtime or enough overtime.
6
A considerable share of small businesses pay their employees periodic bonuses or offer their employees a profit-sharing plan based on the performance of the overall business. Forty-four percent of small employers report that their full-time employees receive such benefits, with the benefit being more frequently offered at larger small businesses (Q#8). The benefit is most common among firms with ten to 19 employees, with 60 percent of such firms offering the benefit to their full-time employees. A majority (53 percent) of owners with 20 to 249 employees also report their full-time employees receiving the benefit. Firms with one to nine employees were least likely to offer the benefit to their employees, although a substantial share—some 40 percent—of these firms still offered bonuses or some form of profit-sharing.
Paid Time Off Not all compensation is pecuniary in nature. Nonfinancial benefits also contribute to an employee’s total compensation and are another means to bid for and retain talent. An important non-pecuniary employee benefit is paid time off from work. Most employers offer these benefits to stay competitive in recruiting and retaining good employees. An employer might offer employees paid time off benefits with contingencies attached, as manifested in paid sick leave benefits, paid vacation benefits, and paid holidays, for example, or the owner might elect to offer employees a paid time off benefit writ broadly and allow employees discretion in when and for what reason to use paid time off, whether it be for medical purposes, the caretaking of family members, leisure, or some other reason. According to the Bureau of Labor Statistics, the majority of private sector workers already have access to such benefits. Sixty-one percent of private sector workers are reported to have access to paid sick leave, 76 percent are reported to have access to paid vacation time, and 77 percent are granted paid holidays by their employers.4F
5 The percentages are even higher when just full-time employees are considered: 74 percent of full-time private sectors workers have access to paid sick leave, 91 percent have access to paid vacation time, and 90 percent are granted paid holidays.
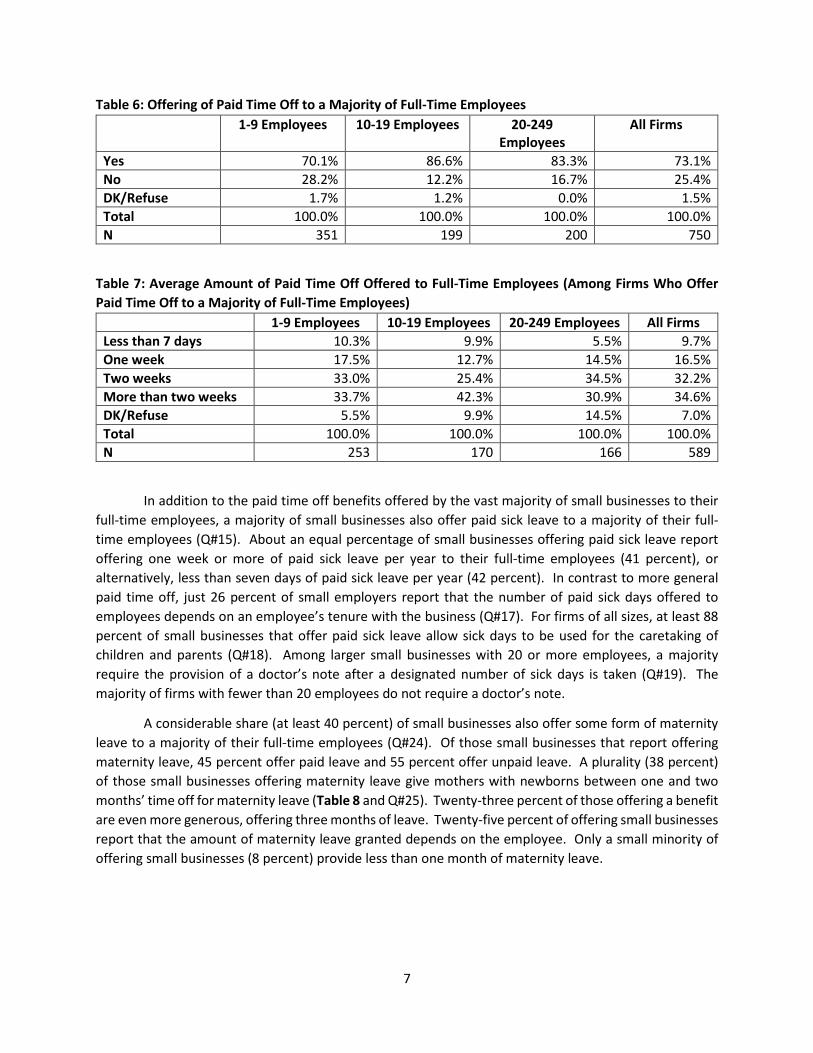
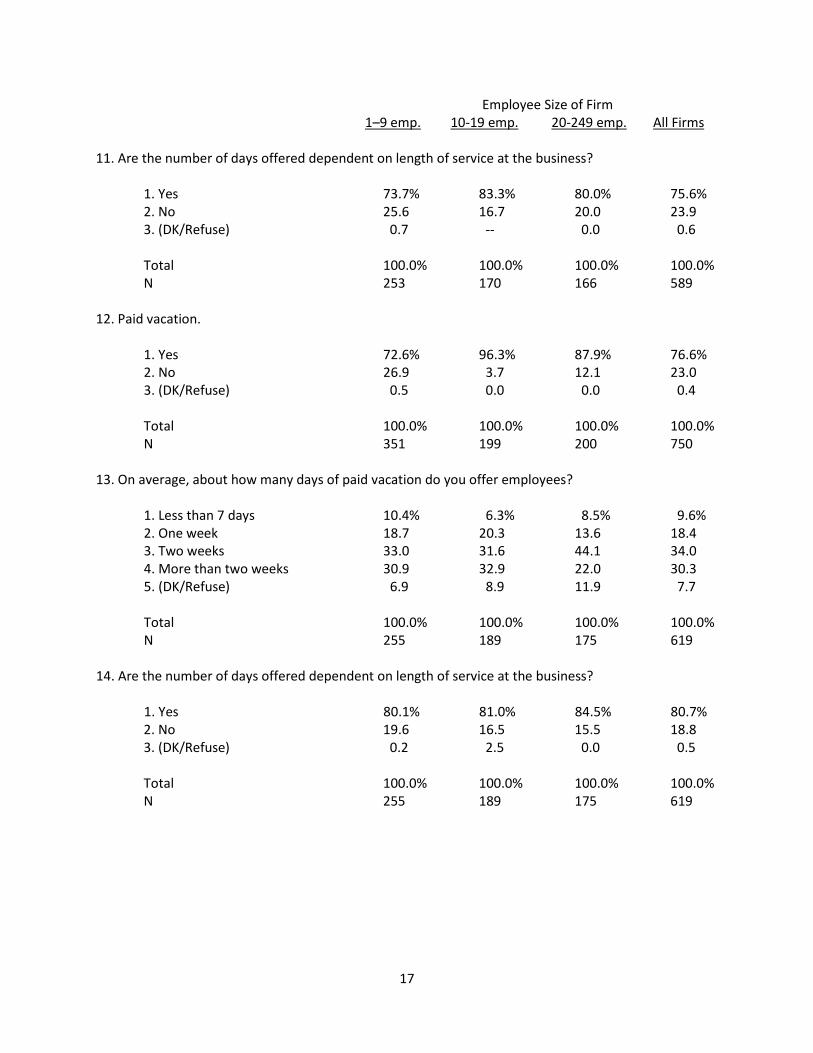
The vast majority of small businesses already offer paid time off (PTO), time that can be used for any type of leave, to a majority of their full-time employees (Q#9). We note that in the survey, PTO was addressed in a standalone question. However, respondents may have confused this specific and distinct benefit with other types of paid leave benefits they offer (such as paid sick leave or paid vacation), as many owners responded that they offer PTO in addition to other paid time off benefits that were addressed in the survey. Overall, 73 percent of small businesses report offering this benefit to majority of their full-time employees (Table 6). Seventy percent of firms with one to nine employees report offering the benefit, compared to 87 percent and 83 percent of firms with ten to 19 employees and firms with 20 to 249 employees respectively. A majority of firms (67 percent) offering paid time off grant employees two weeks or more of paid time off to their employees per year (Table 7 and Q#10). For firms of all sizes, at least 80 percent of firms report that the number of paid time off days offered to employees annually depends on the employee’s length of service at the business (Q#14).
5 “Employee Benefits in the United States—March 2015,” National Compensation Survey, Bureau of Labor Statistics, released July 24, 2015.
7
Table 6: Offering of Paid Time Off to a Majority of Full-Time Employees 1-9 Employees 10-19 Employees 20-249
Employees All Firms
Yes 70.1% 86.6% 83.3% 73.1% No 28.2% 12.2% 16.7% 25.4% DK/Refuse 1.7% 1.2% 0.0% 1.5% Total 100.0% 100.0% 100.0% 100.0% N 351 199 200 750
Table 7: Average Amount of Paid Time Off Offered to Full-Time Employees (Among Firms Who Offer Paid Time Off to a Majority of Full-Time Employees)
1-9 Employees 10-19 Employees 20-249 Employees All Firms Less than 7 days 10.3% 9.9% 5.5% 9.7% One week 17.5% 12.7% 14.5% 16.5% Two weeks 33.0% 25.4% 34.5% 32.2% More than two weeks 33.7% 42.3% 30.9% 34.6% DK/Refuse 5.5% 9.9% 14.5% 7.0% Total 100.0% 100.0% 100.0% 100.0% N 253 170 166 589
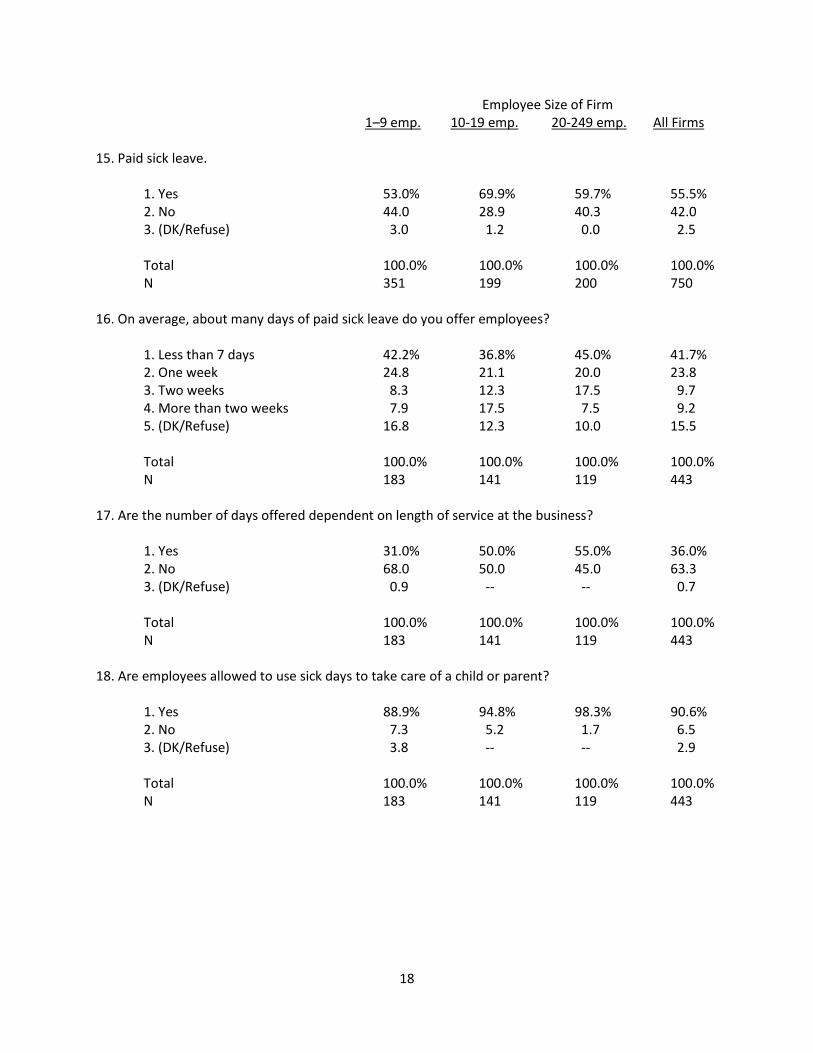
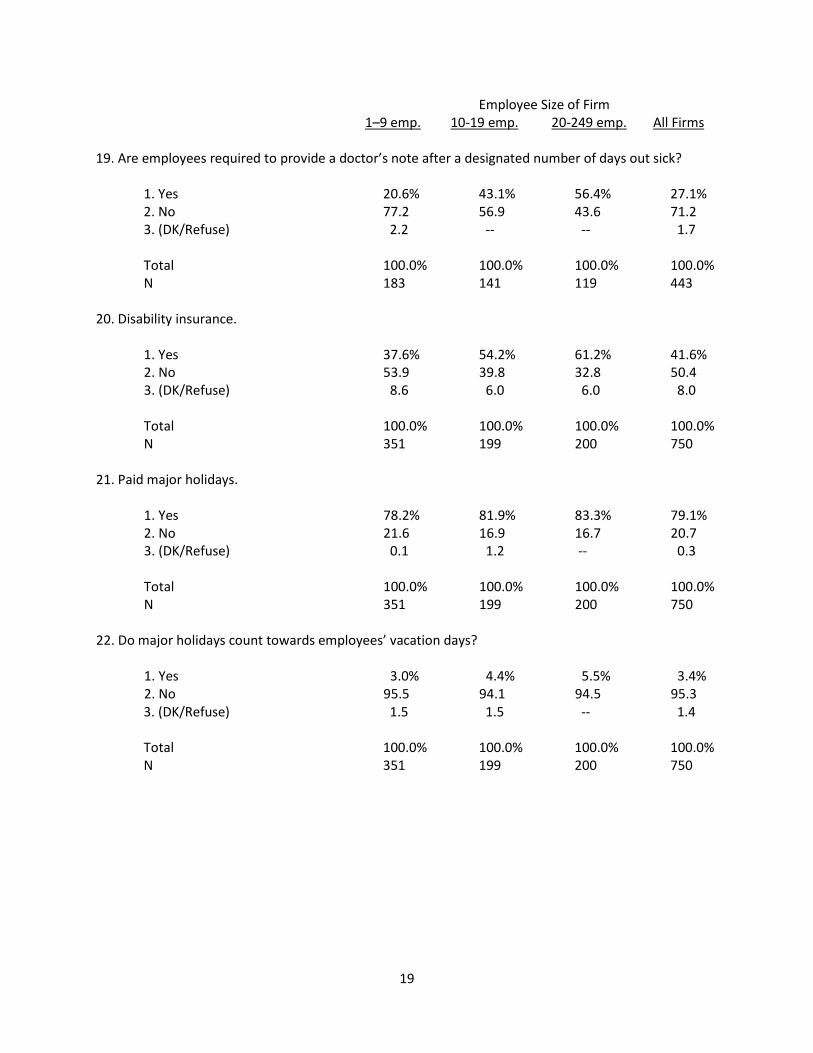
In addition to the paid time off benefits offered by the vast majority of small businesses to their full-time employees, a majority of small businesses also offer paid sick leave to a majority of their full-time employees (Q#15). About an equal percentage of small businesses offering paid sick leave report offering one week or more of paid sick leave per year to their full-time employees (41 percent), or alternatively, less than seven days of paid sick leave per year (42 percent). In contrast to more general paid time off, just 26 percent of small employers report that the number of paid sick days offered to employees depends on an employee’s tenure with the business (Q#17). For firms of all sizes, at least 88 percent of small businesses that offer paid sick leave allow sick days to be used for the caretaking of children and parents (Q#18). Among larger small businesses with 20 or more employees, a majority require the provision of a doctor’s note after a designated number of sick days is taken (Q#19). The majority of firms with fewer than 20 employees do not require a doctor’s note.
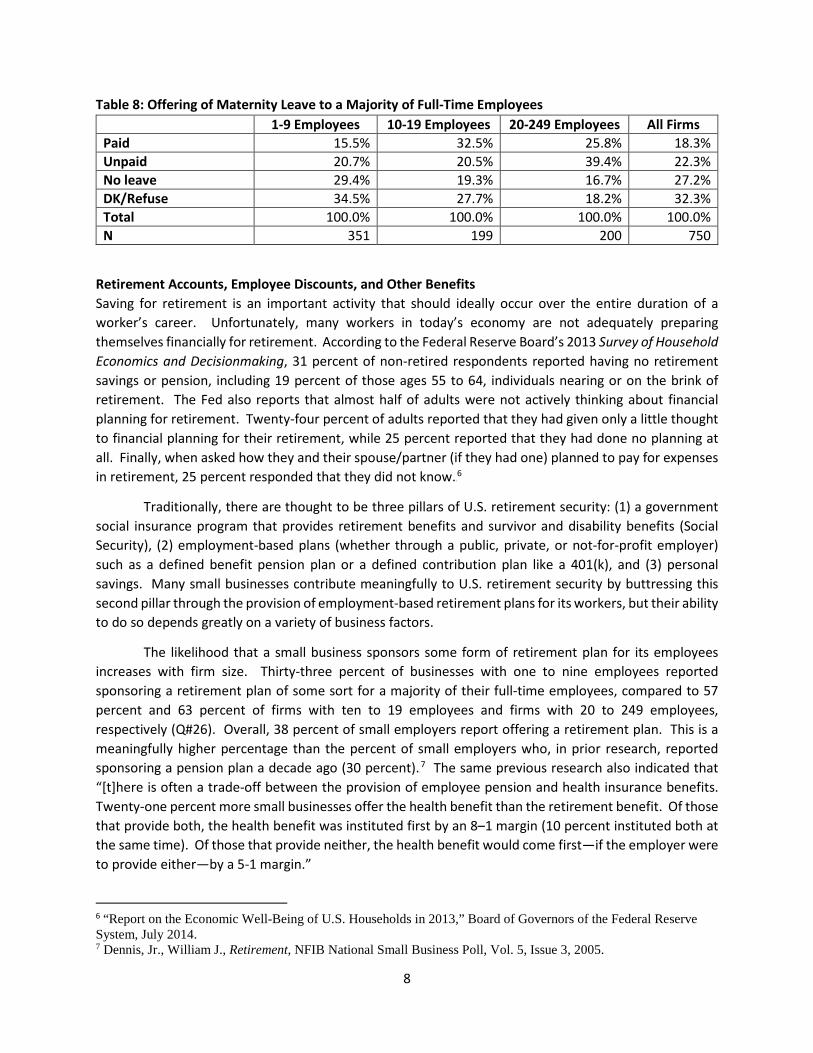
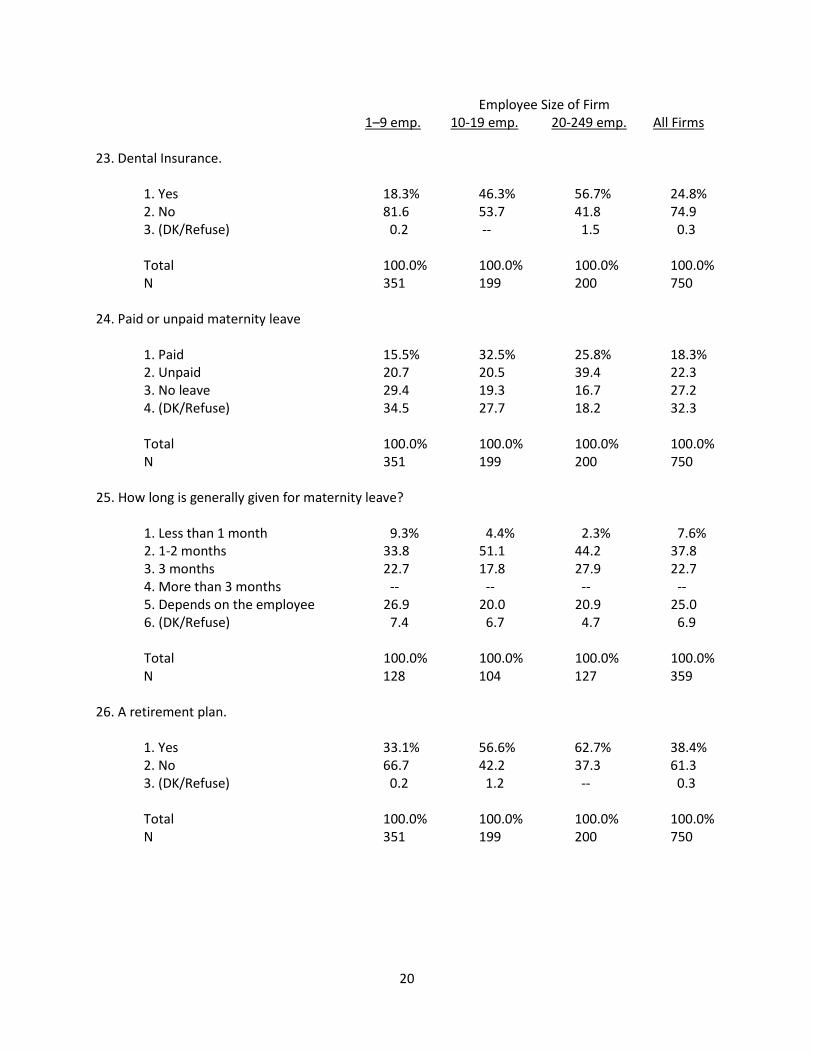
A considerable share (at least 40 percent) of small businesses also offer some form of maternity leave to a majority of their full-time employees (Q#24). Of those small businesses that report offering maternity leave, 45 percent offer paid leave and 55 percent offer unpaid leave. A plurality (38 percent) of those small businesses offering maternity leave give mothers with newborns between one and two months’ time off for maternity leave (Table 8 and Q#25). Twenty-three percent of those offering a benefit are even more generous, offering three months of leave. Twenty-five percent of offering small businesses report that the amount of maternity leave granted depends on the employee. Only a small minority of offering small businesses (8 percent) provide less than one month of maternity leave.
8
Table 8: Offering of Maternity Leave to a Majority of Full-Time Employees 1-9 Employees 10-19 Employees 20-249 Employees All Firms Paid 15.5% 32.5% 25.8% 18.3% Unpaid 20.7% 20.5% 39.4% 22.3% No leave 29.4% 19.3% 16.7% 27.2% DK/Refuse 34.5% 27.7% 18.2% 32.3% Total 100.0% 100.0% 100.0% 100.0% N 351 199 200 750
Retirement Accounts, Employee Discounts, and Other Benefits Saving for retirement is an important activity that should ideally occur over the entire duration of a worker’s career. Unfortunately, many workers in today’s economy are not adequately preparing themselves financially for retirement. According to the Federal Reserve Board’s 2013 Survey of Household Economics and Decisionmaking, 31 percent of non-retired respondents reported having no retirement savings or pension, including 19 percent of those ages 55 to 64, individuals nearing or on the brink of retirement. The Fed also reports that almost half of adults were not actively thinking about financial planning for retirement. Twenty-four percent of adults reported that they had given only a little thought to financial planning for their retirement, while 25 percent reported that they had done no planning at all. Finally, when asked how they and their spouse/partner (if they had one) planned to pay for expenses in retirement, 25 percent responded that they did not know.5F
6
Traditionally, there are thought to be three pillars of U.S. retirement security: (1) a government social insurance program that provides retirement benefits and survivor and disability benefits (Social Security), (2) employment-based plans (whether through a public, private, or not-for-profit employer) such as a defined benefit pension plan or a defined contribution plan like a 401(k), and (3) personal savings. Many small businesses contribute meaningfully to U.S. retirement security by buttressing this second pillar through the provision of employment-based retirement plans for its workers, but their ability to do so depends greatly on a variety of business factors.
The likelihood that a small business sponsors some form of retirement plan for its employees increases with firm size. Thirty-three percent of businesses with one to nine employees reported sponsoring a retirement plan of some sort for a majority of their full-time employees, compared to 57 percent and 63 percent of firms with ten to 19 employees and firms with 20 to 249 employees, respectively (Q#26). Overall, 38 percent of small employers report offering a retirement plan. This is a meaningfully higher percentage than the percent of small employers who, in prior research, reported sponsoring a pension plan a decade ago (30 percent).6F
7 The same previous research also indicated that “[t]here is often a trade-off between the provision of employee pension and health insurance benefits. Twenty-one percent more small businesses offer the health benefit than the retirement benefit. Of those that provide both, the health benefit was instituted first by an 8–1 margin (10 percent instituted both at the same time). Of those that provide neither, the health benefit would come first—if the employer were to provide either—by a 5-1 margin.”
6 “Report on the Economic Well-Being of U.S. Households in 2013,” Board of Governors of the Federal Reserve System, July 2014. 7 Dennis, Jr., William J., Retirement, NFIB National Small Business Poll, Vol. 5, Issue 3, 2005.
9
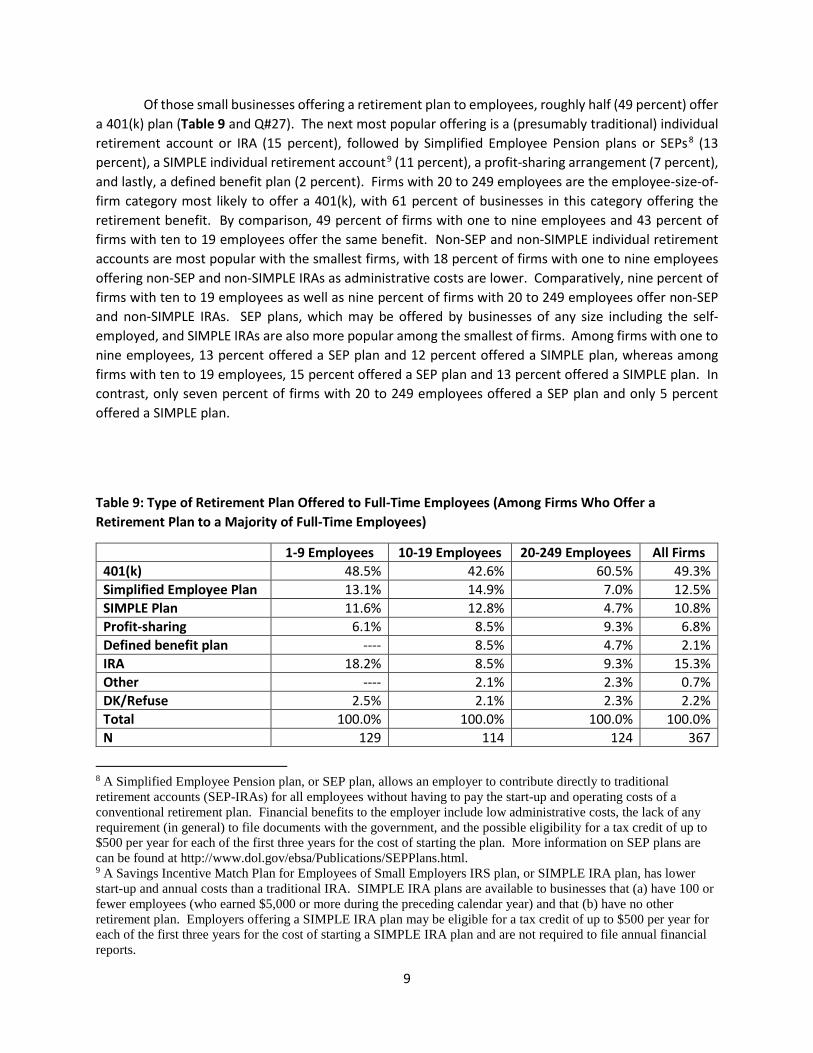
Of those small businesses offering a retirement plan to employees, roughly half (49 percent) offer a 401(k) plan (Table 9 and Q#27). The next most popular offering is a (presumably traditional) individual retirement account or IRA (15 percent), followed by Simplified Employee Pension plans or SEPs7F
8 (13 percent), a SIMPLE individual retirement account8F
9 (11 percent), a profit-sharing arrangement (7 percent), and lastly, a defined benefit plan (2 percent). Firms with 20 to 249 employees are the employee-size-of-firm category most likely to offer a 401(k), with 61 percent of businesses in this category offering the retirement benefit. By comparison, 49 percent of firms with one to nine employees and 43 percent of firms with ten to 19 employees offer the same benefit. Non-SEP and non-SIMPLE individual retirement accounts are most popular with the smallest firms, with 18 percent of firms with one to nine employees offering non-SEP and non-SIMPLE IRAs as administrative costs are lower. Comparatively, nine percent of firms with ten to 19 employees as well as nine percent of firms with 20 to 249 employees offer non-SEP and non-SIMPLE IRAs. SEP plans, which may be offered by businesses of any size including the self-employed, and SIMPLE IRAs are also more popular among the smallest of firms. Among firms with one to nine employees, 13 percent offered a SEP plan and 12 percent offered a SIMPLE plan, whereas among firms with ten to 19 employees, 15 percent offered a SEP plan and 13 percent offered a SIMPLE plan. In contrast, only seven percent of firms with 20 to 249 employees offered a SEP plan and only 5 percent offered a SIMPLE plan.
Table 9: Type of Retirement Plan Offered to Full-Time Employees (Among Firms Who Offer a Retirement Plan to a Majority of Full-Time Employees)
1-9 Employees 10-19 Employees 20-249 Employees All Firms 401(k) 48.5% 42.6% 60.5% 49.3% Simplified Employee Plan 13.1% 14.9% 7.0% 12.5% SIMPLE Plan 11.6% 12.8% 4.7% 10.8% Profit-sharing 6.1% 8.5% 9.3% 6.8% Defined benefit plan ---- 8.5% 4.7% 2.1% IRA 18.2% 8.5% 9.3% 15.3% Other ---- 2.1% 2.3% 0.7% DK/Refuse 2.5% 2.1% 2.3% 2.2% Total 100.0% 100.0% 100.0% 100.0% N 129 114 124 367
8 A Simplified Employee Pension plan, or SEP plan, allows an employer to contribute directly to traditional retirement accounts (SEP-IRAs) for all employees without having to pay the start-up and operating costs of a conventional retirement plan. Financial benefits to the employer include low administrative costs, the lack of any requirement (in general) to file documents with the government, and the possible eligibility for a tax credit of up to $500 per year for each of the first three years for the cost of starting the plan. More information on SEP plans are can be found at http://www.dol.gov/ebsa/Publications/SEPPlans.html. 9 A Savings Incentive Match Plan for Employees of Small Employers IRS plan, or SIMPLE IRA plan, has lower start-up and annual costs than a traditional IRA. SIMPLE IRA plans are available to businesses that (a) have 100 or fewer employees (who earned $5,000 or more during the preceding calendar year) and that (b) have no other retirement plan. Employers offering a SIMPLE IRA plan may be eligible for a tax credit of up to $500 per year for each of the first three years for the cost of starting a SIMPLE IRA plan and are not required to file annual financial reports.
10
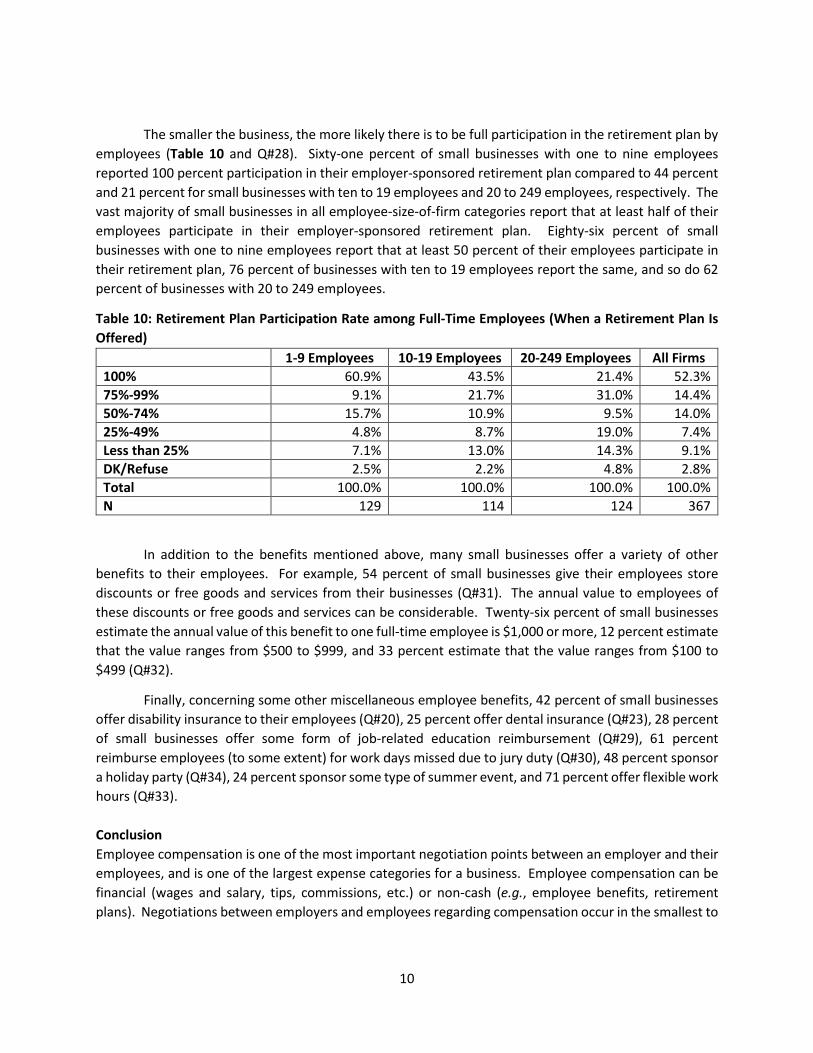
The smaller the business, the more likely there is to be full participation in the retirement plan by employees (Table 10 and Q#28). Sixty-one percent of small businesses with one to nine employees reported 100 percent participation in their employer-sponsored retirement plan compared to 44 percent and 21 percent for small businesses with ten to 19 employees and 20 to 249 employees, respectively. The vast majority of small businesses in all employee-size-of-firm categories report that at least half of their employees participate in their employer-sponsored retirement plan. Eighty-six percent of small businesses with one to nine employees report that at least 50 percent of their employees participate in their retirement plan, 76 percent of businesses with ten to 19 employees report the same, and so do 62 percent of businesses with 20 to 249 employees.
Table 10: Retirement Plan Participation Rate among Full-Time Employees (When a Retirement Plan Is Offered)
1-9 Employees 10-19 Employees 20-249 Employees All Firms 100% 60.9% 43.5% 21.4% 52.3% 75%-99% 9.1% 21.7% 31.0% 14.4% 50%-74% 15.7% 10.9% 9.5% 14.0% 25%-49% 4.8% 8.7% 19.0% 7.4% Less than 25% 7.1% 13.0% 14.3% 9.1% DK/Refuse 2.5% 2.2% 4.8% 2.8% Total 100.0% 100.0% 100.0% 100.0% N 129 114 124 367
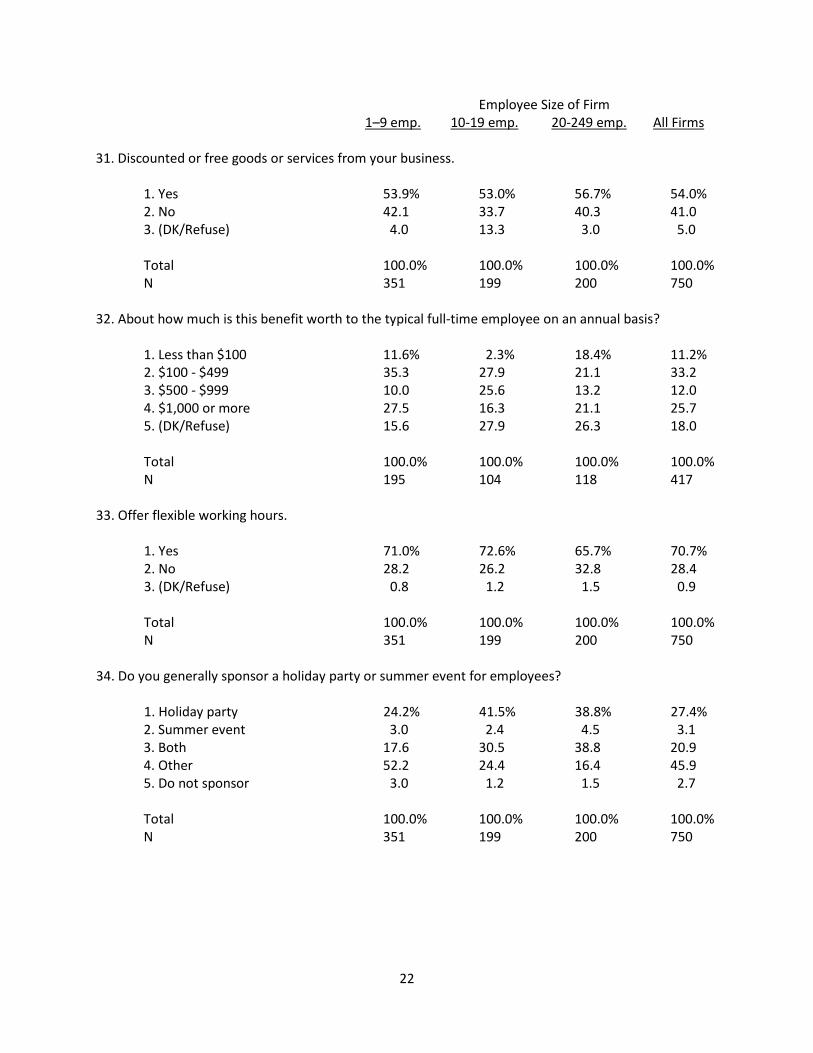
In addition to the benefits mentioned above, many small businesses offer a variety of other benefits to their employees. For example, 54 percent of small businesses give their employees store discounts or free goods and services from their businesses (Q#31). The annual value to employees of these discounts or free goods and services can be considerable. Twenty-six percent of small businesses estimate the annual value of this benefit to one full-time employee is $1,000 or more, 12 percent estimate that the value ranges from $500 to $999, and 33 percent estimate that the value ranges from $100 to $499 (Q#32).
Finally, concerning some other miscellaneous employee benefits, 42 percent of small businesses offer disability insurance to their employees (Q#20), 25 percent offer dental insurance (Q#23), 28 percent of small businesses offer some form of job-related education reimbursement (Q#29), 61 percent reimburse employees (to some extent) for work days missed due to jury duty (Q#30), 48 percent sponsor a holiday party (Q#34), 24 percent sponsor some type of summer event, and 71 percent offer flexible work hours (Q#33).
Conclusion Employee compensation is one of the most important negotiation points between an employer and their employees, and is one of the largest expense categories for a business. Employee compensation can be financial (wages and salary, tips, commissions, etc.) or non-cash (e.g., employee benefits, retirement plans). Negotiations between employers and employees regarding compensation occur in the smallest to
11
the largest sized businesses. The types of compensation packages differ due to a variety of factors including profitability, industry, size of business, and seasonality to name a few.
This survey reports on the current landscape of employee compensation plans in small businesses and challenges the notion that government directed compensation mandates are “much-needed” policies. The reality of operating a small business is often not fully appreciated by the general public. And even the opinions of small employers differ on policies related to employee pay including minimum wage and mandated paid leave. But compensation packages are not developed in a silo, rather they are negotiated based on market forces and business profitability among other factors. Most small employers offer comprehensive packages which include forms of paid leave that employees can use for a variety of purposes. However, due to a variety of reasons, some employers do not, or offer limited benefits. Small employers operate in complex, non-uniform business climates that are often not conducive to one-size-fits-all government mandates.
For example, one of the more recent efforts to regulate compensation is a proposed rule by the Department of Labor that would more than double the salary threshold for employees before they may be considered “exempt” from overtime rules. The results of this survey suggest that a meaningful number of small businesses will be adversely impacted by this overtime rule should it be implemented, with 25 percent of small businesses having 50 percent or more of their workforce in exempt positions, and with 44 percent of these small businesses having employees currently earning less than the proposed new threshold of $50,440 per year.
The survey results also indicate that the vast majority already offer generous paid time off benefits to their full-time employees, with 73 percent of small businesses offering paid time off to a majority of their full-time employees, and with 66 percent of these small businesses granting their full-time employees two weeks or more of paid time off per year. The total amount of compensation that can be paid to a worker is determined by worker productivity, the value the worker brings to the firm. As government regulations and laws impacting the negotiation between employer and employee proliferate (e.g. ACA, NLRB etc.), opportunities to provide more diverse and less standard benefits will be restricted as regulatory costs crowd out other benefit opportunities.
12
EXECUTIVE SUMMARY Forty-two percent of small employers report that a majority of their full-time employees are paid
hourly wages, 32 percent report that a majority are salaried employees and less than 1 percent report that a majority are paid on commission. Twenty-six percent of small employers report a mix of all three types of pay.
Part-time employees are predominantly paid on an hourly basis. Forty-six percent of small employers report that the majority of their part-time employees are paid hourly wages and 8 percent report that a majority are salaried. Thirty-four percent of small employers report that they do not employ any part-time employees.
Thirty-eight percent of small employers pay overtime to everyone who works more than 40 hours a week. Almost 35 percent of small employers do not have any employees who work overtime. And 10 percent determine employee overtime eligibility using common industry practices.
Most small businesses (53%) have no full-time employees in exempt positions, meaning that all of their employees are potentially eligible for overtime pay assuming employees satisfy the salary threshold criterion. Twenty-one percent of small businesses report that all their employees are exempt.
Of small employers who report having at least one exempt employee, 44 percent indicate that some part of their currently exempt workforce earn less than $50,440 per year and will thus become newly eligible for overtime pay under the proposed overtime rule.
The vast majority of small employers (73%) offer paid time off (PTO) to the majority of their full-time employees, and 67 percent of them offer two week or more of leave. The number of days offered is dependent on an employee’s length of service in 76 percent of small businesses offering the benefit.
Over 3/4 of small employers (77%) offer paid vacation to the majority of their full-time employees, with 64 percent of them offering two week or more.
Fifty-six percent of small employers offer paid sick leave to the majority of their full-time employees with 43 percent of them offering one week or more paid sick leave. The number of days offered is dependent on employee’s length of service in 36 percent of small businesses offering the benefit.
Nearly 80 percent of small employers offer paid major holidays to the majority of their full-time employees.
Approximately 38 percent of small employers offer a retirement plan to the majority of their full-time employees, and about half of them offer a 401(k). Of those who offer, 52 percent report that all their employees participate in the plan.
About 71 percent of small employers offer flexible working hours for the majority of their full-time employees.
13
The vast majority of small employers do not have a formal policy for handling time-off requests
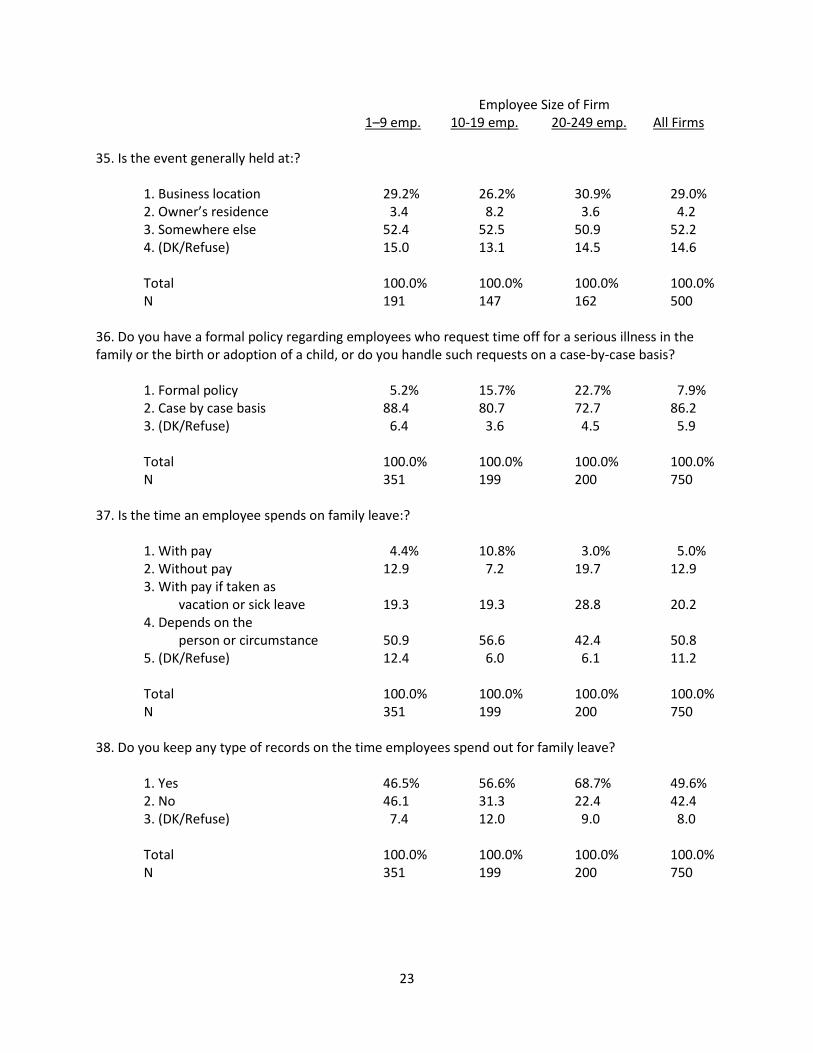
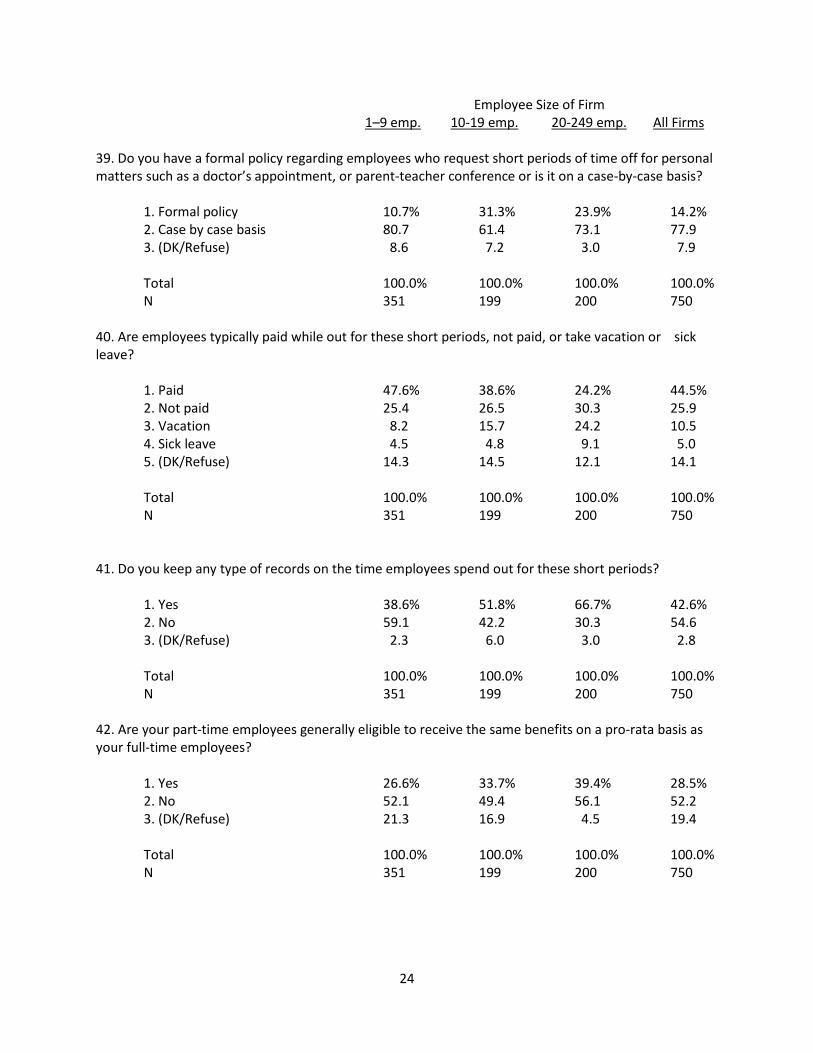
but rather deal with them on a case by case basis. About 86 percent of small employers handle time-off requests due to a serious illness or birth or adoption of a child on a case by case basis. For short periods of time off, approximately 78 percent of small employers handle requests on a case by case basis.
About half of small employers keep records on the time employees spend out for family leave, and 43 percent keep records on the time employees spend out on short periods of time.
14
EMPLOYEE COMPENSATION AND SMALL BUSINESS (Please review notes at the table’s end.)
Employee Size of Firm 1–9 emp. 10-19 emp. 20-249 emp. All Firms 1. Not including yourself, approximately how many total employees does your business have? 1. 1-9 employees -- -- -- 79.6% 2. 10-19 employees -- -- -- 11.1% 3. 20-249 employees -- -- -- 8.9% Total 100.0% 100.0% 100.0% 100.0% N 351 199 200 750 2. Are a majority of your full-time employees salaried, hourly, commissioned or is it mixed? 1. Salaried 34.7% 27.7% 13.6% 32.1% 2. Hourly 41.6 38.6 53.0 42.3 3. Commissioned -- -- -- -- 4. Mixed 23.7 33.7 33.3 25.6 Total 100.0% 100.0% 100.0% 100.0% N 351 199 200 750 3. Are a majority of your part-time employees salaried, hourly, commissioned or is it mixed? 1. Salaried 8.7% 8.4% 4.5% 8.3% 2. Hourly 42.4 56.6 62.1 45.7 3. Commissioned 2.2 1.2 0.0 1.9 4. Mixed 9.6 9.6 10.6 9.7 5. No part-time employees 37.1 24.1 22.7 34.3 Total 100.0% 100.0% 100.0% 100.0% N 351 199 200 750
15
Employee Size of Firm 1–9 emp. 10-19 emp. 20-249 emp. All Firms 4. How do you determine if a specific employee who works more than 40 hours per week should receive overtime pay?
1. Follow common industry practice 8.4% 10.8% 22.4% 9.9% 2. Classify each job
by occupation and earnings 3.9 6.0 3.0 4.0 3. Make only hourly-wage
employees eligible 5.7 14.5 14.9 7.5 4. Make everyone but
management eligible 2.0 8.4 4.5 2.9 5. No employees work overtime 38.8 20.5 16.4 34.7 6. Everyone who works
overtime is eligible 38.3 37.3 38.8 38.2 7. (DK/Refuse) 3.0 2.4 0.0 2.7
Total 100.0% 100.0% 100.0% 100.0% N 351 199 200 750 5. Within the last three years, have you been sued or seriously threatened with a suit for allegedly not paying overtime or enough overtime? 1. Yes 0.5% 1.2% 1.5% 0.7% 2. No 99.3 98.8 97.0 99.1
3. (DK/Refuse) 0.2 -- 1.5 0.3 Total 100.0% 100.0% 100.0% 100.0% N 351 199 200 750 6. What percent of your full-time employees are in “exempt” positions where they do not receive overtime pay no matter how many hours they work in a workweek? 1. 100% 22.8% 12.0% 15.4% 20.9%
2. 75-99% 1.3 7.2 1.5 2.0 3. 50-74% 1.8 4.8 4.6 2.4 4. 25-49% 2.0 4.8 12.3 3.2 5. Less than 25% 7.7 18.1 35.4 11.3
6. No employees in exempt positions 57.5 42.2 27.7 53.2 7. (DK/Refuse) 6.9 10.8 3.1 7.0
Total 100.0% 100.0% 100.0% 100.0% N 351 199 200 750
16
Employee Size of Firm 1–9 emp. 10-19 emp. 20-249 emp. All Firms 7. Do any of your employees who are in “exempt” positions, those not eligible for overtime, earn less than $50,440? 1. Yes 46.8% 27.7% 43.9% 44.4% 2. No 37.8 53.0 34.8 39.2 3. (DK/Refuse) 15.4 19.3 21.2 16.4 Total 100.0% 100.0% 100.0% 100.0% N 351 199 200 750 8. Do your full-time employees receive periodic bonuses or profit-sharing based on performance of the business? 1. Yes 40.4% 60.2% 53.0% 43.8% 2. No 53.5 31.3 33.3 49.3 3. Some do and some don’t 1.2 3.6 10.6 2.3 4. (DK/Refuse) 4.9 4.8 3.0 4.7 Total 100.0% 100.0% 100.0% 100.0% N 351 199 200 750 Do you offer the following benefits to a majority of full-time employees? 9. Paid time off or PTO (time that can be used for any type of leave: vacation, sick, etc.) 1. Yes 70.1% 86.6% 83.3% 73.1% 2. No 28.2 12.2 16.7 25.4 3. (DK/Refuse) 1.7 1.2 0.0 1.5 Total 100.0% 100.0% 100.0% 100.0% N 351 199 200 750 10. On average, about how many days of PTO do you offer employees? 1. Less than 7 days 10.3% 9.9% 5.5% 9.7% 2. One week 17.5 12.7 14.5 16.5 3. Two weeks 33.0 25.4 34.5 32.2 4. More than two weeks 33.7 42.3 30.9 34.6
5. (DK/Refuse) 5.5 9.9 14.5 7.0
Total 100.0% 100.0% 100.0% 100.0% N 253 170 166 589
17
Employee Size of Firm 1–9 emp. 10-19 emp. 20-249 emp. All Firms 11. Are the number of days offered dependent on length of service at the business?
1. Yes 73.7% 83.3% 80.0% 75.6% 2. No 25.6 16.7 20.0 23.9 3. (DK/Refuse) 0.7 -- 0.0 0.6 Total 100.0% 100.0% 100.0% 100.0% N 253 170 166 589 12. Paid vacation.
1. Yes 72.6% 96.3% 87.9% 76.6% 2. No 26.9 3.7 12.1 23.0 3. (DK/Refuse) 0.5 0.0 0.0 0.4 Total 100.0% 100.0% 100.0% 100.0%
N 351 199 200 750 13. On average, about how many days of paid vacation do you offer employees? 1. Less than 7 days 10.4% 6.3% 8.5% 9.6% 2. One week 18.7 20.3 13.6 18.4 3. Two weeks 33.0 31.6 44.1 34.0 4. More than two weeks 30.9 32.9 22.0 30.3 5. (DK/Refuse) 6.9 8.9 11.9 7.7
Total 100.0% 100.0% 100.0% 100.0%
N 255 189 175 619 14. Are the number of days offered dependent on length of service at the business? 1. Yes 80.1% 81.0% 84.5% 80.7% 2. No 19.6 16.5 15.5 18.8 3. (DK/Refuse) 0.2 2.5 0.0 0.5
Total 100.0% 100.0% 100.0% 100.0% N 255 189 175 619
18
Employee Size of Firm 1–9 emp. 10-19 emp. 20-249 emp. All Firms 15. Paid sick leave.
1. Yes 53.0% 69.9% 59.7% 55.5% 2. No 44.0 28.9 40.3 42.0 3. (DK/Refuse) 3.0 1.2 0.0 2.5 Total 100.0% 100.0% 100.0% 100.0%
N 351 199 200 750 16. On average, about many days of paid sick leave do you offer employees? 1. Less than 7 days 42.2% 36.8% 45.0% 41.7% 2. One week 24.8 21.1 20.0 23.8 3. Two weeks 8.3 12.3 17.5 9.7 4. More than two weeks 7.9 17.5 7.5 9.2 5. (DK/Refuse) 16.8 12.3 10.0 15.5
Total 100.0% 100.0% 100.0% 100.0%
N 183 141 119 443 17. Are the number of days offered dependent on length of service at the business? 1. Yes 31.0% 50.0% 55.0% 36.0% 2. No 68.0 50.0 45.0 63.3 3. (DK/Refuse) 0.9 -- -- 0.7
Total 100.0% 100.0% 100.0% 100.0% N 183 141 119 443
18. Are employees allowed to use sick days to take care of a child or parent? 1. Yes 88.9% 94.8% 98.3% 90.6% 2. No 7.3 5.2 1.7 6.5 3. (DK/Refuse) 3.8 -- -- 2.9
Total 100.0% 100.0% 100.0% 100.0% N 183 141 119 443
19
Employee Size of Firm 1–9 emp. 10-19 emp. 20-249 emp. All Firms 19. Are employees required to provide a doctor’s note after a designated number of days out sick?
1. Yes 20.6% 43.1% 56.4% 27.1% 2. No 77.2 56.9 43.6 71.2 3. (DK/Refuse) 2.2 -- -- 1.7
Total 100.0% 100.0% 100.0% 100.0% N 183 141 119 443
20. Disability insurance.
1. Yes 37.6% 54.2% 61.2% 41.6% 2. No 53.9 39.8 32.8 50.4 3. (DK/Refuse) 8.6 6.0 6.0 8.0 Total 100.0% 100.0% 100.0% 100.0%
N 351 199 200 750 21. Paid major holidays. 1. Yes 78.2% 81.9% 83.3% 79.1% 2. No 21.6 16.9 16.7 20.7 3. (DK/Refuse) 0.1 1.2 -- 0.3 Total 100.0% 100.0% 100.0% 100.0% N 351 199 200 750 22. Do major holidays count towards employees’ vacation days?
1. Yes 3.0% 4.4% 5.5% 3.4% 2. No 95.5 94.1 94.5 95.3 3. (DK/Refuse) 1.5 1.5 -- 1.4 Total 100.0% 100.0% 100.0% 100.0% N 351 199 200 750
20
Employee Size of Firm 1–9 emp. 10-19 emp. 20-249 emp. All Firms 23. Dental Insurance.
1. Yes 18.3% 46.3% 56.7% 24.8% 2. No 81.6 53.7 41.8 74.9 3. (DK/Refuse) 0.2 -- 1.5 0.3 Total 100.0% 100.0% 100.0% 100.0% N 351 199 200 750 24. Paid or unpaid maternity leave
1. Paid 15.5% 32.5% 25.8% 18.3% 2. Unpaid 20.7 20.5 39.4 22.3 3. No leave 29.4 19.3 16.7 27.2
4. (DK/Refuse) 34.5 27.7 18.2 32.3 Total 100.0% 100.0% 100.0% 100.0% N 351 199 200 750 25. How long is generally given for maternity leave? 1. Less than 1 month 9.3% 4.4% 2.3% 7.6%
2. 1-2 months 33.8 51.1 44.2 37.8 3. 3 months 22.7 17.8 27.9 22.7 4. More than 3 months -- -- -- -- 5. Depends on the employee 26.9 20.0 20.9 25.0 6. (DK/Refuse) 7.4 6.7 4.7 6.9
Total 100.0% 100.0% 100.0% 100.0% N 128 104 127 359 26. A retirement plan.
1. Yes 33.1% 56.6% 62.7% 38.4%
2. No 66.7 42.2 37.3 61.3 3. (DK/Refuse) 0.2 1.2 -- 0.3 Total 100.0% 100.0% 100.0% 100.0% N 351 199 200 750

21
Employee Size of Firm 1–9 emp. 10-19 emp. 20-249 emp. All Firms 27. What type of a retirement plan is it?
1. 401(k) 48.5% 42.6% 60.5% 49.3% 2. Simplified Employee Plan 13.1 14.9 7.0 12.5 3. SIMPLE plan 11.6 12.8 4.7 10.8 4. Profit-sharing 6.1 8.5 9.3 6.8 5. Defined benefit plan -- 8.5 4.7 2.1 6. IRA 18.2 8.5 9.3 15.3 7. Other -- 2.1 2.3 0.7 8. (DK/Refuse) 2.5 2.1 2.3 2.2
Total 100.0% 100.0% 100.0% 100.0%
N 129 114 124 367 28. What percent of your employees participate in the plan?
1. 100% 60.9% 43.5% 21.4% 52.3% 2. 75-99% 9.1 21.7 31.0 14.4 3. 50-74% 15.7 10.9 9.5 14.0 4. 25-49% 4.8 8.7 19.0 7.4 5. Less than 25% 7.1 13.0 14.3 9.1 6. (DK/Refuse) 2.5 2.2 4.8 2.8
Total 100.0% 100.0% 100.0% 100.0%
N 129 114 124 367 29. Job-related education reimbursement.
1. Yes 23.8% 43.4% 44.8% 27.9% 2. No 70.1 51.8 50.7 66.4 3. (DK/Refuse) 6.0 4.8 4.5 5.8 Total 100.0% 100.0% 100.0% 100.0% N 351 199 200 750 30. Paid jury duty.
1. Yes 59.0% 72.0% 62.7% 60.8% 2. No 28.6 19.5 29.9 27.7 3. (DK/Refuse) 12.4 8.5 7.5 11.6 Total 100.0% 100.0% 100.0% 100.0% N 351 199 200 750
22
Employee Size of Firm 1–9 emp. 10-19 emp. 20-249 emp. All Firms 31. Discounted or free goods or services from your business.
1. Yes 53.9% 53.0% 56.7% 54.0%
2. No 42.1 33.7 40.3 41.0 3. (DK/Refuse) 4.0 13.3 3.0 5.0 Total 100.0% 100.0% 100.0% 100.0% N 351 199 200 750 32. About how much is this benefit worth to the typical full-time employee on an annual basis?
1. Less than $100 11.6% 2.3% 18.4% 11.2% 2. $100 - $499 35.3 27.9 21.1 33.2 3. $500 - $999 10.0 25.6 13.2 12.0 4. $1,000 or more 27.5 16.3 21.1 25.7 5. (DK/Refuse) 15.6 27.9 26.3 18.0
Total 100.0% 100.0% 100.0% 100.0% N 195 104 118 417 33. Offer flexible working hours.
1. Yes 71.0% 72.6% 65.7% 70.7%
2. No 28.2 26.2 32.8 28.4 3. (DK/Refuse) 0.8 1.2 1.5 0.9 Total 100.0% 100.0% 100.0% 100.0% N 351 199 200 750 34. Do you generally sponsor a holiday party or summer event for employees? 1. Holiday party 24.2% 41.5% 38.8% 27.4% 2. Summer event 3.0 2.4 4.5 3.1 3. Both 17.6 30.5 38.8 20.9 4. Other 52.2 24.4 16.4 45.9 5. Do not sponsor 3.0 1.2 1.5 2.7
Total 100.0% 100.0% 100.0% 100.0% N 351 199 200 750
23
Employee Size of Firm 1–9 emp. 10-19 emp. 20-249 emp. All Firms 35. Is the event generally held at:? 1. Business location 29.2% 26.2% 30.9% 29.0% 2. Owner’s residence 3.4 8.2 3.6 4.2 3. Somewhere else 52.4 52.5 50.9 52.2 4. (DK/Refuse) 15.0 13.1 14.5 14.6
Total 100.0% 100.0% 100.0% 100.0% N 191 147 162 500 36. Do you have a formal policy regarding employees who request time off for a serious illness in the family or the birth or adoption of a child, or do you handle such requests on a case-by-case basis? 1. Formal policy 5.2% 15.7% 22.7% 7.9% 2. Case by case basis 88.4 80.7 72.7 86.2 3. (DK/Refuse) 6.4 3.6 4.5 5.9
Total 100.0% 100.0% 100.0% 100.0%
N 351 199 200 750 37. Is the time an employee spends on family leave:?
1. With pay 4.4% 10.8% 3.0% 5.0% 2. Without pay 12.9 7.2 19.7 12.9 3. With pay if taken as vacation or sick leave 19.3 19.3 28.8 20.2 4. Depends on the person or circumstance 50.9 56.6 42.4 50.8 5. (DK/Refuse) 12.4 6.0 6.1 11.2
Total 100.0% 100.0% 100.0% 100.0% N 351 199 200 750 38. Do you keep any type of records on the time employees spend out for family leave?
1. Yes 46.5% 56.6% 68.7% 49.6% 2. No 46.1 31.3 22.4 42.4 3. (DK/Refuse) 7.4 12.0 9.0 8.0 Total 100.0% 100.0% 100.0% 100.0% N 351 199 200 750
24
Employee Size of Firm 1–9 emp. 10-19 emp. 20-249 emp. All Firms 39. Do you have a formal policy regarding employees who request short periods of time off for personal matters such as a doctor’s appointment, or parent-teacher conference or is it on a case-by-case basis? 1. Formal policy 10.7% 31.3% 23.9% 14.2% 2. Case by case basis 80.7 61.4 73.1 77.9 3. (DK/Refuse) 8.6 7.2 3.0 7.9 Total 100.0% 100.0% 100.0% 100.0% N 351 199 200 750 40. Are employees typically paid while out for these short periods, not paid, or take vacation or sick leave?
1. Paid 47.6% 38.6% 24.2% 44.5% 2. Not paid 25.4 26.5 30.3 25.9 3. Vacation 8.2 15.7 24.2 10.5 4. Sick leave 4.5 4.8 9.1 5.0
5. (DK/Refuse) 14.3 14.5 12.1 14.1 Total 100.0% 100.0% 100.0% 100.0% N 351 199 200 750 41. Do you keep any type of records on the time employees spend out for these short periods?
1. Yes 38.6% 51.8% 66.7% 42.6% 2. No 59.1 42.2 30.3 54.6 3. (DK/Refuse) 2.3 6.0 3.0 2.8 Total 100.0% 100.0% 100.0% 100.0% N 351 199 200 750 42. Are your part-time employees generally eligible to receive the same benefits on a pro-rata basis as your full-time employees?
1. Yes 26.6% 33.7% 39.4% 28.5%
2. No 52.1 49.4 56.1 52.2 3. (DK/Refuse) 21.3 16.9 4.5 19.4 Total 100.0% 100.0% 100.0% 100.0% N 351 199 200 750
25
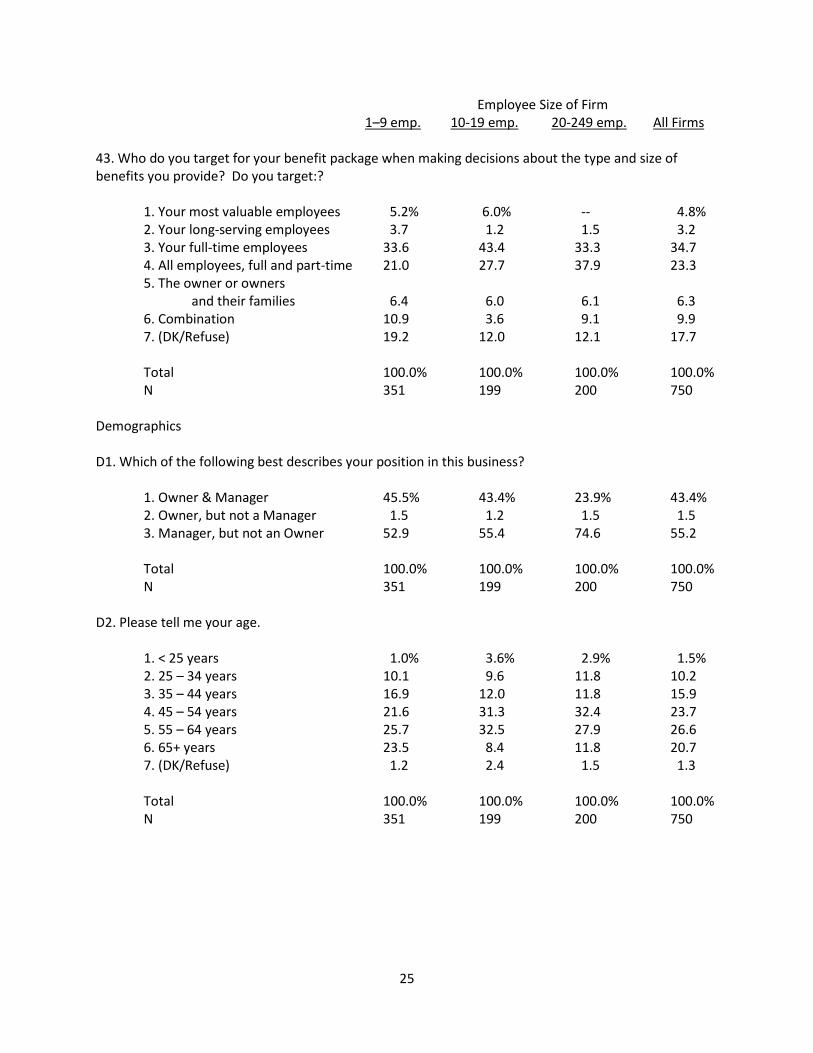
Employee Size of Firm 1–9 emp. 10-19 emp. 20-249 emp. All Firms 43. Who do you target for your benefit package when making decisions about the type and size of benefits you provide? Do you target:?
1. Your most valuable employees 5.2% 6.0% -- 4.8% 2. Your long-serving employees 3.7 1.2 1.5 3.2 3. Your full-time employees 33.6 43.4 33.3 34.7 4. All employees, full and part-time 21.0 27.7 37.9 23.3 5. The owner or owners
and their families 6.4 6.0 6.1 6.3 6. Combination 10.9 3.6 9.1 9.9 7. (DK/Refuse) 19.2 12.0 12.1 17.7
Total 100.0% 100.0% 100.0% 100.0% N 351 199 200 750 Demographics D1. Which of the following best describes your position in this business? 1. Owner & Manager 45.5% 43.4% 23.9% 43.4% 2. Owner, but not a Manager 1.5 1.2 1.5 1.5 3. Manager, but not an Owner 52.9 55.4 74.6 55.2 Total 100.0% 100.0% 100.0% 100.0% N 351 199 200 750 D2. Please tell me your age. 1. < 25 years 1.0% 3.6% 2.9% 1.5% 2. 25 – 34 years 10.1 9.6 11.8 10.2 3. 35 – 44 years 16.9 12.0 11.8 15.9 4. 45 – 54 years 21.6 31.3 32.4 23.7 5. 55 – 64 years 25.7 32.5 27.9 26.6 6. 65+ years 23.5 8.4 11.8 20.7 7. (DK/Refuse) 1.2 2.4 1.5 1.3
Total 100.0% 100.0% 100.0% 100.0% N 351 199 200 750
26
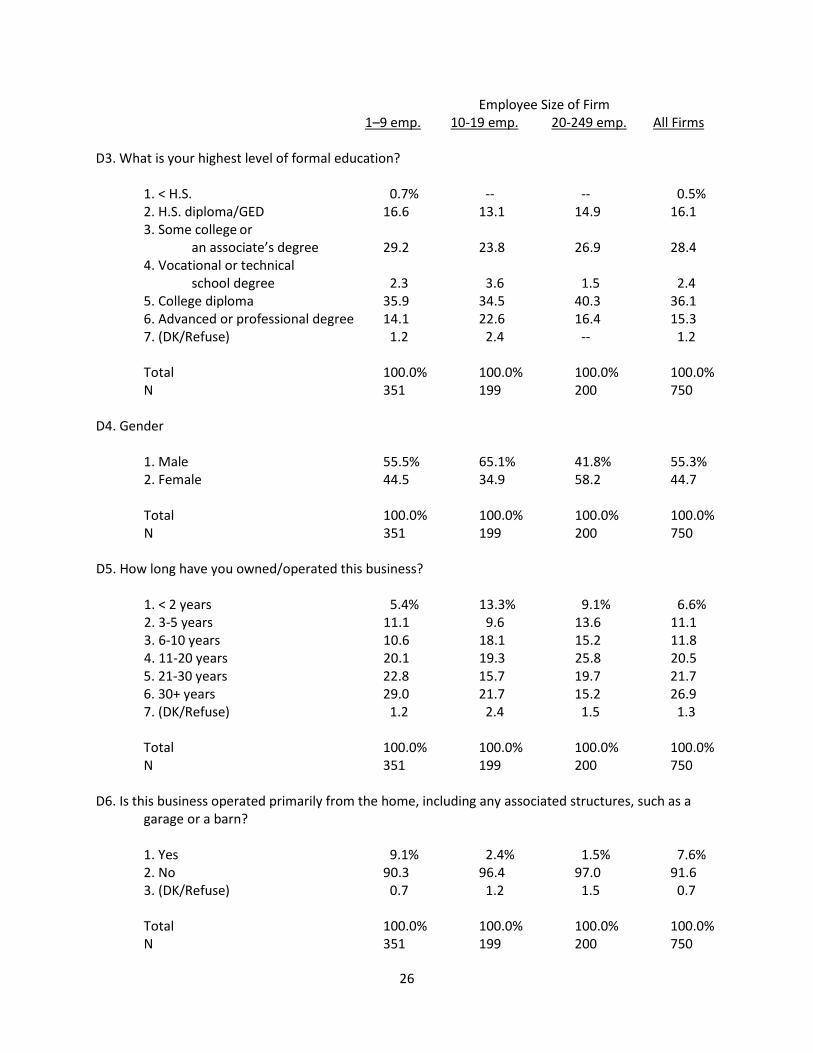
Employee Size of Firm 1–9 emp. 10-19 emp. 20-249 emp. All Firms D3. What is your highest level of formal education? 1. < H.S. 0.7% -- -- 0.5% 2. H.S. diploma/GED 16.6 13.1 14.9 16.1 3. Some college or
an associate’s degree 29.2 23.8 26.9 28.4 4. Vocational or technical
school degree 2.3 3.6 1.5 2.4 5. College diploma 35.9 34.5 40.3 36.1 6. Advanced or professional degree 14.1 22.6 16.4 15.3 7. (DK/Refuse) 1.2 2.4 -- 1.2
Total 100.0% 100.0% 100.0% 100.0% N 351 199 200 750
D4. Gender
1. Male 55.5% 65.1% 41.8% 55.3% 2. Female 44.5 34.9 58.2 44.7
Total 100.0% 100.0% 100.0% 100.0% N 351 199 200 750
D5. How long have you owned/operated this business? 1. < 2 years 5.4% 13.3% 9.1% 6.6% 2. 3-5 years 11.1 9.6 13.6 11.1 3. 6-10 years 10.6 18.1 15.2 11.8 4. 11-20 years 20.1 19.3 25.8 20.5 5. 21-30 years 22.8 15.7 19.7 21.7 6. 30+ years 29.0 21.7 15.2 26.9 7. (DK/Refuse) 1.2 2.4 1.5 1.3 Total 100.0% 100.0% 100.0% 100.0% N 351 199 200 750 D6. Is this business operated primarily from the home, including any associated structures, such as a garage or a barn? 1. Yes 9.1% 2.4% 1.5% 7.6% 2. No 90.3 96.4 97.0 91.6 3. (DK/Refuse) 0.7 1.2 1.5 0.7 Total 100.0% 100.0% 100.0% 100.0% N 351 199 200 750
27
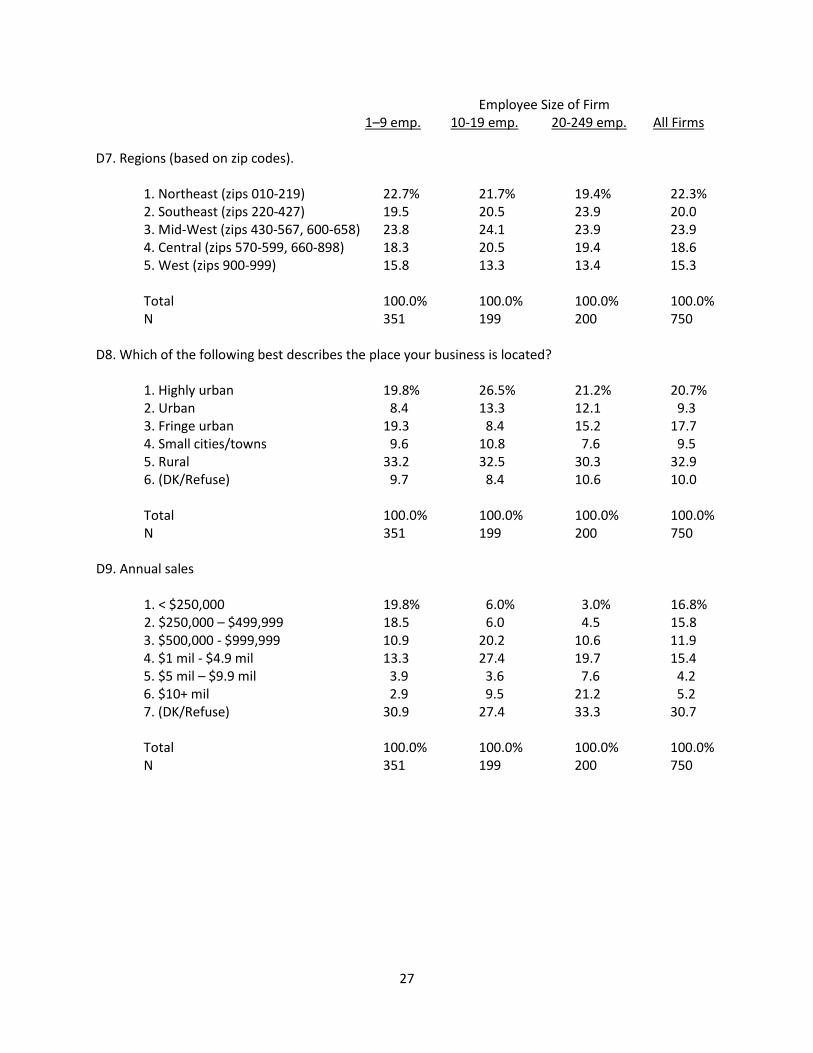
Employee Size of Firm 1–9 emp. 10-19 emp. 20-249 emp. All Firms D7. Regions (based on zip codes). 1. Northeast (zips 010-219) 22.7% 21.7% 19.4% 22.3% 2. Southeast (zips 220-427) 19.5 20.5 23.9 20.0 3. Mid-West (zips 430-567, 600-658) 23.8 24.1 23.9 23.9 4. Central (zips 570-599, 660-898) 18.3 20.5 19.4 18.6 5. West (zips 900-999) 15.8 13.3 13.4 15.3 Total 100.0% 100.0% 100.0% 100.0% N 351 199 200 750 D8. Which of the following best describes the place your business is located? 1. Highly urban 19.8% 26.5% 21.2% 20.7% 2. Urban 8.4 13.3 12.1 9.3 3. Fringe urban 19.3 8.4 15.2 17.7 4. Small cities/towns 9.6 10.8 7.6 9.5 5. Rural 33.2 32.5 30.3 32.9
6. (DK/Refuse) 9.7 8.4 10.6 10.0 Total 100.0% 100.0% 100.0% 100.0% N 351 199 200 750 D9. Annual sales
1. < $250,000 19.8% 6.0% 3.0% 16.8% 2. $250,000 – $499,999 18.5 6.0 4.5 15.8 3. $500,000 - $999,999 10.9 20.2 10.6 11.9 4. $1 mil - $4.9 mil 13.3 27.4 19.7 15.4 5. $5 mil – $9.9 mil 3.9 3.6 7.6 4.2 6. $10+ mil 2.9 9.5 21.2 5.2
7. (DK/Refuse) 30.9 27.4 33.3 30.7
Total 100.0% 100.0% 100.0% 100.0% N 351 199 200 750
28
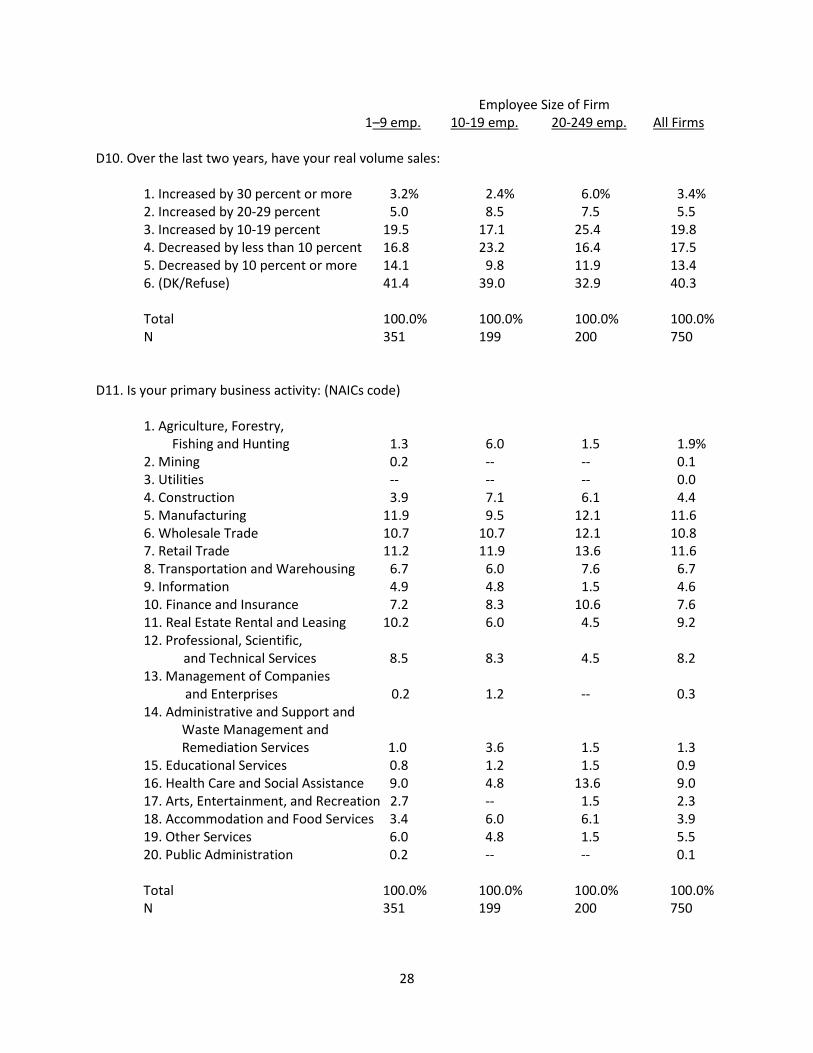
Employee Size of Firm 1–9 emp. 10-19 emp. 20-249 emp. All Firms D10. Over the last two years, have your real volume sales: 1. Increased by 30 percent or more 3.2% 2.4% 6.0% 3.4% 2. Increased by 20-29 percent 5.0 8.5 7.5 5.5 3. Increased by 10-19 percent 19.5 17.1 25.4 19.8 4. Decreased by less than 10 percent 16.8 23.2 16.4 17.5 5. Decreased by 10 percent or more 14.1 9.8 11.9 13.4
6. (DK/Refuse) 41.4 39.0 32.9 40.3
Total 100.0% 100.0% 100.0% 100.0% N 351 199 200 750 D11. Is your primary business activity: (NAICs code)
1. Agriculture, Forestry, Fishing and Hunting 1.3 6.0 1.5 1.9%
2. Mining 0.2 -- -- 0.1 3. Utilities -- -- -- 0.0 4. Construction 3.9 7.1 6.1 4.4 5. Manufacturing 11.9 9.5 12.1 11.6 6. Wholesale Trade 10.7 10.7 12.1 10.8 7. Retail Trade 11.2 11.9 13.6 11.6 8. Transportation and Warehousing 6.7 6.0 7.6 6.7 9. Information 4.9 4.8 1.5 4.6 10. Finance and Insurance 7.2 8.3 10.6 7.6 11. Real Estate Rental and Leasing 10.2 6.0 4.5 9.2 12. Professional, Scientific, and Technical Services 8.5 8.3 4.5 8.2 13. Management of Companies
and Enterprises 0.2 1.2 -- 0.3 14. Administrative and Support and
Waste Management and Remediation Services 1.0 3.6 1.5 1.3
15. Educational Services 0.8 1.2 1.5 0.9 16. Health Care and Social Assistance 9.0 4.8 13.6 9.0 17. Arts, Entertainment, and Recreation 2.7 -- 1.5 2.3 18. Accommodation and Food Services 3.4 6.0 6.1 3.9 19. Other Services 6.0 4.8 1.5 5.5 20. Public Administration 0.2 -- -- 0.1 Total 100.0% 100.0% 100.0% 100.0%
N 351 199 200 750
29
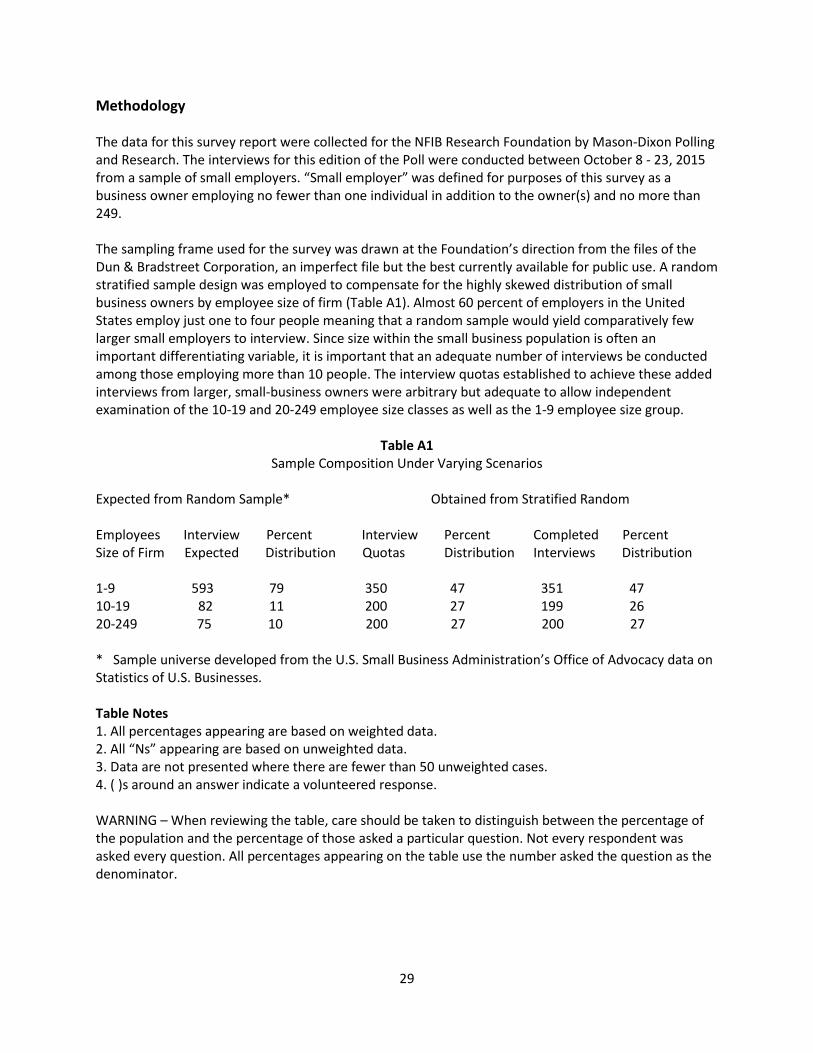
Methodology The data for this survey report were collected for the NFIB Research Foundation by Mason-Dixon Polling and Research. The interviews for this edition of the Poll were conducted between October 8 - 23, 2015 from a sample of small employers. “Small employer” was defined for purposes of this survey as a business owner employing no fewer than one individual in addition to the owner(s) and no more than 249. The sampling frame used for the survey was drawn at the Foundation’s direction from the files of the Dun & Bradstreet Corporation, an imperfect file but the best currently available for public use. A random stratified sample design was employed to compensate for the highly skewed distribution of small business owners by employee size of firm (Table A1). Almost 60 percent of employers in the United States employ just one to four people meaning that a random sample would yield comparatively few larger small employers to interview. Since size within the small business population is often an important differentiating variable, it is important that an adequate number of interviews be conducted among those employing more than 10 people. The interview quotas established to achieve these added interviews from larger, small-business owners were arbitrary but adequate to allow independent examination of the 10-19 and 20-249 employee size classes as well as the 1-9 employee size group.
Table A1 Sample Composition Under Varying Scenarios
Expected from Random Sample* Obtained from Stratified Random Employees Interview Percent Interview Percent Completed Percent Size of Firm Expected Distribution Quotas Distribution Interviews Distribution 1-9 593 79 350 47 351 47 10-19 82 11 200 27 199 26 20-249 75 10 200 27 200 27 * Sample universe developed from the U.S. Small Business Administration’s Office of Advocacy data on Statistics of U.S. Businesses. Table Notes 1. All percentages appearing are based on weighted data. 2. All “Ns” appearing are based on unweighted data. 3. Data are not presented where there are fewer than 50 unweighted cases. 4. ( )s around an answer indicate a volunteered response. WARNING – When reviewing the table, care should be taken to distinguish between the percentage of the population and the percentage of those asked a particular question. Not every respondent was asked every question. All percentages appearing on the table use the number asked the question as the denominator.

30