Embed Size (px)
Citation preview
Employee Compensation
in Pork Production
©2012 National Pork Board, Des Moines, IA USA. This message funded by America’s Pork Producers and the Pork Checkoff.
Table of ContentsSection 1 – Introduction
1. Introduction. . . . . . . . . . . . . . . . . . . . 32. Contributor Profile . . . . . . . . . . . . . . . . 4
Section 2 – Analysis1. Compensation
• Stockperson Wages Benchmark . . . . . . 5• Average Annual Salary/Wage Ranges . . . . 7• Bonus (Incentive) Plans . . . . . . . . . . 29
2. Benefits• Benefits by Employee Category . . . . . . 30 • Vacation/Sick/PTO/Holidays . . . . . . . 33 • Employee Insurance/Coverage. . . . . . . 34 • Employee Family Member
Insurance/Coverage . . . . . . . . . . . . . . . 35 3. HR Management
• Average Number of Hours Worked per Week . . . . . . . . . . . . . . 36
• Weekend Work Schedule . . . . . . . . . . 37 • Pay and Weekend Work Hours . . . . . . 38 • Non-English Speaking Employees. . . . . 39 • Personnel Management
Tools - English/Spanish. . . . . . . . . . . 39• Work Plans . . . . . . . . . . . . . . . . . . 42• Performance Appraisals . . . . . . . . . . 42• Motivating Employees . . . . . . . . . . . 43• Retirement . . . . . . . . . . . . . . . . . . 44
4. Recruiting• Recruiting Managers . . . . . . . . . . . . 45 • Recruiting Stockpersons . . . . . . . . . . 46 • Difficult to Fill Positions . . . . . . . . . . 47
5. Part-Time Staff• Number of Part-Time Staff . . . . . . . . . 48• Average Hourly Wage . . . . . . . . . . . . 48• Average Number of Hours
Worked per Week . . . . . . . . . . . . . . 49 6. Safety
• Worker Safety . . . . . . . . . . . . . . . . 50 7. Key Findings . . . . . . . . . . . . . . . . . . 51
Compensation in Pork Production | 3
IntroductionThe swine industry has been plagued with a negative stereotype that job opportunities within the industry are unrewarding and labor intensive. As producers, we know that to be untrue; however, the general public does not. Changing this perception is critical in order to recruit and retain the most talented employees and ensure talented leaders are developed to help the industry flourish in the future.
In the fall of 2011, the National Pork Board enlisted AgCareers.com to assist with information collection in order to set the story straight about careers in the pork industry. Through a targeted survey outreach, AgCareers.com conducted ‘The Compensation and HR Practices for the Swine Industry Survey’ by collecting data November-December 2011.
Two customized online surveys were created for two target audiences. For the purpose of this survey, the ‘large operations’ audience represents farms with 25,000 or more sows in production. The second audience, ‘mid-size operations,’ represents producers of a significant size that employ full-time employees other than family members. Mid-size operations are defined as those operations with less than 25,000 sows in production or over 1,000 head finishing.
Requests to complete surveys were sent to 30 large operations and 891 mid-size operations. Twenty three larger operations (77%) completed the survey. 191 mid-size operations (21%) completed the survey. Survey respondents represent 46% of U.S. pork production.
The overall survey was conducted to provide an accurate reflection of compensation and human resources practices that can be used by pork producers to help recruit talent and ensure current practices are in-line with competition. The survey covered areas such as compensation, benefits, human resources management, recruiting, part-time staff and safety.
Data was captured via direct communication with the target audiences through an online survey portal. The information was then collated and is presented in the following document. This document provides key findings, analysis commentary and detailed results from collated data of the mid-size operations survey and the large operations survey, as well as combined results.
The Compensation and Human Resources Practices for the Swine Industry Survey analysis has been compiled using data which, to the best of AgCareers.com and the National Pork Board’s knowledge and information at the time of collection and at printing, was accurate and correct.
In this booklet, the tables are color-coded with the operation size surveyed:
Combined Results: Large and Mid-Sized Operations
Large Operations
Mid-Sized Operations
Compensation in Pork Production | 4
Figure 1.0Which of the following best describes your hog operation(s)? (Check all that apply)
Responses % of overall mid-sized response
Farrow-to-wean 50 26.18Farrow-to-feeder 11 5.76Farrow-to-finish 111 58.12Feeder-to-finish 16 8.38Contract farrowing 3 1.57Contract nursery 8 4.19Contract farrow-to-finish 1 0.52Contract finish 22 11.52Seedstock production 7 3.66Other (please specify) 16 8.38Question Respondents 191 191
This question asked of only the mid-size target audience.
*Percentages do not total 100; respondents were allowed to select multiple responses. Results are calculated dividing the number of responses by respondents.
Figure 1.1What is the approximate number pigs/hogs produced in your hog operation(s) (project total head sold at year-end in thousand head marketed annually)?
Responses %
Less-1,000 8 4.191,001-5,000 15 7.855,001-10,000 23 12.0410,001-50,000 67 35.0850,001-250,000 59 30.89250,001-500,000 14 7.33500,001+ 5 2.62Question Respondents 191 191
This question asked of only the mid-size target audience.
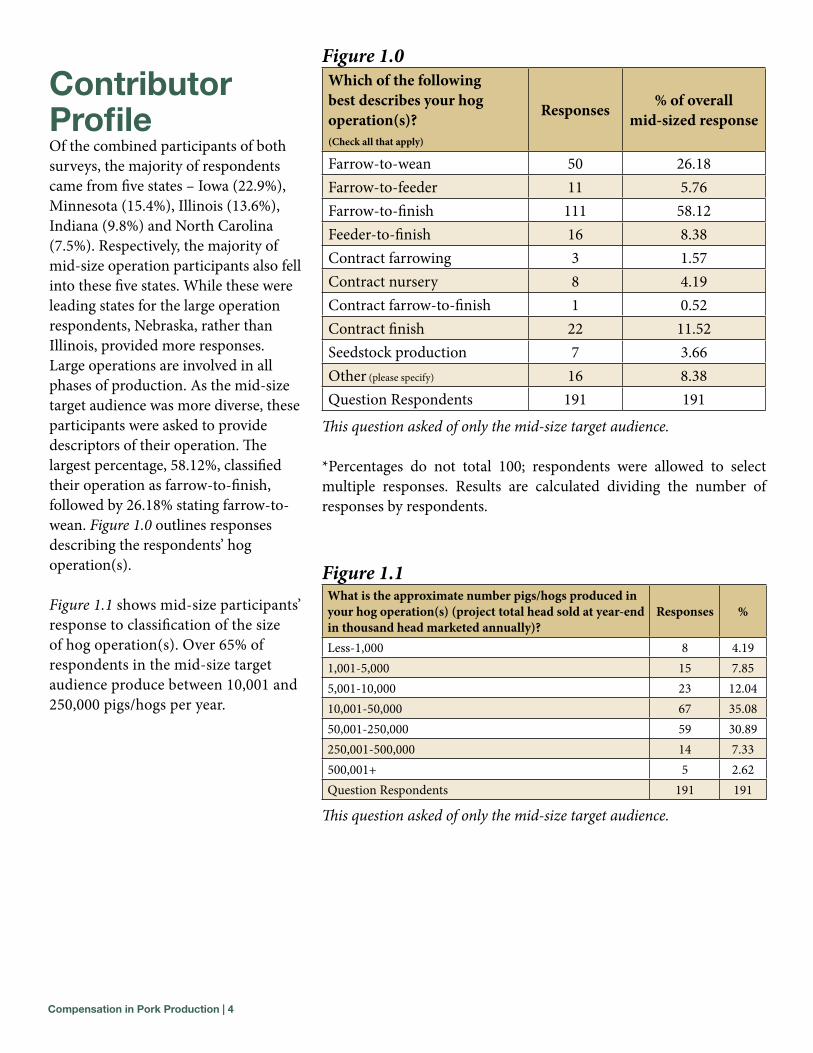
Contributor ProfileOf the combined participants of both surveys, the majority of respondents came from five states – Iowa (22.9%), Minnesota (15.4%), Illinois (13.6%), Indiana (9.8%) and North Carolina (7.5%). Respectively, the majority of mid-size operation participants also fell into these five states. While these were leading states for the large operation respondents, Nebraska, rather than Illinois, provided more responses. Large operations are involved in all phases of production. As the mid-size target audience was more diverse, these participants were asked to provide descriptors of their operation. The largest percentage, 58.12%, classified their operation as farrow-to-finish, followed by 26.18% stating farrow-to-wean. Figure 1.0 outlines responses describing the respondents’ hog operation(s).
Figure 1.1 shows mid-size participants’ response to classification of the size of hog operation(s). Over 65% of respondents in the mid-size target audience produce between 10,001 and 250,000 pigs/hogs per year.
Compensation in Pork Production | 5
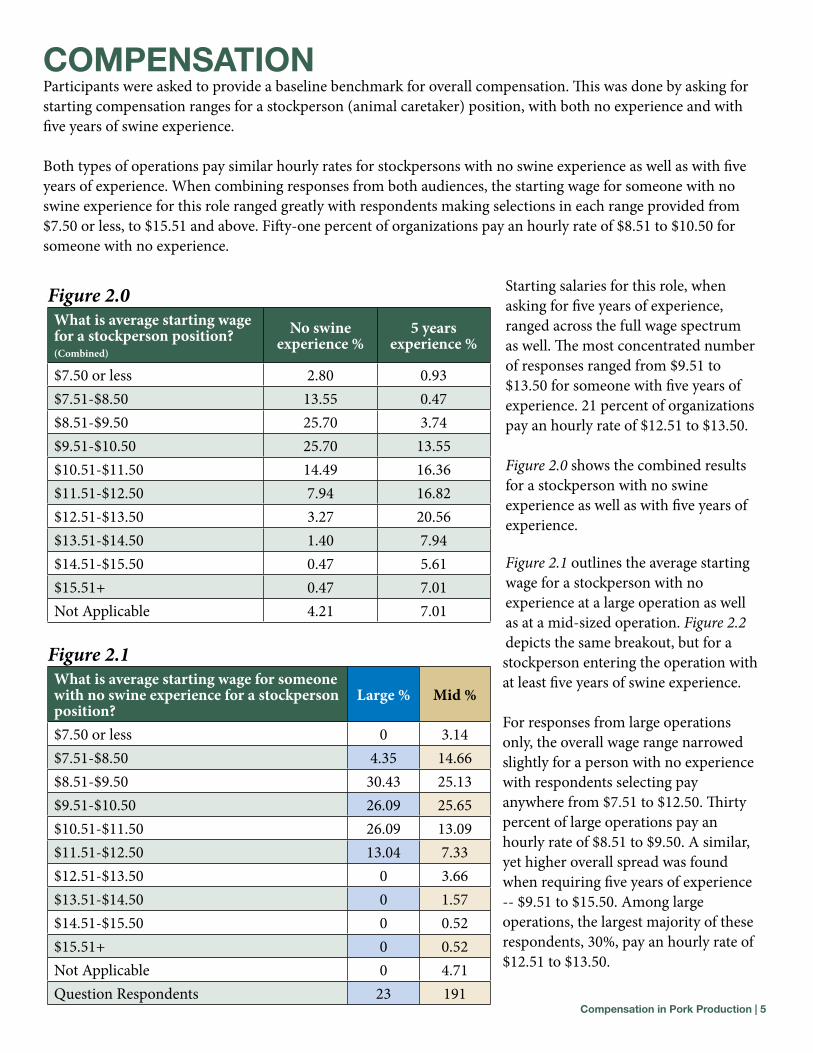
ComPEnsaTIonParticipants were asked to provide a baseline benchmark for overall compensation. This was done by asking for starting compensation ranges for a stockperson (animal caretaker) position, with both no experience and with five years of swine experience.
Both types of operations pay similar hourly rates for stockpersons with no swine experience as well as with five years of experience. When combining responses from both audiences, the starting wage for someone with no swine experience for this role ranged greatly with respondents making selections in each range provided from $7.50 or less, to $15.51 and above. Fifty-one percent of organizations pay an hourly rate of $8.51 to $10.50 for someone with no experience.
Starting salaries for this role, when asking for five years of experience, ranged across the full wage spectrum as well. The most concentrated number of responses ranged from $9.51 to $13.50 for someone with five years of experience. 21 percent of organizations pay an hourly rate of $12.51 to $13.50.
Figure 2.0 shows the combined results for a stockperson with no swine experience as well as with five years of experience.
Figure 2.1 outlines the average starting wage for a stockperson with no experience at a large operation as well as at a mid-sized operation. Figure 2.2 depicts the same breakout, but for a stockperson entering the operation with at least five years of swine experience.
For responses from large operations only, the overall wage range narrowed slightly for a person with no experience with respondents selecting pay anywhere from $7.51 to $12.50. Thirty percent of large operations pay an hourly rate of $8.51 to $9.50. A similar, yet higher overall spread was found when requiring five years of experience -- $9.51 to $15.50. Among large operations, the largest majority of these respondents, 30%, pay an hourly rate of $12.51 to $13.50.
Figure 2.0What is average starting wage for a stockperson position? (Combined)
No swine experience %
5 years experience %
$7.50 or less 2.80 0.93$7.51-$8.50 13.55 0.47$8.51-$9.50 25.70 3.74$9.51-$10.50 25.70 13.55$10.51-$11.50 14.49 16.36$11.51-$12.50 7.94 16.82$12.51-$13.50 3.27 20.56$13.51-$14.50 1.40 7.94$14.51-$15.50 0.47 5.61$15.51+ 0.47 7.01Not Applicable 4.21 7.01
Figure 2.1What is average starting wage for someone with no swine experience for a stockperson position?
Large % Mid %
$7.50 or less 0 3.14$7.51-$8.50 4.35 14.66$8.51-$9.50 30.43 25.13$9.51-$10.50 26.09 25.65$10.51-$11.50 26.09 13.09$11.51-$12.50 13.04 7.33$12.51-$13.50 0 3.66$13.51-$14.50 0 1.57$14.51-$15.50 0 0.52$15.51+ 0 0.52Not Applicable 0 4.71Question Respondents 23 191
Compensation in Pork Production | 6
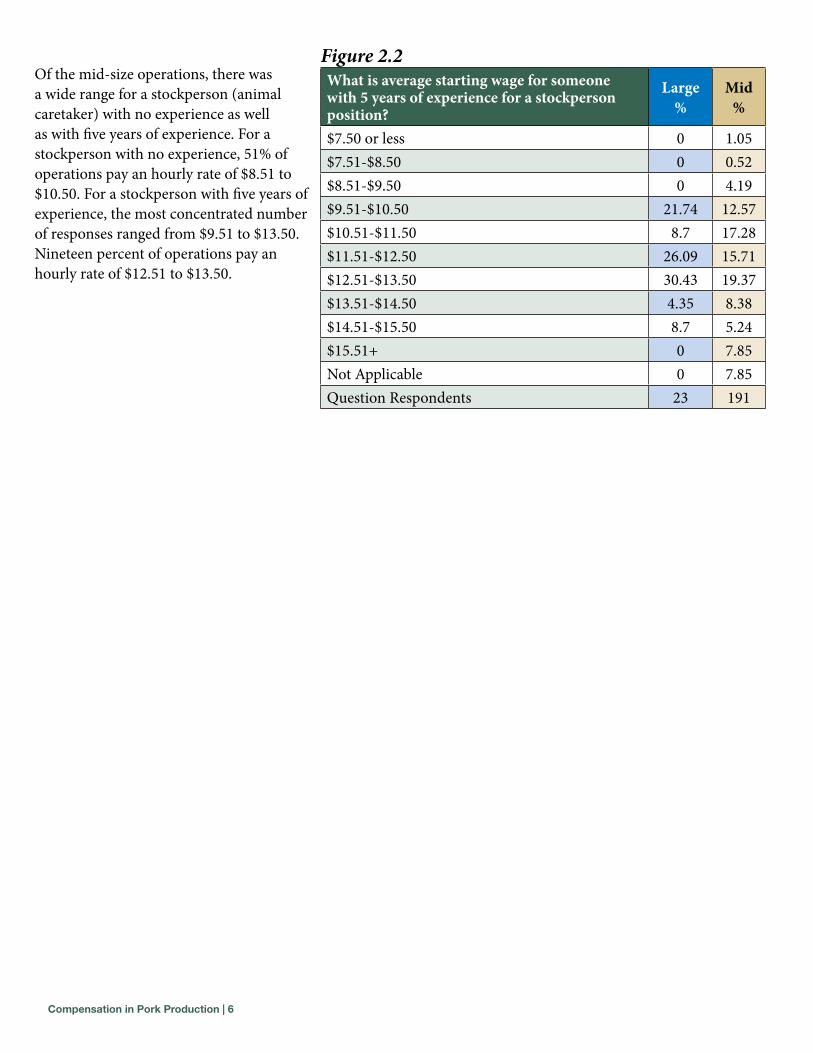
Of the mid-size operations, there was a wide range for a stockperson (animal caretaker) with no experience as well as with five years of experience. For a stockperson with no experience, 51% of operations pay an hourly rate of $8.51 to $10.50. For a stockperson with five years of experience, the most concentrated number of responses ranged from $9.51 to $13.50. Nineteen percent of operations pay an hourly rate of $12.51 to $13.50.
Figure 2.2What is average starting wage for someone with 5 years of experience for a stockperson position?
Large %
Mid %
$7.50 or less 0 1.05$7.51-$8.50 0 0.52$8.51-$9.50 0 4.19$9.51-$10.50 21.74 12.57$10.51-$11.50 8.7 17.28$11.51-$12.50 26.09 15.71$12.51-$13.50 30.43 19.37$13.51-$14.50 4.35 8.38$14.51-$15.50 8.7 5.24$15.51+ 0 7.85Not Applicable 0 7.85Question Respondents 23 191
Compensation in Pork Production | 7
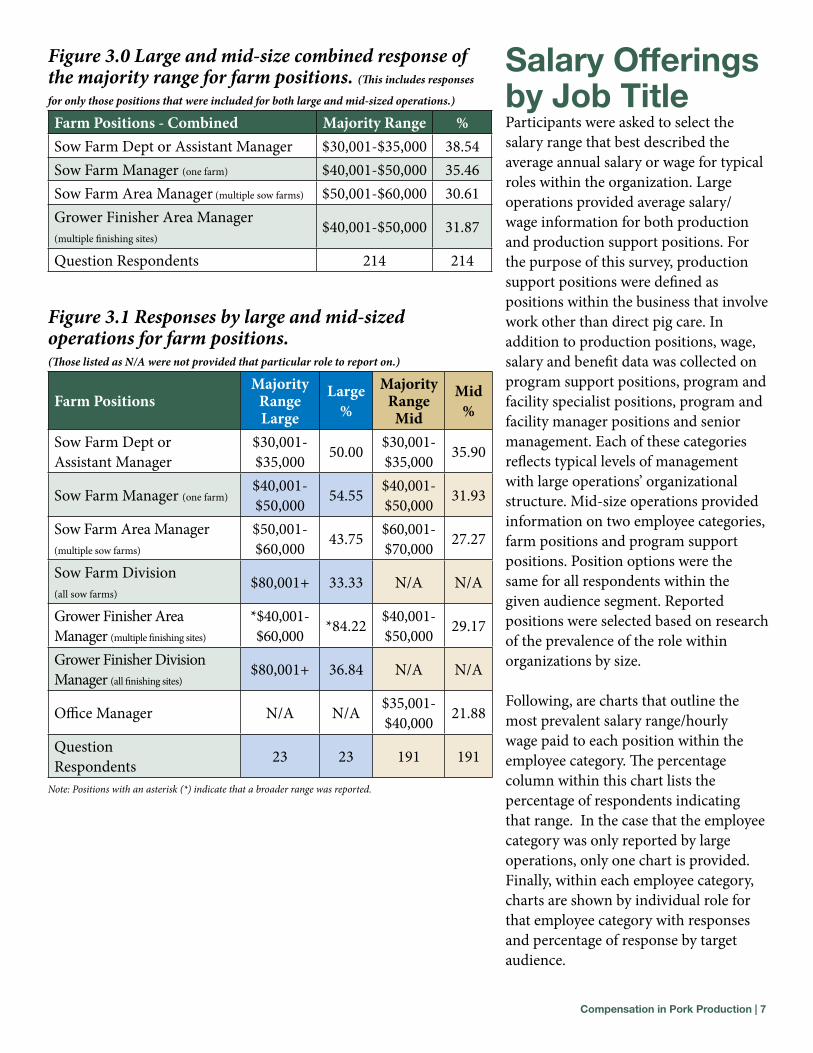
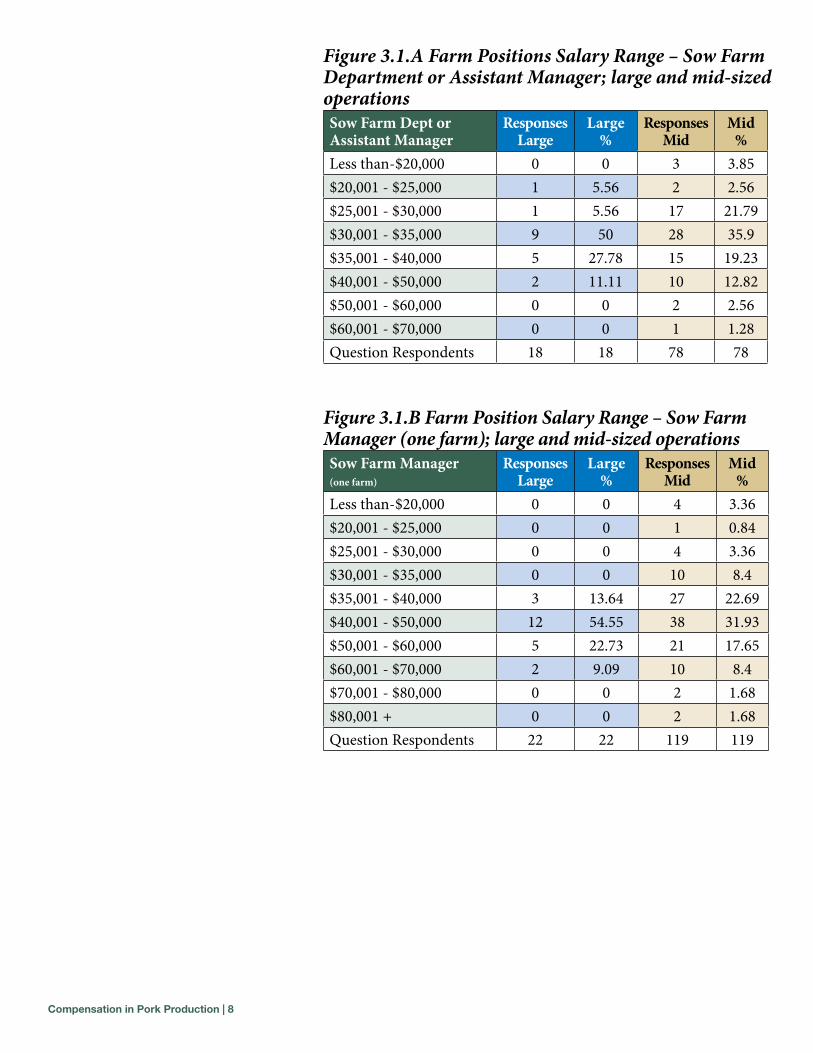
salary offerings by Job TitleParticipants were asked to select the salary range that best described the average annual salary or wage for typical roles within the organization. Large operations provided average salary/wage information for both production and production support positions. For the purpose of this survey, production support positions were defined as positions within the business that involve work other than direct pig care. In addition to production positions, wage, salary and benefit data was collected on program support positions, program and facility specialist positions, program and facility manager positions and senior management. Each of these categories reflects typical levels of management with large operations’ organizational structure. Mid-size operations provided information on two employee categories, farm positions and program support positions. Position options were the same for all respondents within the given audience segment. Reported positions were selected based on research of the prevalence of the role within organizations by size.
Following, are charts that outline the most prevalent salary range/hourly wage paid to each position within the employee category. The percentage column within this chart lists the percentage of respondents indicating that range. In the case that the employee category was only reported by large operations, only one chart is provided. Finally, within each employee category, charts are shown by individual role for that employee category with responses and percentage of response by target audience.
Figure 3.0 Large and mid-size combined response of the majority range for farm positions. (This includes responses
for only those positions that were included for both large and mid-sized operations.)
Farm Positions - Combined Majority Range %Sow Farm Dept or Assistant Manager $30,001-$35,000 38.54Sow Farm Manager (one farm) $40,001-$50,000 35.46Sow Farm Area Manager (multiple sow farms) $50,001-$60,000 30.61Grower Finisher Area Manager (multiple finishing sites)
$40,001-$50,000 31.87
Question Respondents 214 214
Figure 3.1 Responses by large and mid-sized operations for farm positions. (Those listed as N/A were not provided that particular role to report on.)
Farm PositionsMajority
RangeLarge
Large %
Majority Range
Mid
Mid %
Sow Farm Dept or Assistant Manager
$30,001-$35,000 50.00 $30,001-
$35,000 35.90
Sow Farm Manager (one farm)$40,001-$50,000 54.55 $40,001-
$50,000 31.93
Sow Farm Area Manager (multiple sow farms)
$50,001-$60,000 43.75 $60,001-
$70,000 27.27
Sow Farm Division (all sow farms)
$80,001+ 33.33 N/A N/A
Grower Finisher Area Manager (multiple finishing sites)
*$40,001-$60,000 *84.22 $40,001-
$50,000 29.17
Grower Finisher Division Manager (all finishing sites)
$80,001+ 36.84 N/A N/A
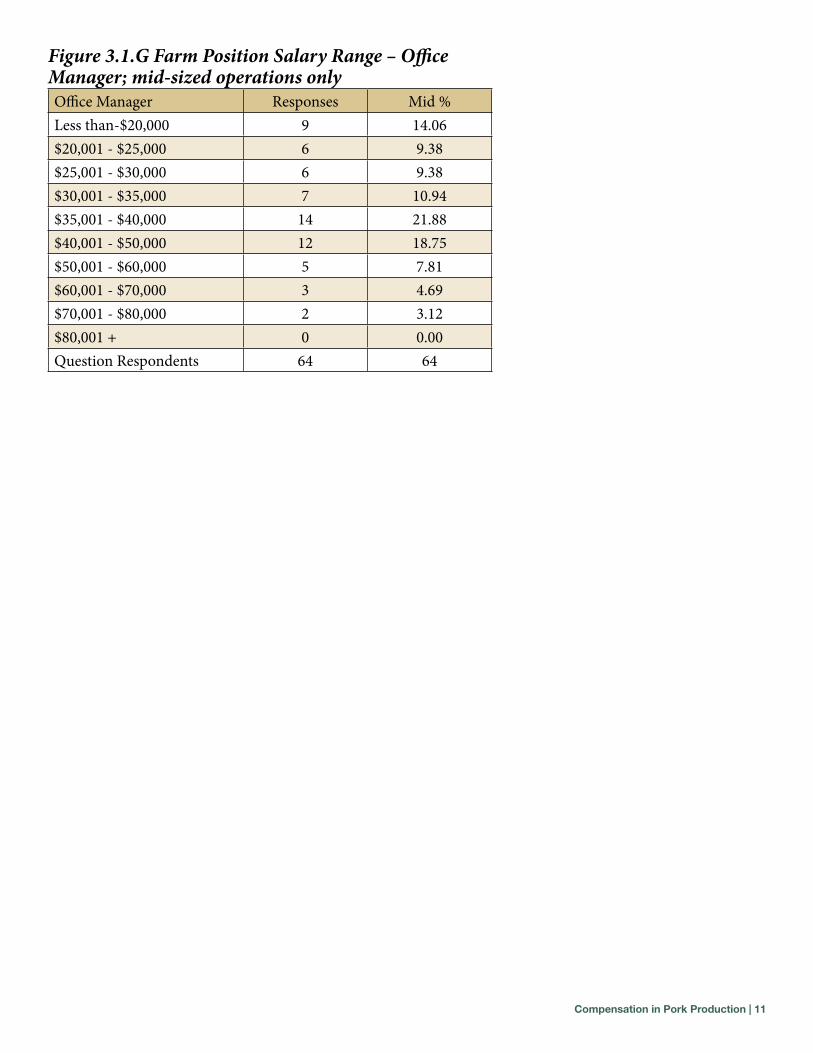
Office Manager N/A N/A $35,001-$40,000 21.88
Question Respondents 23 23 191 191
Note: Positions with an asterisk (*) indicate that a broader range was reported.
Compensation in Pork Production | 8
Figure 3.1.A Farm Positions Salary Range – Sow Farm Department or Assistant Manager; large and mid-sized operationsSow Farm Dept or Assistant Manager
Responses Large
Large %
Responses Mid
Mid %
Less than-$20,000 0 0 3 3.85$20,001 - $25,000 1 5.56 2 2.56$25,001 - $30,000 1 5.56 17 21.79$30,001 - $35,000 9 50 28 35.9$35,001 - $40,000 5 27.78 15 19.23$40,001 - $50,000 2 11.11 10 12.82$50,001 - $60,000 0 0 2 2.56$60,001 - $70,000 0 0 1 1.28Question Respondents 18 18 78 78
Figure 3.1.B Farm Position Salary Range – Sow Farm Manager (one farm); large and mid-sized operationsSow Farm Manager (one farm)
Responses Large
Large %
Responses Mid
Mid %
Less than-$20,000 0 0 4 3.36$20,001 - $25,000 0 0 1 0.84$25,001 - $30,000 0 0 4 3.36$30,001 - $35,000 0 0 10 8.4$35,001 - $40,000 3 13.64 27 22.69$40,001 - $50,000 12 54.55 38 31.93$50,001 - $60,000 5 22.73 21 17.65$60,001 - $70,000 2 9.09 10 8.4$70,001 - $80,000 0 0 2 1.68$80,001 + 0 0 2 1.68Question Respondents 22 22 119 119
Compensation in Pork Production | 9
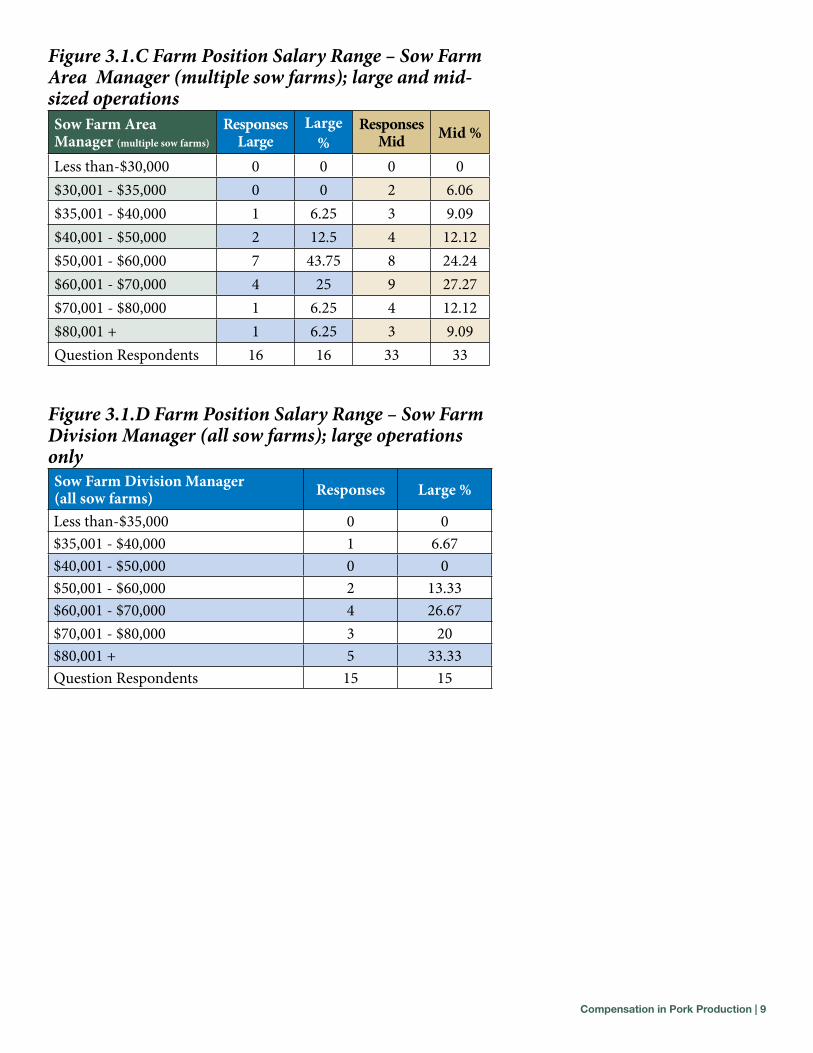
Figure 3.1.C Farm Position Salary Range – Sow Farm Area Manager (multiple sow farms); large and mid-sized operationsSow Farm Area Manager (multiple sow farms)
Responses Large
Large %
Responses Mid Mid %
Less than-$30,000 0 0 0 0$30,001 - $35,000 0 0 2 6.06$35,001 - $40,000 1 6.25 3 9.09$40,001 - $50,000 2 12.5 4 12.12$50,001 - $60,000 7 43.75 8 24.24$60,001 - $70,000 4 25 9 27.27$70,001 - $80,000 1 6.25 4 12.12$80,001 + 1 6.25 3 9.09Question Respondents 16 16 33 33
Figure 3.1.D Farm Position Salary Range – Sow Farm Division Manager (all sow farms); large operations onlySow Farm Division Manager (all sow farms) Responses Large %
Less than-$35,000 0 0$35,001 - $40,000 1 6.67$40,001 - $50,000 0 0$50,001 - $60,000 2 13.33$60,001 - $70,000 4 26.67$70,001 - $80,000 3 20$80,001 + 5 33.33Question Respondents 15 15
Compensation in Pork Production | 10
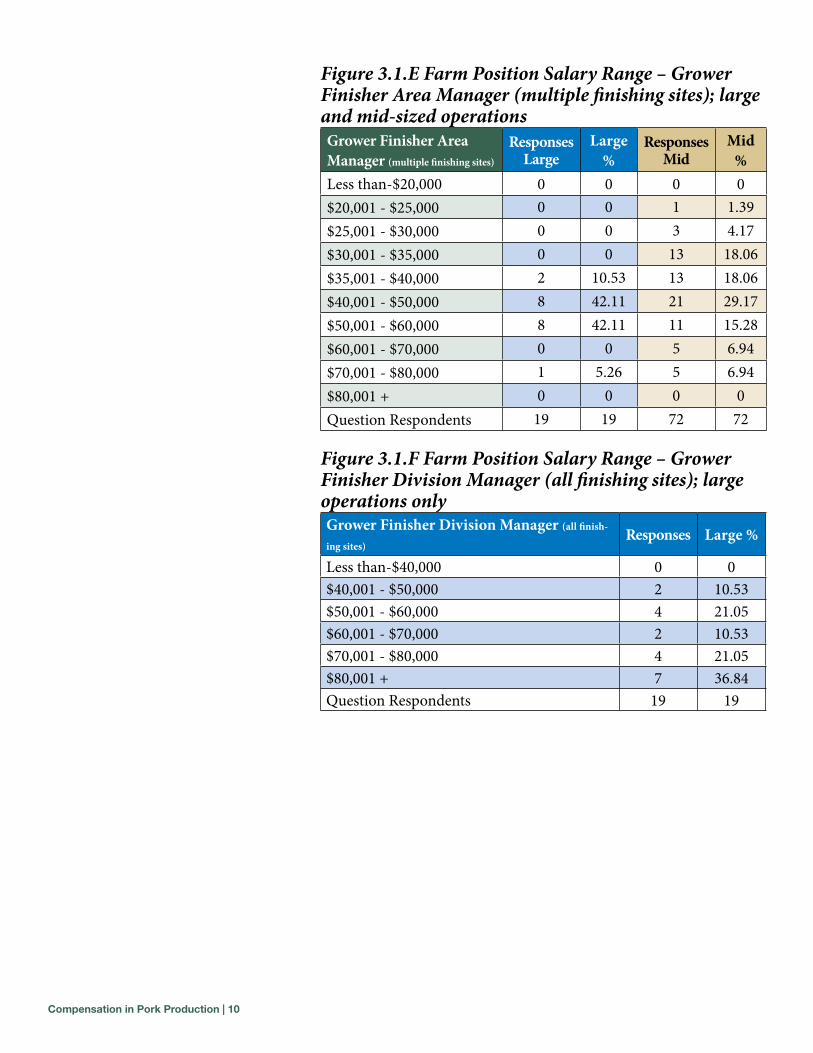
Figure 3.1.E Farm Position Salary Range – Grower Finisher Area Manager (multiple finishing sites); large and mid-sized operationsGrower Finisher Area Manager (multiple finishing sites)
Responses Large
Large %
Responses Mid
Mid %
Less than-$20,000 0 0 0 0$20,001 - $25,000 0 0 1 1.39$25,001 - $30,000 0 0 3 4.17$30,001 - $35,000 0 0 13 18.06$35,001 - $40,000 2 10.53 13 18.06$40,001 - $50,000 8 42.11 21 29.17$50,001 - $60,000 8 42.11 11 15.28$60,001 - $70,000 0 0 5 6.94$70,001 - $80,000 1 5.26 5 6.94$80,001 + 0 0 0 0Question Respondents 19 19 72 72
Figure 3.1.F Farm Position Salary Range – Grower Finisher Division Manager (all finishing sites); large operations onlyGrower Finisher Division Manager (all finish-
ing sites)Responses Large %
Less than-$40,000 0 0$40,001 - $50,000 2 10.53$50,001 - $60,000 4 21.05$60,001 - $70,000 2 10.53$70,001 - $80,000 4 21.05$80,001 + 7 36.84Question Respondents 19 19
Compensation in Pork Production | 11
Figure 3.1.G Farm Position Salary Range – Office Manager; mid-sized operations onlyOffice Manager Responses Mid %Less than-$20,000 9 14.06$20,001 - $25,000 6 9.38$25,001 - $30,000 6 9.38$30,001 - $35,000 7 10.94$35,001 - $40,000 14 21.88$40,001 - $50,000 12 18.75$50,001 - $60,000 5 7.81$60,001 - $70,000 3 4.69$70,001 - $80,000 2 3.12$80,001 + 0 0.00Question Respondents 64 64
Compensation in Pork Production | 12
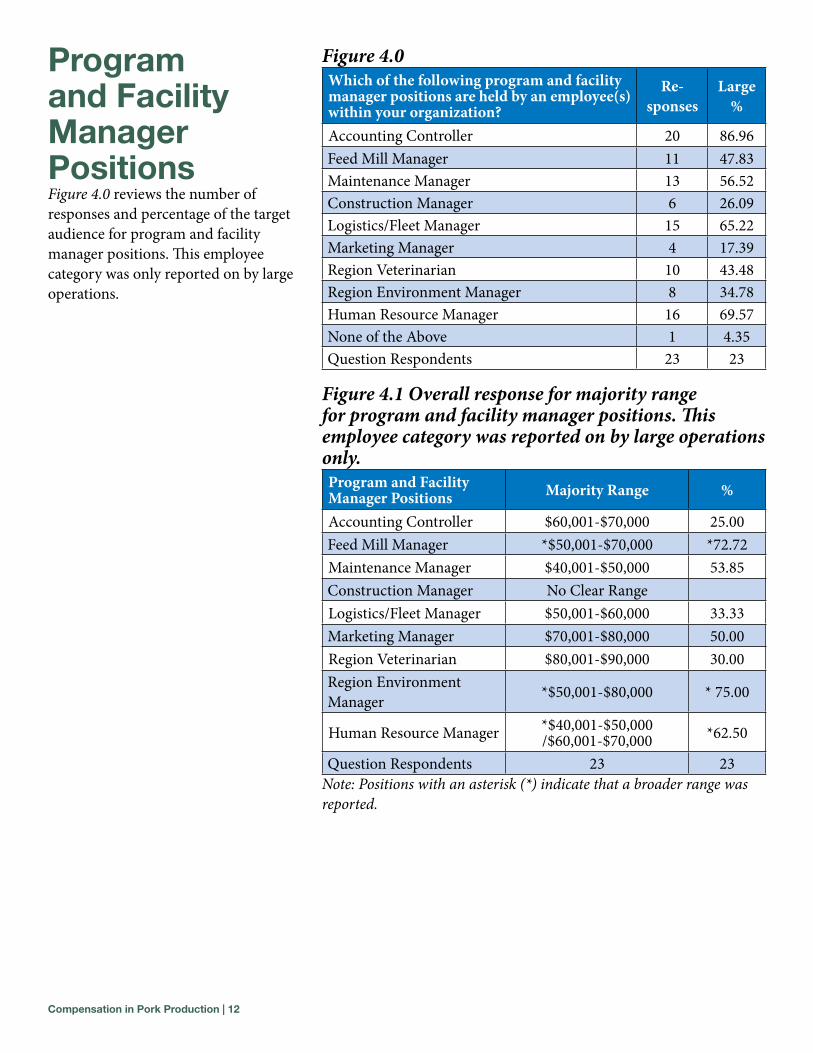
Program and Facility manager PositionsFigure 4.0 reviews the number of responses and percentage of the target audience for program and facility manager positions. This employee category was only reported on by large operations.
Figure 4.0Which of the following program and facility manager positions are held by an employee(s) within your organization?
Re-sponses
Large %
Accounting Controller 20 86.96Feed Mill Manager 11 47.83Maintenance Manager 13 56.52Construction Manager 6 26.09Logistics/Fleet Manager 15 65.22Marketing Manager 4 17.39Region Veterinarian 10 43.48Region Environment Manager 8 34.78Human Resource Manager 16 69.57None of the Above 1 4.35Question Respondents 23 23
Figure 4.1 Overall response for majority range for program and facility manager positions. This employee category was reported on by large operations only.Program and Facility Manager Positions Majority Range %
Accounting Controller $60,001-$70,000 25.00Feed Mill Manager *$50,001-$70,000 *72.72Maintenance Manager $40,001-$50,000 53.85Construction Manager No Clear RangeLogistics/Fleet Manager $50,001-$60,000 33.33Marketing Manager $70,001-$80,000 50.00Region Veterinarian $80,001-$90,000 30.00Region Environment Manager *$50,001-$80,000 * 75.00
Human Resource Manager *$40,001-$50,000/$60,001-$70,000 *62.50
Question Respondents 23 23Note: Positions with an asterisk (*) indicate that a broader range was reported.
Compensation in Pork Production | 13
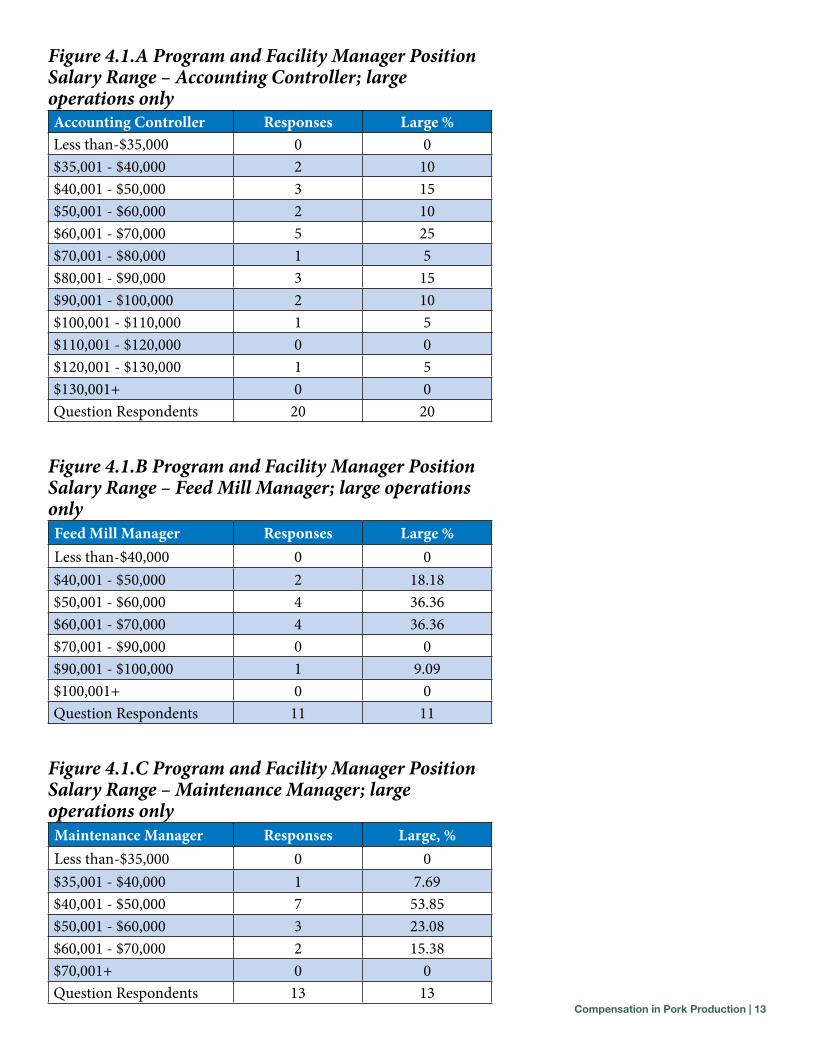
Figure 4.1.A Program and Facility Manager Position Salary Range – Accounting Controller; large operations onlyAccounting Controller Responses Large %Less than-$35,000 0 0$35,001 - $40,000 2 10$40,001 - $50,000 3 15$50,001 - $60,000 2 10$60,001 - $70,000 5 25$70,001 - $80,000 1 5$80,001 - $90,000 3 15$90,001 - $100,000 2 10$100,001 - $110,000 1 5$110,001 - $120,000 0 0$120,001 - $130,000 1 5$130,001+ 0 0Question Respondents 20 20
Figure 4.1.B Program and Facility Manager Position Salary Range – Feed Mill Manager; large operations onlyFeed Mill Manager Responses Large %Less than-$40,000 0 0$40,001 - $50,000 2 18.18$50,001 - $60,000 4 36.36$60,001 - $70,000 4 36.36$70,001 - $90,000 0 0$90,001 - $100,000 1 9.09$100,001+ 0 0Question Respondents 11 11
Figure 4.1.C Program and Facility Manager Position Salary Range – Maintenance Manager; large operations onlyMaintenance Manager Responses Large, %Less than-$35,000 0 0$35,001 - $40,000 1 7.69$40,001 - $50,000 7 53.85$50,001 - $60,000 3 23.08$60,001 - $70,000 2 15.38$70,001+ 0 0Question Respondents 13 13
Compensation in Pork Production | 14
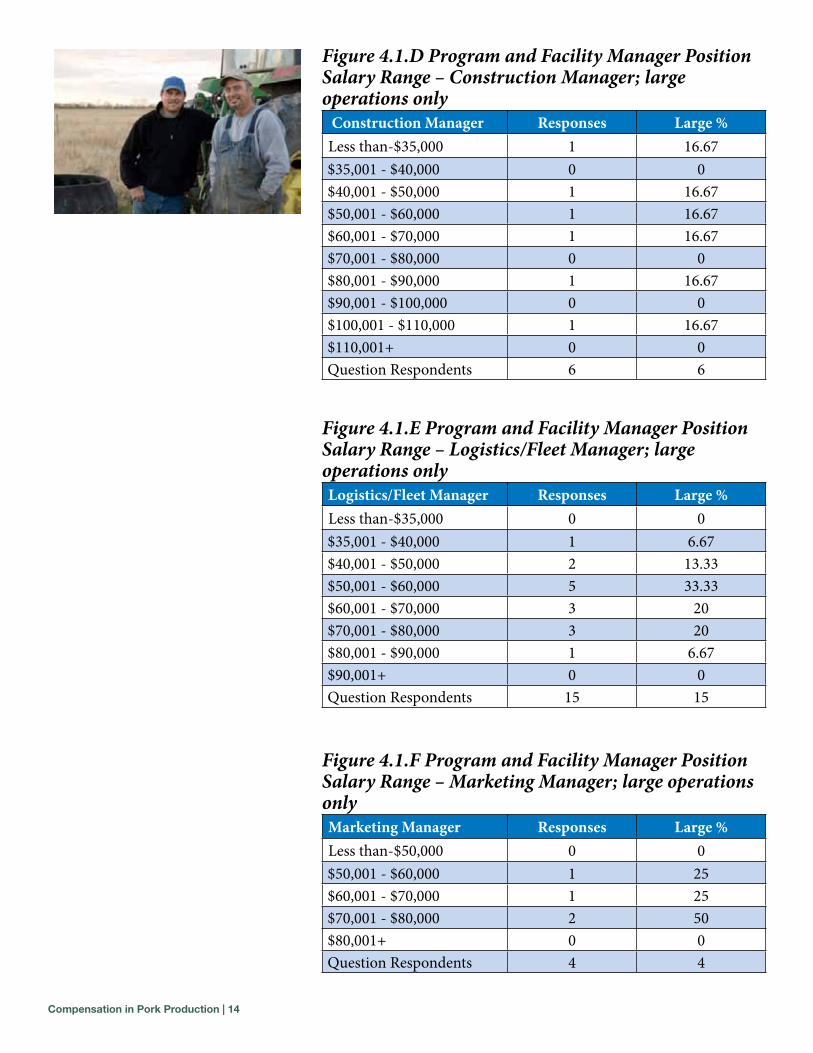
Figure 4.1.D Program and Facility Manager Position Salary Range – Construction Manager; large operations only Construction Manager Responses Large %Less than-$35,000 1 16.67$35,001 - $40,000 0 0$40,001 - $50,000 1 16.67$50,001 - $60,000 1 16.67$60,001 - $70,000 1 16.67$70,001 - $80,000 0 0$80,001 - $90,000 1 16.67$90,001 - $100,000 0 0$100,001 - $110,000 1 16.67$110,001+ 0 0Question Respondents 6 6
Figure 4.1.E Program and Facility Manager Position Salary Range – Logistics/Fleet Manager; large operations onlyLogistics/Fleet Manager Responses Large %Less than-$35,000 0 0$35,001 - $40,000 1 6.67$40,001 - $50,000 2 13.33$50,001 - $60,000 5 33.33$60,001 - $70,000 3 20$70,001 - $80,000 3 20$80,001 - $90,000 1 6.67$90,001+ 0 0Question Respondents 15 15
Figure 4.1.F Program and Facility Manager Position Salary Range – Marketing Manager; large operations onlyMarketing Manager Responses Large %Less than-$50,000 0 0$50,001 - $60,000 1 25$60,001 - $70,000 1 25$70,001 - $80,000 2 50$80,001+ 0 0Question Respondents 4 4
Compensation in Pork Production | 15
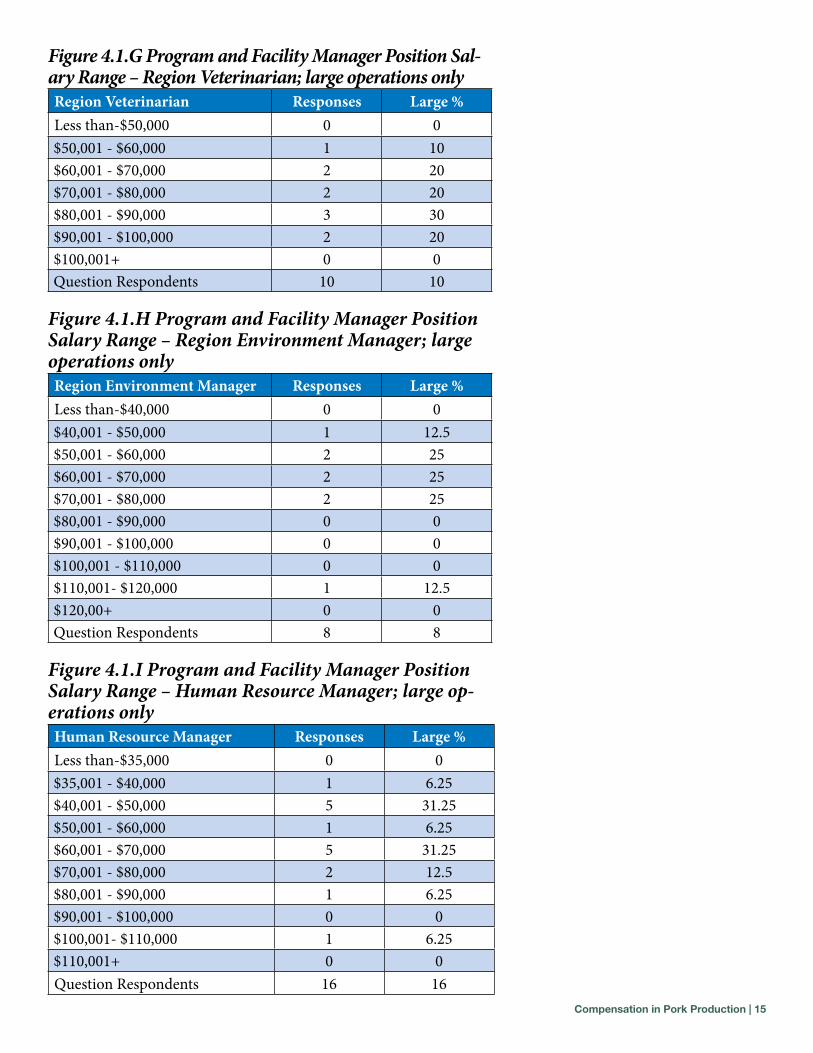
Figure 4.1.G Program and Facility Manager Position Sal-ary Range – Region Veterinarian; large operations onlyRegion Veterinarian Responses Large %Less than-$50,000 0 0$50,001 - $60,000 1 10$60,001 - $70,000 2 20$70,001 - $80,000 2 20$80,001 - $90,000 3 30$90,001 - $100,000 2 20$100,001+ 0 0Question Respondents 10 10
Figure 4.1.H Program and Facility Manager Position Salary Range – Region Environment Manager; large operations onlyRegion Environment Manager Responses Large %Less than-$40,000 0 0$40,001 - $50,000 1 12.5$50,001 - $60,000 2 25$60,001 - $70,000 2 25$70,001 - $80,000 2 25$80,001 - $90,000 0 0$90,001 - $100,000 0 0$100,001 - $110,000 0 0$110,001- $120,000 1 12.5$120,00+ 0 0Question Respondents 8 8
Figure 4.1.I Program and Facility Manager Position Salary Range – Human Resource Manager; large op-erations onlyHuman Resource Manager Responses Large %Less than-$35,000 0 0$35,001 - $40,000 1 6.25$40,001 - $50,000 5 31.25$50,001 - $60,000 1 6.25$60,001 - $70,000 5 31.25$70,001 - $80,000 2 12.5$80,001 - $90,000 1 6.25$90,001 - $100,000 0 0$100,001- $110,000 1 6.25$110,001+ 0 0Question Respondents 16 16
Compensation in Pork Production | 16
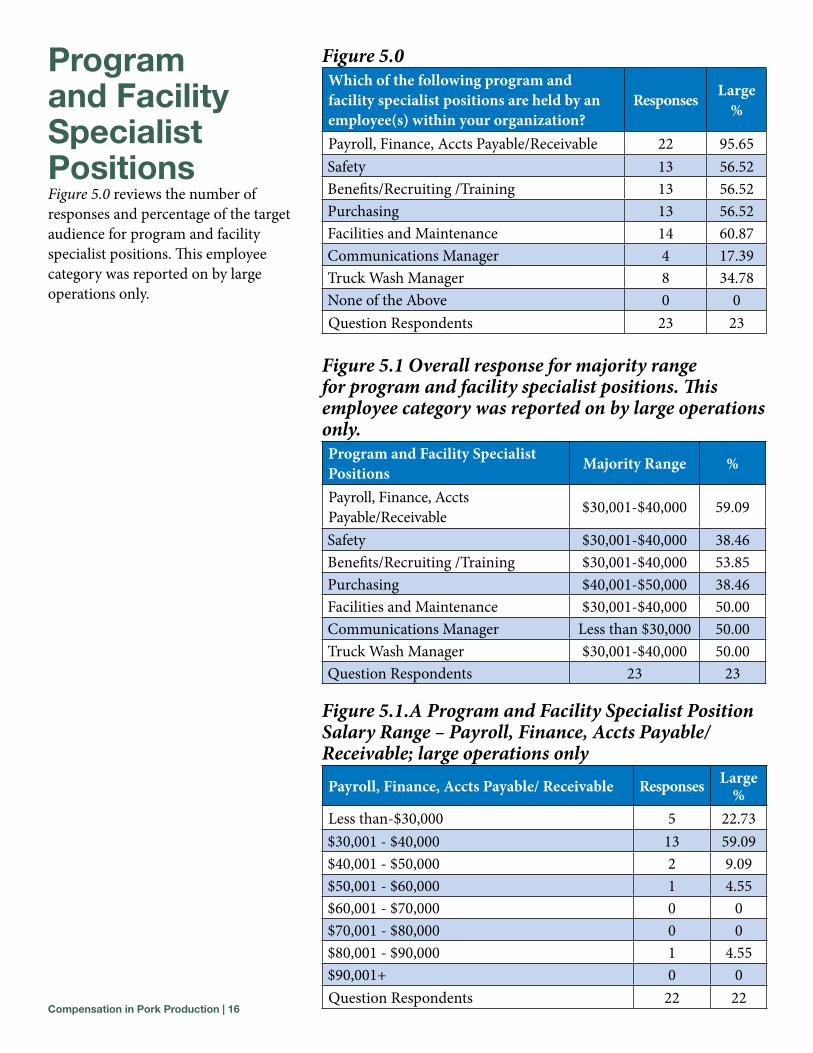
Program and Facility specialist PositionsFigure 5.0 reviews the number of responses and percentage of the target audience for program and facility specialist positions. This employee category was reported on by large operations only.
Figure 5.0Which of the following program and facility specialist positions are held by an employee(s) within your organization?
Responses Large %
Payroll, Finance, Accts Payable/Receivable 22 95.65Safety 13 56.52Benefits/Recruiting /Training 13 56.52Purchasing 13 56.52Facilities and Maintenance 14 60.87Communications Manager 4 17.39Truck Wash Manager 8 34.78None of the Above 0 0Question Respondents 23 23
Figure 5.1 Overall response for majority range for program and facility specialist positions. This employee category was reported on by large operations only.Program and Facility Specialist Positions Majority Range %
Payroll, Finance, Accts Payable/Receivable $30,001-$40,000 59.09
Safety $30,001-$40,000 38.46Benefits/Recruiting /Training $30,001-$40,000 53.85Purchasing $40,001-$50,000 38.46Facilities and Maintenance $30,001-$40,000 50.00Communications Manager Less than $30,000 50.00Truck Wash Manager $30,001-$40,000 50.00Question Respondents 23 23
Figure 5.1.A Program and Facility Specialist Position Salary Range – Payroll, Finance, Accts Payable/Receivable; large operations onlyPayroll, Finance, Accts Payable/ Receivable Responses Large
%Less than-$30,000 5 22.73$30,001 - $40,000 13 59.09$40,001 - $50,000 2 9.09$50,001 - $60,000 1 4.55$60,001 - $70,000 0 0$70,001 - $80,000 0 0$80,001 - $90,000 1 4.55$90,001+ 0 0Question Respondents 22 22
Compensation in Pork Production | 17
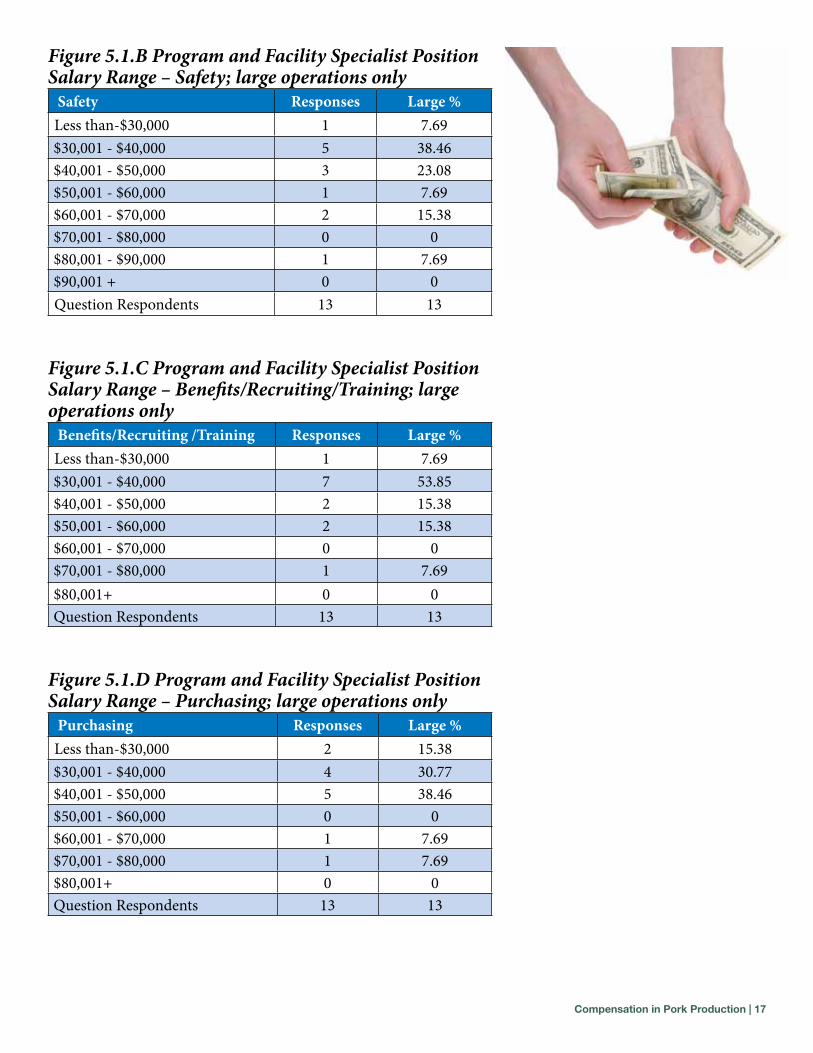
Figure 5.1.B Program and Facility Specialist Position Salary Range – Safety; large operations only Safety Responses Large %Less than-$30,000 1 7.69$30,001 - $40,000 5 38.46$40,001 - $50,000 3 23.08$50,001 - $60,000 1 7.69$60,001 - $70,000 2 15.38$70,001 - $80,000 0 0$80,001 - $90,000 1 7.69$90,001 + 0 0Question Respondents 13 13
Figure 5.1.C Program and Facility Specialist Position Salary Range – Benefits/Recruiting/Training; large operations only Benefits/Recruiting /Training Responses Large %Less than-$30,000 1 7.69$30,001 - $40,000 7 53.85$40,001 - $50,000 2 15.38$50,001 - $60,000 2 15.38$60,001 - $70,000 0 0$70,001 - $80,000 1 7.69$80,001+ 0 0Question Respondents 13 13
Figure 5.1.D Program and Facility Specialist Position Salary Range – Purchasing; large operations only Purchasing Responses Large %Less than-$30,000 2 15.38$30,001 - $40,000 4 30.77$40,001 - $50,000 5 38.46$50,001 - $60,000 0 0$60,001 - $70,000 1 7.69$70,001 - $80,000 1 7.69$80,001+ 0 0Question Respondents 13 13
Compensation in Pork Production | 18
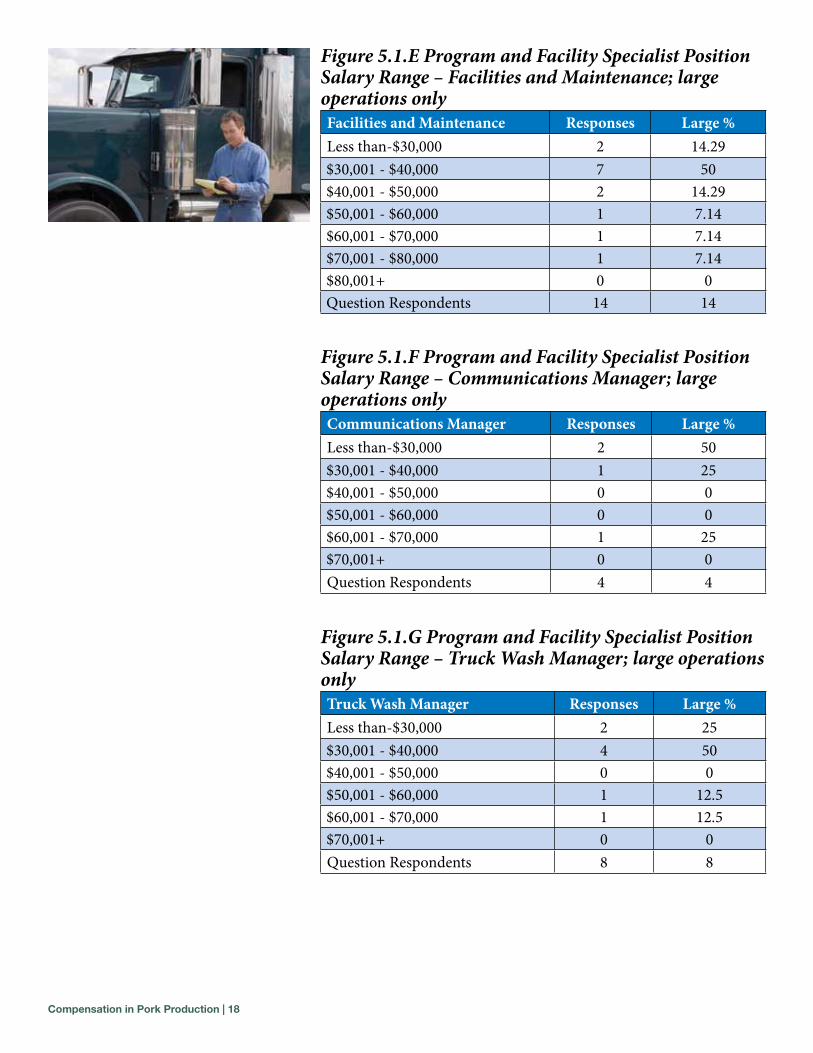
Figure 5.1.E Program and Facility Specialist Position Salary Range – Facilities and Maintenance; large operations onlyFacilities and Maintenance Responses Large %Less than-$30,000 2 14.29$30,001 - $40,000 7 50$40,001 - $50,000 2 14.29$50,001 - $60,000 1 7.14$60,001 - $70,000 1 7.14$70,001 - $80,000 1 7.14$80,001+ 0 0Question Respondents 14 14
Figure 5.1.F Program and Facility Specialist Position Salary Range – Communications Manager; large operations onlyCommunications Manager Responses Large %Less than-$30,000 2 50$30,001 - $40,000 1 25$40,001 - $50,000 0 0$50,001 - $60,000 0 0$60,001 - $70,000 1 25$70,001+ 0 0Question Respondents 4 4
Figure 5.1.G Program and Facility Specialist Position Salary Range – Truck Wash Manager; large operations onlyTruck Wash Manager Responses Large %Less than-$30,000 2 25$30,001 - $40,000 4 50$40,001 - $50,000 0 0$50,001 - $60,000 1 12.5$60,001 - $70,000 1 12.5$70,001+ 0 0Question Respondents 8 8
Compensation in Pork Production | 19
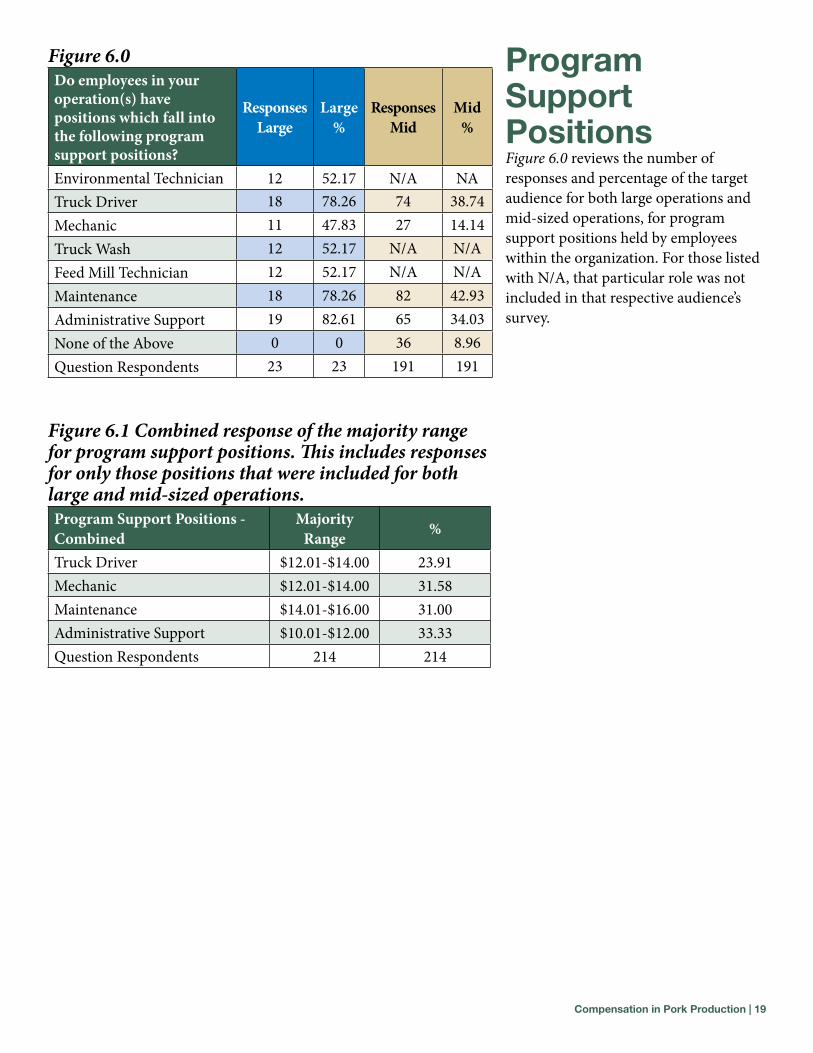
Program support PositionsFigure 6.0 reviews the number of responses and percentage of the target audience for both large operations and mid-sized operations, for program support positions held by employees within the organization. For those listed with N/A, that particular role was not included in that respective audience’s survey.
Figure 6.0Do employees in your operation(s) have positions which fall into the following program support positions?
Responses Large
Large %
Responses Mid
Mid %
Environmental Technician 12 52.17 N/A NATruck Driver 18 78.26 74 38.74Mechanic 11 47.83 27 14.14Truck Wash 12 52.17 N/A N/AFeed Mill Technician 12 52.17 N/A N/AMaintenance 18 78.26 82 42.93Administrative Support 19 82.61 65 34.03None of the Above 0 0 36 8.96Question Respondents 23 23 191 191
Figure 6.1 Combined response of the majority range for program support positions. This includes responses for only those positions that were included for both large and mid-sized operations.Program Support Positions - Combined
Majority Range %
Truck Driver $12.01-$14.00 23.91Mechanic $12.01-$14.00 31.58Maintenance $14.01-$16.00 31.00Administrative Support $10.01-$12.00 33.33Question Respondents 214 214
Compensation in Pork Production | 20
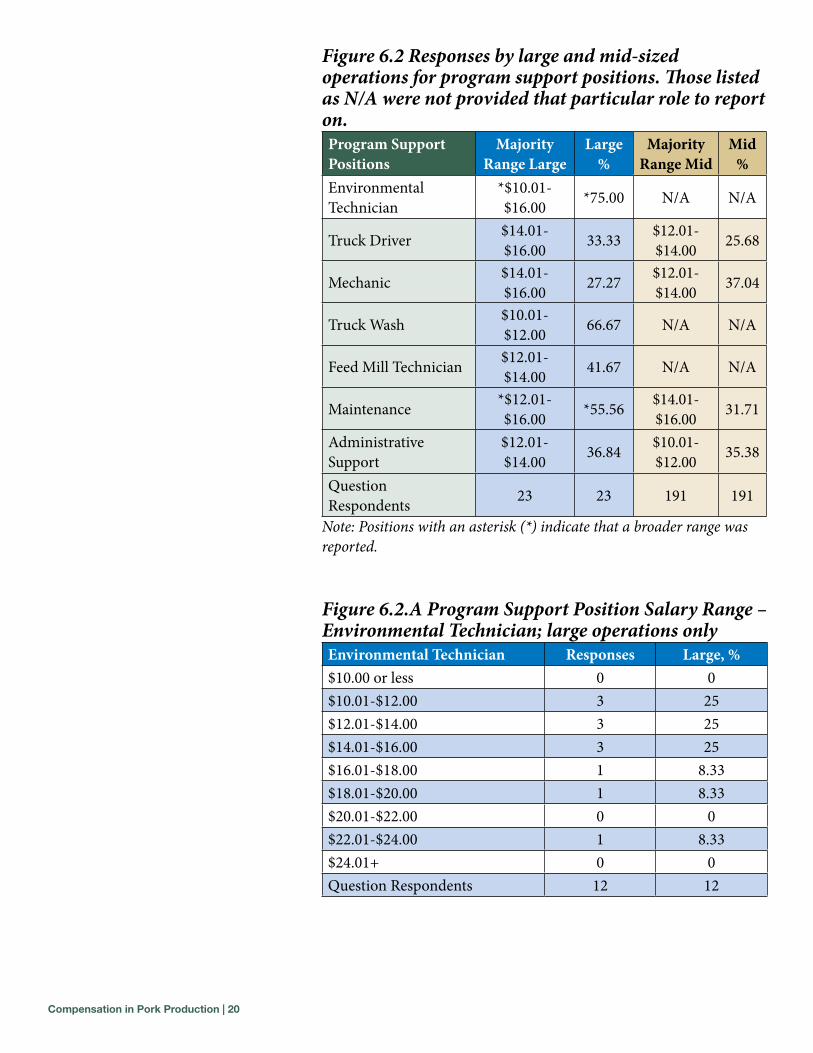
Figure 6.2 Responses by large and mid-sized operations for program support positions. Those listed as N/A were not provided that particular role to report on.Program Support Positions
Majority Range Large
Large %
Majority Range Mid
Mid %
Environmental Technician
*$10.01-$16.00 *75.00 N/A N/A
Truck Driver $14.01-$16.00 33.33 $12.01-
$14.00 25.68
Mechanic $14.01-$16.00 27.27 $12.01-
$14.00 37.04
Truck Wash $10.01-$12.00 66.67 N/A N/A
Feed Mill Technician $12.01-$14.00 41.67 N/A N/A
Maintenance *$12.01-$16.00 *55.56 $14.01-
$16.00 31.71
Administrative Support
$12.01-$14.00 36.84 $10.01-
$12.00 35.38
Question Respondents 23 23 191 191
Note: Positions with an asterisk (*) indicate that a broader range was reported.
Figure 6.2.A Program Support Position Salary Range – Environmental Technician; large operations onlyEnvironmental Technician Responses Large, %$10.00 or less 0 0$10.01-$12.00 3 25$12.01-$14.00 3 25$14.01-$16.00 3 25$16.01-$18.00 1 8.33$18.01-$20.00 1 8.33$20.01-$22.00 0 0$22.01-$24.00 1 8.33$24.01+ 0 0Question Respondents 12 12
Compensation in Pork Production | 21
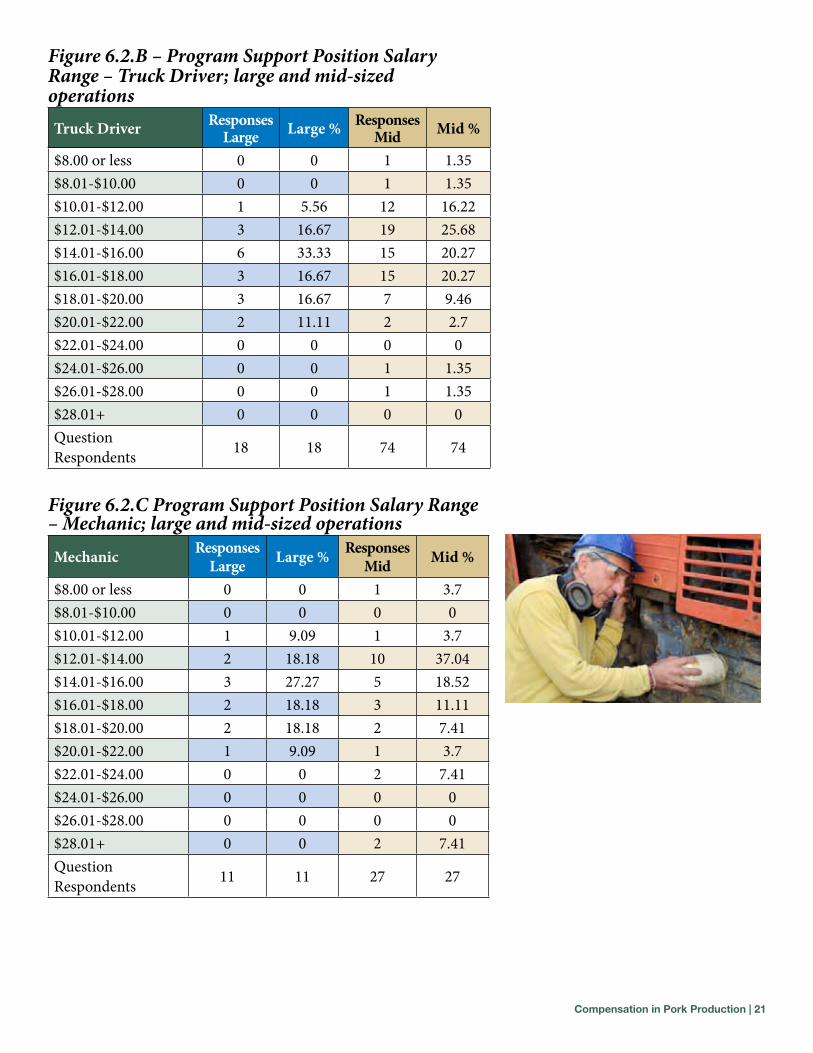
Figure 6.2.B – Program Support Position Salary Range – Truck Driver; large and mid-sized operationsTruck Driver Responses
Large Large % Responses Mid Mid %
$8.00 or less 0 0 1 1.35$8.01-$10.00 0 0 1 1.35$10.01-$12.00 1 5.56 12 16.22$12.01-$14.00 3 16.67 19 25.68$14.01-$16.00 6 33.33 15 20.27$16.01-$18.00 3 16.67 15 20.27$18.01-$20.00 3 16.67 7 9.46$20.01-$22.00 2 11.11 2 2.7$22.01-$24.00 0 0 0 0$24.01-$26.00 0 0 1 1.35$26.01-$28.00 0 0 1 1.35$28.01+ 0 0 0 0Question Respondents 18 18 74 74
Figure 6.2.C Program Support Position Salary Range – Mechanic; large and mid-sized operationsMechanic Responses
Large Large % Responses Mid Mid %
$8.00 or less 0 0 1 3.7$8.01-$10.00 0 0 0 0$10.01-$12.00 1 9.09 1 3.7$12.01-$14.00 2 18.18 10 37.04$14.01-$16.00 3 27.27 5 18.52$16.01-$18.00 2 18.18 3 11.11$18.01-$20.00 2 18.18 2 7.41$20.01-$22.00 1 9.09 1 3.7$22.01-$24.00 0 0 2 7.41$24.01-$26.00 0 0 0 0$26.01-$28.00 0 0 0 0$28.01+ 0 0 2 7.41Question Respondents 11 11 27 27
Compensation in Pork Production | 22
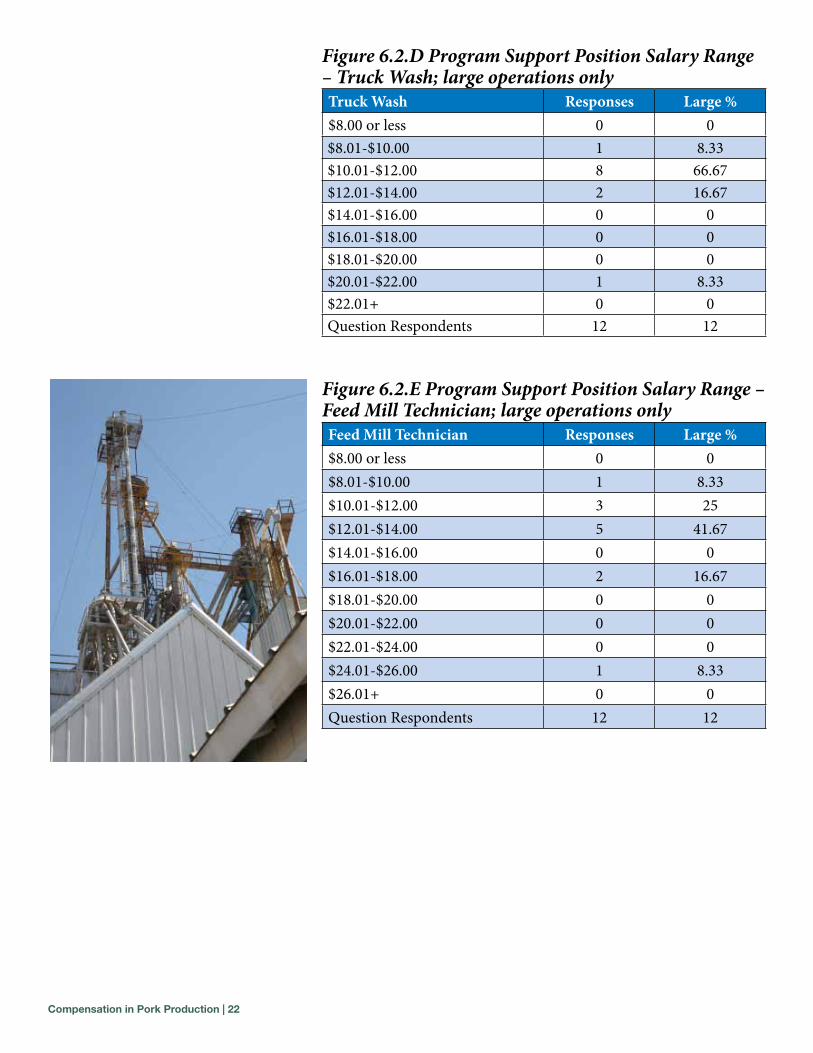
Figure 6.2.D Program Support Position Salary Range – Truck Wash; large operations onlyTruck Wash Responses Large %$8.00 or less 0 0$8.01-$10.00 1 8.33$10.01-$12.00 8 66.67$12.01-$14.00 2 16.67$14.01-$16.00 0 0$16.01-$18.00 0 0$18.01-$20.00 0 0$20.01-$22.00 1 8.33$22.01+ 0 0Question Respondents 12 12
Figure 6.2.E Program Support Position Salary Range – Feed Mill Technician; large operations onlyFeed Mill Technician Responses Large %$8.00 or less 0 0$8.01-$10.00 1 8.33$10.01-$12.00 3 25$12.01-$14.00 5 41.67$14.01-$16.00 0 0$16.01-$18.00 2 16.67$18.01-$20.00 0 0$20.01-$22.00 0 0$22.01-$24.00 0 0$24.01-$26.00 1 8.33$26.01+ 0 0Question Respondents 12 12
Compensation in Pork Production | 23
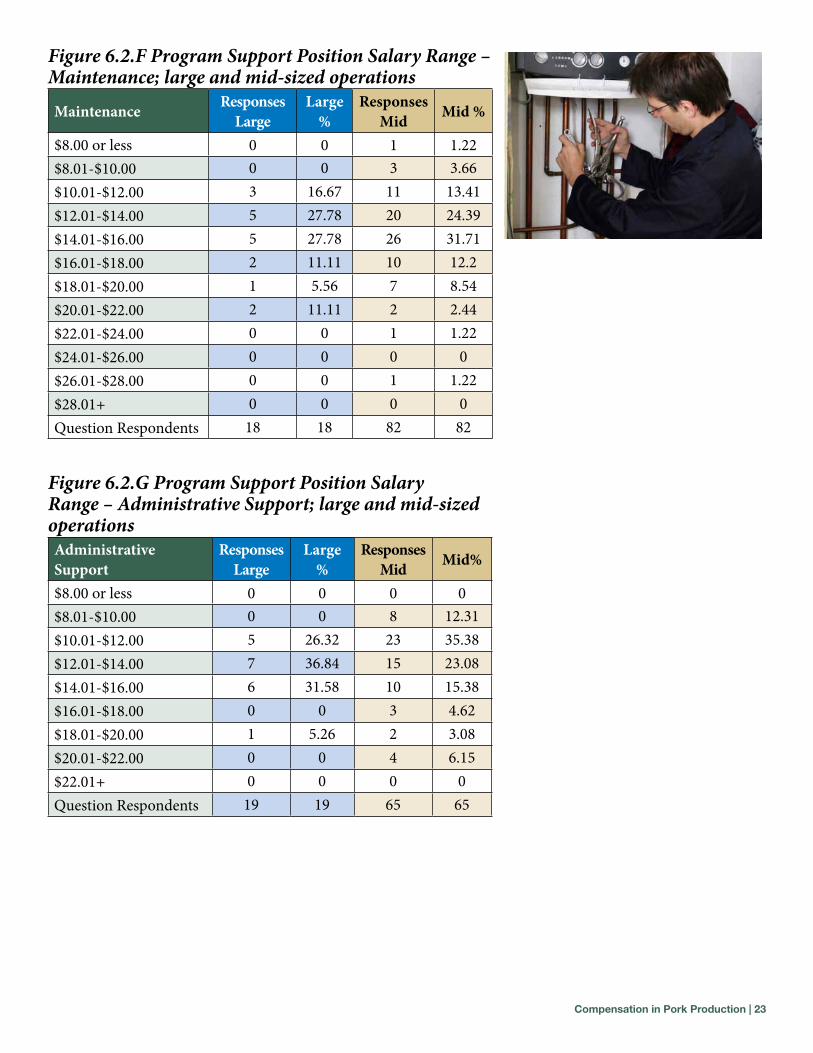
Figure 6.2.F Program Support Position Salary Range – Maintenance; large and mid-sized operations
Maintenance Responses Large
Large %
Responses Mid Mid %
$8.00 or less 0 0 1 1.22$8.01-$10.00 0 0 3 3.66$10.01-$12.00 3 16.67 11 13.41$12.01-$14.00 5 27.78 20 24.39$14.01-$16.00 5 27.78 26 31.71$16.01-$18.00 2 11.11 10 12.2$18.01-$20.00 1 5.56 7 8.54$20.01-$22.00 2 11.11 2 2.44$22.01-$24.00 0 0 1 1.22$24.01-$26.00 0 0 0 0$26.01-$28.00 0 0 1 1.22$28.01+ 0 0 0 0Question Respondents 18 18 82 82
Figure 6.2.G Program Support Position Salary Range – Administrative Support; large and mid-sized operationsAdministrative Support
Responses Large
Large %
Responses Mid Mid%
$8.00 or less 0 0 0 0$8.01-$10.00 0 0 8 12.31$10.01-$12.00 5 26.32 23 35.38$12.01-$14.00 7 36.84 15 23.08$14.01-$16.00 6 31.58 10 15.38$16.01-$18.00 0 0 3 4.62$18.01-$20.00 1 5.26 2 3.08$20.01-$22.00 0 0 4 6.15$22.01+ 0 0 0 0Question Respondents 19 19 65 65
Compensation in Pork Production | 24
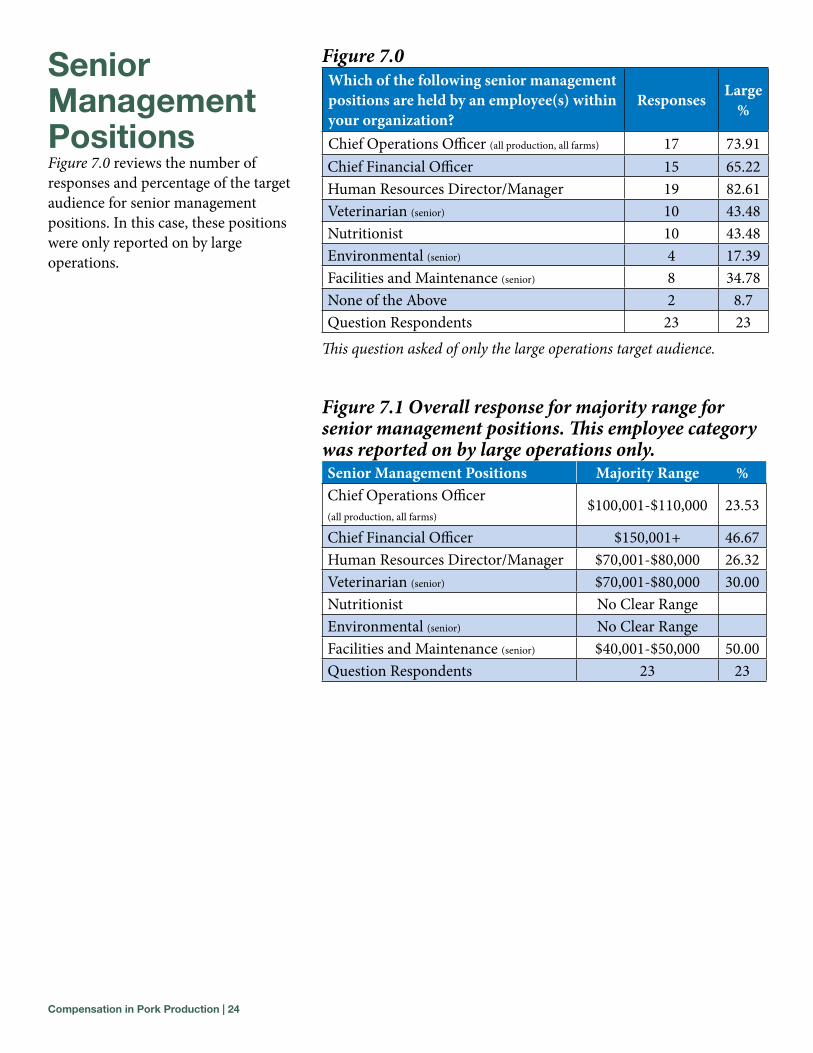
senior management PositionsFigure 7.0 reviews the number of responses and percentage of the target audience for senior management positions. In this case, these positions were only reported on by large operations.
Figure 7.0Which of the following senior management positions are held by an employee(s) within your organization?
Responses Large %
Chief Operations Officer (all production, all farms) 17 73.91Chief Financial Officer 15 65.22Human Resources Director/Manager 19 82.61Veterinarian (senior) 10 43.48Nutritionist 10 43.48Environmental (senior) 4 17.39Facilities and Maintenance (senior) 8 34.78None of the Above 2 8.7Question Respondents 23 23
This question asked of only the large operations target audience.
Figure 7.1 Overall response for majority range for senior management positions. This employee category was reported on by large operations only.Senior Management Positions Majority Range %Chief Operations Officer
(all production, all farms)$100,001-$110,000 23.53
Chief Financial Officer $150,001+ 46.67Human Resources Director/Manager $70,001-$80,000 26.32Veterinarian (senior) $70,001-$80,000 30.00Nutritionist No Clear RangeEnvironmental (senior) No Clear RangeFacilities and Maintenance (senior) $40,001-$50,000 50.00Question Respondents 23 23
Compensation in Pork Production | 25
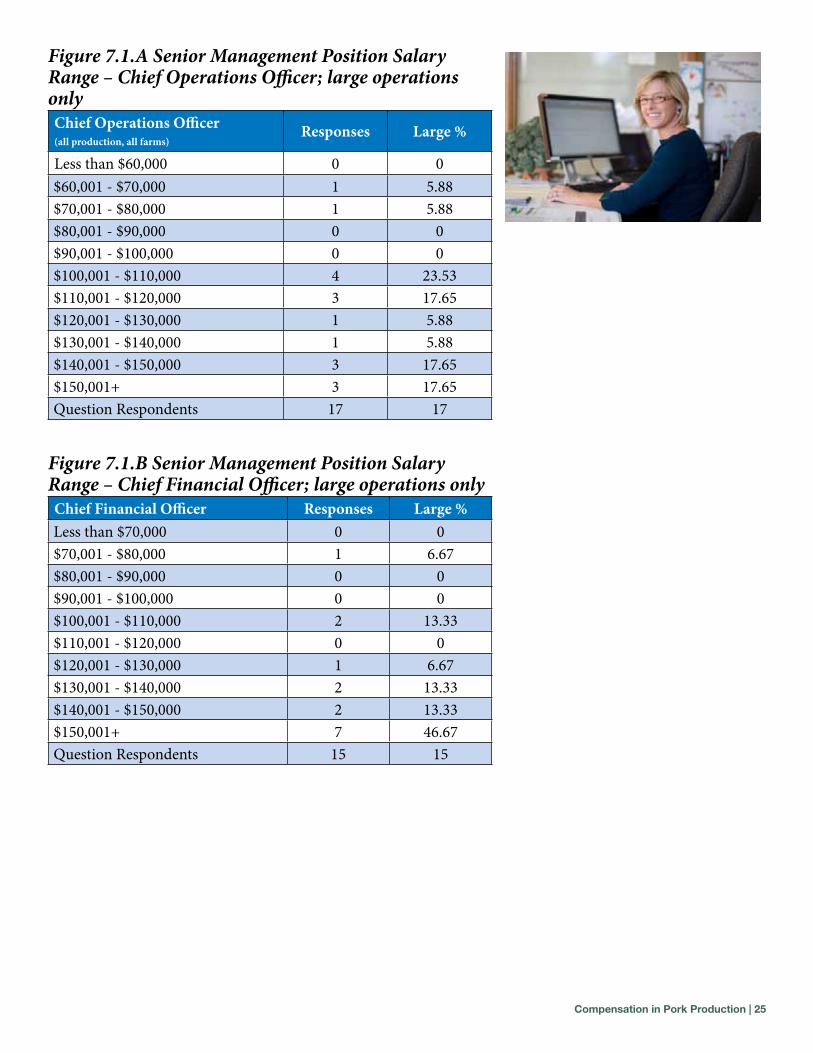
Figure 7.1.A Senior Management Position Salary Range – Chief Operations Officer; large operations onlyChief Operations Officer (all production, all farms)
Responses Large %
Less than $60,000 0 0$60,001 - $70,000 1 5.88$70,001 - $80,000 1 5.88$80,001 - $90,000 0 0$90,001 - $100,000 0 0$100,001 - $110,000 4 23.53$110,001 - $120,000 3 17.65$120,001 - $130,000 1 5.88$130,001 - $140,000 1 5.88$140,001 - $150,000 3 17.65$150,001+ 3 17.65Question Respondents 17 17
Figure 7.1.B Senior Management Position Salary Range – Chief Financial Officer; large operations onlyChief Financial Officer Responses Large %Less than $70,000 0 0$70,001 - $80,000 1 6.67$80,001 - $90,000 0 0$90,001 - $100,000 0 0$100,001 - $110,000 2 13.33$110,001 - $120,000 0 0$120,001 - $130,000 1 6.67$130,001 - $140,000 2 13.33$140,001 - $150,000 2 13.33$150,001+ 7 46.67Question Respondents 15 15
Compensation in Pork Production | 26
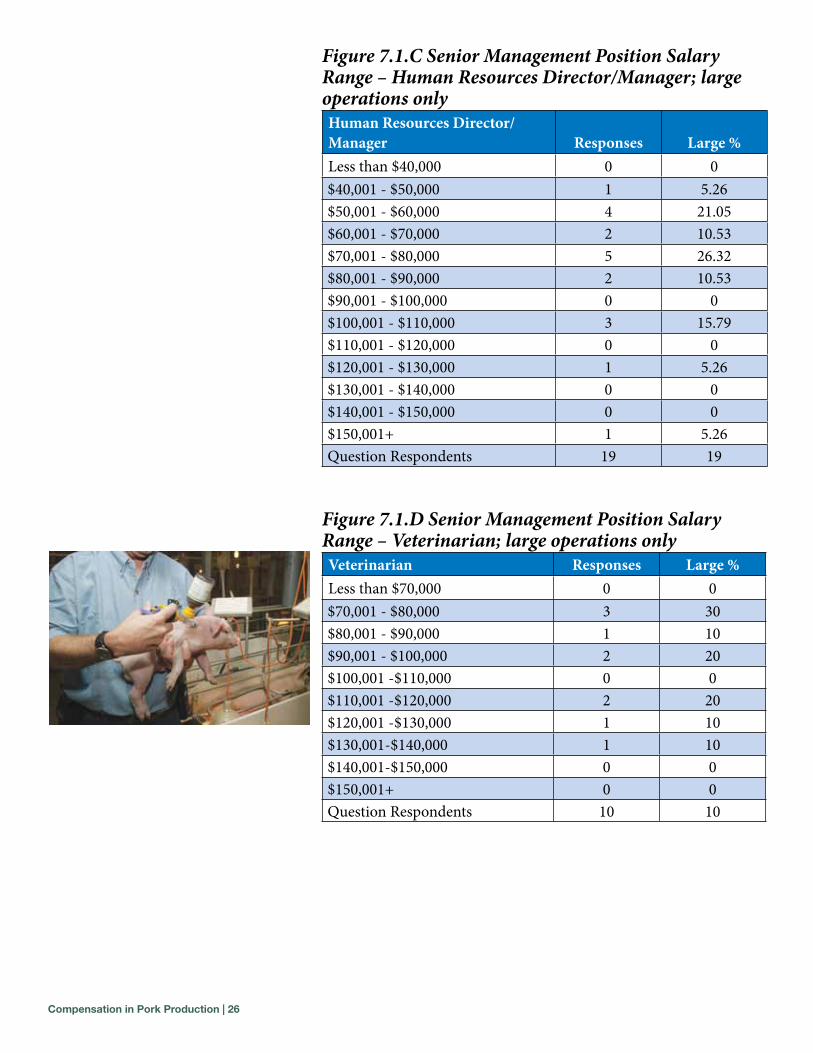
Figure 7.1.C Senior Management Position Salary Range – Human Resources Director/Manager; large operations onlyHuman Resources Director/Manager Responses Large %Less than $40,000 0 0$40,001 - $50,000 1 5.26$50,001 - $60,000 4 21.05$60,001 - $70,000 2 10.53$70,001 - $80,000 5 26.32$80,001 - $90,000 2 10.53$90,001 - $100,000 0 0$100,001 - $110,000 3 15.79$110,001 - $120,000 0 0$120,001 - $130,000 1 5.26$130,001 - $140,000 0 0$140,001 - $150,000 0 0$150,001+ 1 5.26Question Respondents 19 19
Figure 7.1.D Senior Management Position Salary Range – Veterinarian; large operations onlyVeterinarian Responses Large %Less than $70,000 0 0$70,001 - $80,000 3 30$80,001 - $90,000 1 10$90,001 - $100,000 2 20$100,001 -$110,000 0 0$110,001 -$120,000 2 20$120,001 -$130,000 1 10$130,001-$140,000 1 10$140,001-$150,000 0 0$150,001+ 0 0Question Respondents 10 10
Compensation in Pork Production | 27
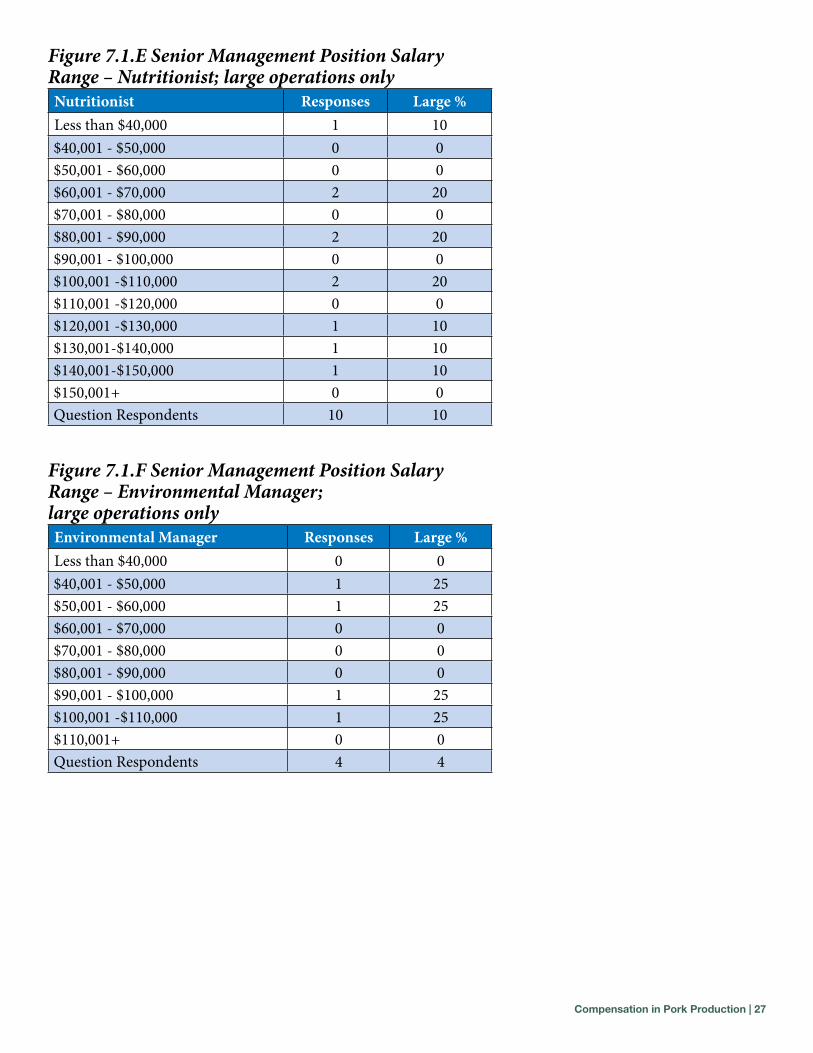
Figure 7.1.E Senior Management Position Salary Range – Nutritionist; large operations onlyNutritionist Responses Large %Less than $40,000 1 10$40,001 - $50,000 0 0$50,001 - $60,000 0 0$60,001 - $70,000 2 20$70,001 - $80,000 0 0$80,001 - $90,000 2 20$90,001 - $100,000 0 0$100,001 -$110,000 2 20$110,001 -$120,000 0 0$120,001 -$130,000 1 10$130,001-$140,000 1 10$140,001-$150,000 1 10$150,001+ 0 0Question Respondents 10 10
Figure 7.1.F Senior Management Position Salary Range – Environmental Manager; large operations onlyEnvironmental Manager Responses Large %Less than $40,000 0 0$40,001 - $50,000 1 25$50,001 - $60,000 1 25$60,001 - $70,000 0 0$70,001 - $80,000 0 0$80,001 - $90,000 0 0$90,001 - $100,000 1 25$100,001 -$110,000 1 25$110,001+ 0 0Question Respondents 4 4
Compensation in Pork Production | 28
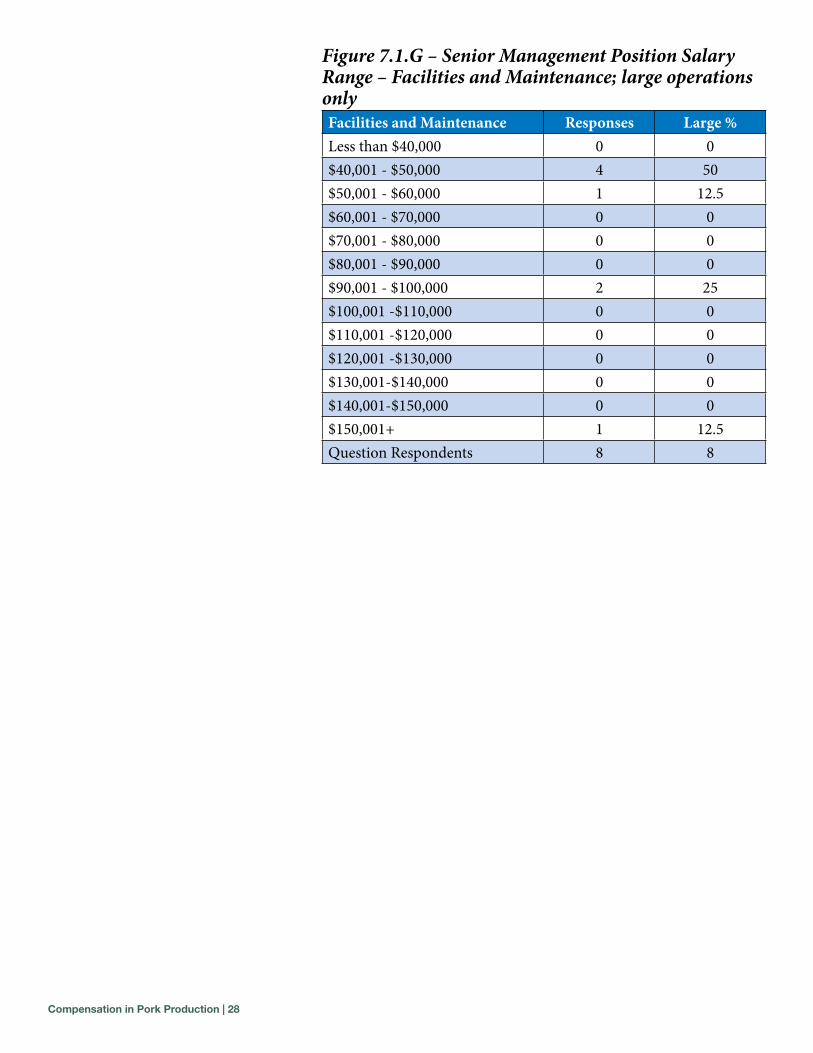
Figure 7.1.G – Senior Management Position Salary Range – Facilities and Maintenance; large operations onlyFacilities and Maintenance Responses Large %Less than $40,000 0 0$40,001 - $50,000 4 50$50,001 - $60,000 1 12.5$60,001 - $70,000 0 0$70,001 - $80,000 0 0$80,001 - $90,000 0 0$90,001 - $100,000 2 25$100,001 -$110,000 0 0$110,001 -$120,000 0 0$120,001 -$130,000 0 0$130,001-$140,000 0 0$140,001-$150,000 0 0$150,001+ 1 12.5Question Respondents 8 8
Compensation in Pork Production | 29
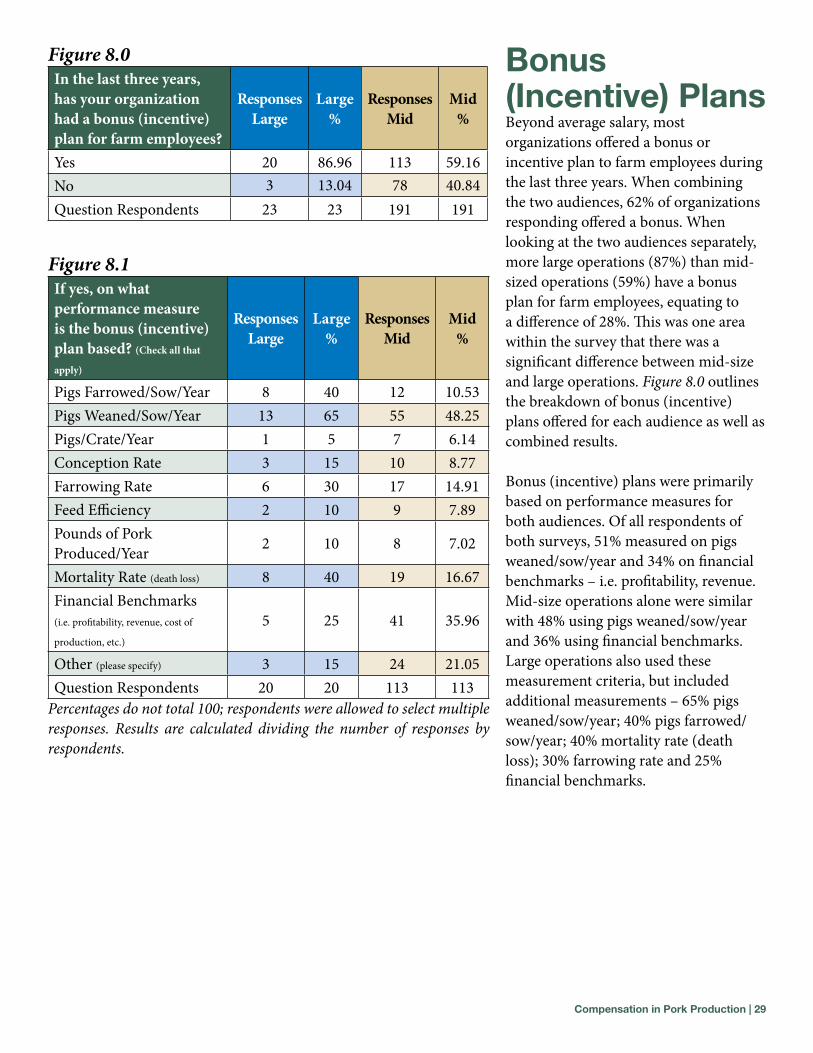
Bonus (Incentive) PlansBeyond average salary, most organizations offered a bonus or incentive plan to farm employees during the last three years. When combining the two audiences, 62% of organizations responding offered a bonus. When looking at the two audiences separately, more large operations (87%) than mid-sized operations (59%) have a bonus plan for farm employees, equating to a difference of 28%. This was one area within the survey that there was a significant difference between mid-size and large operations. Figure 8.0 outlines the breakdown of bonus (incentive) plans offered for each audience as well as combined results.
Bonus (incentive) plans were primarily based on performance measures for both audiences. Of all respondents of both surveys, 51% measured on pigs weaned/sow/year and 34% on financial benchmarks – i.e. profitability, revenue. Mid-size operations alone were similar with 48% using pigs weaned/sow/year and 36% using financial benchmarks. Large operations also used these measurement criteria, but included additional measurements – 65% pigs weaned/sow/year; 40% pigs farrowed/sow/year; 40% mortality rate (death loss); 30% farrowing rate and 25% financial benchmarks.
Figure 8.0In the last three years, has your organization had a bonus (incentive) plan for farm employees?
Responses Large
Large %
Responses Mid
Mid %
Yes 20 86.96 113 59.16No 3 13.04 78 40.84Question Respondents 23 23 191 191
Figure 8.1If yes, on what performance measure is the bonus (incentive) plan based? (Check all that
apply)
Responses Large
Large %
Responses Mid
Mid %
Pigs Farrowed/Sow/Year 8 40 12 10.53Pigs Weaned/Sow/Year 13 65 55 48.25Pigs/Crate/Year 1 5 7 6.14Conception Rate 3 15 10 8.77Farrowing Rate 6 30 17 14.91Feed Efficiency 2 10 9 7.89Pounds of Pork Produced/Year 2 10 8 7.02
Mortality Rate (death loss) 8 40 19 16.67Financial Benchmarks (i.e. profitability, revenue, cost of
production, etc.)
5 25 41 35.96
Other (please specify) 3 15 24 21.05Question Respondents 20 20 113 113
Percentages do not total 100; respondents were allowed to select multiple responses. Results are calculated dividing the number of responses by respondents.
Compensation in Pork Production | 30
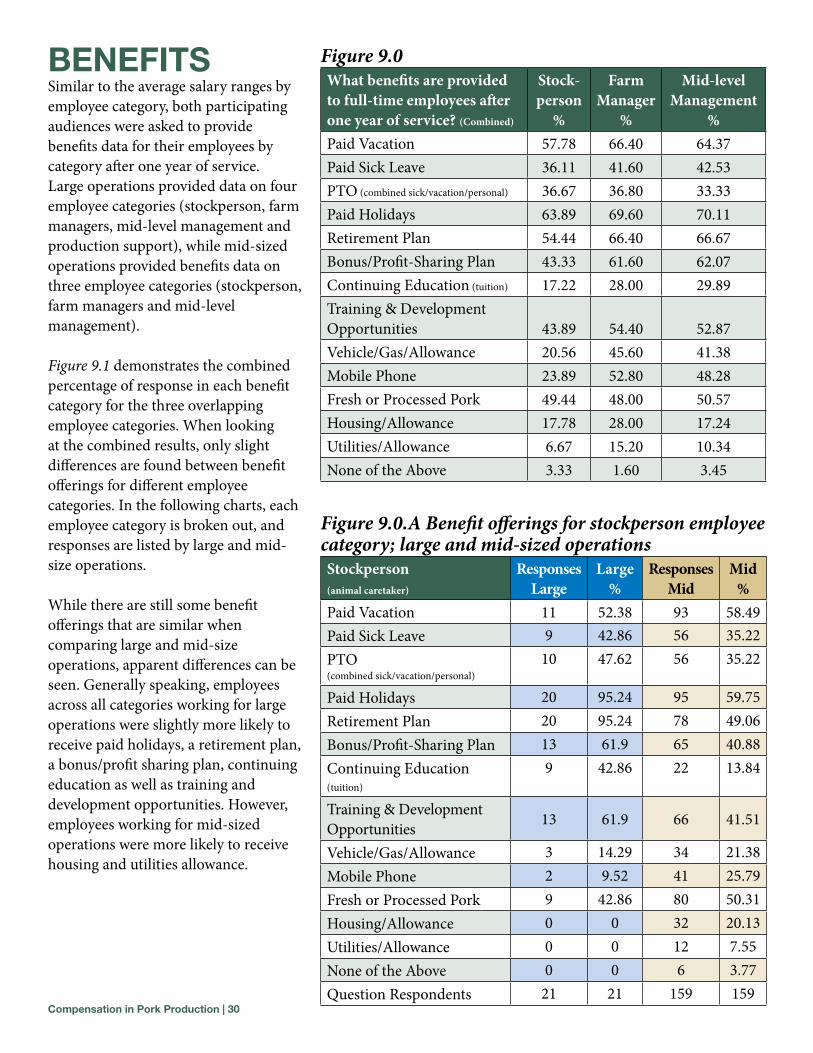
BEnEFITsSimilar to the average salary ranges by employee category, both participating audiences were asked to provide benefits data for their employees by category after one year of service. Large operations provided data on four employee categories (stockperson, farm managers, mid-level management and production support), while mid-sized operations provided benefits data on three employee categories (stockperson, farm managers and mid-level management).
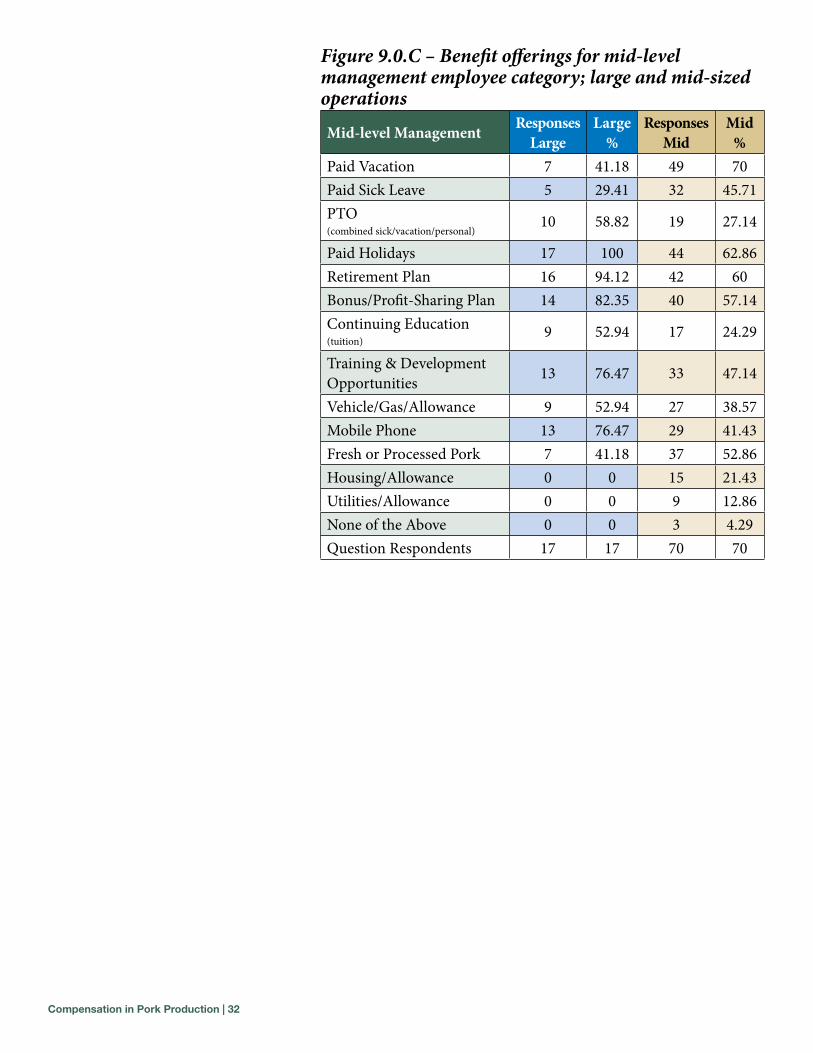
Figure 9.1 demonstrates the combined percentage of response in each benefit category for the three overlapping employee categories. When looking at the combined results, only slight differences are found between benefit offerings for different employee categories. In the following charts, each employee category is broken out, and responses are listed by large and mid-size operations.
While there are still some benefit offerings that are similar when comparing large and mid-size operations, apparent differences can be seen. Generally speaking, employees across all categories working for large operations were slightly more likely to receive paid holidays, a retirement plan, a bonus/profit sharing plan, continuing education as well as training and development opportunities. However, employees working for mid-sized operations were more likely to receive housing and utilities allowance.
Figure 9.0What benefits are provided to full-time employees after one year of service? (Combined)
Stock-person
%
Farm Manager
%
Mid-level Management
%Paid Vacation 57.78 66.40 64.37Paid Sick Leave 36.11 41.60 42.53PTO (combined sick/vacation/personal) 36.67 36.80 33.33Paid Holidays 63.89 69.60 70.11Retirement Plan 54.44 66.40 66.67Bonus/Profit-Sharing Plan 43.33 61.60 62.07Continuing Education (tuition) 17.22 28.00 29.89Training & Development Opportunities 43.89 54.40 52.87Vehicle/Gas/Allowance 20.56 45.60 41.38Mobile Phone 23.89 52.80 48.28Fresh or Processed Pork 49.44 48.00 50.57Housing/Allowance 17.78 28.00 17.24Utilities/Allowance 6.67 15.20 10.34None of the Above 3.33 1.60 3.45
Figure 9.0.A Benefit offerings for stockperson employee category; large and mid-sized operationsStockperson (animal caretaker)
Responses Large
Large %
Responses Mid
Mid %
Paid Vacation 11 52.38 93 58.49Paid Sick Leave 9 42.86 56 35.22PTO (combined sick/vacation/personal)
10 47.62 56 35.22
Paid Holidays 20 95.24 95 59.75Retirement Plan 20 95.24 78 49.06Bonus/Profit-Sharing Plan 13 61.9 65 40.88Continuing Education (tuition)
9 42.86 22 13.84
Training & Development Opportunities 13 61.9 66 41.51
Vehicle/Gas/Allowance 3 14.29 34 21.38Mobile Phone 2 9.52 41 25.79Fresh or Processed Pork 9 42.86 80 50.31Housing/Allowance 0 0 32 20.13Utilities/Allowance 0 0 12 7.55None of the Above 0 0 6 3.77Question Respondents 21 21 159 159
Compensation in Pork Production | 31
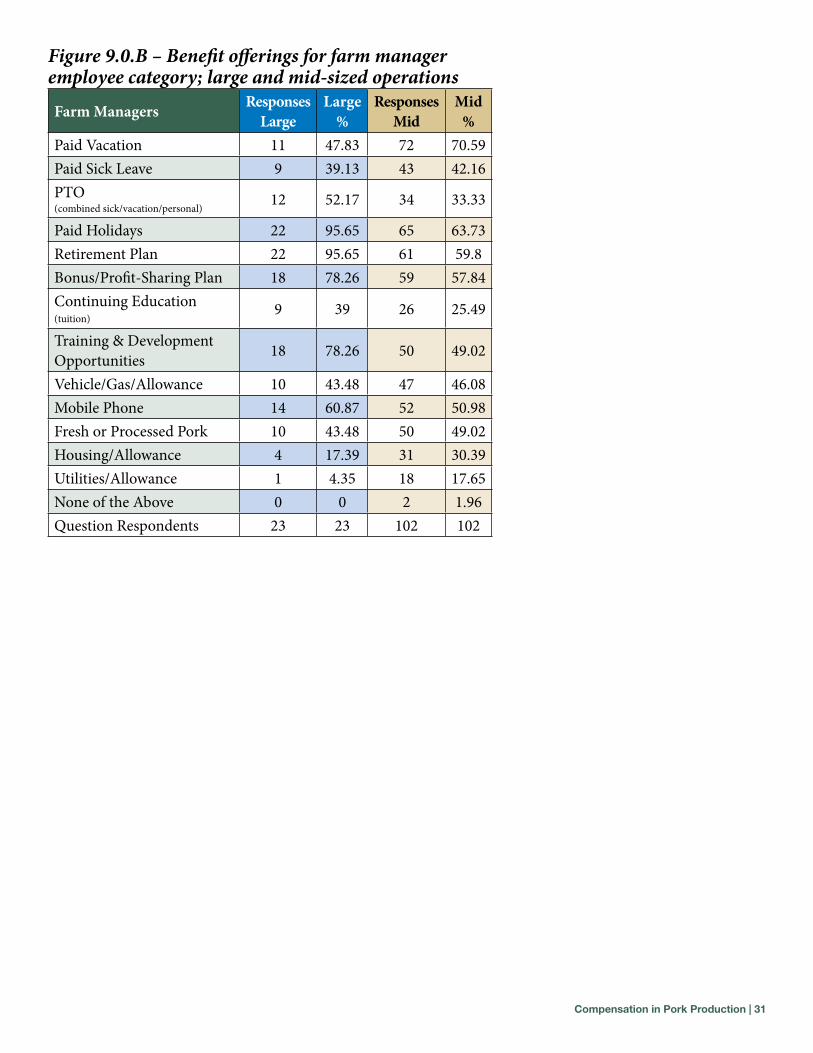
Figure 9.0.B – Benefit offerings for farm manager employee category; large and mid-sized operations
Farm Managers Responses Large
Large %
Responses Mid
Mid %
Paid Vacation 11 47.83 72 70.59Paid Sick Leave 9 39.13 43 42.16PTO (combined sick/vacation/personal)
12 52.17 34 33.33
Paid Holidays 22 95.65 65 63.73Retirement Plan 22 95.65 61 59.8Bonus/Profit-Sharing Plan 18 78.26 59 57.84Continuing Education (tuition)
9 39 26 25.49
Training & Development Opportunities 18 78.26 50 49.02
Vehicle/Gas/Allowance 10 43.48 47 46.08Mobile Phone 14 60.87 52 50.98Fresh or Processed Pork 10 43.48 50 49.02Housing/Allowance 4 17.39 31 30.39Utilities/Allowance 1 4.35 18 17.65None of the Above 0 0 2 1.96Question Respondents 23 23 102 102
Compensation in Pork Production | 32
Figure 9.0.C – Benefit offerings for mid-level management employee category; large and mid-sized operations
Mid-level Management Responses Large
Large %
Responses Mid
Mid %
Paid Vacation 7 41.18 49 70Paid Sick Leave 5 29.41 32 45.71PTO (combined sick/vacation/personal)
10 58.82 19 27.14
Paid Holidays 17 100 44 62.86Retirement Plan 16 94.12 42 60Bonus/Profit-Sharing Plan 14 82.35 40 57.14Continuing Education (tuition)
9 52.94 17 24.29
Training & Development Opportunities 13 76.47 33 47.14
Vehicle/Gas/Allowance 9 52.94 27 38.57Mobile Phone 13 76.47 29 41.43Fresh or Processed Pork 7 41.18 37 52.86Housing/Allowance 0 0 15 21.43Utilities/Allowance 0 0 9 12.86None of the Above 0 0 3 4.29Question Respondents 17 17 70 70
Compensation in Pork Production | 33
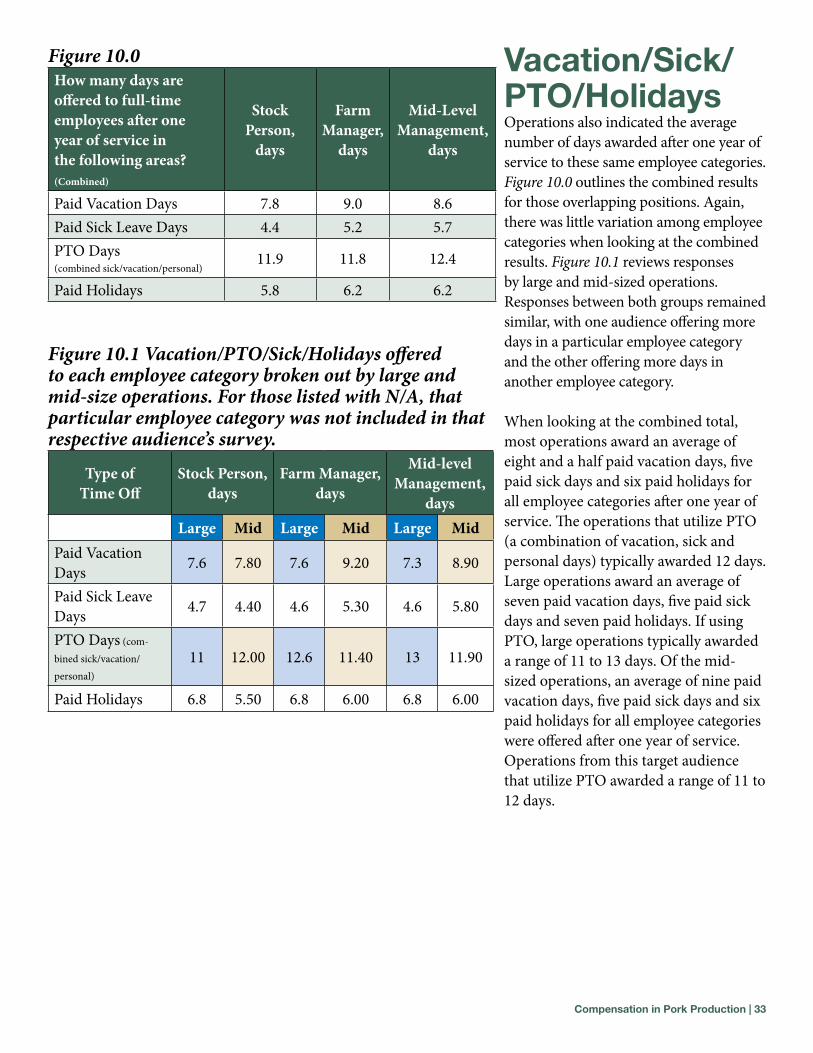
Vacation/sick/PTo/HolidaysOperations also indicated the average number of days awarded after one year of service to these same employee categories. Figure 10.0 outlines the combined results for those overlapping positions. Again, there was little variation among employee categories when looking at the combined results. Figure 10.1 reviews responses by large and mid-sized operations. Responses between both groups remained similar, with one audience offering more days in a particular employee category and the other offering more days in another employee category.
When looking at the combined total, most operations award an average of eight and a half paid vacation days, five paid sick days and six paid holidays for all employee categories after one year of service. The operations that utilize PTO (a combination of vacation, sick and personal days) typically awarded 12 days. Large operations award an average of seven paid vacation days, five paid sick days and seven paid holidays. If using PTO, large operations typically awarded a range of 11 to 13 days. Of the mid-sized operations, an average of nine paid vacation days, five paid sick days and six paid holidays for all employee categories were offered after one year of service. Operations from this target audience that utilize PTO awarded a range of 11 to 12 days.
Figure 10.0How many days are offered to full-time employees after one year of service in the following areas? (Combined)
Stock Person,
days
Farm Manager,
days
Mid-Level Management,
days
Paid Vacation Days 7.8 9.0 8.6Paid Sick Leave Days 4.4 5.2 5.7PTO Days (combined sick/vacation/personal)
11.9 11.8 12.4
Paid Holidays 5.8 6.2 6.2
Figure 10.1 Vacation/PTO/Sick/Holidays offered to each employee category broken out by large and mid-size operations. For those listed with N/A, that particular employee category was not included in that respective audience’s survey.
Type of Time Off
Stock Person, days
Farm Manager, days
Mid-level Management,
daysLarge Mid Large Mid Large Mid
Paid Vacation Days 7.6 7.80 7.6 9.20 7.3 8.90
Paid Sick Leave Days 4.7 4.40 4.6 5.30 4.6 5.80
PTO Days (com-bined sick/vacation/personal)
11 12.00 12.6 11.40 13 11.90
Paid Holidays 6.8 5.50 6.8 6.00 6.8 6.00
Compensation in Pork Production | 34
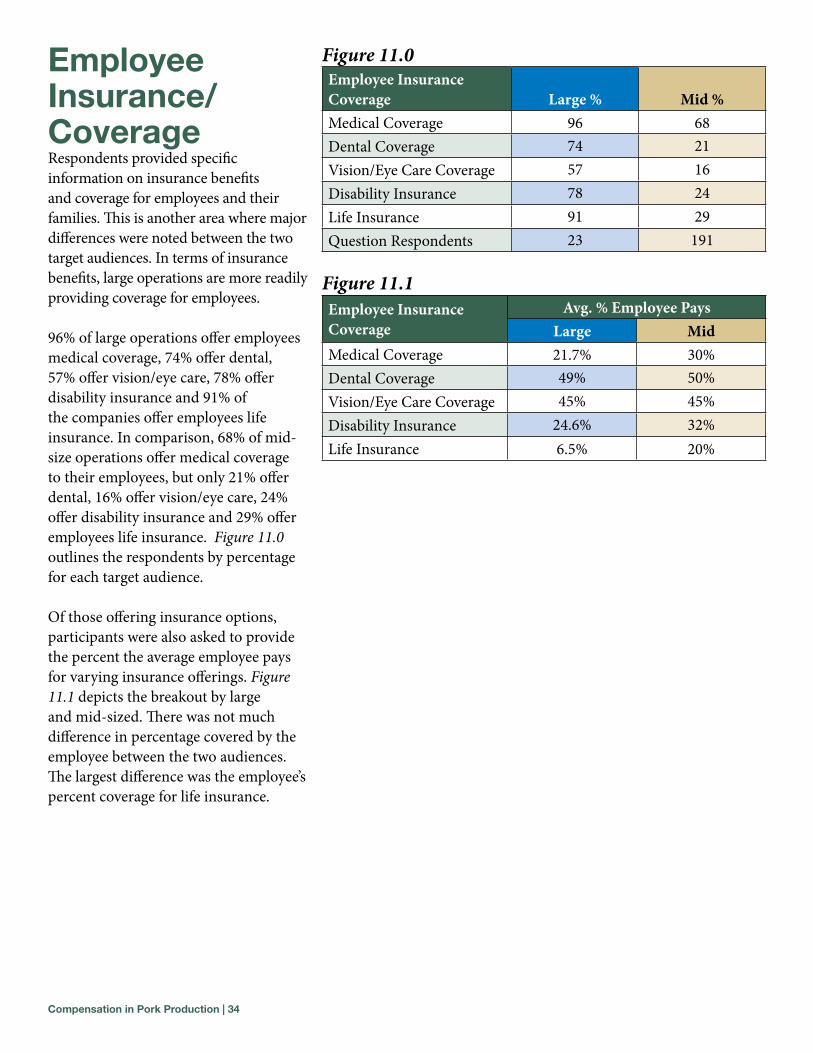
Employee Insurance/ CoverageRespondents provided specific information on insurance benefits and coverage for employees and their families. This is another area where major differences were noted between the two target audiences. In terms of insurance benefits, large operations are more readily providing coverage for employees.
96% of large operations offer employees medical coverage, 74% offer dental, 57% offer vision/eye care, 78% offer disability insurance and 91% of the companies offer employees life insurance. In comparison, 68% of mid-size operations offer medical coverage to their employees, but only 21% offer dental, 16% offer vision/eye care, 24% offer disability insurance and 29% offer employees life insurance. Figure 11.0 outlines the respondents by percentage for each target audience.
Of those offering insurance options, participants were also asked to provide the percent the average employee pays for varying insurance offerings. Figure 11.1 depicts the breakout by large and mid-sized. There was not much difference in percentage covered by the employee between the two audiences. The largest difference was the employee’s percent coverage for life insurance.
Figure 11.0Employee Insurance Coverage Large % Mid %Medical Coverage 96 68Dental Coverage 74 21Vision/Eye Care Coverage 57 16Disability Insurance 78 24Life Insurance 91 29Question Respondents 23 191
Figure 11.1Employee Insurance Coverage
Avg. % Employee PaysLarge Mid
Medical Coverage 21.7% 30%Dental Coverage 49% 50%Vision/Eye Care Coverage 45% 45%Disability Insurance 24.6% 32%Life Insurance 6.5% 20%
Compensation in Pork Production | 35
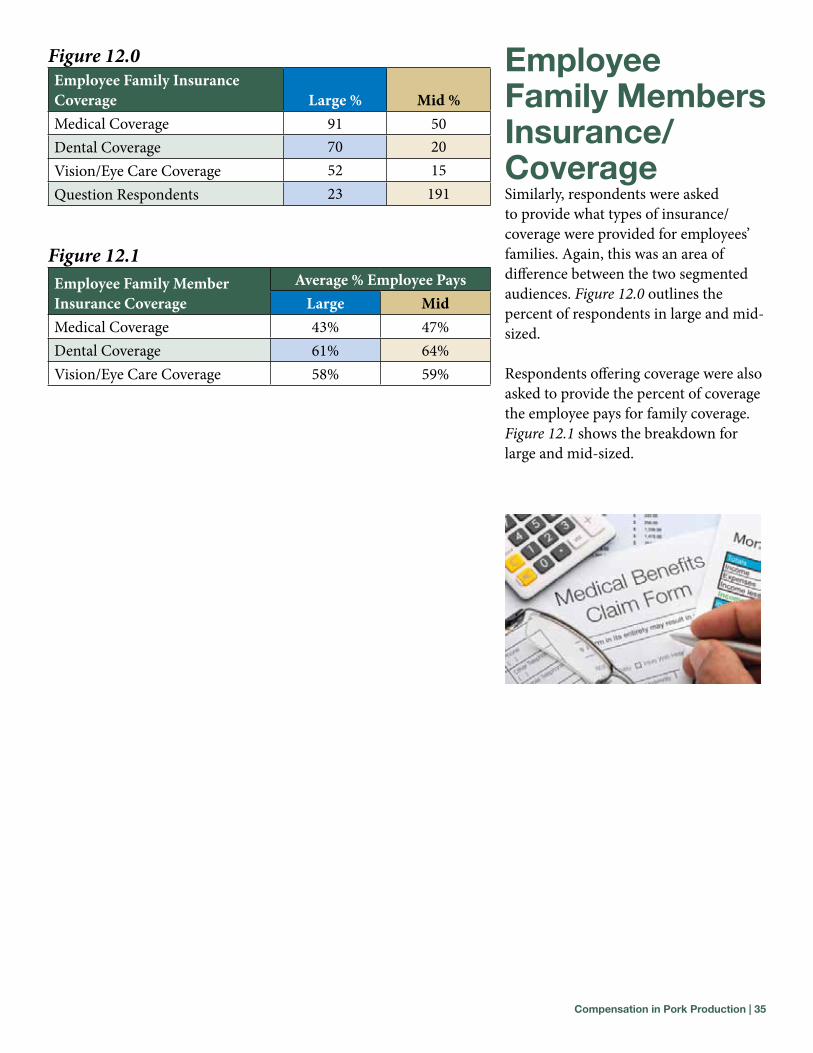
Employee Family members Insurance/CoverageSimilarly, respondents were asked to provide what types of insurance/coverage were provided for employees’ families. Again, this was an area of difference between the two segmented audiences. Figure 12.0 outlines the percent of respondents in large and mid-sized.
Respondents offering coverage were also asked to provide the percent of coverage the employee pays for family coverage. Figure 12.1 shows the breakdown for large and mid-sized.
Figure 12.0Employee Family Insurance Coverage Large % Mid %Medical Coverage 91 50Dental Coverage 70 20Vision/Eye Care Coverage 52 15Question Respondents 23 191
Figure 12.1Employee Family Member Insurance Coverage
Average % Employee PaysLarge Mid
Medical Coverage 43% 47%Dental Coverage 61% 64%Vision/Eye Care Coverage 58% 59%
Compensation in Pork Production | 36
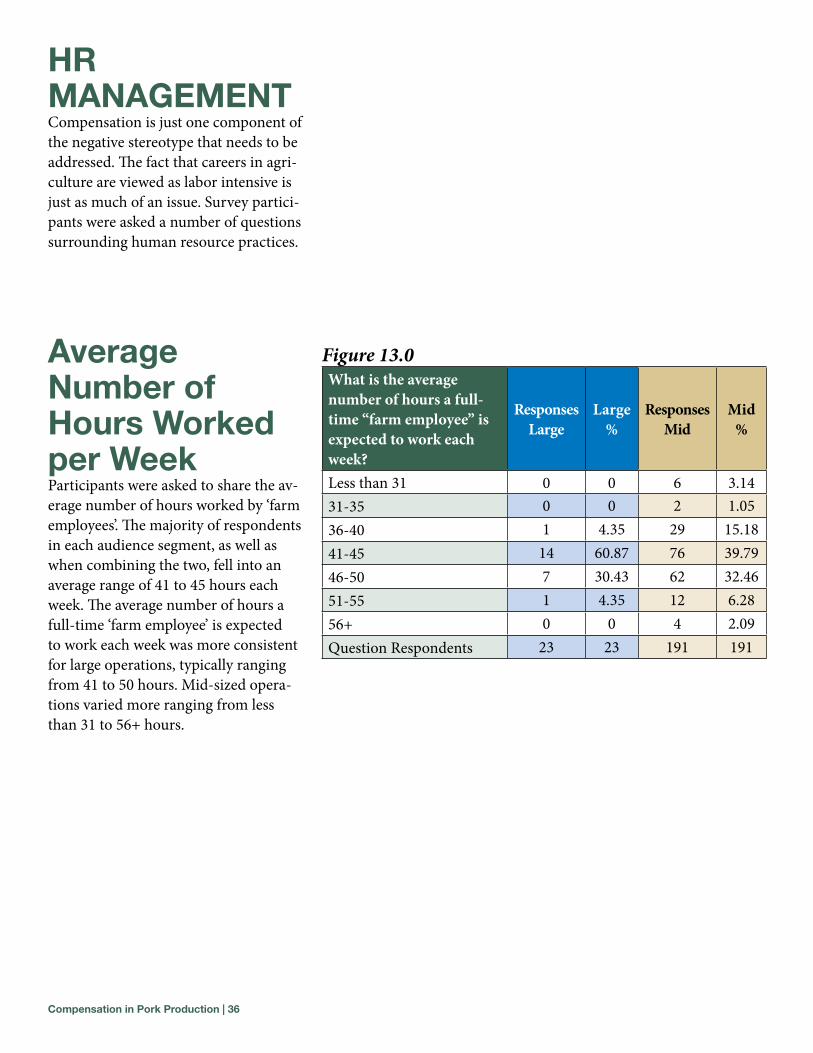
Figure 13.0What is the average number of hours a full-time “farm employee” is expected to work each week?
Responses Large
Large %
Responses Mid
Mid %
Less than 31 0 0 6 3.1431-35 0 0 2 1.0536-40 1 4.35 29 15.1841-45 14 60.87 76 39.7946-50 7 30.43 62 32.4651-55 1 4.35 12 6.2856+ 0 0 4 2.09Question Respondents 23 23 191 191
HR managEmEnTCompensation is just one component of the negative stereotype that needs to be addressed. The fact that careers in agri-culture are viewed as labor intensive is just as much of an issue. Survey partici-pants were asked a number of questions surrounding human resource practices.
average number of Hours Worked per WeekParticipants were asked to share the av-erage number of hours worked by ‘farm employees’. The majority of respondents in each audience segment, as well as when combining the two, fell into an average range of 41 to 45 hours each week. The average number of hours a full-time ‘farm employee’ is expected to work each week was more consistent for large operations, typically ranging from 41 to 50 hours. Mid-sized opera-tions varied more ranging from less than 31 to 56+ hours.
Compensation in Pork Production | 37
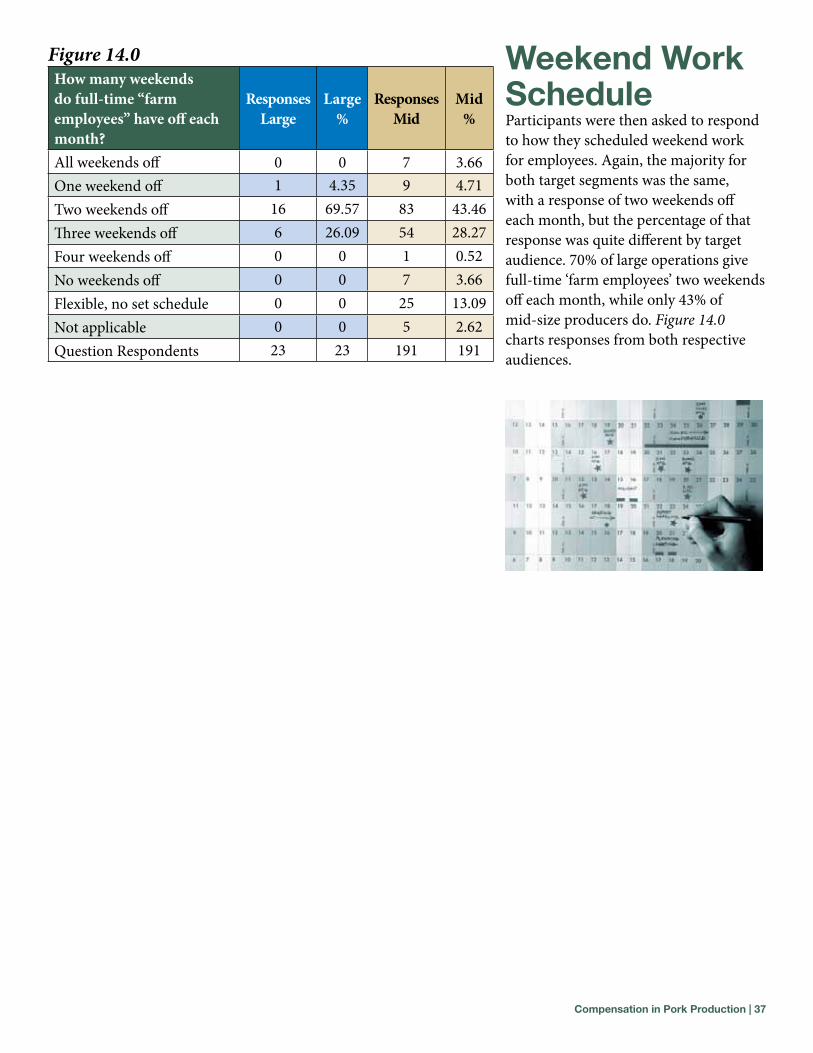
Figure 14.0How many weekends do full-time “farm employees” have off each month?
Responses Large
Large %
Responses Mid
Mid %
All weekends off 0 0 7 3.66One weekend off 1 4.35 9 4.71Two weekends off 16 69.57 83 43.46Three weekends off 6 26.09 54 28.27Four weekends off 0 0 1 0.52No weekends off 0 0 7 3.66Flexible, no set schedule 0 0 25 13.09Not applicable 0 0 5 2.62Question Respondents 23 23 191 191
Weekend Work scheduleParticipants were then asked to respond to how they scheduled weekend work for employees. Again, the majority for both target segments was the same, with a response of two weekends off each month, but the percentage of that response was quite different by target audience. 70% of large operations give full-time ‘farm employees’ two weekends off each month, while only 43% of mid-size producers do. Figure 14.0 charts responses from both respective audiences.
Compensation in Pork Production | 38
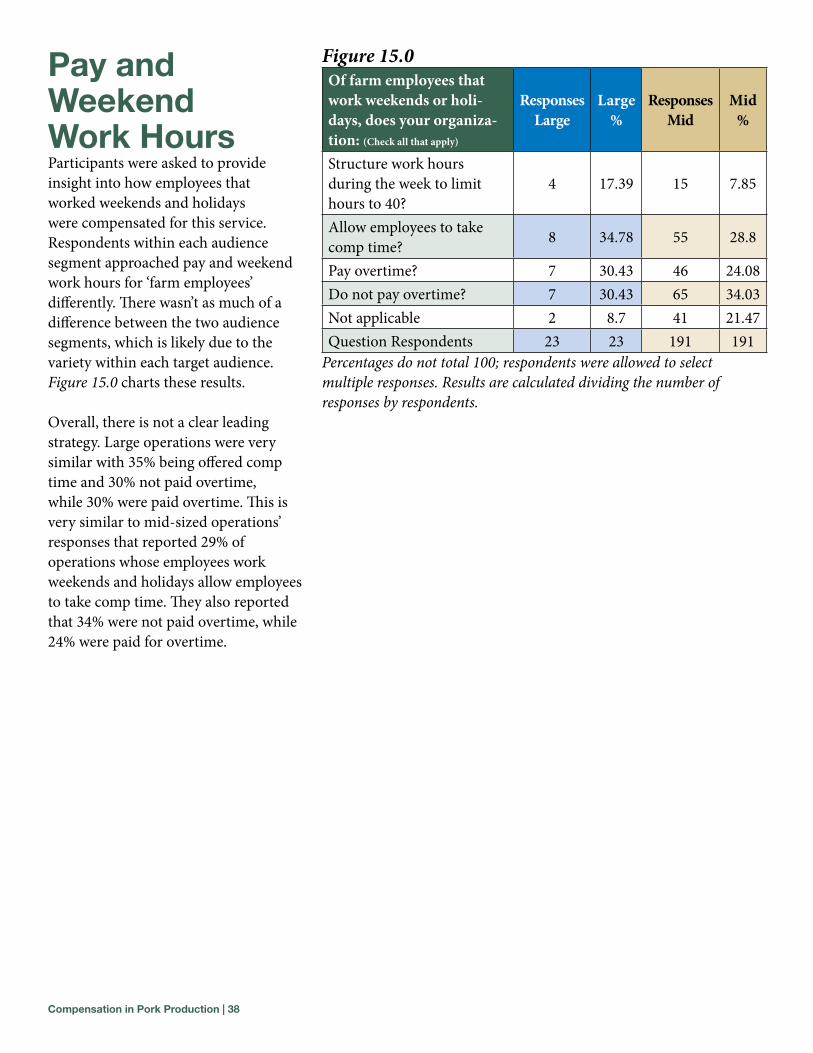
Pay and Weekend Work HoursParticipants were asked to provide insight into how employees that worked weekends and holidays were compensated for this service. Respondents within each audience segment approached pay and weekend work hours for ‘farm employees’ differently. There wasn’t as much of a difference between the two audience segments, which is likely due to the variety within each target audience. Figure 15.0 charts these results.
Overall, there is not a clear leading strategy. Large operations were very similar with 35% being offered comp time and 30% not paid overtime, while 30% were paid overtime. This is very similar to mid-sized operations’ responses that reported 29% of operations whose employees work weekends and holidays allow employees to take comp time. They also reported that 34% were not paid overtime, while 24% were paid for overtime.
Figure 15.0Of farm employees that work weekends or holi-days, does your organiza-tion: (Check all that apply)
Responses Large
Large %
Responses Mid
Mid %
Structure work hours during the week to limit hours to 40?
4 17.39 15 7.85
Allow employees to take comp time? 8 34.78 55 28.8
Pay overtime? 7 30.43 46 24.08Do not pay overtime? 7 30.43 65 34.03Not applicable 2 8.7 41 21.47Question Respondents 23 23 191 191
Percentages do not total 100; respondents were allowed to select multiple responses. Results are calculated dividing the number of responses by respondents.
Compensation in Pork Production | 39
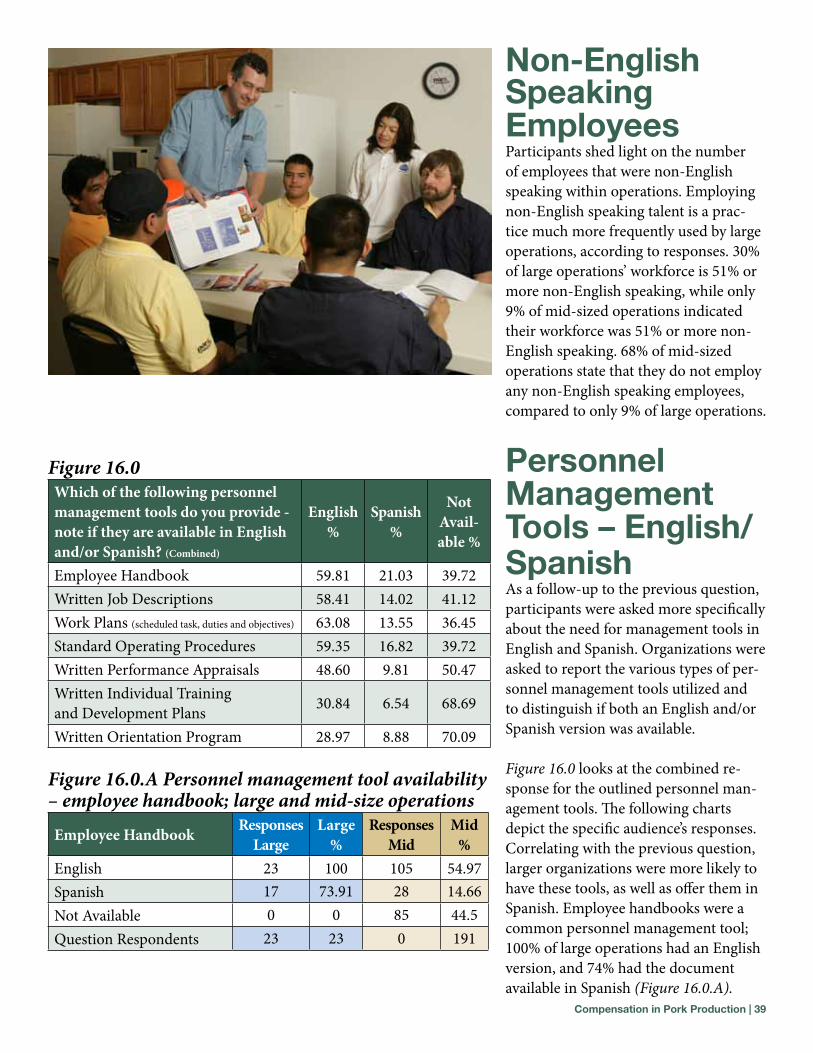
non-English speaking EmployeesParticipants shed light on the number of employees that were non-English speaking within operations. Employing non-English speaking talent is a prac-tice much more frequently used by large operations, according to responses. 30% of large operations’ workforce is 51% or more non-English speaking, while only 9% of mid-sized operations indicated their workforce was 51% or more non-English speaking. 68% of mid-sized operations state that they do not employ any non-English speaking employees, compared to only 9% of large operations.
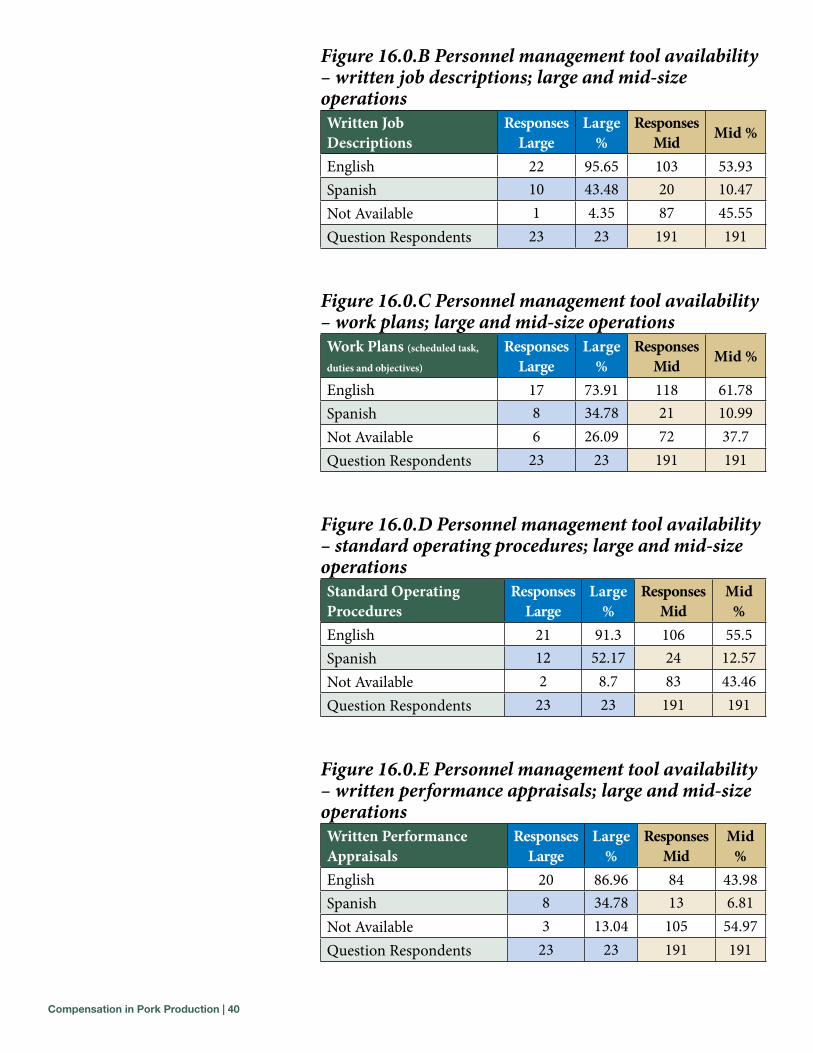
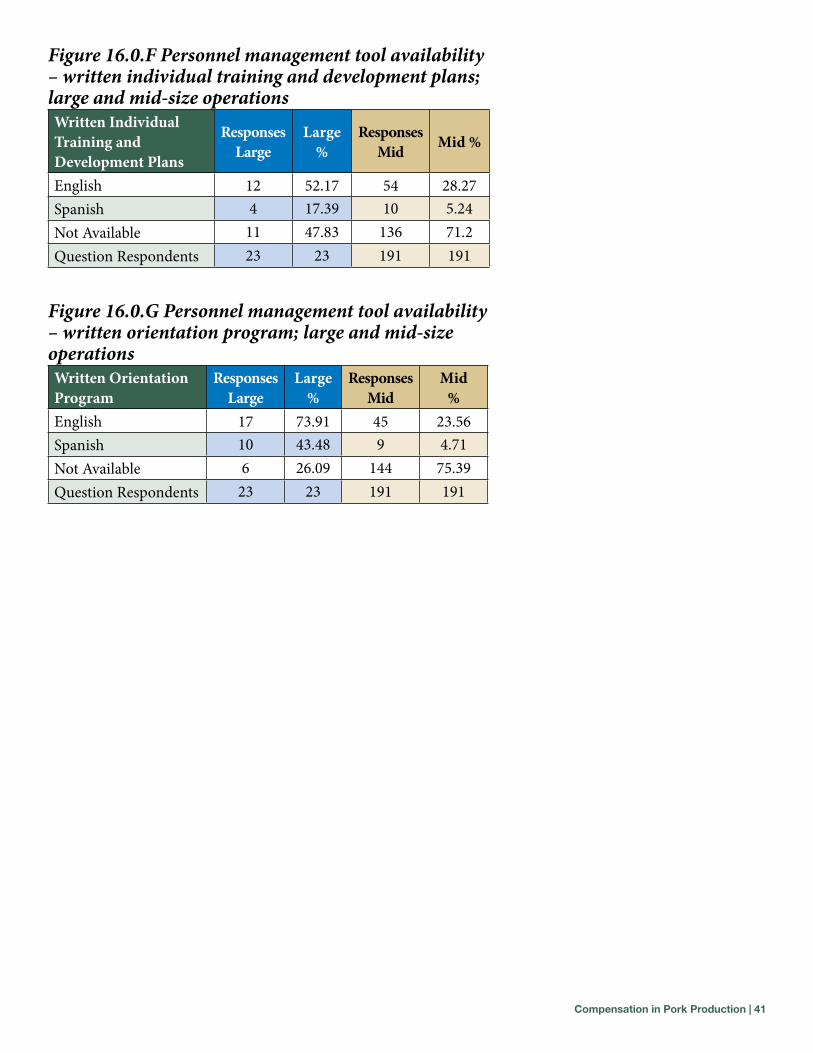
Personnel management Tools – English/spanishAs a follow-up to the previous question, participants were asked more specifically about the need for management tools in English and Spanish. Organizations were asked to report the various types of per-sonnel management tools utilized and to distinguish if both an English and/or Spanish version was available.
Figure 16.0 looks at the combined re-sponse for the outlined personnel man-agement tools. The following charts depict the specific audience’s responses. Correlating with the previous question, larger organizations were more likely to have these tools, as well as offer them in Spanish. Employee handbooks were a common personnel management tool; 100% of large operations had an English version, and 74% had the document available in Spanish (Figure 16.0.A).
Figure 16.0 Which of the following personnel management tools do you provide - note if they are available in English and/or Spanish? (Combined)
English %
Spanish %
Not Avail-able %
Employee Handbook 59.81 21.03 39.72Written Job Descriptions 58.41 14.02 41.12Work Plans (scheduled task, duties and objectives) 63.08 13.55 36.45Standard Operating Procedures 59.35 16.82 39.72Written Performance Appraisals 48.60 9.81 50.47Written Individual Training and Development Plans 30.84 6.54 68.69
Written Orientation Program 28.97 8.88 70.09
Figure 16.0.A Personnel management tool availability – employee handbook; large and mid-size operations
Employee Handbook Responses Large
Large %
Responses Mid
Mid %
English 23 100 105 54.97Spanish 17 73.91 28 14.66Not Available 0 0 85 44.5Question Respondents 23 23 0 191
Compensation in Pork Production | 40
Figure 16.0.B Personnel management tool availability – written job descriptions; large and mid-size operationsWritten Job Descriptions
Responses Large
Large %
Responses Mid Mid %
English 22 95.65 103 53.93Spanish 10 43.48 20 10.47Not Available 1 4.35 87 45.55Question Respondents 23 23 191 191
Figure 16.0.C Personnel management tool availability – work plans; large and mid-size operationsWork Plans (scheduled task,
duties and objectives)
Responses Large
Large %
Responses Mid Mid %
English 17 73.91 118 61.78Spanish 8 34.78 21 10.99Not Available 6 26.09 72 37.7Question Respondents 23 23 191 191
Figure 16.0.D Personnel management tool availability – standard operating procedures; large and mid-size operationsStandard Operating Procedures
Responses Large
Large %
Responses Mid
Mid %
English 21 91.3 106 55.5Spanish 12 52.17 24 12.57Not Available 2 8.7 83 43.46Question Respondents 23 23 191 191
Figure 16.0.E Personnel management tool availability – written performance appraisals; large and mid-size operationsWritten Performance Appraisals
Responses Large
Large %
Responses Mid
Mid %
English 20 86.96 84 43.98Spanish 8 34.78 13 6.81Not Available 3 13.04 105 54.97Question Respondents 23 23 191 191
Compensation in Pork Production | 41
Figure 16.0.F Personnel management tool availability – written individual training and development plans; large and mid-size operationsWritten Individual Training and Development Plans
Responses Large
Large %
Responses Mid Mid %
English 12 52.17 54 28.27Spanish 4 17.39 10 5.24Not Available 11 47.83 136 71.2Question Respondents 23 23 191 191
Figure 16.0.G Personnel management tool availability – written orientation program; large and mid-size operationsWritten Orientation Program
Responses Large
Large %
Responses Mid
Mid %
English 17 73.91 45 23.56Spanish 10 43.48 9 4.71Not Available 6 26.09 144 75.39Question Respondents 23 23 191 191
Compensation in Pork Production | 42
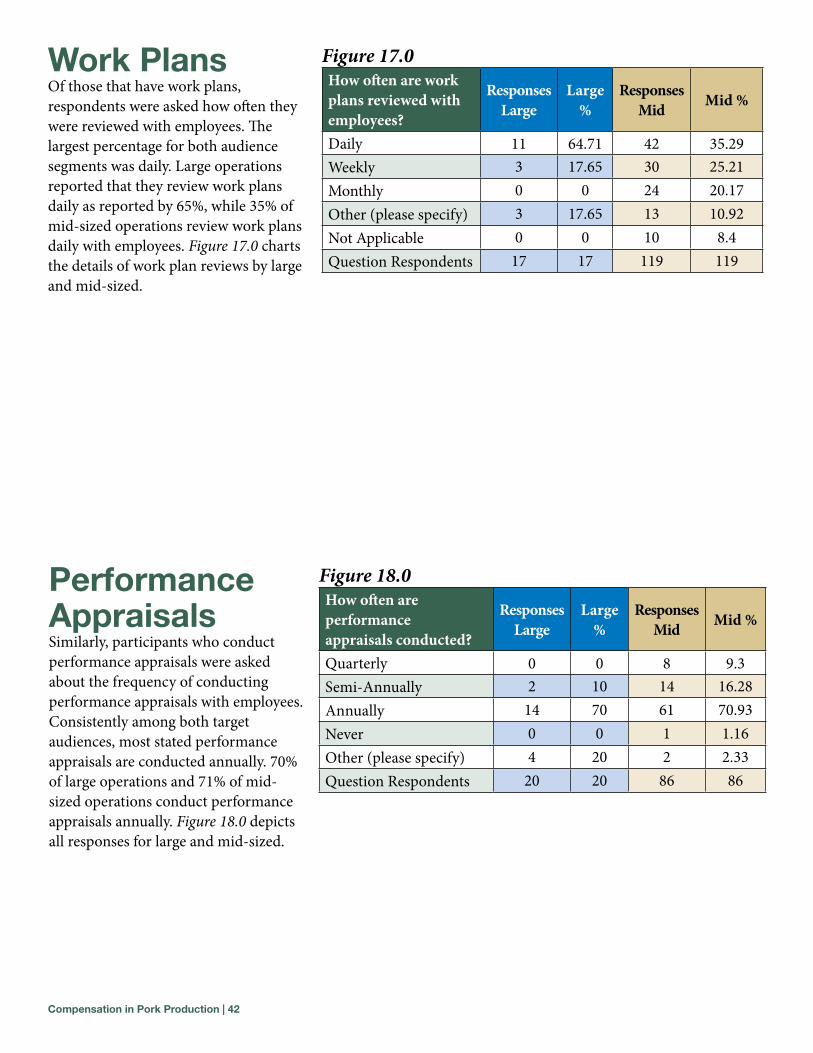
Figure 17.0How often are work plans reviewed with employees?
Responses Large
Large %
Responses Mid Mid %
Daily 11 64.71 42 35.29Weekly 3 17.65 30 25.21Monthly 0 0 24 20.17Other (please specify) 3 17.65 13 10.92Not Applicable 0 0 10 8.4Question Respondents 17 17 119 119
Work PlansOf those that have work plans, respondents were asked how often they were reviewed with employees. The largest percentage for both audience segments was daily. Large operations reported that they review work plans daily as reported by 65%, while 35% of mid-sized operations review work plans daily with employees. Figure 17.0 charts the details of work plan reviews by large and mid-sized.
Performance appraisalsSimilarly, participants who conduct performance appraisals were asked about the frequency of conducting performance appraisals with employees. Consistently among both target audiences, most stated performance appraisals are conducted annually. 70% of large operations and 71% of mid-sized operations conduct performance appraisals annually. Figure 18.0 depicts all responses for large and mid-sized.
Figure 18.0How often are performance appraisals conducted?
Responses Large
Large %
Responses Mid Mid %
Quarterly 0 0 8 9.3Semi-Annually 2 10 14 16.28Annually 14 70 61 70.93Never 0 0 1 1.16Other (please specify) 4 20 2 2.33Question Respondents 20 20 86 86
Compensation in Pork Production | 43
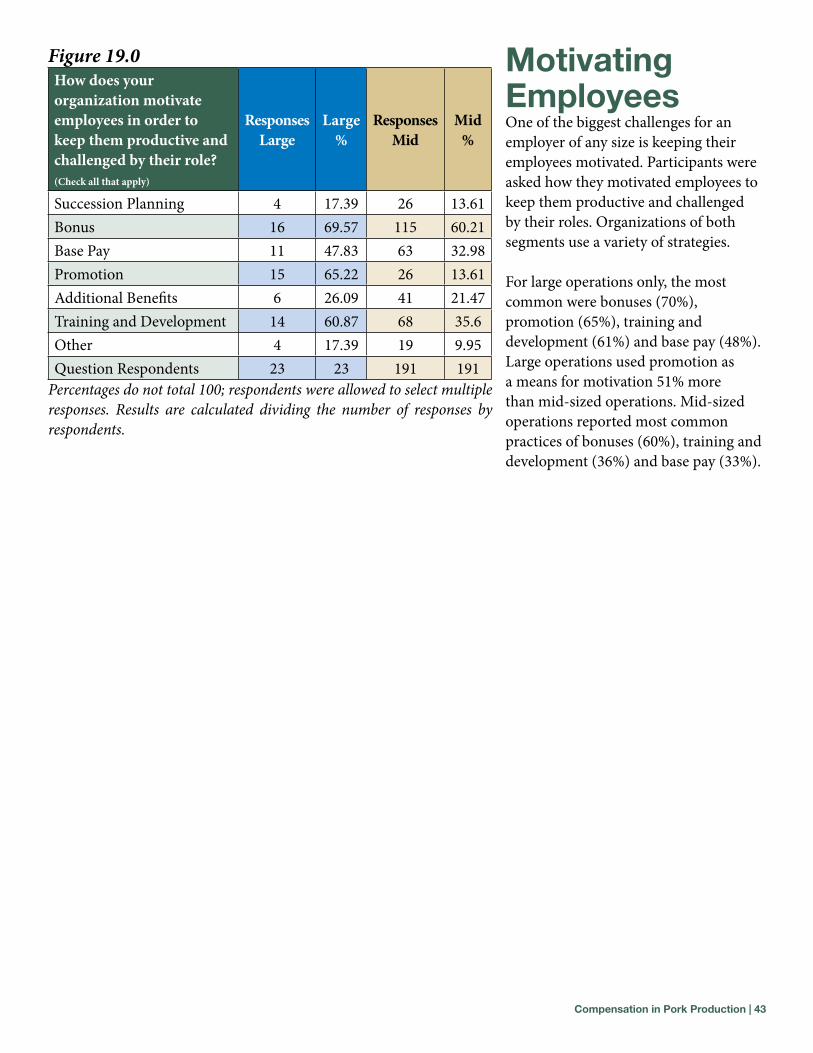
Figure 19.0How does your organization motivate employees in order to keep them productive and challenged by their role? (Check all that apply)
Responses Large
Large %
Responses Mid
Mid %
Succession Planning 4 17.39 26 13.61Bonus 16 69.57 115 60.21Base Pay 11 47.83 63 32.98Promotion 15 65.22 26 13.61Additional Benefits 6 26.09 41 21.47Training and Development 14 60.87 68 35.6Other 4 17.39 19 9.95Question Respondents 23 23 191 191
Percentages do not total 100; respondents were allowed to select multiple responses. Results are calculated dividing the number of responses by respondents.
motivating EmployeesOne of the biggest challenges for an employer of any size is keeping their employees motivated. Participants were asked how they motivated employees to keep them productive and challenged by their roles. Organizations of both segments use a variety of strategies.
For large operations only, the most common were bonuses (70%), promotion (65%), training and development (61%) and base pay (48%). Large operations used promotion as a means for motivation 51% more than mid-sized operations. Mid-sized operations reported most common practices of bonuses (60%), training and development (36%) and base pay (33%).
Compensation in Pork Production | 44
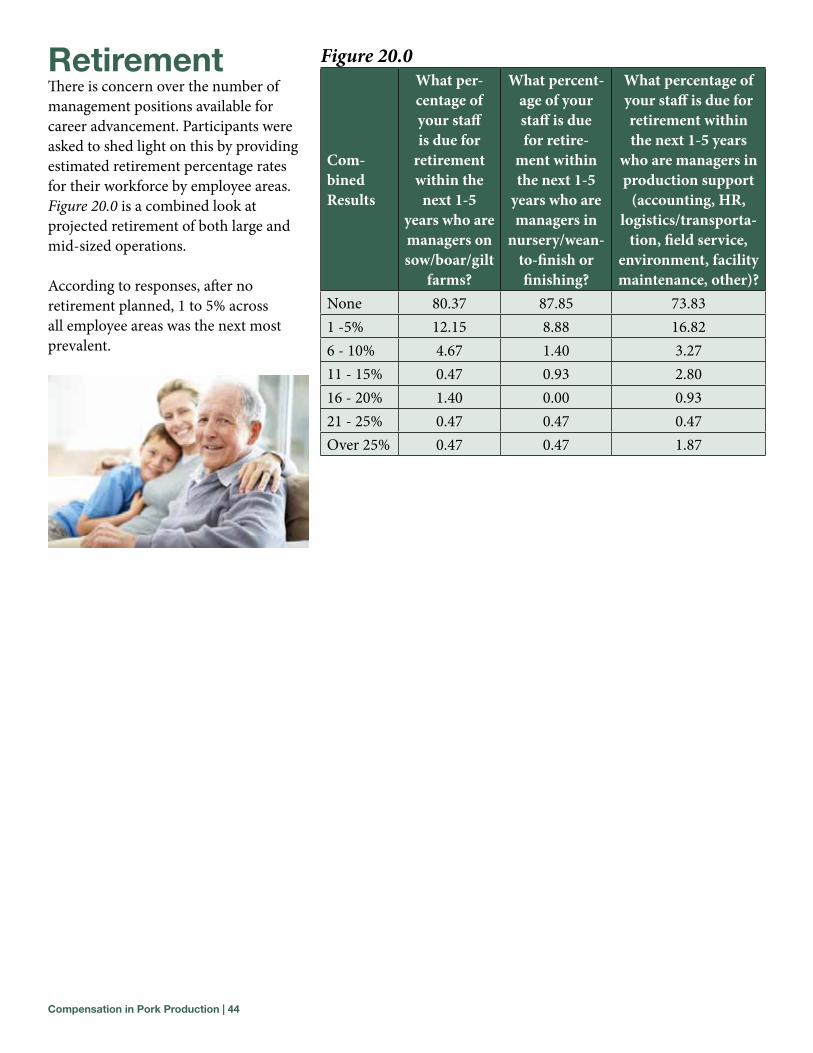
RetirementThere is concern over the number of management positions available for career advancement. Participants were asked to shed light on this by providing estimated retirement percentage rates for their workforce by employee areas. Figure 20.0 is a combined look at projected retirement of both large and mid-sized operations.
According to responses, after no retirement planned, 1 to 5% across all employee areas was the next most prevalent.
Figure 20.0
Com-bined Results
What per-centage of your staff is due for
retirement within the
next 1-5 years who are managers on sow/boar/gilt
farms?
What percent-age of your staff is due for retire-
ment within the next 1-5
years who are managers in
nursery/wean-to-finish or finishing?
What percentage of your staff is due for retirement within the next 1-5 years
who are managers in production support
(accounting, HR, logistics/transporta-
tion, field service, environment, facility maintenance, other)?
None 80.37 87.85 73.831 -5% 12.15 8.88 16.826 - 10% 4.67 1.40 3.2711 - 15% 0.47 0.93 2.8016 - 20% 1.40 0.00 0.9321 - 25% 0.47 0.47 0.47Over 25% 0.47 0.47 1.87
Compensation in Pork Production | 45
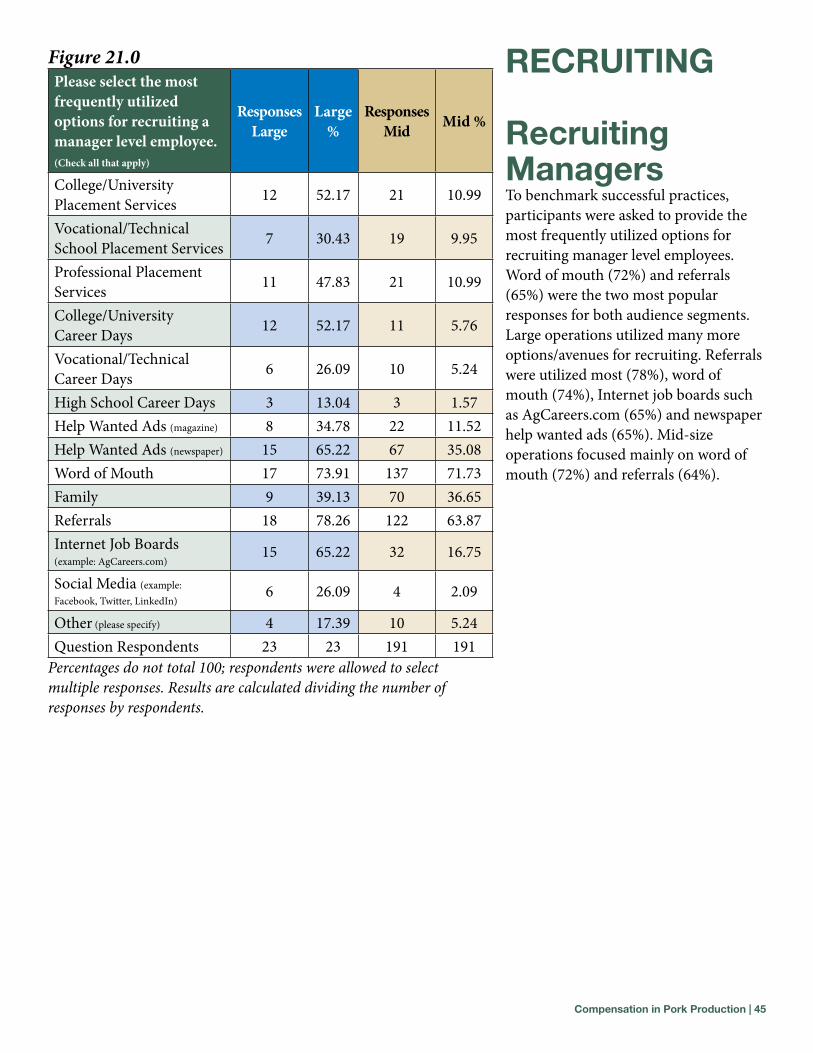
Figure 21.0Please select the most frequently utilized options for recruiting a manager level employee. (Check all that apply)
Responses Large
Large %
Responses Mid Mid %
College/University Placement Services 12 52.17 21 10.99
Vocational/Technical School Placement Services 7 30.43 19 9.95
Professional Placement Services 11 47.83 21 10.99
College/University Career Days 12 52.17 11 5.76
Vocational/Technical Career Days 6 26.09 10 5.24
High School Career Days 3 13.04 3 1.57Help Wanted Ads (magazine) 8 34.78 22 11.52Help Wanted Ads (newspaper) 15 65.22 67 35.08Word of Mouth 17 73.91 137 71.73Family 9 39.13 70 36.65Referrals 18 78.26 122 63.87Internet Job Boards (example: AgCareers.com)
15 65.22 32 16.75
Social Media (example: Facebook, Twitter, LinkedIn)
6 26.09 4 2.09
Other (please specify) 4 17.39 10 5.24Question Respondents 23 23 191 191
Percentages do not total 100; respondents were allowed to select multiple responses. Results are calculated dividing the number of responses by respondents.
RECRuITIng
Recruiting managersTo benchmark successful practices, participants were asked to provide the most frequently utilized options for recruiting manager level employees. Word of mouth (72%) and referrals (65%) were the two most popular responses for both audience segments. Large operations utilized many more options/avenues for recruiting. Referrals were utilized most (78%), word of mouth (74%), Internet job boards such as AgCareers.com (65%) and newspaper help wanted ads (65%). Mid-size operations focused mainly on word of mouth (72%) and referrals (64%).
Compensation in Pork Production | 46
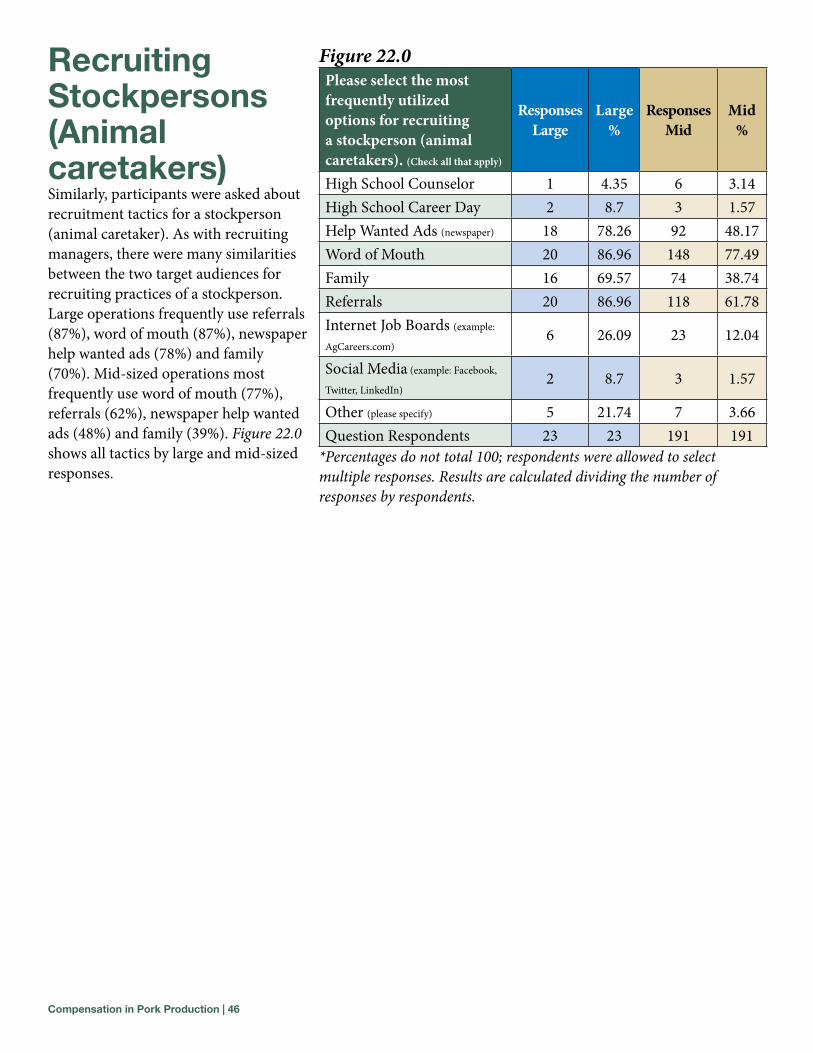
Recruiting stockpersons (animal caretakers)Similarly, participants were asked about recruitment tactics for a stockperson (animal caretaker). As with recruiting managers, there were many similarities between the two target audiences for recruiting practices of a stockperson. Large operations frequently use referrals (87%), word of mouth (87%), newspaper help wanted ads (78%) and family (70%). Mid-sized operations most frequently use word of mouth (77%), referrals (62%), newspaper help wanted ads (48%) and family (39%). Figure 22.0 shows all tactics by large and mid-sized responses.
Figure 22.0Please select the most frequently utilized options for recruiting a stockperson (animal caretakers). (Check all that apply)
Responses Large
Large %
Responses Mid
Mid %
High School Counselor 1 4.35 6 3.14High School Career Day 2 8.7 3 1.57Help Wanted Ads (newspaper) 18 78.26 92 48.17Word of Mouth 20 86.96 148 77.49Family 16 69.57 74 38.74Referrals 20 86.96 118 61.78Internet Job Boards (example:
AgCareers.com)6 26.09 23 12.04
Social Media (example: Facebook,
Twitter, LinkedIn)2 8.7 3 1.57
Other (please specify) 5 21.74 7 3.66Question Respondents 23 23 191 191
*Percentages do not total 100; respondents were allowed to select multiple responses. Results are calculated dividing the number of responses by respondents.
Compensation in Pork Production | 47
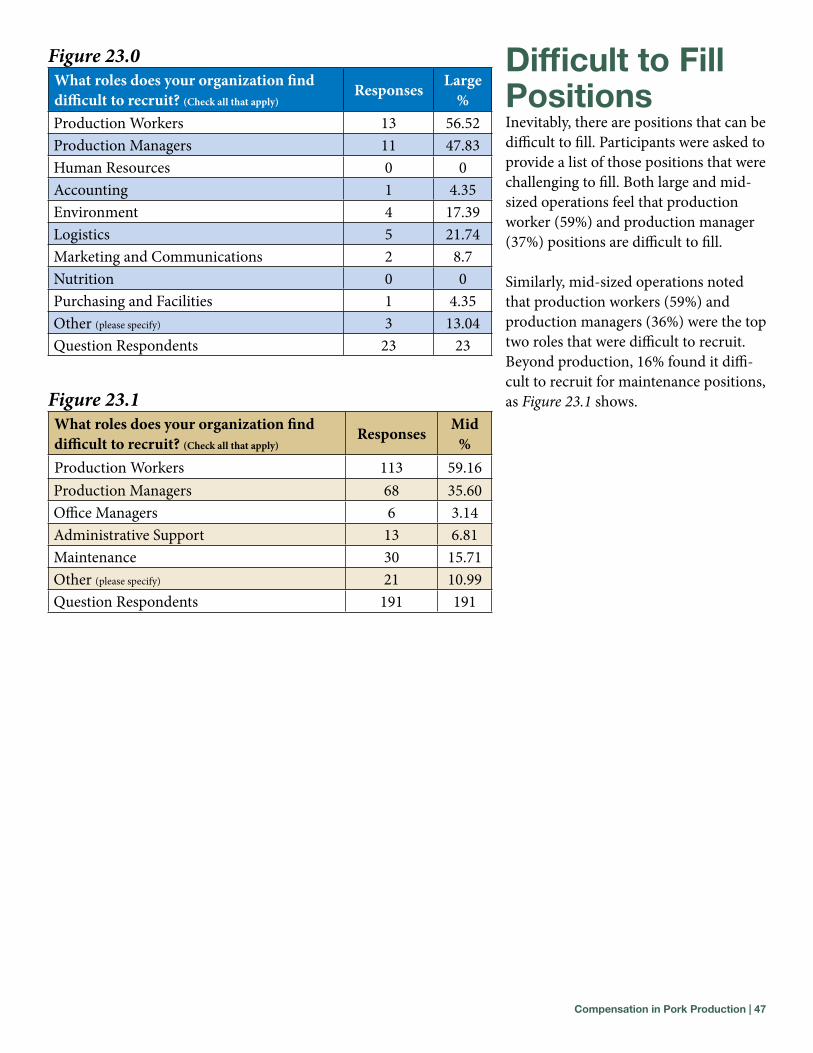
Figure 23.0What roles does your organization find difficult to recruit? (Check all that apply)
Responses Large %
Production Workers 13 56.52Production Managers 11 47.83Human Resources 0 0Accounting 1 4.35Environment 4 17.39Logistics 5 21.74Marketing and Communications 2 8.7Nutrition 0 0Purchasing and Facilities 1 4.35Other (please specify) 3 13.04Question Respondents 23 23
Figure 23.1What roles does your organization find difficult to recruit? (Check all that apply)
Responses Mid %
Production Workers 113 59.16Production Managers 68 35.60Office Managers 6 3.14Administrative Support 13 6.81Maintenance 30 15.71Other (please specify) 21 10.99Question Respondents 191 191
Difficult to Fill PositionsInevitably, there are positions that can be difficult to fill. Participants were asked to provide a list of those positions that were challenging to fill. Both large and mid-sized operations feel that production worker (59%) and production manager (37%) positions are difficult to fill.
Similarly, mid-sized operations noted that production workers (59%) and production managers (36%) were the top two roles that were difficult to recruit. Beyond production, 16% found it diffi-cult to recruit for maintenance positions, as Figure 23.1 shows.
Compensation in Pork Production | 48
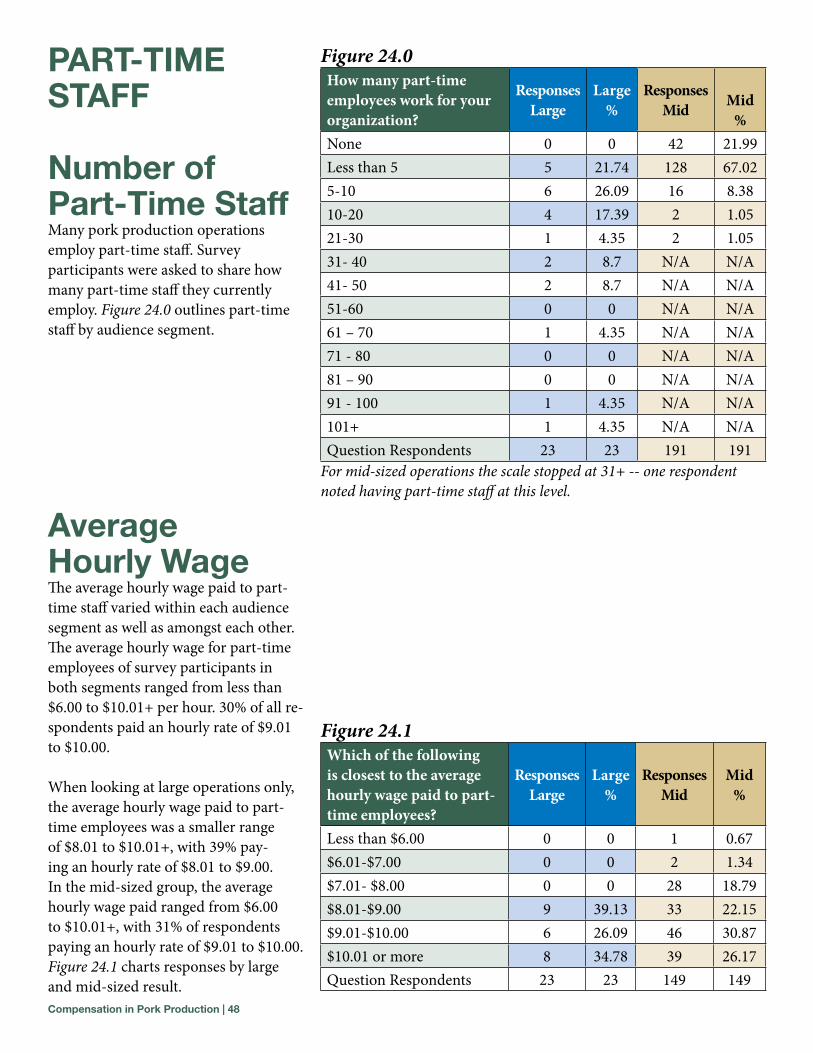
PaRT-TImE sTaFF
number of Part-Time staffMany pork production operations employ part-time staff. Survey participants were asked to share how many part-time staff they currently employ. Figure 24.0 outlines part-time staff by audience segment.
Figure 24.0How many part-time employees work for your organization?
Responses Large
Large %
Responses Mid Mid
%None 0 0 42 21.99Less than 5 5 21.74 128 67.025-10 6 26.09 16 8.3810-20 4 17.39 2 1.0521-30 1 4.35 2 1.0531- 40 2 8.7 N/A N/A41- 50 2 8.7 N/A N/A51-60 0 0 N/A N/A61 – 70 1 4.35 N/A N/A71 - 80 0 0 N/A N/A81 – 90 0 0 N/A N/A91 - 100 1 4.35 N/A N/A101+ 1 4.35 N/A N/AQuestion Respondents 23 23 191 191
For mid-sized operations the scale stopped at 31+ -- one respondent noted having part-time staff at this level.
Figure 24.1Which of the following is closest to the average hourly wage paid to part-time employees?
Responses Large
Large %
Responses Mid
Mid %
Less than $6.00 0 0 1 0.67$6.01-$7.00 0 0 2 1.34$7.01- $8.00 0 0 28 18.79$8.01-$9.00 9 39.13 33 22.15$9.01-$10.00 6 26.09 46 30.87$10.01 or more 8 34.78 39 26.17Question Respondents 23 23 149 149
average Hourly WageThe average hourly wage paid to part-time staff varied within each audience segment as well as amongst each other. The average hourly wage for part-time employees of survey participants in both segments ranged from less than $6.00 to $10.01+ per hour. 30% of all re-spondents paid an hourly rate of $9.01 to $10.00.
When looking at large operations only, the average hourly wage paid to part-time employees was a smaller range of $8.01 to $10.01+, with 39% pay-ing an hourly rate of $8.01 to $9.00. In the mid-sized group, the average hourly wage paid ranged from $6.00 to $10.01+, with 31% of respondents paying an hourly rate of $9.01 to $10.00. Figure 24.1 charts responses by large and mid-sized result.
Compensation in Pork Production | 49
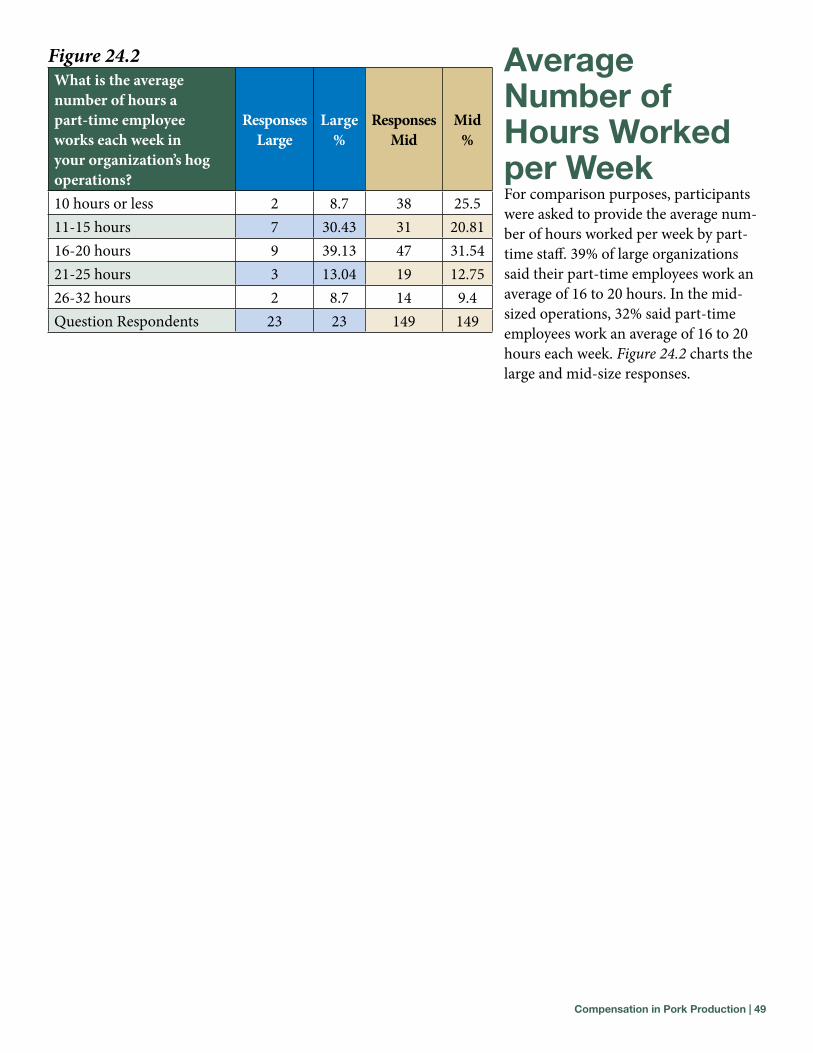
average number of Hours Worked per WeekFor comparison purposes, participants were asked to provide the average num-ber of hours worked per week by part-time staff. 39% of large organizations said their part-time employees work an average of 16 to 20 hours. In the mid-sized operations, 32% said part-time employees work an average of 16 to 20 hours each week. Figure 24.2 charts the large and mid-size responses.
Figure 24.2What is the average number of hours a part-time employee works each week in your organization’s hog operations?
Responses Large
Large %
Responses Mid
Mid %
10 hours or less 2 8.7 38 25.511-15 hours 7 30.43 31 20.8116-20 hours 9 39.13 47 31.5421-25 hours 3 13.04 19 12.7526-32 hours 2 8.7 14 9.4Question Respondents 23 23 149 149
Compensation in Pork Production | 50
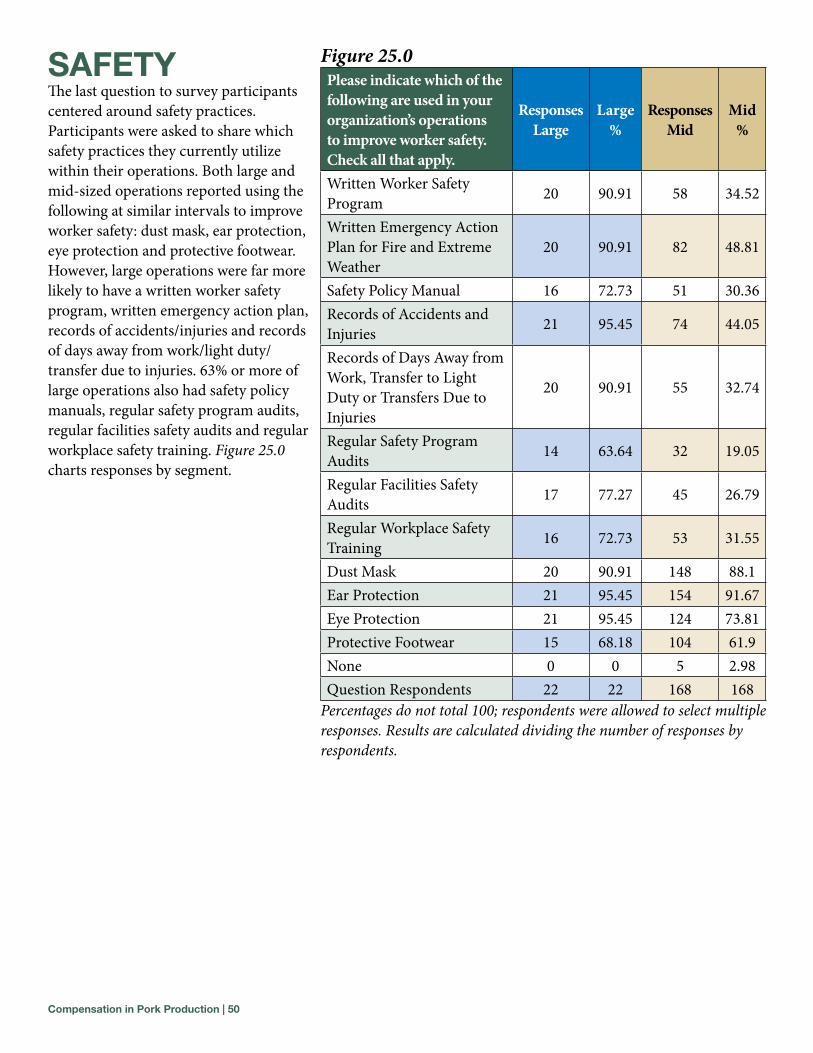
saFETyThe last question to survey participants centered around safety practices. Participants were asked to share which safety practices they currently utilize within their operations. Both large and mid-sized operations reported using the following at similar intervals to improve worker safety: dust mask, ear protection, eye protection and protective footwear. However, large operations were far more likely to have a written worker safety program, written emergency action plan, records of accidents/injuries and records of days away from work/light duty/transfer due to injuries. 63% or more of large operations also had safety policy manuals, regular safety program audits, regular facilities safety audits and regular workplace safety training. Figure 25.0 charts responses by segment.
Figure 25.0Please indicate which of the following are used in your organization’s operations to improve worker safety. Check all that apply.
Responses Large
Large %
Responses Mid
Mid %
Written Worker Safety Program 20 90.91 58 34.52
Written Emergency Action Plan for Fire and Extreme Weather
20 90.91 82 48.81
Safety Policy Manual 16 72.73 51 30.36Records of Accidents and Injuries 21 95.45 74 44.05
Records of Days Away from Work, Transfer to Light Duty or Transfers Due to Injuries
20 90.91 55 32.74
Regular Safety Program Audits 14 63.64 32 19.05
Regular Facilities Safety Audits 17 77.27 45 26.79
Regular Workplace Safety Training 16 72.73 53 31.55
Dust Mask 20 90.91 148 88.1Ear Protection 21 95.45 154 91.67Eye Protection 21 95.45 124 73.81Protective Footwear 15 68.18 104 61.9None 0 0 5 2.98Question Respondents 22 22 168 168
Percentages do not total 100; respondents were allowed to select multiple responses. Results are calculated dividing the number of responses by respondents.
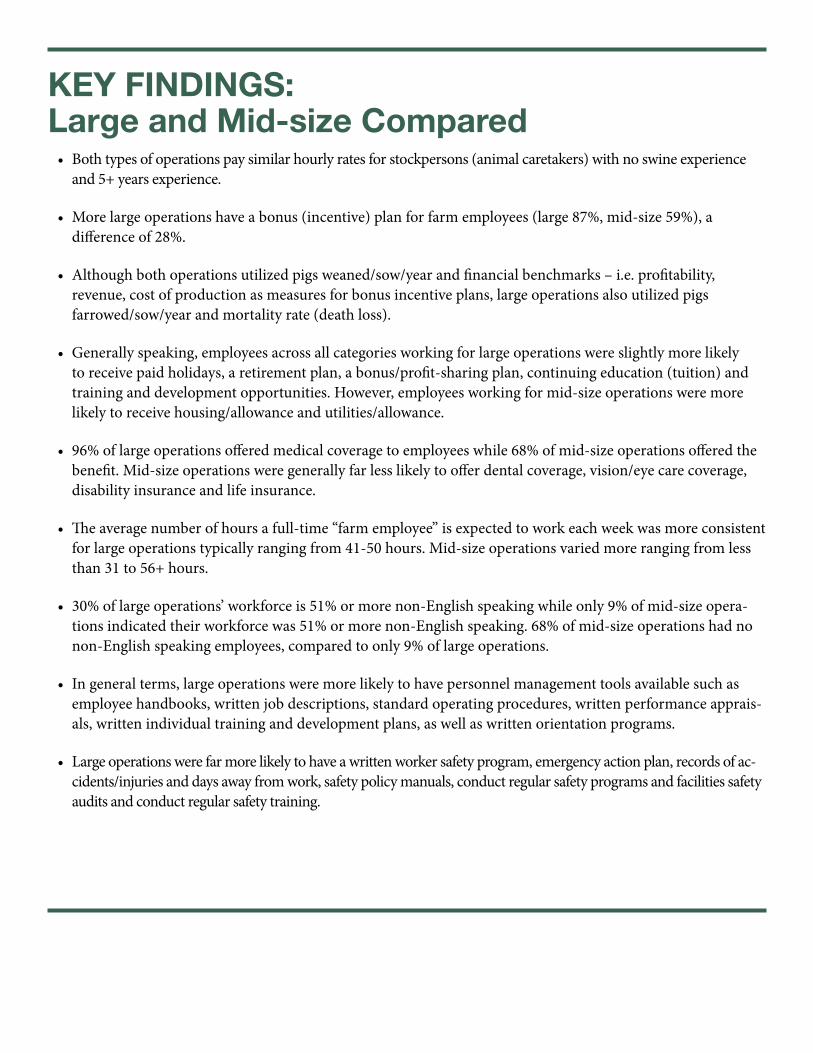
KEy FInDIngs: Large and mid-size Compared• Both types of operations pay similar hourly rates for stockpersons (animal caretakers) with no swine experience
and 5+ years experience.
• More large operations have a bonus (incentive) plan for farm employees (large 87%, mid-size 59%), a difference of 28%.
• Although both operations utilized pigs weaned/sow/year and financial benchmarks – i.e. profitability, revenue, cost of production as measures for bonus incentive plans, large operations also utilized pigs farrowed/sow/year and mortality rate (death loss).
• Generally speaking, employees across all categories working for large operations were slightly more likely to receive paid holidays, a retirement plan, a bonus/profit-sharing plan, continuing education (tuition) and training and development opportunities. However, employees working for mid-size operations were more likely to receive housing/allowance and utilities/allowance.
• 96% of large operations offered medical coverage to employees while 68% of mid-size operations offered the benefit. Mid-size operations were generally far less likely to offer dental coverage, vision/eye care coverage, disability insurance and life insurance.
• The average number of hours a full-time “farm employee” is expected to work each week was more consistent for large operations typically ranging from 41-50 hours. Mid-size operations varied more ranging from less than 31 to 56+ hours.
• 30% of large operations’ workforce is 51% or more non-English speaking while only 9% of mid-size opera-tions indicated their workforce was 51% or more non-English speaking. 68% of mid-size operations had no non-English speaking employees, compared to only 9% of large operations.
• In general terms, large operations were more likely to have personnel management tools available such as employee handbooks, written job descriptions, standard operating procedures, written performance apprais-als, written individual training and development plans, as well as written orientation programs.
• Large operations were far more likely to have a written worker safety program, emergency action plan, records of ac-cidents/injuries and days away from work, safety policy manuals, conduct regular safety programs and facilities safety audits and conduct regular safety training.

For more information, please contact the National Pork Board at 515.223.2600.
Contributing Partners: AgCareers.com is the leading online job board and human resource service provider for the agriculture, food, biotechnology and natural resources industry. Dedicated to bring together employers and job seekers through a targeted, online job board remains AgCareers.com’s mission. However, beyond the job board, AgCareers.com offers industry clients additional human resource products and services, such as an agribusiness salary survey, the Compensation Benchmark Review™. We’d like to also thank Alltech, for their support towards incentives for participants of this survey.
#03635-08/12