Embed Size (px)
Citation preview
EMPLOYEE MOTIVATION AND JOB SATISFACTION AMONG NUTRITIONISTS AT
KENYATTA NATIONAL HOSPITAL
BY
AGNES NAMALWA SITATI
UNITED STATES INTERNATIONAL UNIVERSITY
SPRING 2013
ii
EMPLOYEE MOTIVATION AND JOB SATISFACTION AMONG NUTRITIONISTS AT
KENYATTA NATIONAL HOSPITAL
BY
AGNES NAMALWA SITATI
A Project Submitted to the Chandaria School of Business in Partial Fulfilment of the
Requirement for the Degree of Global Executives Masters in Business Administration
(GEMBA)
UNITED STATES INTERNATIONAL UNIVERSITY
SPRING 2013
iii
STUDENT’S DECLARATION
I, the undersigned, declare that this is my original work and has not been submitted to any
other college, institution, or university other than the United States International University in
Nairobi for academic credit.
Signed: __________________________ Date: _____________________________
Agnes Namalwa Sitati (ID 636241)
This project has been presented for examination with my approval as the appointed
supervisor.
Signed: __________________________ Date: _____________________________
Dr Peter Kiriri
Signed: __________________________ Date: _____________________________
Dean, Chandaria School of Business

iv
COPYRIGHT
© Copyright by Agnes Namalwa Sitati 2013
All rights reserved. No part of this project report may be produced or transmitted in any form
or by any means, electronic, mechanical, including photocopying, recording or any
information storage without prior written permission from the author.
v
ABSTRACT
Employees acting towards company goals and having a strong desire to remain in the
organization are very important for the success of any organization. In order to generate such
organizational commitment of the employees, the knowledge about what motivates and
satisfies them is essential.
The objective of this study was to evaluate employee motivation and job satisfaction among
Nutritionists at KNH. The study also sought to determine the factors that contribute to work
motivation and satisfaction among Nutritonists at KNH, to determine the overall level of job
satisfaction among Nutritionists at KNH and to determine the impact of biographical
variables on job satisfaction among Nutritionists at KNH.
The research design employed was a descriptive research design taking the format of a
survey. The population of study consisted of all the 38 Nutritionists working at KNH but only
37 consented to participate. The sampling method used was a census where all Nutritionists
were eligible to participate in the study. The research instrument was self administered
questionnaires which were distributed to the study subjects. Descriptive statistics was used to
analyze the data and included frequencies, percentages and means. In addition parametric
tests were used for regression analysis to establish the relationship between the variables and
make inferences.
The study established that work content contributes most to job satisfaction, followed by
payment, recognition, personal, general, leader/supervisor, working conditions, promotion
and lastly, benefits. There was also a significant relationship between work motivation and
job satisfaction.
The study also established that 50% of the Nutritionists at KNH were moderately satisfied
while only 2.8% were dissatisfied with their job. Individuals that were aged between 21 to 25
years in age and 46 to 50 years were the most satisfied with regard to age. In addition, the
male individuals were more satisfied compared to females. Those with college certificates
were the most satisfied than those with higher levels of education. Individuals who had
worked for less than 10 years and more than 20 years at KNH were more satisfied.
Nutritionists who worked at the Prime Care Centre displayed higher levels of satisfaction
compared to those who worked in other areas.
vi
The study also demonstrated that there was a significant relationship between years worked at
KNH, level of education, gender, with job satisfaction.
In conclusion, the study established that Nutritionists at KNH were motivated by their work
and were moderately satisfied with their job.
The study recommends that the work situation should be looked into with greater detail with
a view to redesigning the work so as to provide employees with intrinsic motivators. The
intrinsic factors influence a person's willingness to expend considerable efforts toward the
goals of the organization and to remain in the organization (attitudinal commitment) while
the extrinsic factors, on the other hand, may contribute to the behavioral commitment.
This study also recommends that addressing factors like recognition, relationship with
supervisors/team leaders, promotion, working conditions, benefits, and payment of overtime
as observed in the findings will yield an even higher job satisfaction. This in turn will
increase retention and improve service delivery among employees.
The study additionally recommends that employers should critically analyze their employees
individual characteristics when designing motivational plans in order to attract and retain a
motivated and satisfied workforce.
There is need to replicate the study to include all employees at KNH so as to have a larger
sample for the results to be generalized.
There is need to establish the differences in work motivation and job satisfaction among the
different cadres of healthcare workers at KNH.
vii
ACKNOWLEDGEMENTS
I take this opportunity to thank God for the good health He has granted me and for enabling
me accomplish this task that marks a significant milestone in my career growth. I extend
special gratitude to my supervisor Dr Peter Kiriri, for the great partnership we made during
the development and finalization of this study. His guidance, encouragement and patience in
reading, correcting, re-reading and refining this work is commendable.
I would also like to thank KNH management for granting me permission to carry out this
study and most of all my fellow colleagues at KNH for their amazing cooperation, without
which this work would not have come to fruition.
Finally my special tributes go to my ever loving and supportive husband Francis and my
lovely daughter Mitchelle for her inquisitive mind that triggered impeccable insights into the
development of this work.

viii
DEDICATION
I dedicate this work to my family for the sacrifice they made for me to complete this project.
Their love, care, concern, support, encouragement and enthusiasm inspired me to achieve this
goal.
ix
TABLE OF CONTENTS
STUDENT DECLARATION ................................................................................................ iii
COPYRIGHT .......................................................................................................................... iv
ABSTRACT .............................................................................................................................. v
ACKNOWLEDGEMENTS .................................................................................................. vii
DEDICATION...................................................................................................................... viii
LIST OF TABLES ................................................................................................................. xii
LIST OF FIGURES .............................................................................................................. xiv
LIST OF ABBREVIATIONS ............................................................................................... xv
CHAPTER ONE ...................................................................................................................... 1
1.0 INTRODUCTION.............................................................................................................. 1
1.1 Background of the Problem ................................................................................................. 1
1.2 Statement of the Problem ..................................................................................................... 4
1.3 General Objective ................................................................................................................ 5
1.4 Specific Objectives .............................................................................................................. 5
1.5 Significance of the Study ..................................................................................................... 6
1.6 Scope of the Study ............................................................................................................... 6
1.7 Definition of Terms.............................................................................................................. 7
1.8 Chapter Summary ................................................................................................................ 7
CHAPTER TWO ..................................................................................................................... 8
2.0 LITERATURE REVIEW ................................................................................................. 8
2.1 Introduction .......................................................................................................................... 8
2.2 Factors Affecting Motivation ............................................................................................... 8
2.3 Determinants of Job Satisfaction ....................................................................................... 13
2.4 Individual Characteristics, Motivation, and Job Satisfaction ............................................ 19
2.5 Chapter Summary .............................................................................................................. 21
CHAPTER THREE ............................................................................................................... 22
x
3.0 RESEARCH METHODOLOGY ................................................................................... 22
3.1 Introduction ........................................................................................................................ 22
3.2 Research Design................................................................................................................. 22
3.3 Population and Sampling Design ....................................................................................... 22
3.4 Data Collection .................................................................................................................. 24
3.5 Research Procedures .......................................................................................................... 26
3.6 Data Analysis ..................................................................................................................... 26
3.7 Chapter Summary .............................................................................................................. 27
CHAPTER FOUR .................................................................................................................. 28
4.0 RESULTS AND FINDINGS ........................................................................................... 28
4.1 Intoduction ......................................................................................................................... 28
4.2 General Information ........................................................................................................... 29
4.3 Work Motivation and Satisfaction ..................................................................................... 35
4.4 Overall Level of Job Satisfaction among Nutritionists at KNH ........................................ 43
4.5 Biographical Variables and Job Satisfaction ..................................................................... 49
4.6 Summary of the Findings ................................................................................................... 54
CHAPTER FIVE ................................................................................................................... 55
5.0 DISCUSSION CONCLUSIONS AND RECOMMENDATIONS ............................... 55
5.1 Introduction ........................................................................................................................ 55
5.2 Summary ............................................................................................................................ 55
5.3 Discussion .......................................................................................................................... 57
5.4 Conclusion ......................................................................................................................... 63
5.5 Recommendations .............................................................................................................. 63
REFERENCES ....................................................................................................................... 65
Appendices .............................................................................................................................. 72
Appendix 1: Consent Form ...................................................................................................... 72
Appendix 2: Survey Questionnaire .......................................................................................... 73

xi
Appendix 3: A Summary of Motivation Theories ................................................................... 79
xii
LIST OF TABLES
Table 3. 1: Population Distribution .......................................................................................... 23
Table 4. 1: Response by Job Designation ................................................................................ 32
Table 4. 2: Response by Area of work ..................................................................................... 33
Table 4. 3: Work Content......................................................................................................... 36
Table 4. 4: Payment ................................................................................................................. 37
Table 4. 5: Promotion .............................................................................................................. 38
Table 4. 6: Recognition ............................................................................................................ 38
Table 4. 7: Working Conditions............................................................................................... 39
Table 4. 8: Benefits .................................................................................................................. 39
Table 4. 9: Personal.................................................................................................................. 40
Table 4. 10: Leader/Supervisor ................................................................................................ 40
Table 4. 11: General ................................................................................................................. 41
Table 4. 12: Regression Coefficients ....................................................................................... 42
Table 4. 13: Age and Job Satisfaction ..................................................................................... 44
Table 4. 14: Gender and Job Satisfaction ................................................................................ 45
Table 4. 15: Marital Status and Job Satisfaction ...................................................................... 45
Table 4. 16: Level of Education and Job Satisfaction ............................................................. 46
Table 4. 17: Job Group and Job Satisfaction ........................................................................... 46
Table 4. 18: Job Designation and Job Satisfaction .................................................................. 47
Table 4. 19: Area of Work and Job Satisfaction ...................................................................... 48
Table 4. 20: Years at KNH and Job Satisfaction ..................................................................... 49
Table 4. 21: Affiliation to Professional Organization and Job Satisfaction ............................ 49
Table 4. 22: Age and Job Satisfaction ..................................................................................... 50
Table 4. 23: Gender and Job Satisfaction ................................................................................ 51
Table 4. 24: Marital Status and Job Satisfaction ...................................................................... 51
xiii
Table 4. 25: Level of Education and Job Satisfaction ............................................................. 51
Table 4. 26: Job Group and Job Satisfaction ........................................................................... 52
Table 4. 27: Job Designation and Job Satisfaction .................................................................. 52
Table 4. 28: Area of Work and Job Satisfaction ...................................................................... 53
Table 4. 29: Years Worked at KNH and Job Satisfaction ....................................................... 53
Table 4. 30: Affiliations to Professional Groups ..................................................................... 54
xiv
LIST OF FIGURES
Figure 4. 1: Response rate ........................................................................................................ 28
Figure 4. 2: Response by Age .................................................................................................. 29
Figure 4. 3: Response by Gender ............................................................................................. 30
Figure 4. 4: Response by Marital Status .................................................................................. 30
Figure 4. 5: Response by Parentage ......................................................................................... 31
Figure 4. 6: Response by Level of Education .......................................................................... 31
Figure 4. 7: Response by Job Group ........................................................................................ 32
Figure 4. 8: Response by Years Worked at KNH .................................................................... 34
Figure 4. 9: Response by Affiliations to Professional Groups/Organizations ......................... 34
Figure 4. 10: Overall Job Satisfaction...................................................................................... 43

xv
LIST OF ABBREVIATIONS
HR Human Resource
KNH Kenyatta National Hospital
KNDI Kenya Nutritionists and Dieticians Institute
HRM Human Resource Management
ANOVA Analysis of Variance
1
CHAPTER ONE
1.0 INTRODUCTION
1.1 Background of the Problem
Employees are a valuable resource that may contribute in several different ways to a
company's activities, provided that the company gives them an appropriate chance (Morgan,
1997). In order to be successful, a company needs employees who act toward the goals of the
organization and have a strong desire to remain in the company (Molander, 1996). Such
loyalty and commitment may be generated by motivation. Furthermore, motivation is aimed
to achieve increased job satisfaction (Schultz and Schultz, 1998). Today, organizations are
transforming and entering into the new environment, those that can find, develop and retain
people who can fit into this dynamically changing situation will be most successful (Luthans,
2002).
Motivation is a complex phenomenon with many factors coming into play. Today virtually
all people, practitioners and scholars have their own definition of motivation. Usually one or
more of the following words are included in the definition; desires, wants, wishes, aims,
goals, needs, drives, motives and incentives (Luthans, 2002). Motivation has two main
elements being the decisions about which behaviour to engage in and decision about how
much effort one expends (Jackson, et al., 2009). A precise definition of motivation is elusive
since the concept involves numerous characteristics and perceptions of the employee and the
current situation. But it is characterised by a certain level of willingness on the part of the
employee to increase effort to the extent that this exertion also satisfies some need or desire.
At a basic level it can be seen that motivation is about ‘motives and ‘needs’ (Beardwell et al.,
2004).
According to Armstrong (2006), motivation is concerned with the factors that influence
people to behave in certain ways. Motivating people is about getting them to move in the
direction you want them to go in order to achieve a result. Most people, however, need to be
motivated to a greater or lesser degree. The knowledge about needs and expectations of
employees at work represents the basis for their motivation. Moreover, the structure of the
work and the employees' degree of satisfaction with the job are important in order to increase
the actual motivation and satisfaction with their work. Thereby, the differences regarding
what people want and actually perceive from their job are of significance. The strongest
2
motivator is, according to Wiley (1997), is something that people value, but lack. The
knowledge about those strong motivators is of great value and may serve as a starting point
for the re-design of work, in order to increase an employee's motivation and satisfaction.
Human motivation concepts are certainly important for understanding the dynamics of
workers' attitudes. Attitudes have to do with the willingness of workers to perform tasks,
duties and responsibilities, which require them to expend energy. The awareness of
employee motivational priorities alone could enhance a manager's ability to positively
influence members of the workforce (Tesone, 2005).
Porter and Lawler (1967) start with the premise that motivation (effort or force) does not
equal satisfaction. Satisfaction is an internal state (Mullins, 1999). Various authors define it
as the outcome of a motivational process (Bent et al., 1999). Job satisfaction is the positive
and negative feelings and attitudes which an individual holds about his/her work (Schultz and
Schultz, 1998). In other words, it is the extent to which an individual favours his/her job
(Molander, 1996). Positive attitudes toward the job are equivalent to job satisfaction, whereas
negative attitudes represent job dissatisfaction.
Job satisfaction is a complex phenomenon and depends on many work-related as well as
personal factors (Sell and Shipley, 1979; Bent et al., 1999). That means personal factors such
as age, gender, and job experience as well as the characteristics of the job, influence a
person's degree of job satisfaction (Porter and Lawler, 1967). Even though personal
characteristics are unchangeable by the company, they can be used for predictions of
satisfaction among groups of employees. The redesign of the work, as well as of the work
environment, may lead to increases in job satisfaction. Human nature can be very simple, yet
very complex too. n understanding and appreciation of this is a prerequisite to effective
employee motivation in the workplace and therefore effective management and leadership
(Schultz and Schultz, 1998).
Accordingly to Beardwell (2004) it is better to consider the common underlying assumptions
which suggest that motivation is an individual phenomenon and that people are unique and
this means that motivation theories usually allow for uniqueness to be reflected in behavior.
Age, gender, marital status, work area, position, years worked in the company education and
personality are considered as individual characteristics. The demographics and characteristics
of the work force are rapidly changing. There are a number of different characteristics
3
contributing to diversity. Currently, women are accounting for almost half of the work force
and the level of education is increasing among employees. However, while the face of the
workforce keeps changing, many employers’ attitudes and belief have remained obstinate.
When an organization continues to embrace negative implicit attitudes about such changes,
motivation at the workplace becomes an issue.
The knowledge about similarities and differences in the motivation of employees may make
it easier for the organization to motivate them and to generate organizational commitment.
Thereby, the consideration of individual characteristics such as age, gender, work area,
education, individual personalities and years a person has been working in the company may
provide useful information. General personal features, which can be easily used to distinguish
persons from each other, will be considered as individual characteristics in this study (Bassy,
2002).
Kenyatta National Hospital (KNH) is the largest teaching and referral hospital in East and
Central Africa and is placed at the apex of the healthcare services in Kenya (KNH Strategic
Plan 2008-2012). It covers an area of 45.7 hectares and within the KNH complex are College
of Health Sciences (University of Nairobi); the Kenya Medical Training College; Kenya
Medical Research Institute and National Laboratory Service (Ministry of Health). KNH has
50 wards, 22 out-patient clinics, 24 theatres (16 specialized) and Accident & Emergency
Department. KNH has a total bed capacity of 1800.
The mandate of the hospital is to provide specialized health care as a referral facility, provide
facilities for training of health professionals, research and to participate in national health
planning and policy development. It offers quality health care to patients not only from
Kenya but also from the great lakes countries, the horn of Africa, Central and Southern
Africa. The Hospital has set its vision to be a world class hospital in the provision of
innovative and specialized healthcare (KNH Strategic Plan 2008 -2012).
According to the KNH HR Manual (1989) it is the policy of the hospital to seek and employ
individuals who are qualified by job related standards of education, vocational training,
experience or who can be trained to perform work in a manner that will contribute to the
effective achievement of the hospital’s objectives.
Once qualified employees are appointed, every effort is made to use their capabilities to give
them opportunities to develop on the job and retain them as productive and satisfied workers.
4
In making selection for appointment, preference is given to qualified and suitable Kenyan
citizens.
Appointment in all case is made in accordance with the existing career progression guidelines
of the hospital for the various cadres of staff in their respective fields of employment.
Where a vacancy exists, it is filled by promotion or transfer of an employee or advertisement.
New appointments to permanent and pensionable positions are restricted to candidates below
the age of 50 years.
KNH recognizes the need for training and development of all its employees. It is therefore,
the policy of the hospital to offer training opportunities to its entire staff in order to improve
their work performance and personal development as well as assisting the hospital in its
manpower development programmes.
Nutrition services at KNH were instituted in the early 1970s. The Hospital employs nutrition
officers trained at recognized institutions of higher learning with qualifications in Foods,
Nutrition and Dietetics.
The Nutrition department is a unit of the hospital that is tasked with the provision of
specialized and innovative nutrition support and care, as provided under the Nutrition and
Dietetics Act [2008].
The department is headed by a Chief Nutrition Officer. In the year 2012 KNH underwent
some structural reorganization where by Nutrition department was merged with Pharmacy
department to form the Pharmaceutical and Nutritional Services Division headed by Senior
Assistant Director (SAD).
The department’s vision is to be a world class provider of innovative specialized nutrition
services while its mission is to provide accessible specialized quality preventive and curative
nutrition services; facilitate training; participate in research and national health planning and
policy (KNH Nutrition Dept Service Charter, 2012).
1.2 Statement of the Problem
Motivation is the key to performance improvement and therefore an essential key to
organizational success. In order to be successful, organizations need the commitment of
employees (Molander, 1996). To understand motivation, one must understand human nature
5
itself and there lies the problem. Essentially there always exists a gap between an
individual’s actual state and some desired state and therefore employers should always strive
to learn about the characteristics of their employees and work towards reducing this gap to
maintain a motivated and satisfied workforce. People differ; they distinguish themselves
from each other regarding their needs, backgrounds, expectations, and individual
characteristics. In other words, what may satisfy one employee may be different from what
will satisfy another, at least in terms of the satisfaction degree, moreover, some needs may
change over time, getting stronger or weaker. A group of employees sharing the same
individual features may have the same needs and expectations toward work and may be
satisfied in the same way. The knowledge of those factors may be of great value for the
organization in order to increase the employees’ motivation and satisfaction with the work
(Bassy, 2002).
Kenyatta National Hospital like many organizations is committed to having a highly
competent and motivated workforce. This commitment is clearly reflected in the
organization’s core values. However, KNH like other organizations is experiencing similar
trends when it comes to staff motivation, which brings in the question of what is the missing
link between what organizations are doing to motivate their employees and why the intended
goal to sufficiently motivate employees is not being achieved. This study sought to find out
the factors that motivate Nutritionists at KNH in carrying out their duties and responsibilities
and the level of satisfaction they derive from their job as these are important in achieving the
department’s objectives which feed into the organization’s goals as well.
1.3 General Objective
The general objective of this study was to evaluate employee motivation and job satisfaction
among Nutritionists at KNH.
1.4 Specific Objectives
This study sought:
1.4.1 To determine the factors that contribute to work motivation and satisfaction
among Nutritonists at KNH
1.4.2 To determine the overall level of job satisfaction among Nutritionists at
KNH
6
1.4.3 To determine the effects of biographical variables on job satisfaction among
Nutritionists at KNH
1.5 Significance of the Study
1.5.1 Employers
All organizations engage employees to meet their goals. Therefore, the findings of this study
would be useful to organizations in general in re-designing the staff motivation plan and
reward programme.
1.5.2 KNH Management
The knowledge gained from this study would assist Kenyatta National Hospital’s
management to identify and address the weak areas that may be contributing to employee’s
poor performance and staff turnover.
1.5.3 Researchers
The findings and recommendations from the study would be used by researchers and other
scholars in the world of academics as a basis of further to future studies.
1.6 Scope of the Study
The study was carried out among 38 Nutritionists on permanent employment deployed in the
various departments at KNH. The study was conducted in March 2013 as scheduled in
Appendix 5.
The survey was subject to bias and prejudices due to difficulties in measuring actual feelings,
perceptions and attitudes of the respondents, hence 100% accuracy was not assured. The
researcher used a questionnaire with closed ended questions in order to obtain specific
information on the subject matter.
The study results may not be generalized to KNH as a whole due to the fact that the sample
comprised of employees of one profession and is therefore not representative of the
organization. However, KNH can use the outcomes of this study to evaluate job motivation
and satisfaction among employees at the hospital to.
7
1.7 Definition of Terms
1.7.1 Job Satisfaction
Job satisfaction was defined as the affective orientations on the part of individuals toward
work roles which they are presently occupying (Vroom, 1964).
1.7.2 Motivation
For this paper, motivation was operationally defined as forces, which initiates, direct and
sustain behavior towards the attainment of certain goals (Bent, et al., 1999).
1.7.3 Nutritionist
A nutritionist was a person who advises on matters of food and nutrition impacts on health
and is also concerned with the therapeutic use of diet in the treatment of disease (Mosby's
Medical Dictionary, 2009).
1.8 Chapter Summary
This chapter had provided an introduction and overview of the research study. The purpose
and rationale of the study has been stated, and the variables defined by means of reference to
the literature. The chapter was concluded by defining the scope of the study and relevant
terms that describe the constructs in this study. Chapter 2 examines pertinent literature
relevant to the variables under study while chapter 3 details the research methodology.
Introduce chapters 4 and 5 as well. Further, chapter 4 presents results and findings while
chapter 5 presents discussion, conclusions and recommendations.
8
CHAPTER TWO
2.0 LITERATURE REVIEW
2.1 Introduction
This chapter details literature on the constructs of employee motivation, job satisfaction and
individual characteristics. The meaning and definition of Job motivation and satisfaction have
been clearly elaborated including well known respective models and theories. The overall
purpose of this chapter is to evaluate the relative contributions of related research studies, and
to apply their findings and conclusions in directing the present study, both in refining
objectives and in the interpretation of the results.
2.2 Factors Affecting Motivation
The term ‘motivation’ can be traced to the Latin word movere which means “to move”. This
meaning is evident in the following comprehensive definition: Motivation is a process that
starts with a physiological and psychological deficiency or need that activates a behavior or a
drive that is aimed at a goal or incentive. Thus the key to understanding the process of
motivation lies in the meaning of and relationships among needs, drives and incentives
(Luthan, 2002). Luthans (1998) defines motivation as the process that arouses, energizes,
directs, and sustains behaviour and performance. That is, it is the process of stimulating
people to action and to achieve a desired task.
The psychology of motivation is tremendously complex, and what has been unraveled with
any degree of assurance is small indeed (Herzberg, 2002). Motivation is a highly complex
phenomenon (Bent, et al., 1999) and (Jackson, et al., 2009) that influences and is influenced
by a large number of factors in the environment (Porter and Steers, 1991). Kanter (2009)
highlighted some of Peter Drucker’s thoughts of the subject of motivation, one of his thought
was that employees should be motivated by a sense of purpose and not just by money, that
knowledgeable workers cannot be controlled, they must be motivated. The study of
motivation is also concerned with why individuals think and behave as they do (Mullin,
1999).
For this study, motivation is operationally defined as forces, which initiates, direct and
sustain behavior towards the attainment of certain goals (Bent, et al., 1999). A motive is a
reason for doing something. Motivation is therefore concerned with the factors that influence
people to behave in certain ways (Armstrong, 2006).
9
At one time, employees were considered just like another input into the production of goods
and services. What perhaps changed this way of thinking about employees was research,
referred to as the Hawthorne Studies, conducted by Elton Mayo from 1924 to 1932 (Dickson,
1973). This study found employees are not motivated solely by money and that employee
behavior is linked to their attitudes (Dickson, 1973). The Hawthorne Studies began the
human relations approach to management, whereby the needs and motivation of employees
become the primary focus of managers (Bedeian, 1993). The discussion of motivation in the
literature refers mainly to three aspects: what is the arousal or energizing source of the
individual behavior; what directs or channels such behavior (Wagner, 1999) and the
maintenance and sustainability of this behavior (Bent et al., 1999).
The first issue deals with driving forces inherent in the individual those lead to a certain
behavior, and with environmental forces that often cause these drives (Porter and Steers,
1991). The second feature involves the direction of behavior towards a goal (Wagner, 1999).
Furthermore, Porter and Steers (1991) refer to the third matter as forces within the individual
and environmental forces that provide the individual with feedback. This feedback either
reinforces the individual to intensify his/her drive and the direction of his/her energy, or
discourages the individual to pursue his/her course of action and redirects his/her efforts. The
motivational process represents a general model of human behavior; (Mullins, 1999) and
Steers (1991) argued that this model assumes that individuals hold a number of needs, desires
and expectations in varying strengths. Based on these needs and expectations, people act or
behave in a certain way that they believe will lead to the desired goal. Thereby, according to
Steers and Porter (1991), the individual will be provided with feedback about the impact of
his/her behavior. That, in turn may induce the individual to alter his/her present behavior, or
may reassure the individual that his/her current way of acting is correct and may confirm the
person in pursuing this course of action.
According to Atkinson et al. (1995), the motivational process is not a simple and straight-
forward as it seems, it is a far more complex study. Porter and Steers (1991) refer to
Dunnette and Kirchner (1965) and others who identified four aspects, which complicate the
simplicity of the model. The first aspect refers to the fact that motives cannot directly be
observed and therefore a need to deduce them exists (Baron, 1983). However, the inference
of motives from observed behavior is associated with difficulties traced back to at least five
reasons mentioned by Atkinson et al. (1975). These five reasons are: several motives may be
10
expressed through any single action; motives may occur in disguised forms; similar or
identical actions may represent several motives; different behavior may embody similar
motives; and the modes of expression of certain motives may be mitigated by personal and
cultural variations. The second complication of the model deals with the fact that any person
has a host of motives. These motives may change over time and conflict with each other
(Baron, 1983). Third, Porter and Steers (1991) point out that the selection of certain motives
over others, as well as the intensity with which such motives are pursued, may differ from
person to person. In addition, they refer to the fourth complication, the fact that an attainment
of certain needs, desires and expectations may prompt a person to direct his/her attention to
other motives, or to intensify the pursuit of these motives.
2.2.1 The Role of Motivation
Why do organizations need motivated employees? The answer is survival (Smith, 1994). An
understanding of motivation is important to an organization for various reasons such as it
enables organizations to humanize work for employees to make it inherently satisfying and
enjoyable as possible as it is the organization’s moral duty to make work more satisfying
(Beardwell et al., 2004).
In an organization, motivation is important because of reasons such as satisfaction of needs
which vary from basic needs, social needs and self-esteem. Motivation is also important
because it deals with saturated basic needs, since satisfaction of higher needs will elicit more
effort once basic needs are largely fulfilled, greater rewards mainly applicable to the
satisfaction of basic needs would be ineffective as they are saturated. Another reason is for
the release of work capacity as differences in productivity reflect the quality of motivation;
and finally, enhancing the firm’s image (Sagimo, 2002). The knowledge about what
motivates and satisfies people at work may be essential to generate such commitment. That
includes the commitment to act toward the goals of the company, as well as the commitment
to stay in the organization (Dessler, 1986). The achievement of organizational commitment,
however, is not easy since it may be influenced by personal and organizational factors
(Schultz and Schultz, 1998). The key implication for practicing managers falls within the
domain of motivational awareness. There may however be a tendency for some managers to
project their own motivating factors onto subordinates in the process of encouraging
performance. The work life development model indicates that this could be ineffective
(Tesone, 2005).
11
Motivated employees are needed in our rapidly changing workplaces. Motivated employees
help organizations survive and are more productive. To be effective, managers need to
understand what motivates employees within the context of the roles they perform. Of all the
functions a manager performs, motivating employees is arguably the most complex. This is
due in part, to the fact that what motivates employees changes constantly (Bowen &
Radhakrishna, 1991) for example, research suggests that as employees’ income increases,
money becomes less of a motivator also, as employees get older, interesting work becomes
more of a motivator (Kovach, 1987).
2.2.2 Motivation, Human Needs and Expectations
According to Sagimo (2002), motivation that provides a motive to act in a desired manner
must have meaning within the needs of subordinates. Thus, efforts to motivate are related to
human needs because man is truly a wanting animal. But the priority of man’s needs changes
from the physical to the higher social needs as the physical ones become comparatively
satisfied according to current accepted theory. Individuals are different and therefore also
have different needs and expectations, which they attempt to fulfill in many different ways.
When employees join an organization, they do not come in with empty hands, but bring with
them two things i.e potential energy of resources previously acquired in terms of training and
skills (expertise and knowledge, education, interest and experience) and heap of needs and
wishes which they hope or want to satisfy by making use of their energy resources. These
needs and expectations, alter and often conflicting with each other over time. They may be
classified in several ways including;
2.2.2.1 Intrinsic and Extrinsic Motivators
Motives can be thought of as being generated by two separate but interrelated sets of sources.
One method to characterize these two sources is to label them as being either intrinsic or
extrinsic (Luthans, 2002). Internal motivators are, according to Mak and Sockel (2001),
concerned with intrinsic needs that satisfy a person, whereas external motivators are
considered as environmental factors brought by the company to the individual.
Intrinsic motivation is the desire of an individual to perform his/her work well, in order to
achieve the satisfaction of intrinsic needs (Hui and Lee, 2000). In other words, an individual
performs a task in order to achieve certain types of internal states, which he/she experiences
as rewarding (Deci, 1975). Intrinsic motivation relates to psychological rewards such as the
12
recognition of a task completed (Mullins, 1999). External rewards such as food, money,
praise, and so on, are not the main reason for a person to engage in activities (Deci, 1975).
Intrinsic motives can be satisfied by the work itself. In other words, the task itself is the main
source of motivation, since it provides interest, stimulation, challenges, and opportunities for
personal growth and achievement to the individual (Molander, 1996). Deci (1975) refers to
intrinsically motivated behavior as behavior that is determined by an individual’s need for
feeling competent and self-determining.
Extrinsic motives cannot only be satisfied by the work itself. On the one hand, a person will
seek out challenges that allow him/her to behave in ways that provide him/her with a sense of
competence and self-determination. On the other hand, an individual is engaged in a process
of conquering challenges. Extrinsic motivation refers to tangible rewards such as pay, fringe
benefits, work environment, work conditions, and job security (Mullins, 1999). It is important
to remember that these two types of motivators are not completely distinct from one another.
Many motivators have both intrinsic and extrinsic components (Luthans, 2002).
2.2.2.2 Other Classifications for Motivators
According to Mullins (1999), needs and expectations can be classified in economic rewards,
intrinsic satisfaction, and social relationships. Economic rewards include pay, fringe benefits,
and material goods these are an instrumental orientation to work. Intrinsic satisfaction is
provided by the work itself and represents a personal orientation to work. Friendships,
teamwork, and the need for affiliation are part of the social relationship that constitutes the
relational orientation to work. The relative strength of all these categories of needs and
expectations together with the extent to which they are satisfied determines an individual’s
motivation and job satisfaction. People differ in their preferences, some persons may prefer
economic rewards, whereas other individuals will favour intrinsic satisfaction and/or social
relationships. These preferences may change over time.
2.2.3 Motivation Theories
Approaches to motivation are underpinned by motivation theory. The most influential
theories are Instrumentality theory; which states that rewards or punishments (carrot or
sticks) serves as the means of ensuring that people behave or act in desired ways (Armstrong,
2006). Content theory; Which focuses on the content of motivation, it states that motivation
is essentially about taking action to satisfy needs and identifies the main needs that influence
13
behavior. The theories are concern with how employees needs can be satisfied and is
supported by theorist such as Fredrick Taylor (1865-1917), Hawthorn Studies, Abraham
Maslow, Fredrick Herzberg and Douglas McGregor (Beardwell et al., 2004). Process
theory; Process theories focuses on a more dynamic approach and are interested in
understanding the process of developing motives rather than trying to offer static analysis of
needs. They are more concern with the question ‘why’ and are supported by theories such as
Procedure Justice and distributive justice, Procedural Justice, Equity theory, Expectancy
theory and Goal-setting theory (Beardwell et al., 2004). Appendix 1 gives a summary of
motivation theories (Armstrong, 2006).
Since motivation deals with factors that energize, direct and sustain behavior, there are a lot
of important variables, which may influence an individual’s motivation at work. These
variables can be distinguished in three groups: characteristics of the individual, job
characteristics, and work environment characteristics (Steers and Porter, 1983).
2.3 Determinants of Job Satisfaction
Satisfaction is an internal state (Mullins, 1999). Job satisfaction refers to the attitudes and
feelings people have about their work (Armstrong, 2006). It is the outcome of a motivational
process (Bent et al., 1999). Job satisfaction is as a result of employees’ perception on how
well their job provides those things that are viewed as important. It focuses on employees’
attitudes towards their job (Luthans, 2002). Job satisfaction is the positive and negative
feelings and attitudes which an individual holds about his/her work (Schultz and Schultz,
1998). In other words, it is the extent to which an individual favours his/her job, positive
attitudes toward the job are equivalent to job satisfaction, whereas negative attitudes
represent job dissatisfaction (Molander, 1996). The Havard Business Review of January 2003
in an article titled ‘One More Time: How Do You Motivate Employees” stated that the
opposite of job satisfaction is not job dissatisfaction but rather, no job satisfaction.
According to Armstrong (2006), the level of job satisfaction is affected by intrinsic
motivating factors, the quality of supervision, social relationships with the work group and
the degree to which individuals succeed or fail in their work. Job satisfaction is a complex
phenomenon (Sell and Shipley, 1979; Bent et al., 1999) and depends on many work-related
as well as personal factors. That means personal factors such as age, gender, and job
14
experience as well as the characteristics of the job influence a person’s degree of job
satisfaction (Lawler and Porter, 1967).
Employee satisfaction is determined by perceptions of whether the rewards received for
performance are fair (Jackson, et al., 2009). Although recent theoretical analyses have
criticized job satisfaction as being too narrow conceptually, there are three generally accepted
dimensions to job satisfaction. First, job satisfaction is an emotional response to a job
situation. As such, it cannot be seen it can only be inferred. Second, job satisfaction is often
determined by how well outcomes meet or exceed expectations and third, job satisfaction
represents several related attitudes (Luthans, 2002).
The level of job satisfaction is affected by intrinsic motivating factors, the quality of
supervision, social relationships with the work group and the degree to which individuals
succeed or fail in their work (Armstrong, 2006). Job satisfaction is a main factor for the
motivation of employees (Mak and Sockel, 1999). According to Blankertz and Robinson
(1996), individuals who are satisfied with their job to a high extent, are very motivated and
do not prefer to leave their job.
2.3.1 Models of Job Satisfaction
2.3.1.1 Affect Theory
Edwin A. Locke’s Range of Affect Theory (1976) is arguably the most famous job
satisfaction model. The main premise of this theory is that satisfaction is determined by a
discrepancy between what one wants in a job and what one has in a job (e.g the degree of
autonomy in a position) moderates how satisfied/dissatisfied one becomes when expectation
are/aren’t met. This theory also states that too much of a particular facet will produce stronger
feelings of dissatisfaction the more a worker values that facet (Velnampy, 2008).
2.3.1.2 Dispositional Theory
Another well known job satisfaction theory is dispositional theory. It is a very general theory
that suggests that people have innate dispositions that cause them to have tendencies towards
a certain level of satisfaction, regardless of one’s job. This approach becomes a notable
explanation of job satisfaction in light of evidence that job satisfaction tends to be stable over
time ad across careers and jobs. Research to back this theory indicates that identical twins
have similar levels of job satisfaction. A significant model that narrowed the scope of the
disposition theory was the core self-evaluation model, proposed by Timothy A. Judge in
15
1998. He argued that there are four core self-evaluation that determine one’s disposition
towards job satisfaction, they include; self-esteem, general self-efficacy, locus of control and
neuroticism. This model states that higher level of self-esteem and general self-efficacy leads
to higher work satisfaction. Having an internal locus of control and lower levels of
neuroticism leads to higher job satisfaction (Brown, 2008).
2.3.2 Influences on Job Satisfaction
Some theorists think that job satisfaction leads to a better performance. Moreover, the
opinions of theorists differ in terms of whether job satisfaction leads to improved productivity
or the reverse (Mullins, 1999). Lawler and Porter (1967), for instance, described the fact that
increased performance leads to satisfaction with the help of a third variable – rewards. They
assumed that good performance leads to rewards either in the form of extrinsic or intrinsic
rewards, which in turn will cause satisfaction. Furthermore, job satisfaction and life
satisfaction are related positively and reciprocally to each other. That means a person with
positive feelings about his/her family and personal life will be likely to develop positive
attitudes toward his/her job and vice versa (Schultz and Schultz, 1998). In addition, several
studies, for instance Vroom (1964), have shown that a negative relation between job
satisfaction and labour turnover exists. The more satisfied an individual is with his/her work,
the less likely he/she will change the employer.
There are many factors that affect job satisfaction and organizational commitment of an
employee for instance the state of the labour market, which have an influence on the turnover
behavior (Molander, 1996). Absenteeism is another factor; a relationship has been established
between job satisfaction and absenteeism (Vroom, 1964). Verhaegen (1979) argued that
turnover and absenteeism are related to satisfaction in some way, but since many other
factors influence these variables as well, an explicit relationship can only be identified in
some concrete situations. The extent to which an employee is able to identify with his/her job
is another factor, the more a person identifies himself/herself psychologically with the job,
the higher the job satisfaction seems to be. Thereby, according to Schultz and Schultz (1998),
job involvement depends on personal factors such as age, growth needs, job characteristics
like autonomy, variety, stimulation, and feedback, and social factors such as group work.
16
2.3.3 Outcome of Job Satisfaction
To society as a whole as well as from an individual employee’s standpoint, Job satisfaction in
and of itself is a desirable outcome. However, from a pragmatic managerial and
organizational effectiveness perspective, it is important to know how, if at all satisfaction
relates to outcome. For instance, if job satisfaction impacts on performance, turnover,
absenteeism or other factors such as physical health, the rate of learning a new job-related
task, resulting to fewer accidents and filing of fewer grievances (Luthans, 2002). Some of the
personal outcomes of job satisfaction are internal motivation, growth satisfaction and general
satisfaction (Hackman and Oldham, 1980).
According to Luthans (2002) it is argued that job satisfaction is important to an organization.
Some critics have argued, however, that this is pure conjecture because there is so much we
do to know about the positive effects of satisfaction. On the other hand, when job satisfaction
is low, there seem to be negative effects on the organization that have been documented. So if
only from the standpoint of viewing job satisfaction as a minimum requirement or point of
departure, it is of value to the organization’s overall health and effectiveness and is deserving
of study.
2.3.4 Relationship Between Motivation and Job Satisfaction
People work to satisfy basic needs, the process theory called the Porter-Lawler suggests that
levels of motivation are based more on the value that individuals place on the reward. The
components that effect motivation then, are called valence i.e. what’s important to you and
expectancy -can I do it. Porter and Lawler suggest that perceived inequality plays a pivotal
role in motivation and job satisfaction. Employee motivation or effort leads to action which is
followed by intrinsic and extrinsic rewards. The perceived equity of those rewards leads to
satisfaction (Sagimo, 2002).
Luthans (2002) researched on the relationship between job satisfaction and employee
motivation. All motivation theories mentioned before contributed, to a certain extent, to the
job characteristics model developed by Hackman and Oldham (1980), which deals with the
structure of work in order to achieve a high internal motivation and high job satisfaction. This
model considers the intrinsic motivation that causes a person to perform the job well due to
interests on the work and challenges in the job (Hackman and Oldham, 1980).
17
2.3.5 Conditions for Internal Motivation and Job Satisfaction
The occurrence of internal motivation is caused by three basic conditions. These conditions
influence not only an employee’s motivation to work, but also his/her satisfaction on the job.
First, the individual must have knowledge of the results of his/her work performance. In other
words, if the individual has no idea about how well or poorly he/she is performing the job,
he/she will not develop any feelings such as happiness or sadness about his/her job
performance. Secondly, the person must feel responsible and accountable for the results of
his/her work. That means when a person thinks that his/her own efforts contribute only to a
minor extent to the quality of his/her work outcome, the individual will not generate any
feelings such as pride or sadness towards the quality of work done. Third, the person must
experience work as meaningful. In other words, if the individual does not perceive his/her
work as generally important, valuable and worthwhile, he/she will not develop any internal
motivation. Even when a person feels responsible for the work done and receives information
about his/her performance, but lacks the feeling for doing a meaningful job, the internal
motivation is unlikely to develop. In other words, if one of these conditions is missing the
internal motivation will not occur. All three factors – knowledge of results, experienced
responsibility and experienced meaningfulness – are necessary to develop and sustain a
strong internal work motivation. Moreover, the stronger these factors are present, the higher
the internal motivation and job satisfaction (Luthans, 2002).
Hackman and Oldham (1980) point out that a challenge and stretch of an employee’s abilities
and skills by his/her tasks will lead to the fact that the employee will perceive the work as
meaningful. In addition, the more skills can be used, the more meaningful the task appears to
be. Secondly, task identity refers to the degree to which a job involves doing a whole unit of
work from beginning to end with a visible outcome instead of performing only a tiny part of
the overall piece of work. When people are doing a whole job (providing a complete unit or
putting together an entire product) they care more about their work and perceive their job as
more meaningful. Third, task significance is the degree to which the job has a meaningful
impact on other people’s lives and well being, either inside or outside the company. When
people understand that their work outcome will have an impact on someone’s well being (e.g.
happiness, safety, or health) they will care more and experience meaningfulness in their
work. If all three characteristics are present in a job, an employee is more likely to perceive
his/her job as meaningful. Even if one or two characteristics are quite low, a person can
18
experience his/her job as meaningful. The characteristic of the job that influences the
experienced responsibility for the work outcome is autonomy.
Luthans (2002) states that the above-mentioned conditions for internal motivation are
facilitated by five job characteristics. Three of these characteristics contribute to the
experienced meaningfulness of the work, one influences the experienced responsibility for
outcomes of the work, and one has an effect on the knowledge of results. The three
characteristics that have an influence on the meaningfulness of the work are skill variety, task
identity, and task significance. First, skill variety is the extent to which a job requires
different activities in order to perform the work. These activities entail the use of various
skills and abilities.
Hackman and Oldham (1980) refer to autonomy as the degree of freedom and independence
that an individual has in scheduling and organizing work provided by the job. A person will
feel that the work outcome depends on his/her own efforts, initiatives and decisions when the
degree of autonomy provided by the job is high. That a person will feel more personally
responsible for the success or failure of his/her work outcome in comparison to a person who
follows the instructions of his/her boss, or acts according to a manual of job procedures.
Finally, the job characteristic that influences the knowledge of results is the feedback, which
a person receives directly from the work activities themselves. Feedback is the extent to
which the job itself provides an individual with information about the effectiveness of his/her
work performance
A job may provide one or more of these five characteristics to a high extent, but at the same
time the others may be quite low. Therefore, it is advisable to consider a job in terms of each
characteristic. Furthermore, it may be of value to combine the scores of a job on the five
dimensions into a single index in order to understand the overall potential of a job to facilitate
internal work motivation. A job has a high motivating potential if at least one of the three
factors that foster the experienced meaningfulness of a job is provided to a high extent, and
the degree of both autonomy and feedback is high as well. The presence of these
characteristics is necessary to create the conditions for the internal motivation – the
experienced meaningfulness of the work, the experienced responsibility for outcomes of the
work, and the knowledge of the actual results of the work activities (Luthans, 2002).
19
2.4 Individual Characteristics, Motivation, and Job Satisfaction
Herzberg (2002) states that there are two needs of human beings one set of needs can be
thought of as stemming from humankind’s animal nature the built-in drive to avoid pain from
the environment, plus all the learned drives that become conditioned to the basic biological
needs for example hunger a biological drive makes it necessary to earn money then money
becomes a specific drive. The other set of needs relates to that unique human characteristic,
the ability to achieve and through achievement, to experience psychological growth. The
stimuli for the growth needs are tasks that induce growth, in the industrial setting, they are the
job content while the stimuli inducing pain-avoidance behavior are found in the job
environment and motivators are the primary cause of satisfaction. Towards the end of the 20th
century the implicit hypothesis underlying the study of individual differences is that a
person’s behavior is optimally predicted by measuring traits, values and motives, this is
because these variables are relatively stable and hence reflected in a person’s behavior
(Latham, 1989).
In regards to job satisfaction, according to Luthans (2002), employee’s perception of the job
may explain increases in both overall and intrinsic job satisfaction. Since job characteristics
approach only set the stage for internal motivation, the role of differences among people has
to be considered as well. Several attributes of people influence their response to highly
motivating potential jobs. The first attribute is knowledge and skill. If a job is low in
motivating potential, a person’s feelings will not be greatly affected by how well he/she
performs, irrespective of that person’s job-related knowledge and skills. If a job is high in
motivating potential, then, a person who has sufficient knowledge and skills to perform the
job well will receive satisfaction from doing well. However, a person who has insufficient
knowledge and skills will receive negative feelings from doing poorly. “Individual growth
need strength” is the second attribute. Jobs with a high motivating potential often offer the
opportunities for learning and personal accomplishments at work. However, complex,
challenging work is not appreciated by all persons. Individuals with “strong growth needs”
such as need for personal accomplishment, for learning and developing themselves,
experience a high internal motivation from performing a complex and challenging work.
They react in a positive way to opportunities provided by enriched work. On the other hand,
persons with “low growth needs” do not strive to exploit opportunities for personal growth
20
that are provided by such a job. Furthermore, it seems that they do not recognize that such
opportunities exist, or may perceive such opportunities as a threat.
According to Hackman and Oldham (1980), the link between the job dimensions and the
conditions for internal motivation means that the conditions for internal motivation are more
strongly experienced by an individual with “high growth needs”, when one performs an
enriched work, than by a “low growth need person”. Second, the link between the conditions
for internal motivation and the internal motivation means that a “high growth need person”
will show more positive responses to the conditions for internal motivation, when they are
present, compared to a person with a “low growth need strength”. Finally, the satisfaction
with the work context is the third variable influencing a person’s response to work. The
degree of satisfaction with the work context may be of importance for an individual in order
to use opportunities of personal accomplishments provided by the job. That means a person
satisfied with pay, job security, co-workers and supervision would react more positively to
challenges and enrichment of his/her work compared to a person who is dissatisfied with the
work context. Persons who have a “high growth need strength” and are satisfied with the
work context have a very high level of internal motivation. The motivating potential score is
positively related to a person’s motivation and performance of the job. Individuals who have
“low growth need strength” and are dissatisfied with the work context can be rarely
motivated by motivational characteristics of the job they do. The three attributes mentioned
above – job relevant knowledge and skill, “growth need strength”, and level of satisfaction
with aspects of the work context - affect the responses of a person to a job with high
motivating potential.
A combination of these factors has a more significant impact on the responses than just a
single factor. A person with insufficient knowledge and skills to perform the job well, low
needs for personal growth at work, and a high degree of dissatisfaction with the work context,
would not fit a job high in motivating potential score. The work would be too much for that
person and negative personal outcomes, as well as negative work outcomes have to be
expected. Therefore, a more simple and routine job would be more appropriate for that
person. On the other hand, an individual with knowledge and skills to perform a complex and
challenging work, a high need for personal growth, and satisfied with the aspects of work
context, would be expected to experience a high degree of personal satisfaction and work
motivation, and to perform best his/her tasks. A work high in motivating potential would fit
best with the talents and the needs of that person (Luthans, 2002).
21
Hackman and Oldham (1980) divide the outcomes of enriched work into personal outcomes
and work effectiveness. The personal outcomes are internal motivation, growth satisfaction
and general satisfaction. People, who perform a job that is high in the motivating potential,
may experience opportunities for personal growth and learning in their job as personally
satisfying. General satisfaction and work effectiveness (quantity and quality of produced
goods and services) may be increased by job enrichment as well. Employee satisfaction in
terms of work context is also likely. The redesign of work may affect absenteeism and
voluntary turnover in the way that more capable persons may feel more committed to the job
and to the company, whereas the commitment of less talented individuals may decrease.
2.5 Chapter Summary
This chapter presents an overview of the literature pertaining to employee motivation and job
satisfaction including many of the most well-known and authoritative theories and
definitions. Previous research on the constructs, in addition to perspectives on individual
characteristics, and the relationship between the constructs under investigation has been
reviewed.
Chapter 3 describes the methodology employed to explore the three constructs and their
relationships.
22
CHAPTER THREE
3.0 RESEARCH METHODOLOGY
3.1 Introduction
Chapter 2 presented the research literature on the constructs of employee motivation, job
satisfaction. This study aimed at exploring the relationship between employee motivation and
job satisfaction. This was done by investigating the job motivating factors and their relative
importance, assessing the level of job satisfaction and consequently the relationship between
the variables among Nutritionists at KNH. The procedure followed in conducting the research
was described in this chapter. This chapter defines the research methods used to conduct the
study. The researcher explained how the necessary data and information to address the
research objectives and questions would be collected and analyzed.
3.2 Research Design
The study was adopted a descriptive research design taking the format of a survey.
According to Mugenda and Mugenda (2003), descriptive research design is used when the
problem has been well defined, some information exists concerning the phenomenon, and
where the researcher can engage in a survey by going to the population of interest in order for
the respondents to explain certain features about the problem under study. Similarly it is a
common method of studying individuals under natural conditions (Saunders and Thornhill
2003).
For the purpose of this study a quantitative methodology was applied and a questionnaire was
used as the measuring instrument. The major advantages of questionnaires was that they are
less time-consuming and less costly than other measuring instruments and can be
administered to groups of people simultaneously (Leary, 2004). The data gathering
techniques that were used include a biographical questionnaire and the Work Satisfaction and
Motivation Questionnaire as designed by De Beer (1987). The independent variable in this
study was work motivation while the dependent variable was job satisfaction
3.3 Population and Sampling Design
3.3.1 Population
Mugenda and Mugenda (1999) define population as an entire group of individuals, events or
objects having common observable characteristics. The Nutrition department is situated on
23
the 2nd floor of the old hospital (formerly King George Hospital) next to the University of
Nairobi’s Radiology department and KEMRI Annex.
The department was composed of Nutrition Officers and was headed by a Chief Nutrition
Officer who oversaw all nutrition care activities in the hospital. Other cadres of staff
included: the Deputy Chief Nutrition Officer; Assistant Chief Nutrition Officer; Senior
Nutrition Officers; Nutrition officer I; Nutrition Officer II, Nutrition Officer III, and Senior
Assistant Nutritionist.
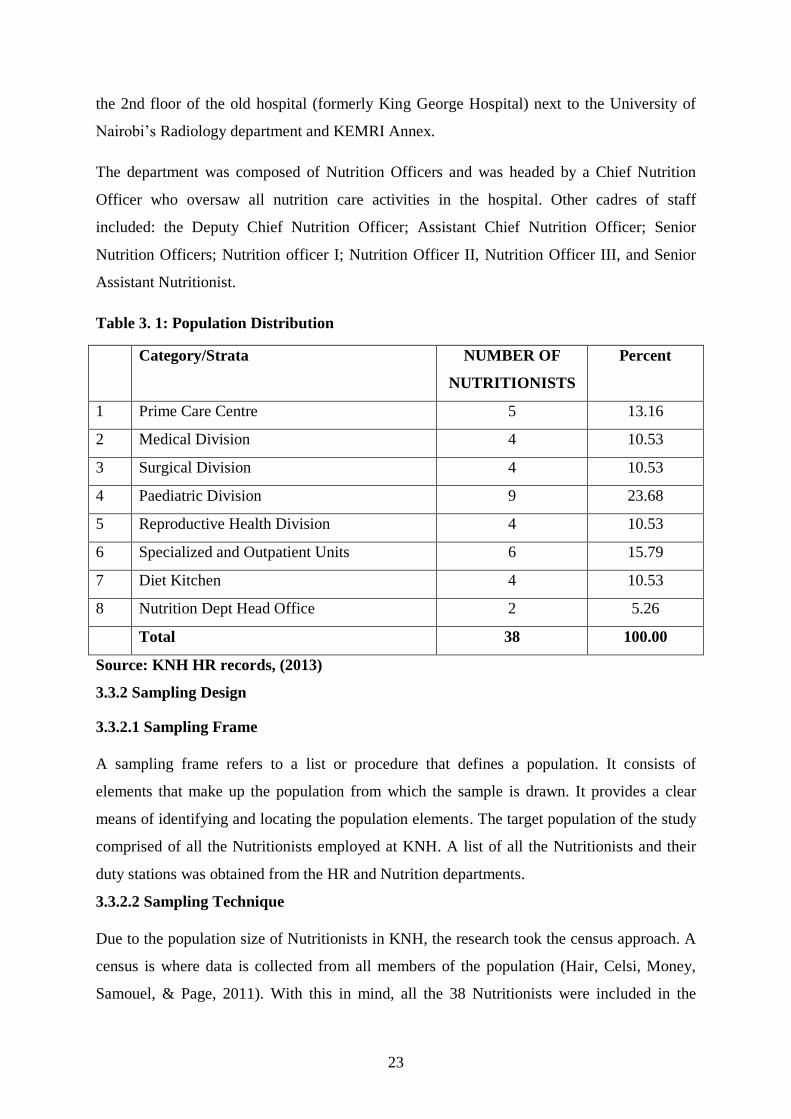
Table 3. 1: Population Distribution
Category/Strata NUMBER OF
NUTRITIONISTS
Percent
1 Prime Care Centre 5 13.16
2 Medical Division 4 10.53
3 Surgical Division 4 10.53
4 Paediatric Division 9 23.68
5 Reproductive Health Division 4 10.53
6 Specialized and Outpatient Units 6 15.79
7 Diet Kitchen 4 10.53
8 Nutrition Dept Head Office 2 5.26
Total 38 100.00
Source: KNH HR records, (2013)
3.3.2 Sampling Design
3.3.2.1 Sampling Frame
A sampling frame refers to a list or procedure that defines a population. It consists of
elements that make up the population from which the sample is drawn. It provides a clear
means of identifying and locating the population elements. The target population of the study
comprised of all the Nutritionists employed at KNH. A list of all the Nutritionists and their
duty stations was obtained from the HR and Nutrition departments.
3.3.2.2 Sampling Technique
Due to the population size of Nutritionists in KNH, the research took the census approach. A
census is where data is collected from all members of the population (Hair, Celsi, Money,
Samouel, & Page, 2011). With this in mind, all the 38 Nutritionists were included in the
24
sampling unit to constitute an adequate sample size. This technique of collecting data has
high reliability and accuracy as a result of inclusion of all the elements of the population.
3.3.2.3 Sample Size
The sample size included all the 38 Nutritionist working at Kenyatta National Hospital.
3.4 Data Collection
Data was obtained mainly by use of a structured Questionnaire (appendix 2). The
Questionnaire was closed ended and was used to collect both quantitative and qualitative data
to answer related problems.
The Questionnaire comprised of three (3) sections: Section A sought to obtain socio-
demographic data which included job group, gender, education level, age, marital status,
Professional affiliation, years one had been working at KNH, and total years of work
experience, area of work, and job designation
Section B comprised the Work Motivation and Satisfaction questionnaire as defined by De
Beer (1987) and incorporated the sixteen factors of Herzberg’s two-factor theory. The
questionnaire consisted of nine dimensions that impact employee satisfaction and motivation
as follows:
1. Work content probed about the respondents’ feelings about the type of work they did.
2. Payment probed respondents’ satisfaction with their salaries.
3. Promotion probed for the opportunity that the organisation offered for promotion.
4. Recognition probed whether the respondents received recognition and feedback for the
jobs they performed.
5. Working conditions probed for the opportunity to mix with colleagues and interpersonal
relations.
6. Benefits looked at whether the benefits such as pension, medical schemes and leave were
satisfactory.
7. Personal probed the respondents’ feelings towards their job.
8. Leadership or supervision probed the level of satisfaction with the manager (supervior).
25
9. General probed if the respondents had considered alternative employment and hence their
level of satisfaction with the organisation.
Each dimension had a number of possible responses from which the respondent could select
the one which best suited their feeling or attitude at that given time.
The selected responses were indicated on a three-point scale as follows:
True = 1
Not sure = 2
Untrue = 3
The respondents were requested to mark their chosen responses with an X (De Beer, 1987).
According to Leary (2004), “Reliability refers to the consistency or dependability of a
measuring instrument while Validity refers to the extent to which a measurement procedure
actually measures what it is intended to measure rather than measuring something else, or
nothing at all”
De Beer (1987) conducted an item analysis to evaluate the inter-item consistency of the Work
Motivation and Satisfaction Questionnaire. This provides an indication of the consistency of
responses to all the items delineated in a measuring instrument.
According to Prinsloo (1996), the reliability of this instrument is determined with the aid of
the SPSSX-programme in conjunction with Cronbach coefficient-alpha. The calculated
coefficient-alpha is 0.82, which suggests a strong positive item-homogeneity in this
measuring instrument. This signifies as an indication of test reliability.
Section C included a single question to evaluate the employees’ overall level of job
satisfaction status measured on a 1-5 scale. The advantages of a single item measures for
measuring overall job satisfaction are increased face validity, brevity, high correlation with
multi-item satisfaction measures and increased sensitivity in measuring changes in job
satisfaction Wanous & Reichers (1997), and Nagy (2002).
Ordinal ranking was used to measure the attitudes of the respondents on a scale of 1 to 5,
where 5 indicated little or very dissatisfied while 1 indicated a high level of satisfaction.
26
3.5 Research Procedures
Before commencing data collection the researcher sought and obtained permission from the
Deputy Director, Clinical Services, KNH to carry out the study. Prior to that, the researcher
conducted a pilot study at Mbagathi Level 5 Hospital to test the research instrument. This was
done on 10% of the sample size of 38 Nutritionists which amounted to 4 respondents. The
purpose of the pilot study was to assess the clarity and ease of use of the instruments and
ensure reliability. The questionnaire was tested for content and face validity during the pilot
study.
Thereafter, the researcher personally contacted all the respondents and sought their consent to
participate in the study. She explained to the respondents the purpose and significance of the
study. The researcher agreed with each respondent on the date and venue to deliver the
questionnaires. All respondents were required to sign the consent form before completing the
questionnaire. Confidentiality was ensured by informing participants not to write their
personal information on the questionnaires as it was not required.
The ‘Drop and Pick’ method was used to issue and collect questionnaires. The respondents
were given a period of two days to complete the questionnaires. This was followed up with
personal telephone calls for any clarification and checking on the progress of completing the
questionnaires. The researcher personally collected the questionnaires to ensure a high
response rate. The questionnaires were checked for completeness upon collection. The
questionnaires were coded and the data entered onto an excel spreadsheet in preparation for
analysis. The questionnaires were kept safely for reference if necessary.
3.6 Data Analysis
Data analysis involves organizing, accounting for and explaining the data; that is, making
sense of the data in terms of respondents’ definition of the situation noting patterns, themes,
categories and regularities (Gay, 1992). The collected data was be coded and a roster
prepared. The data was thereafter analyzed using a statistical computer package (SPSS V.
21). Descriptive statistics was used during the analysis to compute frequencies, percentages,
means, and standard deviation. Frequency tables, graphs and charts were used to present the
data for ease of comparison and understanding. In addition non parametric tests were used for
the computation of multiple-regression to establish the relationship between motivation and
job satisfaction among Nutritionists and make inferences. In addition cross tabulation was
27
used to establish the variation in job satisfaction in relation to the biographic variables.
Further, ANOVA was used to establish the relationship between biographic variables and job
satisfaction.
3.7 Chapter Summary
This chapter looks at the research methodology that was used in this study. The research
design was defined and the population and sample described. Data was collected by use of
questionnaires. The research procedures are outlined. Data was analyzed using both
descriptive and inferential statistical methods.
The next chapter provides the results and findings of the research. The results and findings
were presented and discussed on the basis of the research questions and the questionnaire
administered to the respondents.
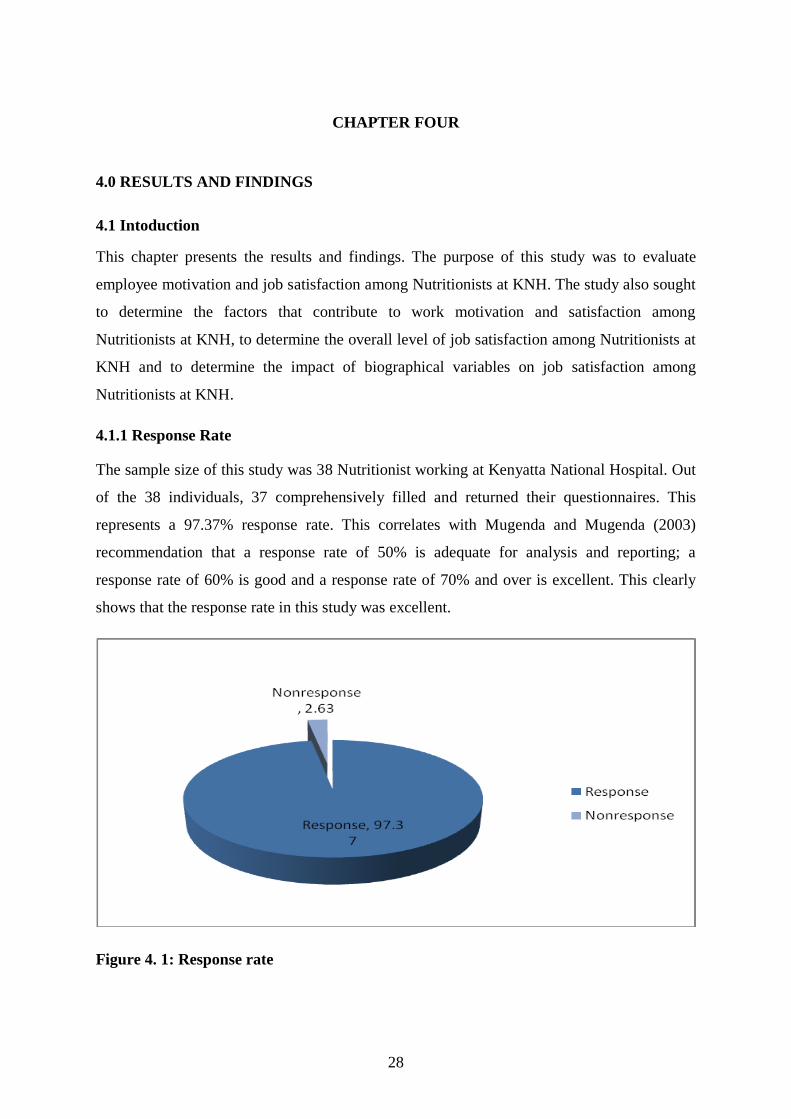
28
CHAPTER FOUR
4.0 RESULTS AND FINDINGS
4.1 Intoduction
This chapter presents the results and findings. The purpose of this study was to evaluate
employee motivation and job satisfaction among Nutritionists at KNH. The study also sought
to determine the factors that contribute to work motivation and satisfaction among
Nutritionists at KNH, to determine the overall level of job satisfaction among Nutritionists at
KNH and to determine the impact of biographical variables on job satisfaction among
Nutritionists at KNH.
4.1.1 Response Rate
The sample size of this study was 38 Nutritionist working at Kenyatta National Hospital. Out
of the 38 individuals, 37 comprehensively filled and returned their questionnaires. This
represents a 97.37% response rate. This correlates with Mugenda and Mugenda (2003)
recommendation that a response rate of 50% is adequate for analysis and reporting; a
response rate of 60% is good and a response rate of 70% and over is excellent. This clearly
shows that the response rate in this study was excellent.
Figure 4. 1: Response rate
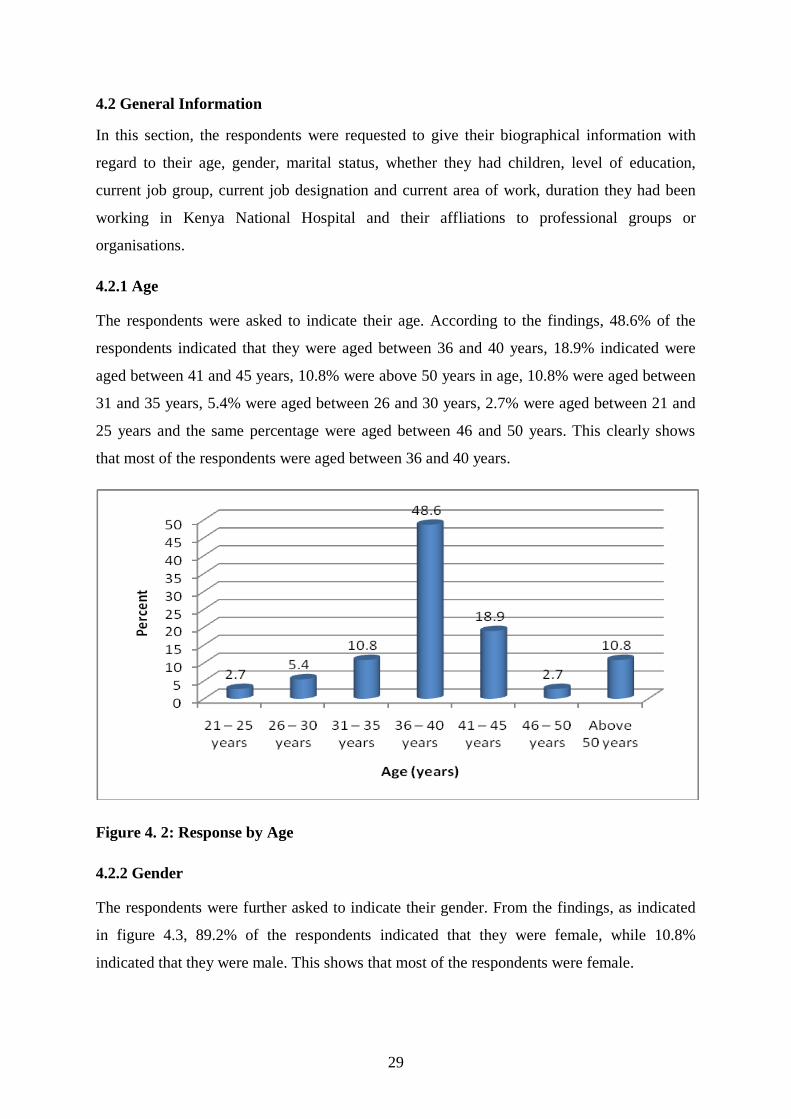
29
4.2 General Information
In this section, the respondents were requested to give their biographical information with
regard to their age, gender, marital status, whether they had children, level of education,
current job group, current job designation and current area of work, duration they had been
working in Kenya National Hospital and their affliations to professional groups or
organisations.
4.2.1 Age
The respondents were asked to indicate their age. According to the findings, 48.6% of the
respondents indicated that they were aged between 36 and 40 years, 18.9% indicated were
aged between 41 and 45 years, 10.8% were above 50 years in age, 10.8% were aged between
31 and 35 years, 5.4% were aged between 26 and 30 years, 2.7% were aged between 21 and
25 years and the same percentage were aged between 46 and 50 years. This clearly shows
that most of the respondents were aged between 36 and 40 years.
Figure 4. 2: Response by Age
4.2.2 Gender
The respondents were further asked to indicate their gender. From the findings, as indicated
in figure 4.3, 89.2% of the respondents indicated that they were female, while 10.8%
indicated that they were male. This shows that most of the respondents were female.
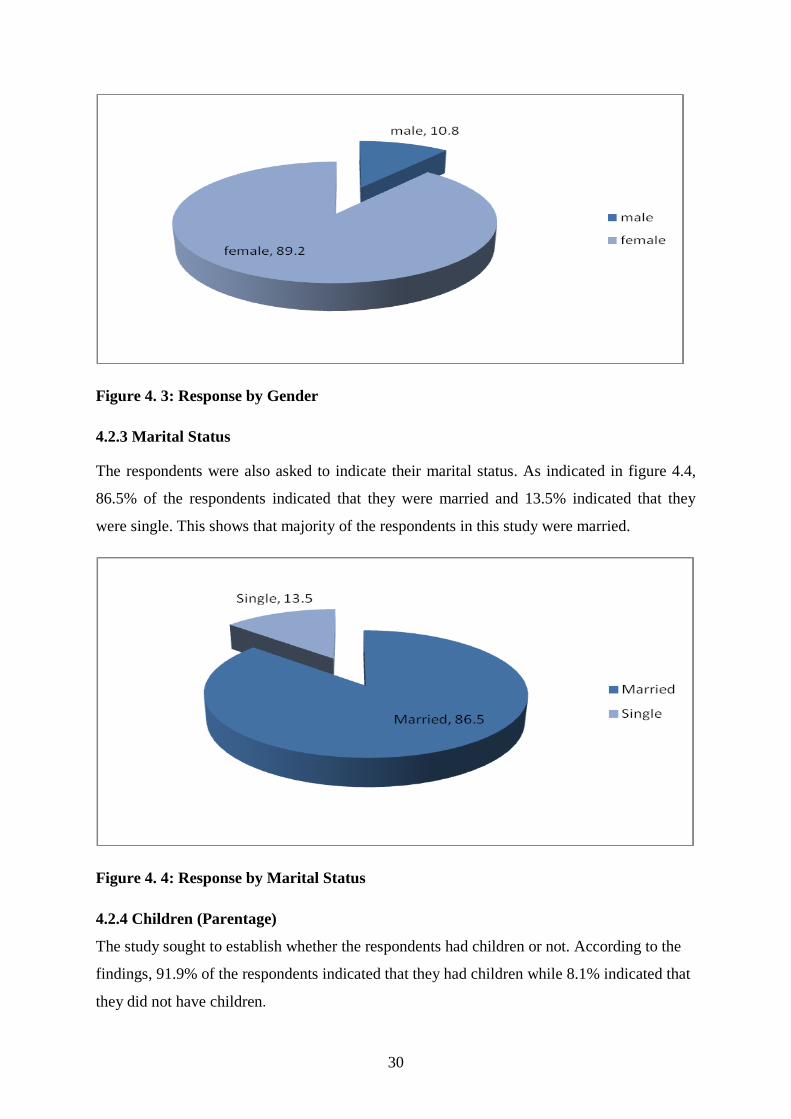
30
Figure 4. 3: Response by Gender
4.2.3 Marital Status
The respondents were also asked to indicate their marital status. As indicated in figure 4.4,
86.5% of the respondents indicated that they were married and 13.5% indicated that they
were single. This shows that majority of the respondents in this study were married.
Figure 4. 4: Response by Marital Status
4.2.4 Children (Parentage)
The study sought to establish whether the respondents had children or not. According to the
findings, 91.9% of the respondents indicated that they had children while 8.1% indicated that
they did not have children.
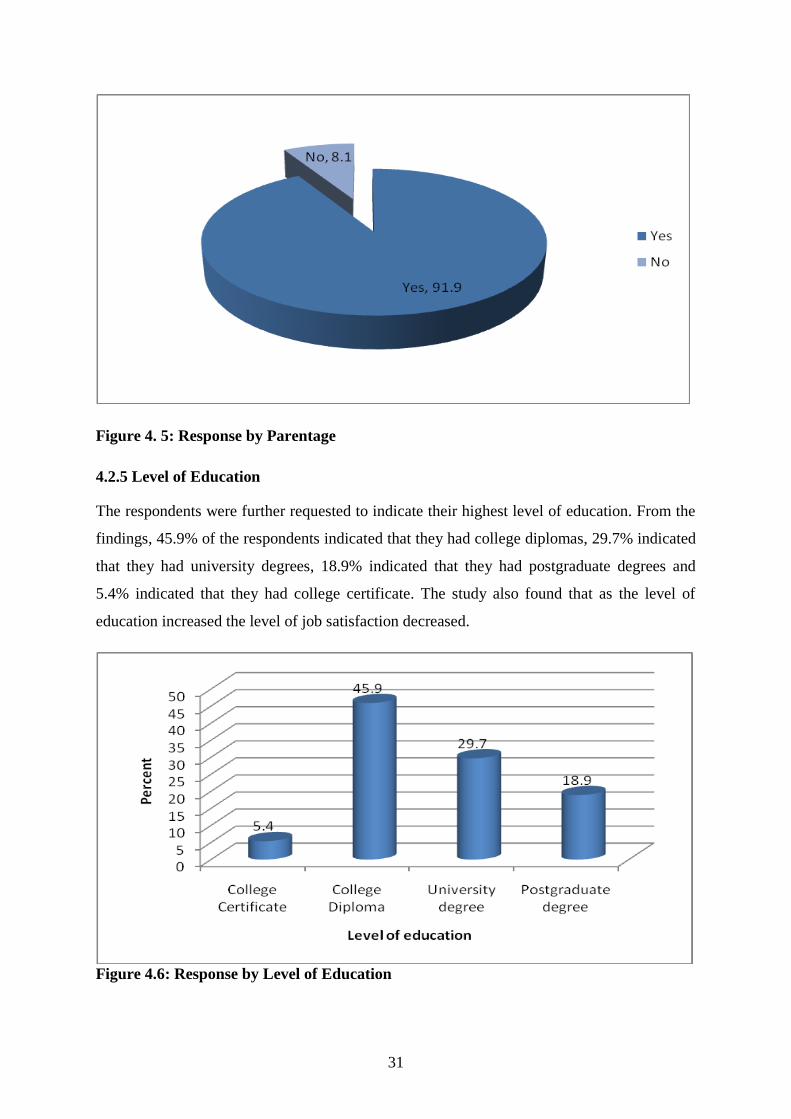
31
Figure 4. 5: Response by Parentage
4.2.5 Level of Education
The respondents were further requested to indicate their highest level of education. From the
findings, 45.9% of the respondents indicated that they had college diplomas, 29.7% indicated
that they had university degrees, 18.9% indicated that they had postgraduate degrees and
5.4% indicated that they had college certificate. The study also found that as the level of
education increased the level of job satisfaction decreased.
Figure 4.6: Response by Level of Education
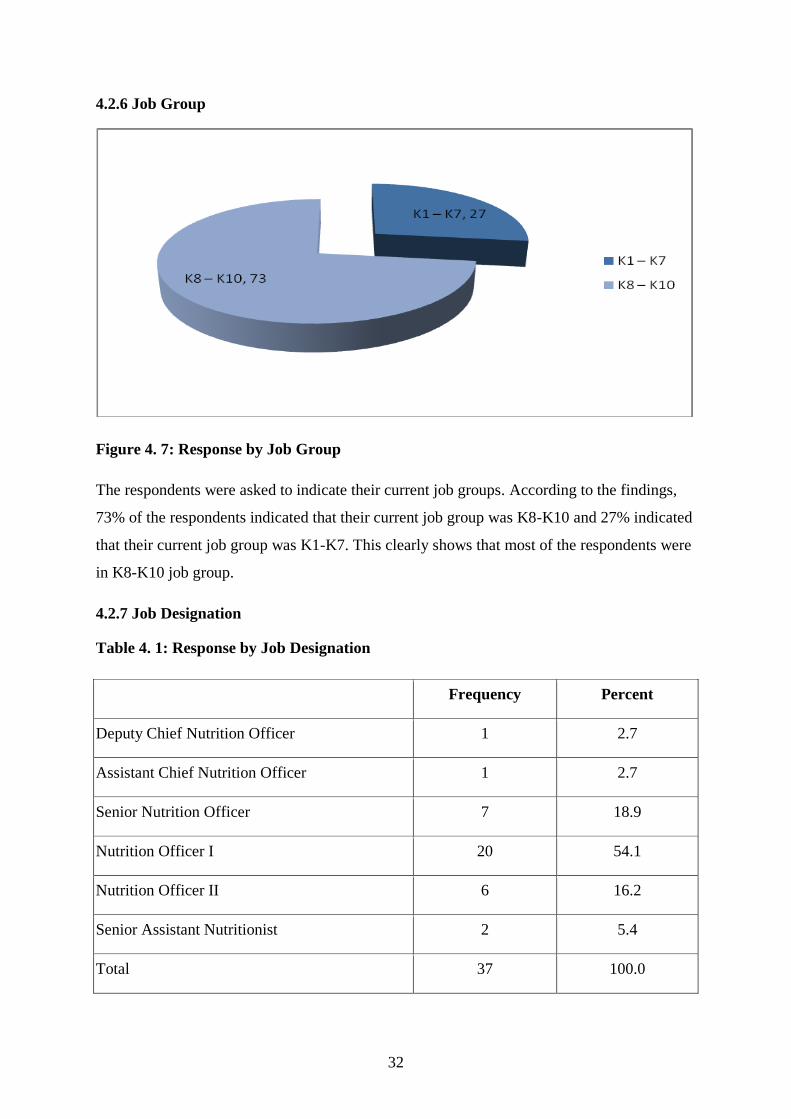
32
4.2.6 Job Group
Figure 4. 7: Response by Job Group
The respondents were asked to indicate their current job groups. According to the findings,
73% of the respondents indicated that their current job group was K8-K10 and 27% indicated
that their current job group was K1-K7. This clearly shows that most of the respondents were
in K8-K10 job group.
4.2.7 Job Designation
Table 4. 1: Response by Job Designation
Frequency Percent
Deputy Chief Nutrition Officer 1 2.7
Assistant Chief Nutrition Officer 1 2.7
Senior Nutrition Officer 7 18.9
Nutrition Officer I 20 54.1
Nutrition Officer II 6 16.2
Senior Assistant Nutritionist 2 5.4
Total 37 100.0
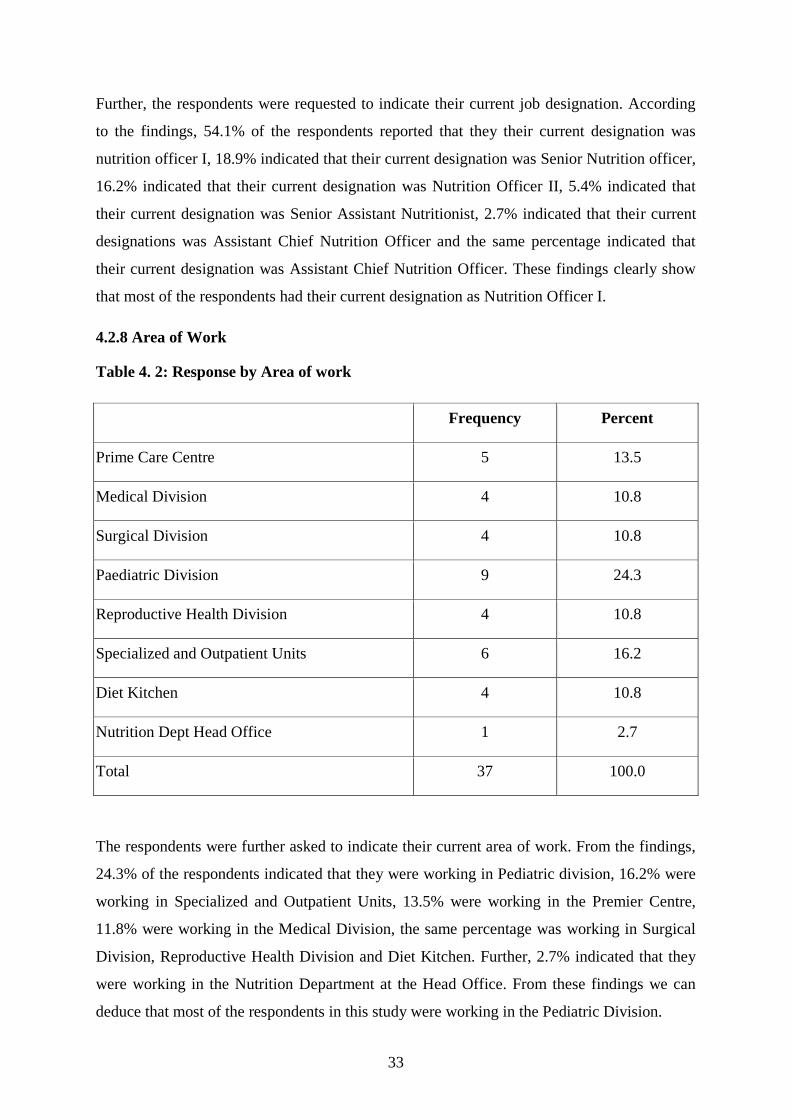
33
Further, the respondents were requested to indicate their current job designation. According
to the findings, 54.1% of the respondents reported that they their current designation was
nutrition officer I, 18.9% indicated that their current designation was Senior Nutrition officer,
16.2% indicated that their current designation was Nutrition Officer II, 5.4% indicated that
their current designation was Senior Assistant Nutritionist, 2.7% indicated that their current
designations was Assistant Chief Nutrition Officer and the same percentage indicated that
their current designation was Assistant Chief Nutrition Officer. These findings clearly show
that most of the respondents had their current designation as Nutrition Officer I.
4.2.8 Area of Work
Table 4. 2: Response by Area of work
Frequency Percent
Prime Care Centre 5 13.5
Medical Division 4 10.8
Surgical Division 4 10.8
Paediatric Division 9 24.3
Reproductive Health Division 4 10.8
Specialized and Outpatient Units 6 16.2
Diet Kitchen 4 10.8
Nutrition Dept Head Office 1 2.7
Total 37 100.0
The respondents were further asked to indicate their current area of work. From the findings,
24.3% of the respondents indicated that they were working in Pediatric division, 16.2% were
working in Specialized and Outpatient Units, 13.5% were working in the Premier Centre,
11.8% were working in the Medical Division, the same percentage was working in Surgical
Division, Reproductive Health Division and Diet Kitchen. Further, 2.7% indicated that they
were working in the Nutrition Department at the Head Office. From these findings we can
deduce that most of the respondents in this study were working in the Pediatric Division.
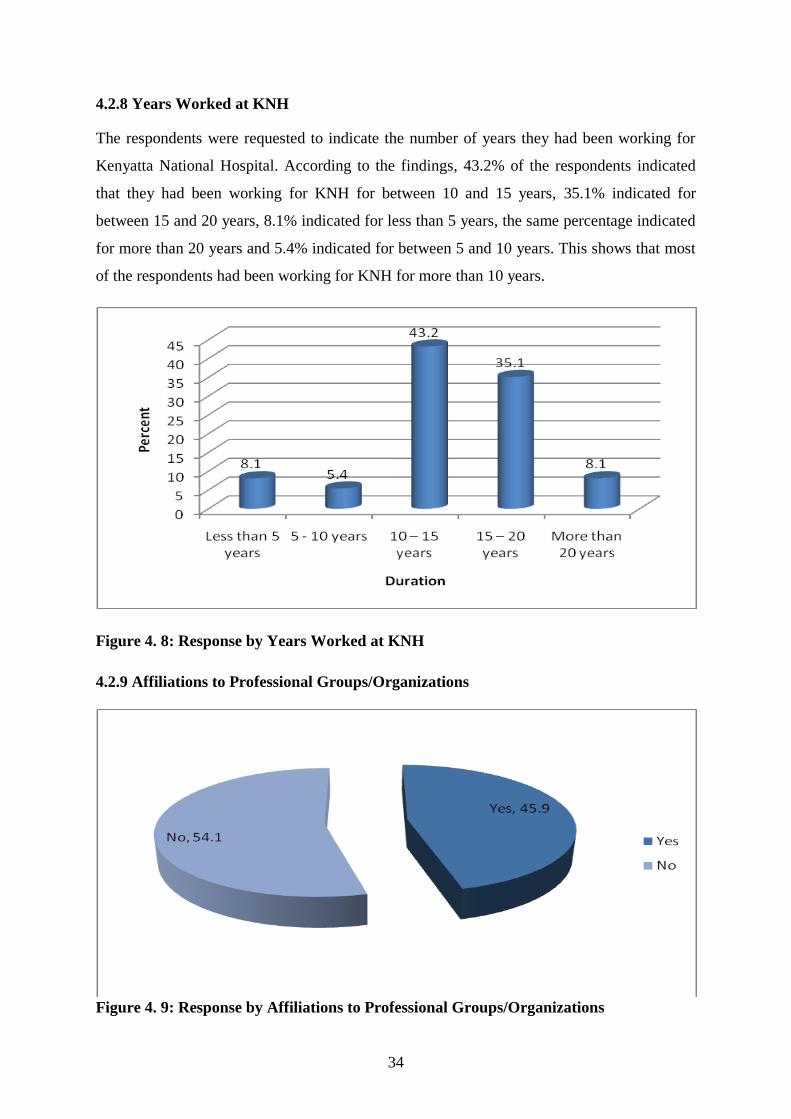
34
4.2.8 Years Worked at KNH
The respondents were requested to indicate the number of years they had been working for
Kenyatta National Hospital. According to the findings, 43.2% of the respondents indicated
that they had been working for KNH for between 10 and 15 years, 35.1% indicated for
between 15 and 20 years, 8.1% indicated for less than 5 years, the same percentage indicated
for more than 20 years and 5.4% indicated for between 5 and 10 years. This shows that most
of the respondents had been working for KNH for more than 10 years.
Figure 4. 8: Response by Years Worked at KNH
4.2.9 Affiliations to Professional Groups/Organizations
Figure 4. 9: Response by Affiliations to Professional Groups/Organizations
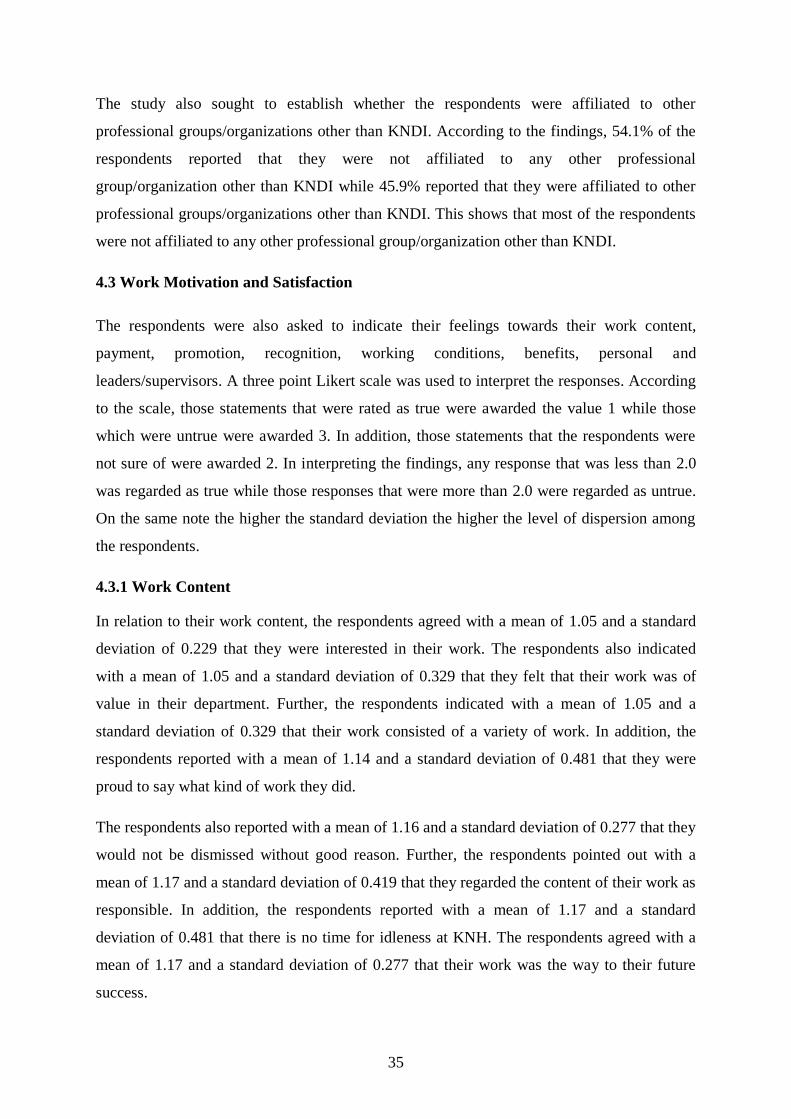
35
The study also sought to establish whether the respondents were affiliated to other
professional groups/organizations other than KNDI. According to the findings, 54.1% of the
respondents reported that they were not affiliated to any other professional
group/organization other than KNDI while 45.9% reported that they were affiliated to other
professional groups/organizations other than KNDI. This shows that most of the respondents
were not affiliated to any other professional group/organization other than KNDI.
4.3 Work Motivation and Satisfaction
The respondents were also asked to indicate their feelings towards their work content,
payment, promotion, recognition, working conditions, benefits, personal and
leaders/supervisors. A three point Likert scale was used to interpret the responses. According
to the scale, those statements that were rated as true were awarded the value 1 while those
which were untrue were awarded 3. In addition, those statements that the respondents were
not sure of were awarded 2. In interpreting the findings, any response that was less than 2.0
was regarded as true while those responses that were more than 2.0 were regarded as untrue.
On the same note the higher the standard deviation the higher the level of dispersion among
the respondents.
4.3.1 Work Content
In relation to their work content, the respondents agreed with a mean of 1.05 and a standard
deviation of 0.229 that they were interested in their work. The respondents also indicated
with a mean of 1.05 and a standard deviation of 0.329 that they felt that their work was of
value in their department. Further, the respondents indicated with a mean of 1.05 and a
standard deviation of 0.329 that their work consisted of a variety of work. In addition, the
respondents reported with a mean of 1.14 and a standard deviation of 0.481 that they were
proud to say what kind of work they did.
The respondents also reported with a mean of 1.16 and a standard deviation of 0.277 that they
would not be dismissed without good reason. Further, the respondents pointed out with a
mean of 1.17 and a standard deviation of 0.419 that they regarded the content of their work as
responsible. In addition, the respondents reported with a mean of 1.17 and a standard
deviation of 0.481 that there is no time for idleness at KNH. The respondents agreed with a
mean of 1.17 and a standard deviation of 0.277 that their work was the way to their future
success.
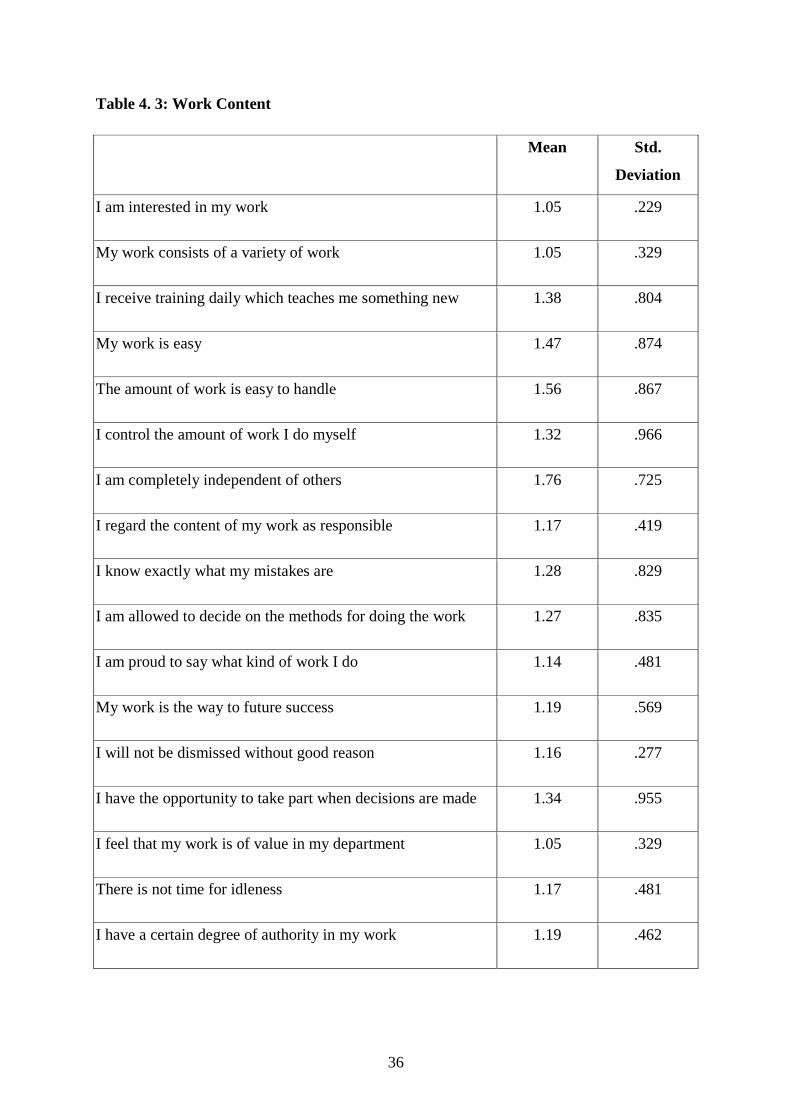
36
Table 4. 3: Work Content
Mean Std.
Deviation
I am interested in my work 1.05 .229
My work consists of a variety of work 1.05 .329
I receive training daily which teaches me something new 1.38 .804
My work is easy 1.47 .874
The amount of work is easy to handle 1.56 .867
I control the amount of work I do myself 1.32 .966
I am completely independent of others 1.76 .725
I regard the content of my work as responsible 1.17 .419
I know exactly what my mistakes are 1.28 .829
I am allowed to decide on the methods for doing the work 1.27 .835
I am proud to say what kind of work I do 1.14 .481
My work is the way to future success 1.19 .569
I will not be dismissed without good reason 1.16 .277
I have the opportunity to take part when decisions are made 1.34 .955
I feel that my work is of value in my department 1.05 .329
There is not time for idleness 1.17 .481
I have a certain degree of authority in my work 1.19 .462
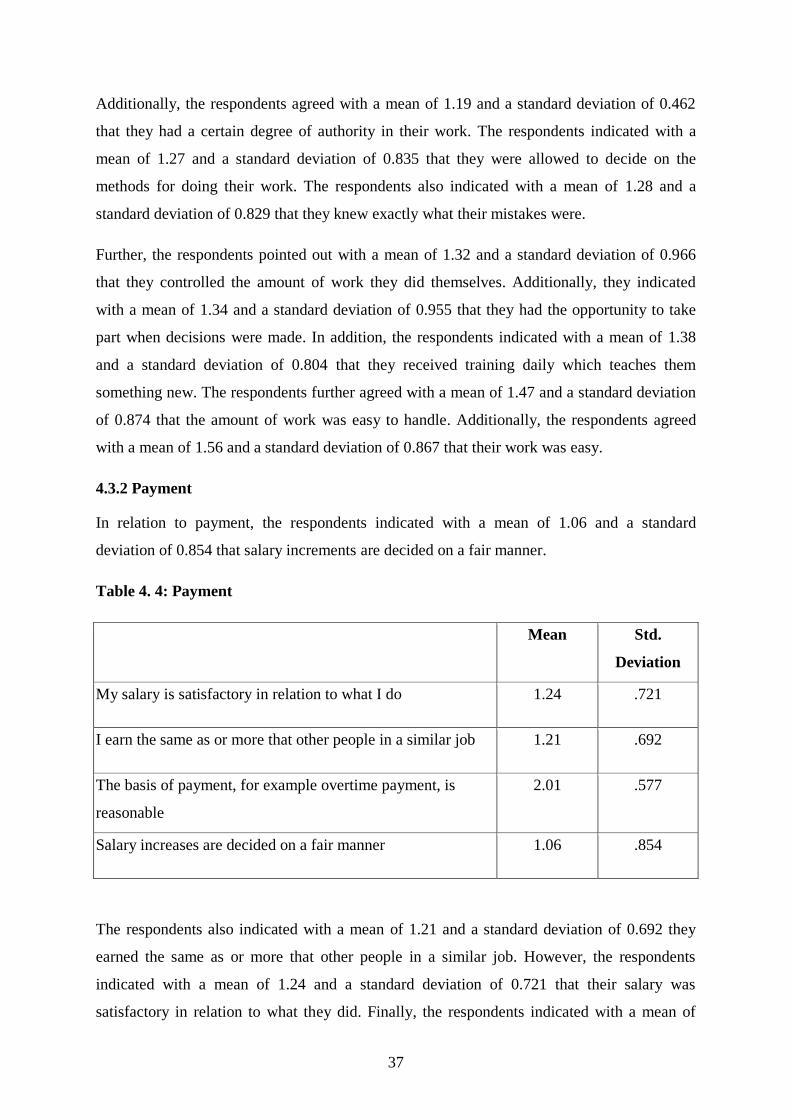
37
Additionally, the respondents agreed with a mean of 1.19 and a standard deviation of 0.462
that they had a certain degree of authority in their work. The respondents indicated with a
mean of 1.27 and a standard deviation of 0.835 that they were allowed to decide on the
methods for doing their work. The respondents also indicated with a mean of 1.28 and a
standard deviation of 0.829 that they knew exactly what their mistakes were.
Further, the respondents pointed out with a mean of 1.32 and a standard deviation of 0.966
that they controlled the amount of work they did themselves. Additionally, they indicated
with a mean of 1.34 and a standard deviation of 0.955 that they had the opportunity to take
part when decisions were made. In addition, the respondents indicated with a mean of 1.38
and a standard deviation of 0.804 that they received training daily which teaches them
something new. The respondents further agreed with a mean of 1.47 and a standard deviation
of 0.874 that the amount of work was easy to handle. Additionally, the respondents agreed
with a mean of 1.56 and a standard deviation of 0.867 that their work was easy.
4.3.2 Payment
In relation to payment, the respondents indicated with a mean of 1.06 and a standard
deviation of 0.854 that salary increments are decided on a fair manner.
Table 4. 4: Payment
Mean Std.
Deviation
My salary is satisfactory in relation to what I do 1.24 .721
I earn the same as or more that other people in a similar job 1.21 .692
The basis of payment, for example overtime payment, is
reasonable
2.01 .577
Salary increases are decided on a fair manner 1.06 .854
The respondents also indicated with a mean of 1.21 and a standard deviation of 0.692 they
earned the same as or more that other people in a similar job. However, the respondents
indicated with a mean of 1.24 and a standard deviation of 0.721 that their salary was
satisfactory in relation to what they did. Finally, the respondents indicated with a mean of
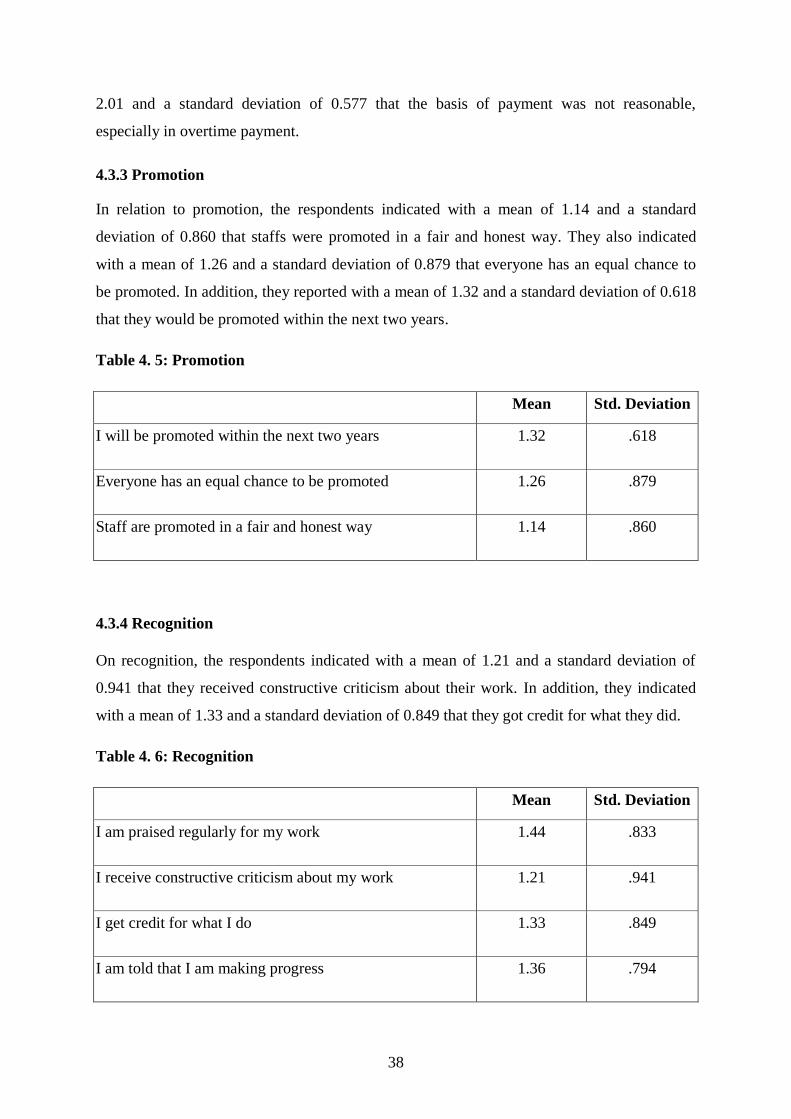
38
2.01 and a standard deviation of 0.577 that the basis of payment was not reasonable,
especially in overtime payment.
4.3.3 Promotion
In relation to promotion, the respondents indicated with a mean of 1.14 and a standard
deviation of 0.860 that staffs were promoted in a fair and honest way. They also indicated
with a mean of 1.26 and a standard deviation of 0.879 that everyone has an equal chance to
be promoted. In addition, they reported with a mean of 1.32 and a standard deviation of 0.618
that they would be promoted within the next two years.
Table 4. 5: Promotion
Mean Std. Deviation
I will be promoted within the next two years 1.32 .618
Everyone has an equal chance to be promoted 1.26 .879
Staff are promoted in a fair and honest way 1.14 .860
4.3.4 Recognition
On recognition, the respondents indicated with a mean of 1.21 and a standard deviation of
0.941 that they received constructive criticism about their work. In addition, they indicated
with a mean of 1.33 and a standard deviation of 0.849 that they got credit for what they did.
Table 4. 6: Recognition
Mean Std. Deviation
I am praised regularly for my work 1.44 .833
I receive constructive criticism about my work 1.21 .941
I get credit for what I do 1.33 .849
I am told that I am making progress 1.36 .794
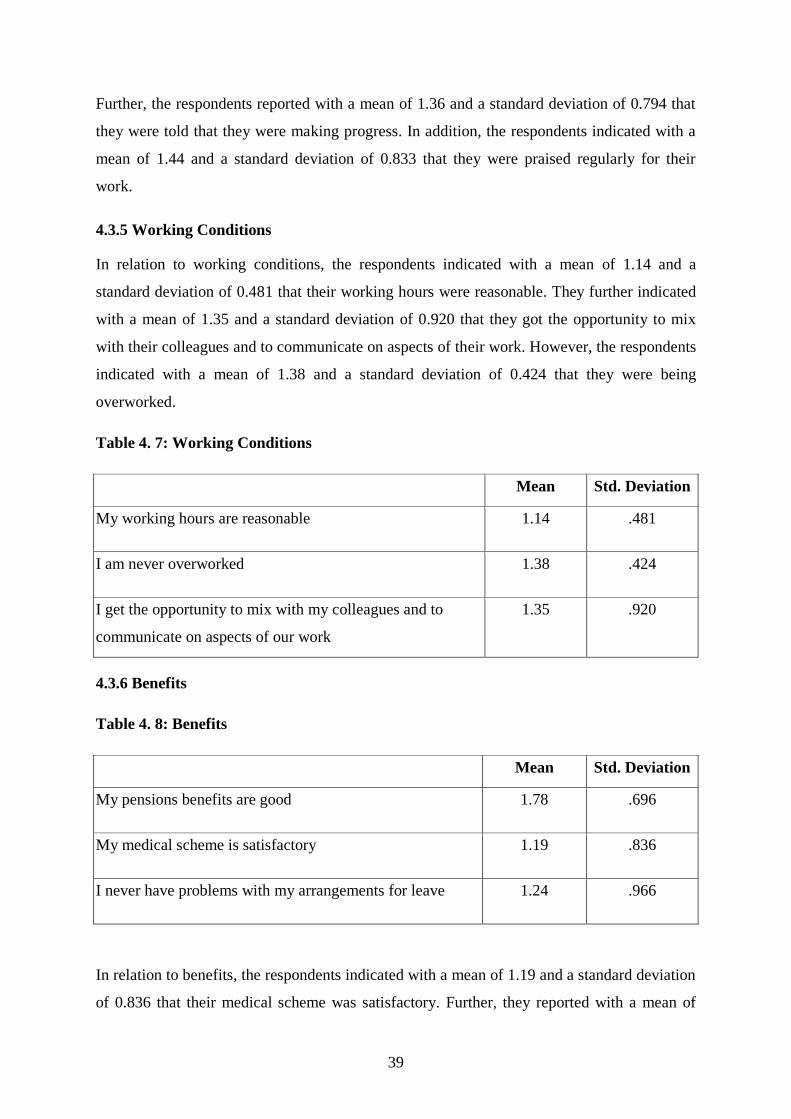
39
Further, the respondents reported with a mean of 1.36 and a standard deviation of 0.794 that
they were told that they were making progress. In addition, the respondents indicated with a
mean of 1.44 and a standard deviation of 0.833 that they were praised regularly for their
work.
4.3.5 Working Conditions
In relation to working conditions, the respondents indicated with a mean of 1.14 and a
standard deviation of 0.481 that their working hours were reasonable. They further indicated
with a mean of 1.35 and a standard deviation of 0.920 that they got the opportunity to mix
with their colleagues and to communicate on aspects of their work. However, the respondents
indicated with a mean of 1.38 and a standard deviation of 0.424 that they were being
overworked.
Table 4. 7: Working Conditions
Mean Std. Deviation
My working hours are reasonable 1.14 .481
I am never overworked 1.38 .424
I get the opportunity to mix with my colleagues and to
communicate on aspects of our work
1.35 .920
4.3.6 Benefits
Table 4. 8: Benefits
Mean Std. Deviation
My pensions benefits are good 1.78 .696
My medical scheme is satisfactory 1.19 .836
I never have problems with my arrangements for leave 1.24 .966
In relation to benefits, the respondents indicated with a mean of 1.19 and a standard deviation
of 0.836 that their medical scheme was satisfactory. Further, they reported with a mean of
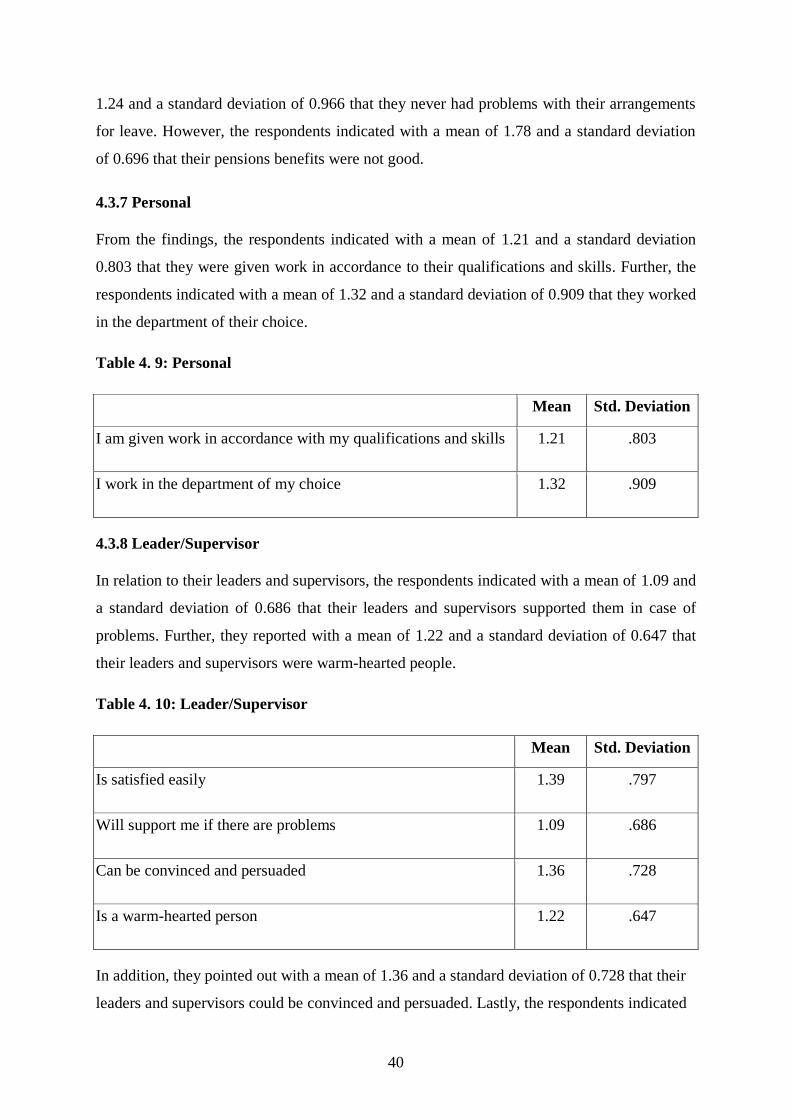
40
1.24 and a standard deviation of 0.966 that they never had problems with their arrangements
for leave. However, the respondents indicated with a mean of 1.78 and a standard deviation
of 0.696 that their pensions benefits were not good.
4.3.7 Personal
From the findings, the respondents indicated with a mean of 1.21 and a standard deviation
0.803 that they were given work in accordance to their qualifications and skills. Further, the
respondents indicated with a mean of 1.32 and a standard deviation of 0.909 that they worked
in the department of their choice.
Table 4. 9: Personal
Mean Std. Deviation
I am given work in accordance with my qualifications and skills 1.21 .803
I work in the department of my choice 1.32 .909
4.3.8 Leader/Supervisor
In relation to their leaders and supervisors, the respondents indicated with a mean of 1.09 and
a standard deviation of 0.686 that their leaders and supervisors supported them in case of
problems. Further, they reported with a mean of 1.22 and a standard deviation of 0.647 that
their leaders and supervisors were warm-hearted people.
Table 4. 10: Leader/Supervisor
Mean Std. Deviation
Is satisfied easily 1.39 .797
Will support me if there are problems 1.09 .686
Can be convinced and persuaded 1.36 .728
Is a warm-hearted person 1.22 .647
In addition, they pointed out with a mean of 1.36 and a standard deviation of 0.728 that their
leaders and supervisors could be convinced and persuaded. Lastly, the respondents indicated
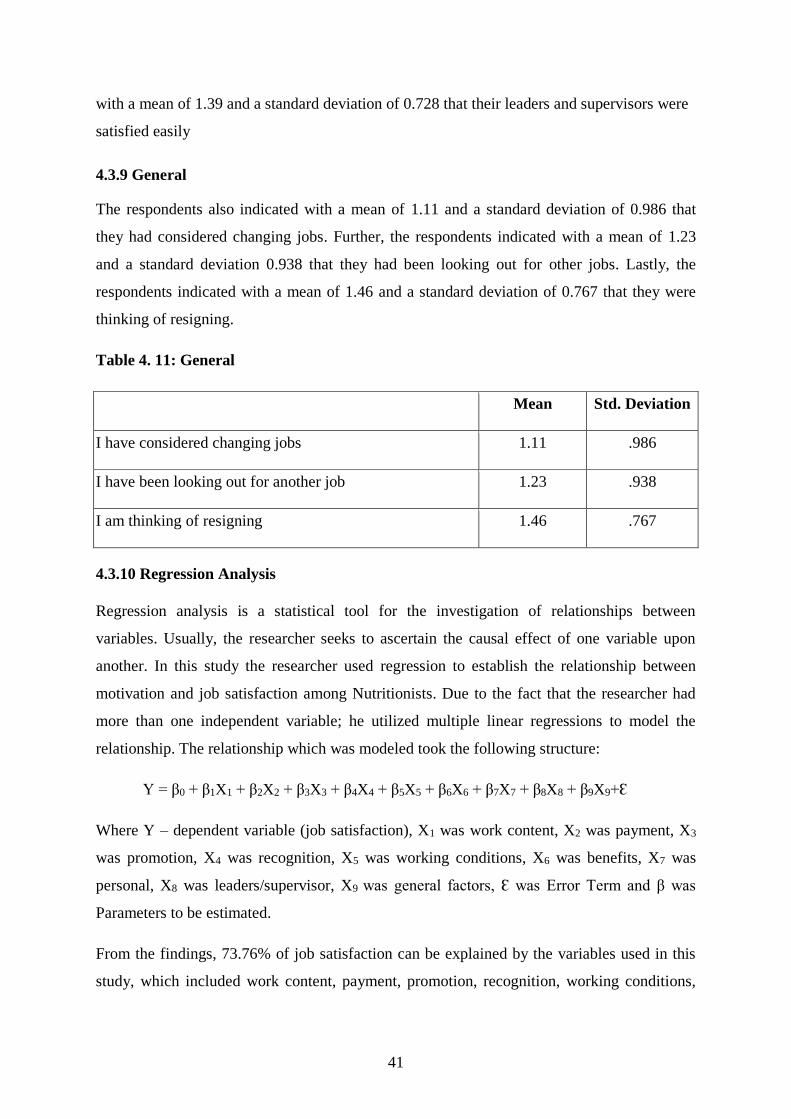
41
with a mean of 1.39 and a standard deviation of 0.728 that their leaders and supervisors were
satisfied easily
4.3.9 General
The respondents also indicated with a mean of 1.11 and a standard deviation of 0.986 that
they had considered changing jobs. Further, the respondents indicated with a mean of 1.23
and a standard deviation 0.938 that they had been looking out for other jobs. Lastly, the
respondents indicated with a mean of 1.46 and a standard deviation of 0.767 that they were
thinking of resigning.
Table 4. 11: General
Mean Std. Deviation
I have considered changing jobs 1.11 .986
I have been looking out for another job 1.23 .938
I am thinking of resigning 1.46 .767
4.3.10 Regression Analysis
Regression analysis is a statistical tool for the investigation of relationships between
variables. Usually, the researcher seeks to ascertain the causal effect of one variable upon
another. In this study the researcher used regression to establish the relationship between
motivation and job satisfaction among Nutritionists. Due to the fact that the researcher had
more than one independent variable; he utilized multiple linear regressions to model the
relationship. The relationship which was modeled took the following structure:
Y = β0 + β1X1 + β2X2 + β3X3 + β4X4 + β5X5 + β6X6 + β7X7 + β8X8 + β9X9+Ɛ
Where Y – dependent variable (job satisfaction), X1 was work content, X2 was payment, X3
was promotion, X4 was recognition, X5 was working conditions, X6 was benefits, X7 was
personal, X8 was leaders/supervisor, X9 was general factors, Ɛ was Error Term and β was
Parameters to be estimated.
From the findings, 73.76% of job satisfaction can be explained by the variables used in this
study, which included work content, payment, promotion, recognition, working conditions,
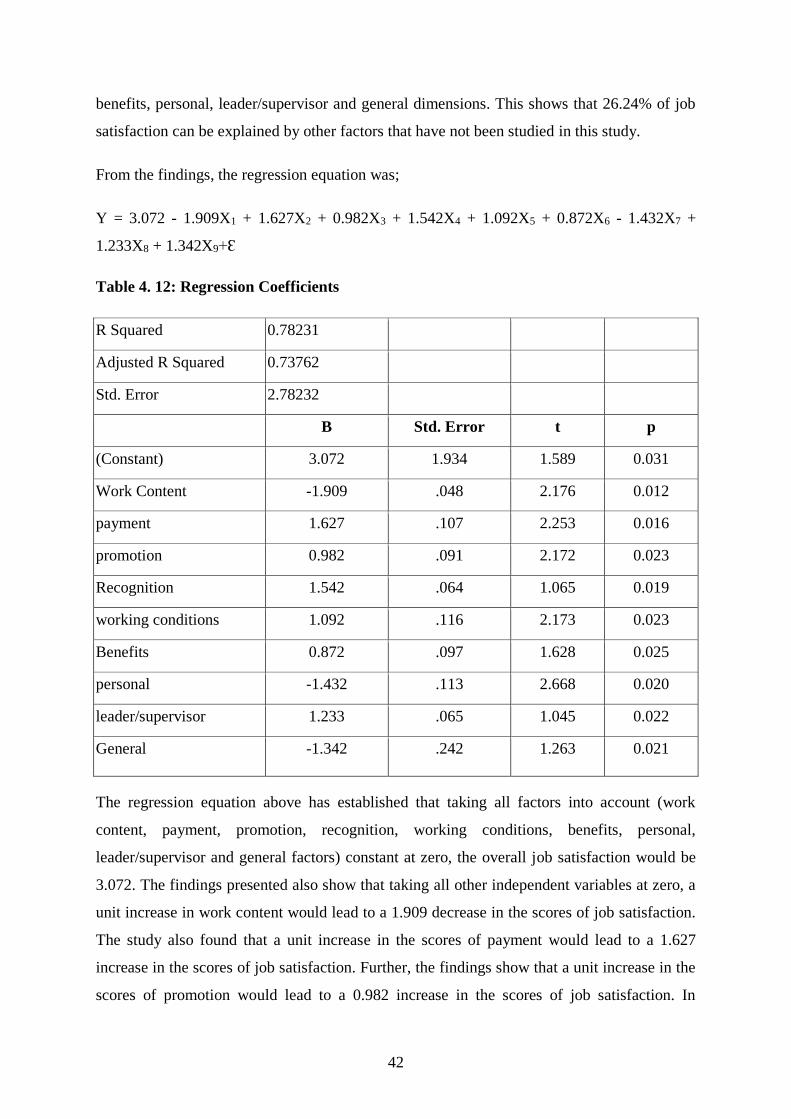
42
benefits, personal, leader/supervisor and general dimensions. This shows that 26.24% of job
satisfaction can be explained by other factors that have not been studied in this study.
From the findings, the regression equation was;
Y = 3.072 - 1.909X1 + 1.627X2 + 0.982X3 + 1.542X4 + 1.092X5 + 0.872X6 - 1.432X7 +
1.233X8 + 1.342X9+Ɛ
Table 4. 12: Regression Coefficients
R Squared 0.78231
Adjusted R Squared 0.73762
Std. Error 2.78232
B Std. Error t p
(Constant) 3.072 1.934 1.589 0.031
Work Content -1.909 .048 2.176 0.012
payment 1.627 .107 2.253 0.016
promotion 0.982 .091 2.172 0.023
Recognition 1.542 .064 1.065 0.019
working conditions 1.092 .116 2.173 0.023
Benefits 0.872 .097 1.628 0.025
personal -1.432 .113 2.668 0.020
leader/supervisor 1.233 .065 1.045 0.022
General -1.342 .242 1.263 0.021
The regression equation above has established that taking all factors into account (work
content, payment, promotion, recognition, working conditions, benefits, personal,
leader/supervisor and general factors) constant at zero, the overall job satisfaction would be
3.072. The findings presented also show that taking all other independent variables at zero, a
unit increase in work content would lead to a 1.909 decrease in the scores of job satisfaction.
The study also found that a unit increase in the scores of payment would lead to a 1.627
increase in the scores of job satisfaction. Further, the findings show that a unit increase in the
scores of promotion would lead to a 0.982 increase in the scores of job satisfaction. In
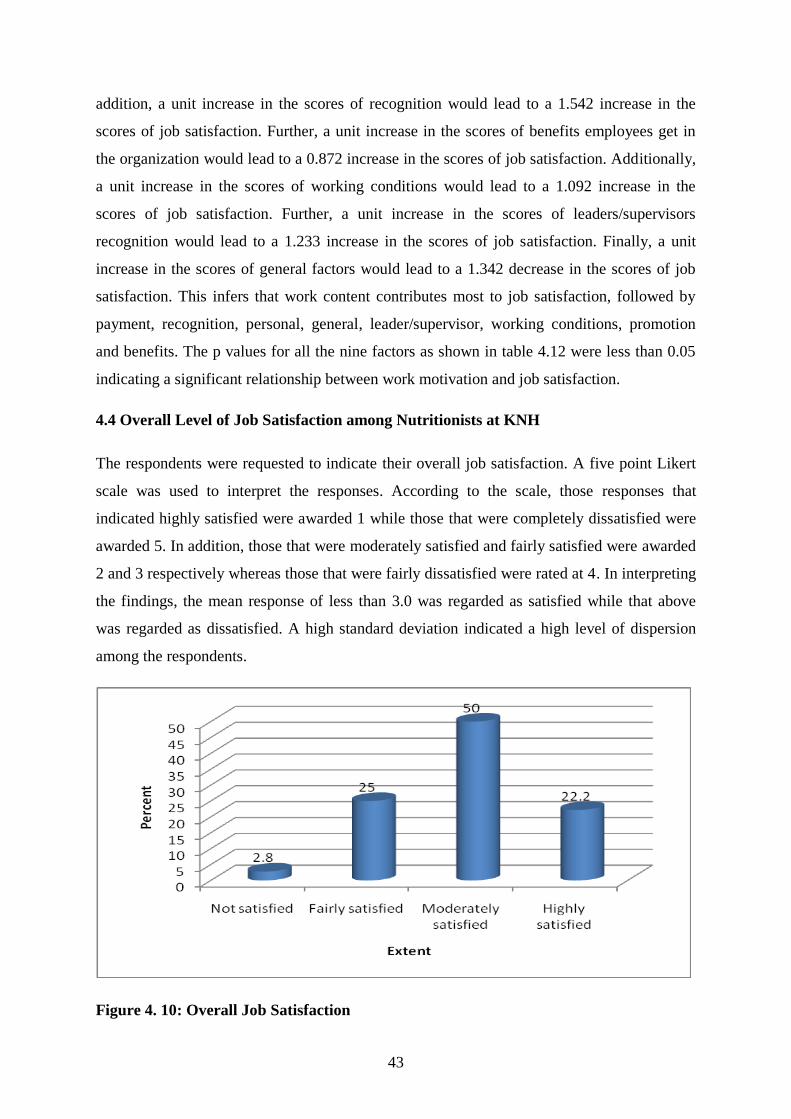
43
addition, a unit increase in the scores of recognition would lead to a 1.542 increase in the
scores of job satisfaction. Further, a unit increase in the scores of benefits employees get in
the organization would lead to a 0.872 increase in the scores of job satisfaction. Additionally,
a unit increase in the scores of working conditions would lead to a 1.092 increase in the
scores of job satisfaction. Further, a unit increase in the scores of leaders/supervisors
recognition would lead to a 1.233 increase in the scores of job satisfaction. Finally, a unit
increase in the scores of general factors would lead to a 1.342 decrease in the scores of job
satisfaction. This infers that work content contributes most to job satisfaction, followed by
payment, recognition, personal, general, leader/supervisor, working conditions, promotion
and benefits. The p values for all the nine factors as shown in table 4.12 were less than 0.05
indicating a significant relationship between work motivation and job satisfaction.
4.4 Overall Level of Job Satisfaction among Nutritionists at KNH
The respondents were requested to indicate their overall job satisfaction. A five point Likert
scale was used to interpret the responses. According to the scale, those responses that
indicated highly satisfied were awarded 1 while those that were completely dissatisfied were
awarded 5. In addition, those that were moderately satisfied and fairly satisfied were awarded
2 and 3 respectively whereas those that were fairly dissatisfied were rated at 4. In interpreting
the findings, the mean response of less than 3.0 was regarded as satisfied while that above
was regarded as dissatisfied. A high standard deviation indicated a high level of dispersion
among the respondents.
Figure 4. 10: Overall Job Satisfaction
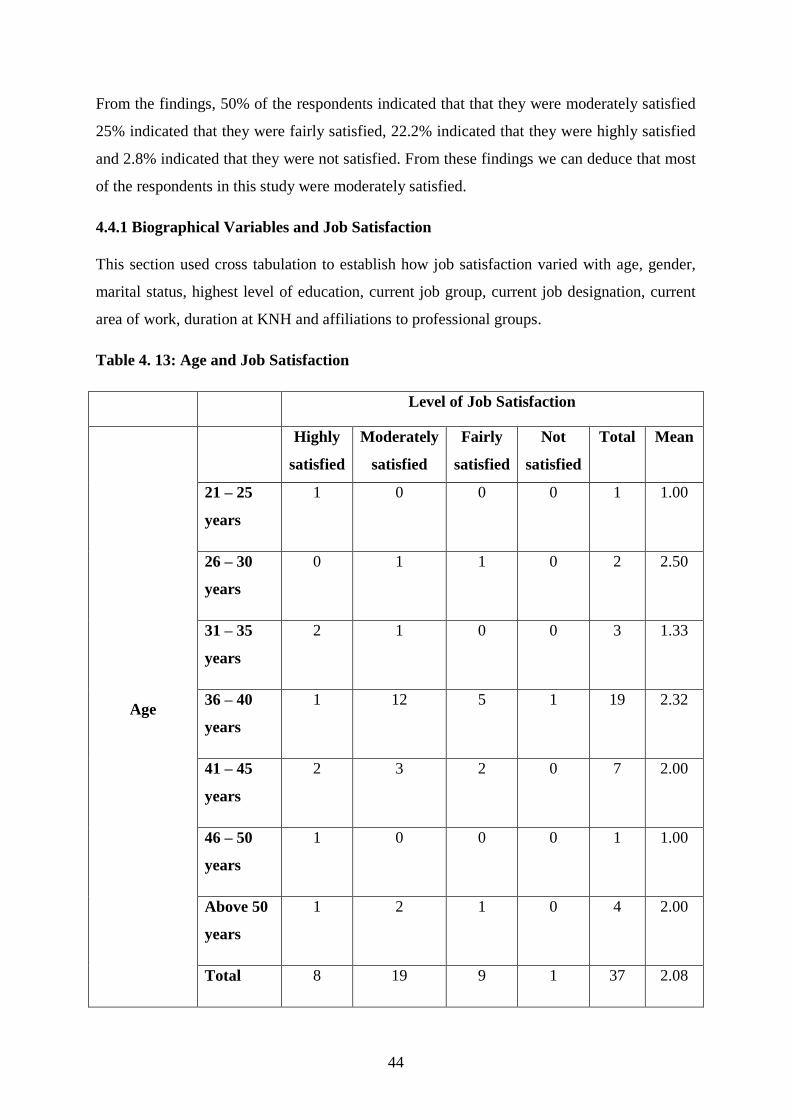
44
From the findings, 50% of the respondents indicated that that they were moderately satisfied
25% indicated that they were fairly satisfied, 22.2% indicated that they were highly satisfied
and 2.8% indicated that they were not satisfied. From these findings we can deduce that most
of the respondents in this study were moderately satisfied.
4.4.1 Biographical Variables and Job Satisfaction
This section used cross tabulation to establish how job satisfaction varied with age, gender,
marital status, highest level of education, current job group, current job designation, current
area of work, duration at KNH and affiliations to professional groups.
Table 4. 13: Age and Job Satisfaction
Level of Job Satisfaction
Age
Highly
satisfied
Moderately
satisfied
Fairly
satisfied
Not
satisfied
Total Mean
21 – 25
years
1 0 0 0 1 1.00
26 – 30
years
0 1 1 0 2 2.50
31 – 35
years
2 1 0 0 3 1.33
36 – 40
years
1 12 5 1 19 2.32
41 – 45
years
2 3 2 0 7 2.00
46 – 50
years
1 0 0 0 1 1.00
Above 50
years
1 2 1 0 4 2.00
Total 8 19 9 1 37 2.08
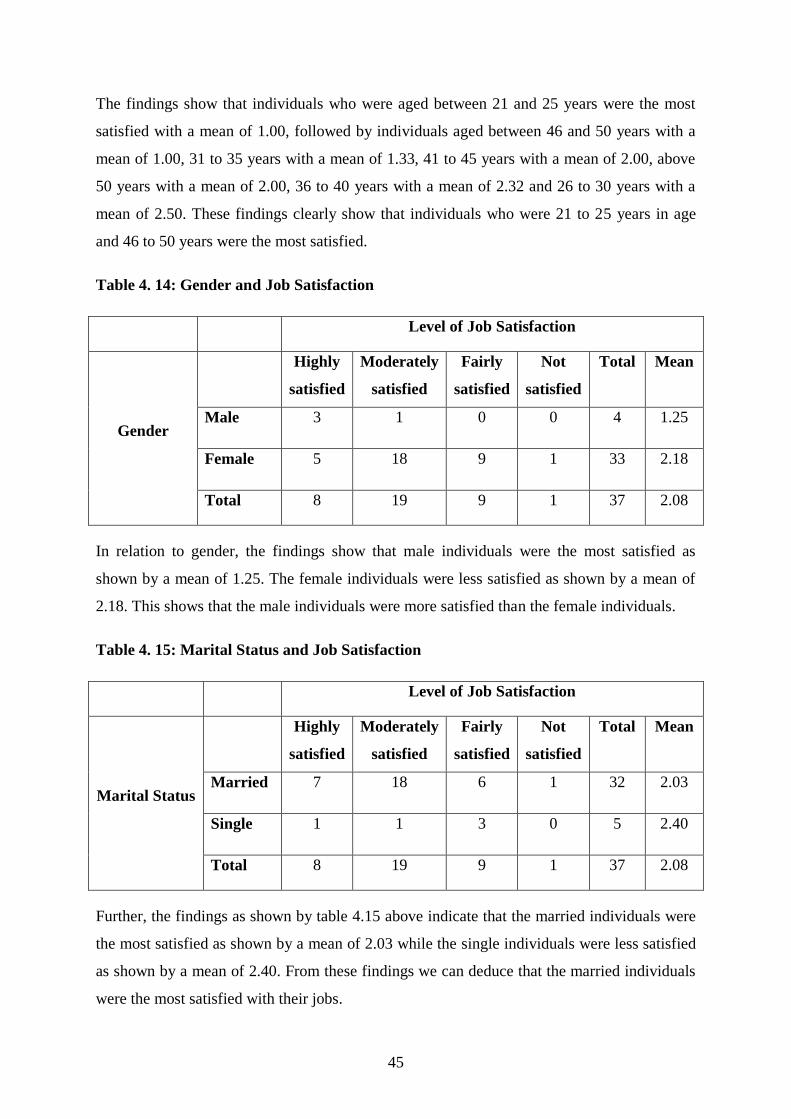
45
The findings show that individuals who were aged between 21 and 25 years were the most
satisfied with a mean of 1.00, followed by individuals aged between 46 and 50 years with a
mean of 1.00, 31 to 35 years with a mean of 1.33, 41 to 45 years with a mean of 2.00, above
50 years with a mean of 2.00, 36 to 40 years with a mean of 2.32 and 26 to 30 years with a
mean of 2.50. These findings clearly show that individuals who were 21 to 25 years in age
and 46 to 50 years were the most satisfied.
Table 4. 14: Gender and Job Satisfaction
Level of Job Satisfaction
Gender
Highly
satisfied
Moderately
satisfied
Fairly
satisfied
Not
satisfied
Total Mean
Male 3 1 0 0 4 1.25
Female 5 18 9 1 33 2.18
Total 8 19 9 1 37 2.08
In relation to gender, the findings show that male individuals were the most satisfied as
shown by a mean of 1.25. The female individuals were less satisfied as shown by a mean of
2.18. This shows that the male individuals were more satisfied than the female individuals.
Table 4. 15: Marital Status and Job Satisfaction
Level of Job Satisfaction
Marital Status
Highly
satisfied
Moderately
satisfied
Fairly
satisfied
Not
satisfied
Total Mean
Married 7 18 6 1 32 2.03
Single 1 1 3 0 5 2.40
Total 8 19 9 1 37 2.08
Further, the findings as shown by table 4.15 above indicate that the married individuals were
the most satisfied as shown by a mean of 2.03 while the single individuals were less satisfied
as shown by a mean of 2.40. From these findings we can deduce that the married individuals
were the most satisfied with their jobs.
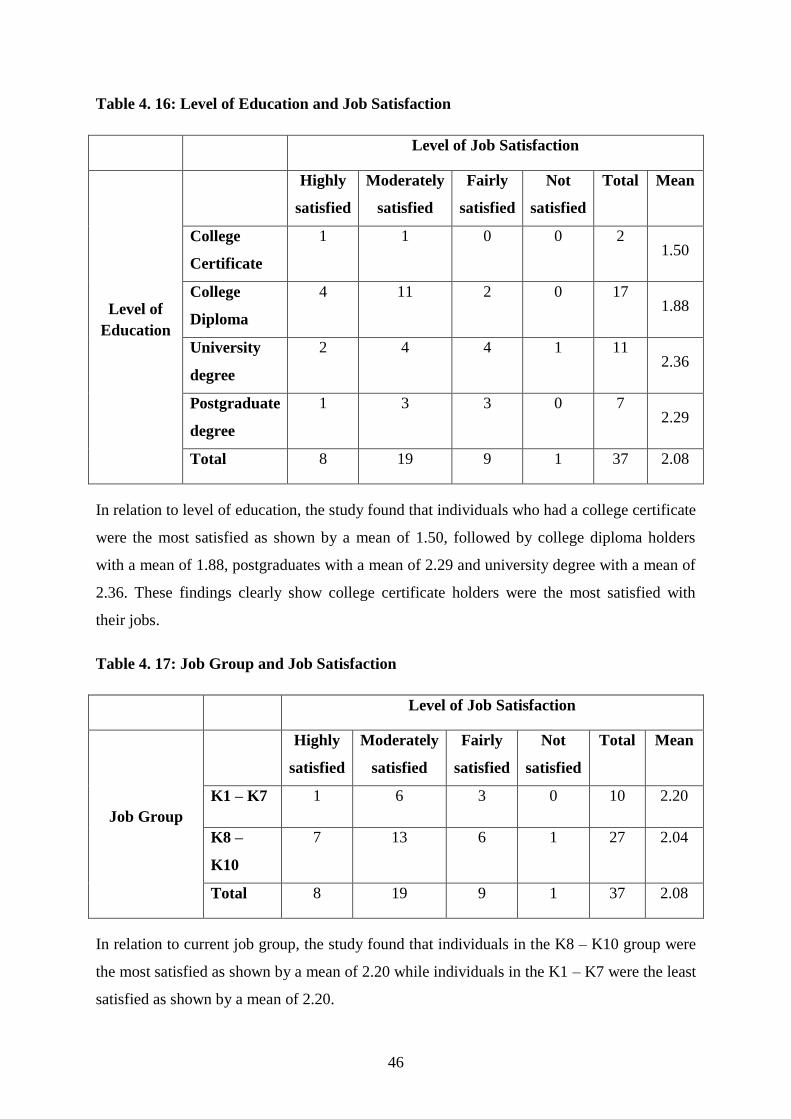
46
Table 4. 16: Level of Education and Job Satisfaction
Level of Job Satisfaction
Level of
Education
Highly
satisfied
Moderately
satisfied
Fairly
satisfied
Not
satisfied
Total Mean
College
Certificate
1 1 0 0 2 1.50
College
Diploma
4 11 2 0 17 1.88
University
degree
2 4 4 1 11 2.36
Postgraduate
degree
1 3 3 0 7 2.29
Total 8 19 9 1 37 2.08
In relation to level of education, the study found that individuals who had a college certificate
were the most satisfied as shown by a mean of 1.50, followed by college diploma holders
with a mean of 1.88, postgraduates with a mean of 2.29 and university degree with a mean of
2.36. These findings clearly show college certificate holders were the most satisfied with
their jobs.
Table 4. 17: Job Group and Job Satisfaction
Level of Job Satisfaction
Job Group
Highly
satisfied
Moderately
satisfied
Fairly
satisfied
Not
satisfied
Total Mean
K1 – K7 1 6 3 0 10 2.20
K8 –
K10
7 13 6 1 27 2.04
Total 8 19 9 1 37 2.08
In relation to current job group, the study found that individuals in the K8 – K10 group were
the most satisfied as shown by a mean of 2.20 while individuals in the K1 – K7 were the least
satisfied as shown by a mean of 2.20.
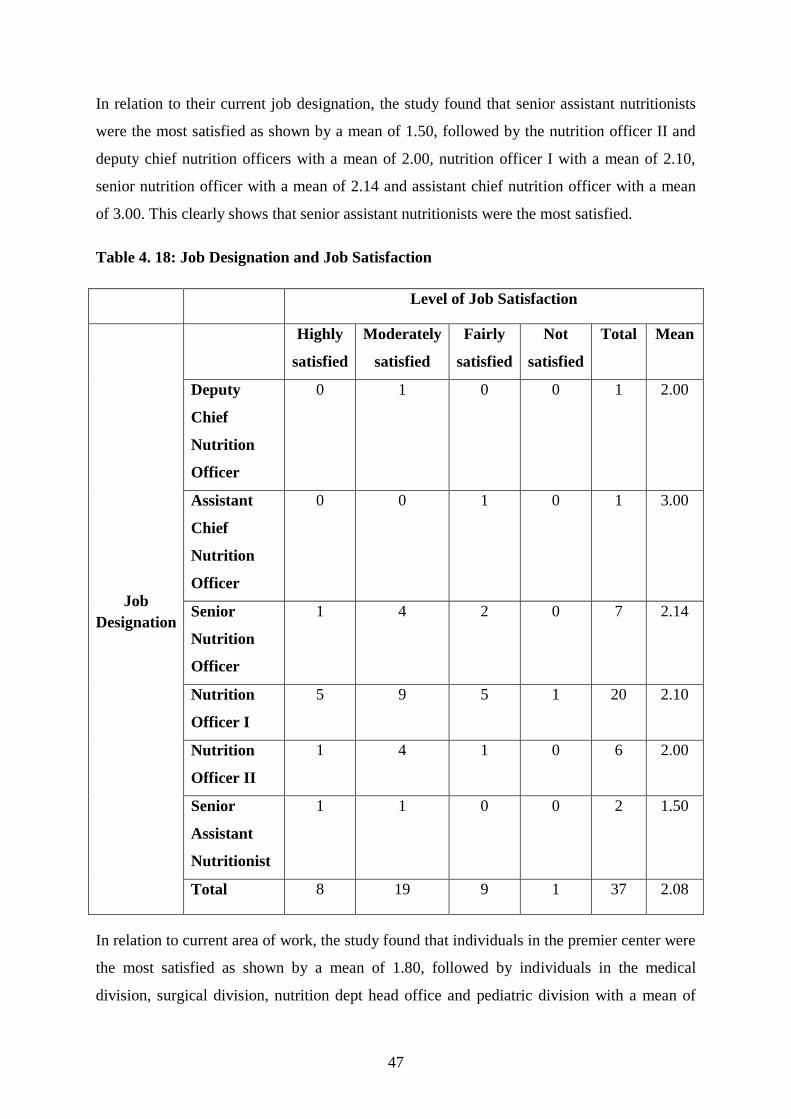
47
In relation to their current job designation, the study found that senior assistant nutritionists
were the most satisfied as shown by a mean of 1.50, followed by the nutrition officer II and
deputy chief nutrition officers with a mean of 2.00, nutrition officer I with a mean of 2.10,
senior nutrition officer with a mean of 2.14 and assistant chief nutrition officer with a mean
of 3.00. This clearly shows that senior assistant nutritionists were the most satisfied.
Table 4. 18: Job Designation and Job Satisfaction
Level of Job Satisfaction
Job
Designation
Highly
satisfied
Moderately
satisfied
Fairly
satisfied
Not
satisfied
Total Mean
Deputy
Chief
Nutrition
Officer
0 1 0 0 1 2.00
Assistant
Chief
Nutrition
Officer
0 0 1 0 1 3.00
Senior
Nutrition
Officer
1 4 2 0 7 2.14
Nutrition
Officer I
5 9 5 1 20 2.10
Nutrition
Officer II
1 4 1 0 6 2.00
Senior
Assistant
Nutritionist
1 1 0 0 2 1.50
Total 8 19 9 1 37 2.08
In relation to current area of work, the study found that individuals in the premier center were
the most satisfied as shown by a mean of 1.80, followed by individuals in the medical
division, surgical division, nutrition dept head office and pediatric division with a mean of
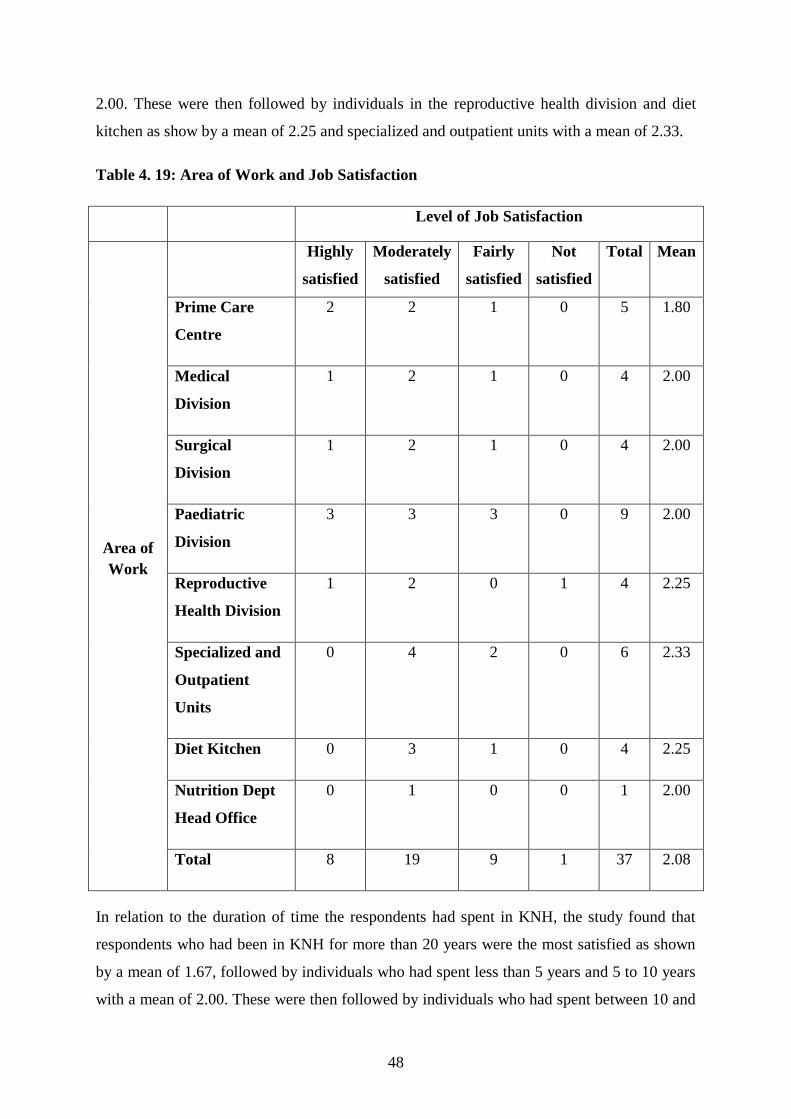
48
2.00. These were then followed by individuals in the reproductive health division and diet
kitchen as show by a mean of 2.25 and specialized and outpatient units with a mean of 2.33.
Table 4. 19: Area of Work and Job Satisfaction
Level of Job Satisfaction
Area of
Work
Highly
satisfied
Moderately
satisfied
Fairly
satisfied
Not
satisfied
Total Mean
Prime Care
Centre
2 2 1 0 5 1.80
Medical
Division
1 2 1 0 4 2.00
Surgical
Division
1 2 1 0 4 2.00
Paediatric
Division
3 3 3 0 9 2.00
Reproductive
Health Division
1 2 0 1 4 2.25
Specialized and
Outpatient
Units
0 4 2 0 6 2.33
Diet Kitchen 0 3 1 0 4 2.25
Nutrition Dept
Head Office
0 1 0 0 1 2.00
Total 8 19 9 1 37 2.08
In relation to the duration of time the respondents had spent in KNH, the study found that
respondents who had been in KNH for more than 20 years were the most satisfied as shown
by a mean of 1.67, followed by individuals who had spent less than 5 years and 5 to 10 years
with a mean of 2.00. These were then followed by individuals who had spent between 10 and
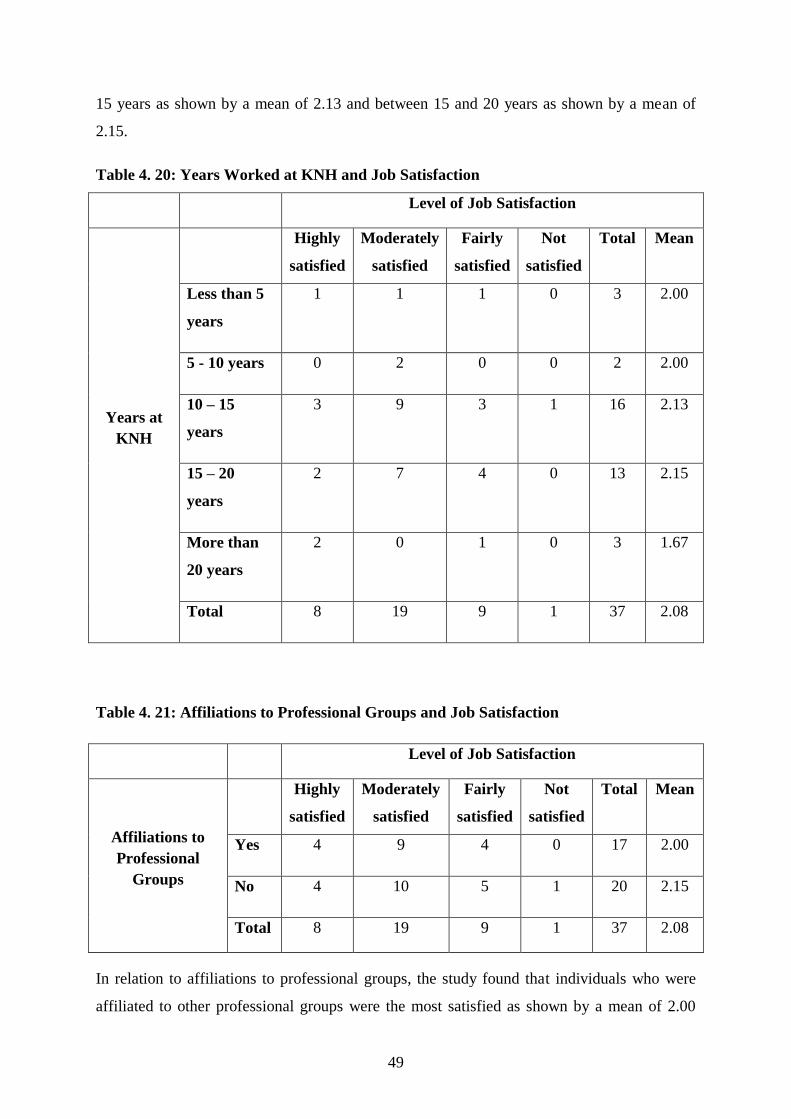
49
15 years as shown by a mean of 2.13 and between 15 and 20 years as shown by a mean of
2.15.
Table 4. 20: Years Worked at KNH and Job Satisfaction
Level of Job Satisfaction
Years at
KNH
Highly
satisfied
Moderately
satisfied
Fairly
satisfied
Not
satisfied
Total Mean
Less than 5
years
1 1 1 0 3 2.00
5 - 10 years 0 2 0 0 2 2.00
10 – 15
years
3 9 3 1 16 2.13
15 – 20
years
2 7 4 0 13 2.15
More than
20 years
2 0 1 0 3 1.67
Total 8 19 9 1 37 2.08
Table 4. 21: Affiliations to Professional Groups and Job Satisfaction
Level of Job Satisfaction
Affiliations to
Professional
Groups
Highly
satisfied
Moderately
satisfied
Fairly
satisfied
Not
satisfied
Total Mean
Yes 4 9 4 0 17 2.00
No 4 10 5 1 20 2.15
Total 8 19 9 1 37 2.08
In relation to affiliations to professional groups, the study found that individuals who were
affiliated to other professional groups were the most satisfied as shown by a mean of 2.00
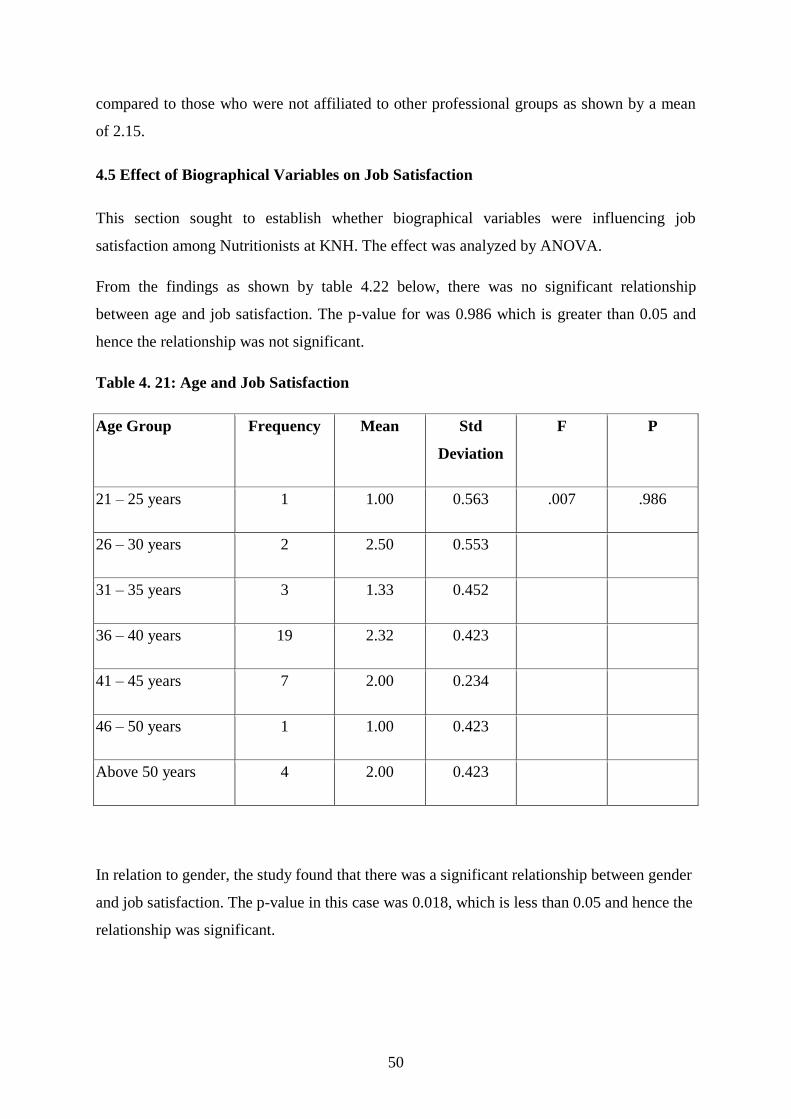
50
compared to those who were not affiliated to other professional groups as shown by a mean
of 2.15.
4.5 Effect of Biographical Variables on Job Satisfaction
This section sought to establish whether biographical variables were influencing job
satisfaction among Nutritionists at KNH. The effect was analyzed by ANOVA.
From the findings as shown by table 4.22 below, there was no significant relationship
between age and job satisfaction. The p-value for was 0.986 which is greater than 0.05 and
hence the relationship was not significant.
Table 4. 21: Age and Job Satisfaction
Age Group Frequency Mean Std
Deviation
F P
21 – 25 years 1 1.00 0.563 .007 .986
26 – 30 years 2 2.50 0.553
31 – 35 years 3 1.33 0.452
36 – 40 years 19 2.32 0.423
41 – 45 years 7 2.00 0.234
46 – 50 years 1 1.00 0.423
Above 50 years 4 2.00 0.423
In relation to gender, the study found that there was a significant relationship between gender
and job satisfaction. The p-value in this case was 0.018, which is less than 0.05 and hence the
relationship was significant.
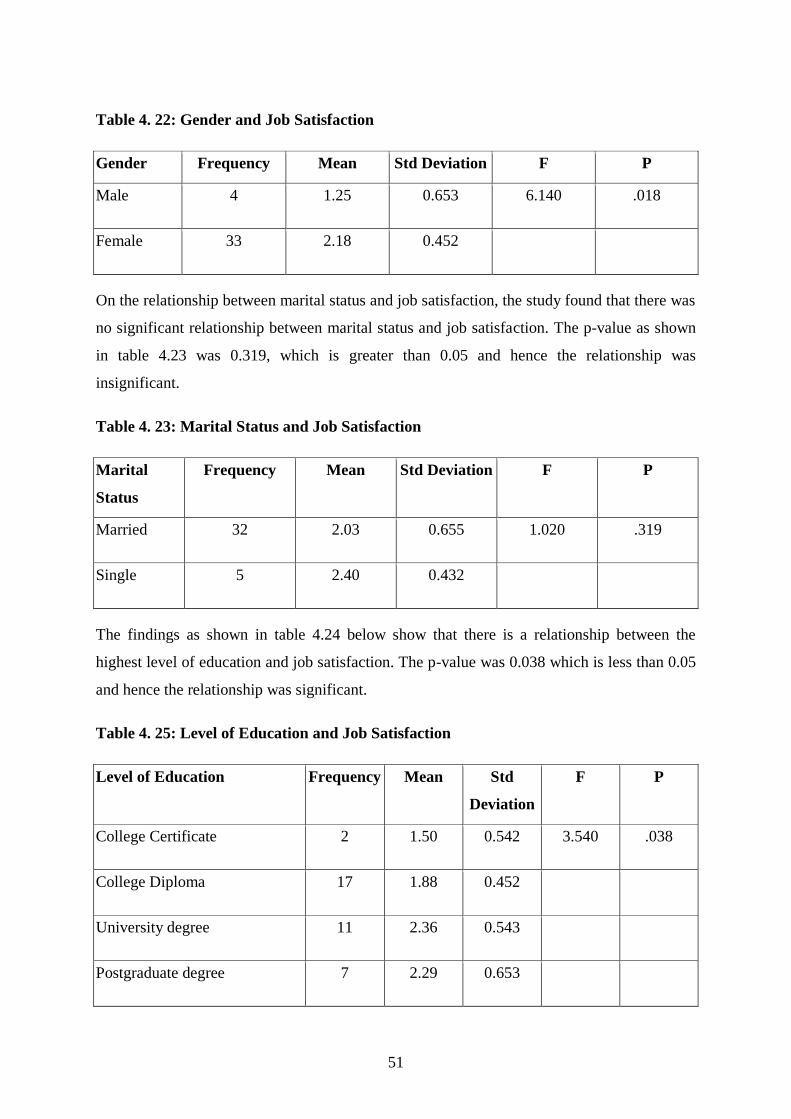
51
Table 4. 22: Gender and Job Satisfaction
Gender Frequency Mean Std Deviation F P
Male 4 1.25 0.653 6.140 .018
Female 33 2.18 0.452
On the relationship between marital status and job satisfaction, the study found that there was
no significant relationship between marital status and job satisfaction. The p-value as shown
in table 4.23 was 0.319, which is greater than 0.05 and hence the relationship was
insignificant.
Table 4. 23: Marital Status and Job Satisfaction
Marital
Status
Frequency Mean Std Deviation F P
Married 32 2.03 0.655 1.020 .319
Single 5 2.40 0.432
The findings as shown in table 4.24 below show that there is a relationship between the
highest level of education and job satisfaction. The p-value was 0.038 which is less than 0.05
and hence the relationship was significant.
Table 4. 25: Level of Education and Job Satisfaction
Level of Education Frequency Mean Std
Deviation
F P
College Certificate 2 1.50 0.542 3.540 .038
College Diploma 17 1.88 0.452
University degree 11 2.36 0.543
Postgraduate degree 7 2.29 0.653
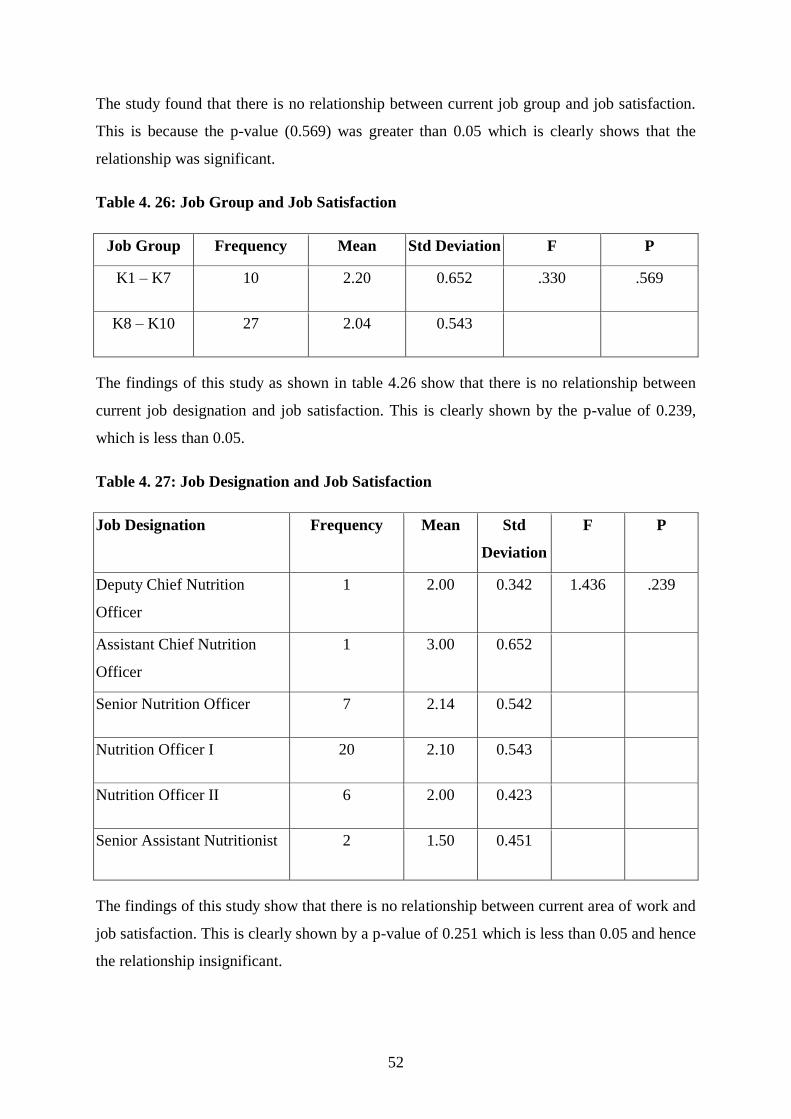
52
The study found that there is no relationship between current job group and job satisfaction.
This is because the p-value (0.569) was greater than 0.05 which is clearly shows that the
relationship was significant.
Table 4. 26: Job Group and Job Satisfaction
Job Group Frequency Mean Std Deviation F P
K1 – K7 10 2.20 0.652 .330 .569
K8 – K10 27 2.04 0.543
The findings of this study as shown in table 4.26 show that there is no relationship between
current job designation and job satisfaction. This is clearly shown by the p-value of 0.239,
which is less than 0.05.
Table 4. 27: Job Designation and Job Satisfaction
Job Designation Frequency Mean Std
Deviation
F P
Deputy Chief Nutrition
Officer
1 2.00 0.342 1.436 .239
Assistant Chief Nutrition
Officer
1 3.00 0.652
Senior Nutrition Officer 7 2.14 0.542
Nutrition Officer I 20 2.10 0.543
Nutrition Officer II 6 2.00 0.423
Senior Assistant Nutritionist 2 1.50 0.451
The findings of this study show that there is no relationship between current area of work and
job satisfaction. This is clearly shown by a p-value of 0.251 which is less than 0.05 and hence
the relationship insignificant.
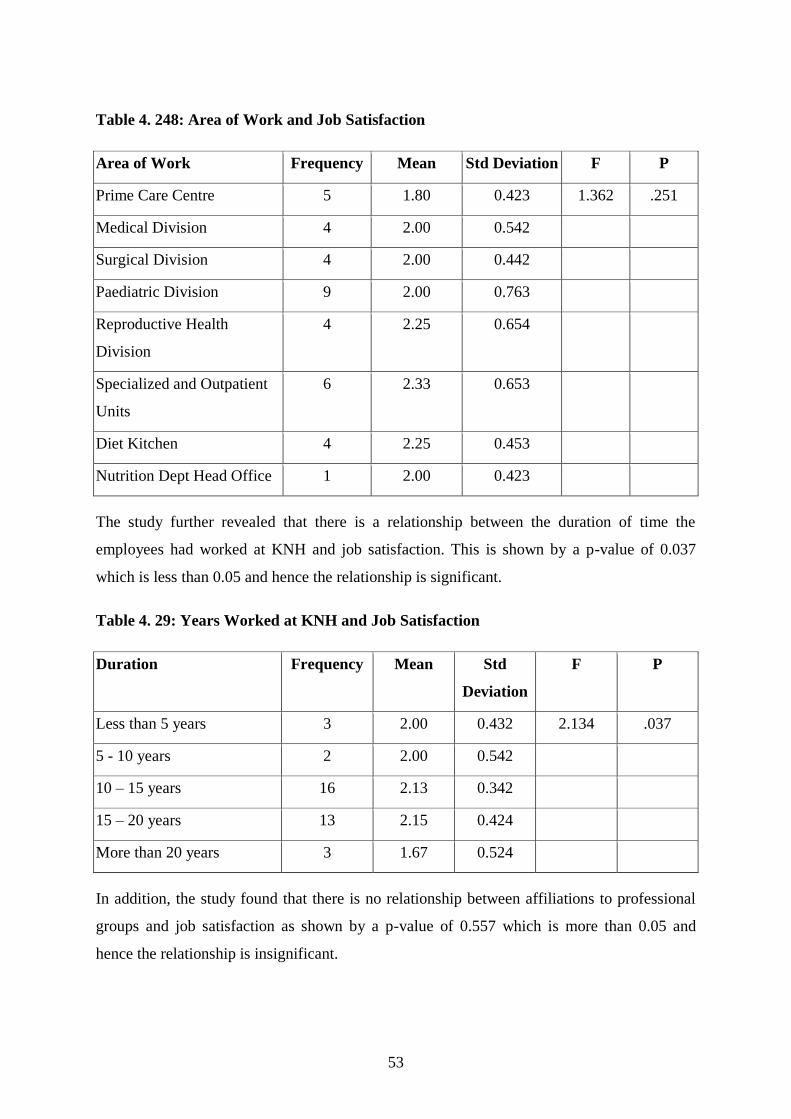
53
Table 4. 248: Area of Work and Job Satisfaction
Area of Work Frequency Mean Std Deviation F P
Prime Care Centre 5 1.80 0.423 1.362 .251
Medical Division 4 2.00 0.542
Surgical Division 4 2.00 0.442
Paediatric Division 9 2.00 0.763
Reproductive Health
Division
4 2.25 0.654
Specialized and Outpatient
Units
6 2.33 0.653
Diet Kitchen 4 2.25 0.453
Nutrition Dept Head Office 1 2.00 0.423
The study further revealed that there is a relationship between the duration of time the
employees had worked at KNH and job satisfaction. This is shown by a p-value of 0.037
which is less than 0.05 and hence the relationship is significant.
Table 4. 29: Years Worked at KNH and Job Satisfaction
Duration Frequency Mean Std
Deviation
F P
Less than 5 years 3 2.00 0.432 2.134 .037
5 - 10 years 2 2.00 0.542
10 – 15 years 16 2.13 0.342
15 – 20 years 13 2.15 0.424
More than 20 years 3 1.67 0.524
In addition, the study found that there is no relationship between affiliations to professional
groups and job satisfaction as shown by a p-value of 0.557 which is more than 0.05 and
hence the relationship is insignificant.
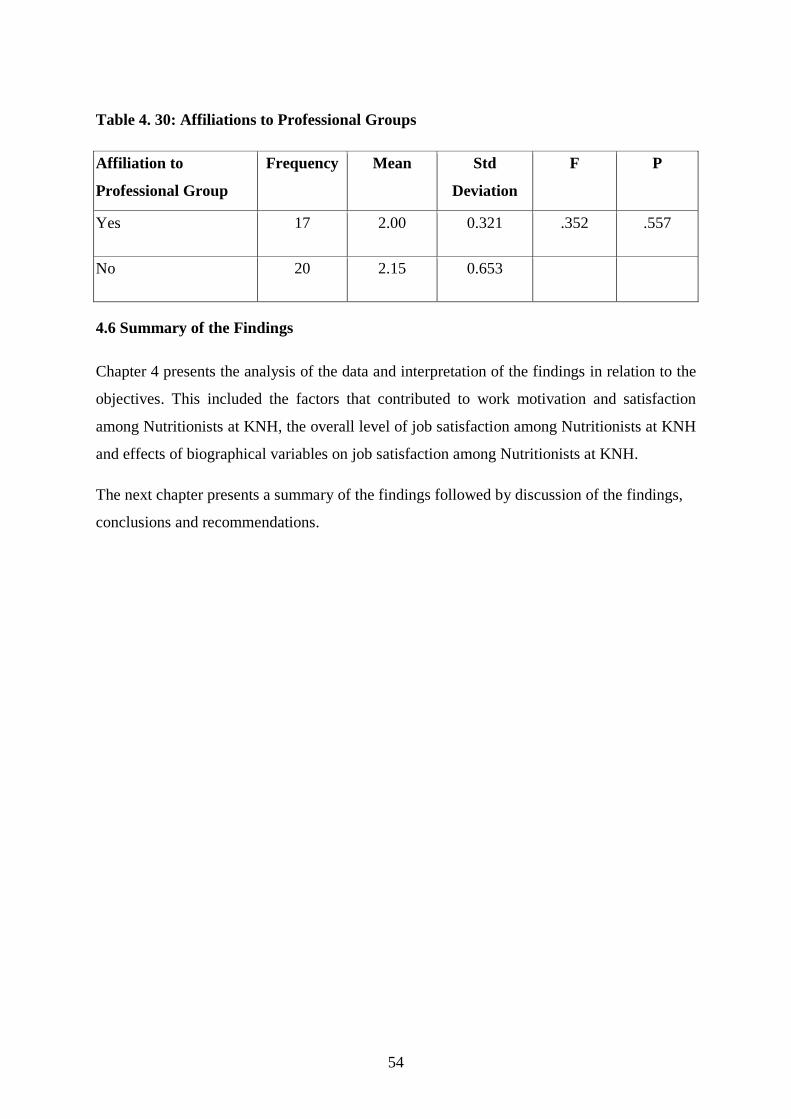
54
Table 4. 30: Affiliations to Professional Groups
Affiliation to
Professional Group
Frequency Mean Std
Deviation
F P
Yes 17 2.00 0.321 .352 .557
No 20 2.15 0.653
4.6 Summary of the Findings
Chapter 4 presents the analysis of the data and interpretation of the findings in relation to the
objectives. This included the factors that contributed to work motivation and satisfaction
among Nutritionists at KNH, the overall level of job satisfaction among Nutritionists at KNH
and effects of biographical variables on job satisfaction among Nutritionists at KNH.
The next chapter presents a summary of the findings followed by discussion of the findings,
conclusions and recommendations.
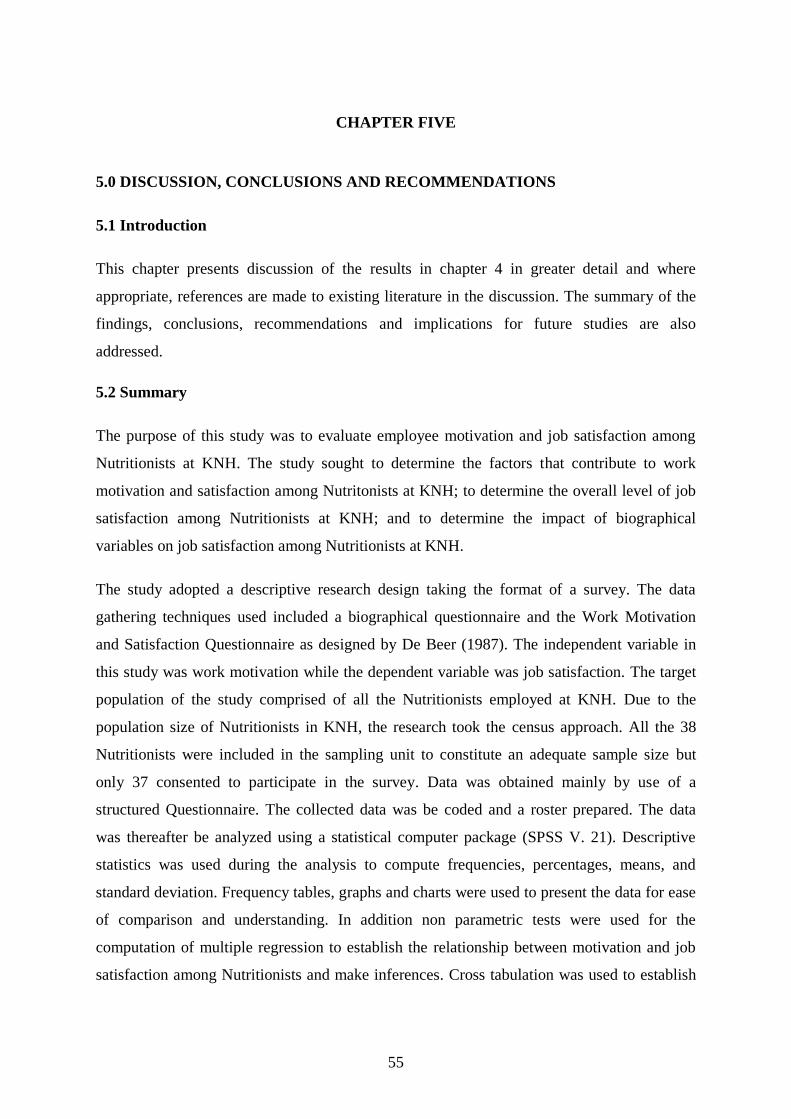
55
CHAPTER FIVE
5.0 DISCUSSION, CONCLUSIONS AND RECOMMENDATIONS
5.1 Introduction
This chapter presents discussion of the results in chapter 4 in greater detail and where
appropriate, references are made to existing literature in the discussion. The summary of the
findings, conclusions, recommendations and implications for future studies are also
addressed.
5.2 Summary
The purpose of this study was to evaluate employee motivation and job satisfaction among
Nutritionists at KNH. The study sought to determine the factors that contribute to work
motivation and satisfaction among Nutritonists at KNH; to determine the overall level of job
satisfaction among Nutritionists at KNH; and to determine the impact of biographical
variables on job satisfaction among Nutritionists at KNH.
The study adopted a descriptive research design taking the format of a survey. The data
gathering techniques used included a biographical questionnaire and the Work Motivation
and Satisfaction Questionnaire as designed by De Beer (1987). The independent variable in
this study was work motivation while the dependent variable was job satisfaction. The target
population of the study comprised of all the Nutritionists employed at KNH. Due to the
population size of Nutritionists in KNH, the research took the census approach. All the 38
Nutritionists were included in the sampling unit to constitute an adequate sample size but
only 37 consented to participate in the survey. Data was obtained mainly by use of a
structured Questionnaire. The collected data was be coded and a roster prepared. The data
was thereafter be analyzed using a statistical computer package (SPSS V. 21). Descriptive
statistics was used during the analysis to compute frequencies, percentages, means, and
standard deviation. Frequency tables, graphs and charts were used to present the data for ease
of comparison and understanding. In addition non parametric tests were used for the
computation of multiple regression to establish the relationship between motivation and job
satisfaction among Nutritionists and make inferences. Cross tabulation was used to establish
56
the variation in job satisfaction based on biographical variables. Further, ANOVA was used
to establish the relationship between biographic variables and job satisfaction.
The study established that work content contributes most to job satisfaction, followed by
payment, recognition, personal, general, leader/supervisor, working conditions, promotion
and benefits. The study also found that most of the Nutritionists were interested in their work
and they felt that their work was of value in their department. In addition, the study revealed
that salary increments are decided on a fair manner and most Nutritionists felt they earned the
same as or more than other people in a similar job. In relation to promotion, the study found
that nutritionists at KNH were promoted in a fair and honest way and everyone had an equal
chance to be promoted. It was also established that most Nutritionists received constructive
criticism about their work and got credit for what they did. The findings of this study also
show that the Nutritionists working hours were reasonable and they got the opportunity to
mix with their colleagues and to communicate on aspects of their work. In relation to
payment, most nutritionists were satisfied with what they earn but dissatisfied with overtime
payment. The study established that the medical scheme, benefits and arrangement for leave
was satisfactory and that nutritionists trusted their leaders/supervisors. The study findings
show a significant relationship between work motivation and job satisfaction
The study also established that 50% of the Nutritionists were moderately satisfied while only
2.8% were dissatisfied with their job. Individuals that were aged between 21 to 25 years in
age and 46 to 50 years were the most satisfied with regard to age. In addition, the study found
that the male individuals were more satisfied compared to females. Those with college
certificates were the most satisfied than those with higher academic qualifications. In relation
to work experience those who had worked for less than 10 years and more than 20 years at
KNH were more satisfied. Nutritionists who worked at the Prime Care Centre displayed
higher levels of satisfaction compared to those who worked in other areas.
In relation to the effects of biographic variables on job satisfaction, the study found that there
was a significant relationship between duration of time the employees had worked at KNH,
highest level of education, gender and job satisfaction. However, there was no significant
relationship between age, marital status, current job group, current job designation, current
area of work and affiliation to other professional groups and job satisfaction.
57
5.3 Discussion
The findings of the three specific objectives are discussed objectively in this section.
5.3.1 Factors that Contribute to Work Motivation and Satisfaction
This study focused on motivational factors under 9 themes; mainly work content, payment,
promotion, and recognition, working conditions, benefits, personal, leader/supervisor and
general dimensions.
In relation to work content, the study found that Nutritionists at KNH were interested in their
work; they had a feeling that their work was valued in their department and they were proud
of their work. In addition, the respondents were confident that they would not be dismissed
without good reason and that there is not time for idleness in their area of work. These
findings concur with Oosthuizen (2001) argument that the types of work individuals do
influence their satisfaction. He states that managers must make the work content as
interesting as possible in order to build strong levels of motivation. As well, most of the
respondents were sure that their work was the way to future success, they had a certain
degree of authority in their work and they were allowed to decide on the methods for doing
their work. This was also supported by the fact that most of the respondents controlled the
amount of work they did themselves. Additionally, they had the opportunity to take part when
decisions were made. These findings agree with Lam, Baum & Pine (2000) argument that the
job itself is an influential factor in predicting overall job satisfaction.
In relation to payment, the study established that salary increments was decided on a fair
manner and most respondents were satisfied with their salary and felt that they earned the
same as or more that other people in a similar job. However, the study also established that
the respondents were dissatisfied with payment of overtime.
The study revealed that nutritionists were promoted in a fair and honest way and that
everyone had an equal chance to be promoted and most of the respondents were sure that they
would be promoted within the next two years. This improves the motivation and job
satisfaction of the employees. According to Arnolds and Boshoff (2001), satisfaction in the
workplace, by providing promotion opportunities, has been shown to impact positively on
employee job performance, especially in the case of top managers.
58
Stroh (2001) argues that that when rewarding employees for good performance, the element
of recognition is of paramount importance. This study found that most of the respondents
received constructive criticism about their work and they got credit for what they did. In
addition, the respondents were informed when they were making progress and they were
praised regularly for their work. This explains the overall job satisfaction of Nutritionists at
KNH.
In relation to working conditions, the study established that the respondents’ working hours
were reasonable and they got the opportunity to mix with their colleagues and to
communicate on aspects of their work. According to Baum & Pine (2000), work environment
emerged as an influential factor in predicting overall job satisfaction for Chinese restaurant
managers..
In relation to benefits, the study found that the medical scheme was satisfactory. In addition,
they never had problems with their arrangements for leave. According to Mullins (1999),
economic rewards include pay, fringe benefits, and material goods are instrumental factors to
job satisfaction. Nevertheless, the Nutritionists were not satisfied with their pension benefits.
The study further established that Nutritionists at KNH were given work in accordance with
their qualifications and skills and they worked in the department of their choice. According to
Luthans (2002), employee’s perception of the job may explain increases in both overall and
intrinsic job satisfaction. Since job characteristics approach only set the stage for internal
motivation, the role of differences among people has to be considered as well. Several
attributes of people influence their response to highly motivating potential jobs.
In relation to their leaders and supervisors, the study found that leaders and supervisors were
warm-hearted people and supported them in case of problems. In addition, they could be
convinced, persuaded satisfied easily. According to Pearson, (1991) if an organization’s
employees do not feel that their supervisors are fair, their job satisfaction suffers
significantly, while if these are perceived positively they are more willing to assist beyond
their formal job requirements. The study found that most of the respondents had not
considered changing jobs inferring that they were satisfied with their jobs as Nutritionists at
KNH.
The study also established that there was a significant relationship between work motivation
and job satisfaction where the p value for all the nine work motivation factors was less than
59
0.05. The study showed a positive relationship between job satisfaction and payment,
supervisor/leader, recognition, working conditions, promotion, and benefits and an inverse
relationship with work content, personal and general dimensions. These findings are
consistent with previous researches such as Brown and Shepherd (1997) who reported that
motivation improves workers’ performance and job satisfaction. The result also agrees with
Vinokur et al (1994), who reported that certain motivational factors contribute to the
prediction of job satisfaction.
5.3 2 Overall Level of Job Satisfaction
According to Armstrong (2006), motivation is concerned with the factors that influence
people to behave in certain ways. Motivating people is about getting them to move in the
desired direction in order to achieve the desired objectives. This study established that most
of the Nutritionists were moderately satisfied with their jobs. These findings can be explained
by the fact that most of the respondents had not considered changing jobs. Lam et al. (2000)
indicated that job itself is an influential factor in predicting overall job satisfaction.
According to Maslow's hierarchy of needs job security and compensation represent lower
level needs, which have to be fulfilled to a higher degree before higher needs may emerge.
This concurs with the findings in this study as well. The lower level needs are more satisfied
and emerge to a higher extent than other factors, which are, according to Maslow (1943,
1954), higher level needs. Hackman and Oldham (1980) pointed out that work context
factors, extrinsic factors, might influence an individual’s willingness to take advantage of
challenges in his/her job. Therefore, it can be argued that the environmental aspects as well as
the compensation have to be satisfied to a certain extent in order to provide the basis for the
intrinsic job factors to serve as motivators.
This study established that individuals who were 21 to 25 years in age and 46 to 50 years
were the most satisfied. These were followed by individuals with an age ranging from 31 to
35 years (M=1.33), 41 to 45 years (M=2.00), above 50 years (M=2.00), 36 to 40 years
(M=2.32) and 26 to 30 years (M=2.50). These findings clearly show that satisfaction was not
increasing or decreasing with changes in age groups. One of the factors that may have
influenced these findings is the fact that each age category had considerably varying
population sizes.
60
Further, the study established that male individuals were the most satisfied (M=1.25) that the
female individuals (M=2.18). However, these findings cannot be used argue that there is a
relationship between gender and job satisfaction. This is because the male respondents
constituted only 11.1% of the population and hence was not well distributed.
Additionally, the study established that married individuals were the more satisfied (M=2.03)
than single individuals (M=2.40). Nevertheless, the number of single individuals and married
individuals was not equal and hence these findings cannot be used to conclude that married
individuals were more satisfied than single individuals.
The study also revealed that individuals who had college certificates were the most satisfied
(M=1.50), followed by college diploma holders (M=1.88), postgraduates holders (M=2.29)
and university degree (M=2.36). These findings clearly show that job satisfaction increased
with level of education.
It was established in this study that individuals in the K8 – K10 group had the same
satisfaction (M=2.20) with individuals in the K1 – K7 (M=2.20). Further, senior assistant
nutritionists were the most satisfied (M=1.50), followed by the nutrition officer II (M=2.00),
deputy chief nutrition officers (M=2.00), nutrition officer I (M=2.10), senior nutrition officer
(M=2.14) and assistant chief nutrition officer (M=3.00). in relation to their working the study
found that individuals in the premier center were the most satisfied (M=1.80), followed by
individuals in the medical division, surgical division, nutrition dept head office and pediatric
division (M=2.00). These were then followed by individuals in the reproductive health
division and diet kitchen (M=2.25) and specialized and outpatient units (M=2.33). However,
these finding cannot be used to make conclusions on which group was more satisfied than the
other because each group had different number of individuals.
The study also found that individuals who had been in KNH for more than 20 years were the
most satisfied (M=1.67), followed by individuals who worked for less than 10 years with a
mean of (M=2.00), 10 to 15 years (M=2.13) and 15 to 20 years (M=2.15). These findings
show that an increase in the number of years worked at KNH led to an increase in job
satisfaction.
Further, the study established that individuals who were affiliated to other professional
groups were the more satisfied (M=2.00) that individuals who were not affiliated to other
61
professional groups (M=2.15). These findings indicate that affiliation tor professional groups
may increase job satisfaction.
5.3.3 Effect of Biographical Variables on Job Satisfaction
According to Murgui (1999), differences in the motivation nature levels between males and
females are based on the assumption that the needs fulfillment theory postulates that job
motivation is determined by the biological, psychological and social needs of an individual
which are different in female and male. The study found that there was a significant
relationship between gender and job satisfaction (P=0.018). These findings concur with
Murgui (1999) argument that differences in the nature and levels of satisfaction between
males and females are expected. This study showed that the males were more likely to be
satisfied (M=1.25) compared to females (2.18).
The Needs Fulfillment Theory assumes that job motivation is determined by the biological,
psychological and social needs of an individual. These needs highly affect the behavior of
individuals. As females and males differ at least on the biological aspects, the possibility of
differences in job motivation, in terms of this theory, can be expected. However, the findings
of these study contrast with Pearson (1991) and Robbins et al. (2001) argument that there is
no evidence indicating that an employee’s gender affects job satisfaction.
This study established that there was no significant relationship between age and job
satisfaction (P-0.986). These findings contrast with Pearson (1991) and Robbins et al. (2001)
who had argued that there is a positive relationship between age and satisfaction, at least up
to age 60. Oosthuizen (2001) also indicated that there are statistically significant differences
between age groups and the motivators – achievement, advancement and the possibility of
growth.
On the relationship between marital status and job satisfaction, the study found that there was
no significant relationship between marital status and job satisfaction (P=0.319). These
findings correlate with Oosthuizen (2001) argument that there is no significant association
between marital status and the job satisfaction. However, this contrasts with Bowen et al.,
(1994) and Fetsch & Kennington (1997) argument that there is a relationship between marital
status and job satisfaction. They had further argued that married or divorced individuals are
more satisfied with their jobs than remarried, never married, or widowed individuals.
62
The study also established that there is a significant relationship between the level of
education and job satisfaction (P=0.038). The study established that as the level of education
increased the level of job satisfaction decreased. These findings correlate with Pearson (1991)
argument that satisfaction is found to be positively related to educational achievement.
Further Mould (2004) revealed that the job itself is consistently the highest ranked factor
across all educational groupings except for respondents with no post-Matric qualifications.
The study showed that there is no significant relationship between current job group
(representing salary scales) and job satisfaction (P=0.569). Further the study found that there
is no relationship between current job designation and job satisfaction (P=0.239).
Additionally, It was established in this study that there is no relationship between current area
of work and job satisfaction (P=0.251). These findings contrast with Pearson (1991)
argument that satisfaction is positively related to occupational level. Oosthuizen (2001) also
indicates that there is an association between level of occupation and job satisfaction. On the
other hand Analoui (2000) argues that in terms of motives, managers are more concerned
with factors such as achievement, power, status, income and advancement. In addition, Morse
and Weiss (1955) established that from amongst several different occupational groups, none
viewed achievement and accomplishment as more important to their motivation than the
management group.
The study further revealed that there is a significant relationship between the duration of time
the employees had worked at KNH and job satisfaction (P=0.037). These findings concur
with Schulze and Steyn (2003) argument that there is a significant association between length
of service and factors that motivate employees. Further, Bellingan–Timmer (2004) had earlier
established that middle managers with over five years service in their current rank were more
dissatisfied with their jobs. In addition, middle managers who had less than five years of
service were more dissatisfied with their activity levels in the work.
In addition, the study found that there is no relationship between affiliations to professional
groups and job satisfaction (P=0.557). These findings concur with Analoui (2000) argument
that individuals involved in professional groups were more likely to be satisfied than
individuals who were not involved in any professional group. However, the findings differ
with Mould (2004) that affiliation to professional groups does not affect job satisfaction..
63
5.4 Conclusion
5.4.1 Factors that Contribute to Work Motivation and Satisfaction
Work content contributed most to job satisfaction followed by payment, recognition,
personal, general, leader/supervisor, working conditions, promotion and benefits. However,
any positive simulations in work content, personal factors and general dimensions would lead
to a reduction in job satisfaction; while an increase in payment, recognition,
leader/supervisor, working conditions, promotion and benefits would lead to an increase in
job satisfaction. The study concludes that there was a significant relationship between work
motivation and job satisfaction and that Nutritionists at KNH were generally motivated by
their work.
5.4.2 Overall Level of Job Satisfaction
The study further concludes that most of the Nutritionists were moderately satisfied with their
jobs. This could be attributed to the findings above that majority of the Nutritionists were also
motivated by their work.
5.4.3 Effect of Biographical Variables on Job Satisfaction
This study finally concludes that there was a significant relationship between years worked at
KNH, level of education, and gender with job satisfaction. However, there was no significant
relationship between age, marital status, job group, job designation, area of work and
affiliation to professional groups with job satisfaction.
5.5 Recommendations
5.5.1 Recommendations for Improvement
5.5.1.1 Factors that Contribute to Work Motivation and Satisfaction
It was clear from the findings that most of the Nutritionists at KNH were motivated with their
work and there was a significant relationship between work motivation and job satisfaction.
However, taking into consideration all the differences observed in this research, the study
recommends that the work situation should be looked into with greater detail with a view to
redesigning the work so as to provide employees with intrinsic motivators. The intrinsic
factors influence a person's willingness to expend considerable efforts toward the goals of the
64
organization and to remain in the organization (attitudinal commitment) while the extrinsic
factors, on the other hand, may contribute to the behavioral commitment.
5.5.1.2 Overall Level of Job Satisfaction
This study established that majority of the Nutritionists were moderately satisfied with their
job. This study recommends that addressing factors like recognition, relationship with
supervisors/team leaders, promotion, working conditions, benefits, and payment of overtime
as observed in the findings will yield an even higher job satisfaction. This in turn will
increase retention and improve service delivery among employees.
5.5.1.3 Biographical Variables on Work Motivation and Satisfaction
This study established that there was a significant relationship between the level of education,
gender, and years worked at KNH with job satisfaction. The study recommends that
employers should critically analyze their employees individual characteristics when
designing motivational plans in order to attract and retain a motivated and satisfied
workforce.
5.5.2 Recommendation for Further Studies
There is need to replicate the study to include all employees at KNH so as to have a larger
sample for the results to be generalized.
There is need to establish the differences in work motivation and job satisfaction among the
different cadres of healthcare workers at KNH.
65
REFERENCES
Analoui, F. (2000), What motivates senior managers?, Journal of Managerial Psychology,
15(4), pp. 324-340
Analoui, F. (2000). What motivates senior managers? The case of Romania. Journal of
Managerial Psychology, 15(4), 324-340.
Armstrong, M. (2006), A Handbook of Human Resource Management Practice, 10th edition,
New York: Kogan Page 317-329
Arnolds, C., & Boshoff, C. (2001). The challenge of motivating top management: A need
satisfaction perspective. Journal of Industrial Psychology, 27(1), 39-42.
Atkins, R. C., Atkins, R. L., & Hilgard, E. R. (1975), Introduction to psychology, 6th edition,
New York: Harcourt Brace Jovanovich Inc
Baron, R. A. (1983), Behavior in Organizations: Understanding and Managing the Human
Side of Work, Newton: Allyn and Bacon Inc
Bassy, M. (2002), Motivation and Work: Investigation and Analysis of Motivation Factors at
Work. Retrevied on 16th February from www.ep.liu.se/exjobb/eki/2002/fek/009/
Beardwell, I., Holden, L., & Claydon, T. (2004), Human Resource Management: A
Contemporary Approach, 4th Edition, Prentice Hall, Financial Times
Bellingan-Timmer, R. (2004). Job satisfaction: An analysis of middle managers in the South
African Police Service. Acta Commercii, 4, 29-36
Bent, R., Seaman, E. A., & Ingram, A. (1999), Staff Motivation In Small Food
Manufacturing Enterprises, British Food Journal, 101(9), pp. 654-667
Bowen, B. E., & Radhakrishna, R. B. (1991), Job Satisfaction Of Agricultural Education
Faculty, A Constant Phenomena, Journal of Agricultural Education, 32(2), pp. 16-22.
Bowen, C. F., Radhakrishna, R. B., & Keyser, R. (1994). Job satisfaction and commitment of
4-H agents. Journal of Extension, 32(1), pp. 45-49
66
Brown, A., Forde, C., Spencer, D., & Charlwood, A. (2008). Changes in HRM and job
satisfaction, 1998-2004: Evidence from the Workplace Employment Relations
Survey. Human Resource Management Journal, 18(3), 237–256.
Brown, J. & Sheppard, B. (1997). Teacher librarians in learning organizations. Paper
Presented at the Annual Conference of the International Association of School
Librarianship, Canada. August 25-30.
Cole, G.A. (1996) Management: Theory and Practice, 5th edition, New York: Letts
Educational
Davidson, F. (1996), Principal of Statistical data Handling, San Francisco, CA: Sage
De Beer, M.J. (1987), 'n Ondersoek na die rol wat arbeidsomset in die bedryf speel
Deci, E. L. (1975), Intrinsic Motivation, New York: Plenum Press
Dessler, G. (1986), Organization Theory: Integrating Structure and Behavior, 2nd edition,
Englewood Cliffs: Prentice Hall,
Dickson, W. J. (1973), Hawthorne experiments: The encyclopedia of management, 2nd
edition New York: Van Nostrand Reinhold.
Education, Inc. Lindner J.R. (1998) Understanding Employee Motivations, Journal of
Extension, 36(3), pp.34-37
Evidence from the Workplace Employment Relations Survey, Human Resource Management
Journal 18(2) 2008 pp.97-195
Fetsch, R. J., & Kennington, M. S. (1997). Balancing work and family in Cooperative
Extension: History, effective programs, and future directions. Journal of Extension,
35(1), pp. 34-38
Funder, D. C. (2001). The Personality Puzzle (2nd ed.). New York: W. W. Norton.
Gay, L. (1992), Educational Research: Competencies for Analysis and Application (4th Ed).
New York, Macmillan Publishing Company.
Groep swart administratiewe werkers. Unpublished master’s dissertation, University of the
Orange Free State, Bloemfontein.
Hair, J.F., Celsi, M. W., Money, A. H., Samouel, P. & Page, M. (2011). Essentials of
Business Research Methods (2nd edition) M. E. Sharpe: Armonk
67
Herzberg F. (2002), The Havard Business: Review Breakthrough Ideas, 15 Articles that
Define Business Practice Today, How do You Motivate Employees pp 89
Hoppock, R. (1935). Job Satisfaction, New York: Harper and Brothers
Hui, C., & Lee, C. (2000), Moderating effects of organization-based self-esteem on
organizational uncertainty: employee response relationships, Journal of Management,
26(2), pp. 215-232
Jackson W. S (1986), Hippocratic Times to Modern Times; New Haven: Yale University
Press
Jackson, S. E., Schuler, R. S., & Werner, S. (2009), Managing Human Resources, 10th
Edition, South-Western Cengage: South-Western Cengage Learning Press,
Kanter, R.M. (2009), "What would Peter say?", Harvard Business Review, November, pp.65-
70.
Kenyatta National Hospital Human Resource Manual, 1989.
Kenyatta National Hospital Strategic Plan 2008 - 2012
Kilemi, M. and Wamahiu, S. (1995). Issues in Educational Research in Africa. Nairobi: East
African Educational Publishers.
Kothari, C. R. (2004). Research methodology: Methods and techniques. New Delhi: New
Age International (P) Limited Publishers.
Kovach, K. A. (1987), What motivates employees? Workers and supervisors give different
answers, Business Horizons, 30, pp. 58-65
Lam, T., Baum, T., & Pine, R. (2001). Study of managerial job satisfaction in Hong Kong's
chinese restaurants. International Journal of Contemporary Hospitality Management,
3(1), 35-42.
Latham G.P. (1989), Work Motivation: History, Theory, Research and Practice, London:
Sage Publications
Lawler, E. E., & Porter, L. W. (1967), The Effect Of Performance on Job Satisfaction,
Industrial Relations, 7, pp. 20-28
68
Leary, M.R. (2004), Introduction to Behavioural Research Methods. New York: Pearson
Luthans, F. (1995), Organizational behavior, 7th edition, New York: McGraw-Hill
Luthans, F. (2002), Organizational behavior, 9th edition, New York: McGraw-Hill,
Mak, B. L., & Sockel, H. (2001), A Confirmatory Factor Analysis of IS Employee
Motivation and Retention, Information & Management, 38, pp. 265-276
Maslow, A. H. (1943), A theory of Human Motivation, Psychological Review, 50(4), pp.
370-396
Maslow, A. H. (1954), Motivation and Personality, New York: Harper and Row
Maxwell, J. (1997). Designing a qualitative study. In L. Bickman & D. J. Rog (Eds.)
Handbook of applied social research methods (pp. 69-100). Thousand Oaks, CA:
Sage.
McCrae, R.R., & Costa, P.T. (1987) Validation of the five-factor model of personality across
instruments and observers. Journal of Personality and Social Psychology, 52, 81-90
McCrae, R.R., & Costa, P.T. (1997) Personality trait structure as a human universal.
American Psychologist, 52, 509-516.
McNeill, P. (1985), Research methods, London: Tavistock publications,
Met spesifieke verwysing na werkbevrediging en werksmotivering. Unpublished master’s
dissertation, University of the Free State, Bloemfontein.
Miller-Keane Encyclopedia and Dictionary of Medicine, Nursing, and Allied Health, Seventh
Edition. © 2003 by Saunders, an imprint of Elsevier, Inc.
Molander, C. (1996), Human Resources at Work, Lund: Chartwell-Bratt,
Morgan, G. (1997), Images of Organization, Thousand Oaks: Sage Publications
Mosby's Medical Dictionary, 8th edition. © 2009, Elsevier.
Mould, C. (2004). Factors influencing the motivation of information technology professionals
in the workplace. Journal of Business and Industrial Marketing, 15(7), 507-524
Mugenda O. M., Mugenda A. G,(2003), Research Methods, quantitative and qualitative
Approaches, , Nairobi, Kenya: African centre for technology studies press
69
Mullins, L. J. (1999), Management and Organizational Behaviour, 5th edition, Financial
Times Harlow: Prentice Hall
Murgui, S.R. (1999, August). Motivation to manager: A comparative study of male and
female library and information science students. Retrieved April 10, 2013, from
http://www.ifla.org
Nagy MS,( 2002), Using a single-item approach to measure facet job satisfaction. J Occup
Org Psychol. 75:77-86.
Nutrition Department Service Charter 2012
Oosthuizen, T.F.J. (2001). Motivation influencing worker performance in a technical division
of Telkom SA, Acta Commercii, 1, 19-30.
Ornstein, R. (1993). The Roots of the Self: Unraveling the mystery of who we are. New York:
Harper Collins.
Parke, R. D., & Buriel, R. (1998). Socialization in the family: Ethnic and ecological
perspectives. In W. Damon (Editor-in-Chief ) & N. Eisenberg (Vol. Ed.), Handbook
of child psychology: Vol. 3. Social, emotional, and personality development (5th ed.,
pp. 463–552). New York: Wiley.
Pearson, R. (1991). The human resource: Managing people and work in the 1990s.
Berkshire: McGraw-Hill.
Pearson, R. (1991). The human resource: Managing people and work in the 1990s.
Berkshire: McGraw-Hill.
Porter, L. W., & Steers, R. M. (1991), Motivation and Work Behavior, 5th edition, New
York: McGraw-Hill,
Prinsloo, I. (1996), Die effek van regstellende aksie op die werkmotiveering van 'n
Rathus S.A. (1990), Psychology, 4th ed., Fort Worth: Holt, Rinehart & Winston,
Reis, D., & Pena, L. (2001), Reengineering the motivation to work, Management Decision,
39(8), pp. 666-675
Robbins, S.P., Odendaal, A., & Roodt, G. (2001). Organizational behavior: Global and
South African perspectives. South Africa: Pearson Education.
70
Sagimo, P.O. (2002), Management Dynamics: Towards Efficiency, Effectiveness,
Competence and Productivity, Nairobi: East African Educational Publishers
Saunders, M., Lewis, P. And Thornhill, A. (2003), Research Methods for Business Students,
3rd Edition, London: Pitman Publishing
Schein E.H. (1971), Organizational Socialization and the Profession of Management, in
David Kolb, Irwin Rubin and Jams Mclntyre (Eds), Organizational Psychology: A
Book of Readings, Prentice Hall, Upper Saddle River, N.J. 1971, pp 14-15
Schultz, D. P., & Schultz, S. E. (1998), Psychology & Work Today: An Introduction to
Industrial and Organizational Psychology, New Jersey: Prentice Hall
Schulze, S., & Steyn, G.M. (2003). Educators’ motivation: Differences related to gender, age
and experience. Acta Academica, 35(3), 138-160.
Sell, R. G., & Shipley, P. (1979), Satisfactions in work design: ergonomics and other
approaches, London: Taylor and Francis Ltd
Smith, G. P. (1994), Human Resources Management and Development Handbook, 2nd
Edition. New York: Free Press
Spector, P.E. (1997). Job satisfaction: Application, assessment, causes and consequences,
Thousand Oaks,CA: Sage Publications, Inc
Statt, D. A. (1994), Psychology and the World of Work, Houndmills: Macmillan Press Ltd
Stroh, E.C. (2001). Personnel motivation: Strategies to stimulate employees to increase
performance. Politeia, 20(2), 59-74.
Terpstra, D. E. (1979), Theories of motivation, Borrowing the Best, Personnel Journal, 58.
376.
Tesone, D. V. (2005), Hospitality Human Resource Management: A Practitioner’s
Perspective, Upper Saddle River, NJ: Pearson-Prentice Hall.
Tesone, D.V. (2005),Workplace Motivation and the Brain, Journal of Applied Management
and Entrepreneurship, 7(4), pp.67-78
71
Velnampy T. (2008), Job Attitude and Employees Performance of Public Sector Organization
in Jaffna District, Sri Lanka, GITAM Journal of Management, 6(2), pp.66-73
Verhaegen, P. (1979), Work satisfaction in present-day working life: ergonomics and work
satisfaction in Sell, R. G., & Shipley, P. (1979): Satisfactions in work design:
ergonomics and other approaches, London: Taylor and Francis Ltd
Vignali, C. (1997), Motivation factors that force a sales training programme and the
experience within the brewing industry, Industrial and Commercial Training, 29(1),
pp. 10-15
Vinokur, K. D., Jayaaratne, S., Chess, W. A. (1994). Job satisfaction and retention of social
workers in public agencies, non-profit agencies and private practice: The impact of
work place conditions and motivators. Administration in Social Work, 18(3), 93-121.
Vroom, H. V. (1963), Work and Motivation, New York John Wiley & Sons Inc
Vroom, V.H. (1964). Work and motivation, New York: John Wiley and Sons
Wagner, H. (1999), The Psychobiology of Human Motivation, London: Routledge
Wanous JP, Reichers AE, (1997), Hudy MJ: Overall job satisfaction: How good are single-
item measures? J Appl Psychol, 82, pp. 247-252.
Whitsett D. (Jan-Feb 1975), Where are your Enriched Jobs? Harvard Business Review pp.
74-80.
Wiley, C. (1997), What Motivates Employees According To Over 40 Years Of Motivation
Surveys, International Journal of Manpower, 18(3), pp.263-280
72
Appendices
Appendix 1: Consent Form
Correspondent No……………
Dear Madam/Sir,
I am Agnes Sitati a graduate student at the School of Business, United States International
University of Nairobi and a Nutritionist at KNH. In partial fulfilment of the requirements for
the award of a Degree of Global Executives Masters in Business Administration (GEMBA), I
am conducting a research titled Employee Motivation And Job Satisfaction Among
Nutritionists At Kenyatta National Hospital. The objectives of this study are: To determine
the factors that contribute to work motivation and satisfaction among Nutritonists at KNH; to
determine the overall level of job satisfaction among Nutritionists at KNH; and to determine
the impact of biographical variables on work motivation and satisfaction among Nutritionists
at KNH.
The findings of this study will be useful in identifying and addressing the weak areas that
may be contributing to poor performance and staff turnover among Nutritionists at the
hospital and in re-designing the staff motivation and reward programme.
You have been selected to assist in providing the required information as your views are
considered important to this study. I am therefore kindly requesting you to fill this
questionnaire that requires responses regarding your personal data, the extent of your
motivation towards your job, and your level of job satisfaction.
Please note that all information will be treated with utmost confidentiality and will only be
used for the purposes of this study. If you wish to make any inquiry or need more
information or further clarification, please contact me on mobile number 0722678886.
If you agree to participate in this study, kindly sign below:
Signature................................................. Date..........................................
Thank you for accepting to participate
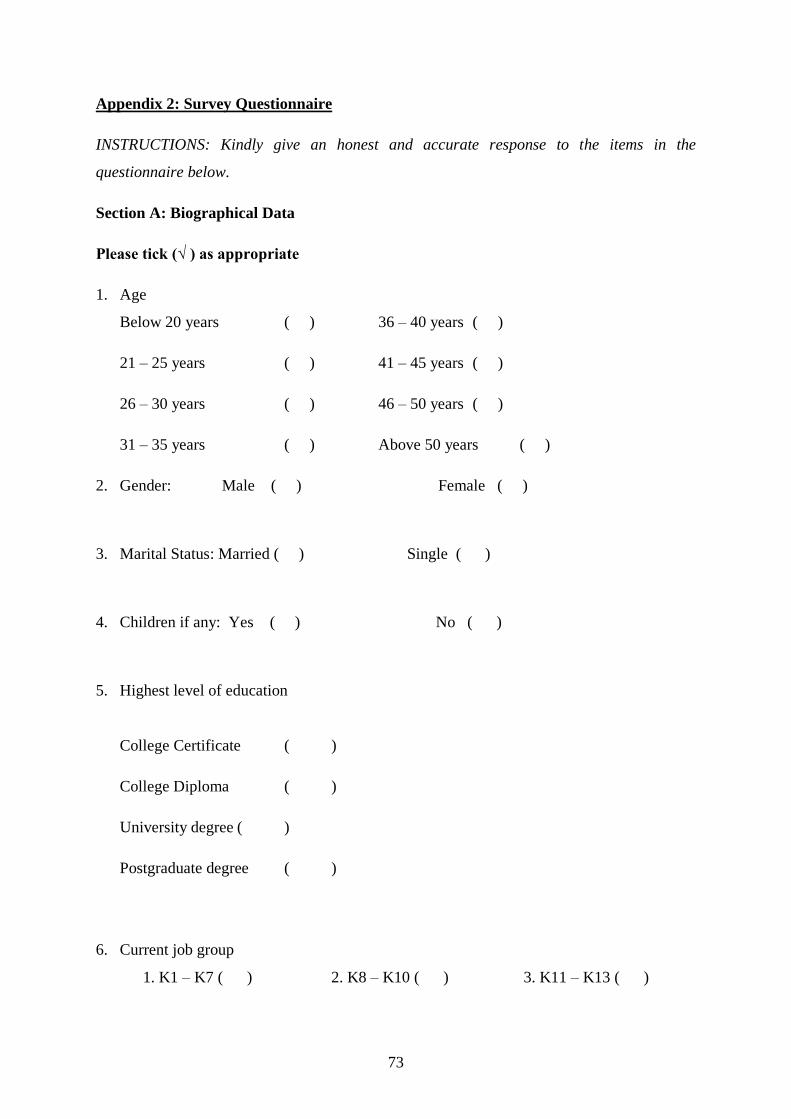
73
Appendix 2: Survey Questionnaire
INSTRUCTIONS: Kindly give an honest and accurate response to the items in the
questionnaire below.
Section A: Biographical Data
Please tick (√ ) as appropriate
1. Age
Below 20 years ( ) 36 – 40 years ( )
21 – 25 years ( ) 41 – 45 years ( )
26 – 30 years ( ) 46 – 50 years ( )
31 – 35 years ( ) Above 50 years ( )
2. Gender: Male ( ) Female ( )
3. Marital Status: Married ( ) Single ( )
4. Children if any: Yes ( ) No ( )
5. Highest level of education
College Certificate ( )
College Diploma ( )
University degree ( )
Postgraduate degree ( )
6. Current job group
1. K1 – K7 ( ) 2. K8 – K10 ( ) 3. K11 – K13 ( )
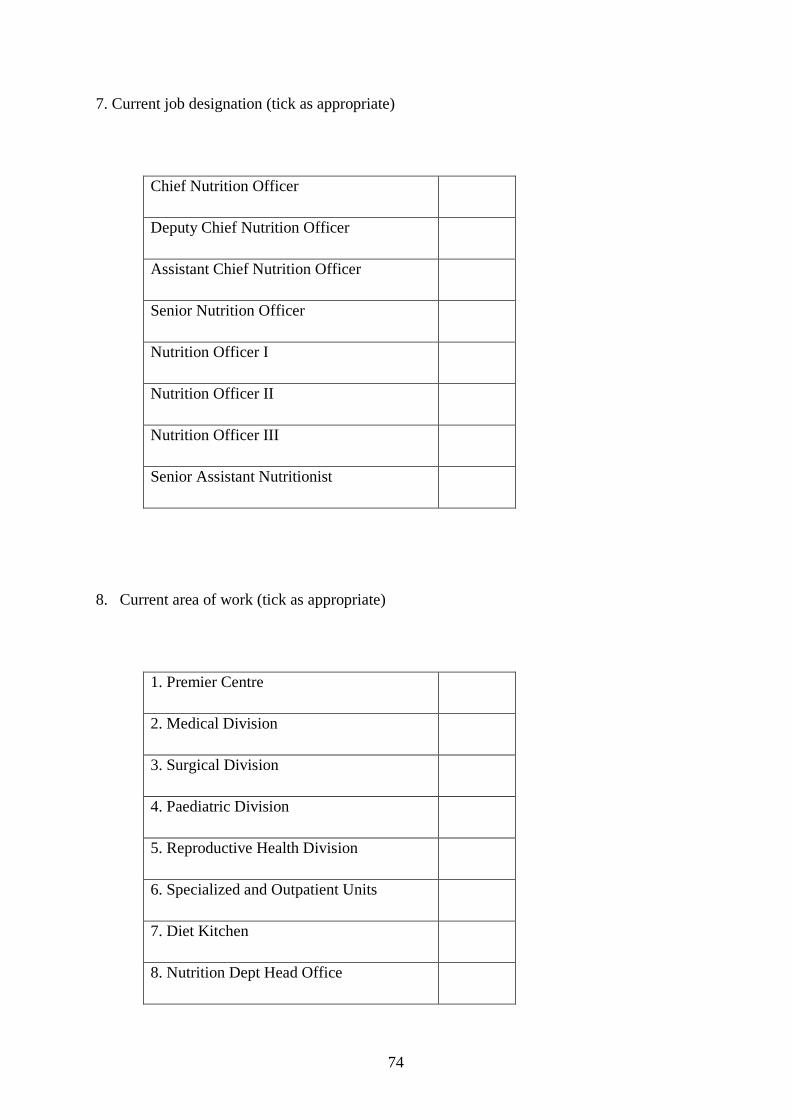
74
7. Current job designation (tick as appropriate)
Chief Nutrition Officer
Deputy Chief Nutrition Officer
Assistant Chief Nutrition Officer
Senior Nutrition Officer
Nutrition Officer I
Nutrition Officer II
Nutrition Officer III
Senior Assistant Nutritionist
8. Current area of work (tick as appropriate)
1. Premier Centre
2. Medical Division
3. Surgical Division
4. Paediatric Division
5. Reproductive Health Division
6. Specialized and Outpatient Units
7. Diet Kitchen
8. Nutrition Dept Head Office
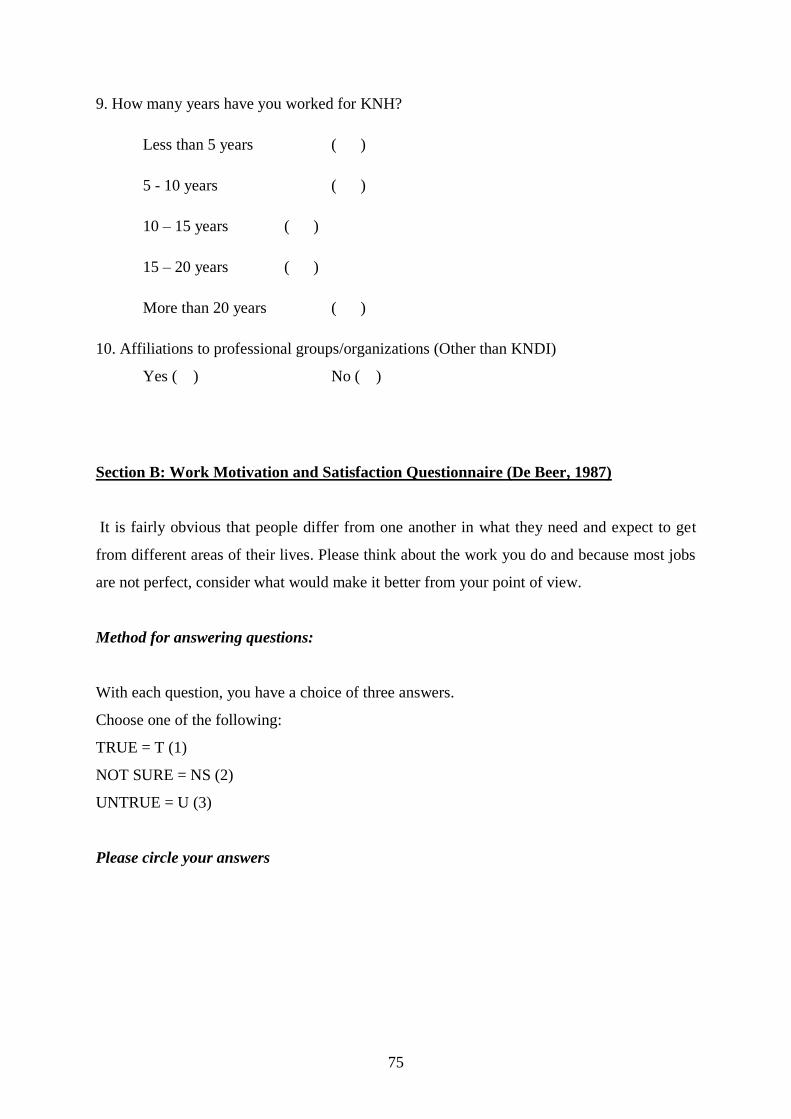
75
9. How many years have you worked for KNH?
Less than 5 years ( )
5 - 10 years ( )
10 – 15 years ( )
15 – 20 years ( )
More than 20 years ( )
10. Affiliations to professional groups/organizations (Other than KNDI)
Yes ( ) No ( )
Section B: Work Motivation and Satisfaction Questionnaire (De Beer, 1987)
It is fairly obvious that people differ from one another in what they need and expect to get
from different areas of their lives. Please think about the work you do and because most jobs
are not perfect, consider what would make it better from your point of view.
Method for answering questions:
With each question, you have a choice of three answers.
Choose one of the following:
TRUE = T (1)
NOT SURE = NS (2)
UNTRUE = U (3)
Please circle your answers
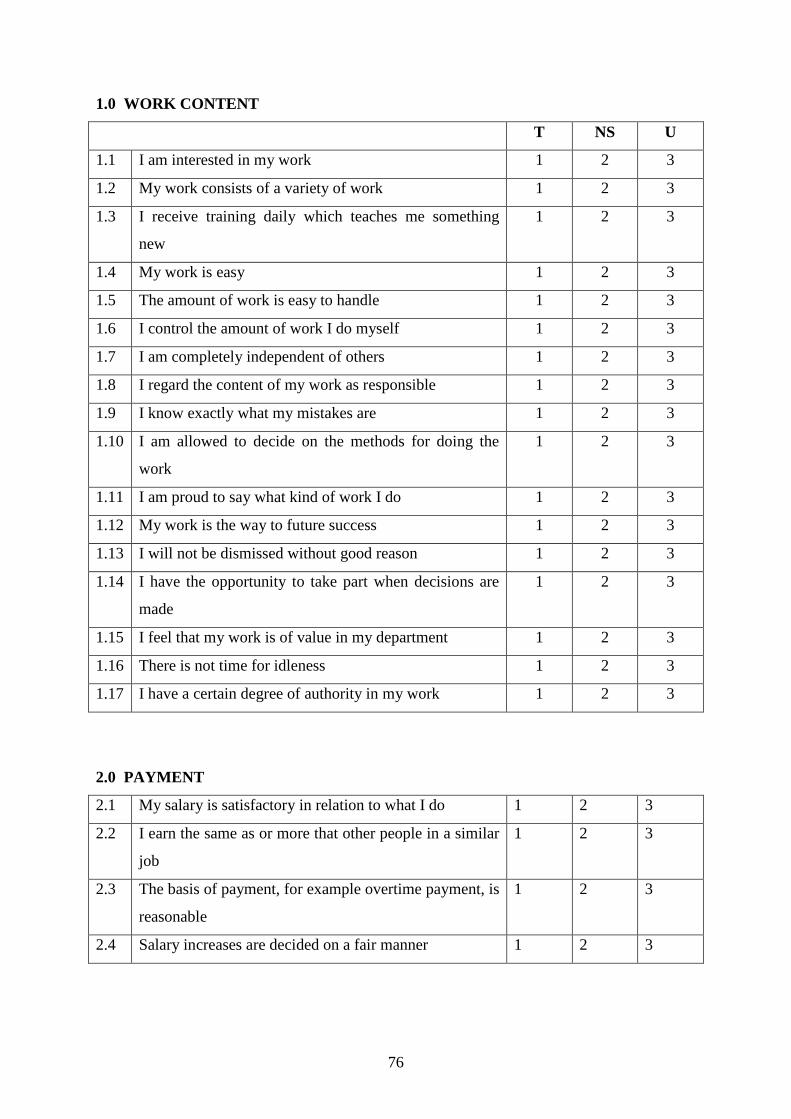
76
1.0 WORK CONTENT
T NS U
1.1 I am interested in my work 1 2 3
1.2 My work consists of a variety of work 1 2 3
1.3 I receive training daily which teaches me something
new
1 2 3
1.4 My work is easy 1 2 3
1.5 The amount of work is easy to handle 1 2 3
1.6 I control the amount of work I do myself 1 2 3
1.7 I am completely independent of others 1 2 3
1.8 I regard the content of my work as responsible 1 2 3
1.9 I know exactly what my mistakes are 1 2 3
1.10 I am allowed to decide on the methods for doing the
work
1 2 3
1.11 I am proud to say what kind of work I do 1 2 3
1.12 My work is the way to future success 1 2 3
1.13 I will not be dismissed without good reason 1 2 3
1.14 I have the opportunity to take part when decisions are
made
1 2 3
1.15 I feel that my work is of value in my department 1 2 3
1.16 There is not time for idleness 1 2 3
1.17 I have a certain degree of authority in my work 1 2 3
2.0 PAYMENT
2.1 My salary is satisfactory in relation to what I do 1 2 3
2.2 I earn the same as or more that other people in a similar
job
1 2 3
2.3 The basis of payment, for example overtime payment, is
reasonable
1 2 3
2.4 Salary increases are decided on a fair manner 1 2 3
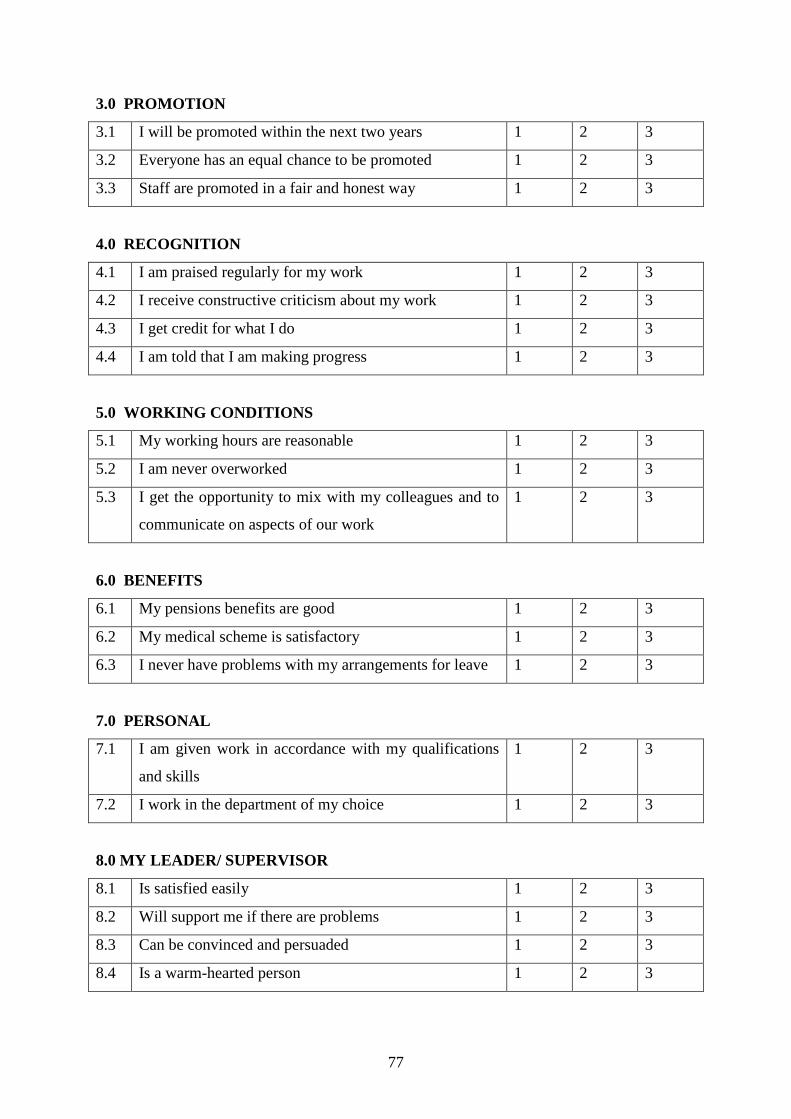
77
3.0 PROMOTION
3.1 I will be promoted within the next two years 1 2 3
3.2 Everyone has an equal chance to be promoted 1 2 3
3.3 Staff are promoted in a fair and honest way 1 2 3
4.0 RECOGNITION
4.1 I am praised regularly for my work 1 2 3
4.2 I receive constructive criticism about my work 1 2 3
4.3 I get credit for what I do 1 2 3
4.4 I am told that I am making progress 1 2 3
5.0 WORKING CONDITIONS
5.1 My working hours are reasonable 1 2 3
5.2 I am never overworked 1 2 3
5.3 I get the opportunity to mix with my colleagues and to
communicate on aspects of our work
1 2 3
6.0 BENEFITS
6.1 My pensions benefits are good 1 2 3
6.2 My medical scheme is satisfactory 1 2 3
6.3 I never have problems with my arrangements for leave 1 2 3
7.0 PERSONAL
7.1 I am given work in accordance with my qualifications
and skills
1 2 3
7.2 I work in the department of my choice 1 2 3
8.0 MY LEADER/ SUPERVISOR
8.1 Is satisfied easily 1 2 3
8.2 Will support me if there are problems 1 2 3
8.3 Can be convinced and persuaded 1 2 3
8.4 Is a warm-hearted person 1 2 3
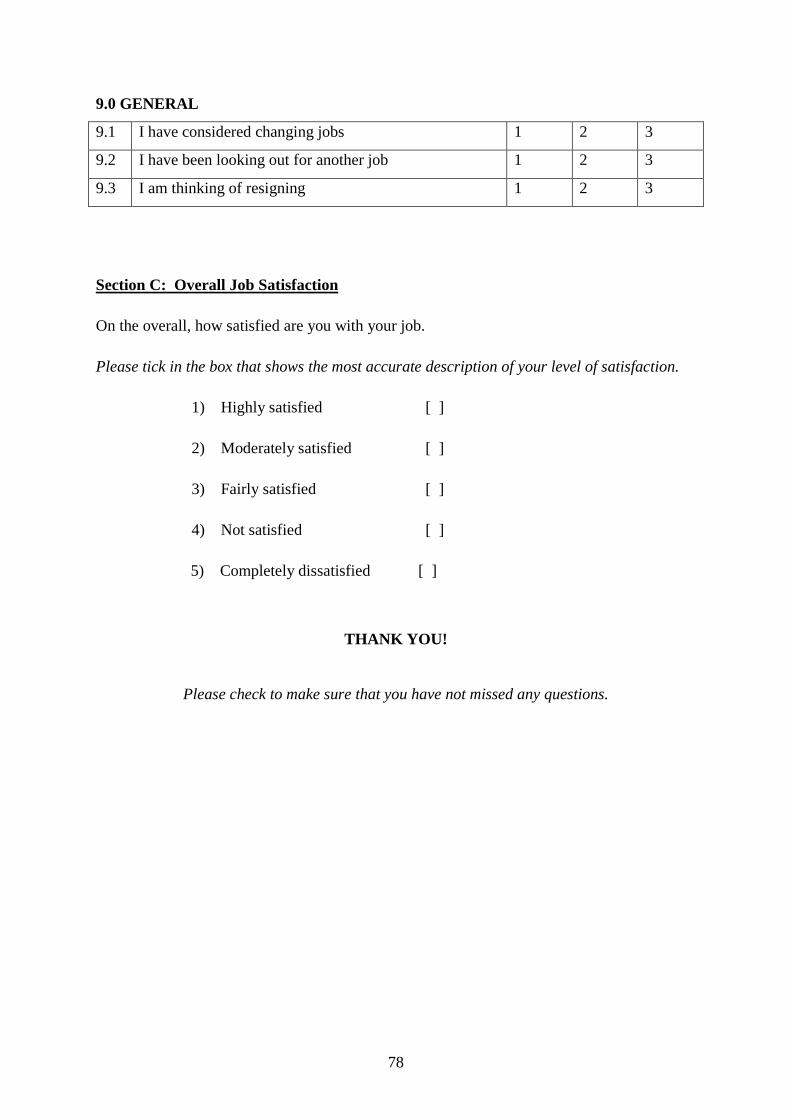
78
9.0 GENERAL
9.1 I have considered changing jobs 1 2 3
9.2 I have been looking out for another job 1 2 3
9.3 I am thinking of resigning 1 2 3
Section C: Overall Job Satisfaction
On the overall, how satisfied are you with your job.
Please tick in the box that shows the most accurate description of your level of satisfaction.
1) Highly satisfied [ ]
2) Moderately satisfied [ ]
3) Fairly satisfied [ ]
4) Not satisfied [ ]
5) Completely dissatisfied [ ]
THANK YOU!
Please check to make sure that you have not missed any questions.
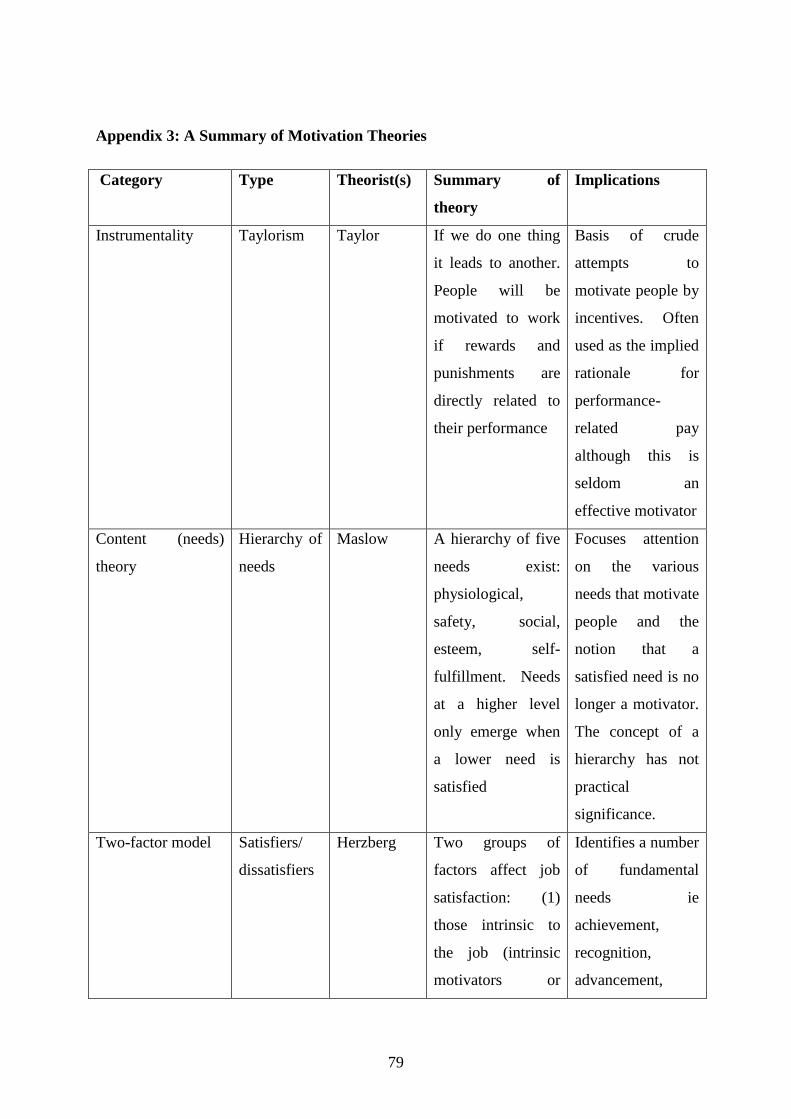
79
Appendix 3: A Summary of Motivation Theories
Category Type Theorist(s) Summary of
theory
Implications
Instrumentality Taylorism Taylor If we do one thing
it leads to another.
People will be
motivated to work
if rewards and
punishments are
directly related to
their performance
Basis of crude
attempts to
motivate people by
incentives. Often
used as the implied
rationale for
performance-
related pay
although this is
seldom an
effective motivator
Content (needs)
theory
Hierarchy of
needs
Maslow A hierarchy of five
needs exist:
physiological,
safety, social,
esteem, self-
fulfillment. Needs
at a higher level
only emerge when
a lower need is
satisfied
Focuses attention
on the various
needs that motivate
people and the
notion that a
satisfied need is no
longer a motivator.
The concept of a
hierarchy has not
practical
significance.
Two-factor model Satisfiers/
dissatisfiers
Herzberg Two groups of
factors affect job
satisfaction: (1)
those intrinsic to
the job (intrinsic
motivators or
Identifies a number
of fundamental
needs ie
achievement,
recognition,
advancement,
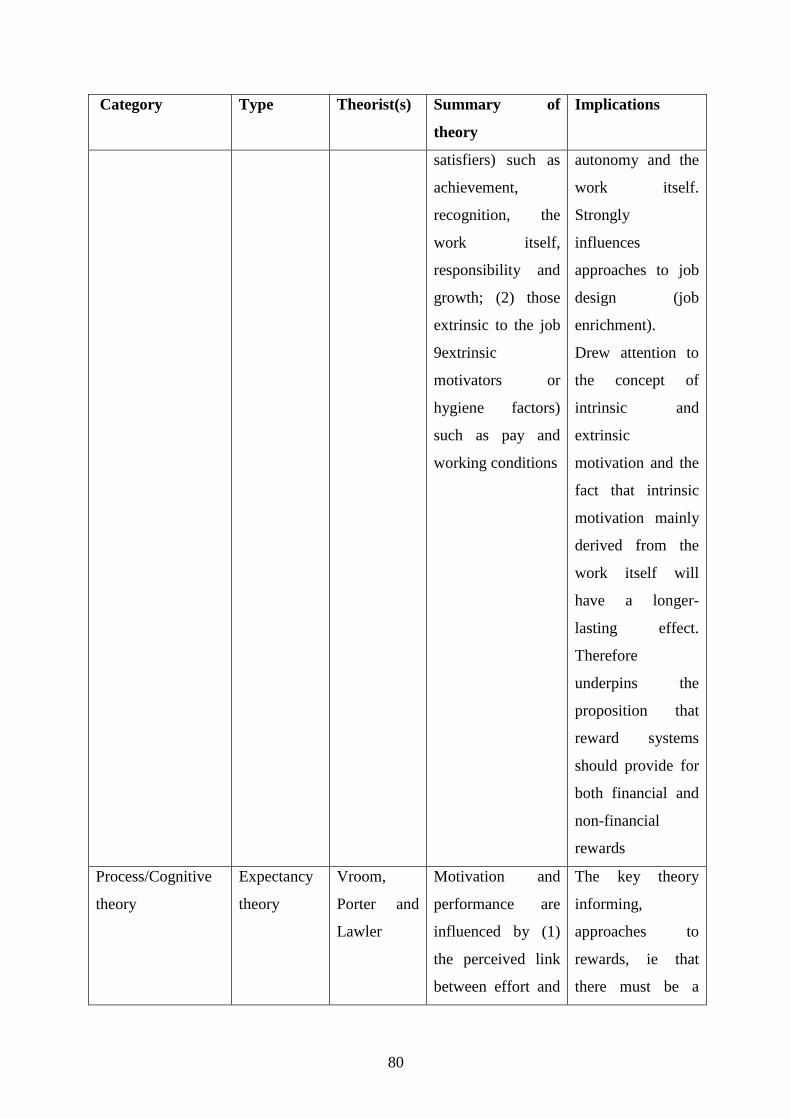
80
Category Type Theorist(s) Summary of
theory
Implications
satisfiers) such as
achievement,
recognition, the
work itself,
responsibility and
growth; (2) those
extrinsic to the job
9extrinsic
motivators or
hygiene factors)
such as pay and
working conditions
autonomy and the
work itself.
Strongly
influences
approaches to job
design (job
enrichment).
Drew attention to
the concept of
intrinsic and
extrinsic
motivation and the
fact that intrinsic
motivation mainly
derived from the
work itself will
have a longer-
lasting effect.
Therefore
underpins the
proposition that
reward systems
should provide for
both financial and
non-financial
rewards
Process/Cognitive
theory
Expectancy
theory
Vroom,
Porter and
Lawler
Motivation and
performance are
influenced by (1)
the perceived link
between effort and
The key theory
informing,
approaches to
rewards, ie that
there must be a
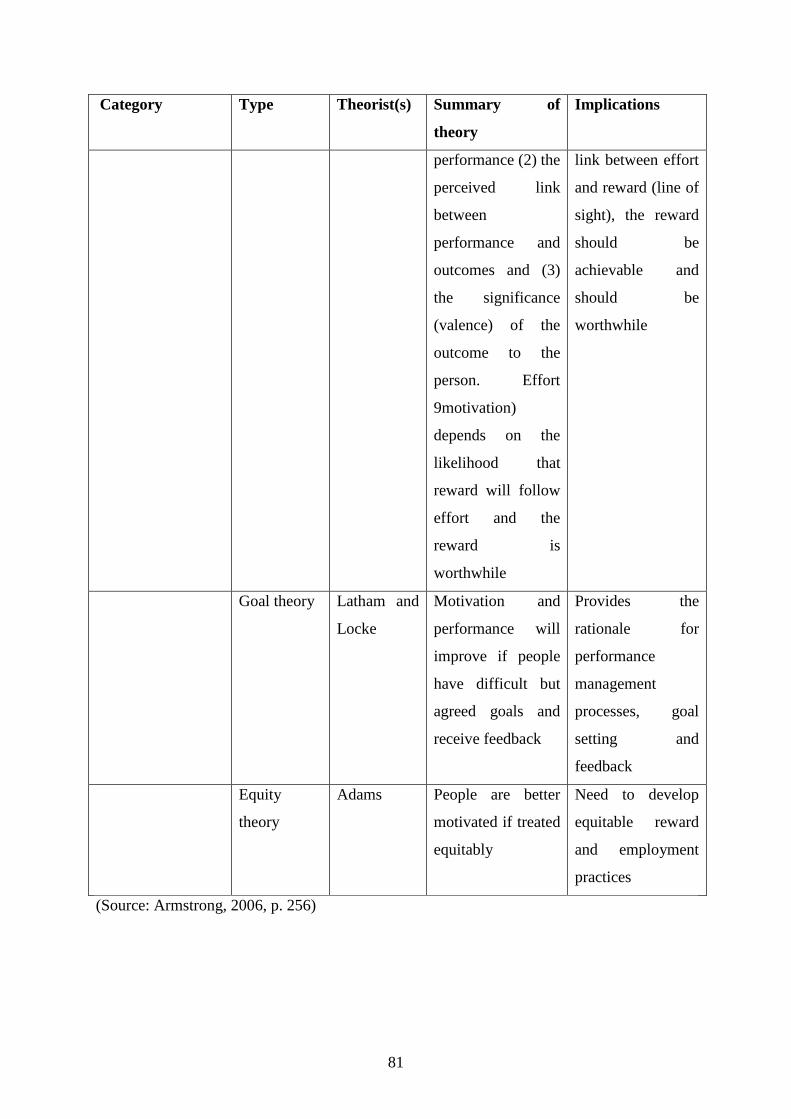
81
Category Type Theorist(s) Summary of
theory
Implications
performance (2) the
perceived link
between
performance and
outcomes and (3)
the significance
(valence) of the
outcome to the
person. Effort
9motivation)
depends on the
likelihood that
reward will follow
effort and the
reward is
worthwhile
link between effort
and reward (line of
sight), the reward
should be
achievable and
should be
worthwhile
Goal theory Latham and
Locke
Motivation and
performance will
improve if people
have difficult but
agreed goals and
receive feedback
Provides the
rationale for
performance
management
processes, goal
setting and
feedback
Equity
theory
Adams People are better
motivated if treated
equitably
Need to develop
equitable reward
and employment
practices
(Source: Armstrong, 2006, p. 256)