Embed Size (px)
Citation preview

EMPLOYMENT AT
CHERRY POINT Prepared by:
Hart Hodges, Western Washington University &
Bill Beyers, University of Washington
October
2014

1
Employment at Cherry Point Executive Summary
The goal of this report is to provide a point of reference in discussions about the jobs that currently exist
within the Cherry Point Industrial Zone in Whatcom County. It is not intended to serve any advocacy
purposes.
The scope of this report is limited to describing the jobs and their influence in the regional economy,
focusing on the number of jobs in the industrial zone, the wages received, the other jobs that are
indirectly related to the jobs in the industrial zone, fiscal impacts or taxes paid, and charitable
contributions from the businesses in the zone.
With that information as a backdrop, some of the key findings in the study include the following:
The Cherry Point Industrial Zone is home to 2,100 to 2,200 jobs, which is roughly 2.5 percent of
the total job base in the county – where there were roughly 84,000 jobs in 2013.
The jobs in the Cherry Point area have an average wage of roughly $114,000 per year,
influenced heavily by the wages paid at the refineries.
According to the Washington State Department of Employment Security, the average wage in
Whatcom County is $41,334 (data for 2013). If you remove the jobs at Cherry Point, the overall
average falls to $39,400. The average would fall again if you removed many of the jobs that
depend on the businesses at Cherry Point.
While only 2.5 percent of the jobs in Whatcom County are located in the Cherry Point Industrial
Zone, the Cherry Point area supports directly or indirectly roughly 11 percent of the jobs in the
County (roughly 9,000 jobs out of 84,000).
o The addition (or loss) of 50 jobs at the refineries would result in a total gain (or loss) of
270 jobs throughout the County.
o The addition (or loss) of 50 jobs at the Intalco smelter or electric generation facilities
would result in a total gain (or loss) of 163 jobs throughout the County.
o The addition (or loss) of 50 jobs at the electric generation facilities would result in a total
gain (or loss) of 193 jobs throughout the County.
The wages paid in the Cherry Point area account for roughly 9 percent of the total wages paid in
the county. However, the Cherry Point area supports directly or indirectly 15 percent of the
wages paid in the County (roughly $510 million out of a total of $3.5 billion in 2013).
The businesses in the Cherry Point Industrial Zone pay over $200 million in taxes each year.
Business and Occupation (B&O) taxes, hazardous substance taxes, and oil spill response taxes
account for roughly 80 percent of the total. Property taxes, payroll taxes, and sales and use
taxes make up the remainder. This figure includes more than $15 million in property taxes
alone.
The business also support others in the community by making more than $1 million in charitable
contributions each year.
2
Introduction
Western Washington University’s Center for Economic and Business Research (CEBR) was asked to
describe the jobs that currently exist within the Cherry Point Industrial Area in Whatcom County,
including a description of the influence those jobs have in the regional economy.1 Funding for this work
comes from various businesses in Whatcom County, through the Whatcom Business Alliance.
The report is not intended to serve any advocacy purposes. Rather, it is intended to provide a reference
point for discussions about the jobs that currently exist in the Cherry Point area and perhaps about small
changes to the employment levels at businesses in that area. For example, the information provided in
this report could be used to discuss what the impacts might be of adding or subtracting, say, 50 jobs at
one of the refineries or the Intalco smelter. (Include examples later in the report)
This report is not intended to show what might happen if a new business was added in an industry
sector that does not currently exist in the county, or what might happen if efforts were implemented to
significantly reduce the employment in the area (e.g., if efforts were implemented to ‘deindustrialize’
the area to reduce the number of jobs). Analyzing those sorts of changes would require discussions
about an economy that has a different structure than the current economy and is beyond the scope of
this report.
We show in this report the number of jobs, by industry sector, found in the Cherry Point Industrial Zone.
We also show wages paid for those jobs where information is available, along with estimates of tax
payments and charitable giving. When looking at the ripple or multiplier effects, we use both the
Washington State Input-Output Model and the IMPLAN software package. These models show how a
job in the Cherry Point area is connected to or influences other jobs in the county and/or state.
Description of Employment in the Region
The Cherry Point Industrial Zone is home to 2,100 to 2,200 jobs, which is roughly 2.5 percent of
the total job base in the county. Washington State Employment Security shows an estimate of
82,300 “covered” jobs in 2013 and 84,400 “nonfarm” jobs. (Different data sets and methods of
estimation give different estimates of the total number of jobs in the county.)
When people think about businesses in the Cherry Point area, they tend to think of the more iconic,
large employers: BP, Intalco, and Phillips 66. However, there are a number of other employers located
within or immediately adjacent to the industrial zone.
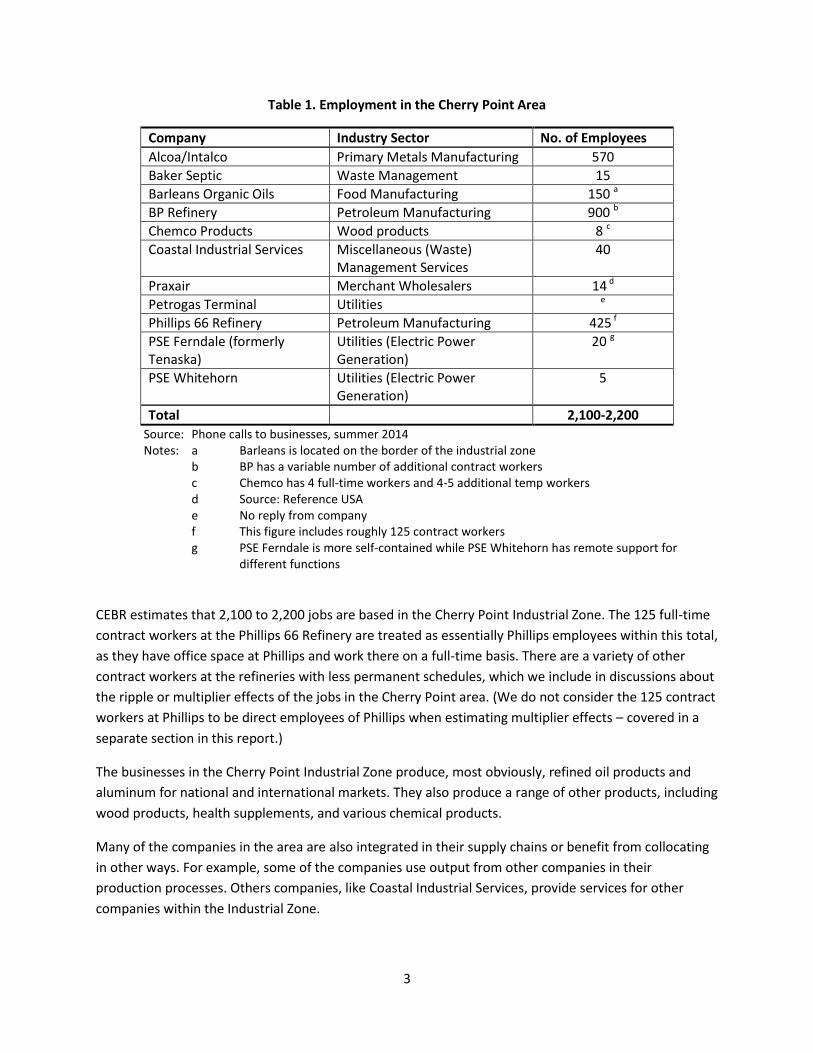
Table 1 shows the businesses and the number of workers at each business in the Cherry Point industrial
area. (Note: data for individual firms are not provided by the state. The state is obligated to treat certain
data – including the number of workers at a business – as confidential. We obtained the information in
the table from the businesses themselves or from data sources such as Reference USA. When we were
able to talk with someone at a business, we asked for permission to report the data.)
1 The primary researchers and authors were Dr. Hart Hodges, Director of Western Washington University’s Center
for Economic and Business Research, and Dr. Bill Beyers, Professor Emeritus, University of Washington.
3
Table 1. Employment in the Cherry Point Area
Company Industry Sector No. of Employees
Alcoa/Intalco Primary Metals Manufacturing 570
Baker Septic Waste Management 15
Barleans Organic Oils Food Manufacturing 150 a
BP Refinery Petroleum Manufacturing 900 b
Chemco Products Wood products 8 c
Coastal Industrial Services Miscellaneous (Waste) Management Services
40
Praxair Merchant Wholesalers 14 d
Petrogas Terminal Utilities e
Phillips 66 Refinery Petroleum Manufacturing 425 f
PSE Ferndale (formerly Tenaska)
Utilities (Electric Power Generation)
20 g
PSE Whitehorn Utilities (Electric Power Generation)
5
Total 2,100-2,200
Source: Phone calls to businesses, summer 2014 Notes: a Barleans is located on the border of the industrial zone
b BP has a variable number of additional contract workers c Chemco has 4 full-time workers and 4-5 additional temp workers d Source: Reference USA
e No reply from company f This figure includes roughly 125 contract workers g PSE Ferndale is more self-contained while PSE Whitehorn has remote support for
different functions
CEBR estimates that 2,100 to 2,200 jobs are based in the Cherry Point Industrial Zone. The 125 full-time
contract workers at the Phillips 66 Refinery are treated as essentially Phillips employees within this total,
as they have office space at Phillips and work there on a full-time basis. There are a variety of other
contract workers at the refineries with less permanent schedules, which we include in discussions about
the ripple or multiplier effects of the jobs in the Cherry Point area. (We do not consider the 125 contract
workers at Phillips to be direct employees of Phillips when estimating multiplier effects – covered in a
separate section in this report.)
The businesses in the Cherry Point Industrial Zone produce, most obviously, refined oil products and
aluminum for national and international markets. They also produce a range of other products, including
wood products, health supplements, and various chemical products.
Many of the companies in the area are also integrated in their supply chains or benefit from collocating
in other ways. For example, some of the companies use output from other companies in their
production processes. Others companies, like Coastal Industrial Services, provide services for other
companies within the Industrial Zone.
4
In addition to identifying the businesses located in the Industrial Zone, it can also be helpful to identify
some of the businesses they touch on a regular basis for context or to give more identity to the
businesses in the area. For example, the refineries rely heavily on consulting firms like Anvil, CH2MHill
and Matrix located in other parts of the county, as well as other firms who provide technical support
services such Acuren, Brinderson, Mistras, URS, Transfield Services, Western Refinery Services,
Whatcom Environmental Services, Dunkin & Bush, and Rain for Rent. The refineries also support a
variety of firms in the construction and related industries, such as JH Kelly, Dawson Construction, RAM
Construction, Brand Scaffold, Safeway Scaffold, Sicklesteel Cranes, Mills Electric, and Bay Valve. In
addition, they use recruiters in the area, like Bayside USA; caterers like Kelly’s O’Deli and the Pizza
Factory; rental companies like United Rentals and Birch Equipment Rentals; and other service providers
such as Management Services Northwest and Covenant Security.2 (Some of the jobs at these companies
are what we count when we estimate the multiplier effects of the jobs in the Cherry Point area.)
For perspective, the 2,150 jobs in the Cherry Point area represent 2.5 percent of the total nonfarm
employment base in Whatcom County. This percent, however, understates the role the jobs in the
industry play in the regional economy. Many of the jobs in the Cherry Point area pay relatively high
wages or salaries and help support a large number of other jobs in the region. The sample of
contractors that provide services to firms in the area also helps illustrate the high volume of business-to-
business activity, which also leads to jobs in the Cherry Point area helping to support a large number of
other jobs in the region. Most Whatcom County jobs do not have the same level of pay or business-to-
business activity as the jobs within the Cherry Point area.
Wages
The jobs in the Cherry Point area have an average wage of roughly $114,000 per year,
influenced heavily by the wages paid at the refineries.
According to the Washington State Department of Employment Security, the average wage in
Whatcom County is $41,334 (data for 2013). If you remove the jobs at Cherry Point, the overall
average falls to $39,400. The average would fall again if you removed many of the jobs that
depend on the businesses at Cherry Point.
The jobs in the Cherry Point Industrial Zone typically have wages above the county average, and in many
cases, well above the county average. Data from the State of Washington Department of Employment
Security shows wages by industry sector, not individual company. Confidentiality restrictions prevent
the state from showing data for individual firms and even limits the state’s ability to show detailed
information for a sector when there are too few firms in the sector and/or when there is a dominant
firm in the sector and reported data would reveal too much information about that firm.
2 This list of companies is not comprehensive or exhaustive. It is simply a list of companies that we know have
worked with firms in the Chery Point area. The sample helps illustrate the range of firms that benefit from the demand for services in the Cherry Point region, even though they are not located in the industrial zone itself.
5
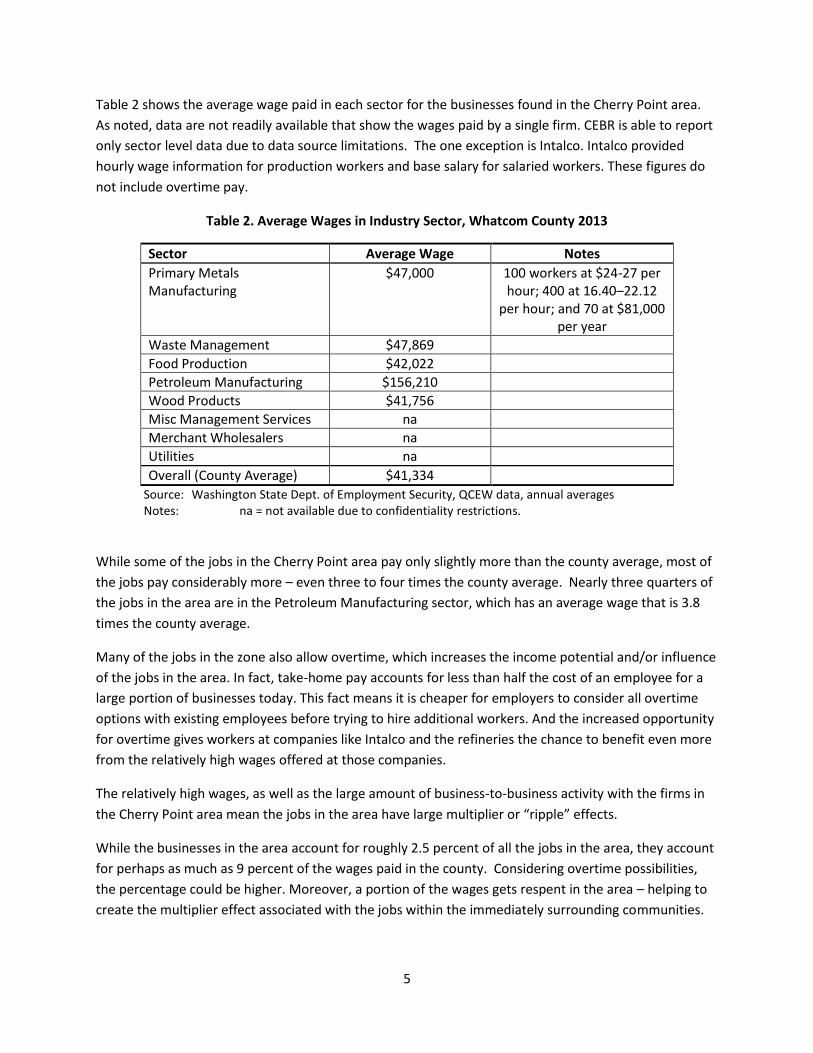
Table 2 shows the average wage paid in each sector for the businesses found in the Cherry Point area.
As noted, data are not readily available that show the wages paid by a single firm. CEBR is able to report
only sector level data due to data source limitations. The one exception is Intalco. Intalco provided
hourly wage information for production workers and base salary for salaried workers. These figures do
not include overtime pay.
Table 2. Average Wages in Industry Sector, Whatcom County 2013
Sector Average Wage Notes
Primary Metals Manufacturing
$47,000 100 workers at $24-27 per hour; 400 at 16.40–22.12
per hour; and 70 at $81,000 per year
Waste Management $47,869
Food Production $42,022
Petroleum Manufacturing $156,210
Wood Products $41,756
Misc Management Services na
Merchant Wholesalers na
Utilities na
Overall (County Average) $41,334
Source: Washington State Dept. of Employment Security, QCEW data, annual averages Notes: na = not available due to confidentiality restrictions.
While some of the jobs in the Cherry Point area pay only slightly more than the county average, most of
the jobs pay considerably more – even three to four times the county average. Nearly three quarters of
the jobs in the area are in the Petroleum Manufacturing sector, which has an average wage that is 3.8
times the county average.
Many of the jobs in the zone also allow overtime, which increases the income potential and/or influence
of the jobs in the area. In fact, take-home pay accounts for less than half the cost of an employee for a
large portion of businesses today. This fact means it is cheaper for employers to consider all overtime
options with existing employees before trying to hire additional workers. And the increased opportunity
for overtime gives workers at companies like Intalco and the refineries the chance to benefit even more
from the relatively high wages offered at those companies.
The relatively high wages, as well as the large amount of business-to-business activity with the firms in
the Cherry Point area mean the jobs in the area have large multiplier or “ripple” effects.
While the businesses in the area account for roughly 2.5 percent of all the jobs in the area, they account
for perhaps as much as 9 percent of the wages paid in the county. Considering overtime possibilities,
the percentage could be higher. Moreover, a portion of the wages gets respent in the area – helping to
create the multiplier effect associated with the jobs within the immediately surrounding communities.

6
Multiplier effects
The jobs in a given business, or in a given industry sector to be more precise, support jobs in other
sectors through business-to-business activities and through spending by the employee on personal
items. In economic impact analysis, the task is often to determine the impact of adding or subtracting
jobs at a given business. The jobs being added or taken away are referred to as a change in the direct
jobs. These are the jobs directly tied to a particular business or sector. They can also be viewed as the
jobs directly affected by a given event. The related impacts that arise due to changes in business
activities are called the indirect effects, and those that arise due to changes in household spending are
called the induced effects.
The relationship between the direct effects and the indirect and induced effects is often described in
terms of “multiplier effects”. That is, the total change (direct, indirect, and induced combined) is a
multiple of the direct change.
It can be important to note that the multiplier effects for a given change depend on the sector in which
the change occurs, the geographic location, and when the change occurs. The multiplier effects differ
depending on whether a job is added or taken away from a clothing store rather than an engineering
firm or business in another sector because the firms in different industry sectors interact differently with
the firms in other industry sectors. Moreover, the level of pay varies across firms or sectors. In addition,
the interactions between businesses and the patterns in household spending change over time. As such,
it doesn’t make sense to talk about multipliers without specifying the industry sector and time when the
data behind the multiplier were collected.
It is also worth noting that there are different multipliers for different measures of economic activity. It
does not make sense to talk about “the multiplier” for, say, petroleum refining. There is a multiplier for
changes in employment; a different multiplier for change in income; and a different multiplier for
changes in output. To be sure, the different multipliers are all related. You can describe an event in
terms of changes in employment, income, and/or output. The point here is simply to highlight the fact
that there is not a single multiplier or single way of describing the ripple effects associated with a given
event, despite media and promotional coverage. Nor is there always agreement on what the multiplier
effects really are, even if you focus on a particular industry and multiplier type.
Not surprisingly, there’s a tendency for advocates to hope for the largest possible multiplier. For
example, economic development specialists might want a large multiplier to make a particular project
look attractive (noting that job creation offers political appeal, so a large employment multiplier can
help make a project attractive). Similarly, an industry trade group may want a large employment or
income multiplier for the industry they support to show the importance of the industry to a community
or region. Part of our job at CEBR and in this report is to provide as plausible an estimate as possible for
the relevant multipliers.

7
The Washington Research Council offered in 2004 that the five refineries in Washington State had an
employment multiplier of 11.68, for state level impacts.3 That estimate suggests that adding one job at a
refinery in Washington generates or supports another 10.68 jobs in the state. The Research Council
released another report in 2012 (with a correction posted in April 2013) that claimed the employment
multiplier was 13.23.4 In comparison, a report prepared for the Western States Petroleum Association
(WSPA) in 2011 showed an employment multiplier for the sector of 2.51 in the State of California.5
While we would expect the employment multipliers for a change in one state to differ from the
employment multiplier for a similar change in another state, we would not expect the addition, or
subtraction, of jobs in the petroleum industry to be so dramatically different in two western states (even
noting the focus on petroleum refining in the report for Washington and a much broader definition of
the petroleum industry in the report for California).
CEBR generally relies on two different sources for identifying multipliers: The revised Washington State
Input-Output Model and IMPLAN. Using the revised Washington State Input-Output Model, we
estimate an employment multiplier of 6.70 for petroleum refining in Washington State. The IMPLAN
software package gives an employment multiplier of 8.08 for Washington. The range in employment
multipliers from 6.7 to 13.2 invites questions to be sure. We explore the differences in the multipliers
from different models in the next section.
In comparison, the literature is more consistent with multipliers for other industries, including the
aluminum smelting industry in Washington. A report prepared for The Pacific Northwest Aluminum
Industry in 2000 suggests an employment multiplier of 3.94 for that industry in Washington State. 6 This
study has been updated and cited in a variety of other studies, with the same multiplier. CEBR observes
an estimate of 3.88 using the revised Washington State Input-Output Model and 4.18 using the IMPLAN
model.
Multipliers – a closer look
One reason different reports give different estimates for multipliers is the data and exact methodology
used may differ. One report may use multipliers provided by the US Bureau of Economic Analysis.
Another report may use the IMPLAN or REMI software packages - both popular commercial packages.
The different models use different baseline data and can include different factors in the calculations.
Sometimes the geographic boundaries of the study area will differ from one report to the next, but that
should not be a factor when discussing multipliers at the state or county levels.
The Washington Research Council used the REMI model in its reports with the large multipliers for the
petroleum refining industry. CEBR uses both the IMPLAN software and the Washington State Input-
3 http://researchcouncil.files.wordpress.com/2013/08/final-report.pdf (accessed August 2014)
4 http://researchcouncil.files.wordpress.com/2013/08/2012refineryreportfinal040913.pdf (accessed August 2014)
5
https://www.wspa.org/sites/default/files/uploads/documents/Industry%20Issues/Purvin%20%26%20Gertz%20Economic%20Impacts%20FINAL.pdf (accessed August 2014) 6 https://www.bpa.gov/power/pl/aluminumstudy/ImpactConway.pdf (accessed August 2014); see also
https://www.alcoa.com/locations/usa_intalco/en/pdf/Aluminum_Industry_Impact_2005.pdf (accessed 2014)

8
Output Model. Washington State is one of a few states that has developed a model that shows how
industries in the state interact with each other and funds periodic surveys to update the model. Given
the different software, it is not expected to arrive at the same multipliers for the petroleum industry as
those presented in the Washington Research Council reports. However, the magnitude of the
differences found are problematic.
One question is whether an employment multiplier of 13 really makes sense. For example, our analysis
has trouble imagining that adding one job at a refinery would generate 12 additional jobs in the state.
That impact seems too large to be plausible and it invites related questions about what elements or data
in the models really drive the estimates and what should ultimately be reported for policy purposes.
CEBR has found that the way one accounts for ‘regional purchases’ in a sector can have a dramatic
impact on the magnitude of the multipliers generated by the model. In the case of the Washington State
model, it is important to ensure that the survey results (e.g., what portion of total purchases are made
within the study area or region) are entered correctly in the model. With other models, such as IMPLAN
and REMI, it is critical to check whether the underlying assumptions in the model – often based on
national employment and other patterns – are appropriate for the study area.
CEBR does not have access to the REMI model, but a colleague at REMI got an employment multiplier
for petroleum refining in Washington of roughly 6 when (appropriately) suppressing job increases in the
government sector due to increases in employment at refineries. The automatic assumption in the
REMI model is that increased activity in a given sector will lead to higher tax revenues and proportional
increases in government employment. However, the increase in output associated with new
employment at a refinery is very high and would almost certainly not lead to a proportional increase in
employment in the government sector. As such, this assumption in the model needs to be suppressed
when analyzing the impacts of changes in employment in the petroleum sector.
One version of the Washington State Input-Output Model had an incorrect number for regional
purchases in petroleum refining, giving an employment multiplier of 21. Using the correct share of
regional purchases, but not addressing other problems, we found that the model gave an employment
multiplier close to 13. After correcting for data entry and related errors , we found a multiplier of 6.70,
similar to what REMI suggested.
Appendix A offers additional detail on the multipliers.
Regional Impacts
Most of the jobs in the Cherry Point area have employment multipliers larger than 3. For
comparison, jobs in sectors such as architecture and engineering, eating and drinking
establishments, accommodations, and retail all have multipliers less than 2.
While only 2.5 percent of the jobs in Whatcom County are located in the Cherry Point Industrial
Zone, the Cherry Point area supports directly or indirectly roughly 11 percent of the jobs in the
County.
9
o The addition (or loss) of 50 jobs at the refineries would result in a total gain (or loss) of
270 jobs throughout the County.
o The addition (or loss) of 50 jobs at the Intalco smelter or electric generation facilities
would result in a total gain (or loss) of 163 jobs throughout the County.
o The addition (or loss) of 50 jobs at the electric generation facilities would result in a total
gain (or loss) of 193 jobs throughout the County.
The wages paid in the Cherry Point area account for roughly 9 percent of the total wages paid in
the county. However, the Cherry Point area supports directly or indirectly 15 percent of the
wages paid in the County (roughly $510 million out of a total of $3.5 billion in 2013).
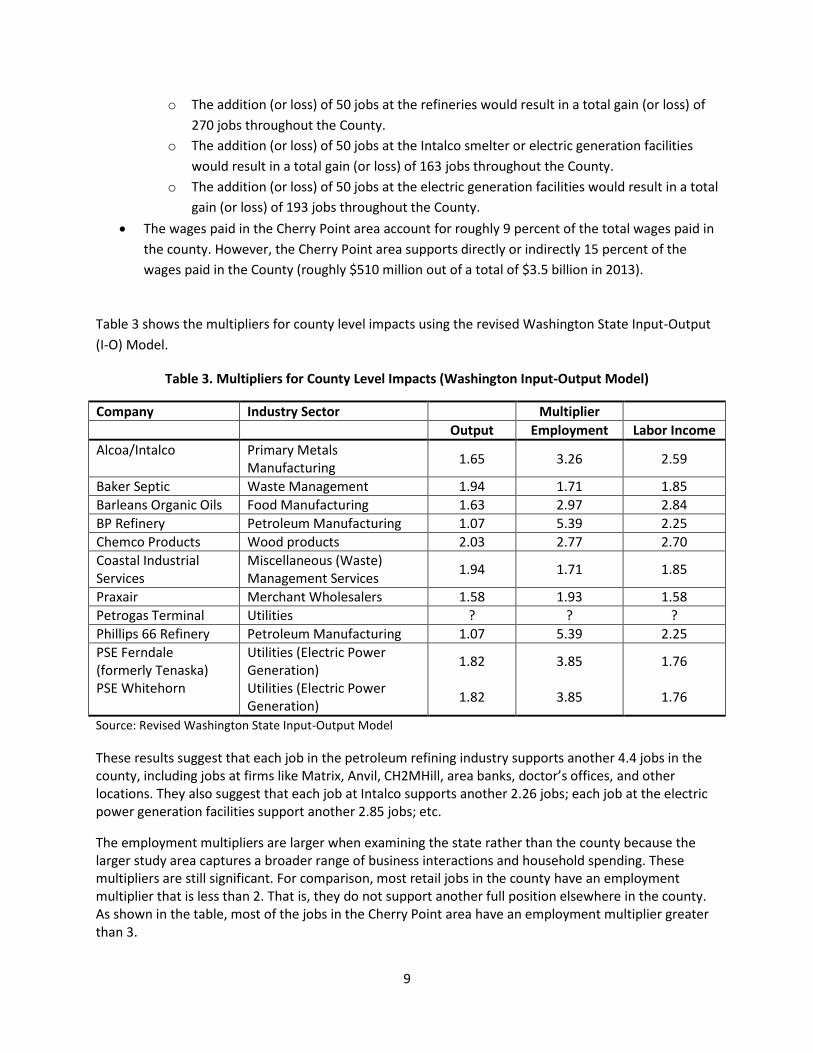
Table 3 shows the multipliers for county level impacts using the revised Washington State Input-Output
(I-O) Model.
Table 3. Multipliers for County Level Impacts (Washington Input-Output Model)
Company Industry Sector Multiplier
Output Employment Labor Income
Alcoa/Intalco Primary Metals Manufacturing
1.65 3.26 2.59
Baker Septic Waste Management 1.94 1.71 1.85
Barleans Organic Oils Food Manufacturing 1.63 2.97 2.84
BP Refinery Petroleum Manufacturing 1.07 5.39 2.25
Chemco Products Wood products 2.03 2.77 2.70
Coastal Industrial Services
Miscellaneous (Waste) Management Services
1.94 1.71 1.85
Praxair Merchant Wholesalers 1.58 1.93 1.58
Petrogas Terminal Utilities ? ? ?
Phillips 66 Refinery Petroleum Manufacturing 1.07 5.39 2.25
PSE Ferndale (formerly Tenaska)
Utilities (Electric Power Generation)
1.82 3.85 1.76
PSE Whitehorn Utilities (Electric Power Generation)
1.82 3.85 1.76
Source: Revised Washington State Input-Output Model
These results suggest that each job in the petroleum refining industry supports another 4.4 jobs in the county, including jobs at firms like Matrix, Anvil, CH2MHill, area banks, doctor’s offices, and other locations. They also suggest that each job at Intalco supports another 2.26 jobs; each job at the electric power generation facilities support another 2.85 jobs; etc.
The employment multipliers are larger when examining the state rather than the county because the larger study area captures a broader range of business interactions and household spending. These multipliers are still significant. For comparison, most retail jobs in the county have an employment multiplier that is less than 2. That is, they do not support another full position elsewhere in the county. As shown in the table, most of the jobs in the Cherry Point area have an employment multiplier greater than 3.

10
The output and labor income multipliers show different ways of measuring the influence of activity or
wages in the Cherry Point area on the rest of the county. For example, each dollar of labor income at
Intalco generates an additional $1.59, and each dollar of income at Barleans generates an additional
$1.84 in the county. The output multipliers can be used in a similar fashion. In short, it can make sense
to talk about the employment impacts or the wage impacts or the output impacts associated with a
given event; but it would be double counting, as well as misleading, to add the different types of impacts
together.
Table 4 shows the employment impacts in Whatcom County associated with the jobs in the Cherry Point
area, using the multipliers from the revised Washington State Input-Output Model.
Table 4. County Level Employment Impacts
Company Industry Sector Direct Employment Total
Employment Multiplier Impact
Alcoa/Intalco Primary Metals Manufacturing
570 3.26 1,858
Baker Septic Waste Management 15 1.71 26
Barleans Ogranic Oils Food Manufacturing 150 2.97 446
BP Refinery Petroleum Manufacturing 900 5.39 4,851
Chemco Products Wood products 8 2.77 22
Coastal Industrial Services
Miscellaneous (Waste) Management Services
40 1.71 na 1
Praxair Merchant Wholesalers 14 1.93 27
Petrogas Terminal ? ? ? ?
Phillips 66 Refinery Petroleum Manufacturing 3001 5.39 1,617
PSE Ferndale (formerly Tenaska)
Utilities (Electric Power Generation)
20 3.85 77
PSE Whitehorn Utilities (Electric Power
Generation) 5 3.85 19
Total 2,100-2,200 9,000
Source: Multipliers from revised Washington State I-O Model
Notes: We reduced the number of jobs at Phillips 66 to the number of Phillips employees only – not any contract
workers. We also do not include the induced and indirect jobs associated with Coastal Industrial. We made these
changes based on concerns about double counting. The contract workers at Phillips and the employees at Coastal
Industrial are likely to be included in the indirect and induced jobs associated with the refineries and Intalco.
The figures in Table 4 suggest that the businesses in the Cherry Point area account for and/or support
roughly 10 percent of all the jobs in the county. (As mentioned in the table notes, we do not consider
the indirect and induced effects associated with the jobs at Coastal Industrial Services. Coastal Industrial
is a vendor for other firms in the Cherry Point area, especially the refineries and Intalco, so we worry
about double counting the ripple effects if we include them in our estimate of total impacts.)

11
The employment multiplier shown in the table for petroleum refining suggests that adding, say, 50 jobs
at the refineries would result in an increase of 270 jobs overall (50 * 5.39 = 269.5). Of course, the
multiplier effect works with layoffs as well. Reducing employment at the refineries by 50 jobs would
result in a loss of 270 jobs overall.
Multiplying the wages paid at each business in the Cherry Point area by the appropriate income
multiplier gives an estimate of the wages in the area that depend either directly or indirectly on the
activity at Cherry Point. That figure is more than 15 percent of all the wages paid in the county.
We provide in Appendix B multipliers for Whatcom County for the same sectors, based on the IMPLAN
software package. This information is for comparison or reference purposes.
A Note on the Misuse of Multipliers
Economic development specialists, politicians, and others rely on multiplier effects to show the possible
impacts of recruiting a new business – or perhaps the consequences of a potential business closure. One
problem with this use of multipliers is that the application may not be appropriate.
Multipliers show the linear relationship between industry sectors at a given point in time for a given
study area. Large changes, whether the addition of new firms or the loss of existing firms, may or may
not represent a change that can be analyzed with existing multipliers. In an extreme case, the addition
of a firm in an industry that is not currently represented in a community (i.e., there are no existing firms
in that industry in the community) cannot be modeled with multipliers because no multiplier would exist
for that industry. Similarly, if a firm closes and the closure means the industry sector is no longer
represented in the area, the analysis of that loss requires more than just the application of existing
multipliers. The existing multipliers assume a given structure, and the loss of the firm represents a
change in the structure of the economy in the study area or a change in the industries that exist in the
study area.
In the end, relatively large changes to industry sectors may or may not be modeled appropriately with
multipliers like those available with the existing Washington State Input-Output Model or IMPLAN. Work
may be needed to assess changes to the structure of the regional economy and how those changes
might affect the multipliers.
One example of note that was discussed in the recent past was how many jobs might be lost if the
Intalco Smelter had to close because it could not secure a contract for electricity. Another is the possible
addition of a bulk cargo export terminal in the Cherry Point area. In both cases estimates of the
potential impacts have relied on existing multipliers. In fact, more work is needed in both cases. The loss
of Intalco would mean more than just the loss of a single firm in an industry sector. It would mean the
elimination of the entire sector from the local economy. And the addition of the bulk cargo facility
would mean more than the addition of another marine terminal – it could possibly be viewed as the
addition of a new industry sector and might need to be modeled as such.

12
In the end, analysts are often a bit lazy and use readily available multipliers more than is appropriate. In
many cases more analysis is needed to assess the likely impacts of a given change or event than simply
multiplying the direct impacts by an existing multiplier.
We also note the risk of double counting. For example, some of the indirect jobs associated with the
refineries might be found at other businesses within the Cherry Point Industrial Zone. We did not
include the employment at Coastal Industrial Services when estimating the total number of jobs
supported by the businesses at Cherry Point because we found that Coastal Industrial works for the
other businesses within the industrial zone more than it works with other firms outside the zone. If we
had included the jobs at Coastal Industrial Services as direct jobs when estimating total impacts, we
would have been counting them as both indirect jobs tied to the refineries and Intalco while also
viewing them as direct jobs that generate other indirect jobs.
In general, it is important to know enough about the businesses being analyzed to avoid problems of
double counting. It is also important to estimate the multiplier effects for the businesses in each
industry sector appropriately and not combine businesses or try to imagine an average multiplier.
Tax Impacts
We estimate that the businesses in the Cherry Point Industrial Zone pay over $200 million in
taxes each year. Business and Occupation (B&O) taxes, hazardous substance taxes, and oil spill
response taxes account for roughly 80 percent of the total. Property taxes, payroll taxes, and
sales and use taxes make up the remainder. This figure includes more than $15 million in
property taxes alone.
As with employment data, information on the taxes paid by any single company is considered to be
confidential. Fortunately, several of the companies in the Cherry Point area provided information, with
the understanding that we would show only a gross estimate for all the businesses in the industrial
zone. This actual information helped us determine whether the tax impact data from the IMPLAN
software was reasonably accurate (noting that the software manufacturers can only include in their
models a rough estimate of tax rates and may or may not include state and industry specific taxes such
as the Washington State hazardous substance tax.) The tax estimates from the IMPLAN software
underestimated the taxes paid by the refineries, presumably because the model does not include the
hazardous substance and oil spill response taxes.
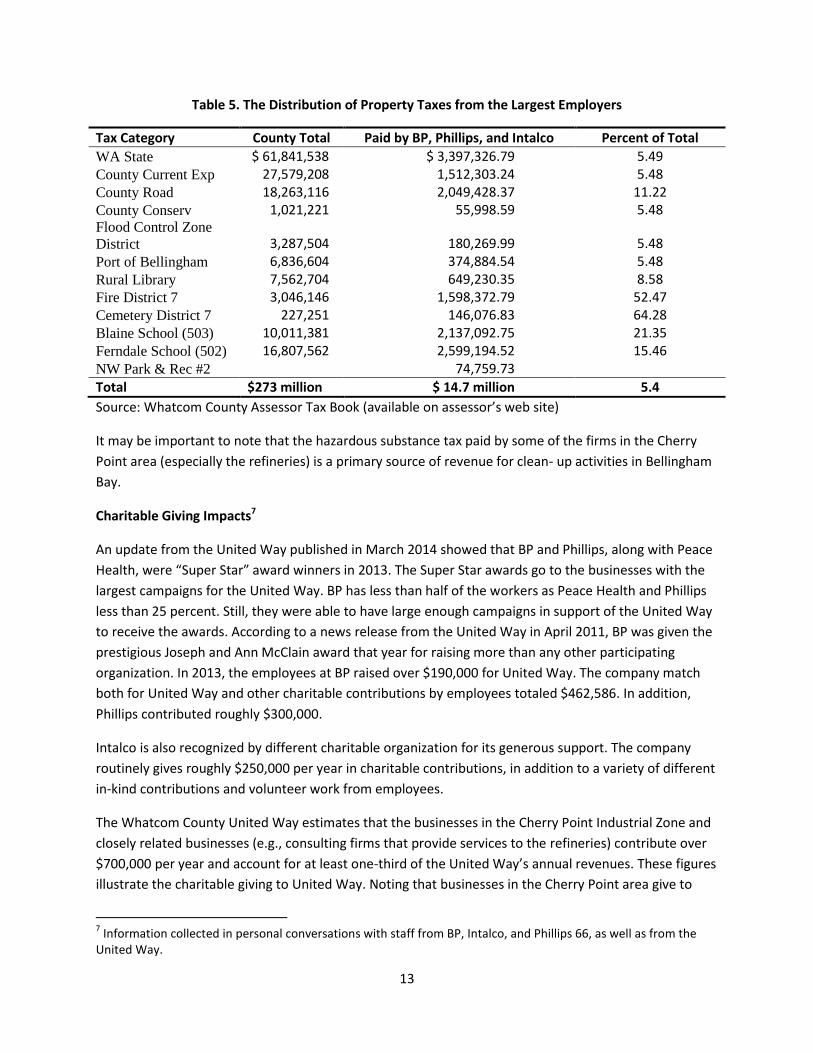
Table 5 shows detailed data from the Whatcom County Tax Assessor for property taxes paid by the
largest employers in the Cherry Point area.
13
Table 5. The Distribution of Property Taxes from the Largest Employers
Tax Category County Total Paid by BP, Phillips, and Intalco Percent of Total
WA State $ 61,841,538 $ 3,397,326.79 5.49
County Current Exp 27,579,208 1,512,303.24 5.48
County Road 18,263,116 2,049,428.37 11.22
County Conserv 1,021,221 55,998.59 5.48 Flood Control Zone
District 3,287,504 180,269.99 5.48
Port of Bellingham 6,836,604 374,884.54 5.48
Rural Library 7,562,704 649,230.35 8.58 Fire District 7 3,046,146 1,598,372.79 52.47 Cemetery District 7 227,251 146,076.83 64.28 Blaine School (503) 10,011,381 2,137,092.75 21.35
Ferndale School (502) 16,807,562 2,599,194.52 15.46
NW Park & Rec #2 74,759.73
Total $273 million $ 14.7 million 5.4
Source: Whatcom County Assessor Tax Book (available on assessor’s web site)
It may be important to note that the hazardous substance tax paid by some of the firms in the Cherry
Point area (especially the refineries) is a primary source of revenue for clean- up activities in Bellingham
Bay.
Charitable Giving Impacts7
An update from the United Way published in March 2014 showed that BP and Phillips, along with Peace
Health, were “Super Star” award winners in 2013. The Super Star awards go to the businesses with the
largest campaigns for the United Way. BP has less than half of the workers as Peace Health and Phillips
less than 25 percent. Still, they were able to have large enough campaigns in support of the United Way
to receive the awards. According to a news release from the United Way in April 2011, BP was given the
prestigious Joseph and Ann McClain award that year for raising more than any other participating
organization. In 2013, the employees at BP raised over $190,000 for United Way. The company match
both for United Way and other charitable contributions by employees totaled $462,586. In addition,
Phillips contributed roughly $300,000.
Intalco is also recognized by different charitable organization for its generous support. The company
routinely gives roughly $250,000 per year in charitable contributions, in addition to a variety of different
in-kind contributions and volunteer work from employees.
The Whatcom County United Way estimates that the businesses in the Cherry Point Industrial Zone and
closely related businesses (e.g., consulting firms that provide services to the refineries) contribute over
$700,000 per year and account for at least one-third of the United Way’s annual revenues. These figures
illustrate the charitable giving to United Way. Noting that businesses in the Cherry Point area give to
7 Information collected in personal conversations with staff from BP, Intalco, and Phillips 66, as well as from the
United Way.

14
other organizations and/or match the contributions from their employees to other causes and
organizations, we assume the total giving to charity by businesses in the area exceeds $1 million
annually.
Scope Revisited
The employment and wage impacts of a given job probably are not the only impacts associated with the
job. There may be environmental and various socioeconomic factors to consider. An economic impact
analysis that focuses on employment, wages, and taxes simply isn’t a good tool for analyzing the broad
net impacts associated with a given change or event. For example, someone might want to know the
broad net impact of adding 50 jobs, or losing 50 jobs, at one of the refineries at Cherry Point. And they
might want to be sure to include environmental and other factors not found in an economic impact
analysis. In such cases, a broader framework, like a benefit-cost analysis, could be helpful.
While preparing this report we wondered what we might offer if we looked past the employment, wage,
tax, and charitable giving dimensions. We started to discuss an interesting set of questions, including but
not limited to the following:
Cherry Point businesses pay
roughly $200 million in taxes,
including more than $15 million
in property taxes
Cherry Point supports
9,000+ direct, indirect, and
induced jobs
Cherry Point businesses and
closely related businesses
make over $1million per year
in charitable contributions
Cherry Point Industrial Zone
2,100+ jobs with an average
wage over $114,000 per year

15
If there are negative environmental impacts associated with the production of a given good or
service, how should we decide how to allocate those impacts? Some could be attributed to the
businesses where the production activities occur, but some should be assigned to the consumer
as well.
If ‘dirty’ jobs are moved out of a study area, but consumer behavior hasn’t changed, how do you
include in the analysis something to account for the fact that the negative impacts still exist,
somewhere?
Significant changes such as the addition of a new industry in a region or the loss of an entire
industry in a region are difficult changes to analyze. Such changes require consideration of
different scenarios of what might happen with the change in structure of the regional economy.
How do you ensure that the scenarios are plausible and meaningful?
o Scenarios that sound good as a story may not hold together when you start trying to be
clear about cause and effect relationships, about how an economy might actually
change as a result of a given policy or event, etc.
How accurate or useful are input-output models when building forecasts?
o Technology is changing rapidly, which can mean changes in the relationship between
output and labor. Care is needed when trying to use impact models such as the ones
used here when doing any type of forecasting work.
How do you build consensus around data? Disagreement about what data are or are not
acceptable can paralyze policy analysis.
Conclusion
The businesses in the Cherry Point Industrial Zone play a very significant role in the regional economy.
They support perhaps 10 percent of all the jobs and 15 percent of all the wages paid in the county. They
also pay roughly 5 percent of all property taxes paid in the county and they, along with their employees,
help generate over $1 million per year in charitable donations each year.
This report is not an advocacy piece. It is intended to provide a reference point for discussions about the
jobs that currently exist in the Cherry Point area.

16
References
Conway, Richard (2005) “The Economic Impacts of the Washington State Aluminum Industry”
https://www.alcoa.com/locations/usa_intalco/en/pdf/Aluminum_Industry_Impact_2005.pdf
Conway and Associates (2011) “The Impact of Energy-Intensive Manufacturers on Small Economies”
Miller, Ronald E. & Blair, Peter D. (2009) Input-Output Analysis. Foundations and Extensions.
Cambridge: Cambridge University Press. Chapter 8.2, Location Quotients and Related Techniques, pp.
349-359.
Washington Research Council (2012), The Economic Contribution of Washington State’s Petroleum Refining Industry in 2011, (http://researchcouncil.files.wordpress.com/2013/08/2012refineryreportfinal040913.pdf)
Washington State Office of Financial Management, http://www.ofm.wa.gov/economy/io/

17
Appendix A - Whatcom County Multipliers
The Washington Input-Output Model was modified through the use of the location quotient method of
adjustment to produce an input-output model for Whatcom County. The Washington Input-Output
Model can be found at the website of the Washington State Office of Financial Management
(http://search.usa.gov/search?utf8=%E2%9C%93&affiliate=ofm&query=input+output&commit=Search).
This method is widely used to adjust input-output models from the structure of a benchmark region to a
smaller region (Miller & Blair 2009). Table A-1 contains estimates of location quotients for Whatcom
County, and the values used to adjust the Washington input-output model’s structure. In the location
quotient method the direct requirements matrix of the benchmark region has coefficients reduced
when location quotients are less than one. Thus, in Table A-1 the right hand column shows the values
used to adjust the direct requirements matrix. For example, in the petroleum refining sector Whatcom
County has an estimated location quotient of 12.68, implying that there is ample supply of the output of
this sector that can supply demands of Whatcom County industries. In contrast, the air transportation
sector is estimated to have a location quotient of .626, meaning that this sector can only supply 62.6%
of the state level demands for services from this sector in Whatcom County. For rows in the direct
requirements matrix where the values of the location quotient is less than one, the state level
coefficients are multiplied by the location quotients, reducing the value of the state level direct
requirements coefficients. The resulting inverse matrix used for impact analysis has lower overall
multipliers than in the state input-output model due to this adjustment process. A combination of
Washington State Employment Security Department QCED data and data from the U.S. Bureau of
Economic Analysis were used to develop these location quotients.
Table A-1 Whatcom County Location Quotients
Sector NAICS Location Quotient
LQ for adjustment
1. Crop Production 111 1.263 1
2. Animal Production 112 4.013 1
3. Forestry and Logging 113 (Incl. state forests,
etc.) 2.198 1
4. Fishing, Hunting, and Trapping 114 2.912 1
5. Mining 21 0.958 0.958
6. Electric Utilities 2211 (Incl. public, BPA,
etc.) 1 1.000
7. Gas Utilities 2212 (Incl. public) 1 1.000
8. Other Utilities 2213 (Incl. public) 1 1.000
9. Highway, Street, and Bridge Construction 2373 0.818 0.818
10. Other Construction 23 except 2373 1.311 1.000 11. Food, Beverage and Tobacco Manufacturing 311, 312 1.802 1.000

18
12. Textiles and Apparel Mills 313, 314, 315 3.411 1.000
13. Wood Product Manufacturing 321 2.782 1.000
14. Paper Manufacturing 322 0.155 0.155
15. Printing and Related Activities 323 0.856 0.856 16. Petroleum and Coal Products Manufacturing 324 12.682 1.000
17. Chemical Manufacturing 325 0.755 0.755 18. Nonmetallic Mineral Products Manufacturing 327 0.979 0.979
19. Primary Metal Manufacturing 331 3.771 1.000
20. Fabricated Metals Manufacturing 332 0.776 0.776
21. Machinery Manufacturing 333 1.234 1.000 22. Computer and Electronic Product Manufacturing 334 0.341 0.341
23. Electrical Equipment Manufacturing 335 2.772 1.000
24. Aircraft and Parts Manufacturing 3364 0.214 0.214
25. Ship and Boat Building 3366 (Incl.
federal/PSNS) 0.662 0.662 26. Other Transportation Equipment Manufacturing
3361, 3362, 3363, 3365, 3369 0.966 0.966
27. Furniture Product Manufacturing 337 0.812 0.812
28. Other Manufacturing 316, 326, 339 1.610 1.000
29. Wholesale 423 0.724 0.724
30. Non-Store Retail 454 0.587 0.587
31 Other Retail 44-45 excluding 454 1.243 1.000
32. Air Transportation 481 0.626 0.626
33. Water Transportation 483 (Incl. Ferry) 0.049 0.049
34. Truck Transportation 484 1.060 1.000
35. Other Transportation/Postal Offices 482, 485, 486, 487, 491,
492 (Incl. transit) 3.483 1.000 36. Support Activities for Storage, Transportation and Warehousing 488, 493 1.016 1.000 37. Software Publishers & Data Processing & related services 5112, 5182 0.279 0.279
38. Telecommunications 517 0.943 0.943
39. Other Information 5111, 512, 515, 516,
519 0.872 0.872
40. Credit Intermediation and Related Activities 521, 522 1.147 1.000
41. Other Finance and Insurance 523, 524, 525 0.491 0.491
42. Real Estate and Rental and Leasing 53 except real estate 0.759 0.759
43. Legal /Accounting and Bookkeeping /Management Services
5411, 5412, 5416, 5418, 5419, 55 0.573 0.573
44. Architectural, Engineering, and Computing Services 5413, 5414, 5415, 5417 0.653 0.653
45. Educational Services 61 0.752 0.752

19
46. Ambulatory Health Care Services 621 0.956 0.956
47. Hospitals 622 1.355 1.000 48. Nursing and Residential Care Facilities, Social Assistance 623, 624 0.980 0.980
49. Arts, Recreation, and Accommodation 71, 721 1.158 1.000
50. Food Services and Drinking Places 722 1.192 1.000 51. Administrative/Employment Support Services 561 0.834 0.834 52. Waste Management/Other, and Agriculture Services 562, 81, 115 0.860 0.860
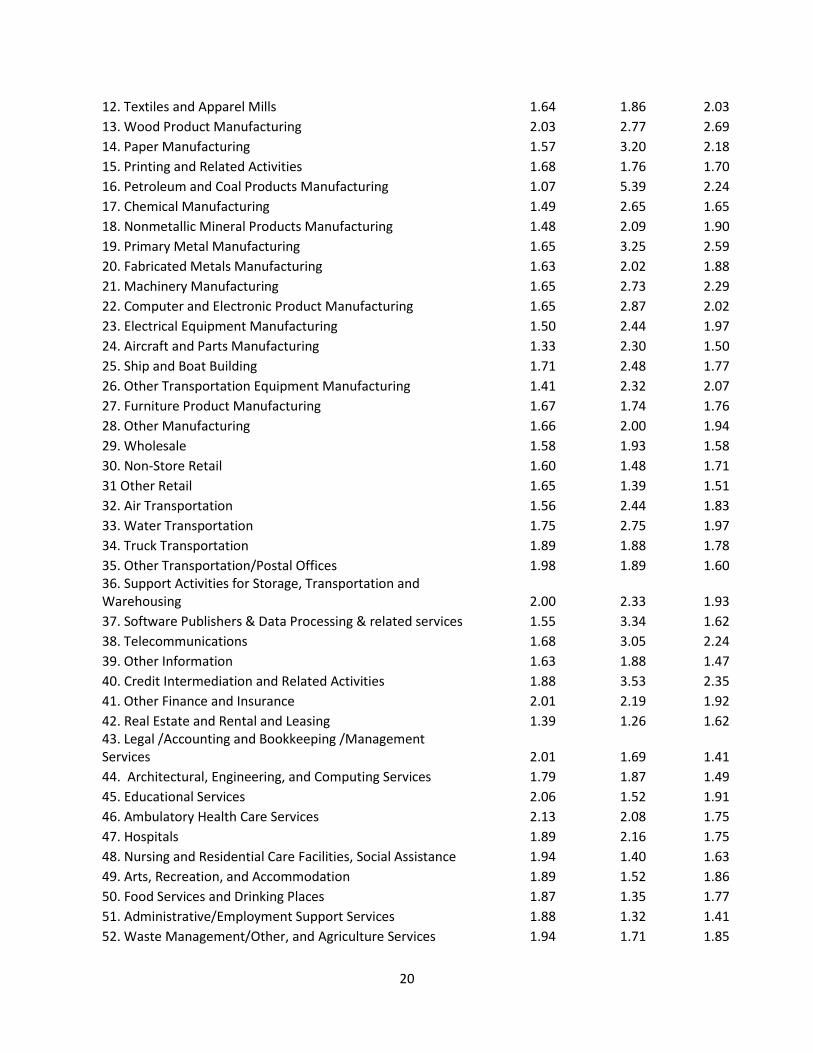
The resulting input-output model yields multipliers for each industry. Three broad categories of
multipliers are created: output, labor income and employment. Table A-2 contains these multipliers for
each industry as well as the average across industries (a simple average, not weighted by output). Each
of these categories of multipliers reports estimates of total activity in Whatcom County per unit of direct
activity. For example, within the crop production sector, total sales of all industries in Whatcom County
are estimated to be $1.78 per $1 of direct output. It is estimated that 1.45 total jobs in Whatcom
County are created for each direct job in Crop Production, and it is estimated that $1.63 in labor income
is created per dollar of direct income in the crop production sector. One of the reasons why input-
output models are so widely used is because of their ability to capture different multiplier relationships
for sectors. The linkage structure of sectors, as well as their magnitude of direct labor income influence
these values. Sectors with relatively low labor income per worker have relatively low income
multipliers. Sectors with weak linkages to other sectors in the local economy have low output
multipliers. Sectors with high wages have high employment multipliers, as the spending of this income
translates in these models into high levels of consumption expenditures through the induced-effects
channel of impacts. There is no easy way to sort-out the reasons why values for a particular sector are
high or low on a particular multiplier measure.
Table A-2 (Title)
Sector Output
Multiplier Employment
Multiplier Income
Multiplier
1. Crop Production 1.78 1.45 1.63
2. Animal Production 2.06 1.96 1.96
3. Forestry and Logging 1.89 2.70 2.30
4. Fishing, Hunting, and Trapping 1.81 2.47 1.65
5. Mining 1.78 1.95 2.02
6. Electric Utilities 1.82 3.85 1.76
7. Gas Utilities 1.38 5.29 3.18
8. Other Utilities 1.89 2.24 1.86
9. Highway, Street, and Bridge Construction 1.79 2.54 1.90
10. Other Construction 1.79 2.29 1.98
11. Food, Beverage and Tobacco Manufacturing 1.63 2.97 2.84
20
12. Textiles and Apparel Mills 1.64 1.86 2.03
13. Wood Product Manufacturing 2.03 2.77 2.69
14. Paper Manufacturing 1.57 3.20 2.18
15. Printing and Related Activities 1.68 1.76 1.70
16. Petroleum and Coal Products Manufacturing 1.07 5.39 2.24
17. Chemical Manufacturing 1.49 2.65 1.65
18. Nonmetallic Mineral Products Manufacturing 1.48 2.09 1.90
19. Primary Metal Manufacturing 1.65 3.25 2.59
20. Fabricated Metals Manufacturing 1.63 2.02 1.88
21. Machinery Manufacturing 1.65 2.73 2.29
22. Computer and Electronic Product Manufacturing 1.65 2.87 2.02
23. Electrical Equipment Manufacturing 1.50 2.44 1.97
24. Aircraft and Parts Manufacturing 1.33 2.30 1.50
25. Ship and Boat Building 1.71 2.48 1.77
26. Other Transportation Equipment Manufacturing 1.41 2.32 2.07
27. Furniture Product Manufacturing 1.67 1.74 1.76
28. Other Manufacturing 1.66 2.00 1.94
29. Wholesale 1.58 1.93 1.58
30. Non-Store Retail 1.60 1.48 1.71
31 Other Retail 1.65 1.39 1.51
32. Air Transportation 1.56 2.44 1.83
33. Water Transportation 1.75 2.75 1.97
34. Truck Transportation 1.89 1.88 1.78
35. Other Transportation/Postal Offices 1.98 1.89 1.60 36. Support Activities for Storage, Transportation and Warehousing 2.00 2.33 1.93
37. Software Publishers & Data Processing & related services 1.55 3.34 1.62
38. Telecommunications 1.68 3.05 2.24
39. Other Information 1.63 1.88 1.47
40. Credit Intermediation and Related Activities 1.88 3.53 2.35
41. Other Finance and Insurance 2.01 2.19 1.92
42. Real Estate and Rental and Leasing 1.39 1.26 1.62 43. Legal /Accounting and Bookkeeping /Management Services 2.01 1.69 1.41
44. Architectural, Engineering, and Computing Services 1.79 1.87 1.49
45. Educational Services 2.06 1.52 1.91
46. Ambulatory Health Care Services 2.13 2.08 1.75
47. Hospitals 1.89 2.16 1.75
48. Nursing and Residential Care Facilities, Social Assistance 1.94 1.40 1.63
49. Arts, Recreation, and Accommodation 1.89 1.52 1.86
50. Food Services and Drinking Places 1.87 1.35 1.77
51. Administrative/Employment Support Services 1.88 1.32 1.41
52. Waste Management/Other, and Agriculture Services 1.94 1.71 1.85

21
Average 1.72 2.34 1.91
Table A-3 shows a different set of county level multipliers, from the IMPLAN software package rather
than the Washington State model.
Table A-3. Multipliers for County Level Impacts (IMPLAN)
Company Industry Sector Multiplier
Output Employment Labor Income
Alcoa/Intalco Primary Metals Manufacturing
1.46 3.3 2.01
Baker Septic Waste Management 1.64 1.89 1.67
Barleans Organic Oils Food Manufacturing 1.49 2.25 1.85
BP Refinery Petroleum Manufacturing 1.11 4.7 1.75
Chemco Products Wood products 1.73 4.28 6.66
Coastal Industrial Services
Miscellaneous (Waste) Management Services
1.64 1.89 1.67
Praxair Merchant Wholesalers ? ? ?
Petrogas Terminal Utilities ? ? ?
Phillips 66 Refinery Petroleum Manufacturing 1.11 4.7 1.75
PSE Ferndale (formerly Tenaska)
Utilities (Electric Power Generation)
1.19 2.01 1.29
PSE Whitehorn Utilities (Electric Power Generation)
1.19 2.01 1.29
Source: IMPLAN software
The IMPLAN multipliers are shown for reference purposes only. CEBR believes the multipliers from the
Washington Input-Output Model give a more accurate estimate of the role the jobs in the Cherry Point
area play in the local economy. That model is based on surveys of Washington businesses rather than
patterns or relationships at the national level.
For comparison, “The Impact of Energy-Intensive Manufacturers on Small Economies”8 showed an
employment multiplier of 3.45 for aluminum smelting in Whatcom County - very slightly above the
multipliers we’ve estimated.
8 Prepared for Alcoa, Inc. and Port Townsend Paper Company by Dick Conway & Associates in August 2011.