Embed Size (px)
Citation preview
Ife Journal of Economics and Finance (2020), Vol. 9 (1), 145-162
1
EMPLOYMENT GROWTH, SERVICE SECTOR, AND MANUFACTURING VALUE-ADDED IN SUB-SAHARAN AFRICA
Ojo, Segun Michael
Department of Economics
Redeemers University, Ede
Email: [email protected]
Ogunleye, Edward Oladipo
Department of Economics
Ekiti State University, Ado Ekiti
Email: [email protected]
Abstract
This study examined the interaction among employment growth, service sector, and manufacturing
value-added in sub-Sahara Africa. The study utilized secondary data spanning 1990 to 2019. The data
was analyzed using a panel vector error correction model (PVECM). The result reveals that long-run
causality runs from manufacturing value-added and service sector to employment growth. The result
shows that the manufacturing sector and service sector generate employment in the economy. It further
reveals that there is no long-run causality running from employment growth and service sector to
manufacturing value-added in SSA. Finally, the analysis reveals that there is long-run causality running
from manufacturing value-added and employment growth to the service sector. The direction of
causality reveals in this study shows that the service sector is crowding out the manufacturing sector in
SSA.
Keywords: service sector, manufacturing value-added, employment growth, deindustrialization,
causality
1. Introduction
The service sector’s expansion over the
manufacturing sector is said to be an
inhibiting factor on the progress of
manufacturing activities globally
(Bosworth and Triplett, 2000). This does
not leave out the sub-Saharan African
countries (SSA). For instance, the average
service value-added share of GDP in sub-
Saharan Africa over the period 1981 to
2018 is estimated at 47.5%, while the
manufacturing-value-added share of GDP
is 13.1%. One of the immediate
consequences of the deindustrialization
menace is the jobless growth
manufacturing sector (ADB, 2017). The
service sector crowding effect on the
manufacturing sector and the jobless
growth problem is not peculiar to the SSA,
rather it is a global problem. But the
attendant consequences bit harder in
developing countries like the SSA than in
the developed countries.
For instance, Sub-Saharan Africa (SSA) is
said to have the lowest standard of living in
the world, and the region is the lowest on
the table of human development index
globally (UNIDO, 2016). The region is
vulnerable to external shocks due to
structural imbalances like high employment
rate, poor infrastructural facilities, weak
institutional frameworks, low per capita
income, the prevalence of abject poverty
and high import dependence. In the face of
those structural imbalances, how can the

Ife Journal of Economics and Finance (2020), Vol. 9 (1), 145-162
2
SSA countries sustain service-led growth
(Hansda, 2006)? Couple with the fact that
they do not have the prerequisite
industrialization experiences required for
the service-led growth process. The
developed countries around the world
metamorphosed from manufacturing-led
growth systems to service-driven
economies. Although the latecomer
countries may not necessarily go through
the evolutionary process which the
developed countries went through before
and after their takeoff, the developing
countries attempt to leapfrog to the service-
led economic system without laying the
foundation of industrialization and
manufacturing value-added may not yield
the desired results.
Figure 1, presents the unemployment rate in
sub-Saharan Africa, East Asia and Pacific
(EAP) and the world. The graph shows that
the unemployment rate in SSA is higher
than the world average unemployment rate.
The unemployment rate is lower in the East
Asia and Pacific region. The prevalent of
unemployment in SSA is worrisome
because it is one of the root causes of the
observed economic backwardness, moral
and social vices that are rampant in the
African sub-region.
Source: author’s computation
Fig. 1 Unemployment Rate in Sub-Saharan Africa, East Asia And Pacific and the World
In figure 2, the trend in service value-added
share of GDP shows that SSA is lower than
EAP and the world in terms of service
value-added. But in figure 4, the trend in the
SSA manufacturing value-added share of
GDP is downward sloping which implies a
persistent deindustrialization scenario in
the African sub-region. In other words,
figures 3, 4, and 5 contain two lines each.
The curve lines are the graph plots of the
movement in manufacturing value-added
share of GDP in the world, SSA and EAP
respectively. The straight lines are the fitted
regression lines (the regression lines depict
the latent trend in the data) of the data series
over the period. So, the regression line in
figure 3 depicts the movement in the world
aggregate manufacturing value-added share
of GDP, while the regression line in figure
5 depicts the trend in manufacturing value-
added share of GDP in the EAP over the
period. The world aggregate and the EAP
manufacturing value-added share of GDP
are upward sloping from left to the right,
which implies an increase in manufacturing
value-added over the period. But the

Ife Journal of Economics and Finance (2020), Vol. 9 (1), 145-162
3
situation in the SSA is the opposite of the
trend in the world and EAP. This shows
among other things that SSA is not keeping
pace with the rest of the world in terms of
productivity and development.
Source: author’s computation
Figure 2 Service Value Added as Percentage of GDP
Service value-added is rising all over the
world. But the SSA case is exceptional due
to the deindustrialization menace that
accompanies the service intensity of the
region's economy. In the world and EAP,
service value-added is rising much as
manufacturing value-added share of GDP is
on the rise. Consequently, unemployment is
lower compare to the rate in SSA.
However, SSA is also recording an increase
in service value-added, alongside a
negative trend in the manufacturing value-
added share of GDP. The employment
sector in SSA is shrinking due to the decline
in manufacturing activities.
Source: author’s computation
Figure 3, The World Manufacturing Value-Added Share of GDP
4
6
8
10
12
14
16
1996 1998 2000 2002 2004 2006 2008 2010 2012 2014 2016 2018 2020
Y e a r

Ife Journal of Economics and Finance (2020), Vol. 9 (1), 145-162
4
Source: author’s computation
Figure 4, SSA Manufacturing Value-Added Share of GDP
Source: author’s computation
Figure 5, EAP Manufacturing Value-Added Share of GDP
9
10
11
12
13
14
15
1996 1998 2000 2002 2004 2006 2008 2010 2012 2014 2016 2018 2020
Y e a r
4
8
12
16
20
24
28
32
1996 1998 2000 2002 2004 2006 2008 2010 2012 2014 2016 2018 2020
Y e a r

Ife Journal of Economics and Finance (2020), Vol. 9 (1), 145-162
5
Hence, the need to ascertain the direction of
causality among manufacturing value-
added, service sector, and employment
growth in SSA. Manufacturing sector
generates more employment than other
sectors, owing to the multi-stages of
interconnectivities among manufacturing
firms that serve as sources of employment
in an economy. In contrast, the modern
economic system is witnessing jobless
growth in the manufacturing sector because
productivity in the manufacturing sector is
growing faster than the manufacturing
output (ADB, 2017), due to the
computerization and robotization of the
production process which reduced the need
for workers in manufacturing production
(WTO, 2013). Consequently, it has been
argued that a fall in manufacturing output
implies a fall in employment, and a fall in
employment implies higher poverty and
crimes.
2.1 Literature Review The unprecedented expansion in the service
sector that accompanies the globalization
explosion of the early 1990s, has been an
issue of concern to economic managers,
policymakers, scholars, and development
partners around the world. The growth of
the service sector per se is not the bone of
contention, but the decline in employment
and the fall in manufacturing output that
trail the upsurge in services are the basis for
concern. Economic scholars from different
ends have been responding to this
development through various empirical
investigations and analyses of the cause and
effects of this issue. This section of this
study reviews some of the empirical studies
that have been done, investigating how
service sector impacts the manufacturing
sector development in different economies
around the world.
For instance, Haraguchi (2016), carried out
a study on the topic "The importance of
manufacturing in economic development:
has this changed?" this study sought to
determine whether the backwardness in
manufacturing development in developing
countries are as a result of the global
deindustrialization menace that is plaguing
the global manufacturing market. The study
utilized simple regression analysis and
found that the backwardness in
manufacturing development in the
developing countries is a result of the
failure to develop the manufacturing
sectors in the developing countries.
Similarly, Coad and Vezzani (2017),
carried out a study that investigated the
links among manufacturing sector,
productivity growth, exports, and R&D?
Using non-parametric plots and regressions
analytical technique. It observed that many
technologically advanced countries had
recorded acute reduction in the relative
share of manufacturing sectors lately.
Feng and Sivakumar (2016) studied the role
of collaboration in service innovation
across the manufacturing and service
sectors in Germany using the probit
regression technique in a sample of 3,060
firms across 22 different industries. The
result revealed that the effect of service
innovation on innovation performance is
greater for service firms than
manufacturing firms. This study and the
preceding ones attested to the fact that the
developed countries are shying away from
manufacturing in favour of services.
Behuria and Goodfellow (2019) used a
descriptive method to investigate the
plausibility of a services-led developmental
state in Rwanda. The study argued that
service-led growth policy may work for the
Asian countries due to the kind of
integrated transformation they exhibited
before and after they take off. Such a
service-led growth policy cannot work for
Rwanda because the country is not as
prepared as the Asian countries in terms of
technological know-how, prerequisite
manufacturing spectrum, and market
infrastructure.
Das and Saha (2011) used a growth model
and descriptive statistics to explain how and
why the services sector may grow faster
than manufacturing, in the Indian economy.

Ife Journal of Economics and Finance (2020), Vol. 9 (1), 145-162
6
The study used a two-sector growth model
(service sector and the manufacturing
sector) to show how diff erences in returns
to scale between the two sectors and the
employment frictions in manufacturing
explain how the growth rate of the services
sector may be higher. This study was able
to identify the key factors responsible for
the rise of the service sector over
manufacturing. A service-oriented
organization needs less labour to operate
and the few labours would be skilled
workers being augmented with
sophisticated machines and equipment.
Consequently, in the service sector; average
labour productivity is higher than other
sectors including the manufacturing sector
because the service sector has a higher
concentration of skilled workers.
Therefore, the return to scale is higher in the
service sector. Investment in the service
sector is more lucrative than in the
manufacturing sector. Manufacturing firms
employ different categories of labour to
undertake different tasks at different stages
of manufacturing activities. Hence,
manufacturing generates employment
opportunities for both the skilled and
unskilled workers which enhances the
aggregate income, alleviates poverty, and
stimulates development. The service sector
attracts investors' funds due to its
competitive advantages in return to scale
and higher relative efficiency.
A similar situation is approaching in Japan
following the result reported in a study by
Fukao (2010). The study investigated the
service sector productivity in Japan using
descriptive statistics. The study focused on
three major observations; one, how bad the
productivity performance in Japan’s service
sector has been. Two, why it is important to
accelerate total factor productivity growth
in the service sector. Three, why total factor
productivity has stagnated in Japan’s
service sector. The result revealed that total
factor productivity growth in the
manufacturing sector is much higher than
that in other sectors but the manufacturing
sector’s share is falling speedily.
Hussin and Ching (2013) carried out a
study on the relative contribution of sectors
to economic growth in Malaysia and China.
The study utilized time series data spanning
1978 to 2007 using multiple regression
techniques. Three sectors were included in
the study; agricultural sector,
manufacturing sector, and service sector.
The result of the correlation analysis
revealed that the three sectors (agriculture,
manufacturing, and service sector) share a
positive relationship with GDP per capita in
Malaysia and China over the period.
Besides, the multiple regression analysis
shows that the service sector accounts for
the highest share in Malaysian GDP while
the manufacturing sector accounts for the
larger proportion of China’s economic
growth. Incidentally, a similar study was
conducted for Nigeria in that same year by
Oluwatoyese and Dewi (2013). The study
was titled; effect of agricultural,
manufacturing, and services sectors
performance in Nigeria. It utilized time
series data spanning 1980 to 2011, using
ordinary least square (OLS). The result
shows that the agricultural and services
sector of the non-oil export component
contributed significantly to the economic
growth (GDP) of Nigeria than the
manufacturing sector. The mixed results
about how service and manufacturing
impact the economic growth in the different
countries is a cause for concern, regarding
how to manage the latest structural changes
in the global economy in the modern
economic system.
However, more recently and very
comprehensively Attiah (2019) carried out
a study involving 10 developed countries
and 40 developing countries on the role of
manufacturing and service sectors in
economic growth. The study is a time-
series study that spanned over 65 years
(1950 to 2015). It examines the relative role
of manufacturing and service sectors in
economic development across the 50
countries, using a panel regression
analytical technique. The results support
the popular hypothesis which postulated
Ife Journal of Economics and Finance (2020), Vol. 9 (1), 145-162
7
that manufacturing is the engine of growth.
As the manufacturing share of GDP is
positively related to economic growth in
developing countries, such a result is not
found for the service sector. Santacreu and
Zhu (2018) also worked on manufacturing
and service sector roles in the evolution of
innovation and productivity using
descriptive statistics across 24 countries
over the period 2000 to 2014. The findings
include the fact that the contribution of the
service sector to employment and value-
added surpassed that of manufacturing. But
manufacturing exceeded service in terms of
exports, innovation, and productivity
growth. The study further argued that
services and manufacturing are interwoven
such that services are needed in the
manufacturing outfits and manufacturing
products are used in the process of service
delivery. The thin line of demarcation
between them is being accentuated by
innovation and globalization intensity.
Therefore, innovation and sophistication
are the forces that will likely determine the
industrialization of the developing
countries and the likelihood of catching up.
Mbate (2017), investigated the structural
change and industrial policy in Ethiopia,
using the country’s leather sector as case
study. The paper examined the basis for
industrial policy in developing countries
and why it has not been effective in most
African countries. It also considered the
policy measures that can be used to spur
industrial development in Africa. It
examined the implementation of industrial
policies, using the descriptive methods of
analysis in the Ethiopian leather product
sector. The study observed that
industrialization and manufacturing
activities are on the decline in developing
countries. On this basis, it itemized some
policy tools that can be used to spur
manufacturing sector development in
developing countries. The policy tolls
include; institutionalization of industrial
policy in the national development plan,
such that will set achievable goals and put
necessary supervisory and monitoring
measures in place for effective
implementation of programs and projects. It
also recommends human capital
enhancement through the accumulation of
technology and skills upgrading.
Chen and Ravallion (2010), carried out a
study titled; 'the developing world is poorer
than we thought, but no less successful in
the fight against poverty using descriptive
methods of analysis and found that one-
third of the world's population lived in
poverty in 1981, but by 2001 it had
decreased to 18%. This was due to the
economic growth of some population rich
countries like China and India in recent
decades. Industrialization and
manufacturing value-added helped China
and India during their take-off. In the
developing African countries, the
proportion of the poor in their population
has been on the increase due to economic
backwardness and deindustrialization that
worsen the unemployment situation. The
basic factor that demarcates between the
African countries and the Asians is
industrialization which helped the Asian
countries to break the vicious cycle of
underdevelopment.
The global decline in employment is one of
the emerging issues that is puzzling to
economic managers the world over. The
world's overall productivity is rising but
employment is falling leading to
joblessness, underemployment, and
poverty. This has motivated empirical
studies from different scholars at different
times from various ends. For instance,
Singh and Mitra (2017) investigated the
cyclical asymmetries and short-run relation
between employment and output in Indian
manufacturing, using time series data
spanning 1990 to 2012. The study utilized
panel regression and descriptive statistics to
estimate the data. The result shows that
both output and employment fall sharply
during the recession than their rate of rising
during recovery. Besides, a fall in output
dampened the employment rate than it stirs
it when output is rising. Rodrik (2015)

Ife Journal of Economics and Finance (2020), Vol. 9 (1), 145-162
8
worked on premature deindustrialization in
Latin America, using panel regression. The
study observed that the Latin American
countries are losing their industrial
potentialities too early and it is happening
at a relatively low level of income. The
Latin American countries have recorded a
considerable and continuous decline in
employment as a result of persistent and
premature deindustrialization. The study
further argued that globalization and
labour-saving technological progress in
manufacturing are responsible for this
development.
Felipe, Mehta, and Rhee (2014) carried out
a study that was titled; manufacturing
matters, it's the jobs that count. They used
the panel regression technique to analyze
time-series data in 50 countries. The result
revealed that economies that create many
manufacturing jobs grow at a high rate than
those that do not. Two, the result shows that
manufacturing employment shares have
fallen. This calls for urgent intervention by
the policymakers because manufacturing
employment boost growth and welfare than
manufacturing output.
Majid (2000) studied employment, output,
and productivity in Pakistan using
regression analysis conducted for the
period 1980 to 1997. The result shows that
labour productivity in Pakistan has been
influenced by changes in capital intensity.
This implies that manufacturing activities
in the countries are being dominated by
labour-saving devices and equipment.
Capital intensive approach to production
requires a huge startup and running capital
than a labour-intensive method. And the
return to scale under capital intensive is
higher than that of labour intensive. So,
every investor is interested in a huge return
on capital but the government can prioritize
labour through regulatory measures to
employ the unemployed. However, in
Pakistan, labour productivity and capital
intensity have a significant positive
relationship because, under a capital-
intensive method of production, the few
labours employed will be highly
productive. So, the concern is about the
proportion of the total workforce that is
gainfully employed in the economy.
Pierce and Scoott (2016), carried out a
study titled "the surprisingly swift decline
of US manufacturing employment". They
used the generalized ordinary least square
method and found that the US has recorded
fall in the relative share of their
manufacturing sectors lately due to policy
adjustment that favoured import over
domestic production.
Bernard, Smeets, and Warzynski (2016) did
a study for Denmark on the topic
“rethinking deindustrialization” using pool
regression and found that manufacturing
employment and the number of firms have
been shrinking as a share of the total and in
absolute levels. They further observed that
firms are switching from the manufacturing
sector to the service sector resulting in the
shrinking of the manufacturing sector and
the employment level. Scholars across the
globe had seen a decline in the industrial
output of the developed countries as a cause
for concern (Alex and Antonio, 2017).
2.2 Theory
This study is premised on the principles of
Baumol’s “cost disease” theory. Baumol in
1967 carried out a study on the American
economy titled "the macroeconomic of
unbalanced growth: the anatomy of urban
crisis". In the study, he argued that
deindustrialization is due to faster
productivity growth in manufacturing, such
that the manufacturing sector has
decreasing labour requirements, while
labour-intensive services have little scope
for mechanization, scale economies, capital
accumulation, or productivity growth. This
phenomenon is called the Baumol disease,
which simply implies that low productivity
growth and economic stagnation are due to
the low manufacturing output and increased
share of the service sector. Baumol was the
first scholar to perceive the clash between
the manufacturing sector and the service

Ife Journal of Economics and Finance (2020), Vol. 9 (1), 145-162
9
sector which poses a threat to the
sustainability of manufacturing
development in the face of continuous
growth in technology.
3. Method of Estimation
This analysis seeks to determine the
relationship among manufacturing value-
added, service sector and employment
growth in the sub-Saharan countries to
ascertain how the three variables interplay
in the manufacturing sector of the African
sub-region. Studies have proved that
sophistication has a positive impact on a
country's industrial production, export
structure and growth, but a negative impact
on employment generation (job loss)
resulting in depletion of the manufacturing
output and growth (Hausmann, Hwang, and
Rodrik 2007). However, the way
sophistication and the attendance service
sector expansion act upon manufacturing
activities is of paramount importance in the
modern globalized economy (page, 2011).
Panel vector autoregressive
(PVAR) technique will be used to estimate
the dynamic interaction among the
variables if the Cointegration test indicates
no cointegration in the model. The
empirical model is stated in PVAR form as;
(22)
𝑀𝑉𝐴𝑖𝑡 = 𝛼𝑖1 + 𝛽𝑖𝑗∑𝑀𝑉𝐴𝑖𝑡−𝑗 + 𝛾𝑖𝑗∑𝑆𝐸𝑅𝑖𝑡−𝑗 +
𝑛
𝑗=1
𝑛
𝑗=1
𝜌𝑖𝑗∑𝐸𝑃𝑌𝑖𝑡−𝑗 +
𝑛
𝑗=1
𝜀1𝑖𝑡
𝑆𝐸𝑅𝑖𝑡 = 𝛼𝑖2 + 𝜃𝑖𝑗∑𝑀𝑉𝐴𝑖𝑡−𝑗 + 𝜇𝑖𝑗∑𝑆𝐸𝑅𝑖𝑡−𝑗 +
𝑛
𝑗=1
𝑛
𝑗=1
𝜎𝑖𝑗∑𝐸𝑃𝑌𝑖𝑡−𝑗 +
𝑛
𝑗=1
𝜀2𝑖𝑡
𝐸𝑃𝑌𝑖𝑡 = 𝛼𝑖3 + 𝜋𝑖𝑗∑𝑀𝑉𝐴𝑖𝑡−𝑗 + 𝜏𝑖𝑗∑𝑆𝐸𝑅𝑖𝑡−𝑗 +
𝑛
𝑗=1
𝑛
𝑗=1
𝜋𝑖𝑗∑𝐸𝑃𝑌𝑖𝑡−𝑗 +
𝑛
𝑗=1
𝜀3𝑖𝑡
where, t = 1, 2, 3 4, ………. T and I = 1, 2,
3, 4, ………. N, MVAi,t is manufacturing
value-added, MVAi,t-1 is one year lag of
manufacturing value-added, 𝑆𝐸𝑅𝑖𝑡−𝑗 is
service sector and 𝐸𝑃𝑌𝑖𝑡−𝑗 is employment
growth. 𝜀𝑖 is the error term. This analysis is
meant to model and determine the dynamic
behaviour among manufacturing value-
added, service sector and employment
growth in SSA. If there is cointegration in
the model, a panel vector error correction
model will be used to estimate the model.
The panel vector error correction model
(PVECM) form of the above VAR model
can be stated as;
(23) ∆𝑀𝑉𝐴𝑖𝑡 = 𝛼𝑖1 +∑𝛽𝑖𝑗∆𝑀𝑉𝐴𝑖𝑡−𝑗 +∑𝛾𝑖𝑗∆𝑆𝐸𝑅𝑖𝑡−𝑗 +
𝑛−1
𝑗=1
𝑛−1
𝑗=1
∑𝜌𝑖𝑗∆𝐸𝑃𝑌𝑖𝑡−𝑗 +𝜑1𝑖𝑒𝑐𝑚𝑖𝑡−1 +
𝑛−1
𝑗=1
𝜀1𝑖𝑡
∆𝑆𝐸𝑅𝑖𝑡 = 𝛼𝑖2 +∑𝜃𝑖𝑗∆𝑀𝑉𝐴𝑖𝑡−𝑗 +∑𝜇𝑖𝑗∆𝑆𝐸𝑅𝑖𝑡−𝑗 +
𝑛−1
𝑗=1
𝑛−1
𝑗=1
∑𝜎𝑖𝑗∆𝐸𝑃𝑌𝑖𝑡−𝑗 + 𝜑2𝑖𝑒𝑐𝑚𝑖𝑡−1 +
𝑛−1
𝑗=1
𝜀2𝑖𝑡
∆𝐸𝑃𝑌𝑖𝑡 = 𝛼𝑖3 +∑𝜋𝑖𝑗∆𝑀𝑉𝐴𝑖𝑡−𝑗 +∑𝜏𝑖𝑗∆𝑆𝐸𝑅𝑖𝑡−𝑗 +
𝑛−1
𝑗=1
𝑛−1
𝑗=1
∑𝜋𝑖𝑗∆𝐸𝑃𝑌𝑖𝑡−𝑗 +
𝑛−1
𝑗=1
𝜑3𝑖𝑒𝑐𝑚𝑖𝑡−1 + 𝜀3𝑖𝑡
where,t = 1, 2, 3 4, ……….T and I = 1, 2,
3, 4, ………..N, MVAi,t is manufacturing
value-added, MVAi,t-1 is one year lag of
manufacturing value-added, 𝑆𝐸𝑅𝑖𝑡−𝑗 is
service sector and 𝐸𝑃𝑌𝑖𝑡−𝑗 is employment
growth. 𝜀𝑖, is the error terms. Panel vector
error correction model (PVECM) is the first
difference of panel vector autoregressive
(PVAR) model. Therefore, the optimum lag
for the PVECM is n-1 because when we
take the first difference we shall lose one
lag. 𝑒𝑐𝑚𝑖𝑡−1 is the error correction terms
while 𝜑3𝑖 is the speed of adjustment if there
is deviation from the long-run estimator.
Data and Measurement of Variables
Manufacturing Value-added (MVA) is the
total value of the net output of all resident
manufacturing activity units obtained by
adding up outputs and subtracting
intermediate inputs. This will be captured
by the manufacturing value-added data
published in global input-output tables
(WIOD, 2020). In this study, service value-
added is used as a proxy for the service
sector (Su and Yao, 2016). Employment
growth refers to the rate at which jobs are
being created in a country over a period of
time. This is measured as the ratio of the
labour force to the unemployed in the
economy (Freeman, 2008).
4. Results
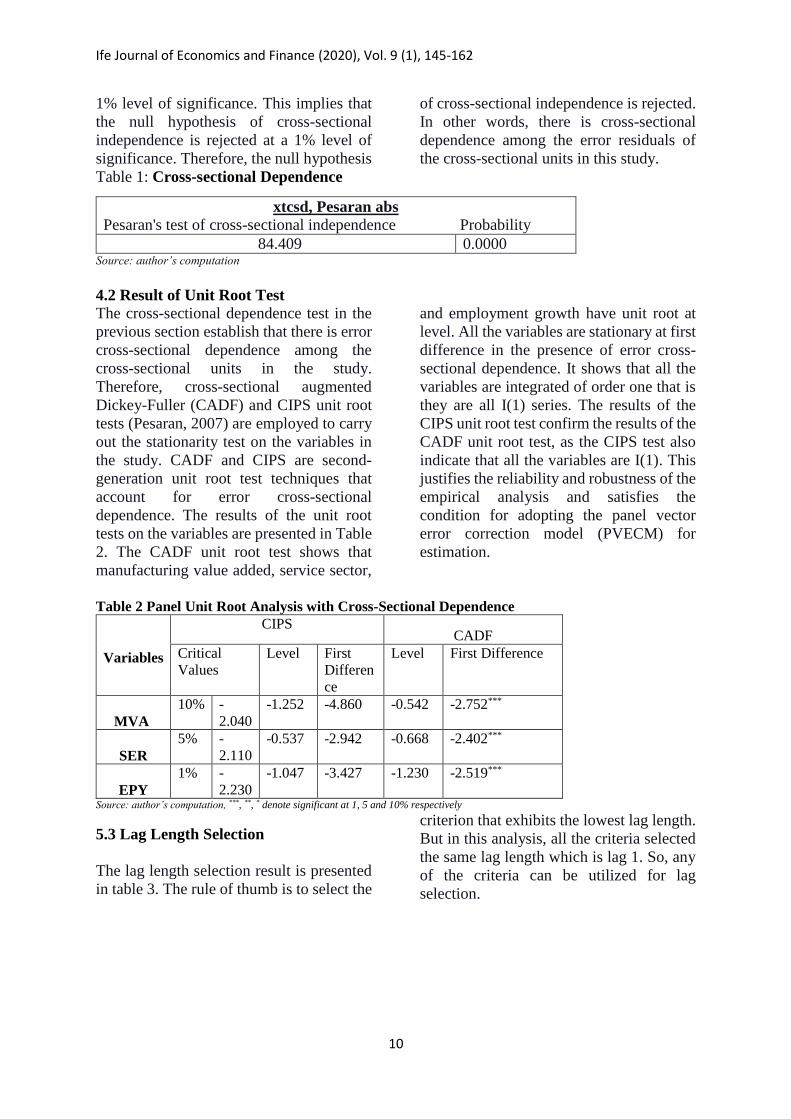
4.1 Cross-sectional Dependence
The result of the cross-sectional
dependence test is presented in table 1. The
test statistics is statistically significant at a
Ife Journal of Economics and Finance (2020), Vol. 9 (1), 145-162
10
1% level of significance. This implies that
the null hypothesis of cross-sectional
independence is rejected at a 1% level of
significance. Therefore, the null hypothesis
of cross-sectional independence is rejected.
In other words, there is cross-sectional
dependence among the error residuals of
the cross-sectional units in this study.
Table 1: Cross-sectional Dependence
xtcsd, Pesaran abs
Pesaran's test of cross-sectional independence Probability
84.409 0.0000 Source: author’s computation
4.2 Result of Unit Root Test
The cross-sectional dependence test in the
previous section establish that there is error
cross-sectional dependence among the
cross-sectional units in the study.
Therefore, cross-sectional augmented
Dickey-Fuller (CADF) and CIPS unit root
tests (Pesaran, 2007) are employed to carry
out the stationarity test on the variables in
the study. CADF and CIPS are second-
generation unit root test techniques that
account for error cross-sectional
dependence. The results of the unit root
tests on the variables are presented in Table
2. The CADF unit root test shows that
manufacturing value added, service sector,
and employment growth have unit root at
level. All the variables are stationary at first
difference in the presence of error cross-
sectional dependence. It shows that all the
variables are integrated of order one that is
they are all I(1) series. The results of the
CIPS unit root test confirm the results of the
CADF unit root test, as the CIPS test also
indicate that all the variables are I(1). This
justifies the reliability and robustness of the
empirical analysis and satisfies the
condition for adopting the panel vector
error correction model (PVECM) for
estimation.
Table 2 Panel Unit Root Analysis with Cross-Sectional Dependence
Variables
CIPS CADF
Critical
Values
Level First
Differen
ce
Level First Difference
MVA
10% -
2.040
-1.252 -4.860 -0.542 -2.752***
SER
5% -
2.110
-0.537 -2.942 -0.668 -2.402***
EPY
1% -
2.230
-1.047 -3.427 -1.230 -2.519***
Source: author’s computation, ***, **, * denote significant at 1, 5 and 10% respectively
5.3 Lag Length Selection
The lag length selection result is presented
in table 3. The rule of thumb is to select the
criterion that exhibits the lowest lag length.
But in this analysis, all the criteria selected
the same lag length which is lag 1. So, any
of the criteria can be utilized for lag
selection.

Ife Journal of Economics and Finance (2020), Vol. 9 (1), 145-162
11
Table 3 Lag Length Selection
Lag LogL LR FPE AIC SC HQ
0 -1804.925 NA 2.602049 3.794176 3.809474 3.800004
1 -849.2934 1903.241* 0.350945* 1.790752* 1.811149* 1.798523*
2 -849.1992 0.187445 0.351613 1.792653 1.818149 1.802366
3 -848.6938 1.004289 0.351978 1.793691 1.824287 1.805347
4 -847.7590 1.855978 0.352026 1.793828 1.829523 1.807426
Source: author’s computation
* indicates the criterion and the lag order selected
4.3 Cointegration Test Cointegration is about the existence of a
long-run relationship between economic
variables. It is about the time dimension of
the economic data. However, cointegration
analysis should not be limited to the time
dimension of economic variables because
in a panel data set the cross-sectional
dimension could enhance the accuracy and
power of the estimation. Many studies have
not been able reject the null hypothesis of
no cointegration concerning economic
relations where theories advocate for a
long-run relationship due to low statistical
power. Consequently, this study adopts an
error-correction based cointegration test for
panel data (Westerlund panel cointegration
test), because it accounts for the cross-
sectional dimension of the panel model.
The result of the cointegration test is
presented in table 4, the result shows that
there is cointegration in the model. The p-
value is '0.0178' which is less than 5%. This
implies rejection of the null hypothesis of
no cointegration at a 5% level of
significance. In other words, there is a long-
run relationship between the variables in
the model.
Table 4: Westernlund Panel Cointegration Test
Statistics p-value
Variance ratio -2.1007 0.0178 Source: author’s computation
4.4 Result of Panel VECM
The panel VECM result when employment
growth is the endogenous variable is
presented in table 5. The long-run
coefficient of manufacturing value-added is
estimated at '-0.198472' while the long-run
coefficient of service sector is -11.55493.
The error correction term (ECM) is
estimated at '-0.018912'. The speed of
adjustment is negative and significant at a
5% level of significance. It implies that
disequilibrium from the previous year's
shock converges back to the long-run
equilibrium in the current year at the speed
of 1.9%. The significance of the ECM term
represents a joint significance of the long-
run coefficients because the coefficient of
the ECM term embodies the long-run
coefficients. Therefore, the joint long-run
causality can be deduced from the
significance of the ECM term. In other
words, the significance of the ECM term
implies that long-run causality runs from
manufacturing value-added and service
sector to employment growth.
The result of the short-run dynamics is also
presented in table 5. The coefficient of the
lag of the dependent variable is estimated at
'-0.327451' and it is significant at a 1% level
of significance. The coefficient of
manufacturing value-added and service
sector is estimated at '0.004621' and '-
0.110103' respectively. Manufacturing
value-added is positive but not significant
while service sector is negative and not

Ife Journal of Economics and Finance (2020), Vol. 9 (1), 145-162
12
significant. However, the joint short-run
causality test of the Wald Coefficient Test
fails to reject the null hypothesis of no
causality. The probability of the test
statistics is greater than the 10% level of
significance. This shows that there is no
short-run causality running from
manufacturing value-added and service
sector to employment growth in SSA.
Table 5 Result of Panel Vector Error Correction Model when Employment Growth is
the Dependent Variable
LONG-RUN
VARIABLES COEFFICIENTS PROBABILITY
EPY(-1) 1.000000 -
LNMVA(-1)
-0.198472
(0.11442)
-
LNSER(-1)
-11.55493
(1.68798)
-
CointEq
-0.018912
(0.007825)
0.0157
SHORT-RUN
EPY(-1)
-0.327451
(0.03331)
0.0000
LNMVA(-1)
0.004621
(0.02752)
0.8667
D(LNSER(-1))
-0.110103
(0.19512)
0.5726
Wald Test
Test Statistic Value Df Probability
Chi-square 0.344570 2 0.8417
Source: author’s computation
The result of the model where
manufacturing value-added is the
dependent variable is presented in table 6.
The coefficients of the long-run
relationship are presented in the upper part
of the table, the long-run coefficient of
employment growth is negative ‘-
5.038489’ while the long-run coefficient of
service sector is also negative ‘-58.21937’.
In this analysis, the probability of the
cointegration term (error correction term) is
approximate ‘0.76%’ which is greater than
the 10% level of significance. This implies
that there is no long-run causality running
from employment growth and service
sector to manufacturing value-added in
SSA. In other words, employment growth
and the service sector are not long-run
drivers of manufacturing value-added in
SSA.
The result of the short-run dynamics when
manufacturing value-added is the
dependent variable is presented in the lower
segment of table 6. The coefficient of the
lag of the dependent variable is negative but
not significant, it is estimated at ‘-
0.011798’. The coefficient of the short-run
dynamics between manufacturing value-
added and employment growth is positive
but not significant, it is estimated at
‘0.020943’. The coefficient of the short-run
dynamics between manufacturing value-
added and service sector is positive and
significant, it is estimated at ‘0.025802’.
This study employs the Wald Coefficient
Test to ascertain the likelihood of short-run
causality running from the exogeneous
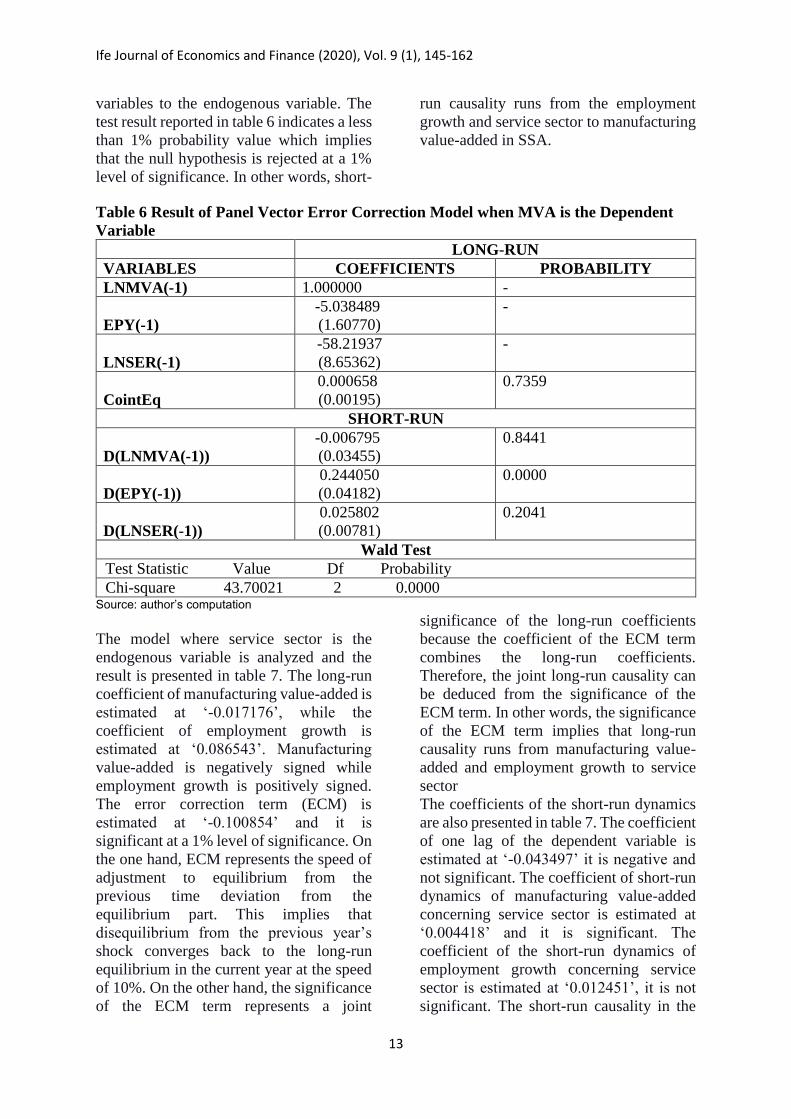
Ife Journal of Economics and Finance (2020), Vol. 9 (1), 145-162
13
variables to the endogenous variable. The
test result reported in table 6 indicates a less
than 1% probability value which implies
that the null hypothesis is rejected at a 1%
level of significance. In other words, short-
run causality runs from the employment
growth and service sector to manufacturing
value-added in SSA.
Table 6 Result of Panel Vector Error Correction Model when MVA is the Dependent
Variable
LONG-RUN
VARIABLES COEFFICIENTS PROBABILITY
LNMVA(-1) 1.000000 -
EPY(-1)
-5.038489
(1.60770)
-
LNSER(-1)
-58.21937
(8.65362)
-
CointEq
0.000658
(0.00195)
0.7359
SHORT-RUN
D(LNMVA(-1))
-0.006795
(0.03455)
0.8441
D(EPY(-1))
0.244050
(0.04182)
0.0000
D(LNSER(-1))
0.025802
(0.00781)
0.2041
Wald Test
Test Statistic Value Df Probability
Chi-square 43.70021 2 0.0000
Source: author’s computation
The model where service sector is the
endogenous variable is analyzed and the
result is presented in table 7. The long-run
coefficient of manufacturing value-added is
estimated at ‘-0.017176’, while the
coefficient of employment growth is
estimated at ‘0.086543’. Manufacturing
value-added is negatively signed while
employment growth is positively signed.
The error correction term (ECM) is
estimated at ‘-0.100854’ and it is
significant at a 1% level of significance. On
the one hand, ECM represents the speed of
adjustment to equilibrium from the
previous time deviation from the
equilibrium part. This implies that
disequilibrium from the previous year’s
shock converges back to the long-run
equilibrium in the current year at the speed
of 10%. On the other hand, the significance
of the ECM term represents a joint
significance of the long-run coefficients
because the coefficient of the ECM term
combines the long-run coefficients.
Therefore, the joint long-run causality can
be deduced from the significance of the
ECM term. In other words, the significance
of the ECM term implies that long-run
causality runs from manufacturing value-
added and employment growth to service
sector
The coefficients of the short-run dynamics
are also presented in table 7. The coefficient
of one lag of the dependent variable is
estimated at ‘-0.043497’ it is negative and
not significant. The coefficient of short-run
dynamics of manufacturing value-added
concerning service sector is estimated at
‘0.004418’ and it is significant. The
coefficient of the short-run dynamics of
employment growth concerning service
sector is estimated at ‘0.012451’, it is not
significant. The short-run causality in the

Ife Journal of Economics and Finance (2020), Vol. 9 (1), 145-162
14
model is determined using the Wald
Coefficient Test. The probability of the test
statistics of the Wald Coefficient Test is
less than 10% but greater than the 5% level
of significance. This implies that the test
statistics are significant at a 10% level of
significance. In other words, there is short-
run causality running from manufacturing
value-added and employment growth to
service sector in SSA.
Table 7 Result of Panel Vector Error Correction Model when Service sector is the
Dependent Variable
LONG-RUN
VARIABLES COEFFICIENTS PROBABILITY
LNSER(-1) 1.000000 -
LNMVA(-1)
-0.017176
(0.01026)
-
EPY(-1)
0.086543
(0.02813)
-
CointEq
-0.100854
(0.01633)
0.0000
SHORT-RUN
LNSER(-1)
-0.043497
(0.03524)
0.2171
LNMVA(-1)
0.004418
(0.00497) 0.0386
EPY(-1)
0.012451
(0.00602)
0.3741
Wald Test
Test Statistic Value Df Probability
Chi-square 5.096201 2 0.0782
Source: author’s computation
5. Conclusion
The causal relationship among
manufacturing productivity, the
employment sector, and the service sector
has been highly debated in the literature
without consensus (Bernard, Smeets and
Warzynski, 2016). Hence, this study
ascertained the direction of causality
among these variables in the context of the
SSA economy. The result reveals that long-
run causality runs from manufacturing
value-added and service sector to
employment growth. This result justifies
the fact that the manufacturing sector and
service sector generate employment in the
economy. In other words, the
manufacturing sector and the service sector
contribute to employment generation in
SSA. The short-run analysis reveals that
there is no short-run causality running from
manufacturing value-added and service
sector to employment growth in SSA. In
other words, the employment impacts of the
manufacturing sector and the service sector
is not immediate, rather it takes a relatively
long time for the employment impact of the
two sectors to materialize.
The study also reveals that there is no long-
run causality running from employment
growth and service sector to manufacturing
value-added in SSA. In other words,
employment growth and the service sector
are not long-run drivers of manufacturing
value-added in SSA. The manufacturing
sector induces employment because
demand creates supply. The service sector
does not induce the manufacturing sector
because the service sector is crowding out
the manufacturing sector (Faggio and
Overman, 2014).
Ife Journal of Economics and Finance (2020), Vol. 9 (1), 145-162
15
Although in the short-run, both the
employment sector and service sector
enhance the manufacturing value-added in
SSA, they do not have a long-run impact on
it.
Finally, the analysis reveals that there is
long-run causality running from
manufacturing value-added and
employment growth to the service sector.
This implies that the manufacturing sector
and employment sector stimulate the
service sector. Besides, there is short-run
causality running from manufacturing
value-added and employment growth to
service sector in SSA. In other words, both
in the short-run and long run the
manufacturing sector and employment stir
the service sector growth.
References
ADB (2017) Industrialize Africa strategies,
policies, institutions, and financing.
Alex C. and Antonio V. (2017).
Manufacturing the future: is the
manufacturing sector a driver
of R&D, exports and productivity
growth. JRC Working Papers on
Corporate R&D and Innovation No
06/2017
Attiah, E. (2019) The role of manufacturing
and service sectors in economic
growth: an empirical study of
developing countries. European
Research Studies Journal Volume
XXII, Issue 1, 2019 pp. 112-127.
Baumol W. J (1967). Macroeconomics of
unbalanced growth: the anatomy of
urban crisis. The American
Economic Review, Vol. 57, No. 3
(Jun. 1967), pp. 415-426.
Behuria P. and Goodfellow, T. (2019)
Leapfrogging manufacturing?
Rwanda's attempt to build a
service‑ led ‘developmental state’.
Eur J Dev Res (2019) 31:581–603
Bernard, A. B., Smeets, V. and Warzynski,
F. (2016) Rethinking
deindustrialization. CEP Discussion
Paper No 1423 April 2016
Bosworth, Barry P. and Triplett, Jack E.
(2000) "Productivity in the Services
Sector." Brookings,
Chen, S. And Ravallion, M. (2010) The
developing world is poorer than we
thought but no less successful in the
fight against poverty. The
Quarterly Journal of Economics,
November 2010
Coad A. and Vezzani A. (2017)
Manufacturing the future: is the
manufacturing sector a driver of
R&D, exports and productivity
growth? JRC Working Papers on
Corporate R & D and Innovation No
06/2017
Das S. P. and Saha, A. (2011) On the
growth of the services sector. Indian
Statistical Institute – Delhi Centre.
Faggio, G. and Overman, H. (2014). The
effect of public sector employment
on local labour markets. Journal of
Urban Economics, 79, pp. 91-107.
DOI: 10.1016/j.jue.2013.05.002.
Felipe, J. Mehta, A. and Rhee, C. (2014)
Manufacturing matters… but it’s
the jobs that count.
ADB economics working paper series No.
420 | 2014
Feng, C and Sivakumar K (2016) The role
of collaboration in service
innovation across manufacturing
and service sectors. Service Science
8(3):263-281.
Freeman, R. (2008) Labour productivity
indicators. OECD Statistics
Directorate Division of Structural
Economic Statistics.
Ife Journal of Economics and Finance (2020), Vol. 9 (1), 145-162
16
Fukao K. (2010) Service sector
productivity in Japan: The key to
future economic growth RIETI
Policy Discussion Paper Series 10-
P-007
Hansda, S. K. (2006). Sustainability of
services-led growth: An input-
output analysis of the Indian
economy. Available from
ge/papers/0512/0512009.pdf
Haraguchi N. (2016) The importance of
manufacturing in economic
development: Has this changed?
Department of Policy Research and
Statistics Working Paper 1/2016
UNIDO
Hausmann, R, Hwang, J. and Rodrik, D.
(2007) What You Export Matters,”
Journal of Economic Growth 12(1):
1–25.
Hussin, F. and Ching C. W. (2013) The
contribution of economic sectors to
economic growth: the cases of
Malaysia and China. International
Journal of Academic Research in
Economics and Management
Sciences. March 2013, Vol. 2, No. 2
ISSN: 2226-3624 36
www.hrmars.com/journals
Majid, N. (2000) Pakistan: employment,
output and productivity. ISSUES IN
DEVELOPMENT Discussion
Paper 33
Mbate, M., (2017) Structural change and
industrial policy: A case study of
Ethiopia's leather sector, Journal of
African Trade (2017).
Oluwatoyese O. P. and Dewi, S (2013)
Effect of agricultural,
manufacturing and services sectors
performance in Nigeria, 1980-2011.
Journal of Economics and
Sustainable Development
www.iiste.org ISSN 2222-1700
(Paper) ISSN 2222-2855 (Online)
Vol.4, No.20, 2013 35.
Page, J. (2011) Should Africa industrialize?
UNU-WIDER. Working Paper No.
2011/47
Pesaran, M.H., 2007. A simple panel unit
root test in the presence of cross-
section dependence. Journal of
Applied Econometrics 22, 265–312
Pierce, J. R., and Schott, P. K. (2016). The
surprisingly swift decline of US
manufacturing employment. The
American Economic Review,
106(7), 1632-1662.
Pisano, G. P., and W.C. Shih (2009)
Restoring American
competitiveness, Harvard Business
Review 87, Nos. 7-8 (July-August
2009).
Rodrik, D. (2015) Premature
deindustrialization. NBER
WORKING PAPER SERIES
Working Paper 20935
Santacreu, A. M. and Zhu, H. (2018)
Manufacturing and service sector
roles in the evolution of innovation
and productivity. Economic
Synopses No. 2
Singh, J and Mitra A. (2017) Cyclical
asymmetries and short-run relation
between employment and output:
the case of organized manufacturing
in India. Ind. J. Labour Econ. (2016)
59:203–216
Su, D. and Yao, Y. (2016). Manufacturing
as the key engine of economic
growth for middle-income
economies. ADBI Working Paper
Series No. 573.
UNIDO (2016). Industrial development
report 2016: the role of technology
and innovation in inclusive and
sustainable industrial development.

Ife Journal of Economics and Finance (2020), Vol. 9 (1), 145-162
17
United Nations Industrial
Development Organization.
Vienna.
World Trade Organization (WTO) (2013).
Global value chains in a changing
world.154 Rue
WIOD, (2020) World Input-Output
Database. 2018 edition.