Embed Size (px)
Citation preview

Iraq experienced steady and strong GDP growth, av-eraging a rate of 7 percent per year over the 2007 to 2012 period but only modest poverty reduction; im-plying a negative but weak relationship between eco-nomic growth and poverty reduction. For economic growth to have a positive impact on poverty, it needs to generate employment and income for those who need it the most. Recent economic growth was driven mainly by growth in mining or oil, which represents half of the total GDP, the bulk of government revenues, and almost all export revenues. However, it employs a tiny share of the labor force (1%) and has a low output-elasticity of employment (–0.2). Across other sectors, in general, employment generation has remained low despite output growth. In contrast, earnings are much more responsive to output growth in general and for the mining sector in particular; although the latter is not likely to directly benefit the poor. Earnings have grown at an annual rate of 8.3 percent in the min-ing sector, which employs 1 percent of the labor force, compared to –2.5 percent in agriculture or 0.8 percent in construction, which employ more than a fifth of the population.
Although more than 750,000 new jobs were created over the five year period, these were not enough to ab-sorb all new participants in the labor market, and four-fifths of these new jobs were generated by the public sector. The expansion of public sector employment has increased the incentives for ‘wait unemployment’ and low labor force participation. Having a public sector job translates into having a “better” job relative to the private sector on several dimensions including wages,
benefits and working hours. Earnings have dispropor-tionately increased among public sector employees. A private sector worker still earned almost 30 percent less than public workers in 2012, before including other benefits associated with public sector employment.
The expansion of the public sector has adversely affect-ed the labor market in Iraq by creating economy wide disincentives to labor force participation, especially for the youth. An increase of one percentage point in the public employment rate of the governorate where the youth was born contributes to a significant reduction (around 50 and 40 percent for 2007 and 2012 respec-tively) in their participation rate, keeping everything else constant. This disincentive to labor force partici-pation is also significant among adults. In general, reduces the participation rate of both adult women and men by about 30 percent, holding everything else constant. For women, in addition, a significant gender wage gap further disincentivizes labor force participation.
The nature of public sector expansion has also altered the incentives for education. With the expansion in public sector jobs for less educated men, the returns to education in the public sector level off after primary school, and do not pick up again until after tertiary education. In 2012, an average male in the working-age population received 20 percent more in the public sector by having complete primary education relative to being illiterate. However, the premium for getting an additional level is almost negligible thereafter un-til he completes tertiary education.
6The Growth-Employment Nexus

THE UNFULFILLED PROMISE OF OIL AND GROWTH126
The type of employment growth generated by Iraq over the last five years has only weakly impacted poverty, and the expansion of public sector employment has oc-curred in sectors where a minority of the poor work. For instance, one-quarter of the poor work in Con-struction, where only 7 percent of jobs are public sec-tor jobs. This does not imply more intervention of the public sector in these sectors but the contrary. In fact, the expansion of the public sector has adversely affected the labor market in Iraq by creating economy wide disincentives to labor force participation; inhibiting the development of the private sector; and distorting incentives to invest in education.
The Links between Growth and Employment in Iraq
As mentioned in Chapter 2, Iraq experienced steady and strong GDP growth, averaging a rate of 7 percent per year over the 2007 to 2012 period but only modest poverty reduction (3.8 percentage points over the entire five year period). This points to a negative but weak relationship between eco-nomic growth and poverty reduction, which may be due to weak links between economic growth and employment or between employment and earnings, or both. On the other hand, the decomposition analysis from Chapter 5 shows that the growth of labor income is the most important contributory factor to poverty reduction, but that in Iraq, it was not driven by employment growth, but rather by growth in earnings. Thus, an economy where growth goes hand in hand with job creation and in-come generation, i.e., one where the links between growth and welfare are strong, has the potential to deliver significant poverty reduction. And so, we turn our attention to the relationship between growth, employment and earnings in Iraq.
For economic growth to have a positive impact on poverty, it needs to generate employment and in-come for those who need it the most. Recent eco-nomic growth was driven mainly by growth in mining which represents almost half of the total GDP. How-ever, of all the sectors, this has the lowest potential
for employment creation for any given growth rate because its employs a tiny share of the labor force (1%) and has a low output-elasticity of employment (–0.2).39 This implies that a 1 percent increase in output will generate a 0.2 percent reduction in em-ployment in the mining sector. Given the growth rate experienced in mining since 2007, this means that employment in the mining sector has reduced by 1.3 percent or 0.07 percent of the labor force.
This pattern is evident not only in mining but across almost all economic sectors. Even when a sector’s GDP has grown over the period, employ-ment generation has remained low. This implies that employment is relatively inelastic to output growth overall (Table 28). Among sectors which have grown between 2007 and 2012, manufactur-ing is one of the most responsive sectors in terms of employment. It employs 10 percent of the labor force and it has one of the highest output elastici-ties of employment of 0.6. Having experienced an annual growth rate of 9.5 percent over the period, this indicates that employment in manufacturing sector has increased by 6 percent, or 2.4 percent of the labor force.
In contrast, earnings are much more responsive to output growth in general and for the mining sec-tor in particular; although the latter is not likely to directly benefit the poor. Earnings have grown at an annual rate of 8.3 percent in the mining sector, which employs 1 percent of the labor force, com-pared to –2.5 percent in agriculture or 0.8 percent in construction, which employ more than a fifth of the population (Table 28). Moreover, the output elasticity of earnings is also relatively high in pub-lic administration, the financial services sector, and other services, all of which are primarily public sec-tor jobs. Within the private sector, only transport, storage and communications has a relatively high earnings elasticity; and accounts for 11 percent of employment.
39 We are referring to the direct effect of mining on employ-ment; we are not considering the spillover effect on other sectors.

THE GROWTH-EMPLOYMENT NEXUS 127
New Jobs in the Economy: Public Versus Private Sector
Notwithstanding the weak relationship between economic growth and employment, more than 750 thousand new jobs were created over the five year period. However, these were not enough to absorb all new participants in the labor market. In the face of significant labor market discouragement, this has translated into stagnant participation and employ-ment rates for the working age population during the period.40
Demographic trends in Iraq create opportunities as well as challenges for the future growth and poverty reduction. The working-age population has been expanding at an average growth rate of 2.2 percent per year indicating an 11 percent increase in the working-age population between 2007 and 2012. The “bulge” among five to fourteen year-olds in the 2012 population indicates that the working-age population growth trend will increase over the next decade.41 While a growing labor force can be an as-set for income generation and growth, absorbing a large wave of new entrants every year poses a major
challenge for the labor market particularly in an economy with relatively weak links between growth and employment. Moreover, the relatively small im-provement in human capital of younger generations poses another challenge for the country.
The private sector contributed around 60 percent of total jobs in Iraq in 2007 and 2012. However, it did not lead new job creation: in the last five years 80 per-cent of the new jobs were generated by the public sec-tor. While in 2007, public jobs accounted for 35 per-cent of total jobs in Iraq, five years later, their share jumped to almost 40 percent (Figure 143 panel A). These types of jobs grew not only across space—in
40 In chapter 4 “For young women, the main reason cited for not looking for work is social reasons and being a house-wife. In contrast, for young men, the bulk those who fall in this category say they are not actively looking for a job because they cannot find a job, and this is another indicator of labor market discouragement among young men”.
41 Individuals between 5 and 15 year-olds grew annually al-most 1 percentage point faster (3 percent per year) than the annual growth rate of the working-age population between 2007 and 2012 based on IHSES 2007 and 2012.
TABLE 28: Growth, Employment and Labor Income Relations
Economic Activities
Annual growth rate
(%) 2007–12
Employment Earnings
Labor Share (%) 2012
Annual growth rate
2007–12
Output elasticity of
labor
Annual growth rate
2007–12
Output elasticity of
earningsAgriculture & �shing 2.69 8.94 –4.78 –1.78 –2.54 –0.95
Mining & quarrying 7.80 1.02 –1.29 –0.17 8.26 1.06
Manufacturing Industry 9.45 9.67 5.96 0.63 4.74 0.50
Utilities 16.08 2.21 1.87 0.12 5.94 0.37
Construction 15.30 13.63 2.96 0.19 0.82 0.05
Transport, storage & communication 7.96 11.43 3.65 0.46 6.65 0.84
Commerce and retail 12.39 15.61 0.17 0.01 6.93 0.56
Financial, insurance 3.61 14.37 15.51 4.30 3.23 0.89
Public administration 5.66 17.23 –2.81 –0.50 6.95 1.23
Other services 4.00 5.89 1.90 0.47 4.64 1.16
Total 7.09 100.00 1.95 0.27 4.77 0.67
Source: Authors’ calculations, IHSES 2007 and 2012.

THE UNFULFILLED PROMISE OF OIL AND GROWTH128
Baghdad, the North and the South—but also among economic sectors such as Financial, Insurance and professional services (with more than half of them in 2012), Manufacturing and Transport (Figure 143).
In 2007, the public sector already employed more than 70 percent of highly educated workers, those with higher secondary and tertiary education; and around 40 percent of total public jobs were con-centrated among them (Figure 144 panel A). While the dominance of the public sector as a source of employment for the highly educated has continued, new public sector jobs have also absorbed less edu-cated workers. Most of the new public jobs went mainly those with lower than intermediate level of education. In particular, 60 percent of the new pub-lic sector jobs were distributed among workers with less than primary complete (Figure 144 panel B).
Having a public sector job translates into having a “better” job relative to the private sector on several different dimensions such as retirement plan. Figure 145 shows that around 90 percent of public work-ers have a retirement plan irrespective of the year compared to their private counterparts who have no benefits at all.42
Additionally, being in a public sector job implies working fewer hours (about 2 hours less) than in the private sector (Figure 146 panel A). The hours gap between both sectors has been increasing between 2007 and 2012. However, there are differences across space: while this gap increases significantly in Kurdistan and Baghdad, it remains almost constant in the South and Central division and reduces in the North (Figure 146 panel B). For instance, in Kurdis-tan the difference between the median hours of work in private and public sector was 2 hours in 2007. This represents 22 percent less hours of work relative to the median hours of work in the private sector for that year. In 2012, this gap increases up to 27 percent of the median hours of work in the private sector (i.e. 9.5 hours). This translates into almost 2.6 less hours of work in a public job relative to a private one.
Thus, what little job creation has taken place in Iraq over the last five years has been driven by the public
FIGURE 143: Public Sector Employment
A. Share of Public Jobs B. Economic Sector (% of total jobs)
– 20 100
34.7 39.1
–1020304050
Kurdistan
Baghdad
North
Central
South
Iraq
40 60 80
Agriculture & �shing
Mining & quarrying
Manufacturing
Utilities
Construction
Commerce and retail
Transport, storage &
Financial, insurance
Public administration
Other services
2007 2012 2007 2012
Source: Authors’ calculations, IHSES 2007 and 2012.
42 According to last consultation with country counterparts held in Erbil–May 2014, all public jobs include health in-surance. However, the 2012 IHSES presents inconsisten-cies in the variable that measures this benefit; thus results are not presenting in this report.

THE GROWTH-EMPLOYMENT NEXUS 129
sector. A large and expanding public sector can cre-ate significant distortions in the labor market, espe-cially in a country where there is already low labor force participation, even among men, and labor market discouragement is widespread. The increas-ing possibility of a public sector job, with greater job security, benefits and fewer hours of work, can raise the reservation wage among the working age
population, and limit active job search as people wait and queue for openings in the public sector. More-over, the private sector’s ability to attract talent is also severely constrained by an expanding and in-creasingly well-paying public sector. In the medium term, the anticipation of public sector employment can also distort education investments, by catering to certain fields of study that may be irrelevant to the private sector. Below we quantify some of these adverse consequences of the expansion of public sector employment on youth, male and female labor force participation; on education investments; and on the potential for private sector development.
Youth Participation in the WorkforceYouth labor force participation in Iraq is low and stagnant. Only 40 percent of Iraqis between the ag-es of 15 and 24 who are not in school, are employed or looking for work. This means that 6 out of every 10 young Iraqis who are not in school are neither working nor actively seeking work. However, labor force participation rates vary significantly by the level of education of the youth. It ranges from 25
FIGURE 144: Public Jobs – Education Levels
A. Share of Public Jobs among levels B. Distribution of new public jobs
2007 2012
–
10
20
30
40
50
60
70
80
Illite
rate
Inco
mple
te pr
imar
y
Com
plete
prim
ary
Inte
rmed
iate
Seco
ndar
y
High
er Se
cond
ary
Terti
ary
36.511.9–0.7
23.410.7
11.7
6.4
Incomplete primary IlliterateIntermediateComplete primary
Higher secondary SecondaryTertiary
Source: Authors’ calculations, IHSES 2007 and 2012.
FIGURE 145: Private and Public Jobs: Retirement
–
100
102030405060708090
Retirement private Retirement public
2007 2012
Source: Authors’ calculations, IHSES 2007 and 2012.

THE UNFULFILLED PROMISE OF OIL AND GROWTH130
percent for illiterate individuals to 66 percent for those with tertiary education (Figure 147 panel A).
Given these low participation rates, it is not surpris-ing to find low levels of employment among this young cohort. 33 percent of this population found
a job in 2007 compared to 35 percent in 2012 (Fig-ure 147 panel B). Conversely to the participation rate, the employment rate does not vary much by education. This implies much higher unemploy-ment rates among the highest educated youth. In 2012, unemployment rises to almost 25 percent
FIGURE 146: Private and Public Jobs: Gaps on Hours of Work Per Day
A. Median hours of work per day B. Gaps of median hours of work by region
2007 2012 Gap
–5
1015202530
Kurdistan
Baghdad
North
Central
South
Iraq
–
1
2
3
4
5
6
7
8
9
10
Private Public 2007 2012
Source: Authors’ calculations, IHSES 2007 and 2012.
FIGURE 147: Youth Participation and Employment Rates, by Education Level
100A. Participation rate B. Employment rate
2007 2012
40.1
40.6
–102030405060708090
100
–102030405060708090
Illite
rate
Inco
mple
te pr
imar
y
Com
plete
prim
ary
Inte
rmed
iate
Seco
ndar
y
High
er se
cond
ary
Terti
ary
Tota
l
Illite
rate
Inco
mple
te pr
imar
y
Com
plete
prim
ary
Inte
rmed
iate
Seco
ndar
y
High
er se
cond
ary
Terti
ary
Tota
l33
.3 34.6
Source: Authors’ calculations, IHSES 2007 and 2012.

THE GROWTH-EMPLOYMENT NEXUS 131
among youth with tertiary education in comparison to about 5 percent for illiterate.
The majority of employed youth were engaged in salaried jobs irrespective of their level of education. In 2007, salaried employment accounted for 70 percent of all employed youth with a variation of 20 percentage points between the lowest and highest education level. In 2012, the share of salaried em-ployment increased at all levels of education (or in other words, self-employment increased) except ter-tiary (Figure 148 panel A). Salaried workers consist of two distinct groups, public and private workers, with public sector jobs making up a fifth of salaried employment. The former has remained at almost 20 percent over the five year period. Between 2007 and 2012, there was a 17 percentage point decrease in the share of tertiary educated workers employed in the public sector; but since their share in the youth population is so small, the overall rates of public sec-tor employment remain largely unchanged (Figure 148 panel B).
Between 2007 and 2012, the youth have moved out mainly from Agriculture, Public Administration and Commerce to Construction, Manufacturing and
Financial, Insurance and professional services (Fig-ure 149 panel A). As a result of this sectoral shift among the youth, the education levels within each sector have remained largely unchanged, with the most educated youth are still being employed in services and the less educated are absorbed main-ly by Construction (Figure 149 panels B and C). However, average education levels within the pub-lic administration and mining sectors has increased, with more young workers having relatively high education.
What contributes to labor force participation among youth?To investigate the hypothesis that youth labor force participation rates are low because youth are queu-ing for a job in the public sector, we calculate the marginal effects of the probability of being active conditioned on several individual and household characteristics of the young population for 2007 and 2012. We find that an increase of one percent-age point in the public employment rate of the gov-ernorate where the individual was born contributes to a significant reduction (around 50 and 40 percent for 2007 and 2012 respectively) in the participation
FIGURE 148: Type and Sector of Work, by Education Level
100A. Salaried B. Public sector
2007 2012
–102030405060708090
100
–102030405060708090
Illite
rate
Inco
mple
te pr
imar
y
Com
plete
prim
ary
Inte
rmed
iate
Seco
ndar
y
High
er se
cond
ary
Terti
ary
Tota
l
Illite
rate
Inco
mple
te pr
imar
y
Com
plete
prim
ary
Inte
rmed
iate
Seco
ndar
y
High
er se
cond
ary
Terti
ary
Tota
l
70.4 80
.4
19.4
19.2
Source: Authors’ calculations, IHSES 2007 and 2012.

THE UNFULFILLED PROMISE OF OIL AND GROWTH132
rate among the youth, keeping everything else con-stant (Table A 6.1).43
Being born in a governorate where the public sec-tor contributes a larger share of the jobs in the local economy relative to other governorates creates dis-incentives to participate in the labor market among the youth. To illustrate by how much the public employment rate affects the labor participation of this cohort, we calculate the probability to partici-pate by education level considering three levels of
public employment rates: minimum or low, mean and maximum (Figure 150).
These graphs provide clear evidence in favor of the hypothesis that youth queue for a job in the pub-lic sector independent of their education level. Both
FIGURE 149: Sectors of Employment, Youth
100%II. 2007: Education structure by economic sector III. 2012: Education structure by economic sector
Illiterate + Incomplete primary Prim. Complete + Intermediate Secondary and above
0%10%20%30%40%50%60%70%80%90%
Agric
ultur
e & �s
hing
Mini
ng &
quar
rying
Man
ufac
turin
g
Utilit
ies
Cons
tructi
on
Com
mer
ce an
d ret
ail
Tran
spor
t, sto
rage
&
Finan
cial, i
nsur
ance
Publi
c adm
inistr
ation
Othe
r ser
vices
100%
0%10%20%30%40%50%60%70%80%90%
Agric
ultur
e & �s
hing
Mini
ng &
quar
rying
Man
ufac
turin
g
Utilit
ies
Cons
tructi
on
Com
mer
ce an
d ret
ail
Tran
spor
t, sto
rage
&
Finan
cial, i
nsur
ance
Publi
c adm
inistr
ation
Othe
r ser
vices
I. Share of employment by economic sector
0 5 3010 15 20 25
Agriculture & �shing
Mining & quarrying
Manufacturing
Utilities
Construction
Commerce and retail
Transport, storage &
Financial, insurance
Public administration
Other services
2007 2012
58.3 21.9 42.7 22.8 47.3 34.5 32.4 38.3 22.7 41.9 67.4 28.9 52.3 39.8 57.0 43.9 46.1 38.0 18.8 48.1
3.1 30.7 7.8 21.9 5.0 9.9 9.1 10.7 31.5 7.3 2.2 9.1 5.2 13.0 3.8 9.0 9.7 13.5 39.8 7.4
Source: Authors’ calculations, IHSES 2007 and 2012.
43 To avoid problems associated with the endogeneity of mi-gration, we use the jurisdiction of birth rather than that of current residence to calculate the relevant public employ-ment rate as Asaad (2013)

THE GROWTH-EMPLOYMENT NEXUS 133
graphs show on the one hand, that the probability to participate in the labor market increases with the level of education of the young independent of the share of public employment. For instance, in 2012, around 40 percent of the youth with less than inter-mediate level education were willing to participate in the labor market if they were born in a governorate with low public employment rate. These participa-tion rate levels increase to 70 percent for youth with higher secondary or more in similar governorates.
On the other hand, the higher the share of employ-ment in the public sector, the lower the participa-tion rates among the youth irrespective of their level of education. For example, the participation rate among those with tertiary education decreases 30 percentage points (from 70 to 40 percentage) if the youth were born in a governorate with low pub-lic employment rates relative to a governorate with high rates of public employment. In other words, the bigger the public sector, the higher the disincen-tive to participate among the youth.
We also note that there are other factors which con-tribute to lower labor force participation among youth. For instance, having another household
member working in the public sector as well as living in urban areas, in households where the net income is relatively high and where the household head has more than incomplete primary education; reduces the probability to participate in the labor market.44
On the other hand, there are many factors which encourage youth labor force participation in 2007 and 2012. Among these, we find that being male increases participation significantly by about 70 per-cent for both years. Being relatively older and living in a rich governorate increases the probability by about 3 and 8 percent respectively. The individual’s level of education also has a positive effect on the probability to participate. The higher the education level, the higher the impact on participation, rang-ing from 5 up to 20 percent higher with respect to being illiterate (Figure 151).
Female Participation in the Labor ForceOnly 15 percent of adult Iraqi women of working age participate in the labor force; well below the already
FIGURE 150: Youth Participation Rate by Public Employment Rate in the Governorate of Birth
0.8A. 2007 B. 2012
00.10.20.30.40.50.60.7
Illite
rate
Inco
mpl
ete p
rimar
y
Com
plet
e prim
ary
Inte
rmed
iate
Seco
ndar
y
High
er se
cond
ary
Terti
ary
0.8
00.10.20.30.40.50.60.7
Illite
rate
Inco
mpl
ete p
rimar
y
Com
plet
e prim
ary
Inte
rmed
iate
Seco
ndar
y
High
er se
cond
ary
Terti
ary
Prob
abilit
y to p
artic
ipate
in th
e lab
or m
arke
t
Low Mean Max
Source: Authors’ calculations, IHSES 2007 and 2012.
44 Net income includes labor income from other household members and from non-labor sources.

THE UNFULFILLED PROMISE OF OIL AND GROWTH134
low rates of female labor force participation in the Middle East and North Africa region of around 25 percent. The share of women aged 25 to 64 who are either employed or actively seeking work has remained stagnant between 2007 and 2012. Par-ticipation varies sharply by education. Among adult women with intermediate or lower education, labor force participation rates are below 10 percent. With secondary education, these rates more than double to 24 percent, and increase six-fold with secondary and tertiary education. Well educated Iraqi women are therefore at least six times as likely to work or to be looking for work compared to the vast majority of Iraqi women (Figure 152 panel A).
This pattern is almost entirely reflected in employ-ment rates for adult women. Almost all of labor force participation comprises of employment, with negligible rates of unemployment at each level of education. Less than 10 percent of women with intermediate education or less are employed, but almost 60 percent of women with higher second-ary or tertiary education work. However, there has been an 8 percentage point decline in employment among the most highly educated women between
2007 and 2012 (Figure 152 panel B). Conse-quently, the most educated women also have the highest rates of unemployment of around 5 to 6 percent.
Overall, 70 percent of employed women work in salaried employment (Figure 153 panel A). Among the few less educated women who work, the major-ity are self-employed: about a third of women with primary education or less work in salaried jobs. In contrast, with higher education, the likelihood of working in a salaried job more than doubles: for instance, almost all employed women who have secondary or higher education are employed in a salaried job. This pattern is driven by differences in access to public jobs by education level. Almost two-thirds of employed women work in the public sector, varying from around a fifth of women with primary education or less to almost all employed women with secondary or higher education (Figure 153 panel B).
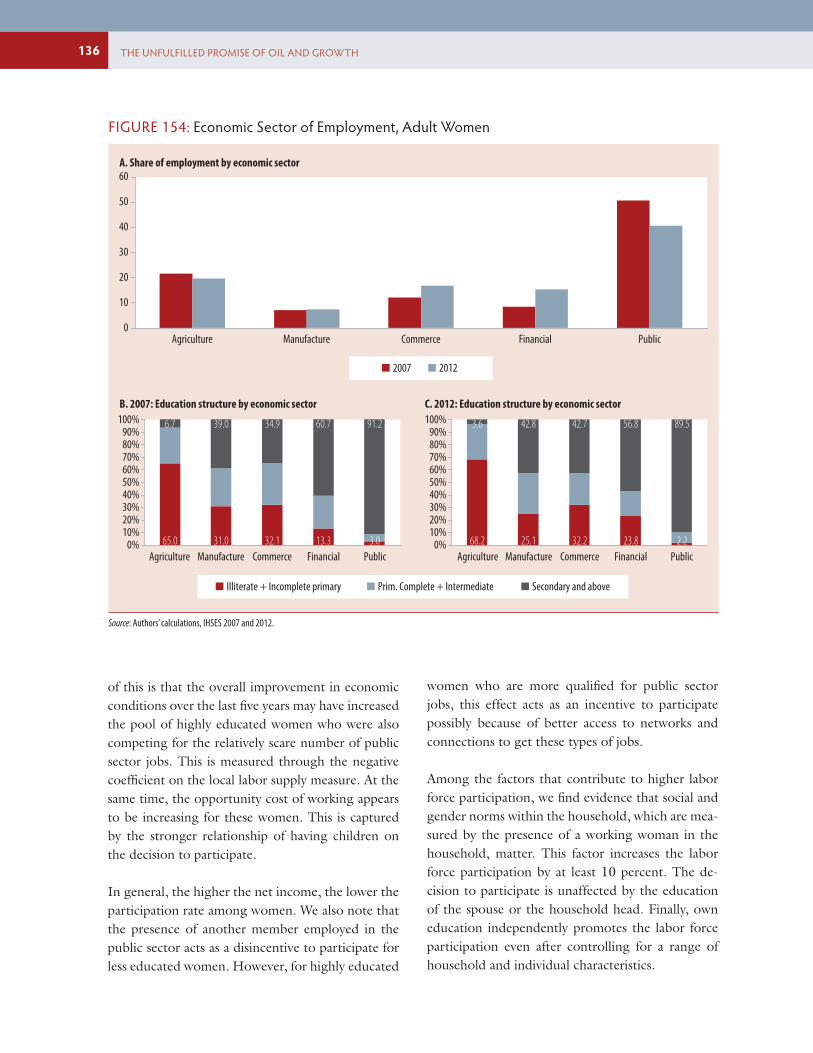
Between 2007 and 2012, adult women have moved primarily from the public administration, health and education services sector, which still employs 40 percent of women, to mostly public sector jobs in financial, insurance and professional services, and private sector jobs in commerce and retail. In ad-dition, there was a small decrease in employment in agriculture (Figure 154 panel A). Almost all women who work in agriculture have low levels of education; in contrast, almost 90 percent of women employed in the public administration sector have secondary and higher education. As a result of shift in women’s employment towards financial services and commerce, the share of highly educated women in the former has come down, whereas the share of highly educated women in commerce has increased (Figure 154 panels B and C).
What contributes to labor force participation among adult women?As in the case of the youth, we analyze how the pub-lic sector affects adult female participation in the la-bor market. To do so, we consider women between
FIGURE 151: Marginal E�ects of Being Active – Youth Population by Education Level
0.30
0
0.05
0.10
0.15
0.20
0.25
Inco
mpl
ete p
rimar
y
Com
plet
e prim
ary
Inte
rmed
iate
Seco
ndar
y
High
er se
cond
ary
Terti
ary
Mar
ginal
e�ec
t of b
eing a
ctive
2007 2012
Source: Authors’ calculations, IHSES 2007 and 2012.

THE GROWTH-EMPLOYMENT NEXUS 135
25 and 64 years old and we divide them into two groups accordingly to their marital status: currently married and non-married (including single, widowed and separated); and skill level: less educated—less than primary complete, and highly educated—more than primary complete. This results in four mutu-ally exclusive groups. We find that an increase of one
percentage point in the public employment rate of the governorate where the woman was born would contribute to a significant reduction, in general about 30 percent, in her participation holding every-thing else constant (see Table A 6.2 and A 6.3). The exception to this result is married women with high education levels in 2012. One possible explanation
FIGURE 152: Participation and Employment Rates, Adult Women
100A. Participation rate B. Employment rate
2007 2012
–102030405060708090
100
–102030405060708090
Illite
rate
Inco
mple
te pr
imar
y
Com
plete
prim
ary
Inte
rmed
iate
Seco
ndar
y
High
er se
cond
ary
Terti
ary
Tota
l
Illite
rate
Inco
mple
te pr
imar
y
Com
plete
prim
ary
Inte
rmed
iate
Seco
ndar
y
High
er se
cond
ary
Terti
ary
Tota
l
64.7
16.0
66.4
15.1
62.2
15.3
61.9
14.2
Source: Authors’ calculations, IHSES 2007 and 2012.
FIGURE 153: Type and Sector of Work, Adult Women
100A. Salaried B. Public sector
2007 2012
–102030405060708090
100
–102030405060708090
Illite
rate
Inco
mple
te pr
imar
y
Com
plete
prim
ary
Inte
rmed
iate
Seco
ndar
y
High
er se
cond
ary
Terti
ary
Tota
l
Illite
rate
Inco
mple
te pr
imar
y
Com
plete
prim
ary
Inte
rmed
iate
Seco
ndar
y
High
er se
cond
ary
Terti
ary
Tota
l
70.5
70.5
66.1
63.6
Source: Authors’ calculations, IHSES 2007 and 2012.
THE UNFULFILLED PROMISE OF OIL AND GROWTH136
of this is that the overall improvement in economic conditions over the last five years may have increased the pool of highly educated women who were also competing for the relatively scare number of public sector jobs. This is measured through the negative coefficient on the local labor supply measure. At the same time, the opportunity cost of working appears to be increasing for these women. This is captured by the stronger relationship of having children on the decision to participate.
In general, the higher the net income, the lower the participation rate among women. We also note that the presence of another member employed in the public sector acts as a disincentive to participate for less educated women. However, for highly educated
women who are more qualified for public sector jobs, this effect acts as an incentive to participate possibly because of better access to networks and connections to get these types of jobs.
Among the factors that contribute to higher labor force participation, we find evidence that social and gender norms within the household, which are mea-sured by the presence of a working woman in the household, matter. This factor increases the labor force participation by at least 10 percent. The de-cision to participate is unaffected by the education of the spouse or the household head. Finally, own education independently promotes the labor force participation even after controlling for a range of household and individual characteristics.
FIGURE 154: Economic Sector of Employment, Adult Women
100%B. 2007: Education structure by economic sector C. 2012: Education structure by economic sector
Illiterate + Incomplete primary Prim. Complete + Intermediate Secondary and above
0%10%20%30%40%50%60%70%80%90%
100%
0%10%20%30%40%50%60%70%80%90%
A. Share of employment by economic sector
2007 2012
Agriculture Manufacture Commerce Financial Public Agriculture Manufacture Commerce Financial Public
0
10
20
30
40
50
60
Agriculture Manufacture Commerce Financial Public
65.0 31.0 32.1 13.3 3.0 68.2 25.1 32.2 23.8 2.2
6.7 39.0 34.9 60.7 91.2 3.6 42.8 42.7 56.8 89.5
Source: Authors’ calculations, IHSES 2007 and 2012.

THE GROWTH-EMPLOYMENT NEXUS 137
Male Participation in the Labor ForceMore than four-fifth of adult Iraqi men of work-ing age are either employed or actively looking for work. While these rates of labor force participation are much higher than those among adult women and have remained almost stagnant between 2007 and 2012. Unlike for women, male labor force par-ticipation rates are on average higher among the less educated than among the better education. For in-stance, in 2012, while 87 percent of men aged 25 to 64 participated in the labor force, this drops 10 per-centage points among illiterate educated men and increases to more than 90 percent among secondary educated men (Figure 155 panel A).
As with women, the variation in labor force partici-pation by education is reflected in employment rates at different levels of education. Overall, 85 percent of adult men are employed, a rate that varies from 70 percent among the less educated men to 90 per-cent among men with tertiary education (Figure 155 panel B).
More than 70 percent of employed men work in salaried employment, which represents an increase of 6 percentage points relative to 2007 (Figure 156
panel A). A majority of men work in salaried em-ployment at each level of education, and the share of self-employment has fallen at each level of educa-tion between 2007 and 2012. At the highest lev-els of education, more than four-fifths of employed men work in salaried jobs. Unlike for women, this is not entirely driven by public sector employment, except for the highly educated. While the share of employment in the public sector has increased across education levels, less than 50 percent of men with secondary education in the public sector. In contrast, 70 percent of tertiary educated men work in the public sector. However, on average, 58 per-cent of adult men are employed in the private sec-tor; driven by a greater dependence on the private sector as a source of employment among the major-ity of adult men who have relatively low levels of education (Figure 156 panel B).
In 2012, three sectors—commerce and retail, public administration, health and education; and financial, insurance and professional services—together ac-counted for almost half of all employment for men (Figure 157 panel A). Between 2007 and 2012, adult men have moved away from agriculture, commerce and retail and public administration, predominantly
FIGURE 155: Participation and Employment Rates, Adult Men
100
A. Participation rate B. Employment rate
2007 2012
–102030405060708090
100
–102030405060708090
Illite
rate
Inco
mple
te pr
imar
y
Com
plete
prim
ary
Inte
rmed
iate
Seco
ndar
y
High
er se
cond
ary
Terti
ary
Tota
l
Illite
rate
Inco
mple
te pr
imar
y
Com
plete
prim
ary
Inte
rmed
iate
Seco
ndar
y
High
er se
cond
ary
Terti
ary
Tota
l
86.1
87.4
82.7 84.9
Source: Authors’ calculations, IHSES 2007 and 2012.
THE UNFULFILLED PROMISE OF OIL AND GROWTH138
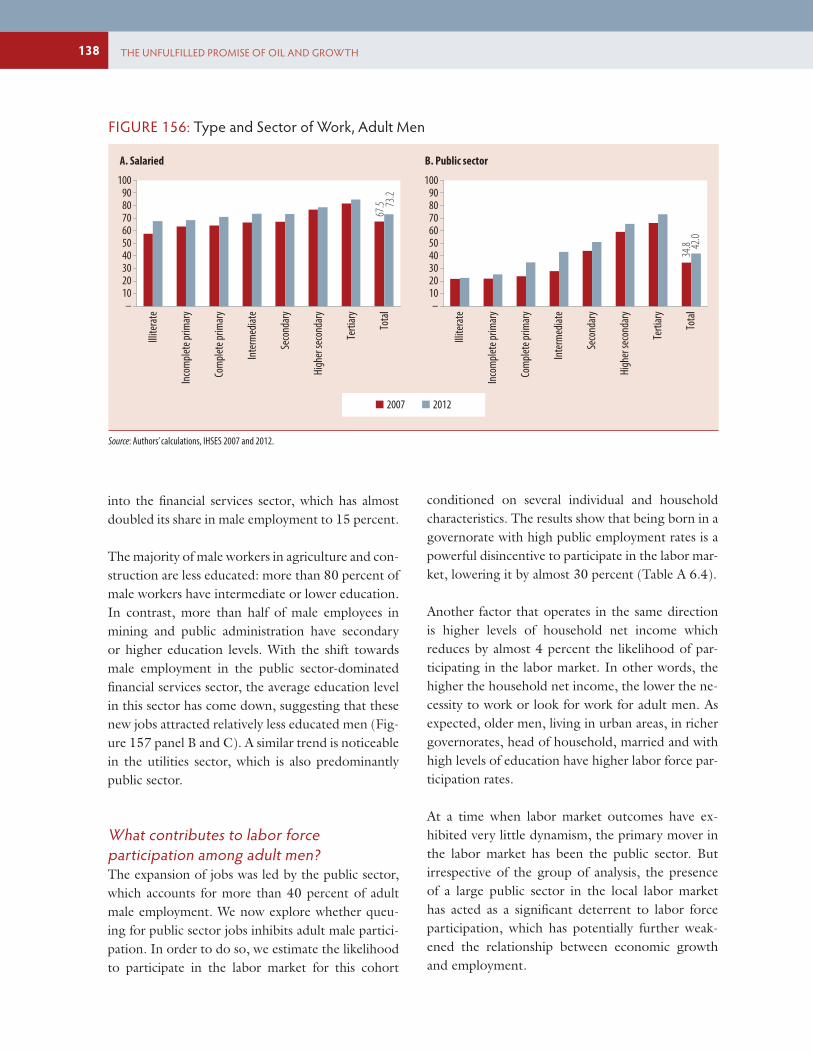
into the financial services sector, which has almost doubled its share in male employment to 15 percent.
The majority of male workers in agriculture and con-struction are less educated: more than 80 percent of male workers have intermediate or lower education. In contrast, more than half of male employees in mining and public administration have secondary or higher education levels. With the shift towards male employment in the public sector-dominated financial services sector, the average education level in this sector has come down, suggesting that these new jobs attracted relatively less educated men (Fig-ure 157 panel B and C). A similar trend is noticeable in the utilities sector, which is also predominantly public sector.
What contributes to labor force participation among adult men?The expansion of jobs was led by the public sector, which accounts for more than 40 percent of adult male employment. We now explore whether queu-ing for public sector jobs inhibits adult male partici-pation. In order to do so, we estimate the likelihood to participate in the labor market for this cohort
conditioned on several individual and household characteristics. The results show that being born in a governorate with high public employment rates is a powerful disincentive to participate in the labor mar-ket, lowering it by almost 30 percent (Table A 6.4).
Another factor that operates in the same direction is higher levels of household net income which reduces by almost 4 percent the likelihood of par-ticipating in the labor market. In other words, the higher the household net income, the lower the ne-cessity to work or look for work for adult men. As expected, older men, living in urban areas, in richer governorates, head of household, married and with high levels of education have higher labor force par-ticipation rates.
At a time when labor market outcomes have ex-hibited very little dynamism, the primary mover in the labor market has been the public sector. But irrespective of the group of analysis, the presence of a large public sector in the local labor market has acted as a significant deterrent to labor force participation, which has potentially further weak-ened the relationship between economic growth and employment.
FIGURE 156: Type and Sector of Work, Adult Men
100
A. Salaried B. Public sector
2007 2012
–102030405060708090
100
–102030405060708090
Illite
rate
Inco
mple
te pr
imar
y
Com
plete
prim
ary
Inte
rmed
iate
Seco
ndar
y
High
er se
cond
ary
Terti
ary
Tota
l
Illite
rate
Inco
mple
te pr
imar
y
Com
plete
prim
ary
Inte
rmed
iate
Seco
ndar
y
High
er se
cond
ary
Terti
ary
Tota
l
67.5 73
.2
34.8 42
.0
Source: Authors’ calculations, IHSES 2007 and 2012.

THE GROWTH-EMPLOYMENT NEXUS 139
What Explains Differences in Earnings?
At the same time, another dimension in which the public sector affects the labor market in the medium term is through distorting the incentives to invest in education by catering to certain fields of study that may be irrelevant to the private sector. To provide some evidence from the demand side on this partic-ular problem, we use the 2011 Iraq Enterprise Sur-vey (BES), which collects information over almost
1000 firms across the country.45 The BES is a na-tionally representative, firm-level survey conducted periodically by the World Bank Group in the devel-oping world. It collects data from non-agricultural, private-owned, registered firms with more than 5 employees. The survey covers a broad range of business environment topics including investment as well as their balance sheets and performance
FIGURE 157: Sector of Economic Activity, Adult Men
100%II. 2007: Education structure by economic sector III. 2012: Education structure by economic sector
Illiterate + Incomplete primary Prim. Complete + Intermediate Secondary and above
0%10%20%30%40%50%60%70%80%90%
Agric
ultur
e & �s
hing
Mini
ng &
quar
rying
Man
ufac
turin
g
Utilit
ies
Cons
tructi
on
Com
mer
ce an
d ret
ail
Tran
spor
t, sto
rage
&
Finan
cial, i
nsur
ance
Publi
c adm
inistr
ation
Othe
r ser
vices
100%
0%10%20%30%40%50%60%70%80%90%
Agric
ultur
e & �s
hing
Mini
ng &
quar
rying
Man
ufac
turin
g
Utilit
ies
Cons
tructi
on
Com
mer
ce an
d ret
ail
Tran
spor
t, sto
rage
&
Finan
cial, i
nsur
ance
Publi
c adm
inistr
ation
Othe
r ser
vices
I. Share of employment by economic sector
0 5 2510 15 20
Agriculture & �shing
Mining & quarrying
Manufacturing
Utilities
Construction
Commerce and retail
Transport, storage &
Financial, insurance
Public administration
Other services
2007 2012
41.6 8.3 20.4 11.9 27.5 21.1 21.1 14.0 13.7 26.3 49.4 11.0 23.5 29.1 40.7 26.9 29.8 25.3 11.6 26.4
16.6 55.0 35.0 55.2 15.1 30.0 22.4 45.4 52.7 24.1 11.9 52.9 34.4 32.9 11.6 28.4 21.0 28.5 55.8 38.2
Source: Authors’ calculations, IHSES 2007 and 2012.
45 �e BES was collected in Iraq between March 2011 and October 2011.

THE UNFULFILLED PROMISE OF OIL AND GROWTH140
measures. Given that this survey is representative at the national level, it is ideal for obtaining a broader picture of the investment environment in Iraq.
The BES finds that one of the major business con-straints is inadequately educated labor force. 34 per-cent of the firms identified this as a major constraint, which is almost 13 percentage points higher than the average in the region and 7 percentage points higher than among all countries (Figure 158). This could be a reflection of an important supply side challenge for the growth of the private sector. Iraq’s private sector also faces a range of other challenges to growth and job creation (See Box 4 for the main findings from the 2012 Investment Climate Assessments).
Earning functions for the Iraqi labor market are es-timated in order to understand the factors that ac-count for differences in earnings levels and growth rates. As expected, the main factors include sector of occupation, education, experience and geographic location. Even though the educational structure of the Iraqi working age population has not signifi-cantly changed over the last five years; the returns to education have increased for all workers. However,
there are significant differences in how these returns have varied across levels of education for male and female workers over time.
We calculate the returns to education for the work-ing-age population (between 15 to 65 years old) by gender in 2007 and 2012. We see that returns have increased significantly for almost all levels of edu-cation irrespective of being male or female (Figure 159). However, for males, the gap has been expand-ing over the last five years in a faster rate than that observed for females (Figure 159 panel A). Note also that the magnitude of differences in returns be-tween low and high educated women is bigger than for men. Moreover, these differentials in returns seem to not have significantly changed for women with less than secondary education but have wid-ened for women with higher secondary or tertiary education. This may be related to labor market seg-mentation between low and high educated women (Figure 159 panel B).
So far it appears that the labor market is generating the correct incentives to invest in education. How-ever, these dynamics seem to differ in the public
FIGURE 158: Business Constraints
Majo
r bus
iness
cons
traint
s
0 5 2510 15 20
TransportationTax administration
Crime, theft and disorderCorruption
Customs and trade regulationsTax rates
Access to �nanceLabor regulations
Business licensing and permitsInadequately educated workforce
Access to landPolitical instability
Practices of the informal sectorElectricity
Iraq Middle East & North Africa All countries
Source: Authors’ calculations, World Bank Enterprise Survey, Iraq, 2011.

THE GROWTH-EMPLOYMENT NEXUS 141
FIGURE 159: Evolution of Returns to Education by Gender
0
0.40A. Males B. Females
0.050.100.150.200.250.300.35
0
1.4
Inco
mple
te pr
imar
y
Com
plete
prim
ary
Inte
rmed
iate
Seco
ndar
y
High
er Se
cond
ary
Terti
ary
Inco
mple
te pr
imar
y
Com
plete
prim
ary
Inte
rmed
iate
Seco
ndar
y
High
er Se
cond
ary
Terti
ary
2007 2012
0.2
0.4
0.6
0.8
1.0
1.2
Source: Authors’ calculations, IHSES 2007 and 2012.
BOX 4: Doing Business in Iraq – Main Messages from the Investment Climate Assessment 2012
The private sector has limited presence and incentives for its expansion are nearly absent in Iraq. Accordingly to the last Investment Climate Assessment (ICA) for Iraq, this is a consequence of decades of socialist economic policy which have tightly bound Iraq’s economy to the state. Although the potential for private sector engagement in post-con�ict Iraq is signi�cant, the country’s private sector is both under-developed and unsupported. Most private businesses in Iraq are very small and informal, mainly operating in retail and trade, construction and transportation services, as well as in light industry in the textile, food, engineering, and chemicals �elds.
The Enterprise Survey suggests signi�cantly higher costs of doing business in Iraq than elsewhere in the region. Respondents to this survey listed electricity, instability, and corruption as the three most severe obstacles to doing business in Iraq. The average �rm su�ered nearly 600 power interruptions per year, with some �rms reporting three outages per day. This unstable power supply results in signi�cant sales losses. As a re�ection of the political instability in Iraq, security and crime are also major concerns, with many surveyed �rms spending considerably on protection. Note however, that the importance of these problems often varies signi�cantly between regions and sectors. Corruption further acts as an economic burden on �rms surveyed, with �rms reporting that bribes are commonplace, often to smooth frequent inspections from authorities, including government agencies and municipal police forces.
Among other problems identi�ed by this report are the following: poor access to �nance and land; and competition from State-Owned Enterprises (SOEs) and the informal sector. Credit systems and access to �nance are severely limited because of the state’s long-term dominance. Nearly half of the �rms surveyed reported having great di�culty in obtaining �nancing; fewer than 7% reported having a loan. Some small and micro-enterprises have no access to banks with markedly di�culties for the smaller ones. Firms also reported poor access to land for investment in general caused by widespread government ownership of prime land and ine�cient methods of allocation to the private sector. With regard to competition from the informal sector, �rms report di�culties confronting competition from unregistered companies, many of which infringe upon the rights of registered businesses, and face lower costs due to their noncompliance with formal rules.
These are few of multiple constraints that private �rms faced on doing business in Iraq such as proper transport or access to adequate labor force. It is not surprising that the ICA report emphasizes the fact that The World Bank’s Doing Business 2012 Report ends ranking Iraq 164 out of 183 economies. Iraq ranks second to last amongst the economies in the Middle East and North Africa region (MENA), signi�cantly behind regional best performers on a global level such as Saudi Arabia (12), United Arab Emirates (33), and Qatar (36).
Source: Investment Climate Assessment—Iraq, World Bank (2012).

THE UNFULFILLED PROMISE OF OIL AND GROWTH142
and private sector labor markets. From the public sector’s viewpoint, the incorporation of less edu-cated workers has produced an expected adjustment on their returns relative to highly educated public workers irrespective of gender. Figure 160 shows that there was no significant increase in the returns of the highly educated workers while the less edu-cated ones experienced the opposite relative to il-literate workers. On the other hand, what occurred in the private sector was that the gap was widened significantly only for highest educated males.
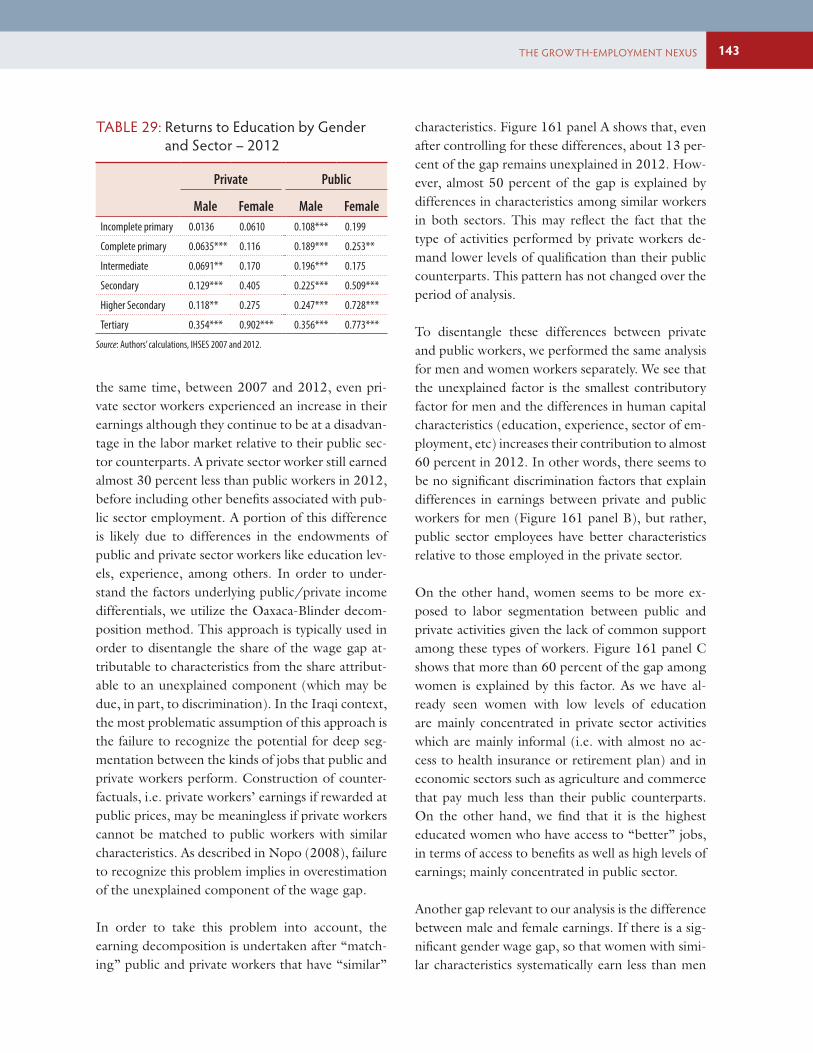
The returns to education in the labor market can profoundly affect the decision to invest in education and the level at which education is stopped. When we examine the earnings gains for each additional education level, we see that in 2012 an average male in the working-age population receives 20 percent more in the public sector by having complete pri-mary education relative to being illiterate. How-ever, the premium for getting an additional level is almost negligible thereafter except when he com-pletes tertiary education, when he obtains roughly an additional 11 percent increase (Table 29). The private sector is not as generous as the public sector at lower levels of education and a similar male will
only get 6 percent higher returns for having com-pleted primary school. However, the private sector catches up for the highest educated males by offer-ing similar premiums as the public sector. Note that the private sector pays much less than the public sec-tor irrespective of gender.
A similar story is true for Iraqi women (Table 29). For the few women who are employed, the pre-mium for getting primary school is higher than for males, increasing from 11 percent up to 25 percent relative to illiterate women in the private and public sector respectively. In contrast to their male coun-terparts, women received an increase again of about 30 percent more by obtaining secondary school ir-respective of the sector (Table 29). This would be mainly driven by the types of activities (i.e. secretar-ies, assistants, etc.) that most of these workers likely perform in comparison to males. The next big jump in women’s education premium happens when they get up to tertiary.
Hand in hand with the growth in employment in the public sector, earnings have disproportionately increased among public sector employees, from al-ready high levels compared to the private sector. At
FIGURE 160: Evolution of Returns to Education by Gender – Public Sector
0
0.40A. Males B. Females
0.050.100.150.200.250.300.35
0
0.9
0.20.1
0.30.40.50.60.70.8
Inco
mple
te pr
imar
y
Com
plete
prim
ary
Inte
rmed
iate
Seco
ndar
y
High
er Se
cond
ary
Terti
ary
Inco
mple
te pr
imar
y
Com
plete
prim
ary
Inte
rmed
iate
Seco
ndar
y
High
er Se
cond
ary
Terti
ary
2007 2012
Source: Authors’ calculations, IHSES 2007 and 2012.
THE GROWTH-EMPLOYMENT NEXUS 143
the same time, between 2007 and 2012, even pri-vate sector workers experienced an increase in their earnings although they continue to be at a disadvan-tage in the labor market relative to their public sec-tor counterparts. A private sector worker still earned almost 30 percent less than public workers in 2012, before including other benefits associated with pub-lic sector employment. A portion of this difference is likely due to differences in the endowments of public and private sector workers like education lev-els, experience, among others. In order to under-stand the factors underlying public/private income differentials, we utilize the Oaxaca-Blinder decom-position method. This approach is typically used in order to disentangle the share of the wage gap at-tributable to characteristics from the share attribut-able to an unexplained component (which may be due, in part, to discrimination). In the Iraqi context, the most problematic assumption of this approach is the failure to recognize the potential for deep seg-mentation between the kinds of jobs that public and private workers perform. Construction of counter-factuals, i.e. private workers’ earnings if rewarded at public prices, may be meaningless if private workers cannot be matched to public workers with similar characteristics. As described in Nopo (2008), failure to recognize this problem implies in overestimation of the unexplained component of the wage gap.
In order to take this problem into account, the earning decomposition is undertaken after “match-ing” public and private workers that have “similar”
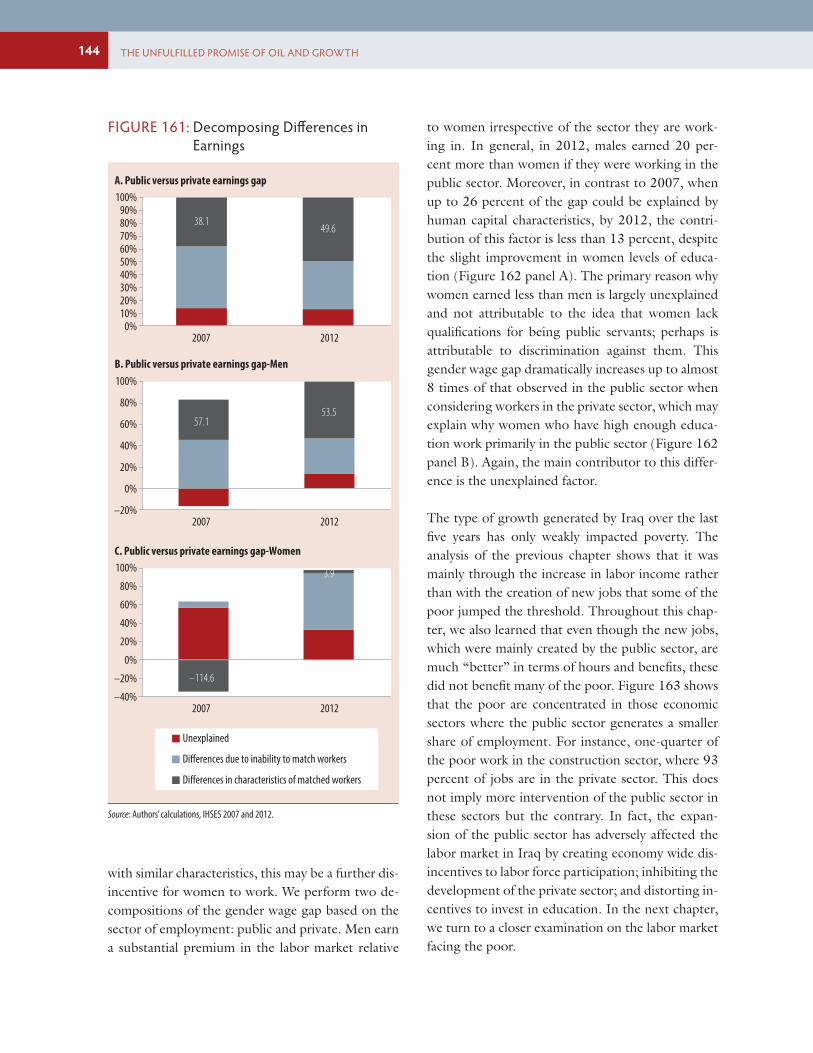
characteristics. Figure 161 panel A shows that, even after controlling for these differences, about 13 per-cent of the gap remains unexplained in 2012. How-ever, almost 50 percent of the gap is explained by differences in characteristics among similar workers in both sectors. This may reflect the fact that the type of activities performed by private workers de-mand lower levels of qualification than their public counterparts. This pattern has not changed over the period of analysis.
To disentangle these differences between private and public workers, we performed the same analysis for men and women workers separately. We see that the unexplained factor is the smallest contributory factor for men and the differences in human capital characteristics (education, experience, sector of em-ployment, etc) increases their contribution to almost 60 percent in 2012. In other words, there seems to be no significant discrimination factors that explain differences in earnings between private and public workers for men (Figure 161 panel B), but rather, public sector employees have better characteristics relative to those employed in the private sector.
On the other hand, women seems to be more ex-posed to labor segmentation between public and private activities given the lack of common support among these types of workers. Figure 161 panel C shows that more than 60 percent of the gap among women is explained by this factor. As we have al-ready seen women with low levels of education are mainly concentrated in private sector activities which are mainly informal (i.e. with almost no ac-cess to health insurance or retirement plan) and in economic sectors such as agriculture and commerce that pay much less than their public counterparts. On the other hand, we find that it is the highest educated women who have access to “better” jobs, in terms of access to benefits as well as high levels of earnings; mainly concentrated in public sector.
Another gap relevant to our analysis is the difference between male and female earnings. If there is a sig-nificant gender wage gap, so that women with simi-lar characteristics systematically earn less than men
TABLE 29: Returns to Education by Gender and Sector – 2012
Private Public
Male Female Male FemaleIncomplete primary 0.0136 0.0610 0.108*** 0.199
Complete primary 0.0635*** 0.116 0.189*** 0.253**
Intermediate 0.0691** 0.170 0.196*** 0.175
Secondary 0.129*** 0.405 0.225*** 0.509***
Higher Secondary 0.118** 0.275 0.247*** 0.728***
Tertiary 0.354*** 0.902*** 0.356*** 0.773***
Source: Authors’ calculations, IHSES 2007 and 2012.
THE UNFULFILLED PROMISE OF OIL AND GROWTH144
with similar characteristics, this may be a further dis-incentive for women to work. We perform two de-compositions of the gender wage gap based on the sector of employment: public and private. Men earn a substantial premium in the labor market relative
to women irrespective of the sector they are work-ing in. In general, in 2012, males earned 20 per-cent more than women if they were working in the public sector. Moreover, in contrast to 2007, when up to 26 percent of the gap could be explained by human capital characteristics, by 2012, the contri-bution of this factor is less than 13 percent, despite the slight improvement in women levels of educa-tion (Figure 162 panel A). The primary reason why women earned less than men is largely unexplained and not attributable to the idea that women lack qualifications for being public servants; perhaps is attributable to discrimination against them. This gender wage gap dramatically increases up to almost 8 times of that observed in the public sector when considering workers in the private sector, which may explain why women who have high enough educa-tion work primarily in the public sector (Figure 162 panel B). Again, the main contributor to this differ-ence is the unexplained factor.
The type of growth generated by Iraq over the last five years has only weakly impacted poverty. The analysis of the previous chapter shows that it was mainly through the increase in labor income rather than with the creation of new jobs that some of the poor jumped the threshold. Throughout this chap-ter, we also learned that even though the new jobs, which were mainly created by the public sector, are much “better” in terms of hours and benefits, these did not benefit many of the poor. Figure 163 shows that the poor are concentrated in those economic sectors where the public sector generates a smaller share of employment. For instance, one-quarter of the poor work in the construction sector, where 93 percent of jobs are in the private sector. This does not imply more intervention of the public sector in these sectors but the contrary. In fact, the expan-sion of the public sector has adversely affected the labor market in Iraq by creating economy wide dis-incentives to labor force participation; inhibiting the development of the private sector; and distorting in-centives to invest in education. In the next chapter, we turn to a closer examination on the labor market facing the poor.
FIGURE 161: Decomposing Di�erences in Earnings
100%A. Public versus private earnings gap
0%
B. Public versus private earnings gap-Men
C. Public versus private earnings gap-Women
10%20%30%40%50%60%70%80%90%
2007 2012
100%
–20%
20%
40%
60%
80%
2007 2012
100%
–40%
20%
40%
60%
80%
2007 2012
0%
–20%
0%
Unexplained
Di�erences due to inability to match workers
Di�erences in characteristics of matched workers
38.149.6
57.153.5
–114.6
3.9
Source: Authors’ calculations, IHSES 2007 and 2012.

THE LABOR MARKET FOR THE POOR: THE RURAL-URBAN DIVIDE 145
FIGURE 162: Decomposing Gender Di�erences in Earnings
100%A. Male versus Female earnings gap-Public
–20%
0%
20%
40%
60%
80%
100%
–20%
0%
20%
40%
60%
80%
2007 2012
B. Male versus Female earnings gap-Private
2007 2012
Unexplained Di�erences due to inability to match workers Di�erences in characteristics of matched workers
26.2 12.7
–6.9
38.0
Source: Authors’ calculations, IHSES 2007 and 2012.
FIGURE 163: Evolution of Employment by Economic Sector
A. Share of public jobs by economic sector B. Distribution of poor by economic sector
0 105 3015 20 25
Agriculture & �shing
Mining & quarrying
Manufacturing
Utilities
Construction
Commerce and retail
Transport, storage &
Financial, insurance
Public administration
Other services
– 20 10040 60 80
Agriculture & �shing
Mining & quarrying
Manufacturing
Utilities
Construction
Commerce and retail
Transport, storage &
Financial, insurance
Public administration
Other services
2007 2012
-
91.7
23.5
84.2
9.3
3.6
17.8
35.0
95.3
42.8
2.2
86.8
33.9
76.0
7.7
4.8
24.3
65.7
96.4
43.6
24.8
0.8
9.2
1.1
19.4
12.3
8.8
4.9
13.3
5.4
16.2
0.4
7.8
2.8
25.2
10.0
12.1
10.5
8.9
6.1
Source: Authors’ calculations, IHSES 2007 and 2012.