Embed Size (px)
Citation preview
EMULATION OF TOPSAR MODE DATA
FOR ITS INTERFEROMETRIC CAPABILITIES ANALYSIS
Javier Duro(1)
, David Albiol(1)
, Alain Arnaud(1)
,
Céline Tison(2)
, Jean-Claude Souyris (2)
(1)Altamira-Information - C/ Còrsega 381-387, 08037 Barcelona, Spain - [email protected]
(2)CNES - 18 avenue Edouard Belin, 31401 Toulouse Cedex 9, France
ABSTRACT
TOPSAR (Terrain Observation with Progressive Scan)
is as new wide swath acquisition mode which is planned
to be used by the forthcoming ESA SAR sensor
Sentinel-1 [1]. This system allows achieving similar
swath coverage than the ScanSAR mode but with an
improved azimuth resolution by rotating the antenna
from backward to forward at a constant speed Moreover
it overcomes two of the main drawbacks of ScanSAR
images, amplitude scalloping and the azimuth varying
ambiguities. The main objective of the study presented
is the analysis and understanding of the characteristics
of the TOPSAR new wide swath acquisition mode.
Special emphasis has also been brought on the
evaluation of its interferometric performance. The
following paper reports the results of those analyses.
1. INTRODUCTION
As the ScanSAR mode, TOPSAR is a wide swath mode
which states a tradeoff between azimuth resolution and
range coverage. As lower resolution is expected the targets do not need to be illuminated by the full azimuth aperture [2].
In TOPSAR mode, as in the ScanSAR one, the satellite
transmits a limited sequence of pulses, called burst, in
one subswath and then steers the beam center to
illuminate another subswath. After scanning all the
subswaths the antenna beam center returns to the initial
one and the cycle is repeated.
The major difference between both modes is that in the
TOPSAR the antenna is also electronically steered in
the azimuth direction while scanning each subswath
from backward to forward. This particular mechanism
results in an increase of the observation time for each
ground target (a larger burst extent and the higher
resolution) and in a uniform gain as result of the
equivalent azimuth antenna pattern which is applied to
each target on ground. This results in important
radiometric enhancements extensively reviewed in the
literature with simulated [3] and real data [1], which
mainly are:
• The reduction of the azimuth scalloping
• The achievement of a constant noise equivalent
sigma zero (NESZ) and signal to azimuth
ambiguity ratio within the burst
The second section of this paper concerns the emulation
of TOPS data from TerraSAR-X Stripmap images
acquired over Barcelona. The emulation directly
considers level 1 data. The third section of the document
reports the results of the interferometric analysis lead
with the emulated TOPSAR scenes. Conclusion and
outlooks of the overall work is proposed in the last part.
2. EMULATION OF TOPSAR DATA FROM A
TERRASAR-X STRIPMAP
2.1. Main considerations
TOPSAR level 1 data is emulated using TerraSAR-X
Stripmap data. The emulation is performed by
considering the Time Frequency Diagram (TFD) of both
acquisition modes.
The result of the process is a very short TOPSAR burst,
due to the fact that the Stripmap band only extends one
PRF, preventing from obtaining the whole frequency
extension of an actual TOPSAR burst (∼3PRF). This is illustrated in Fig. 1 by the dashed red lines that mark a
burst time duration lower than the real one that is
represented with the dashed black lines.
The resulting emulated TOPSAR burst only has the
number of lines that satisfies the Eq. 1:
2
PRFtK
2
PRFTOPSa ≤⋅≤− (1)
where Ka is the Doppler centroid rate introduced by the
antenna rotation in azimuth and tTOPS the TOPSAR
azimuth time.
The equivalent “stripmap image” (Fig. 1) has been
generated for comparison purposes with the emulated
TOPSAR burst. It corresponds to a filtered version of
the TerraSAR-X image that has been processed, setting
⅔ of its band were set to zero, thus decreasing the image
resolution.

Figure 1. Schema of the TFD support considered for the
emulation of TOPSAR data from Stripmap mode.
2.2. Emulation algorithm steps
The TOPSAR emulation process consists in two main
steps described in the following subsections:
- The whitening of the original TerraSAR-X
Stripmap image spectrum,
- The application of a time-frequency variant filter
allowing obtaining the correct frequency band for
each TOPSAR line.
2.2.1. Time-frequency variant TOPSAR filtering
The spectrum is whitened estimating the TerraSAR-X
Stripmap image Azimuth Antenna Pattern (AAP),
applying a FFT in the azimuth direction. Once the
spectrum is flat, it is “sliced” using the TOPSAR AAP.
The TOPSAR AAP is generated in the frequency
domain by using the Eq. 2.
( )2
eff
aeff
a2aTOPS
V2
f1V2
fLsincfAAP
⋅λ⋅
−⋅⋅
⋅α⋅= (2)
where α represents the decrease of the resolution.
The TOPS filter relates then the zero-Doppler samples
(tzd in stripmap geometry) with the TOPS time vector
(tTOPS) using the relation (Eq. 3).
zd
Ra
R
TOPS tKK
Kt
+= (3)
where KR is the azimuth Doppler rate.
Starting from the first line, the instantaneous frequency
for each line is computed applying the Eq. 4 and, the
lines are discarded until fa fits in the interval [-PRF/2;
+PRF/2] in order to satisfy the Eq. 1. This instantaneous
frequency will be the central frequency of the filter.
TOPSaa tKf ⋅= (4)
This results in a burst that is about three times shorter
than a real TOPSAR one (Fig. 2).
ta
fa
PRF
Tb
tzd tTOPS
Figure 2. TOPSAR burst generation
from the Stripmap TFD support.
The whitened spectrum of each line satisfying the Eq. 1
is multiplied with the TOPSAR AAP shifted for every
line to the frequency given by the Eq. 4. Fig. 3
illustrates this procedure. The width of the filter is given
by the target’s Doppler bandwidth, which is determined
by the TOPS acquisition parameters (here a value of
about 450Hz considering TOPS TerraSAR-X
parameters as given in [4] is assumed).
Figure 3. The Stripmap whitened spectrum is cut by
the TOPSAR AAP, resulting in the green spectrum
2.2.2. Results and performance of the TOPSAR
emulation
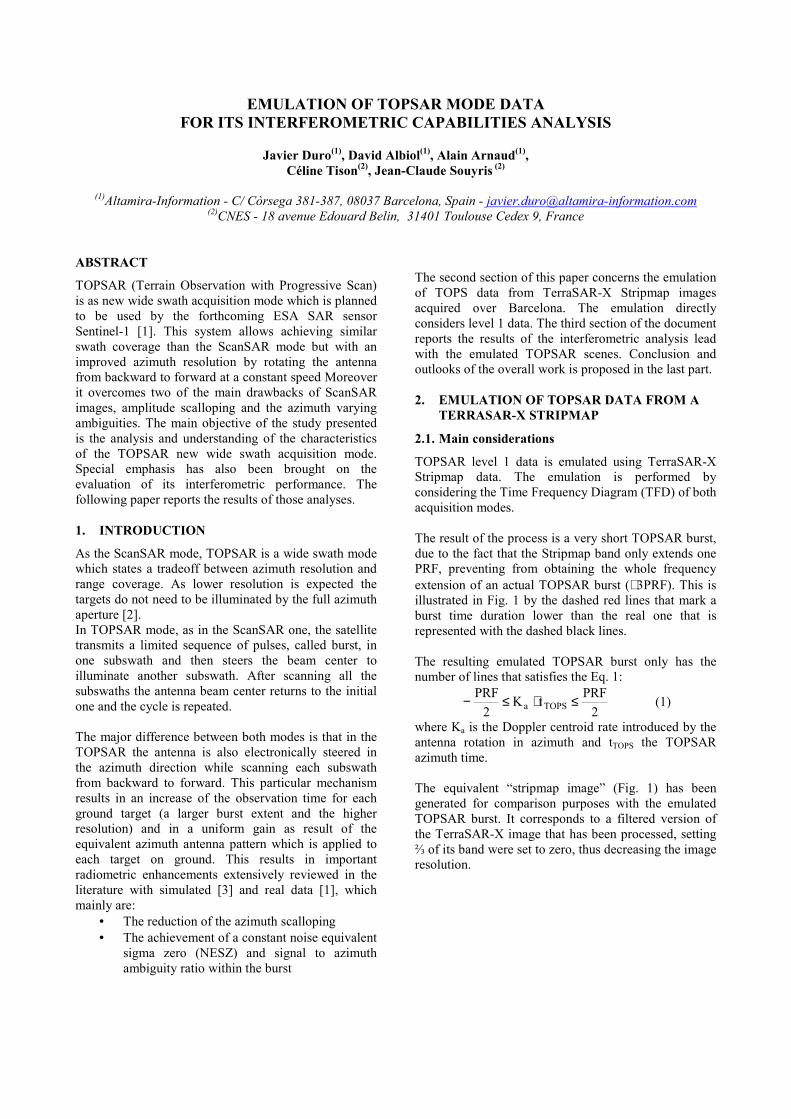
Fig. 4 shows a subset of the equivalent TerraSAR-X
image and the corresponding emulated TOPSAR burst.
Both have the same pixel spacing equal in range to the
nominal Stripmap one and related to 1/PRF in azimuth.
Further analysis can be performed in order to evaluate
the resolution loss introduced by the TOPSAR mode.
Taking an azimuth profile of the amplitude of identified
point targets, it can be seen that the resolution is worst
for the TOPSAR mode; this was expected. Fig. 5 shows
the azimuth profiles of two point targets; highlighted by
the red circle in Fig. 4. It can be observed that the
amplitude profile has a width of about 3 samples for the
equivalent stripmap case (in Fig. 5a)) and of about 16
samples for the emulated TOPSAR (in Fig. 5b)).
EquivalentStripmap at:3m res and 1m spacing
Emulated TOPSAR burst at: 16m res. and 1m spacing
Figure 4. Equivalent TerraSAR-X Stripmap and
emulated TOPSAR burst mode images.
a) b)
Figure 5. Azimuth profile of the resulting amplitude to
analyse the resolution of the emulated TOPSAR burst –
a) Equivalent Stripmap at 3m res and b) Emulated
TOPSAR burst at 16m res.
3. TOPSAR INSAR PROCESSING
3.1. Main considerations
The TOPSAR interferometry is performed using the
TOPSAR emulated data generated. The objective is to
perform an analysis and an evaluation of the TOPS
interferometric mode considering the system acquisition
conditions.
Interferometry with TOPSAR is not very different from
interferometry with any ScanSAR system based on
bursted data acquired with several swaths. The basic
constraint is related to a significant Doppler spectrum
overlap between the two data takes. Like ScanSAR
mode this depends on the system acquisition design, on
the accuracy of the burst synchronization and the
platform attitude [2][3]. However, as more azimuth
bandwidth is available the synchronization requirements
are less strict. Furthermore, the current technology
seems to fulfill such requisites [2]. Any synchronization
mismatch would introduce a shift in the azimuth spectra
that would lead to a loss in the interferogram azimuth
resolution. In particular, a squint error δψ induces a Doppler shift given by the Eq. 5.
λδψ=∆ s
shiftDop
v2f _ (5)
vs being the satellite velocity.
In the experiments reported here four emulated
TOPSAR bursts were generated from TerraSAR-X
Stripmap scenes acquired over the city of Barcelona.
One of the pairs presents a Doppler centroid difference
of 150Hz and the other a value close to 0Hz. The first
interferometric pair has also a slightly different azimuth
FM rate and antenna rotation rate, which leads into a
partially asynchronous TOPS repeat pass. Two
interferograms were made from the four emulated
TOPSAR bursts. The flat earth, as well the topographic
contribution is compensated using an SRTM DEM at
90x90 m. The major scope is to demonstrate the effect
of an asynchronous repeat pass and the effect of the
common-band filter. A qualitative comparison with
Stripmap interferometry is also conducted. Finally the
capabilities of the emulated TOPSAR for cross-mode
interferometry (TOPSAR and StripMap) are evaluated.
3.2. Correction in space and frequency of the
asynchronous acquisitions
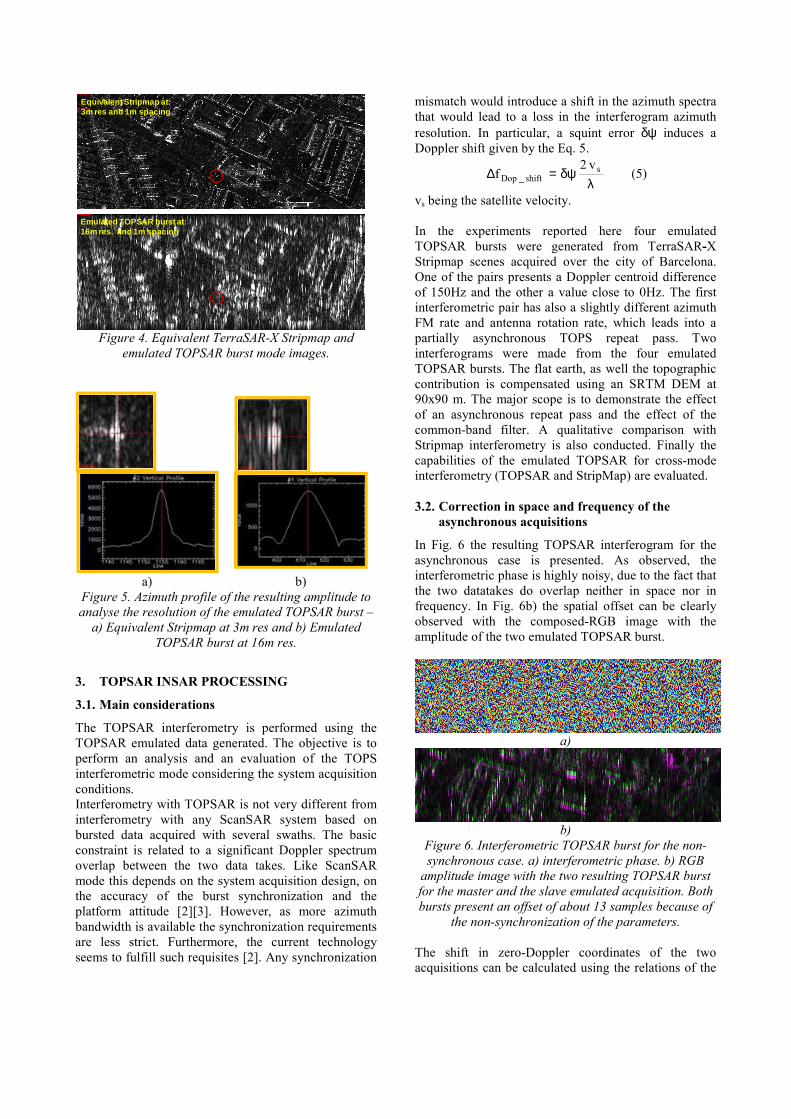
In Fig. 6 the resulting TOPSAR interferogram for the
asynchronous case is presented. As observed, the
interferometric phase is highly noisy, due to the fact that
the two datatakes do overlap neither in space nor in
frequency. In Fig. 6b) the spatial offset can be clearly
observed with the composed-RGB image with the
amplitude of the two emulated TOPSAR burst.
a)
b)
Figure 6. Interferometric TOPSAR burst for the non-
synchronous case. a) interferometric phase. b) RGB
amplitude image with the two resulting TOPSAR burst
for the master and the slave emulated acquisition. Both
bursts present an offset of about 13 samples because of
the non-synchronization of the parameters.
The shift in zero-Doppler coordinates of the two
acquisitions can be calculated using the relations of the
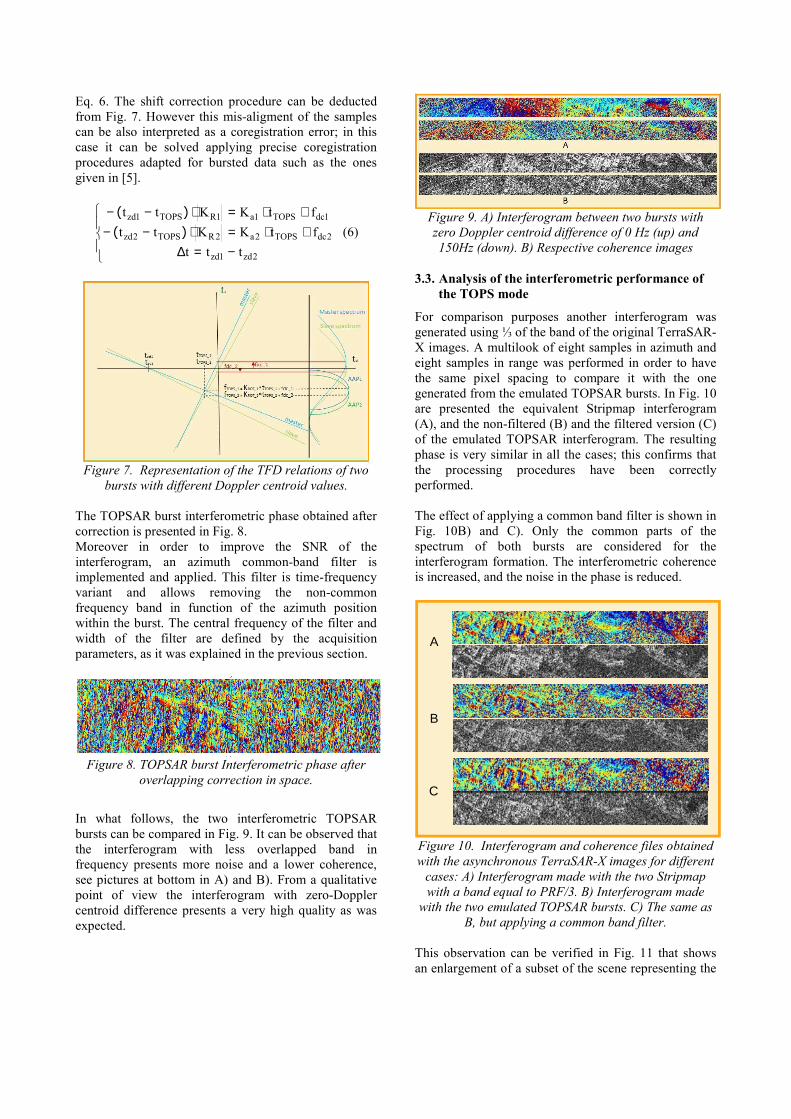
Eq. 6. The shift correction procedure can be deducted
from Fig. 7. However this mis-aligment of the samples
can be also interpreted as a coregistration error; in this
case it can be solved applying precise coregistration
procedures adapted for bursted data such as the ones
given in [5].
−=∆+⋅=⋅−−+⋅=⋅−−
2zd1zd
2dcTOPS2a2RTOPS2zd
1dcTOPS1a1RTOPS1zd
ttt
ftKKtt
ftKKtt
)(
)(
(6)
Figure 7. Representation of the TFD relations of two
bursts with different Doppler centroid values.
The TOPSAR burst interferometric phase obtained after
correction is presented in Fig. 8.
Moreover in order to improve the SNR of the
interferogram, an azimuth common-band filter is
implemented and applied. This filter is time-frequency
variant and allows removing the non-common
frequency band in function of the azimuth position
within the burst. The central frequency of the filter and
width of the filter are defined by the acquisition
parameters, as it was explained in the previous section.
Figure 8. TOPSAR burst Interferometric phase after
overlapping correction in space.
In what follows, the two interferometric TOPSAR
bursts can be compared in Fig. 9. It can be observed that
the interferogram with less overlapped band in
frequency presents more noise and a lower coherence,
see pictures at bottom in A) and B). From a qualitative
point of view the interferogram with zero-Doppler
centroid difference presents a very high quality as was
expected.
Figure 9. A) Interferogram between two bursts with
zero Doppler centroid difference of 0 Hz (up) and
150Hz (down). B) Respective coherence images
3.3. Analysis of the interferometric performance of
the TOPS mode
For comparison purposes another interferogram was
generated using ⅓ of the band of the original TerraSAR-
X images. A multilook of eight samples in azimuth and
eight samples in range was performed in order to have
the same pixel spacing to compare it with the one
generated from the emulated TOPSAR bursts. In Fig. 10
are presented the equivalent Stripmap interferogram
(A), and the non-filtered (B) and the filtered version (C)
of the emulated TOPSAR interferogram. The resulting
phase is very similar in all the cases; this confirms that
the processing procedures have been correctly
performed.
The effect of applying a common band filter is shown in
Fig. 10B) and C). Only the common parts of the
spectrum of both bursts are considered for the
interferogram formation. The interferometric coherence
is increased, and the noise in the phase is reduced.
A
B
C
Figure 10. Interferogram and coherence files obtained
with the asynchronous TerraSAR-X images for different
cases: A) Interferogram made with the two Stripmap
with a band equal to PRF/3. B) Interferogram made
with the two emulated TOPSAR bursts. C) The same as
B, but applying a common band filter.
This observation can be verified in Fig. 11 that shows
an enlargement of a subset of the scene representing the

harbour of Barcelona (right hand side of the burst). With
a coherence threshold of 0.52 the points in the water
disappear after applying the common band filter. This
was expected as the SNR has been increased. However,
there is a degradation of the interferometric resolution
of about 30% due to the reduction of the processing
band (Fig. 10B and C)).
CBA
Figure 11. Zoom of the right-hand part TOPSAR
coherence images, a threshold of 0.52 has been applied.
A) Stripmap coherence with ⅓ of the band. B)
Coherence of the TOPSAR interferogram. C) Coherence
of the TOPSAR interferogram with a common band
filter. False detected coherent targets in the water are
highlighted with red circles in B.
4. CROSS-MODE INTERFEROMETRIC
PROCESSING
The objective of this section is to perform a
demonstration of performance regarding the cross-mode
interferometry for one burst. For this purposes the same
SLC TerraSAR-X image will be used to produce a
TOPSAR burst and an equivalent stripmap image. The
main scope is to demonstrate that cross-mode
interferometry will be possible only in the center of the
TOPSAR burst due to the extension of Doppler
frequencies swept by the TOPS acquisition mode.
The bandwith intersection of the equivalent stripmap
and the TOPSAR burst images is schematized in Fig.
12. The black areas are the ones with non-overlapping
bandwidth, and hence they are the ones that should be
removed by the interferometric common-band filter.
The resulting cross-mode interferometric coherence is
showed in Fig. 13. The coherence between both
emulated images is presented in function of different
implementations of the common-band filter.
a) When no filter is applied, the coherence is higher for
the centre part of the TOPSAR burst (where the SNR is
higher).
b) When filtering the non-common band of the
equivalent stripmap image the coherence increases
drastically, especially in the central part of the burst.
c) Finally, in order to eliminate the residual fluctuation
of the coherence, the non-common band of the emulated
TOPSAR image is also filtered. In this case, the
coherence equals 0 or 1, indicating only the areas with
full spectral and spatial overlap, which are the central
part of the burst.
Figure 12. Overlapped bandwidth between the emulated
TOPSAR burst and the equivalent stripmap image. The
non-common band that should be removed by the filter
is masked with the black areas.
a)
b)
c)
Figure 13. Resulting interferometric coherence for one
cross-mode interferogram performed with two
emulations of the same stripmap TerraSAR-X image as
reference.
a) Coherence without applying any filter. c) The non-
common band of the equivalent has been filtered
stripmap. c) The non-overlapping band in the two takes
is finally totally filtered.

5. CONCLUSION
The interferometric capabilities and performances of the
new wide swath acquisition mode based on TOPS
system have been investigated in this study. The
different steps of the emulation of TOPSAR data from
TerraSAR-X Stripmap scenes have been described and
explained.
TOPSAR interferometric performances have been
analyzed based on the emulated data. Those analyses
were made based on the TOPS acquisition parameters
and the level 1 data product of the sensor TerraSAR-X.
Using the emulated data an interferometric analysis in
case of asynchronous datasets has been conducted. It
has also been demonstrated that cross-mode
interferometry, using emulated TOPSAR data and an
equivalent Strimap image, was only possible over a
small stripe within the burst
All those tests and the comparison with the stripmap
mode interferograms have allowed to validate the
emulation procedures. Furthermore a TOPS common-
band filter has been implemented in order to enhance
the SNR
The capabilities of TOPSAR system as wide swath
interferometric mode seem very promising, as reviewed
by this study. The proposed trade-off between coverage
and resolution (of about 300 Km at 20 meters of
resolution) makes it very appropriate for large InSAR
operational monitoring. However, some interesting
points still open for discussion such as possible
discontinuities at the bursts edges due to the differences
in the used squint angles when observing distributed
targets-like pixels.
REFERENCES
[1] F. de Zan, et al. “TOPSAR: Terrain Observation
by Progressive Scans”, IEEE Trans. Geosci.
Remote Sens., vol.44, Sept 2006.
[2] A. Meta et al. “TerraSAR-X TOPSAR and
ScanSAR comparison”, Proceedings of EUSAR
2008, Friedrichshafen (Germany).
[3] A. Monti Guarnieri et al, “ScanSAR focussing and
interferometry,” IEEE Trans. Geosci. Remote
Sens., vol. 34, no. 4, Jul. 1996.
[4] A. Meta et al., “Investigations on the TOPSAR
acquisition mode with TerraSAR-X”, Proceedings
of IGARSS 2007, Barcelona (Spain).
[5] P. Prats et al., “TOPS Interferometry with
TerraSAR-X”, Proceedings of EUSAR 2010,
Aachen (Germany).


![Apple ][ Emulation on an AVR Microcontroller Emulation ... · Apple ][ Emulation on an AVR Microcontroller Emulation eines Apple ][ auf einem AVR Mikrocontroller Maximilian Strauch](https://img.pdfslide.net/doc/110x75/5d494b4588c99334058bd1f6/apple-emulation-on-an-avr-microcontroller-emulation-apple-emulation.jpg)