Embed Size (px)
Citation preview

CORELIS 1
CAS-1000-I2C/E ™ I2C Bus Analyzer, Exerciser, Programmer, and Tester
User’s Manual
Corelis, Inc. 13100 Alondra Blvd. Cerritos, CA 90703
Telephone: 562.926.6727 • Fax: (562) 404-6196


Preface Copyright © 2006-2013, Corelis Inc.
PRINTING HISTORY Edition 1, February 2006 Edition 2, March 2006 Edition 3, May 2006 Edition 4, June 2006 Edition 5, November 2006 Edition 6, October 2007 Edition 7, July 2008 Edition 8, January 2009 Edition 9, January 2010 Edition 10, February 2011 Edition 11, October 2012 Edition 12, October 2013
GENERAL NOTICE Information contained in this document is subject to change without notice. CORELIS shall not be liable for errors contained herein for incidental or consequential damages in connection with the furnishing, performance, or use of material contained in this manual. This document contains proprietary information that is protected by copyright. All rights reserved. No part of this document may be reproduced or translated to other languages without the prior written consent of CORELIS. This manual is a CORELIS proprietary document and may not be transferred to another party without the prior written permission of CORELIS. CORELIS assumes no responsibility for the use of or reliability of its software on equipment that is not furnished by CORELIS.
ENVIRONMENTAL NOTICE
This product must be disposed of in accordance with the WEEE directive.
TRADEMARK NOTICE I2C Bus is a registered trademark of Philips Electronics N.V. Pentium and SMBus are registered trademarks of Intel Corporation. Windows is a registered trademark of Microsoft Corporation. Other products and services named in this book are trademarks or registered trademarks of their respective companies. All trademarks and registered trademarks in this book are the property of their respective holders.
Preface i

PRODUCT WARRANTY AND SOFTWARE MAINTENANCE For product warranty and software maintenance information, see the PRODUCT WARRANTY AND SOFTWARE MAINTENANCE POLICY statement included with your product shipment.
EXCLUSIVE REMEDIES THE REMEDIES CONTAINED HEREIN ARE THE CUSTOMER'S SOLE AND EXCLUSIVE REMEDIES. CORELIS SHALL NOT BE LIABLE FOR ANY DIRECT, INDIRECT, SPECIAL, INCIDENTAL, OR CONSEQUENTIAL DAMAGES, WHETHER BASED ON CONTRACT, TORT, OR ANY OTHER LEGAL THEORY. Product maintenance agreements and other customer assistance agreements are available for Corelis products. For assistance, contact your nearest Corelis Sales and Service Office.
RETURN POLICY No items returned to CORELIS for warranty, service, or any other reason shall be accepted unless first authorized by CORELIS, either direct or through its authorized sales representatives. All returned items must be shipped pre-paid and clearly display a Return Merchandise Authorization (RMA) number on the shipping carton. Freight collect items will NOT be accepted. Customers or authorized sales representatives must first contact CORELIS with notice of request for return of merchandise. RMAs can only originate from CORELIS. If authorization is granted, an RMA number will be forwarded to the customer either directly or through its authorized sales representative.
CONTACT INFORMATION The latest news, tips and updates on the Corelis bus analyzer hardware and software products can be found in the Corelis user forums. The forums are provided as a free service to our existing customers but an individual user name and password is required. To request an account, please visit forums.corelis.com/register.php For sales inquiries, please contact [email protected]. For any support related questions, please enter a support request at www.corelis.com/support or email [email protected]. For more information about other products and services that Corelis offers, please visit www.corelis.com
ii

Table of Contents
Chapter 1 Product Overview ...................................................................................... 1
Introduction to I2C and SMBus .............................................................................................................. 1
Introduction to the CAS-1000-I2C™ ...................................................................................................... 2
Software Toolset ..................................................................................................................................... 3
Hardware Features ................................................................................................................................. 4
Host Computer Requirements ............................................................................................................... 6
Chapter 2 Installation .................................................................................................. 7
Installing the I2C Exerciser Application Software ............................................................................... 8
CAS-1000-I2C/E Hardware Installation ............................................................................................... 17
Chapter 3 Getting Started ......................................................................................... 23
Overview ................................................................................................................................................ 23
Tutorial – Using Demo Mode ............................................................................................................... 23
Tutorial – Using Live Mode .................................................................................................................. 74
Chapter 4 Connecting to a Target ............................................................................ 91
Connecting the I2C Signals .................................................................................................................. 91 Interface Setup ...................................................................................................................................... 93
Chapter 5 Bus Traffic Monitor ................................................................................ 103
Trace Listing ....................................................................................................................................... 104
Timing Field ......................................................................................................................................... 107
Monitor Configurations ...................................................................................................................... 110
Monitor Preferences ........................................................................................................................... 117
Monitor Trigger ................................................................................................................................... 121 Monitor Window Reference ............................................................................................................... 134
Chapter 6 Interactive Debugger ............................................................................. 150
Send Data ............................................................................................................................................ 151
Receive Data ....................................................................................................................................... 153
Debugger Script .................................................................................................................................. 155
Error Injection ..................................................................................................................................... 158 Debugger Options .............................................................................................................................. 160
Debugger Window Reference ............................................................................................................ 162
iii
Chapter 7 Serial EEPROM Programmer ................................................................ 166
Programmer Operations .................................................................................................................... 167
Programmer Options .......................................................................................................................... 171
Programmer Window Reference ....................................................................................................... 172
Chapter 8 Configuration and Preferences ............................................................ 176
Configuration Manager ...................................................................................................................... 176
Preferences Dialog ............................................................................................................................. 193
Using Project Files ............................................................................................................................. 198
Calibration ........................................................................................................................................... 200
Chapter 9 Third Party Application Interface ......................................................... 203
Overview .............................................................................................................................................. 203
Dynamic Link Library (DLL) ............................................................................................................... 204 General Calling Sequence ................................................................................................................. 205
Function Reference ............................................................................................................................ 206
Chapter 10 I2C Device Emulator ............................................................................. 245
Emulation Manager Window .............................................................................................................. 247
Emulated Master Window .................................................................................................................. 253
Emulated Slave Window .................................................................................................................... 263
Emulated Slave Clock Stretching ..................................................................................................... 268
Chapter 11 Script-Driven Bus Tester ..................................................................... 271
Test Window Reference ..................................................................................................................... 272
Chapter 12 Parameters Scope ............................................................................... 285
Parameter Measurements .................................................................................................................. 286
Waveform Display ............................................................................................................................... 291
Parameters Scope Window Reference ............................................................................................. 293
Chapter 13 Scripting Language ............................................................................. 295
Overview .............................................................................................................................................. 295 The Essential Syntax Elements ......................................................................................................... 296
Example Script .................................................................................................................................... 302
Built-in Functions: Summary ............................................................................................................ 304
Built-In Functions: Detailed Descriptions ........................................................................................ 308
iv
Syntax Summary (Advanced Users Only) ........................................................................................ 392
Built-In Script Editor ........................................................................................................................... 396
Chapter 14 Glitch Pattern Injection ....................................................................... 405
Overview .............................................................................................................................................. 405 Using the Glitch Pattern Editor ......................................................................................................... 406
Adding Glitch Patterns to Master and Slave Emulation ................................................................. 411
Appendix A CAS-1000-I2C Hardware Reference ................................................. 417
Hardware Specifications .................................................................................................................... 417
Electrical Specifications .................................................................................................................... 418
v
List of Figures Figure 1. I2C Bus Topology .......................................................................................................................... 1 Figure 2. Illustration of the CAS-1000-I2C ................................................................................................... 2 Figure 3. I2C Exerciser Installation Wizard .................................................................................................. 8 Figure 4. Windows Run Dialog ..................................................................................................................... 9 Figure 5. License Agreement Screen ........................................................................................................... 9 Figure 6. Customer Registration Screen .................................................................................................... 10 Figure 7. Destination Folder Screen .......................................................................................................... 11 Figure 8. Select Program Folder Screen .................................................................................................... 12 Figure 9. Completing the Installation Wizard Screen ................................................................................. 13 Figure 10. Windows 7 Security Warning Pop-up Window ......................................................................... 14 Figure 11. Windows XP Logo Test Warning Pop-up Window .................................................................... 14 Figure 12. Software Installation Button on the Windows XP Task Bar ...................................................... 15 Figure 13. Installation Completed Screen .................................................................................................. 16 Figure 14. Found New Hardware Wizard - Welcome Screen (Windows XP) ............................................ 17 Figure 15. Found New Hardware Wizard - Install Options (Windows XP) ................................................. 18 Figure 16. Windows XP Logo Test Warning Pop-up Window .................................................................... 19 Figure 17. Found New Hardware Wizard – Installation Complete (Windows XP) ..................................... 20 Figure 18. Windows Device Manager (Windows XP) ................................................................................ 21 Figure 19. Initial I2C Exerciser Warning Message when CAS-1000-I2C is Not Initially Connected .......... 24 Figure 20. Tools Menu Demo Mode Selection ........................................................................................... 25 Figure 21. Status Bar Indicating Demo Mode ............................................................................................ 25 Figure 22. Begin Monitor Data Collection .................................................................................................. 26 Figure 23. Demo Mode Reminder Pop-up Window ................................................................................... 26 Figure 24. Run Status Tab ......................................................................................................................... 27 Figure 25. Monitor Window Centered on Trigger Line ............................................................................... 28 Figure 26. Monitor Window Right-Click Pop-up Menu ............................................................................... 29 Figure 27. Monitor Window Trace List Positioned on Trigger Line ............................................................ 30 Figure 28. Monitor Window Right-Click Pop-up Menu Selecting Trigger Settings ..................................... 31 Figure 29. Configuration Manager Trigger Setup Screen .......................................................................... 32 Figure 30. Monitor Window Trace List Column Headings .......................................................................... 33 Figure 31. I2C Exerciser Status Bar ........................................................................................................... 33 Figure 32. Go to Start Tool Bar Button ....................................................................................................... 34 Figure 33. Monitor Window Trace List Showing Symbolic Address and Data Entries............................... 35 Figure 34. Configuration Manager Symbols Definition Screen .................................................................. 36 Figure 35. Symbol Definition Dialog ........................................................................................................... 37 Figure 36. Configuration Manager Symbols Definition Screen with DAC Symbol ..................................... 38 Figure 37. Monitor Window Trace List Showing New DAC Symbolic Address Entries ............................. 39 Figure 38. Monitor Window Trace List Data Byte Column Right-Click Pop-up Menu ................................ 40 Figure 39. Monitor Window Trace List Data Column with Symbols Disabled ............................................ 41 Figure 40. Monitor Window Trace List Data Byte Column Right-Click Pop-up Menu ................................ 42 Figure 41. Monitor Window Trace List Data Column with Data Bytes in Binary Format............................ 42 Figure 42. Monitor Window Trace List Data Byte Column Right-Click Pop-up Menu ................................ 43 Figure 43. Monitor Window Trace List in Compact Mode .......................................................................... 44 Figure 44. Monitor Window Trace List in Compact Mode with Data Bytes Pop-up Window ..................... 45 Figure 45. Monitor Window Trace List I/O 2 Right-Click Pop-up Menu ..................................................... 46 Figure 46. Dragging Monitor Window Trace List I/O 1 Column Heading ................................................... 46 Figure 47. Monitor Window Trace List with Rearranged I/O Columns ....................................................... 47 Figure 48. Trace Layout Dialog .................................................................................................................. 48
vi
Figure 49. Monitor Window Timing Display ................................................................................................ 49 Figure 50. Monitor Window Trace List Positioned on Cursor A Line ......................................................... 50 Figure 51. Monitor Window Trace List Positioned on Cursor B Line ......................................................... 51 Figure 52. Monitor Window Timing Display Showing Edges Zoomed in at Line 100 ................................ 52 Figure 53. Monitor Window Timing Display Measuring the Time Between Cursors A & B ....................... 53 Figure 54. Go to Start Tool Bar Button ....................................................................................................... 54 Figure 55. Find Tool Bar Button ................................................................................................................. 55 Figure 56. Find Dialog ................................................................................................................................ 55 Figure 57. Find a Data Value of 2E ............................................................................................................ 57 Figure 58. Monitor Window Trace List Showing Find 2E Data Result ....................................................... 58 Figure 59. Find a Data Value of 72 ............................................................................................................ 59 Figure 60. Clear Tagged Rows Prompt ...................................................................................................... 59 Figure 61. Matched Transactions Prompt .................................................................................................. 60 Figure 62. Monitor Window Trace List Showing Find 72 Data Result ....................................................... 60 Figure 63. Go to Tagged Row Tool Bar Button .......................................................................................... 61 Figure 64. Monitor Window Trace List Showing the Second Find 72 Data Result .................................... 61 Figure 65. Monitor Colors Preferences Screen .......................................................................................... 62 Figure 66. Monitor Colors Preferences Screen Changing Cursor A Background Color ............................ 63 Figure 67. Monitor Window with Updated Cursor A Colors ....................................................................... 64 Figure 68. Monitor Window with Updated Cursor A Colors ....................................................................... 65 Figure 69. Monitor Window with Alternating Row Colors ........................................................................... 66 Figure 70. Monitor Window Trace List with the Trigger Line Centered ...................................................... 67 Figure 71. Monitor Options Preferences Screen ........................................................................................ 68 Figure 72. Monitor Window Trace List with Trigger at Line Zero Numbering ............................................ 69 Figure 73. Monitor Window Trace List with Trigger is Time Zero Timestamps .......................................... 70 Figure 74. Monitor Window Trace List with Relative Timestamps ............................................................. 71 Figure 75. Monitor Window Trace List Showing Addresses in FE mode ................................................... 72 Figure 76. Monitor Window Trace List Showing Addresses in 7F mode ................................................... 73 Figure 77. Tools Menu Deselect Demo Mode............................................................................................ 74 Figure 78. Status Bar Indicating Live Data Mode ...................................................................................... 74 Figure 79. Analyzer Supplied Mode Prompt .............................................................................................. 75 Figure 80. Debugger Window .................................................................................................................... 76 Figure 81. Byte Sent From the Debugger .................................................................................................. 77 Figure 82. Receive Three Bytes in the Debugger ...................................................................................... 78 Figure 83. Capture of Debugger Send ....................................................................................................... 79 Figure 84. Tutorial Script Loaded Into Debugger ....................................................................................... 80 Figure 85. Capture of Debugger Script ...................................................................................................... 81 Figure 86. Set Discrete I/O Modes ............................................................................................................. 82 Figure 87. Debugger Discrete I/O Script .................................................................................................... 83 Figure 88. Monitor Debugger Discrete I/O Manipulation ............................................................................ 83 Figure 89. Debugger Close ........................................................................................................................ 84 Figure 90. SMBus Raw Data ...................................................................................................................... 85 Figure 91. SMBus Pane Before Associating Decoder File ........................................................................ 86 Figure 92. SMBus Decoder File Dialog with TC74 Information ................................................................. 87 Figure 93. Switch to SMBus Mode ............................................................................................................. 88 Figure 94. SMBus Decoded Data .............................................................................................................. 88 Figure 95. Decoded SMBus Message ToolTip .......................................................................................... 89 Figure 96. SMBus Data Window ................................................................................................................ 89 Figure 97. RJ45 Connector Pin Numbering ............................................................................................... 92 Figure 98. Configuration Manager ............................................................................................................. 94 Figure 99. Analyzer Supplied Voltage Prompt ........................................................................................... 95 Figure 100. Configuration Manager Analyzer Supplied ............................................................................. 96 Figure 101. Configuration Manager Settings Pane .................................................................................... 98 Figure 102. Bus Electrical Features ........................................................................................................... 99 Figure 103. Bus Drive and Monitoring Features ...................................................................................... 100
vii
Figure 104. Input/Output Signals ............................................................................................................. 101 Figure 105. Monitor Buffer Options .......................................................................................................... 102 Figure 106. Monitor Window .................................................................................................................... 103 Figure 107. Monitor Trace Listing ............................................................................................................ 104 Figure 108. Monitor Timing Field ............................................................................................................. 107 Figure 109. Timing Field Popup Menu ..................................................................................................... 109 Figure 110. Filters Pane ........................................................................................................................... 111 Figure 111. Filter Definition Dialog (similar to Edit) .................................................................................. 112 Figure 112. Symbols Pane ....................................................................................................................... 113 Figure 113. Symbol Definition Dialog ....................................................................................................... 114 Figure 114. SMBus Pane ......................................................................................................................... 115 Figure 115. SMBus Decoder File Dialog .................................................................................................. 116 Figure 116. Monitor Colors Pane ............................................................................................................. 117 Figure 117. Monitor Options Pane ........................................................................................................... 119 Figure 118. Formats Pane........................................................................................................................ 120 Figure 119. Trigger Tab on Monitor Tools Dialog .................................................................................... 121 Figure 120. Trigger on Single Event ........................................................................................................ 125 Figure 121. Trigger on Repeated Single Event ........................................................................................ 126 Figure 122. Trigger on Sequence of Multiple Events ............................................................................... 127 Figure 123. Trigger on Consecutive Sequence of Events ....................................................................... 128 Figure 124. Trigger Dialog........................................................................................................................ 129 Figure 125. Context Popup Menu on Trigger Definition Tree .................................................................. 130 Figure 126. Create New Trigger Dialog ................................................................................................... 131 Figure 127. Active Trigger Operation Status ............................................................................................ 133 Figure 128. I2C Exerciser Monitor Window Layout .................................................................................. 134 Figure 129. Monitor File Menu ................................................................................................................. 135 Figure 130. Monitor Trace Menu .............................................................................................................. 136 Figure 131. Trace | Execute Submenu .................................................................................................... 137 Figure 132. Run Status Tab on Monitor Tools Window ........................................................................... 138 Figure 133. Trace | Go To Submenu ....................................................................................................... 139 Figure 134. Trace | View Submenu .......................................................................................................... 140 Figure 135. Monitor Find Dialog – Regular .............................................................................................. 141 Figure 136. Monitor Find Dialog – Compact ............................................................................................ 141 Figure 137. Trace Layout Dialog .............................................................................................................. 143 Figure 138. Tools Menu ........................................................................................................................... 144 Figure 139. Monitor Window Menu .......................................................................................................... 146 Figure 140. Monitor Help Menu ................................................................................................................ 146 Figure 141. Monitor Tool Bar.................................................................................................................... 147 Figure 142. Debugger Window ................................................................................................................ 150 Figure 143. Debugger Send Controls ...................................................................................................... 151 Figure 144. Debugger Receive Controls .................................................................................................. 153 Figure 145. Debugger Options Pane ....................................................................................................... 160 Figure 146. I2C Exerciser Debugger Window Layout .............................................................................. 162 Figure 147. Debugger File Menu ............................................................................................................. 163 Figure 148. Debugger Tool Bar ................................................................................................................ 164 Figure 149. Programmer Window ............................................................................................................ 167 Figure 150. Programmer Read Window ................................................................................................... 169 Figure 151. Programming Progress Window ........................................................................................... 170 Figure 152. Verifying Progress Window ................................................................................................... 170 Figure 153. Erasing Progress Window ..................................................................................................... 170 Figure 154. Programmer Options Pane ................................................................................................... 171 Figure 155. I2C Exerciser Programmer Window...................................................................................... 172 Figure 156. Programmer File Menu ......................................................................................................... 173 Figure 157. Programmer Tool Bar ........................................................................................................... 174 Figure 158. Configuration Manager Dialog Panes (Settings selected) .................................................... 177
viii
Figure 159. Filters Pane ........................................................................................................................... 179 Figure 160. Filter Definition Dialog (similar to Edit) .................................................................................. 180 Figure 161. Symbols Pane ....................................................................................................................... 181 Figure 162. Symbol Definition Dialog ....................................................................................................... 182 Figure 163. SMBus Pane ......................................................................................................................... 183 Figure 164. SMBus Decoder File Dialog .................................................................................................. 184 Figure 165. Settings Pane ........................................................................................................................ 185 Figure 166. Files Pane ............................................................................................................................. 189 Figure 167. Target Slaves Pane .............................................................................................................. 190 Figure 168. Timing Skew Pane ................................................................................................................ 192 Figure 169. Monitor Colors Pane ............................................................................................................. 193 Figure 170. Monitor Options Pane ........................................................................................................... 194 Figure 171. Debugger Options Pane ....................................................................................................... 195 Figure 172. Programmer Options Pane ................................................................................................... 196 Figure 173. Formats Pane........................................................................................................................ 197 Figure 174. Title Bar for a New Project .................................................................................................... 198 Figure 175. Title Bar for a Saved Project ................................................................................................. 199 Figure 176. File Menu MRU Project List .................................................................................................. 199 Figure 177. Calibration Prompt ................................................................................................................ 200 Figure 178. Calibration Warning .............................................................................................................. 200 Figure 179. Calibration Status .................................................................................................................. 201 Figure 180. Calibration Complete ............................................................................................................ 201 Figure 181. Emulation Manager Window ................................................................................................. 247 Figure 182. Emulator Manager Window ................................................................................................... 248 Figure 183. Add Emulated Device Dialog ................................................................................................ 250 Figure 184. Emulator Execute Menu ........................................................................................................ 251 Figure 185. Emulator Tool Bar ................................................................................................................. 252 Figure 186. Emulated Master Window ..................................................................................................... 253 Figure 187. Emulated Master Source Popup Menu ................................................................................. 255 Figure 188. Emulated Master File Menu .................................................................................................. 257 Figure 189. Emulated Master Edit Menu .................................................................................................. 258 Figure 190. Emulated Master Execute Menu ........................................................................................... 259 Figure 191. Emulated Master Breakpoint Menu....................................................................................... 260 Figure 192. Emulated Master Tool Bar .................................................................................................... 261 Figure 193. Emulated Slave Window ....................................................................................................... 263 Figure 194. Emulated Slave File Menu .................................................................................................... 264 Figure 195. Emulated Slave Edit Menu .................................................................................................... 265 Figure 196. Emulated Slave Tool Bar ...................................................................................................... 266 Figure 197. Configuring Emulated Slave Device ..................................................................................... 269 Figure 198. Clock Stretched on ACK Bit .................................................................................................. 269 Figure 199. Test Window ......................................................................................................................... 272 Figure 200. Test Window ......................................................................................................................... 273 Figure 201. Test Source Popup Menu ..................................................................................................... 276 Figure 202. Test File Menu ...................................................................................................................... 278 Figure 203. Test Edit Menu ...................................................................................................................... 279 Figure 204. Test Execute Menu ............................................................................................................... 280 Figure 205. Test Breakpoint Menu ........................................................................................................... 280 Figure 206. TestTool Bar .......................................................................................................................... 282 Figure 207. Parameters Scope Window .................................................................................................. 285 Figure 208. Parameters Scope Measurement Controls ........................................................................... 286 Figure 209. Parameter Specification File Example .................................................................................. 290 Figure 210. Parameters Scope Waveform Controls ................................................................................ 291 Figure 211. Editor Window ....................................................................................................................... 397 Figure 212. Editor Popup Menu ............................................................................................................... 398 Figure 213. I2C Exerciser Editor Window Layout .................................................................................... 399
ix

Figure 214. Editor File Menu .................................................................................................................... 400 Figure 215. Editor Edit Menu ................................................................................................................... 401 Figure 216. Editor Tool Bar ...................................................................................................................... 403 Figure 217. Glitch Pattern Editor Window ................................................................................................ 406 Figure 218. Glitch Injection Trigger Conditions ........................................................................................ 407 Figure 219. Default Glitch Pattern Setting ................................................................................................ 408 Figure 220. SDA Low Glitch Injected by Data / SDA / Rising-edge Triggering Condition ....................... 408 Figure 221. SDA Low Glitch Waveform ................................................................................................... 409 Figure 222. Glitch Pattern Editor File Menu ............................................................................................. 410
x
List of Tables Table 1. Optional Interface Cables ............................................................................................................... 7 Table 2. Flying Leads Serial Bus Connector Pin Assignments .................................................................. 91 Table 3. 4-Pin Crimp Cable Pin Assignments ............................................................................................ 92 Table 4. Summary of available Trigger Components ............................................................................... 122 Table 5. Monitor Window Layout .............................................................................................................. 134 Table 6. Monitor Tool Bar Functions ........................................................................................................ 148 Table 7. Debugger Script Keywords ......................................................................................................... 156 Table 8. Debugger Error Injection Keywords ............................................................................................ 159 Table 9. Debugger Window Layout .......................................................................................................... 162 Table 10. Debugger Tool Bar Functions ................................................................................................... 164 Table 11. Programmer Function Descriptions .......................................................................................... 168 Table 12. Programmer Read Contents Window Function Descriptions ................................................... 169 Table 13. Programmer Window Areas ..................................................................................................... 172 Table 14. Programmer Tool Bar Functions .............................................................................................. 174 Table 15. Configuration Manager Panes .................................................................................................. 178 Table 16. DLL Components ...................................................................................................................... 204 Table 17. I2C DLL Functions .................................................................................................................... 207 Table 18. List of I2C Bus Measurement Parameters ................................................................................ 217 Table 19. Emulation Manager Areas ........................................................................................................ 247 Table 20. Emulator Tool Bar Functions .................................................................................................... 252 Table 21. Emulated Master Tool Bar Functions ....................................................................................... 262 Table 22. Emulated Slave Tool Bar Functions ......................................................................................... 267 Table 23.Test Window Areas.................................................................................................................... 272 Table 24. Test Tool Bar Functions ........................................................................................................... 283 Table 25. Built-In Scripting Functions ....................................................................................................... 307 Table 26. Editor Window Areas ................................................................................................................ 399 Table 27. Editor Tool Bar Icon Descriptions ............................................................................................. 404
xi


Introduction
What this User’s Manual Covers This User’s Manual was designed to make using your CAS-1000-I2C™ analyzer and its software easier and more efficient. The manual contains easy to navigate tutorials and reference information that are presented in a logical progression. The following briefly summarizes each chapter:
Chapter 1: Product Overview This chapter provides you with an introduction to the I2C bus and SMBus as well as a description of the CAS-1000-I2C analyzer and software application features.
Chapter 2: Installation In this chapter you will learn how to install the I2C Exerciser software and the CAS-1000-I2C hardware.
Chapter 3: Getting Started This chapter introduces you to the basic usage of the CAS-1000-I2C for monitoring and generating bus traffic, writing debug scripts, and working with EEPROM devices. Although it is possible to explore the capabilities of the CAS-1000-I2C on your own, working through this chapter will provide you with an immediate feel for its ease of use and core functionality.
Chapter 4: Connecting to a Target This chapter provides you with instructions on how to hook up the CAS-1000-I2C to a target board and describes the initial software settings that you should be aware of to have the CAS-1000-I2C working properly.
Chapter 5: Bus Traffic Monitor This chapter describes the features of the Monitor window which is used to collect and analyze traffic from the target I2C bus.
Chapter 6: Interactive Debugger This chapter describes the features of the Debugger which is used to manually generate traffic and interact with the target I2C bus.
Chapter 7: Serial EEPROM Programmer This chapter describes the features of the Programmer which is used to read and write the content of EEPROM memory devices on the target I2C bus.
Introduction xiii

Chapter 8: Configuration and Preferences This chapter describes all of the various project options and settings that can be found in the Configuration Manager and Preferences dialogs.
Chapter 9: Third Party Application Interface This chapter provides a reference on all of the function calls available for use in third party software applications that control the CAS-1000-I2C analyzer through the provided dynamic link library (DLL).
Chapter 10: I2C Device Emulator This chapter describes the features of the Emulator which is used to emulate master and slave devices on the target I2C bus.
Chapter 11: Script-Driven Bus Tester This chapter describes the features of the Test tool which is used to execute test scripts that perform a sequence of measurements and tests of the target I2C bus.
Chapter 12: Parameters Scope This chapter describes the features of the Parameters Scope which is used to measure the electrical and timing characteristics of the target I2C bus.
Chapter 13: Scripting Language This chapter provides a reference on the usage and syntax elements of the I2C Exerciser’s scripting language which is used in automated bus testing and device emulation.
Chapter 14: Glitch Pattern Injection This chapter describes the features of the Glitch Pattern Injection which is used to inject glitches into the target I2C bus.
Appendix A: CAS-1000-I2C Hardware Reference This appendix presents a table comparing the features in different versions of Corelis bus analyzers as well as the physical and electrical specifications for the CAS-1000-I2C hardware.
xiv Introduction
Chapter 1 Product Overview
CAS-1000-I2C/E™ Bus Analyzer and I2C Exerciser product overview
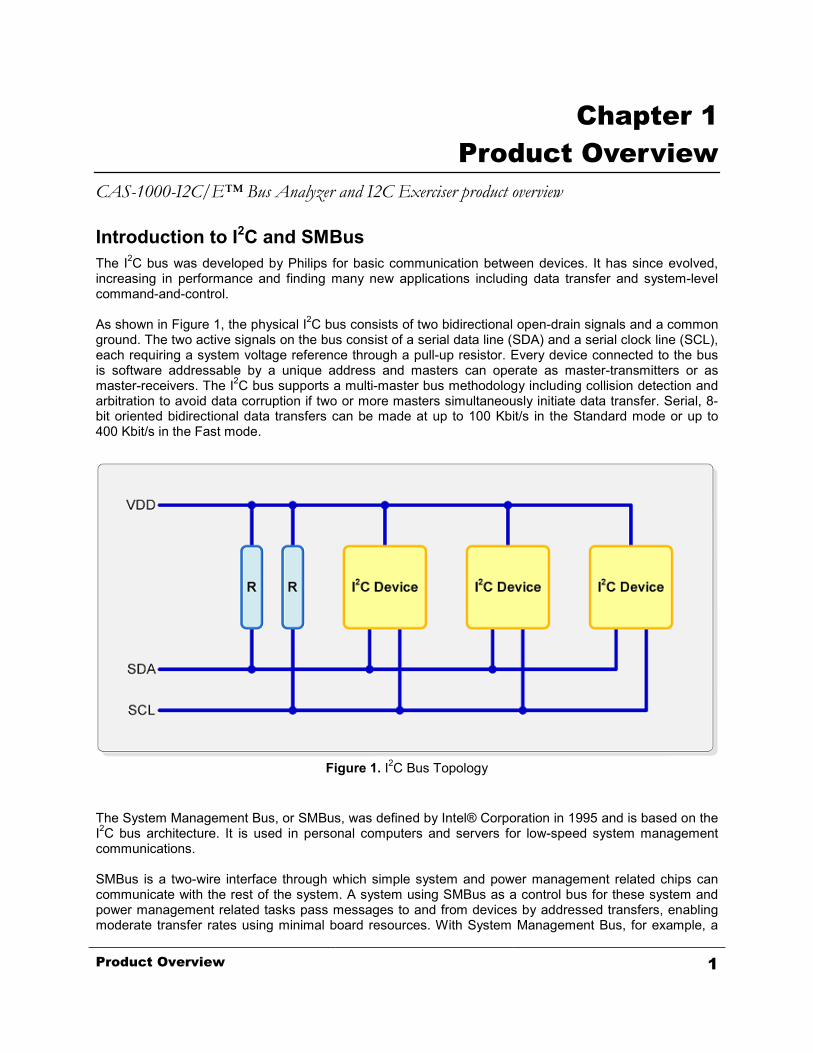
Introduction to I2C and SMBus The I2C bus was developed by Philips for basic communication between devices. It has since evolved, increasing in performance and finding many new applications including data transfer and system-level command-and-control. As shown in Figure 1, the physical I2C bus consists of two bidirectional open-drain signals and a common ground. The two active signals on the bus consist of a serial data line (SDA) and a serial clock line (SCL), each requiring a system voltage reference through a pull-up resistor. Every device connected to the bus is software addressable by a unique address and masters can operate as master-transmitters or as master-receivers. The I2C bus supports a multi-master bus methodology including collision detection and arbitration to avoid data corruption if two or more masters simultaneously initiate data transfer. Serial, 8-bit oriented bidirectional data transfers can be made at up to 100 Kbit/s in the Standard mode or up to 400 Kbit/s in the Fast mode.
Figure 1. I2C Bus Topology
The System Management Bus, or SMBus, was defined by Intel® Corporation in 1995 and is based on the I2C bus architecture. It is used in personal computers and servers for low-speed system management communications. SMBus is a two-wire interface through which simple system and power management related chips can communicate with the rest of the system. A system using SMBus as a control bus for these system and power management related tasks pass messages to and from devices by addressed transfers, enabling moderate transfer rates using minimal board resources. With System Management Bus, for example, a
Product Overview 1

device can provide manufacturer information, tell the system what its model/part number is, save its state for a suspend event, report different types of errors, accept control parameters, and return its status. The SMBus may share the same host device and physical bus with standard I2C components. Intel originally conceived the SMBus as the communication bus to accommodate Smart Batteries and other system and power management components.
Introduction to the CAS-1000-I2C™ The Corelis CAS-1000-I2C is an I2C-bus/SMBus analyzer, exerciser, programmer, and tester. This advanced instrument is used to:
• Monitor and log I2C bus traffic in real-time • Generate traffic to exercise the bus and communicate with its slave components • Program and read in-system EEPROMs • Emulate I2C master and slave devices that are not yet physically connected to the bus (/E version
only) • Measure and test bus performance and characteristics (/E version only)
Because of its rich feature set and ease-of-use, the CAS-1000-I2C can be used in a variety of applications, such as product development, troubleshooting, validation, system integration, production, and field testing. The CAS-1000-I2C pod, shown in Figure 2, connects to the PC via a high-speed USB 2.0 port and can operate either with the provided I2C Exerciser software application, or using the included API of C/C++ library function calls from third party software applications such as National Instruments’ LabWindows/CVI and LabVIEW, or custom user-developed software. The CAS-1000-I2C/E also includes a JTAG controller that, when used with the optional Corelis ScanExpress software, can perform boundary-scan interconnect testing and in-system programming of flash memories and CPLDs. This JTAG testing capability is complimentary to the I2C bus testing features of the CAS-1000-I2C/E and greatly enhances target visibility control and testing access.
Figure 2. Illustration of the CAS-1000-I2C
2 Product Overview

Software Toolset Monitor
Using the Monitor tool, the CAS-1000-I2C listens and records all I2C bus traffic while displaying it as both state and timing information. Transactions can be examined and stored to files and later retrieved for review. Monitor features include message filtering, symbolic translation of numeric values, and event triggering. The CAS-1000-I2C continually verifies compliance to the bus protocol and flags errors when it detects a protocol violation. Concurrent with the bus transaction state listings, a timing display for both the SCL and SDA signals is depicted showing the edge transition history.
Debugger Using the Debugger tool, the CAS-1000-I2C can be utilized to send and receive individual messages on the I2C bus. Looping is supported for repeating I/O patterns to facilitate external signal observation. Storing and restoring files allows saving of received data for post-analysis and reuse of previously sent message scripts. A callable API library distributed as a Windows DLL further enables access to the I2C bus from 3rd-party applications outside of the I2C Exerciser GUI.
Programmer Using the Programmer tool, the CAS-1000-I2C can be utilized to perform high speed programming of I2C-compatible serial EEPROM memory devices, with a user interface similar to the Corelis ScanExpress Programmer boundary-scan in-system programming product. Devices can be programmed in-system and at maximum programming speed, which is typically within several seconds depending on the memory size. The Programmer provides options to Erase, Program, Verify, and Read target EEPROM memory. The content of the EEPROM memory device can be saved to a file in a supported file format including Motorola S-Record, Intel Hex, and a hex-text file format.
Emulator Using the Emulator tool, the CAS-1000-I2C/E can be configured to emulate a master or slave device on the target I2C bus. The behavior of the emulated device is controlled using a sophisticated scripting language that has a simplified C-language syntax. When emulating a slave, blocks of data are defined that will be used in responding to any master transactions. When emulating a master, the functionality of the Debugger tool is taken to the next level, adding conditional branching and schedule control that enables a comprehensive bus and target exercising sequence, ranging from simple target initialization to complex behavioral stimulation, stressing, and evaluation.
Test Using the Test tool, the scripting features available in the Emulator tool are enhanced with the ability to measure and compare target I2C bus electrical and timing parameters as well as the faculty to manipulate the GUI elements of the Test window. Scripts run with the Test tool manipulate and evaluate the behavior of the target bus and make a “go” or “no-go” decision on whether performance is within a desired specification, reporting back the status and results via the Test window controls.
Parameters Scope Using the Parameters Scope tool, the CAS-1000-I2C/E can be utilized to quickly measure and return the basic electrical and timing parameters of the target I2C bus without setting up the advanced scripting functions of the Test tool. It can gather master-specific and slave-specific parameters, such as signal timing characteristics, and also system-wide parameters, such as bus voltage, pull-up resistance, and capacitance. Each measurement is compared to maximum and minimum values loaded from a specification file and the resulting pass or fail status is shown with the measurement. The Parameters Scope provides the additional ability to display a graph of captured signal edge transition data and a trigger can be set to capture a particular I2C bus signal’s rising or falling edge.
Product Overview 3

Hardware Features The main hardware features of the CAS-1000-I2C/E are described in the following sections. I2C Speed Support The CAS-1000-I2C operates using the Standard/Fast-mode/Fast-mode Plus protocol over its entire performance range for both monitoring and driving the bus (up to 5 MHz as a master, 1.9 MHz as a slave). The High-speed mode (Hs-mode) is supported for monitoring only. Additionally, an accelerated rising slope control feature is included to facilitate the driving of higher capacitance targets at high clock rates. USB Port Host Interface The CAS-1000-I2C uses a high-speed USB 2.0 interface for easy connection to a PC. The host PC supplies operating power to the unit and the hot-plug feature of the USB standard is fully supported. You simply plug the CAS-1000-I2C into a PC USB 2.0 socket and it will be automatically detected, configured, and then ready to go. A USB 2.0 port on the host computer is required for optimal performance. The CAS-1000-I2C does not support USB 1.1 ports.
Software Programmable Voltage Levels and Pull-Up Resistors The I2C bus reference voltage can be programmed as target-driven (Target Supplied mode) through its own pull-ups or as driven from the CAS-1000-I2C (Analyzer Supplied mode) through instrument pull-ups. When the CAS-1000-I2C is programmed to source this reference level (for both SCL and SDA signals), the voltage can be set in 100 mV steps from 0.8V to 5.0V. In this case, the target pull-ups should be removed to prevent contention with the analyzer. In addition, for the Analyzer Supplied mode reference voltage, you can select one of a set of pull-up resistors with the same value for both bus signals. The resistor values can be set from about 250 to 50K ohms in varying increments. The TTL output signal level of the set of discrete I/O and trigger lines is programmable from 1.25V to 3.3V in steps of 50 mV. Furthermore, sensed bus signal high and low threshold levels can each be adjusted, supporting the bus hysteresis requirement. Default software-determined values are provided automatically with user override capability.
4 Product Overview

Programmable Clock Rate The CAS-1000-I2C clock rate is software programmable when it drives the bus. It supports Standard-mode, Fast-mode, and Fast-mode Plus transfers up to 5 Mbits/sec and many intermediate rates. The target bus conditions, especially pull-up values and parasitic capacitance, can limit the upper rate of operation. The ability of the analyzer to track the signals is also affected by receive threshold voltage settings. The user should be aware of the analog behavior of the bus signals, especially slow rise-times, and their relationship to transitions at higher clock rates. This clock rate setting does not apply to target master clocks which are not driven but are only monitored by the CAS-1000-I2C. In such cases, the rate is automatically tracked up to 5 MHz. When the CAS-1000-I2C drives the bus, it also automatically synchronizes the clock signal in compliance with the I2C specification’s multi-master requirements. Discrete I/O Signals Two programmable general purpose lines can be operated under PC host software control and are available to stimulate the target system or sense target conditions in coordination with its testing. Each line is programmable as an input, a TTL output, or an open-drain output. The voltage level of these signals is programmable independent of I2C bus levels. The state of these signals is monitored and displayed in the trace listing while collecting bus traffic and they can contribute to trigger conditions. Each one of the two discrete lines can source 12 mA and can be used as a limited programmable power source to a target when configured as a TTL output. Power Requirements The CAS-1000-I2C receives the standard power available from the host USB port. Built-in Self-Test The CAS-1000-I2C has a built-in self-test capability. Logic is provided to loop back bus signals from the target connector. This enables a basic go/no-go confidence testing of its operation. It is launched from the Tools menu and requires that there be no external target attached. Calibration Since the electrical characteristics of each individual CAS-1000-I2C and host USB bus can be slightly different, the CAS-1000-I2C includes a calibration feature to optimize output when using it to supply pull-up voltage to a target bus. Calibration also adjusts the output voltage of the two discrete I/O signals. JTAG Testing and In-System Programming The CAS-1000-I2C includes an IEEE-1149.1 JTAG Test Access Port (TAP). This port can be used to perform boundary-scan testing and in-system programming of flash, EEPROMs and CPLDs on the target system. The optional Corelis ScanExpress software is needed to enable the boundary-scan testing and in-system programming feature. This feature is mutually exclusive to the I2C functionality and requires it to be put into the TAP mode.
Product Overview 5
Host Computer Requirements I2C Exerciser is a 32-bit Microsoft Windows®-based application which controls the CAS-1000-I2C. The PC on which it will be installed should meet the following minimum requirements:
One available USB 2.0 Port Windows® XP (SP2), Windows® Vista, Windows® 7, or Windows® 8 3.2 GHz Pentium® 4 Processor (or equivalent) 1 GB of RAM 600 MB of Free Hard Disk Space (2 GB or more for continuous logging of trace data) CD-ROM Drive
6 Product Overview

Chapter 2 Installation
Installing the I2C Exerciser software and the CAS-1000-I2C hardware
Prior to installation, please verify that the following I2C Exerciser software and CAS-1000-I2C hardware materials are present and free from visible damage or defects. If anything appears to be missing or damaged, please contact Corelis immediately. The CAS-1000-I2C product consists of the following components:
- CAS-1000-I2C Hardware - 6’ USB 2.0 Cable - 12” I2C Target Interface Cable consisting of flying leads with test clips (Part# 15438-2) - Corelis I2C Bus Analyzer, Exerciser, Programmer, and Tester CD-ROM containing the I2C
Exerciser application, support software and example target test files Your application may require additional optional interface cables. Table 1 lists the optional target interface cables available from Corelis.
Cable Description Corelis Part Number
6” I2C Target Interface Flying Leads with Test Clips 15438-1
24” I2C Target Interface Flying Leads with Test Clips 15438-3
6” I2C Target Interface 4-pin Crimp Connector 15431-1
12” I2C Target Interface 4-pin Crimp Connector 15431-2
24” I2C Target Interface 4-pin Crimp Connector 15431-3
Table 1. Optional Interface Cables
Installation 7
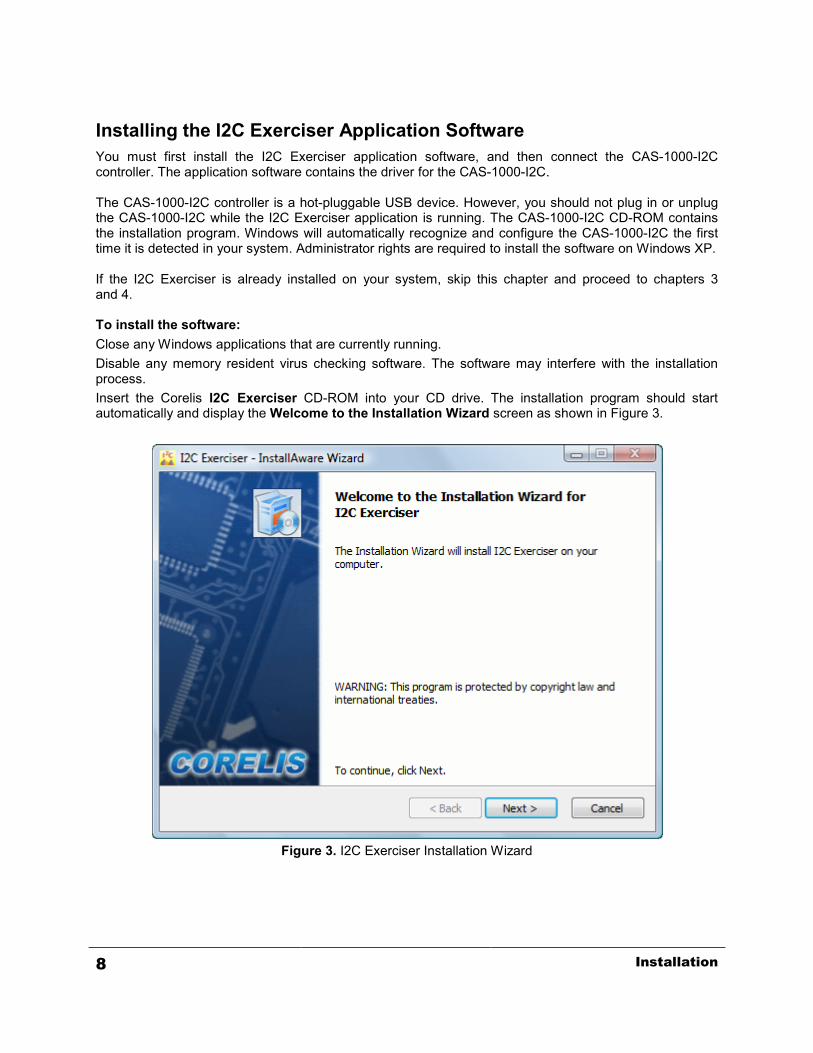
Installing the I2C Exerciser Application Software You must first install the I2C Exerciser application software, and then connect the CAS-1000-I2C controller. The application software contains the driver for the CAS-1000-I2C. The CAS-1000-I2C controller is a hot-pluggable USB device. However, you should not plug in or unplug the CAS-1000-I2C while the I2C Exerciser application is running. The CAS-1000-I2C CD-ROM contains the installation program. Windows will automatically recognize and configure the CAS-1000-I2C the first time it is detected in your system. Administrator rights are required to install the software on Windows XP. If the I2C Exerciser is already installed on your system, skip this chapter and proceed to chapters 3 and 4. To install the software: Close any Windows applications that are currently running. Disable any memory resident virus checking software. The software may interfere with the installation process. Insert the Corelis I2C Exerciser CD-ROM into your CD drive. The installation program should start automatically and display the Welcome to the Installation Wizard screen as shown in Figure 3.
Figure 3. I2C Exerciser Installation Wizard
8 Installation

If the installation program does not automatically begin, go to the Windows Start Menu and select Start, then Run. The Run dialog box will appear as shown in Figure 4. Type “[D]:\setup.exe” where [D] is the CD-ROM drive letter. Click on the OK button to run the installation program.
Figure 4. Windows Run Dialog
Click on the Next button. The License Agreement screen shown in Figure 5 will be displayed.
Figure 5. License Agreement Screen
Installation 9
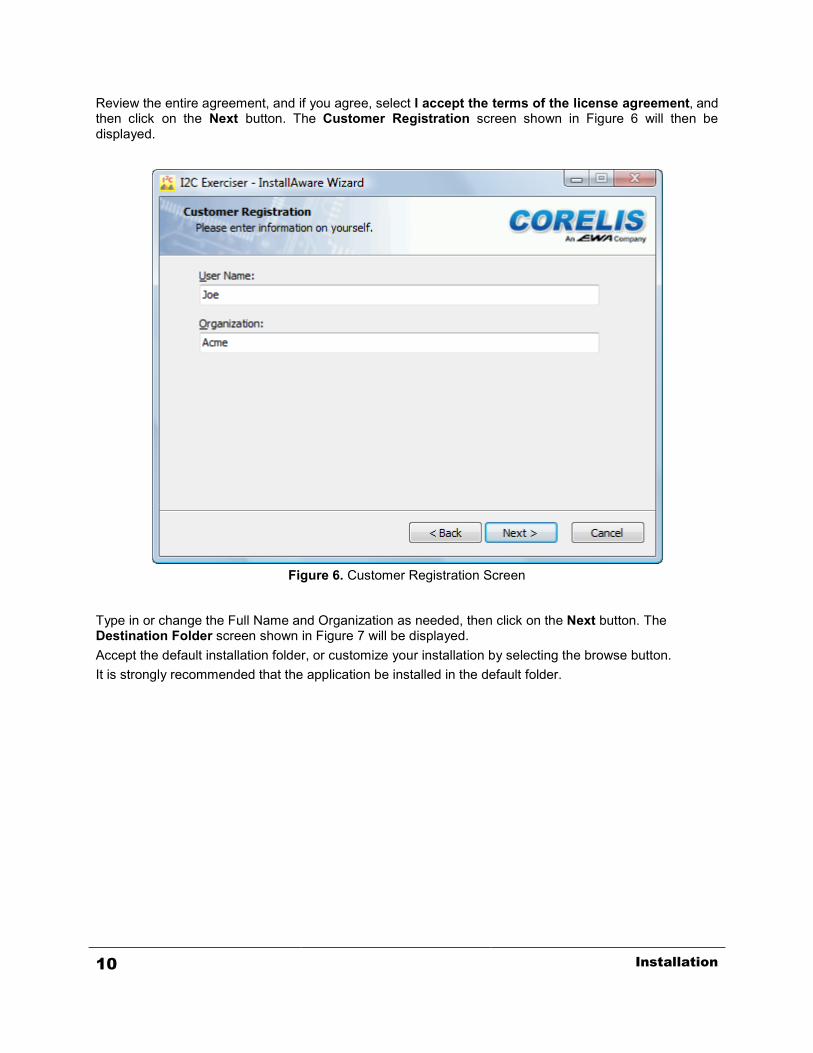
Review the entire agreement, and if you agree, select I accept the terms of the license agreement, and then click on the Next button. The Customer Registration screen shown in Figure 6 will then be displayed.
Figure 6. Customer Registration Screen
Type in or change the Full Name and Organization as needed, then click on the Next button. The Destination Folder screen shown in Figure 7 will be displayed. Accept the default installation folder, or customize your installation by selecting the browse button. It is strongly recommended that the application be installed in the default folder.
10 Installation

Figure 7. Destination Folder Screen
Click on the Next button, and the Select Program Folder screen shown in Figure 8 will be displayed. Select Anyone who uses this computer or Only for me. By default, the installer will place a shortcut icon for the I2C Exerciser on your desktop. If you do not wish this shortcut to be created, uncheck the checkbox on this screen.
Installation 11
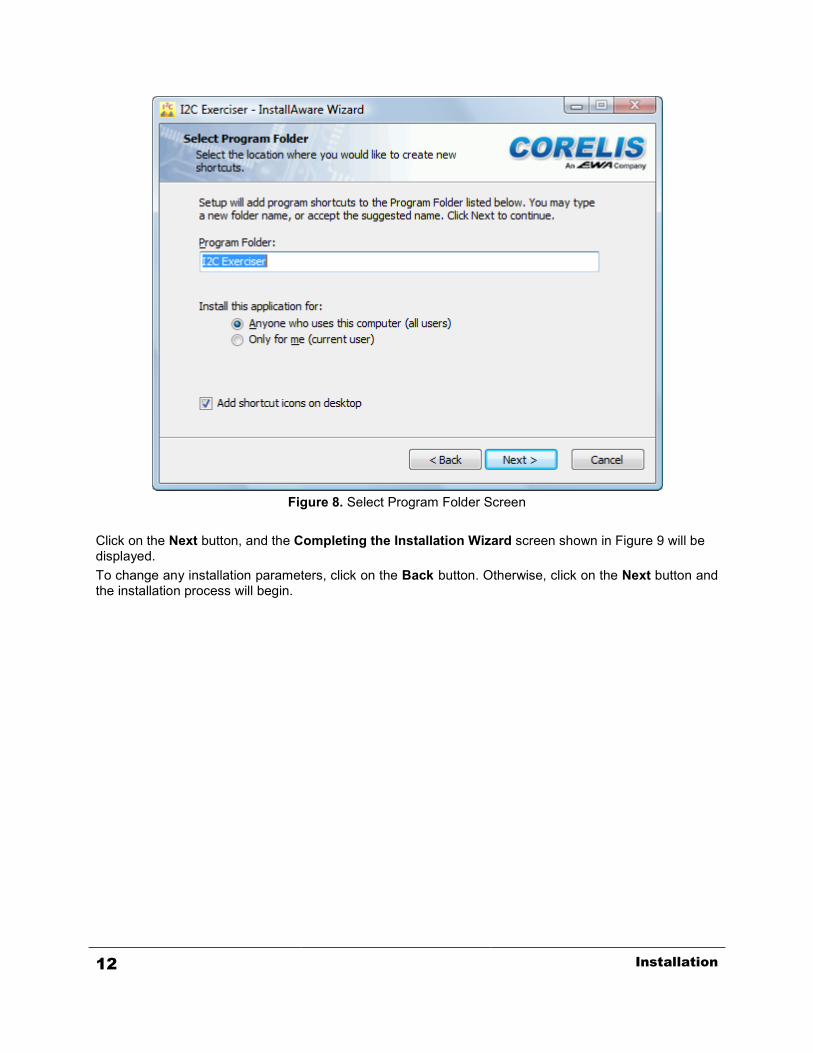
Figure 8. Select Program Folder Screen
Click on the Next button, and the Completing the Installation Wizard screen shown in Figure 9 will be displayed. To change any installation parameters, click on the Back button. Otherwise, click on the Next button and the installation process will begin.
12 Installation
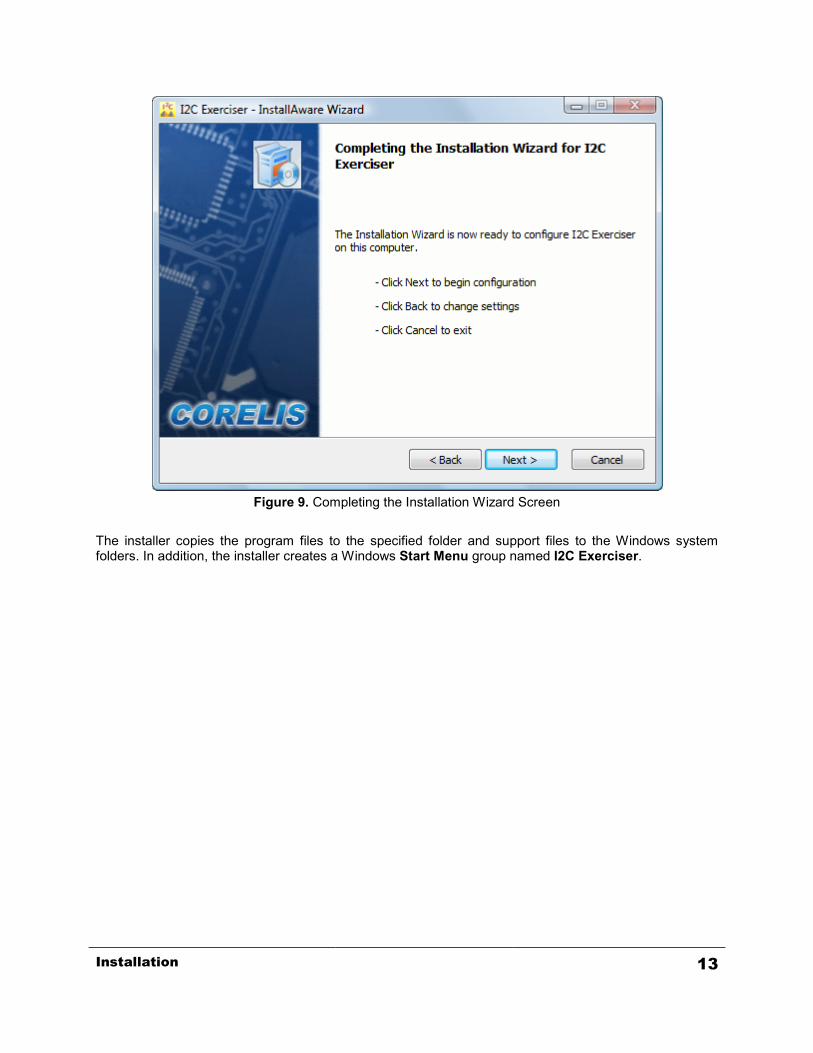
Figure 9. Completing the Installation Wizard Screen
The installer copies the program files to the specified folder and support files to the Windows system folders. In addition, the installer creates a Windows Start Menu group named I2C Exerciser.
Installation 13
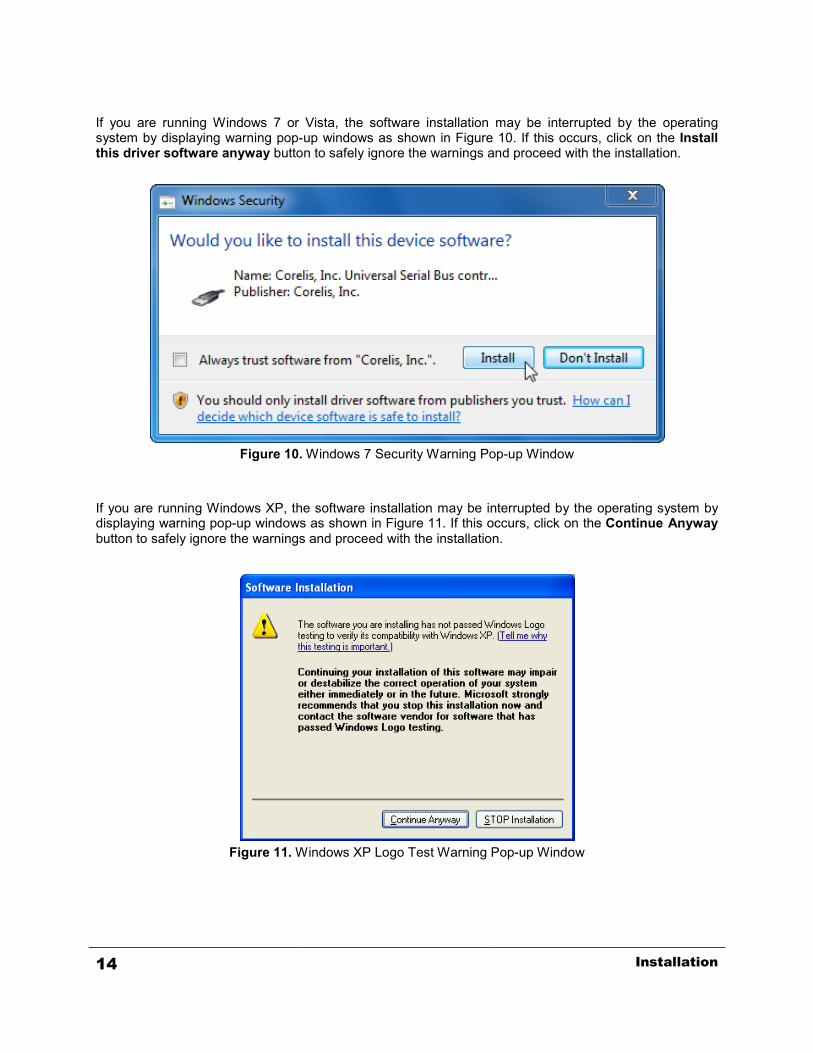
If you are running Windows 7 or Vista, the software installation may be interrupted by the operating system by displaying warning pop-up windows as shown in Figure 10. If this occurs, click on the Install this driver software anyway button to safely ignore the warnings and proceed with the installation.
Figure 10. Windows 7 Security Warning Pop-up Window
If you are running Windows XP, the software installation may be interrupted by the operating system by displaying warning pop-up windows as shown in Figure 11. If this occurs, click on the Continue Anyway button to safely ignore the warnings and proceed with the installation.
Figure 11. Windows XP Logo Test Warning Pop-up Window
14 Installation

The warning pop up windows may be hidden behind the installation window. If this happens, the installation progress bar will stop updating and the installation may appear to be hung. Bring the warning pop up windows to the foreground by clicking on the Software Installation button on the Windows task bar as shown in Figure 12. Then click on the Continue Anyway button to safely ignore the warnings and proceed with the installation.
Figure 12. Software Installation Button on the Windows XP Task Bar
Installation 15
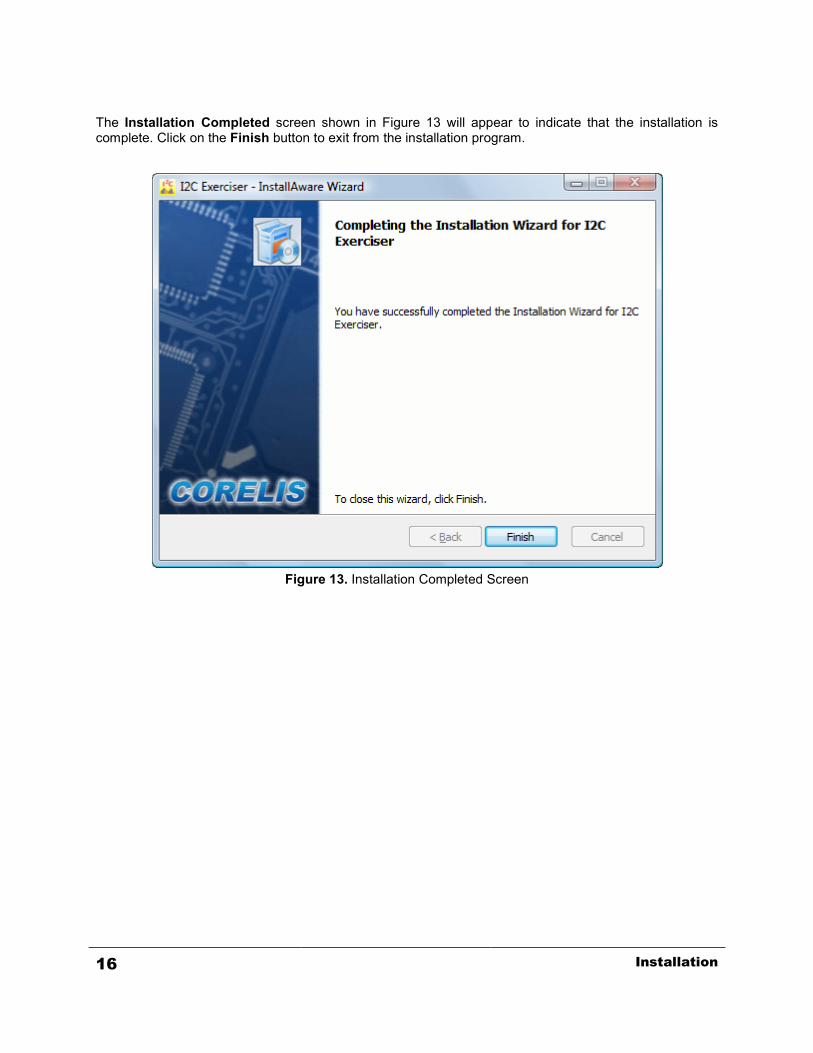
The Installation Completed screen shown in Figure 13 will appear to indicate that the installation is complete. Click on the Finish button to exit from the installation program.
Figure 13. Installation Completed Screen
16 Installation
CAS-1000-I2C/E Hardware Installation The CAS-1000-I2C controller is a hot-plug USB device. You must first install the I2C Exerciser software before installing the CAS-1000-I2C controller. Drivers for the CAS-1000-I2C controller are installed with the I2C Exerciser software and not installing the software and drivers first may result in improper unit configuration and operation.
Installation Steps 1. You should have already installed the I2C Exerciser at this point. If not, please do so before
continuing with hardware installation. 2. Connect a USB 2.0 compatible cable from the CAS-1000-I2C USB 2.0 connector to any available
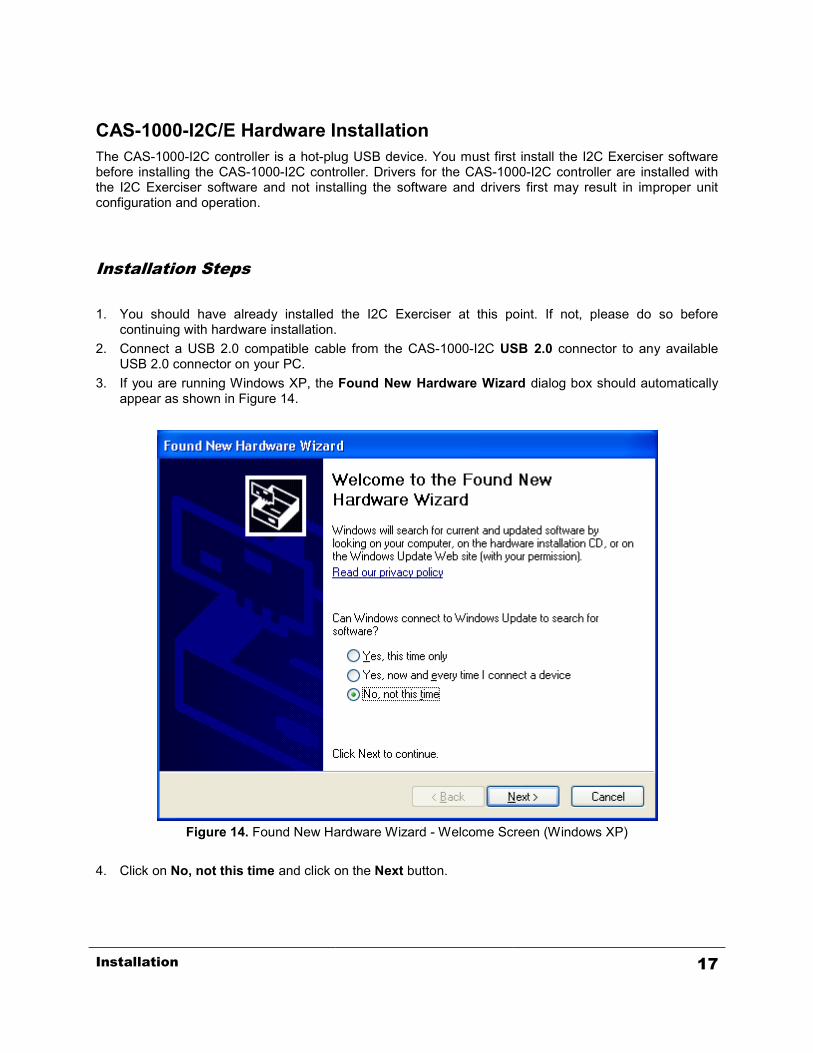
USB 2.0 connector on your PC. 3. If you are running Windows XP, the Found New Hardware Wizard dialog box should automatically
appear as shown in Figure 14.
Figure 14. Found New Hardware Wizard - Welcome Screen (Windows XP)
4. Click on No, not this time and click on the Next button.
Installation 17
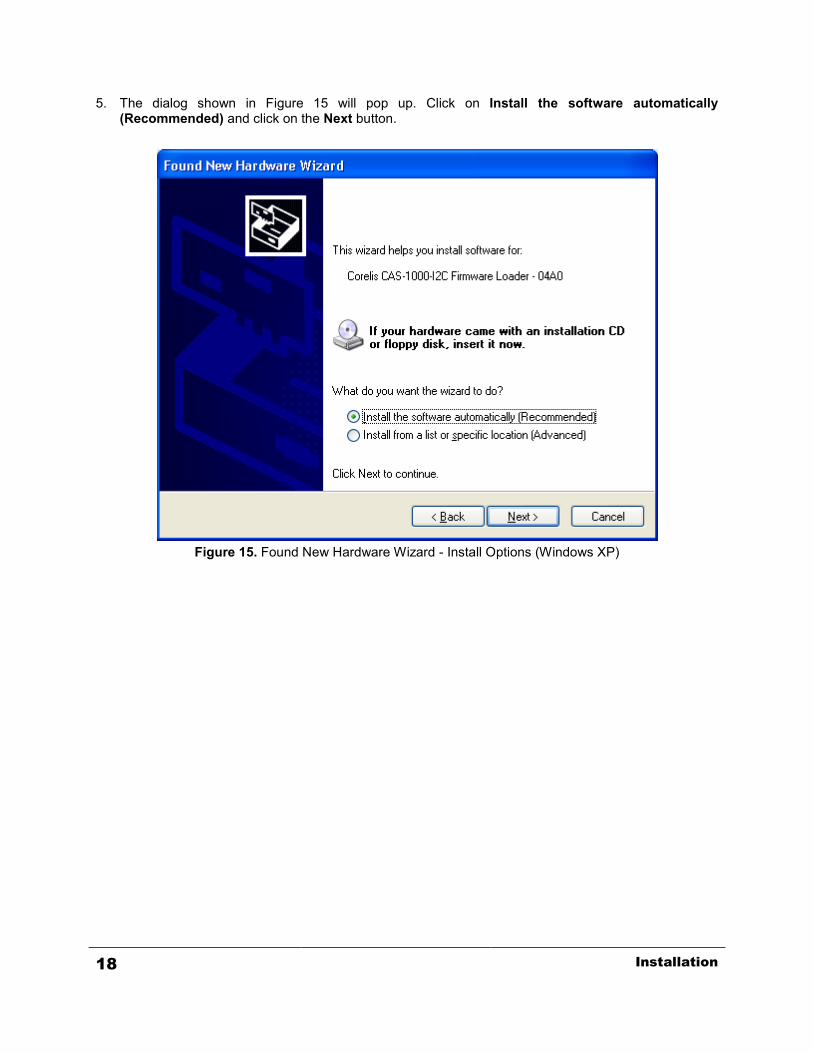
5. The dialog shown in Figure 15 will pop up. Click on Install the software automatically (Recommended) and click on the Next button.
Figure 15. Found New Hardware Wizard - Install Options (Windows XP)
18 Installation
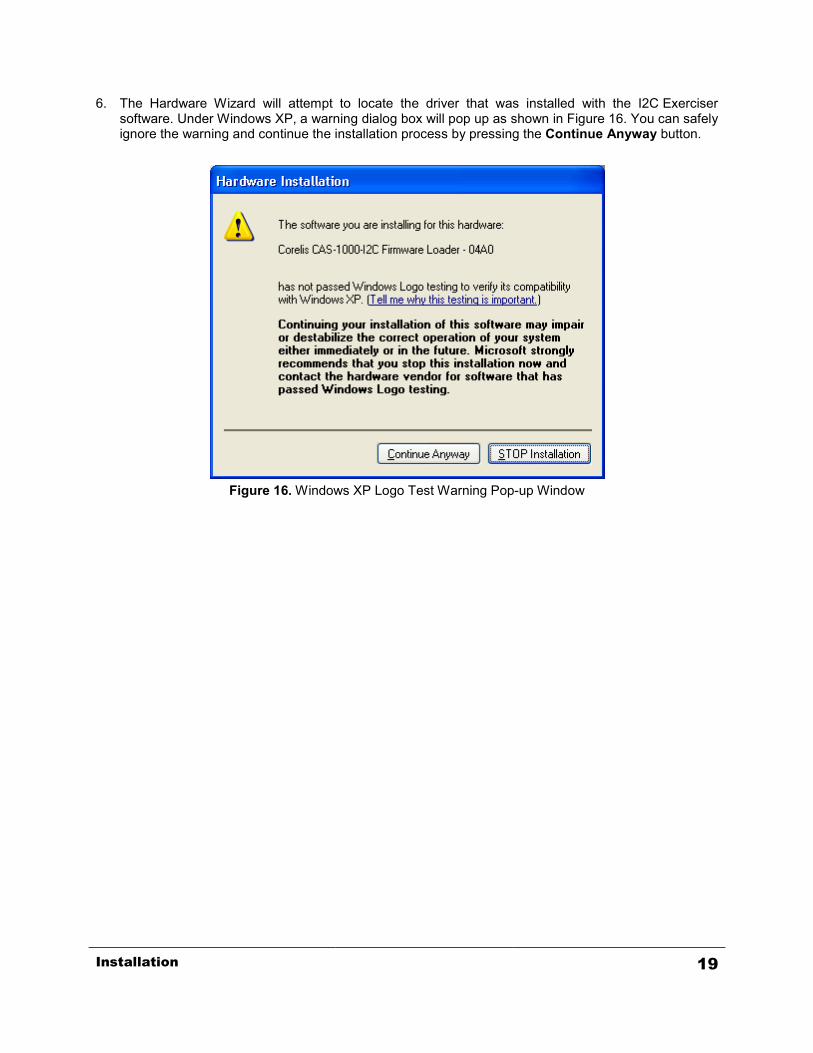
6. The Hardware Wizard will attempt to locate the driver that was installed with the I2C Exerciser software. Under Windows XP, a warning dialog box will pop up as shown in Figure 16. You can safely ignore the warning and continue the installation process by pressing the Continue Anyway button.
Figure 16. Windows XP Logo Test Warning Pop-up Window
Installation 19
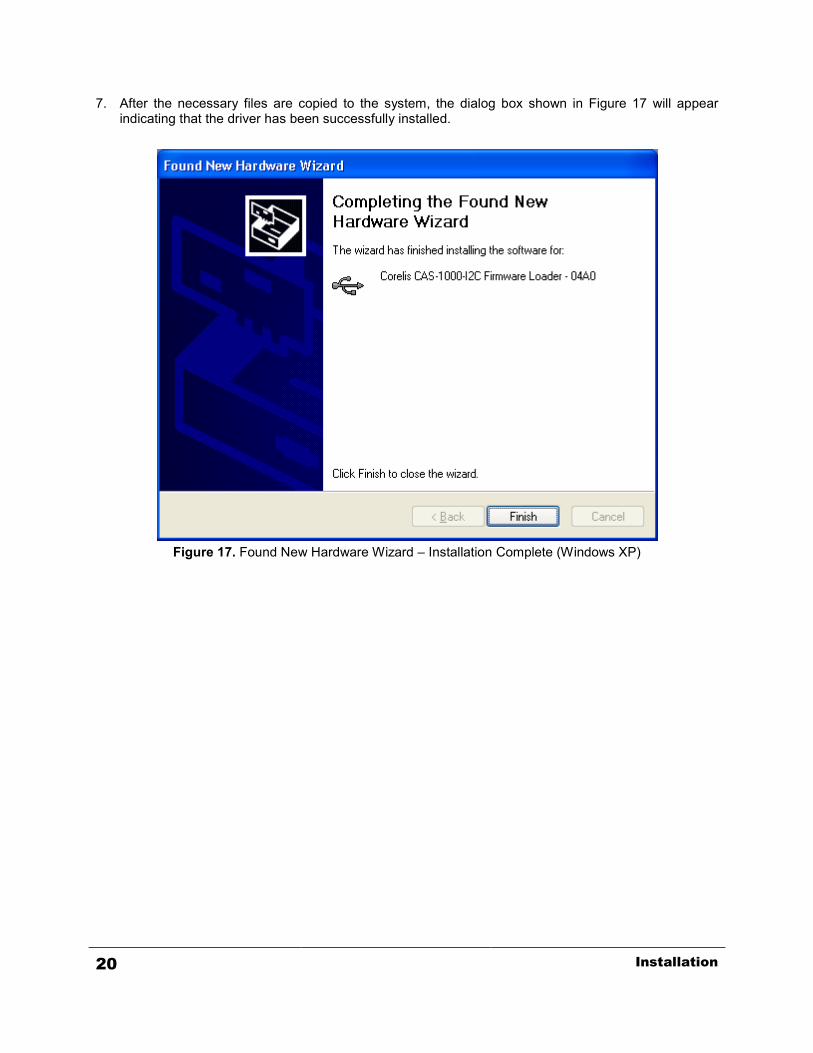
7. After the necessary files are copied to the system, the dialog box shown in Figure 17 will appear indicating that the driver has been successfully installed.
Figure 17. Found New Hardware Wizard – Installation Complete (Windows XP)
20 Installation

8. Click on the Finish button to close the Hardware Wizard dialog box. 9. Another Found New Hardware Wizard should appear again. Repeat steps 3 to 8. 10. The installation of the driver is now complete and Windows will proceed to detect and configure the
CAS-1000-I2C Verify that the CAS-1000-I2C was correctly detected by checking for its entry in the Windows Device Manager. To open the Device Manager, right click on the My Computer icon on the desktop and then select Properties from the pop-up menu. Click on the Hardware tab and then click on the Device Manager button. An entry named Corelis CAS-1000-I2C - 04A1 should be listed in the Universal Serial Bus controllers section as shown in Figure 18.
Figure 18. Windows Device Manager (Windows XP)
11. Plug the RJ45 connector end of the target cable into the CAS-1000-I2C socket labeled Serial Bus
and the other end of the cable can be connected to the target I2C bus signals. The target cables and pinouts are detailed in the Connecting to a Target chapter.
Congratulations! You have now successfully installed the CAS-1000-I2C and drivers on your computer and it is ready to be used. We recommend that you preserve the original packing material for future shipment or storage of the CAS-1000-I2C.
Installation 21

22 Installation

Chapter 3 Getting Started
I2C Exerciser operation overview and tutorial
Overview This chapter will quickly introduce you to the basic usage of the Corelis I2C Exerciser tool for viewing bus traffic via the CAS-1000-I2C. Although it is possible to explore the capabilities of this system on your own, working through this chapter is intended to give an immediate feel and appreciation for its ease of use and core functionality. After you have become familiar with the program, you can go back and explore the rich variety of additional options, tools, and methods available by browsing through the menu system, reading the remainder of this manual, or going through the on-line help. The material in this chapter is divided into two parts. Most of what you will do while working through the chapter will involve using the demo mode feature of I2C Exerciser with the Monitor window to look at various bus tracing capabilities. The second part of the chapter will briefly take you through using the live mode of I2C Exerciser in order to familiarize you with the Debugger window that is not available in the demo mode. Calibration Note If you are going through these tutorials for the first time with a new installation of I2C Exerciser and you have a CAS-1000-I2C connected, then you may be prompted to calibrate the CAS-1000-I2C. The calibration feature fine-tunes the electrical outputs of the CAS-1000-I2C for use when it is providing the voltage source for an attached target bus. Feel free to skip the process during these tutorials by clicking on the No button if prompted to perform calibration. However, if you wish to get the calibration out of the way, you may allow it to proceed by following the on-screen instructions—it should only take a minute or two and need only be completed once. For details on the calibration feature, refer to the Calibration section in the Configuration and Preferences chapter.
Tutorial – Using Demo Mode The steps in the following tutorial will guide you through basic CAS-1000-I2C usage once you have successfully installed the software and, optionally, the hardware. This will not require a live target or even an attached CAS-1000-I2C controller. The demo mode feature of I2C Exerciser allows the user to quickly observe and become familiar with the basic bus tracing features. This mode creates simulated traffic for display in the Monitor window, imitating a connection to virtual targets on an I2C bus. The steps outlined in the demo tutorial focus mainly on understanding the information provided in the Monitor window, including both the trace list and timing display. You will learn how to collect I2C bus traffic, view it in the trace list and timing display, navigate through the data, and utilize various options and features.
Getting Started 23
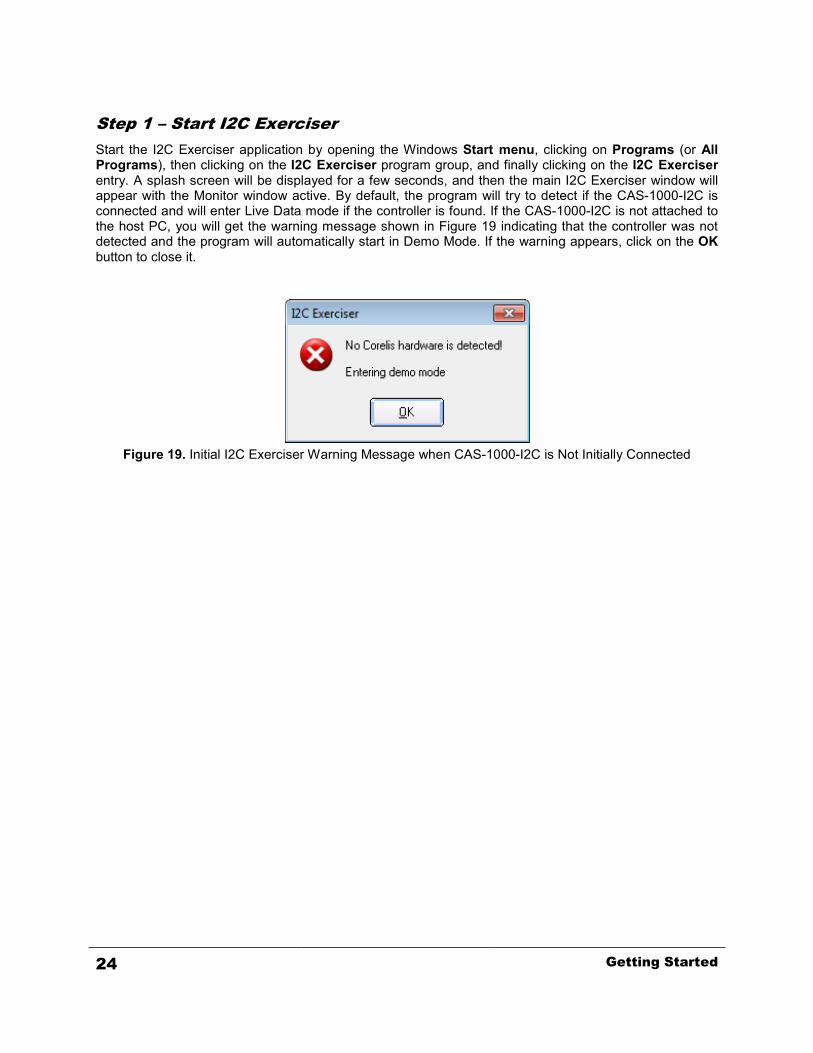
Step 1 – Start I2C Exerciser Start the I2C Exerciser application by opening the Windows Start menu, clicking on Programs (or All Programs), then clicking on the I2C Exerciser program group, and finally clicking on the I2C Exerciser entry. A splash screen will be displayed for a few seconds, and then the main I2C Exerciser window will appear with the Monitor window active. By default, the program will try to detect if the CAS-1000-I2C is connected and will enter Live Data mode if the controller is found. If the CAS-1000-I2C is not attached to the host PC, you will get the warning message shown in Figure 19 indicating that the controller was not detected and the program will automatically start in Demo Mode. If the warning appears, click on the OK button to close it.
Figure 19. Initial I2C Exerciser Warning Message when CAS-1000-I2C is Not Initially Connected
24 Getting Started

Step 2 – Enable Demo mode Click on the Tools menu and verify that the Demo Mode menu item has a check mark next to it as shown below in Figure 20. This indicates that the program is in Demo Mode. If the CAS-1000-I2C was connected to the PC when you started I2C Exerciser, you will have to select this menu item to force the program into Demo Mode. You can also verify that the program is in Demo Mode by observing the programs status bar in the lower right corner of the main window as shown in Figure 21. The leftmost indicator will either contain the bold red text DEMO or the plain text LIVE.
Figure 20. Tools Menu Demo Mode Selection
Figure 21. Status Bar Indicating Demo Mode
Getting Started 25

Step 3 – Begin the Monitor Window Simulated Bus Activity Click on the Run Single tool bar button (represented by a green arrow) as shown in Figure 22 to begin Monitor data collection of the simulated bus activity.
Figure 22. Begin Monitor Data Collection
When the program is in Demo Mode and a Run command is invoked, an informational pop-up window as shown in Figure 23 will appear to remind you that the program is currently in Demo Mode. Click on the OK button to proceed.
Figure 23. Demo Mode Reminder Pop-up Window
26 Getting Started
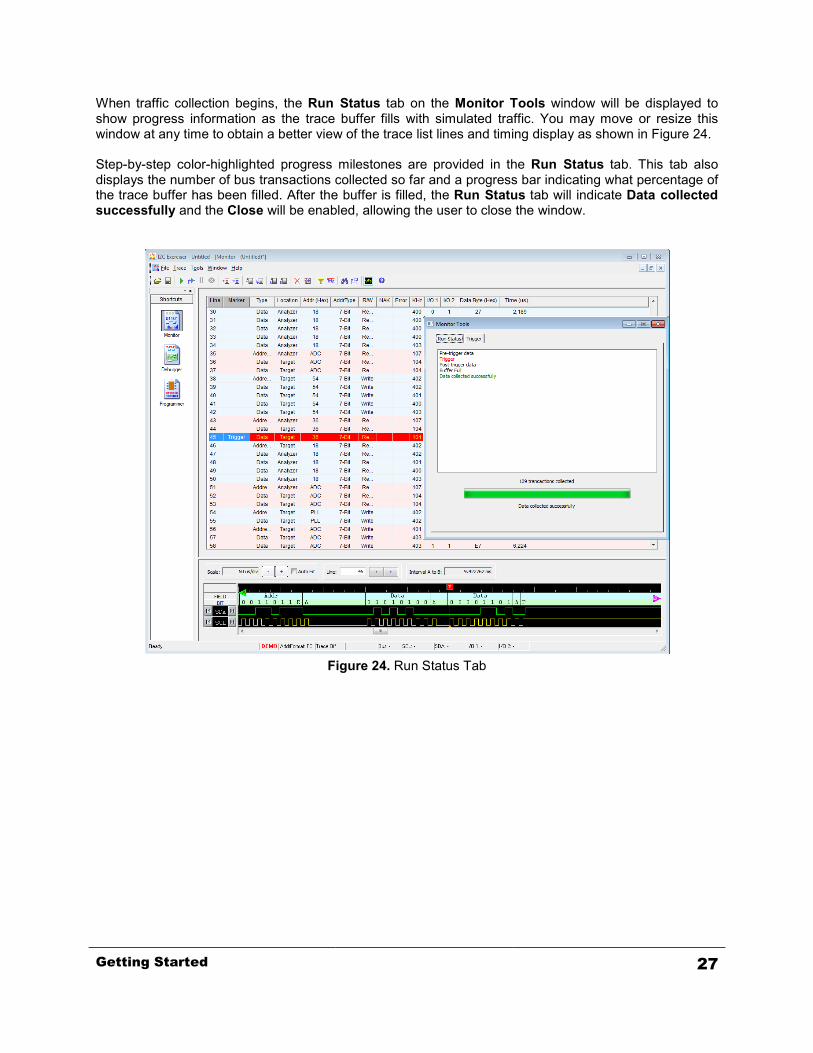
When traffic collection begins, the Run Status tab on the Monitor Tools window will be displayed to show progress information as the trace buffer fills with simulated traffic. You may move or resize this window at any time to obtain a better view of the trace list lines and timing display as shown in Figure 24. Step-by-step color-highlighted progress milestones are provided in the Run Status tab. This tab also displays the number of bus transactions collected so far and a progress bar indicating what percentage of the trace buffer has been filled. After the buffer is filled, the Run Status tab will indicate Data collected successfully and the Close will be enabled, allowing the user to close the window.
Figure 24. Run Status Tab
Getting Started 27
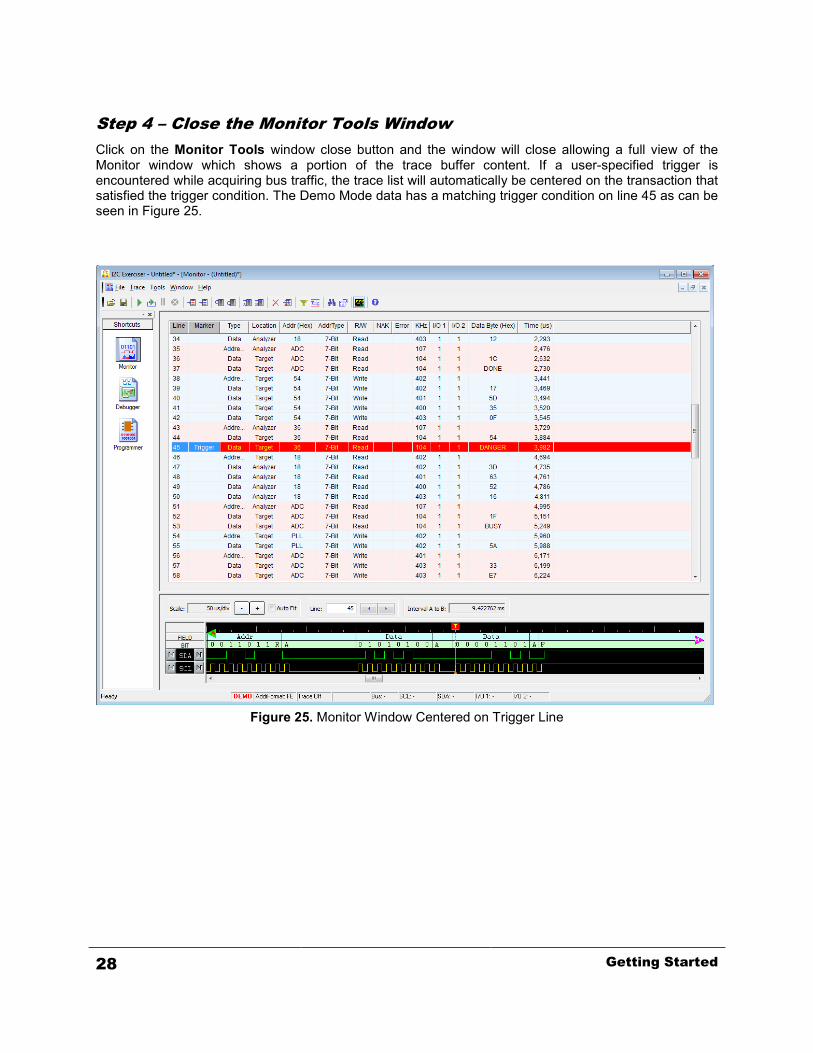
Step 4 – Close the Monitor Tools Window Click on the Monitor Tools window close button and the window will close allowing a full view of the Monitor window which shows a portion of the trace buffer content. If a user-specified trigger is encountered while acquiring bus traffic, the trace list will automatically be centered on the transaction that satisfied the trigger condition. The Demo Mode data has a matching trigger condition on line 45 as can be seen in Figure 25.
Figure 25. Monitor Window Centered on Trigger Line
28 Getting Started
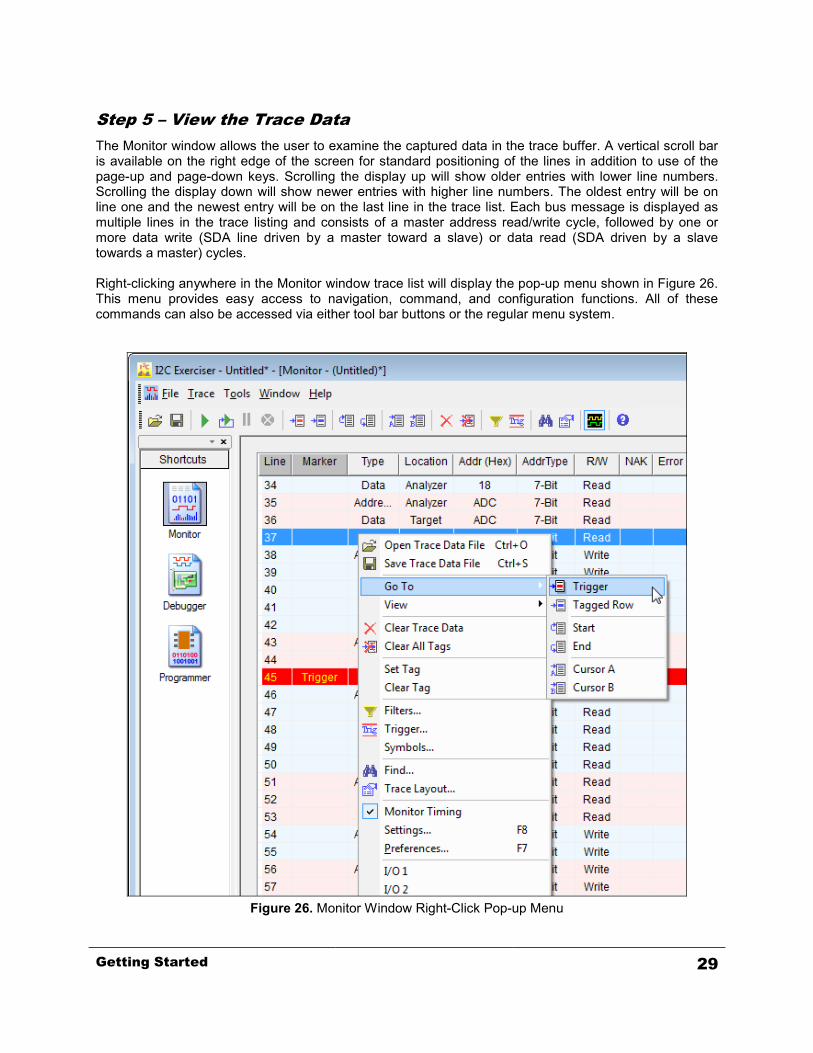
Step 5 – View the Trace Data The Monitor window allows the user to examine the captured data in the trace buffer. A vertical scroll bar is available on the right edge of the screen for standard positioning of the lines in addition to use of the page-up and page-down keys. Scrolling the display up will show older entries with lower line numbers. Scrolling the display down will show newer entries with higher line numbers. The oldest entry will be on line one and the newest entry will be on the last line in the trace list. Each bus message is displayed as multiple lines in the trace listing and consists of a master address read/write cycle, followed by one or more data write (SDA line driven by a master toward a slave) or data read (SDA driven by a slave towards a master) cycles. Right-clicking anywhere in the Monitor window trace list will display the pop-up menu shown in Figure 26. This menu provides easy access to navigation, command, and configuration functions. All of these commands can also be accessed via either tool bar buttons or the regular menu system.
Figure 26. Monitor Window Right-Click Pop-up Menu
Getting Started 29
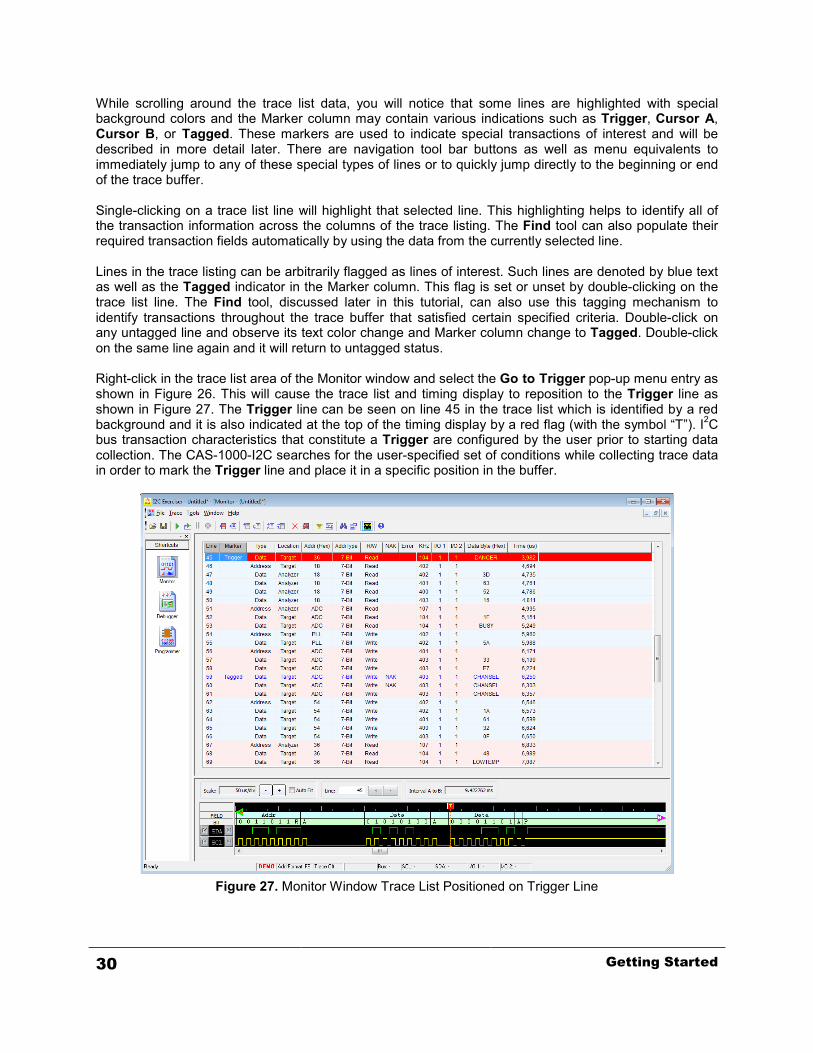
While scrolling around the trace list data, you will notice that some lines are highlighted with special background colors and the Marker column may contain various indications such as Trigger, Cursor A, Cursor B, or Tagged. These markers are used to indicate special transactions of interest and will be described in more detail later. There are navigation tool bar buttons as well as menu equivalents to immediately jump to any of these special types of lines or to quickly jump directly to the beginning or end of the trace buffer. Single-clicking on a trace list line will highlight that selected line. This highlighting helps to identify all of the transaction information across the columns of the trace listing. The Find tool can also populate their required transaction fields automatically by using the data from the currently selected line. Lines in the trace listing can be arbitrarily flagged as lines of interest. Such lines are denoted by blue text as well as the Tagged indicator in the Marker column. This flag is set or unset by double-clicking on the trace list line. The Find tool, discussed later in this tutorial, can also use this tagging mechanism to identify transactions throughout the trace buffer that satisfied certain specified criteria. Double-click on any untagged line and observe its text color change and Marker column change to Tagged. Double-click on the same line again and it will return to untagged status. Right-click in the trace list area of the Monitor window and select the Go to Trigger pop-up menu entry as shown in Figure 26. This will cause the trace list and timing display to reposition to the Trigger line as shown in Figure 27. The Trigger line can be seen on line 45 in the trace list which is identified by a red background and it is also indicated at the top of the timing display by a red flag (with the symbol “T”). I2C bus transaction characteristics that constitute a Trigger are configured by the user prior to starting data collection. The CAS-1000-I2C searches for the user-specified set of conditions while collecting trace data in order to mark the Trigger line and place it in a specific position in the buffer.
Figure 27. Monitor Window Trace List Positioned on Trigger Line
30 Getting Started
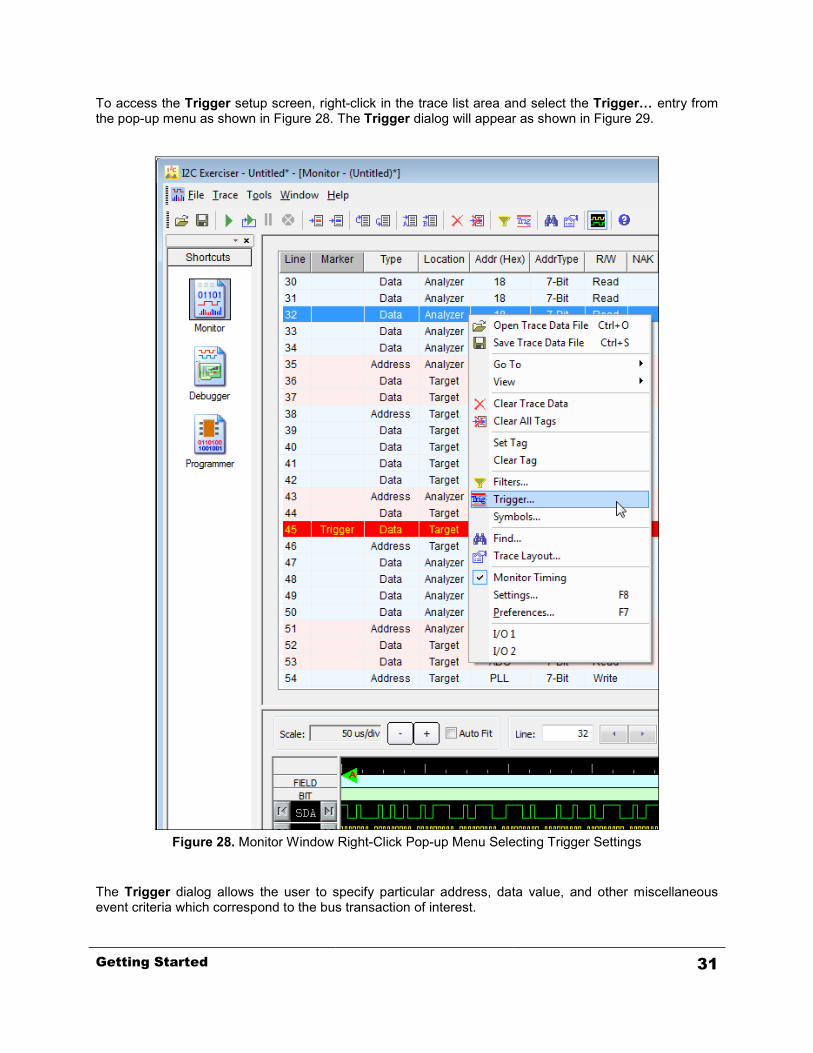
To access the Trigger setup screen, right-click in the trace list area and select the Trigger… entry from the pop-up menu as shown in Figure 28. The Trigger dialog will appear as shown in Figure 29.
Figure 28. Monitor Window Right-Click Pop-up Menu Selecting Trigger Settings
The Trigger dialog allows the user to specify particular address, data value, and other miscellaneous event criteria which correspond to the bus transaction of interest.
Getting Started 31
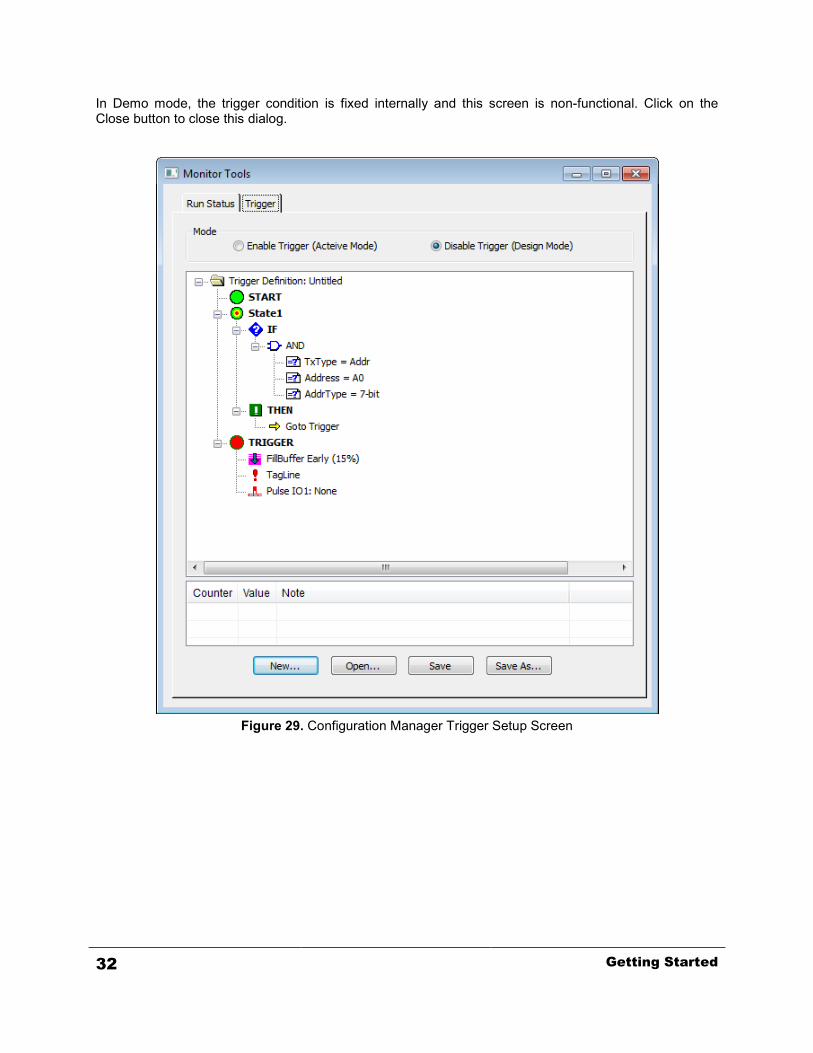
In Demo mode, the trigger condition is fixed internally and this screen is non-functional. Click on the Close button to close this dialog.
Figure 29. Configuration Manager Trigger Setup Screen
32 Getting Started
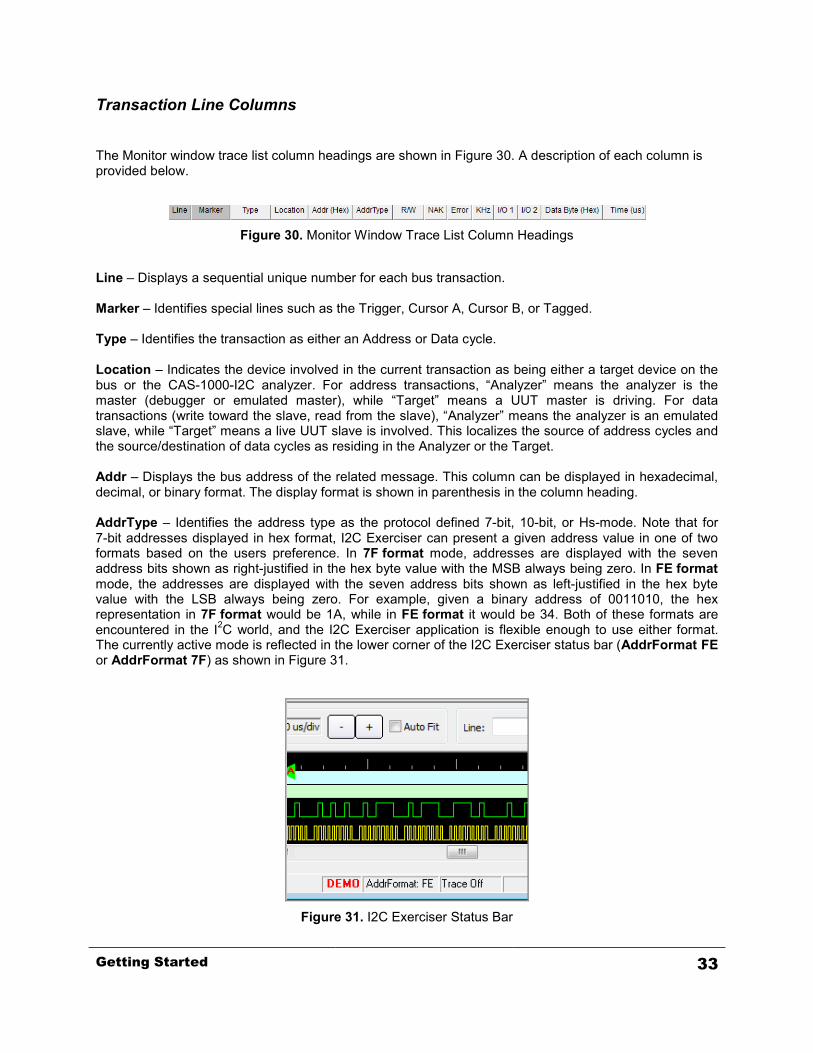
Transaction Line Columns The Monitor window trace list column headings are shown in Figure 30. A description of each column is provided below.
Figure 30. Monitor Window Trace List Column Headings
Line – Displays a sequential unique number for each bus transaction. Marker – Identifies special lines such as the Trigger, Cursor A, Cursor B, or Tagged. Type – Identifies the transaction as either an Address or Data cycle. Location – Indicates the device involved in the current transaction as being either a target device on the bus or the CAS-1000-I2C analyzer. For address transactions, “Analyzer” means the analyzer is the master (debugger or emulated master), while “Target” means a UUT master is driving. For data transactions (write toward the slave, read from the slave), “Analyzer” means the analyzer is an emulated slave, while “Target” means a live UUT slave is involved. This localizes the source of address cycles and the source/destination of data cycles as residing in the Analyzer or the Target. Addr – Displays the bus address of the related message. This column can be displayed in hexadecimal, decimal, or binary format. The display format is shown in parenthesis in the column heading. AddrType – Identifies the address type as the protocol defined 7-bit, 10-bit, or Hs-mode. Note that for 7-bit addresses displayed in hex format, I2C Exerciser can present a given address value in one of two formats based on the users preference. In 7F format mode, addresses are displayed with the seven address bits shown as right-justified in the hex byte value with the MSB always being zero. In FE format mode, the addresses are displayed with the seven address bits shown as left-justified in the hex byte value with the LSB always being zero. For example, given a binary address of 0011010, the hex representation in 7F format would be 1A, while in FE format it would be 34. Both of these formats are encountered in the I2C world, and the I2C Exerciser application is flexible enough to use either format. The currently active mode is reflected in the lower corner of the I2C Exerciser status bar (AddrFormat FE or AddrFormat 7F) as shown in Figure 31.
Figure 31. I2C Exerciser Status Bar
Getting Started 33
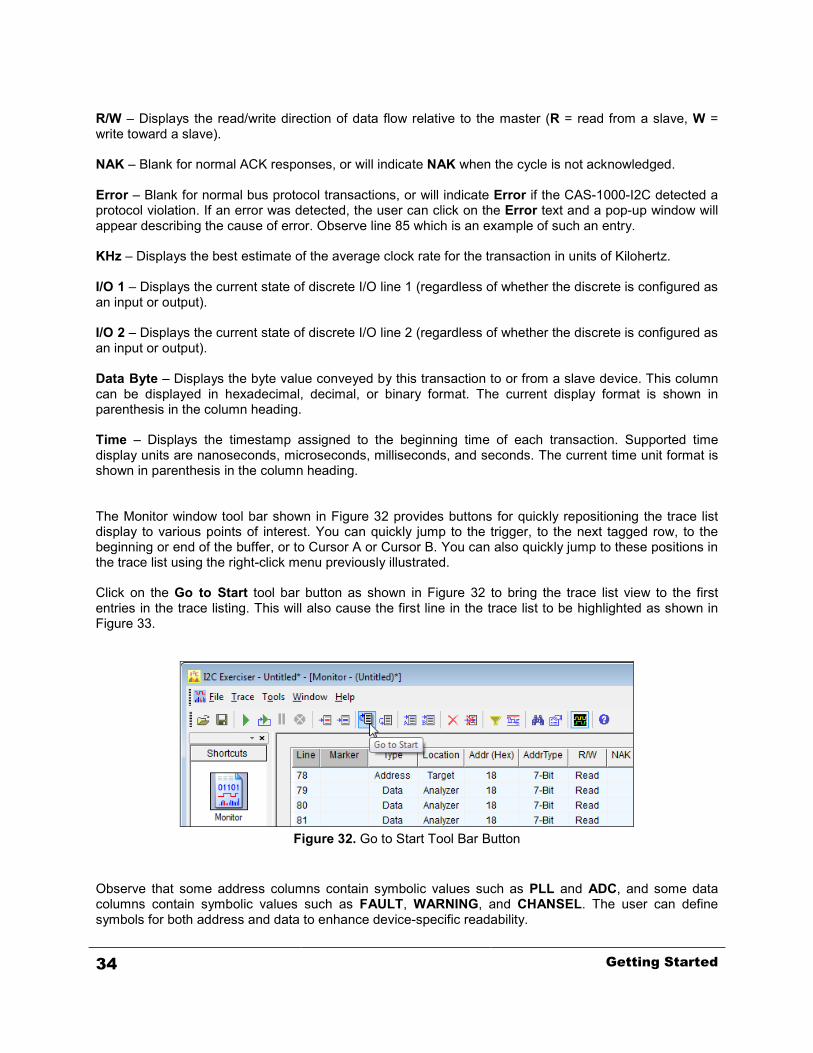
R/W – Displays the read/write direction of data flow relative to the master (R = read from a slave, W = write toward a slave). NAK – Blank for normal ACK responses, or will indicate NAK when the cycle is not acknowledged. Error – Blank for normal bus protocol transactions, or will indicate Error if the CAS-1000-I2C detected a protocol violation. If an error was detected, the user can click on the Error text and a pop-up window will appear describing the cause of error. Observe line 85 which is an example of such an entry. KHz – Displays the best estimate of the average clock rate for the transaction in units of Kilohertz. I/O 1 – Displays the current state of discrete I/O line 1 (regardless of whether the discrete is configured as an input or output). I/O 2 – Displays the current state of discrete I/O line 2 (regardless of whether the discrete is configured as an input or output). Data Byte – Displays the byte value conveyed by this transaction to or from a slave device. This column can be displayed in hexadecimal, decimal, or binary format. The current display format is shown in parenthesis in the column heading. Time – Displays the timestamp assigned to the beginning time of each transaction. Supported time display units are nanoseconds, microseconds, milliseconds, and seconds. The current time unit format is shown in parenthesis in the column heading. The Monitor window tool bar shown in Figure 32 provides buttons for quickly repositioning the trace list display to various points of interest. You can quickly jump to the trigger, to the next tagged row, to the beginning or end of the buffer, or to Cursor A or Cursor B. You can also quickly jump to these positions in the trace list using the right-click menu previously illustrated. Click on the Go to Start tool bar button as shown in Figure 32 to bring the trace list view to the first entries in the trace listing. This will also cause the first line in the trace list to be highlighted as shown in Figure 33.
Figure 32. Go to Start Tool Bar Button
Observe that some address columns contain symbolic values such as PLL and ADC, and some data columns contain symbolic values such as FAULT, WARNING, and CHANSEL. The user can define symbols for both address and data to enhance device-specific readability.
34 Getting Started

Figure 33. Monitor Window Trace List Showing Symbolic Address and Data Entries
Getting Started 35
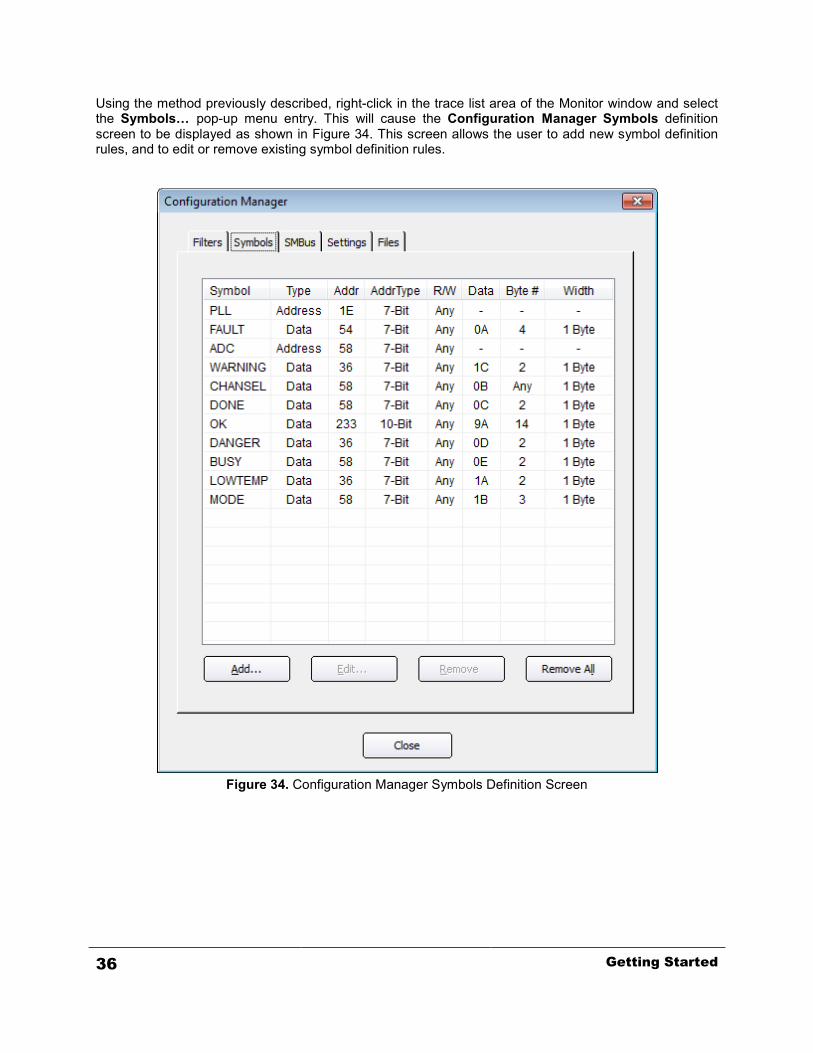
Using the method previously described, right-click in the trace list area of the Monitor window and select the Symbols… pop-up menu entry. This will cause the Configuration Manager Symbols definition screen to be displayed as shown in Figure 34. This screen allows the user to add new symbol definition rules, and to edit or remove existing symbol definition rules.
Figure 34. Configuration Manager Symbols Definition Screen
36 Getting Started
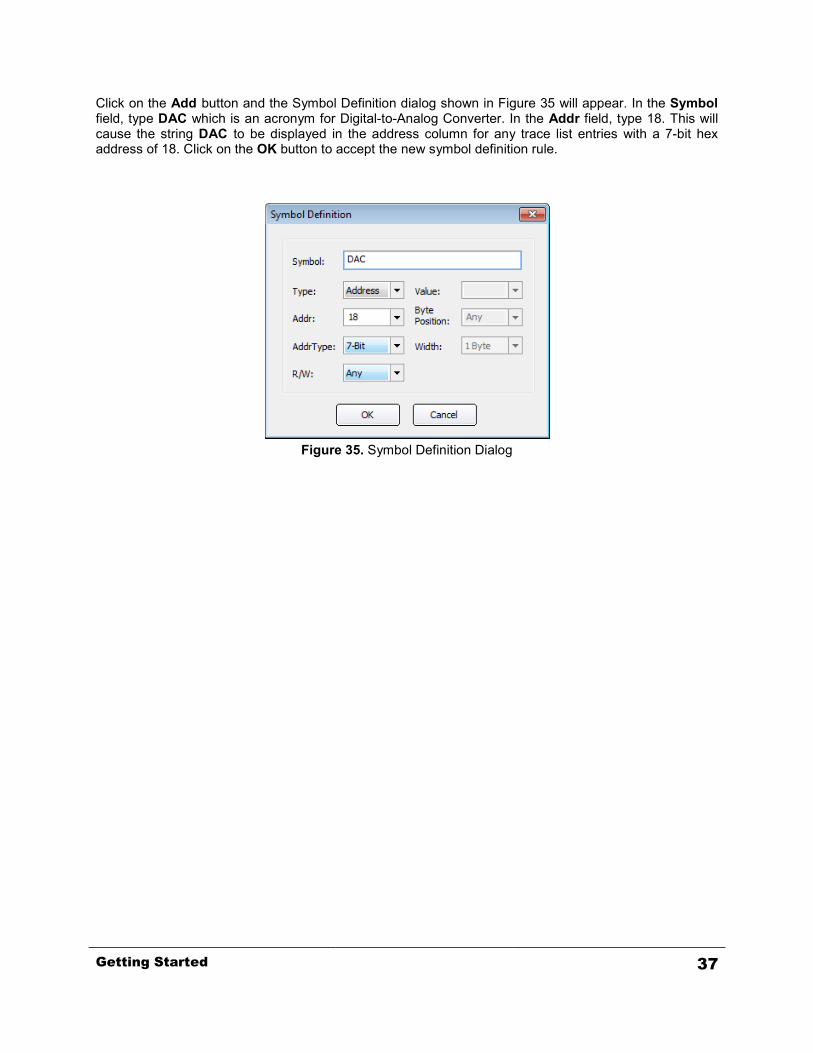
Click on the Add button and the Symbol Definition dialog shown in Figure 35 will appear. In the Symbol field, type DAC which is an acronym for Digital-to-Analog Converter. In the Addr field, type 18. This will cause the string DAC to be displayed in the address column for any trace list entries with a 7-bit hex address of 18. Click on the OK button to accept the new symbol definition rule.
Figure 35. Symbol Definition Dialog
Getting Started 37
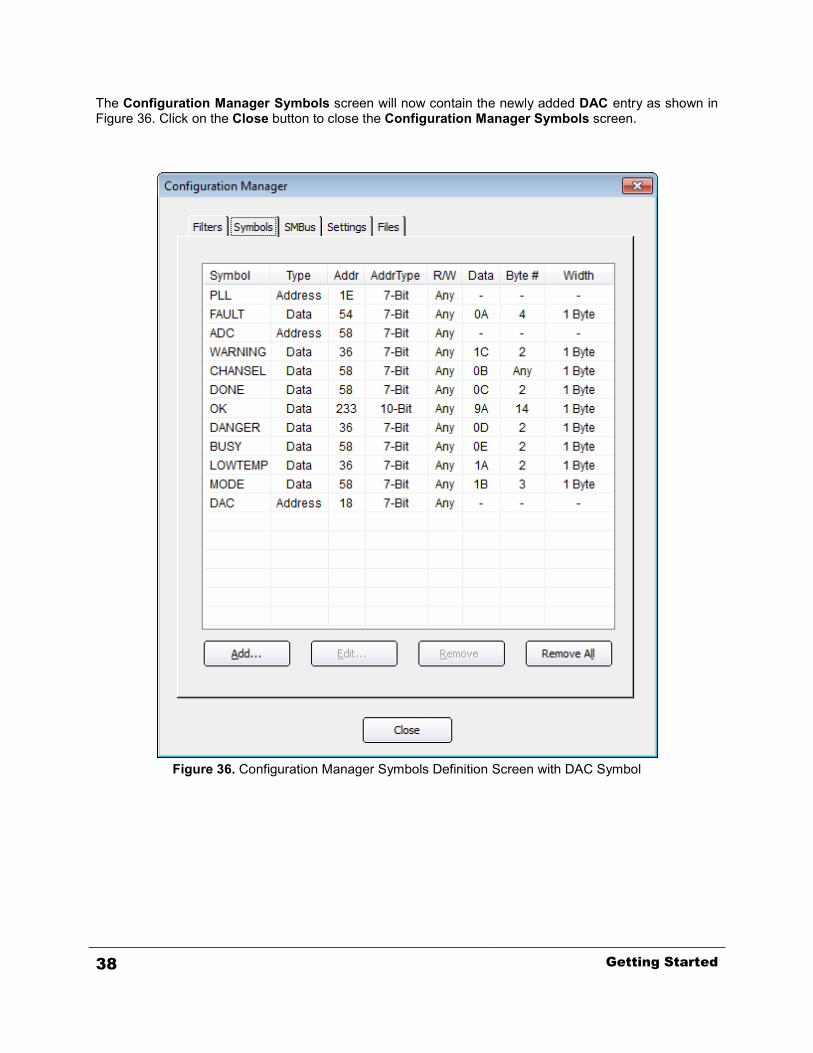
The Configuration Manager Symbols screen will now contain the newly added DAC entry as shown in Figure 36. Click on the Close button to close the Configuration Manager Symbols screen.
Figure 36. Configuration Manager Symbols Definition Screen with DAC Symbol
38 Getting Started
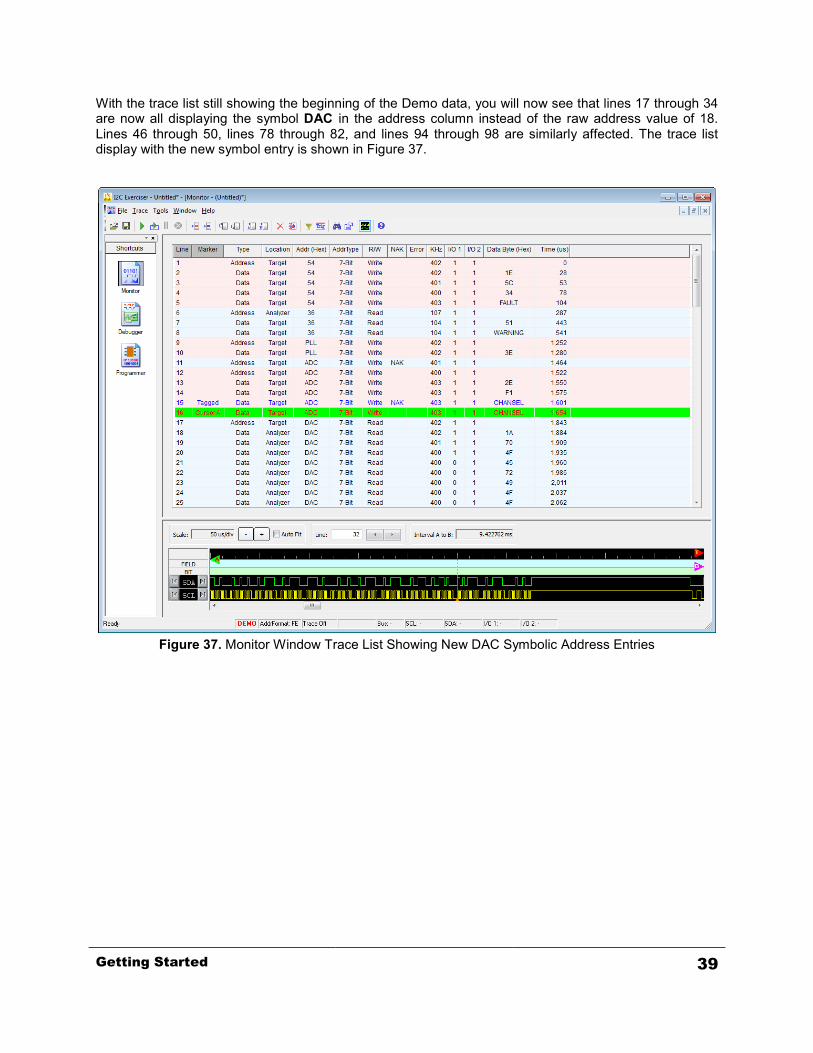
With the trace list still showing the beginning of the Demo data, you will now see that lines 17 through 34 are now all displaying the symbol DAC in the address column instead of the raw address value of 18. Lines 46 through 50, lines 78 through 82, and lines 94 through 98 are similarly affected. The trace list display with the new symbol entry is shown in Figure 37.
Figure 37. Monitor Window Trace List Showing New DAC Symbolic Address Entries
Getting Started 39
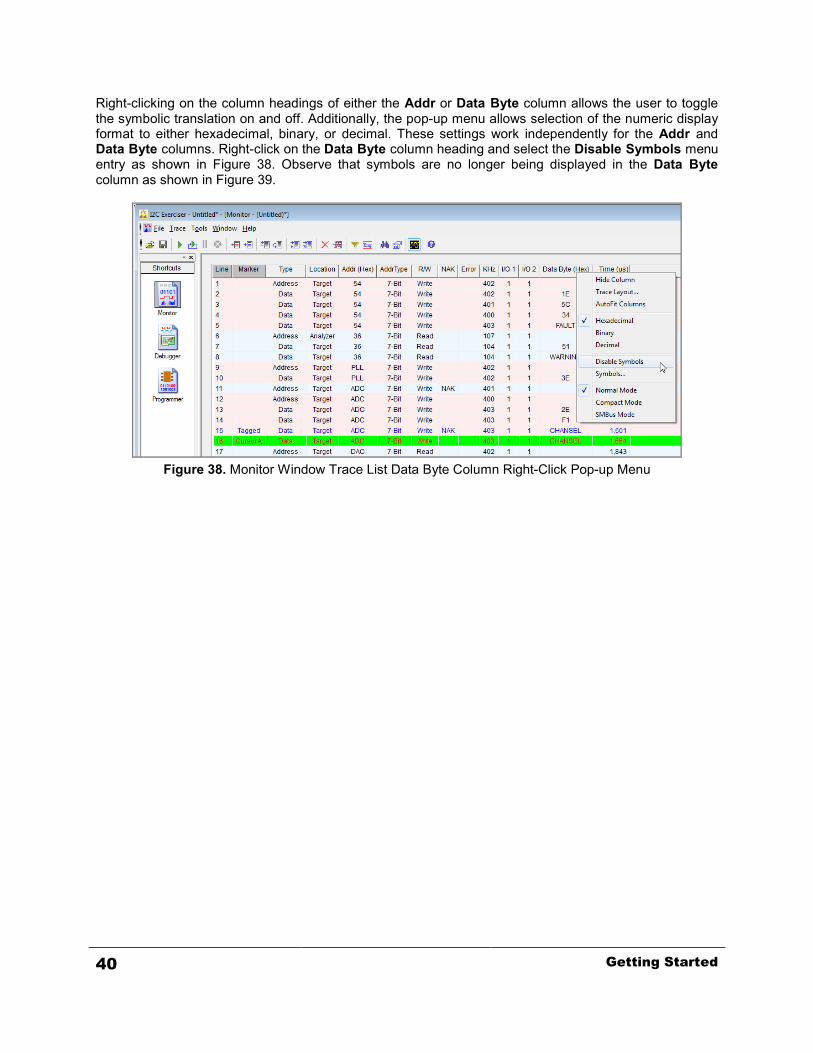
Right-clicking on the column headings of either the Addr or Data Byte column allows the user to toggle the symbolic translation on and off. Additionally, the pop-up menu allows selection of the numeric display format to either hexadecimal, binary, or decimal. These settings work independently for the Addr and Data Byte columns. Right-click on the Data Byte column heading and select the Disable Symbols menu entry as shown in Figure 38. Observe that symbols are no longer being displayed in the Data Byte column as shown in Figure 39.
Figure 38. Monitor Window Trace List Data Byte Column Right-Click Pop-up Menu
40 Getting Started
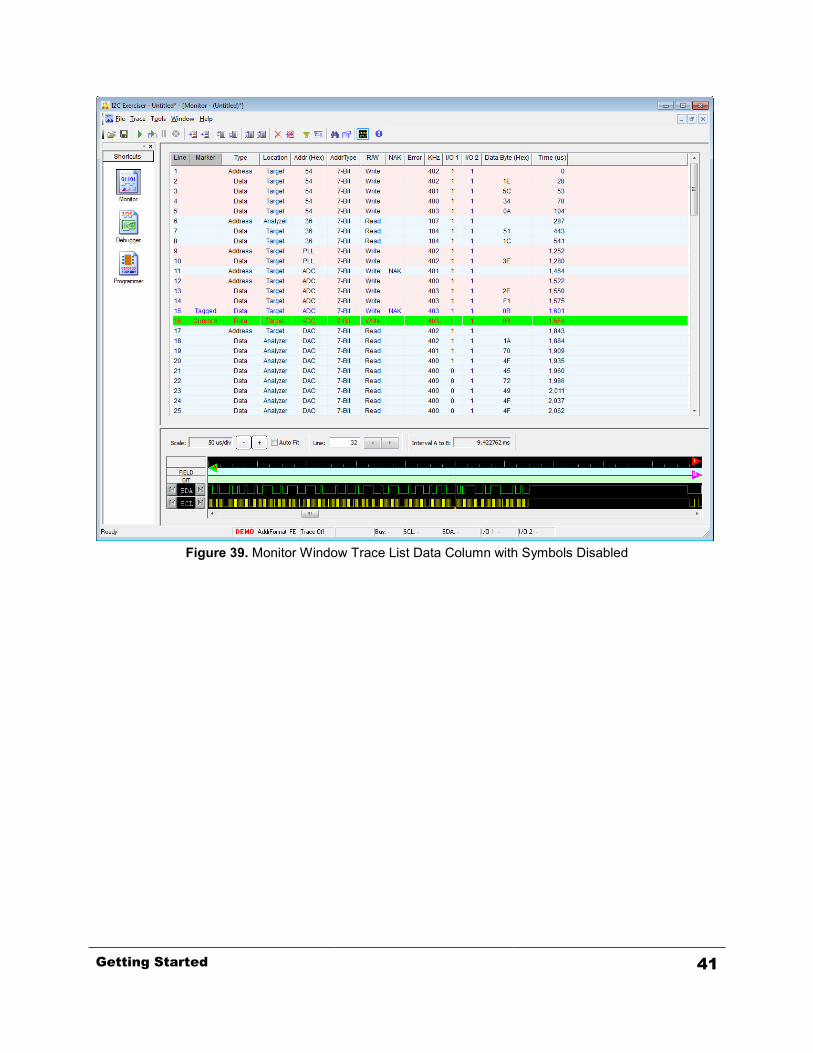
Figure 39. Monitor Window Trace List Data Column with Symbols Disabled
Getting Started 41
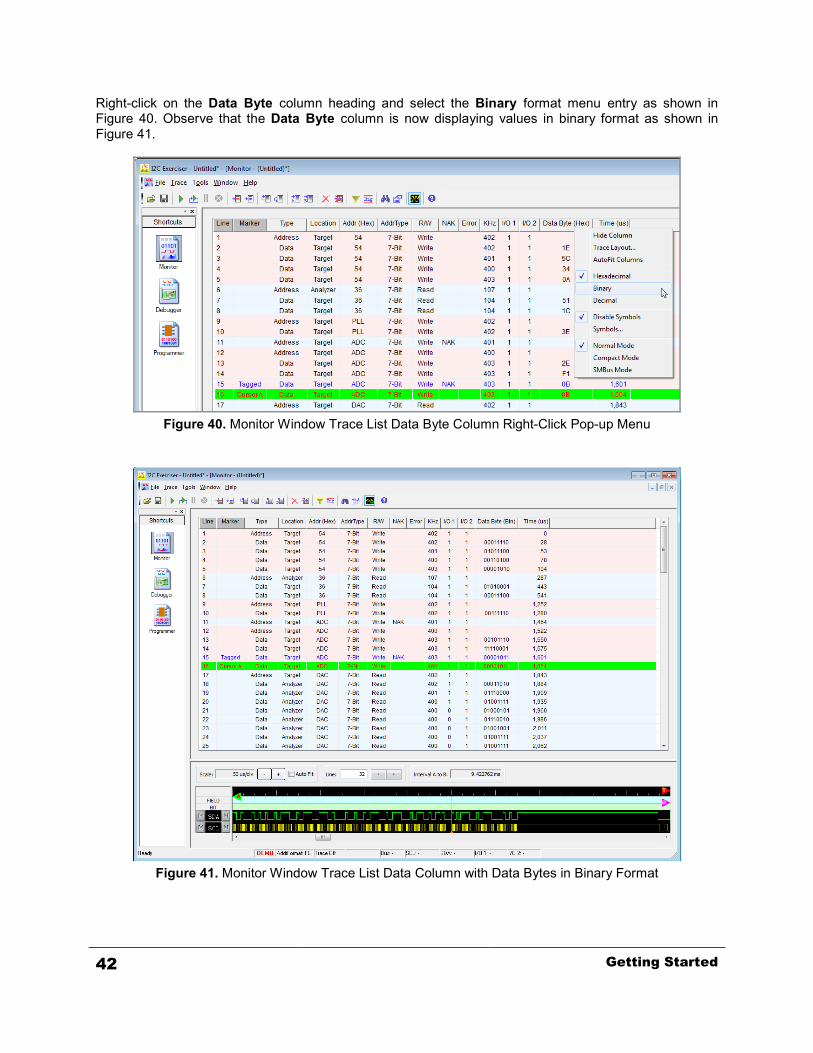
Right-click on the Data Byte column heading and select the Binary format menu entry as shown in Figure 40. Observe that the Data Byte column is now displaying values in binary format as shown in Figure 41.
Figure 40. Monitor Window Trace List Data Byte Column Right-Click Pop-up Menu
Figure 41. Monitor Window Trace List Data Column with Data Bytes in Binary Format
42 Getting Started
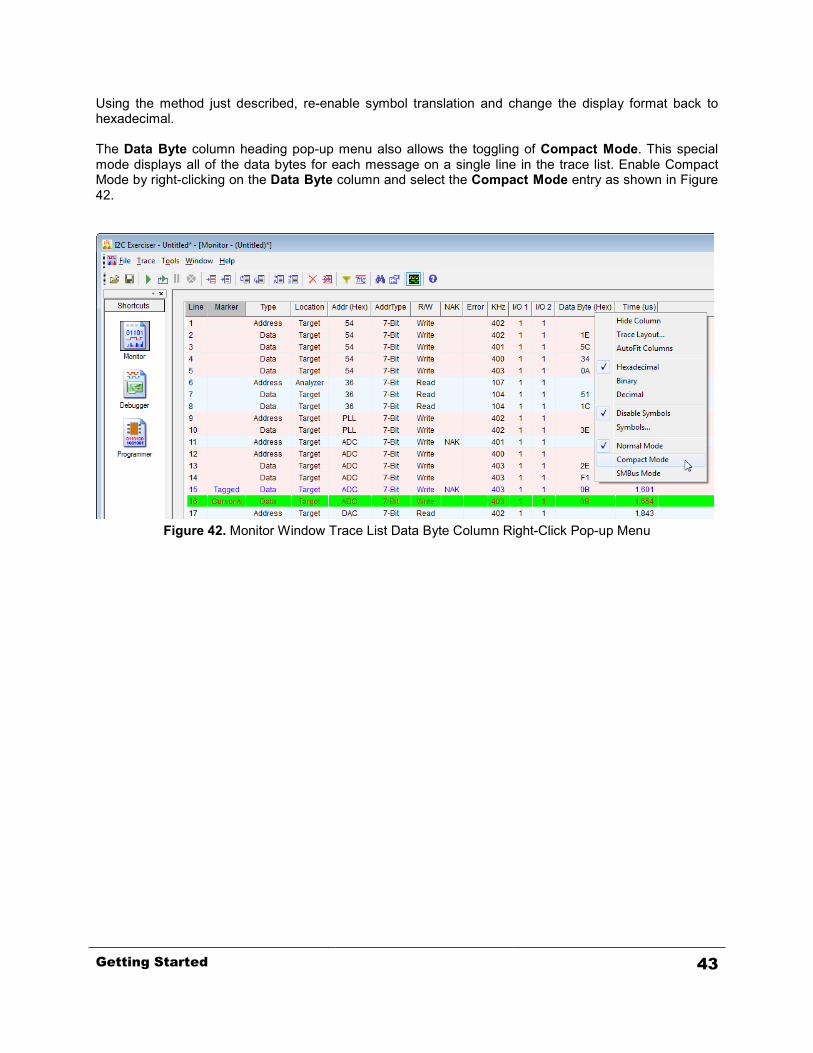
Using the method just described, re-enable symbol translation and change the display format back to hexadecimal. The Data Byte column heading pop-up menu also allows the toggling of Compact Mode. This special mode displays all of the data bytes for each message on a single line in the trace list. Enable Compact Mode by right-clicking on the Data Byte column and select the Compact Mode entry as shown in Figure 42.
Figure 42. Monitor Window Trace List Data Byte Column Right-Click Pop-up Menu
Getting Started 43

The trace list data will be reformatted as shown in Figure 43. Some messages may contain more data bytes than will fit on the screen. When the display is in Compact Mode, clicking on any data transaction in the Data Byte column will cause a pop-up Data Bytes window to appear making it possible to view and scroll through all data in the selected message. Click on line 18 in the Data Byte column and the pop-up window shown in Figure 44 will appear allowing you to see all of the data bytes in that message which are not all visible in the Data Byte column. This pop-up window will remain open until you close it and will continue to update if you click in the Data Byte column for any other data transaction.
Figure 43. Monitor Window Trace List in Compact Mode
44 Getting Started
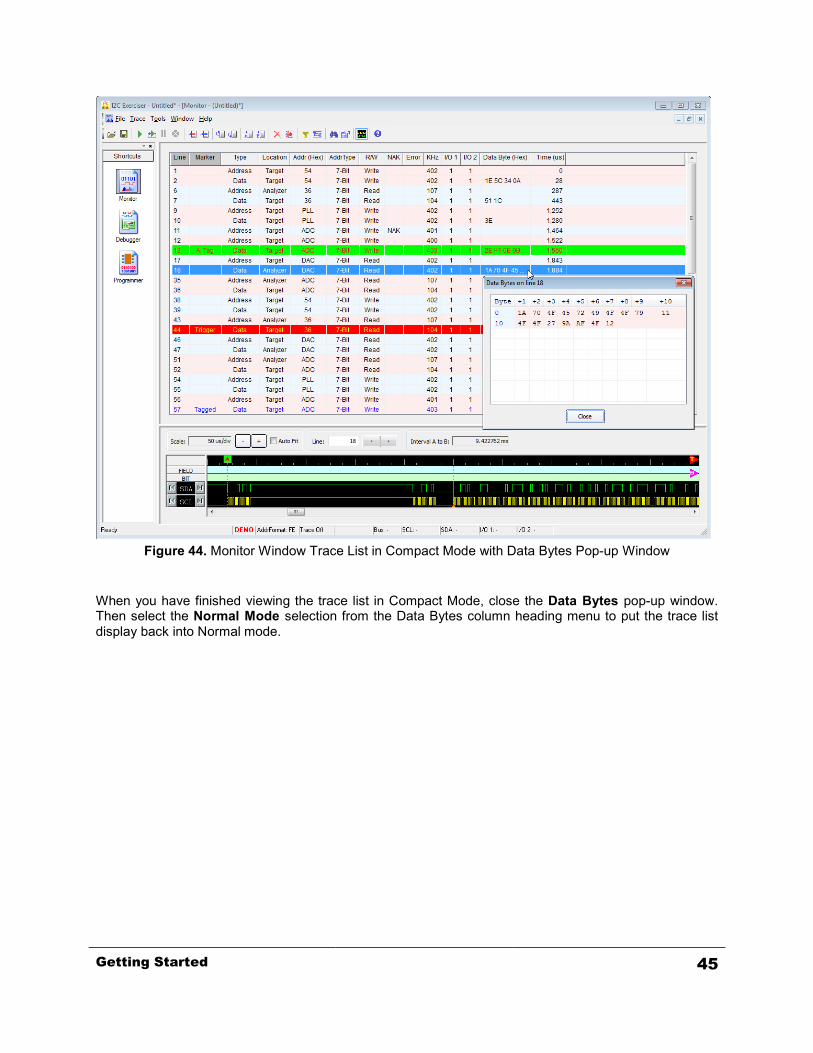
Figure 44. Monitor Window Trace List in Compact Mode with Data Bytes Pop-up Window
When you have finished viewing the trace list in Compact Mode, close the Data Bytes pop-up window. Then select the Normal Mode selection from the Data Bytes column heading menu to put the trace list display back into Normal mode.
Getting Started 45
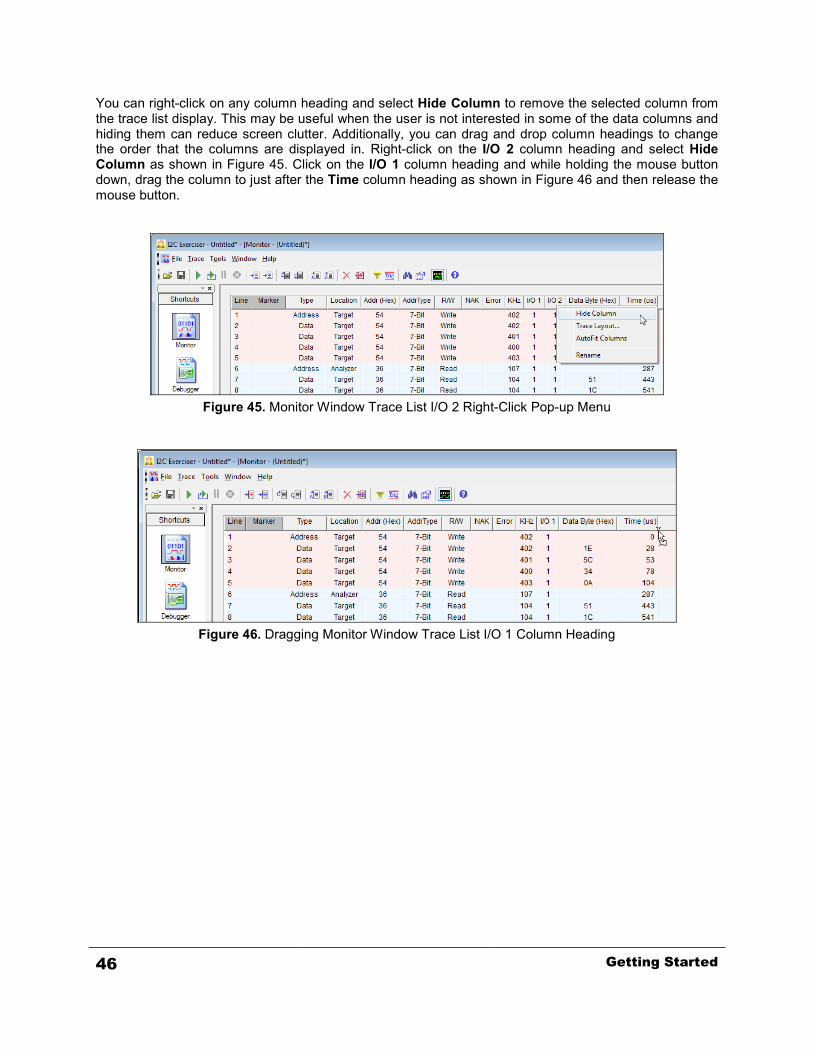
You can right-click on any column heading and select Hide Column to remove the selected column from the trace list display. This may be useful when the user is not interested in some of the data columns and hiding them can reduce screen clutter. Additionally, you can drag and drop column headings to change the order that the columns are displayed in. Right-click on the I/O 2 column heading and select Hide Column as shown in Figure 45. Click on the I/O 1 column heading and while holding the mouse button down, drag the column to just after the Time column heading as shown in Figure 46 and then release the mouse button.
Figure 45. Monitor Window Trace List I/O 2 Right-Click Pop-up Menu
Figure 46. Dragging Monitor Window Trace List I/O 1 Column Heading
46 Getting Started
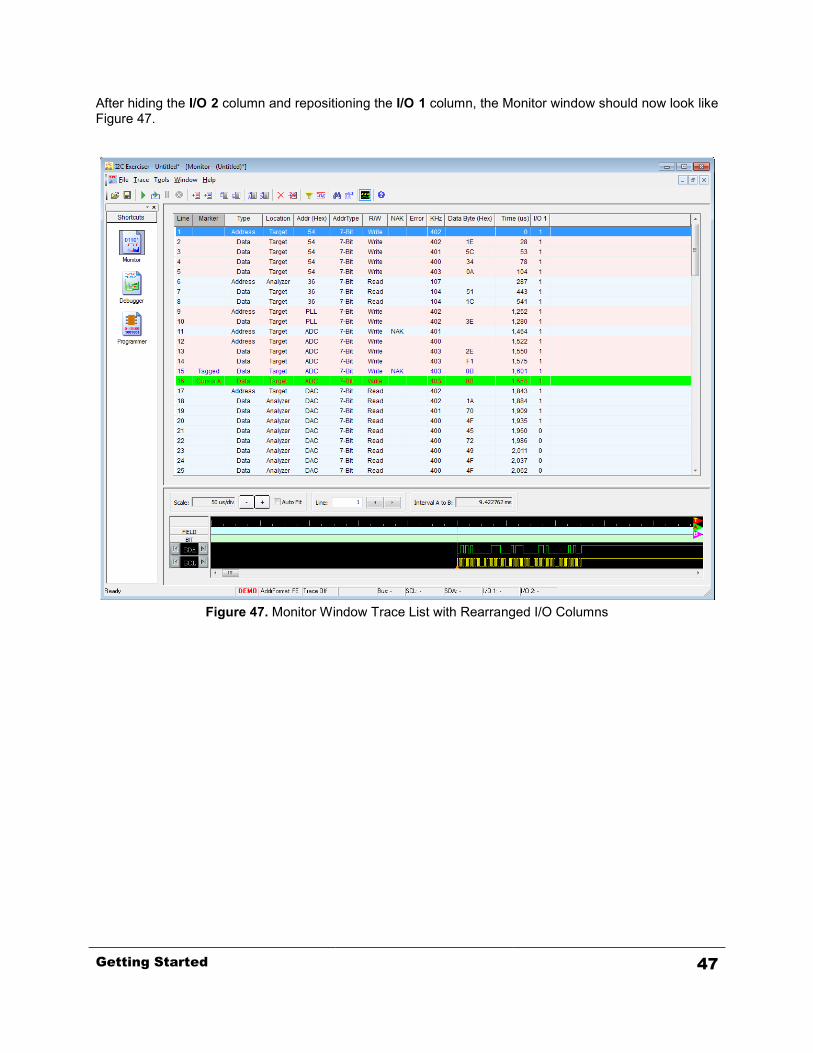
After hiding the I/O 2 column and repositioning the I/O 1 column, the Monitor window should now look like Figure 47.
Figure 47. Monitor Window Trace List with Rearranged I/O Columns
Getting Started 47
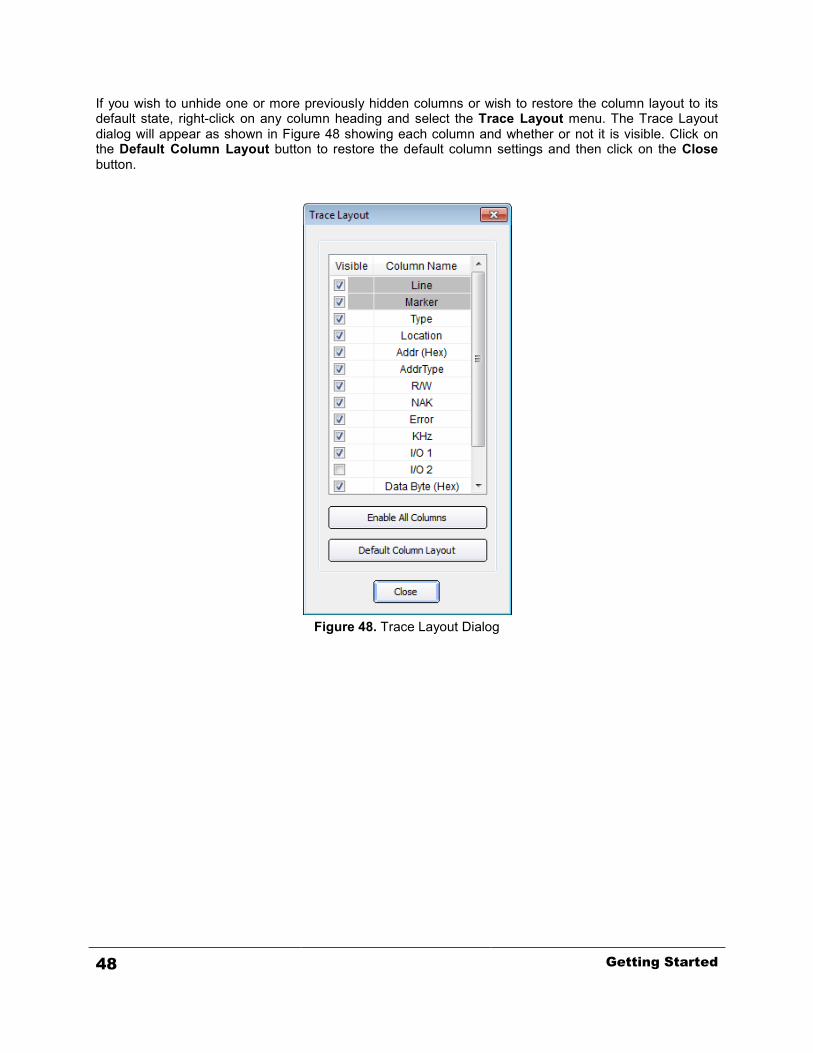
If you wish to unhide one or more previously hidden columns or wish to restore the column layout to its default state, right-click on any column heading and select the Trace Layout menu. The Trace Layout dialog will appear as shown in Figure 48 showing each column and whether or not it is visible. Click on the Default Column Layout button to restore the default column settings and then click on the Close button.
Figure 48. Trace Layout Dialog
48 Getting Started
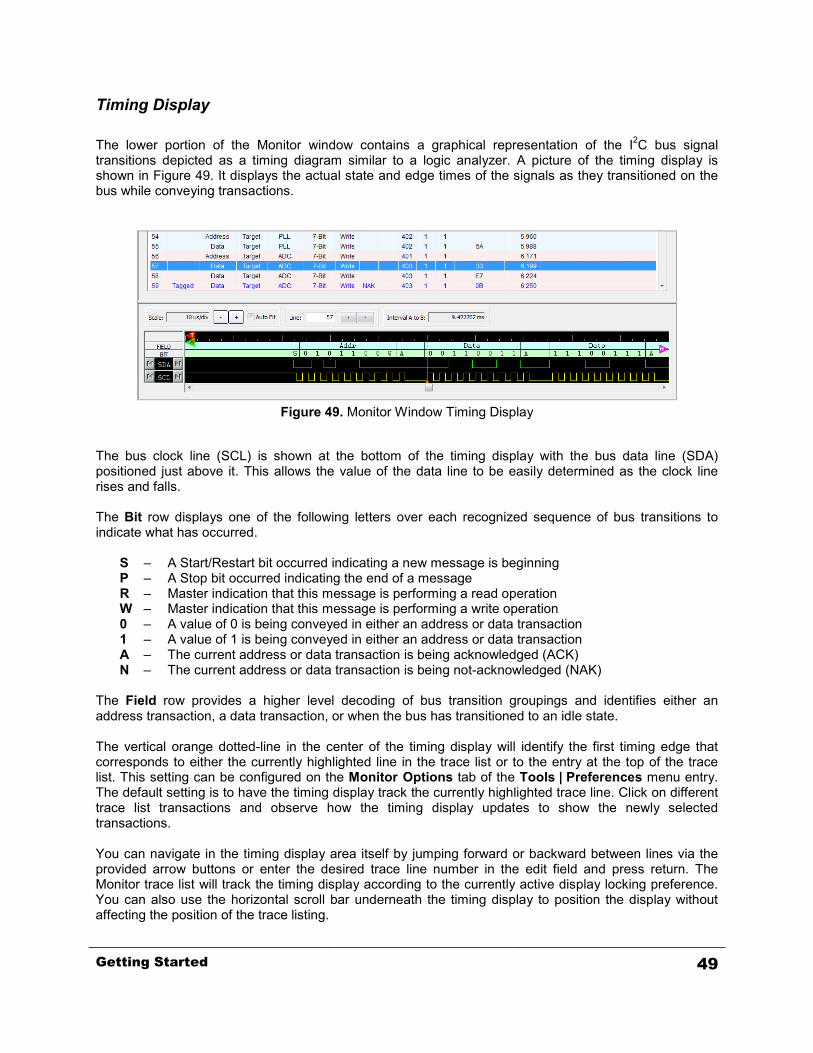
Timing Display The lower portion of the Monitor window contains a graphical representation of the I2C bus signal transitions depicted as a timing diagram similar to a logic analyzer. A picture of the timing display is shown in Figure 49. It displays the actual state and edge times of the signals as they transitioned on the bus while conveying transactions.
Figure 49. Monitor Window Timing Display
The bus clock line (SCL) is shown at the bottom of the timing display with the bus data line (SDA) positioned just above it. This allows the value of the data line to be easily determined as the clock line rises and falls. The Bit row displays one of the following letters over each recognized sequence of bus transitions to indicate what has occurred. S – A Start/Restart bit occurred indicating a new message is beginning P – A Stop bit occurred indicating the end of a message R – Master indication that this message is performing a read operation W – Master indication that this message is performing a write operation 0 – A value of 0 is being conveyed in either an address or data transaction 1 – A value of 1 is being conveyed in either an address or data transaction A – The current address or data transaction is being acknowledged (ACK) N – The current address or data transaction is being not-acknowledged (NAK) The Field row provides a higher level decoding of bus transition groupings and identifies either an address transaction, a data transaction, or when the bus has transitioned to an idle state. The vertical orange dotted-line in the center of the timing display will identify the first timing edge that corresponds to either the currently highlighted line in the trace list or to the entry at the top of the trace list. This setting can be configured on the Monitor Options tab of the Tools | Preferences menu entry. The default setting is to have the timing display track the currently highlighted trace line. Click on different trace list transactions and observe how the timing display updates to show the newly selected transactions. You can navigate in the timing display area itself by jumping forward or backward between lines via the provided arrow buttons or enter the desired trace line number in the edit field and press return. The Monitor trace list will track the timing display according to the currently active display locking preference. You can also use the horizontal scroll bar underneath the timing display to position the display without affecting the position of the trace listing.
Getting Started 49
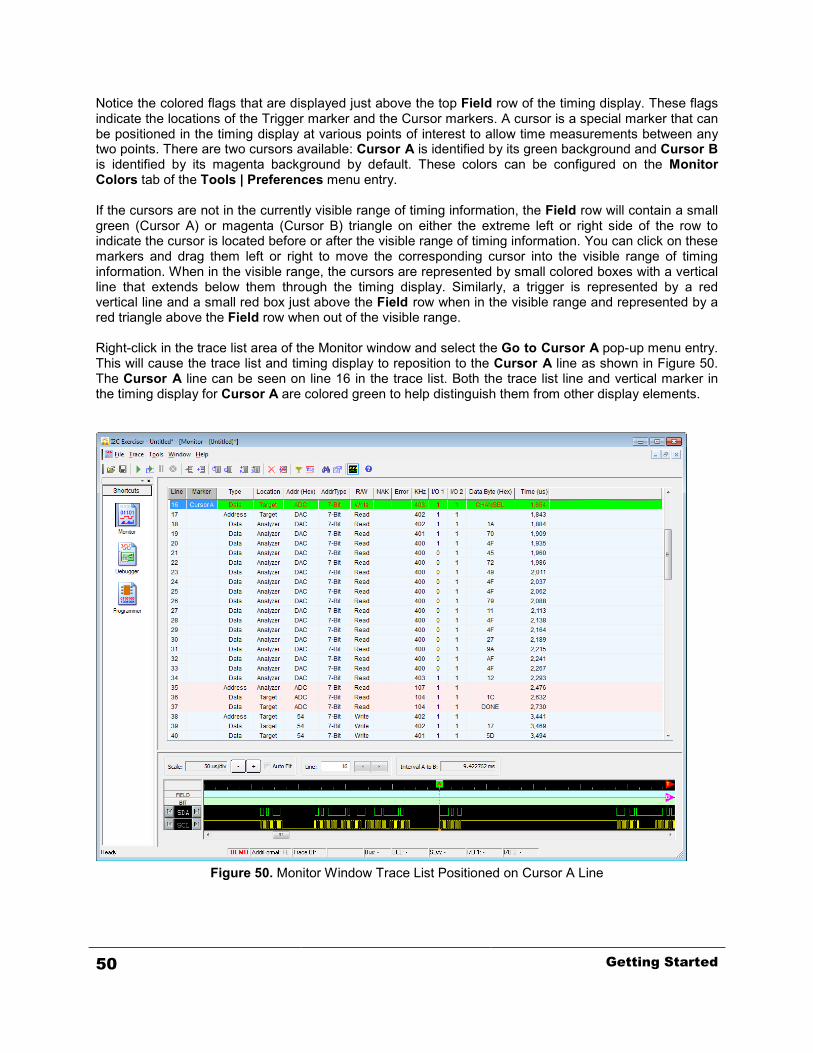
Notice the colored flags that are displayed just above the top Field row of the timing display. These flags indicate the locations of the Trigger marker and the Cursor markers. A cursor is a special marker that can be positioned in the timing display at various points of interest to allow time measurements between any two points. There are two cursors available: Cursor A is identified by its green background and Cursor B is identified by its magenta background by default. These colors can be configured on the Monitor Colors tab of the Tools | Preferences menu entry. If the cursors are not in the currently visible range of timing information, the Field row will contain a small green (Cursor A) or magenta (Cursor B) triangle on either the extreme left or right side of the row to indicate the cursor is located before or after the visible range of timing information. You can click on these markers and drag them left or right to move the corresponding cursor into the visible range of timing information. When in the visible range, the cursors are represented by small colored boxes with a vertical line that extends below them through the timing display. Similarly, a trigger is represented by a red vertical line and a small red box just above the Field row when in the visible range and represented by a red triangle above the Field row when out of the visible range. Right-click in the trace list area of the Monitor window and select the Go to Cursor A pop-up menu entry. This will cause the trace list and timing display to reposition to the Cursor A line as shown in Figure 50. The Cursor A line can be seen on line 16 in the trace list. Both the trace list line and vertical marker in the timing display for Cursor A are colored green to help distinguish them from other display elements.
Figure 50. Monitor Window Trace List Positioned on Cursor A Line
50 Getting Started
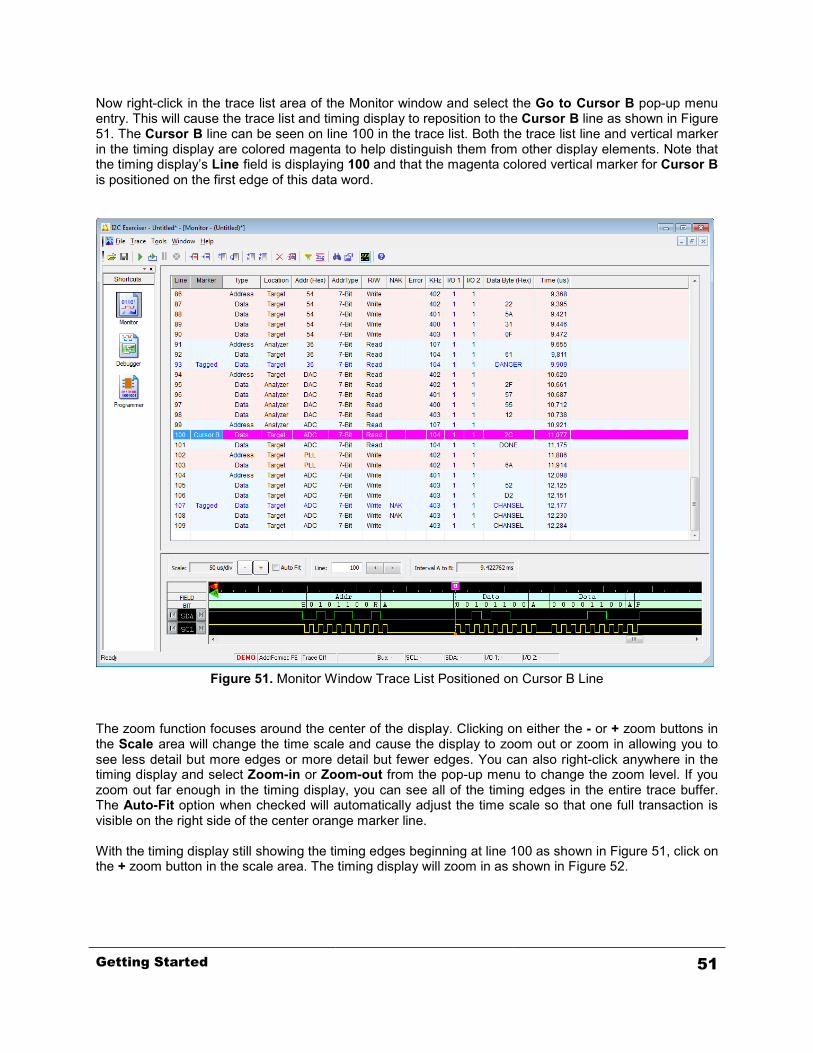
Now right-click in the trace list area of the Monitor window and select the Go to Cursor B pop-up menu entry. This will cause the trace list and timing display to reposition to the Cursor B line as shown in Figure 51. The Cursor B line can be seen on line 100 in the trace list. Both the trace list line and vertical marker in the timing display are colored magenta to help distinguish them from other display elements. Note that the timing display’s Line field is displaying 100 and that the magenta colored vertical marker for Cursor B is positioned on the first edge of this data word.
Figure 51. Monitor Window Trace List Positioned on Cursor B Line
The zoom function focuses around the center of the display. Clicking on either the - or + zoom buttons in the Scale area will change the time scale and cause the display to zoom out or zoom in allowing you to see less detail but more edges or more detail but fewer edges. You can also right-click anywhere in the timing display and select Zoom-in or Zoom-out from the pop-up menu to change the zoom level. If you zoom out far enough in the timing display, you can see all of the timing edges in the entire trace buffer. The Auto-Fit option when checked will automatically adjust the time scale so that one full transaction is visible on the right side of the center orange marker line. With the timing display still showing the timing edges beginning at line 100 as shown in Figure 51, click on the + zoom button in the scale area. The timing display will zoom in as shown in Figure 52.
Getting Started 51
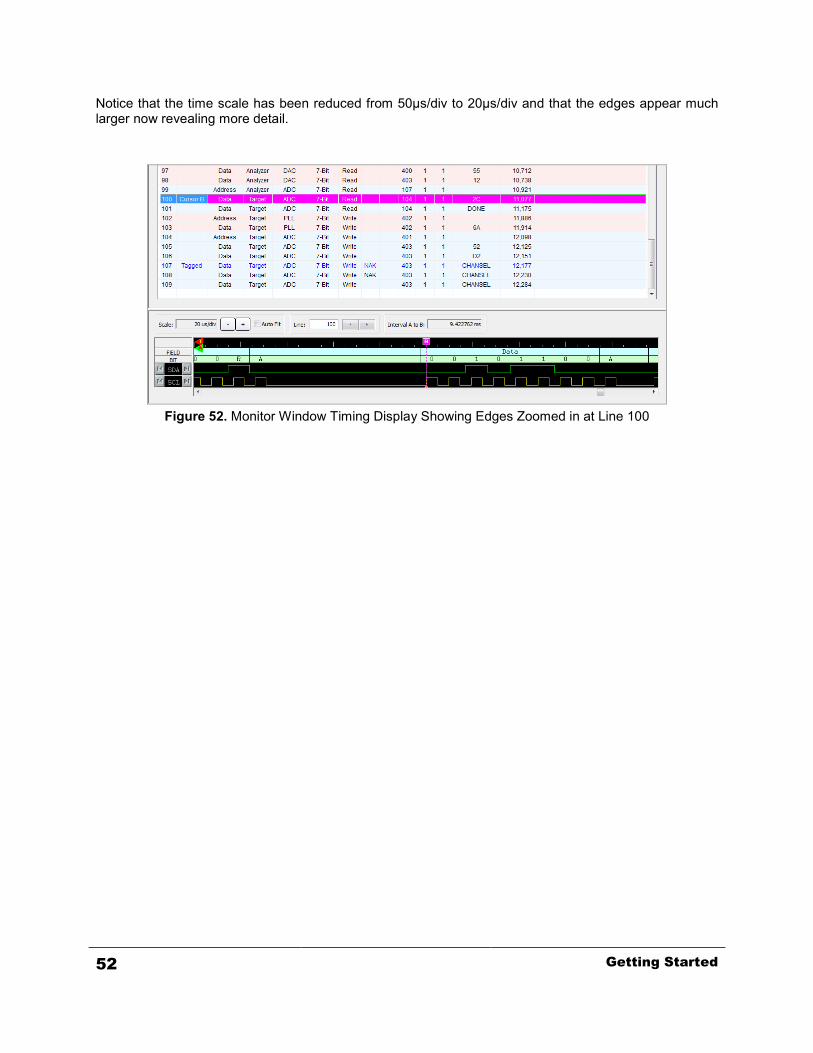
Notice that the time scale has been reduced from 50µs/div to 20µs/div and that the edges appear much larger now revealing more detail.
Figure 52. Monitor Window Timing Display Showing Edges Zoomed in at Line 100
52 Getting Started
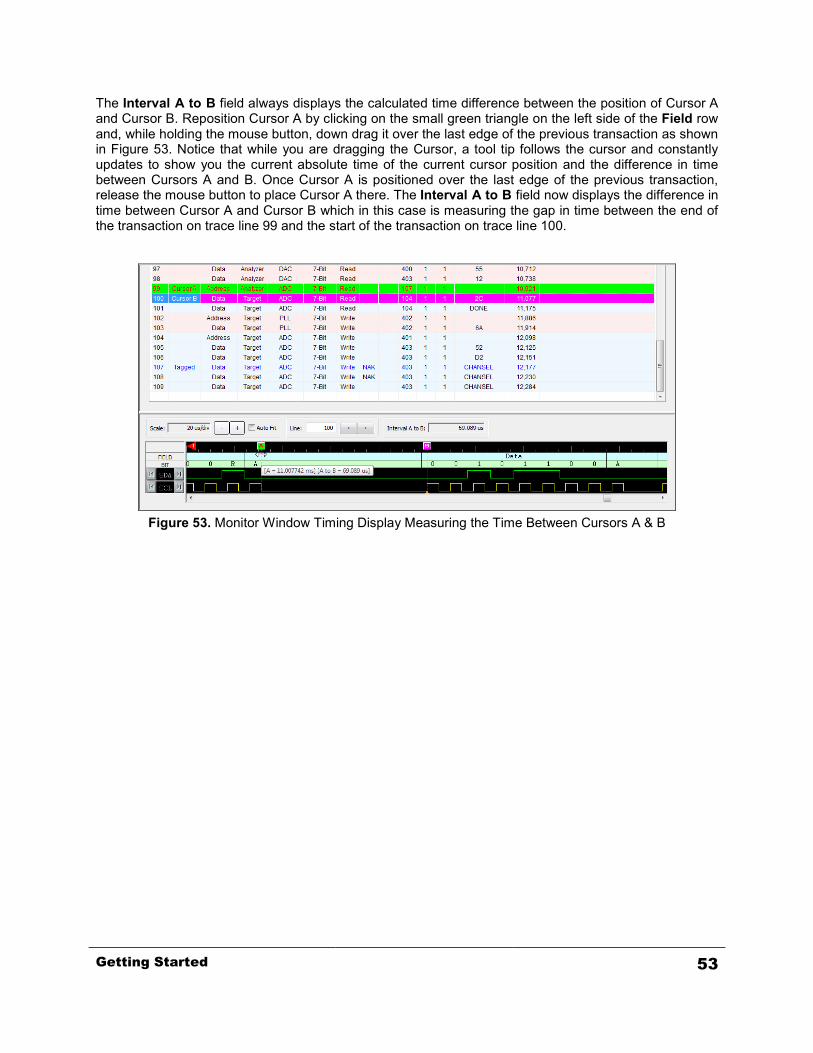
The Interval A to B field always displays the calculated time difference between the position of Cursor A and Cursor B. Reposition Cursor A by clicking on the small green triangle on the left side of the Field row and, while holding the mouse button, down drag it over the last edge of the previous transaction as shown in Figure 53. Notice that while you are dragging the Cursor, a tool tip follows the cursor and constantly updates to show you the current absolute time of the current cursor position and the difference in time between Cursors A and B. Once Cursor A is positioned over the last edge of the previous transaction, release the mouse button to place Cursor A there. The Interval A to B field now displays the difference in time between Cursor A and Cursor B which in this case is measuring the gap in time between the end of the transaction on trace line 99 and the start of the transaction on trace line 100.
Figure 53. Monitor Window Timing Display Measuring the Time Between Cursors A & B
Getting Started 53
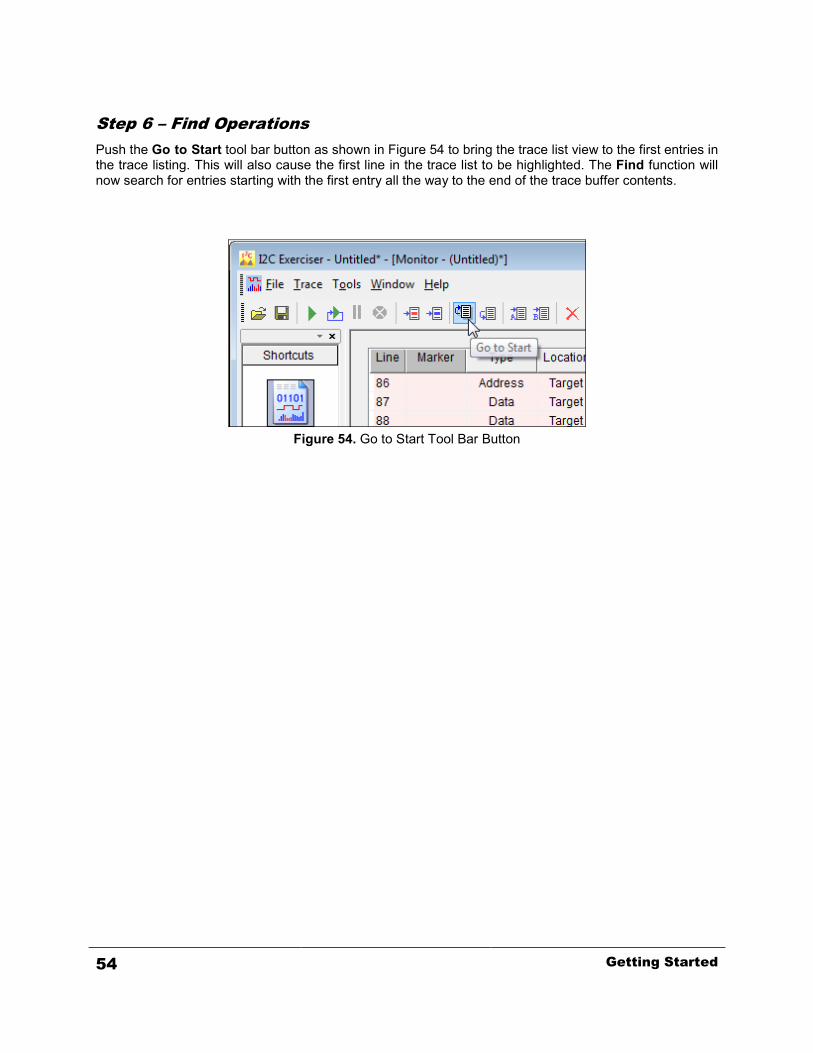
Step 6 – Find Operations Push the Go to Start tool bar button as shown in Figure 54 to bring the trace list view to the first entries in the trace listing. This will also cause the first line in the trace list to be highlighted. The Find function will now search for entries starting with the first entry all the way to the end of the trace buffer contents.
Figure 54. Go to Start Tool Bar Button
54 Getting Started
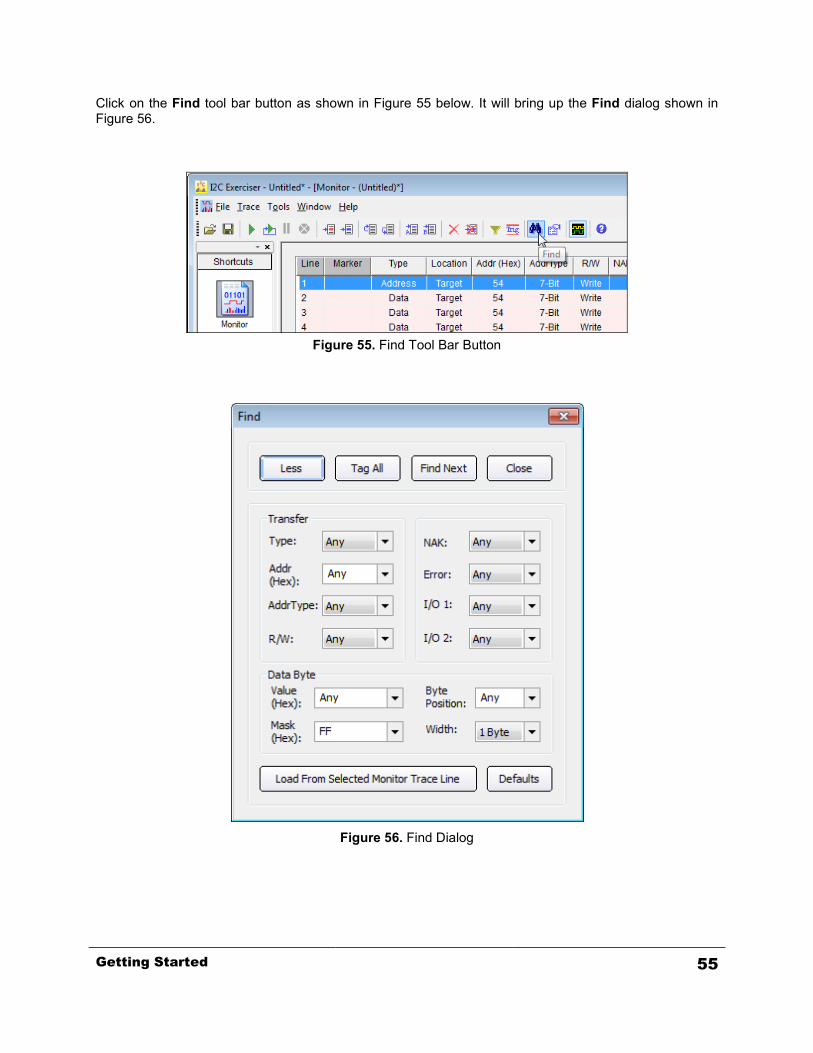
Click on the Find tool bar button as shown in Figure 55 below. It will bring up the Find dialog shown in Figure 56.
Figure 55. Find Tool Bar Button
Figure 56. Find Dialog
Getting Started 55

The Less button compacts this dialog to display only the four buttons on top to minimize any obscuring of the Monitor window. This is useful when you have configured the search parameters and want to repeat the same search query many times. While compacted, this button changes to More enabling the user to force the dialog back to its expanded format. The Tag All button launches a search throughout the trace buffer for the specified search criteria and will tag all lines which match. After this type of search is completed, you can use the Go to Tagged Row tool bar button on the Monitor window to easily locate and step through all of these lines. The Find Next button simply moves the Monitor trace list to the next found line matching the search criteria. This action can be repeated to locate all matching lines, but without tagging them. If the end of the buffer if reached, the search will wrap and continue at the start of the trace buffer. The various fields are intuitive for defining search criteria and allow searching over a wide range of conditions from very specific to entire classes of trace lines. The mask feature allows enabling/disabling individual bits when looking for a single-byte data pattern. The Byte Position indicates which data byte in a message is to be considered. The Width field may not be modified and is locked at one byte for search data values. When the user clicks on the Load From Selected Monitor Trace Line button, the characteristics of the currently selected line in the trace buffer are used to populate the Find dialog. The user can then tweak any needed changes to the search criteria fields. This facilitates searching for the same or similar lines throughout the trace buffer with a minimal amount of manual data entry. Each field’s pull-down will supply common selections, previously entered values, or defined symbols, as appropriate. Otherwise, type in the desired values.
56 Getting Started
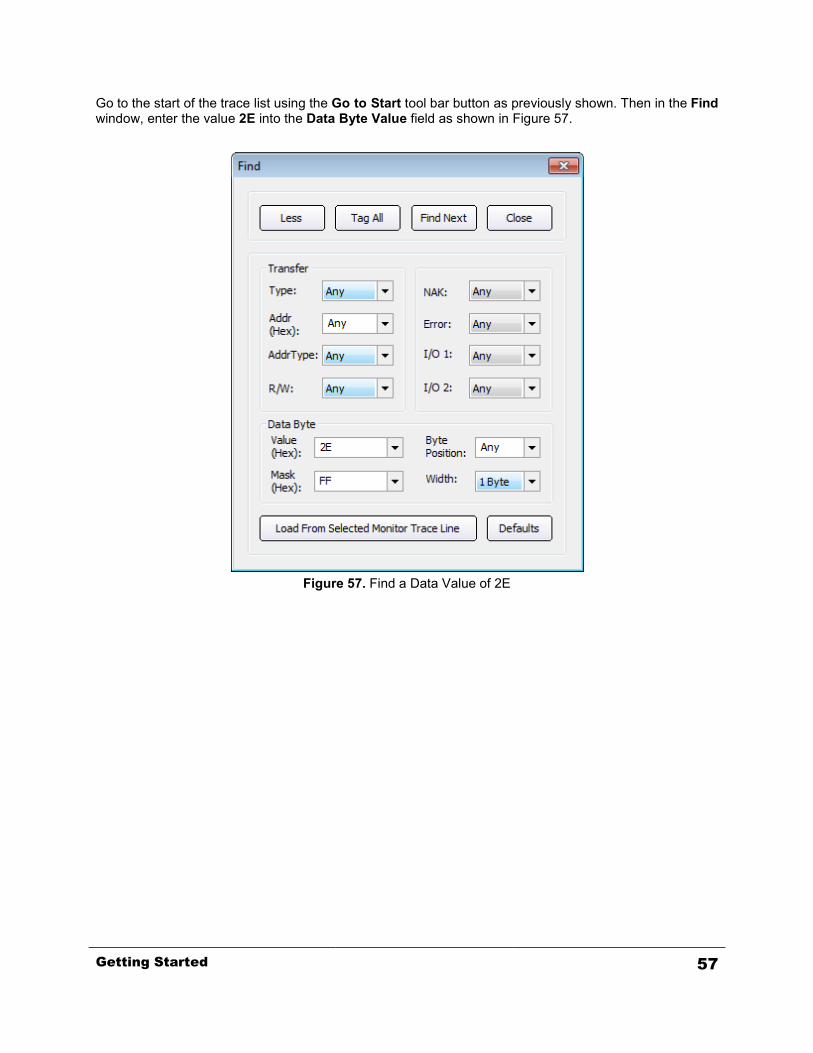
Go to the start of the trace list using the Go to Start tool bar button as previously shown. Then in the Find window, enter the value 2E into the Data Byte Value field as shown in Figure 57.
Figure 57. Find a Data Value of 2E
Getting Started 57

Click on the Find Next button and the trace listing will go to the only line containing this data value which is on line 13 as shown in Figure 58.
Figure 58. Monitor Window Trace List Showing Find 2E Data Result
58 Getting Started
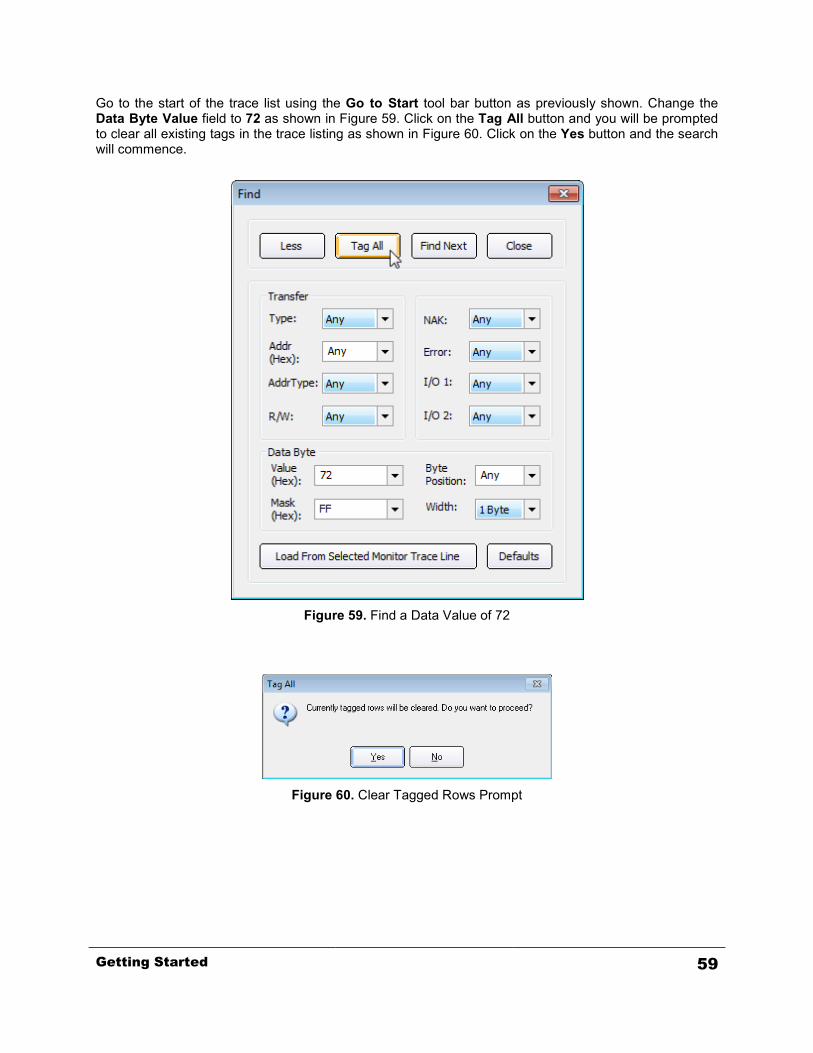
Go to the start of the trace list using the Go to Start tool bar button as previously shown. Change the Data Byte Value field to 72 as shown in Figure 59. Click on the Tag All button and you will be prompted to clear all existing tags in the trace listing as shown in Figure 60. Click on the Yes button and the search will commence.
Figure 59. Find a Data Value of 72
Figure 60. Clear Tagged Rows Prompt
Getting Started 59
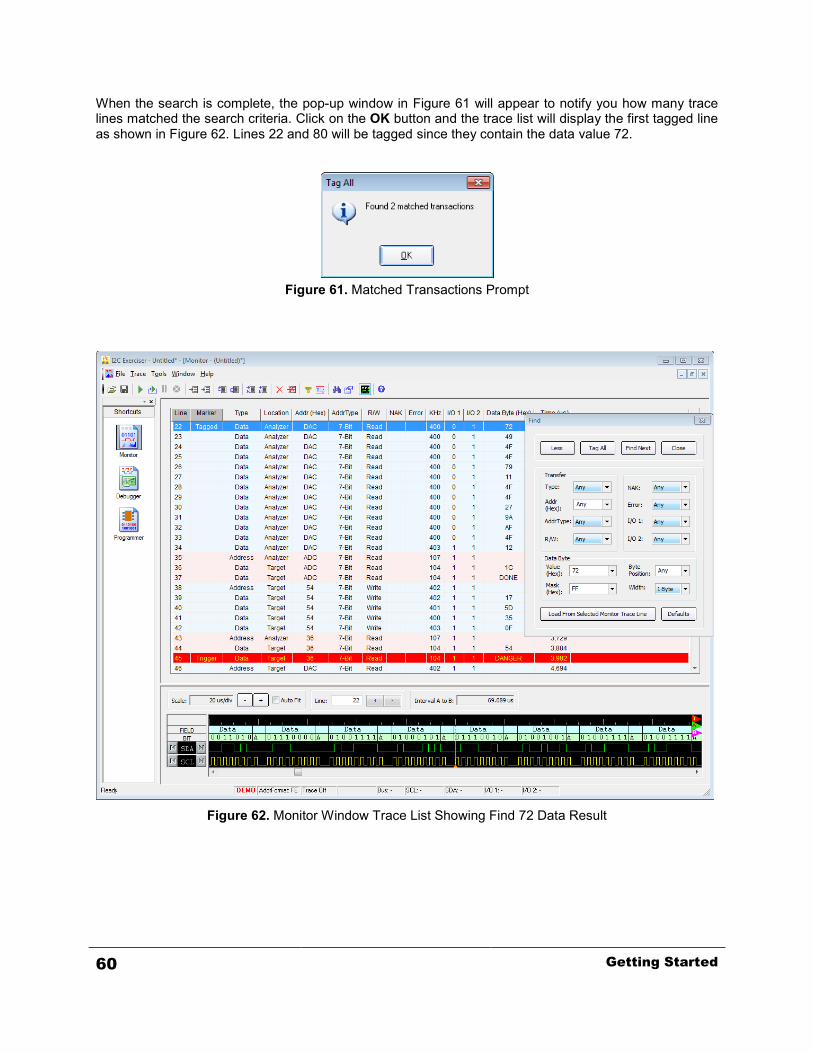
When the search is complete, the pop-up window in Figure 61 will appear to notify you how many trace lines matched the search criteria. Click on the OK button and the trace list will display the first tagged line as shown in Figure 62. Lines 22 and 80 will be tagged since they contain the data value 72.
Figure 61. Matched Transactions Prompt
Figure 62. Monitor Window Trace List Showing Find 72 Data Result
60 Getting Started
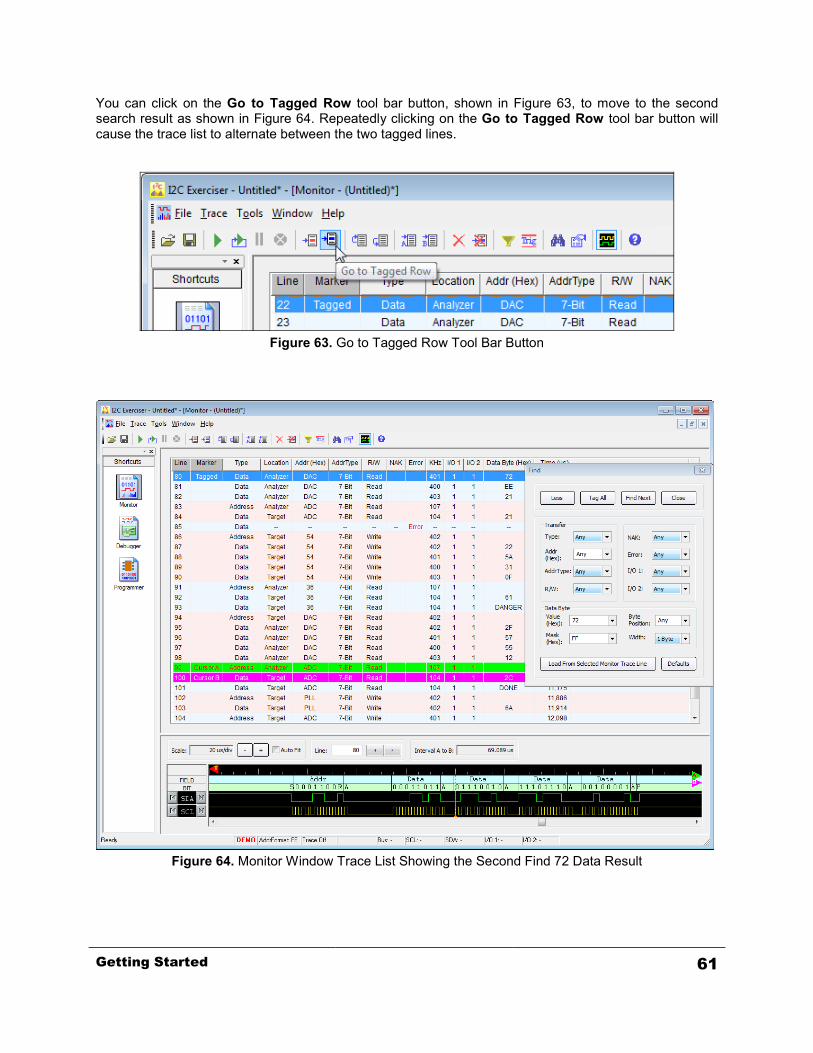
You can click on the Go to Tagged Row tool bar button, shown in Figure 63, to move to the second search result as shown in Figure 64. Repeatedly clicking on the Go to Tagged Row tool bar button will cause the trace list to alternate between the two tagged lines.
Figure 63. Go to Tagged Row Tool Bar Button
Figure 64. Monitor Window Trace List Showing the Second Find 72 Data Result
Getting Started 61
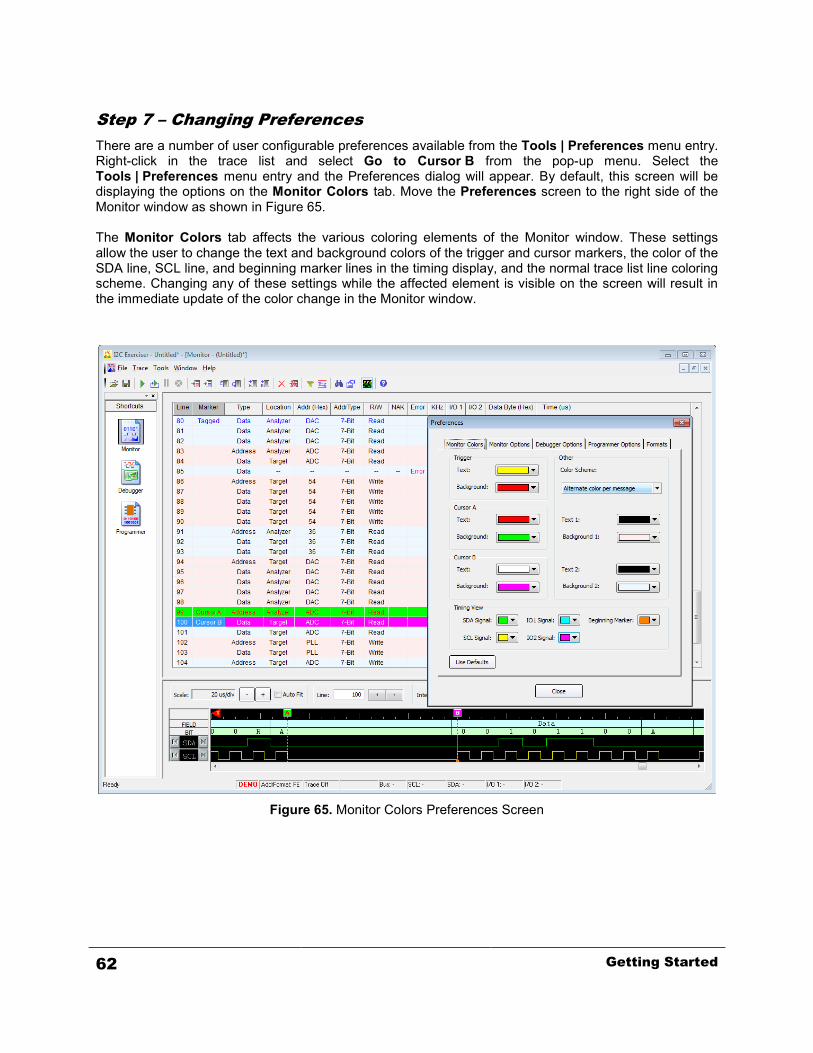
Step 7 – Changing Preferences There are a number of user configurable preferences available from the Tools | Preferences menu entry. Right-click in the trace list and select Go to Cursor B from the pop-up menu. Select the Tools | Preferences menu entry and the Preferences dialog will appear. By default, this screen will be displaying the options on the Monitor Colors tab. Move the Preferences screen to the right side of the Monitor window as shown in Figure 65. The Monitor Colors tab affects the various coloring elements of the Monitor window. These settings allow the user to change the text and background colors of the trigger and cursor markers, the color of the SDA line, SCL line, and beginning marker lines in the timing display, and the normal trace list line coloring scheme. Changing any of these settings while the affected element is visible on the screen will result in the immediate update of the color change in the Monitor window.
Figure 65. Monitor Colors Preferences Screen
62 Getting Started
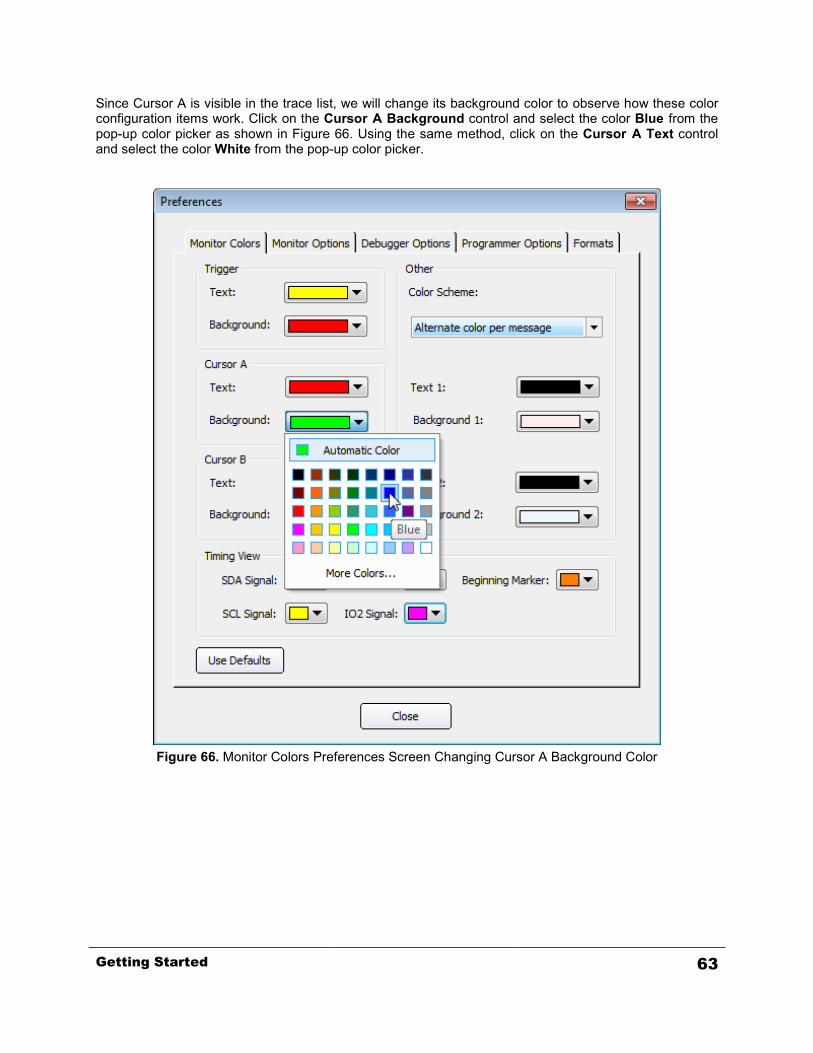
Since Cursor A is visible in the trace list, we will change its background color to observe how these color configuration items work. Click on the Cursor A Background control and select the color Blue from the pop-up color picker as shown in Figure 66. Using the same method, click on the Cursor A Text control and select the color White from the pop-up color picker.
Figure 66. Monitor Colors Preferences Screen Changing Cursor A Background Color
Getting Started 63
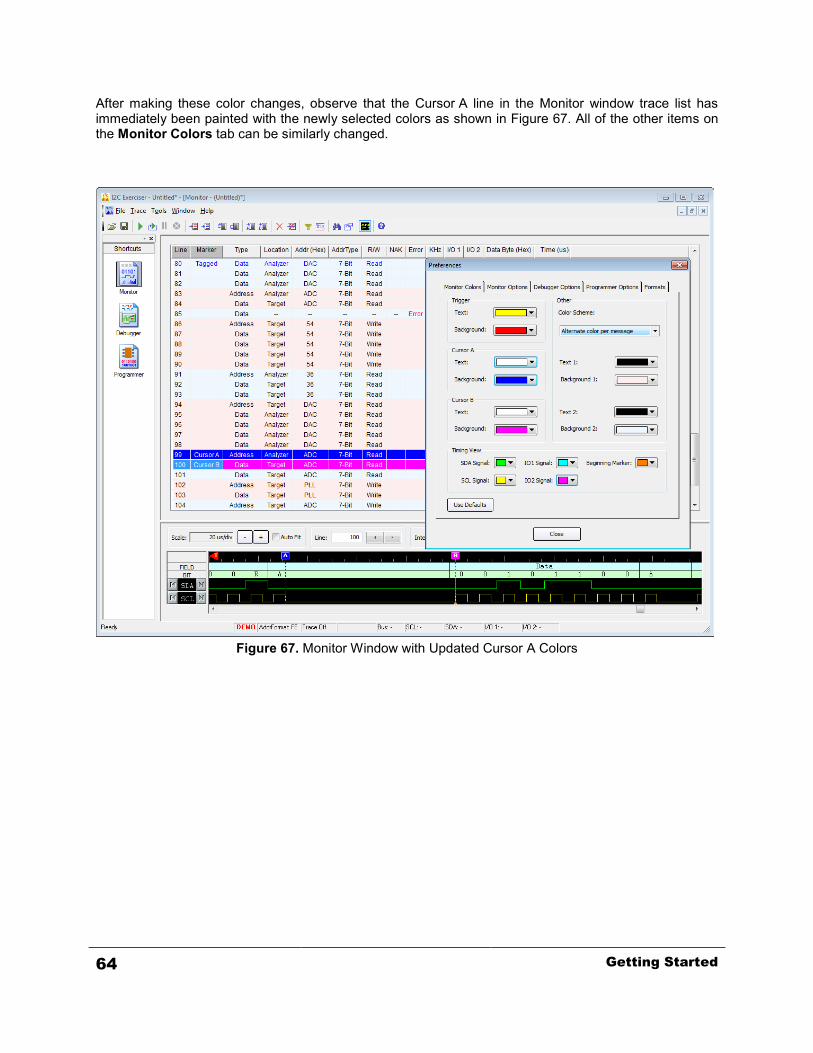
After making these color changes, observe that the Cursor A line in the Monitor window trace list has immediately been painted with the newly selected colors as shown in Figure 67. All of the other items on the Monitor Colors tab can be similarly changed.
Figure 67. Monitor Window with Updated Cursor A Colors
64 Getting Started
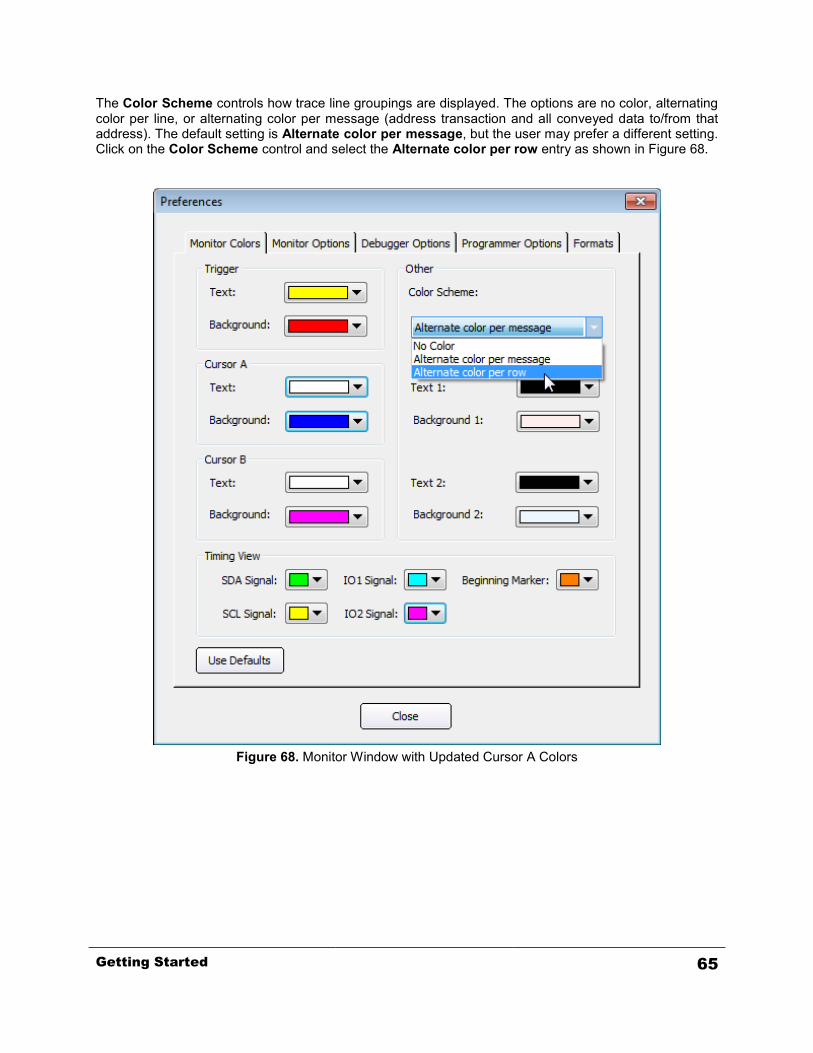
The Color Scheme controls how trace line groupings are displayed. The options are no color, alternating color per line, or alternating color per message (address transaction and all conveyed data to/from that address). The default setting is Alternate color per message, but the user may prefer a different setting. Click on the Color Scheme control and select the Alternate color per row entry as shown in Figure 68.
Figure 68. Monitor Window with Updated Cursor A Colors
Getting Started 65
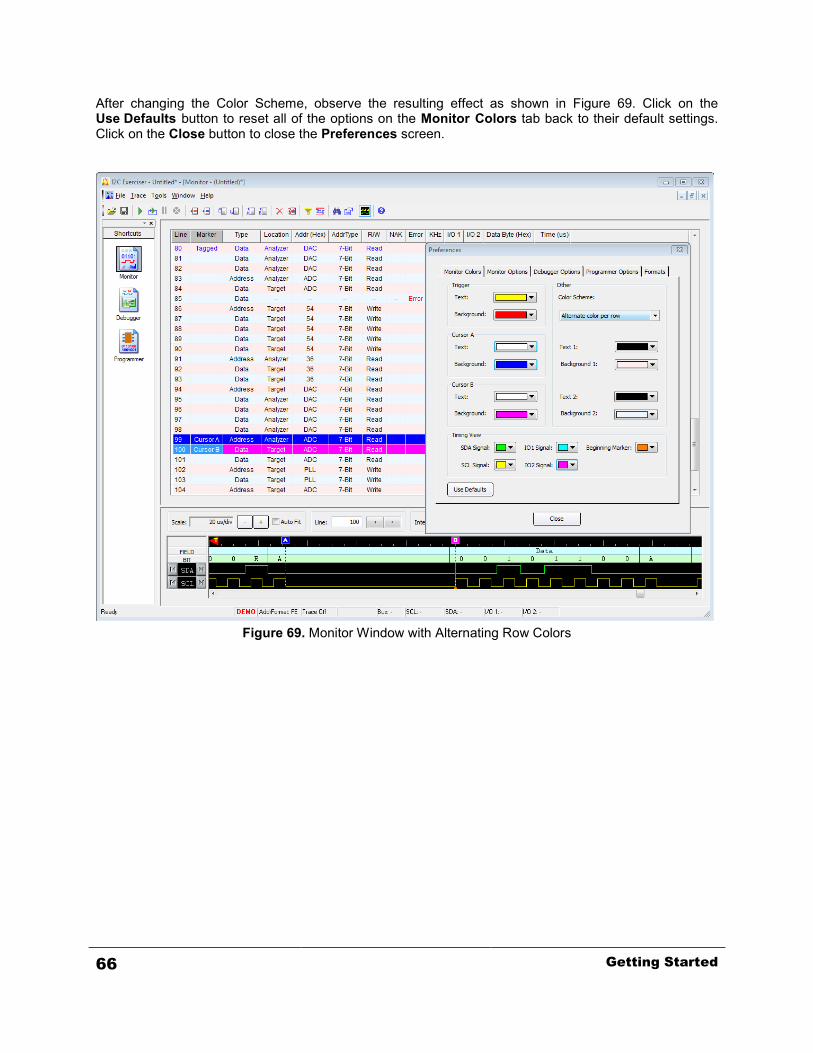
After changing the Color Scheme, observe the resulting effect as shown in Figure 69. Click on the Use Defaults button to reset all of the options on the Monitor Colors tab back to their default settings. Click on the Close button to close the Preferences screen.
Figure 69. Monitor Window with Alternating Row Colors
66 Getting Started
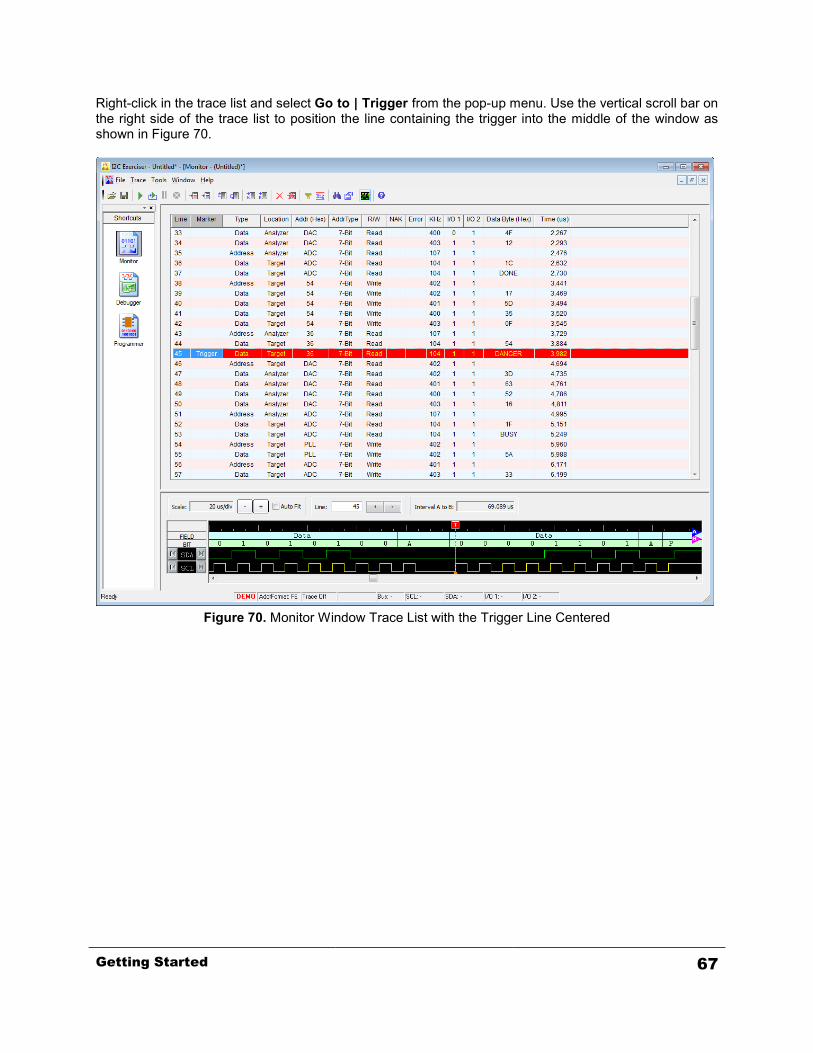
Right-click in the trace list and select Go to | Trigger from the pop-up menu. Use the vertical scroll bar on the right side of the trace list to position the line containing the trigger into the middle of the window as shown in Figure 70.
Figure 70. Monitor Window Trace List with the Trigger Line Centered
Getting Started 67
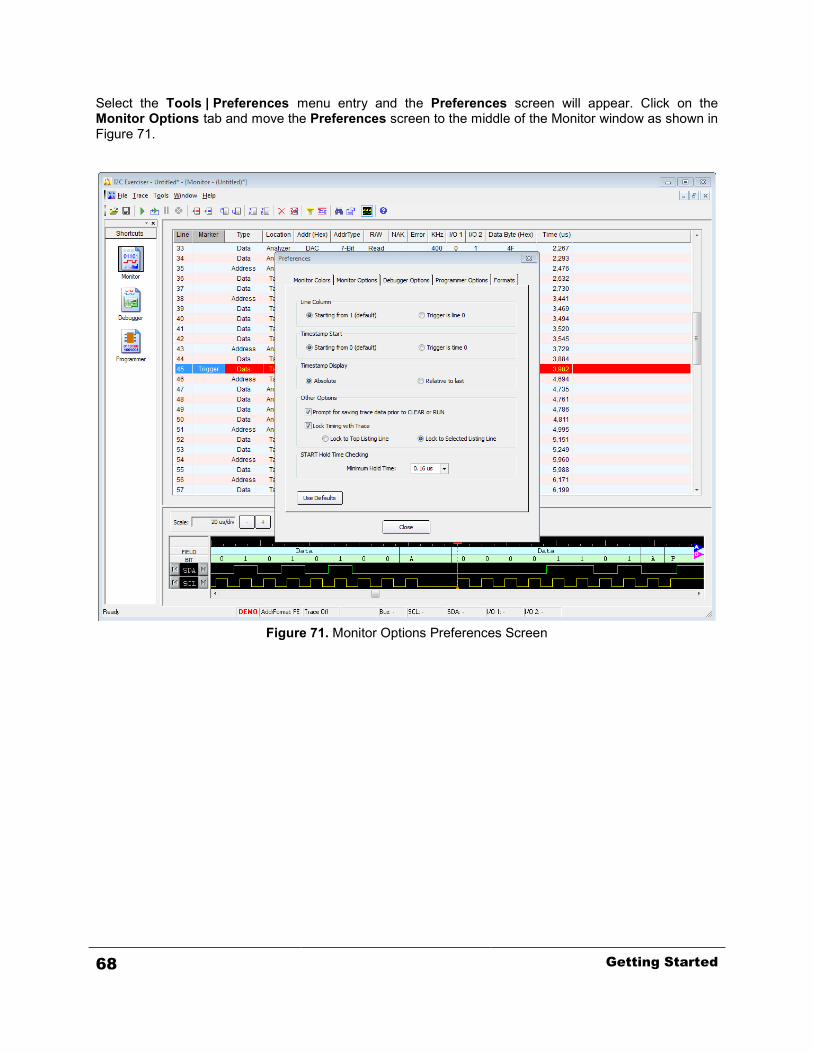
Select the Tools | Preferences menu entry and the Preferences screen will appear. Click on the Monitor Options tab and move the Preferences screen to the middle of the Monitor window as shown in Figure 71.
Figure 71. Monitor Options Preferences Screen
68 Getting Started

The Monitor Options tab allows configuration of other Monitor window display options. The Line Column option affects how the Line column in the trace list is displayed. When set to Starting from 1, the trace list rows will start at number one and increment sequentially. This is the default setting. When set to Trigger is line 0, the line containing the trigger will be zero, lines before the trigger will be negative, and lines after the trigger will be positive. Click on the Trigger is line 0 option, and observe how the Line number column changes around the Trigger line as shown in Figure 72.
Figure 72. Monitor Window Trace List with Trigger at Line Zero Numbering
Getting Started 69
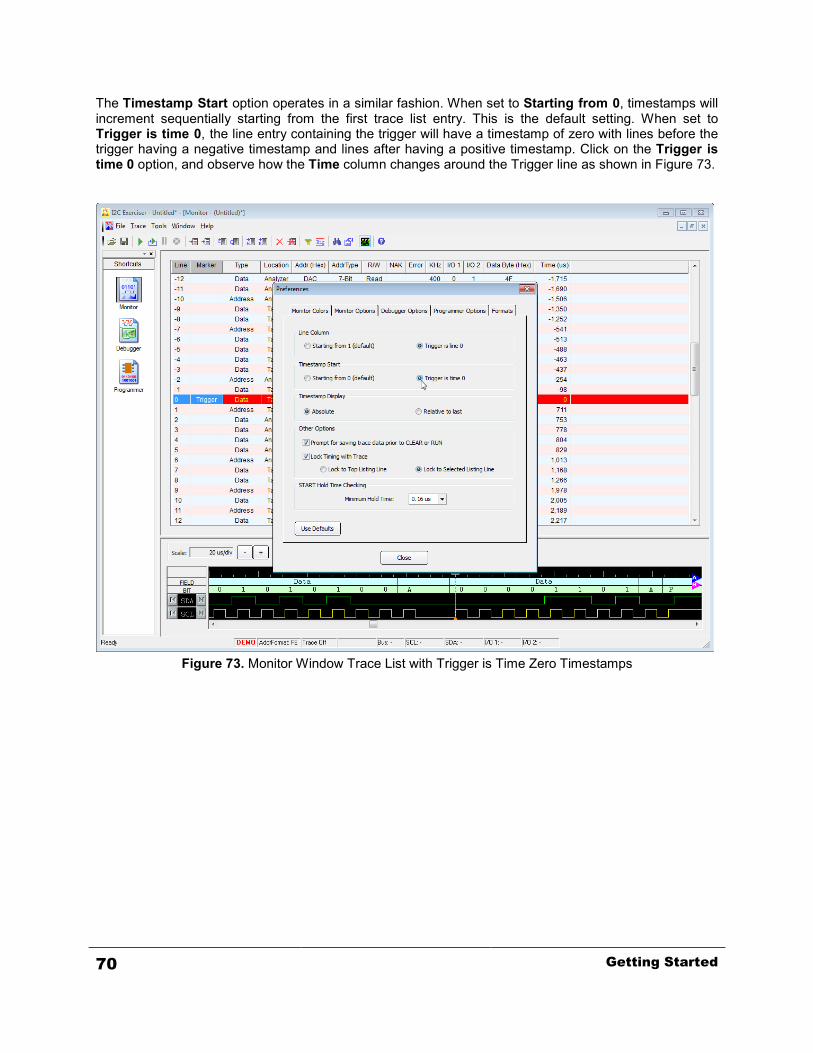
The Timestamp Start option operates in a similar fashion. When set to Starting from 0, timestamps will increment sequentially starting from the first trace list entry. This is the default setting. When set to Trigger is time 0, the line entry containing the trigger will have a timestamp of zero with lines before the trigger having a negative timestamp and lines after having a positive timestamp. Click on the Trigger is time 0 option, and observe how the Time column changes around the Trigger line as shown in Figure 73.
Figure 73. Monitor Window Trace List with Trigger is Time Zero Timestamps
70 Getting Started

The Timestamp Display option affects how timestamps are calculated and displayed. When set to Absolute, the timestamp displayed for each entry is the absolute time relative to the start of bus traffic acquisition. This is the default setting. When set to Relative, the timestamp displayed for each entry is the elapsed time since the last transaction was recorded. Click on the Relative option, and observe how the Time column changes around the Trigger line as shown in Figure 74.
Figure 74. Monitor Window Trace List with Relative Timestamps
There are several other miscellaneous options on this tab which will not be explored in this tutorial but are described in the Configuration and Preferences chapter. Click on the Use Default button to return the Monitor Options settings back to their default settings.
Getting Started 71

Click on the Preferences screen Formats tab and position the screen to the right of the Monitor window as shown in Figure 75. The Formats tab controls how addresses in 7-bit mode will be displayed when shown in hex format. In FE mode, the LSB will always be zero and the 7-bits of address will be left-justified within the byte. This is the default setting. In 7F mode, the MSB will always be zero and the 7-bits of address will be right-justified within the byte. Both of these formats are encountered in the I2C world, and the tool is flexible enough to use either format throughout.
Figure 75. Monitor Window Trace List Showing Addresses in FE mode
72 Getting Started
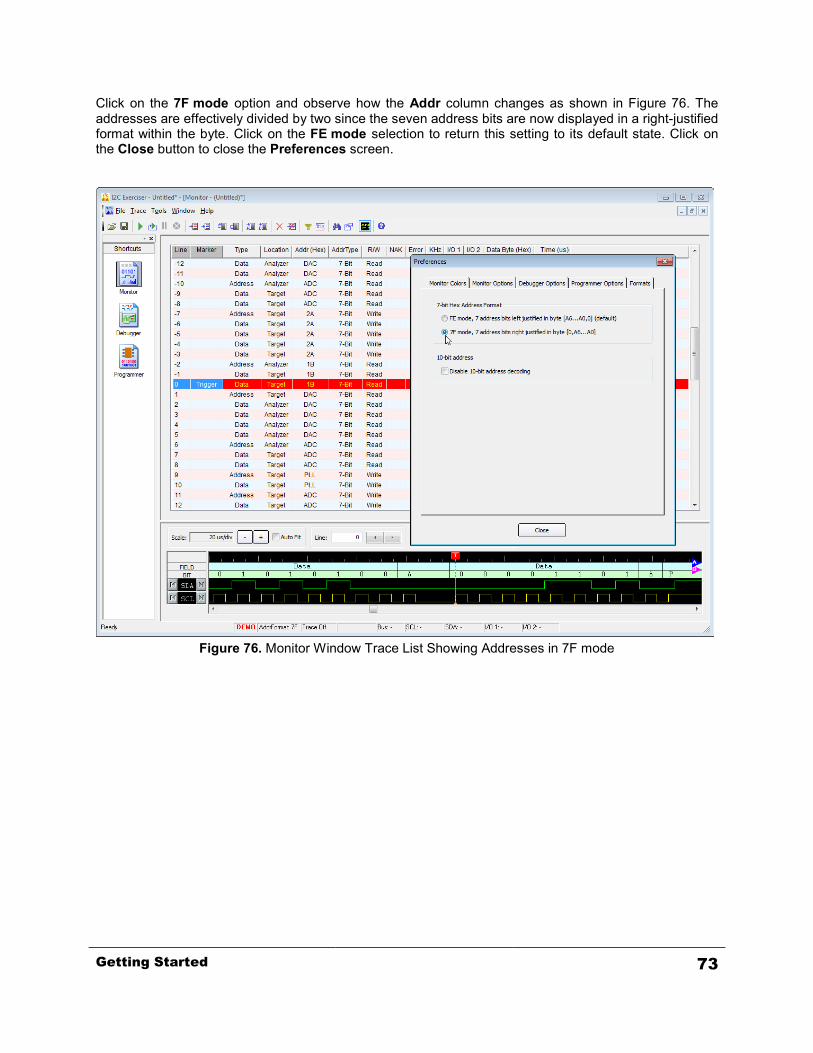
Click on the 7F mode option and observe how the Addr column changes as shown in Figure 76. The addresses are effectively divided by two since the seven address bits are now displayed in a right-justified format within the byte. Click on the FE mode selection to return this setting to its default state. Click on the Close button to close the Preferences screen.
Figure 76. Monitor Window Trace List Showing Addresses in 7F mode
Getting Started 73
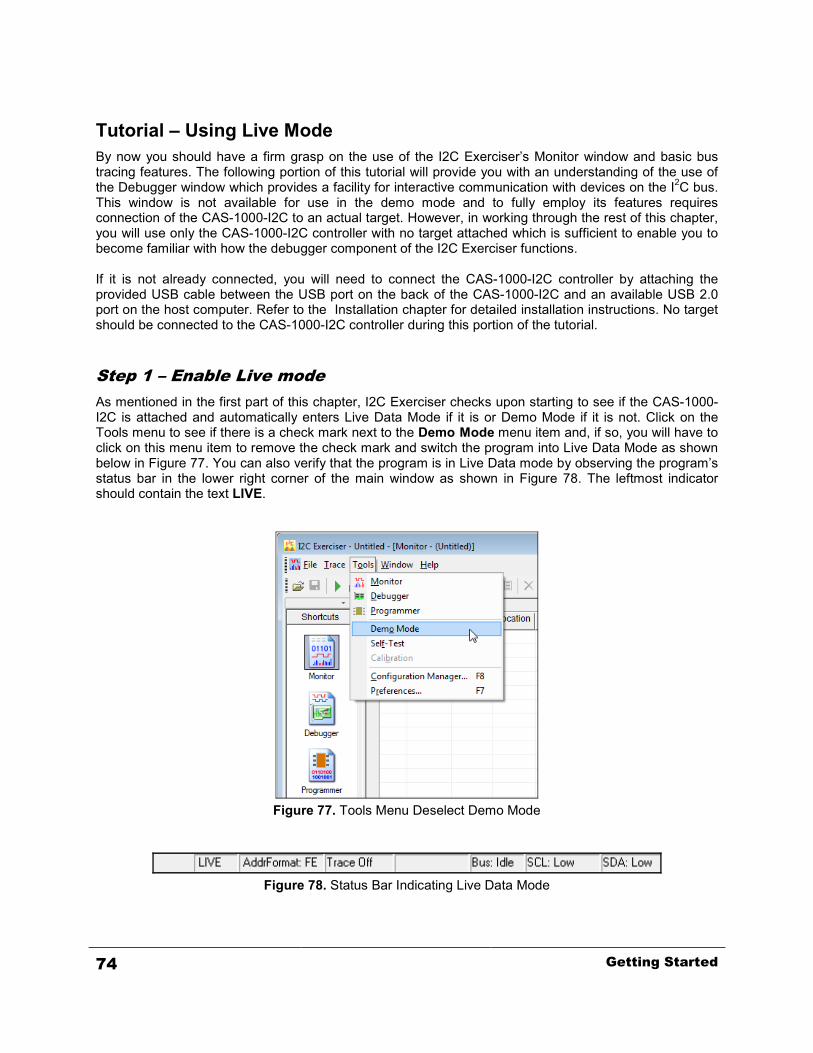
Tutorial – Using Live Mode By now you should have a firm grasp on the use of the I2C Exerciser’s Monitor window and basic bus tracing features. The following portion of this tutorial will provide you with an understanding of the use of the Debugger window which provides a facility for interactive communication with devices on the I2C bus. This window is not available for use in the demo mode and to fully employ its features requires connection of the CAS-1000-I2C to an actual target. However, in working through the rest of this chapter, you will use only the CAS-1000-I2C controller with no target attached which is sufficient to enable you to become familiar with how the debugger component of the I2C Exerciser functions. If it is not already connected, you will need to connect the CAS-1000-I2C controller by attaching the provided USB cable between the USB port on the back of the CAS-1000-I2C and an available USB 2.0 port on the host computer. Refer to the Installation chapter for detailed installation instructions. No target should be connected to the CAS-1000-I2C controller during this portion of the tutorial.
Step 1 – Enable Live mode As mentioned in the first part of this chapter, I2C Exerciser checks upon starting to see if the CAS-1000-I2C is attached and automatically enters Live Data Mode if it is or Demo Mode if it is not. Click on the Tools menu to see if there is a check mark next to the Demo Mode menu item and, if so, you will have to click on this menu item to remove the check mark and switch the program into Live Data Mode as shown below in Figure 77. You can also verify that the program is in Live Data mode by observing the program’s status bar in the lower right corner of the main window as shown in Figure 78. The leftmost indicator should contain the text LIVE.
Figure 77. Tools Menu Deselect Demo Mode
Figure 78. Status Bar Indicating Live Data Mode
74 Getting Started
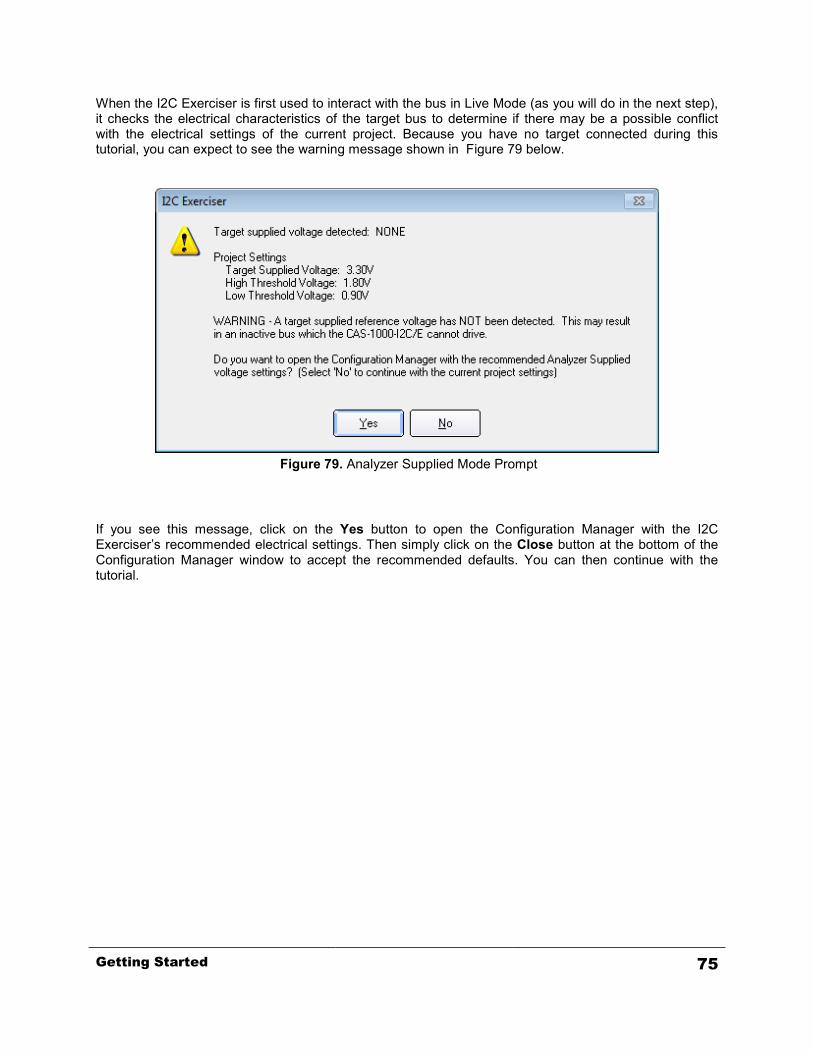
When the I2C Exerciser is first used to interact with the bus in Live Mode (as you will do in the next step), it checks the electrical characteristics of the target bus to determine if there may be a possible conflict with the electrical settings of the current project. Because you have no target connected during this tutorial, you can expect to see the warning message shown in Figure 79 below.
Figure 79. Analyzer Supplied Mode Prompt
If you see this message, click on the Yes button to open the Configuration Manager with the I2C Exerciser’s recommended electrical settings. Then simply click on the Close button at the bottom of the Configuration Manager window to accept the recommended defaults. You can then continue with the tutorial.
Getting Started 75

Step 2 – Send and Receive with Debugger Click on the Debugger icon in the shortcut bar on the far left side of the main window to open the Debugger window. Alternatively, you could select the Debugger entry from the Tools menu. The Debugger window will appear as shown in Figure 80 below. The left area of the Debugger window is for sending data to slave devices on the I2C bus and the right area for receiving data back from slave devices. You can see fields on both sides for specifying the bus address and address type. Both sides also have a No Stop checkbox that allows you to generate a message without a Stop cycle, if necessary, such that the next Address cycle will commence with a Repeated Start cycle. The Run field on the send side allows you to specify the number of times that debugger commands will be looped (including continuous looping). The Bytes field on the receive side lets you enter the number of bytes that you want to read from the slave device at the specified bus address.
Figure 80. Debugger Window
76 Getting Started
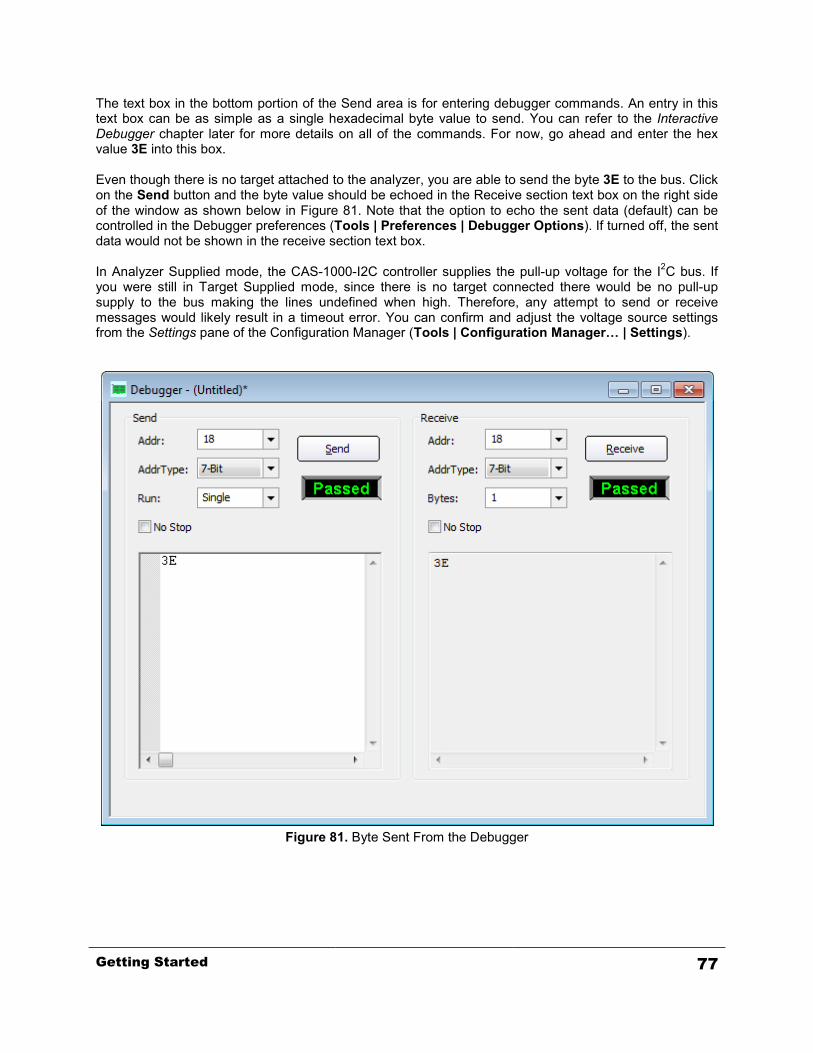
The text box in the bottom portion of the Send area is for entering debugger commands. An entry in this text box can be as simple as a single hexadecimal byte value to send. You can refer to the Interactive Debugger chapter later for more details on all of the commands. For now, go ahead and enter the hex value 3E into this box. Even though there is no target attached to the analyzer, you are able to send the byte 3E to the bus. Click on the Send button and the byte value should be echoed in the Receive section text box on the right side of the window as shown below in Figure 81. Note that the option to echo the sent data (default) can be controlled in the Debugger preferences (Tools | Preferences | Debugger Options). If turned off, the sent data would not be shown in the receive section text box. In Analyzer Supplied mode, the CAS-1000-I2C controller supplies the pull-up voltage for the I2C bus. If you were still in Target Supplied mode, since there is no target connected there would be no pull-up supply to the bus making the lines undefined when high. Therefore, any attempt to send or receive messages would likely result in a timeout error. You can confirm and adjust the voltage source settings from the Settings pane of the Configuration Manager (Tools | Configuration Manager… | Settings).
Figure 81. Byte Sent From the Debugger
Getting Started 77
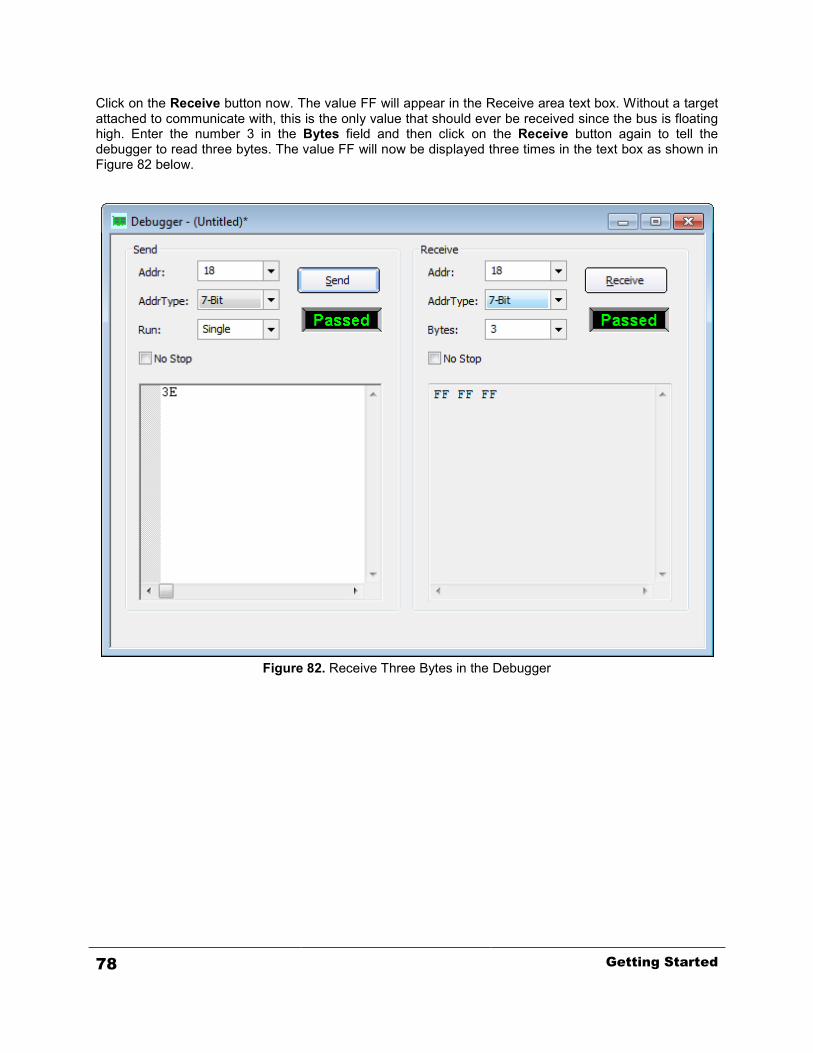
Click on the Receive button now. The value FF will appear in the Receive area text box. Without a target attached to communicate with, this is the only value that should ever be received since the bus is floating high. Enter the number 3 in the Bytes field and then click on the Receive button again to tell the debugger to read three bytes. The value FF will now be displayed three times in the text box as shown in Figure 82 below.
Figure 82. Receive Three Bytes in the Debugger
78 Getting Started
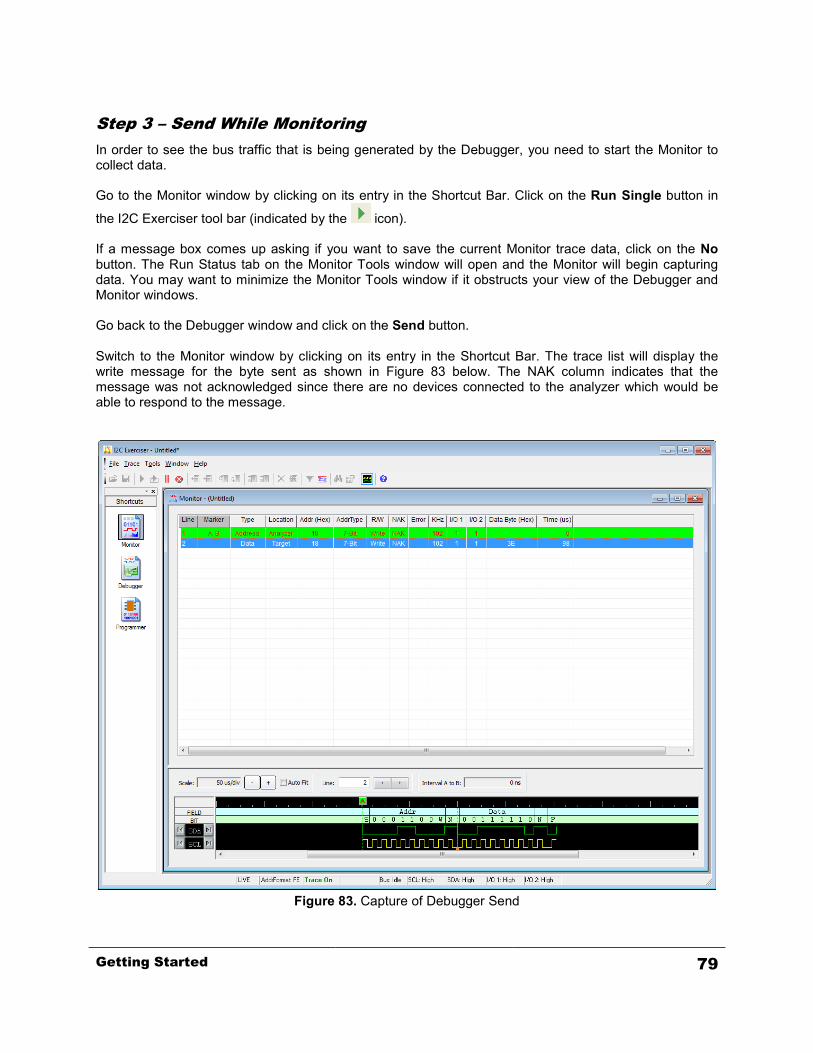
Step 3 – Send While Monitoring In order to see the bus traffic that is being generated by the Debugger, you need to start the Monitor to collect data. Go to the Monitor window by clicking on its entry in the Shortcut Bar. Click on the Run Single button in
the I2C Exerciser tool bar (indicated by the icon). If a message box comes up asking if you want to save the current Monitor trace data, click on the No button. The Run Status tab on the Monitor Tools window will open and the Monitor will begin capturing data. You may want to minimize the Monitor Tools window if it obstructs your view of the Debugger and Monitor windows. Go back to the Debugger window and click on the Send button. Switch to the Monitor window by clicking on its entry in the Shortcut Bar. The trace list will display the write message for the byte sent as shown in Figure 83 below. The NAK column indicates that the message was not acknowledged since there are no devices connected to the analyzer which would be able to respond to the message.
Figure 83. Capture of Debugger Send
Getting Started 79
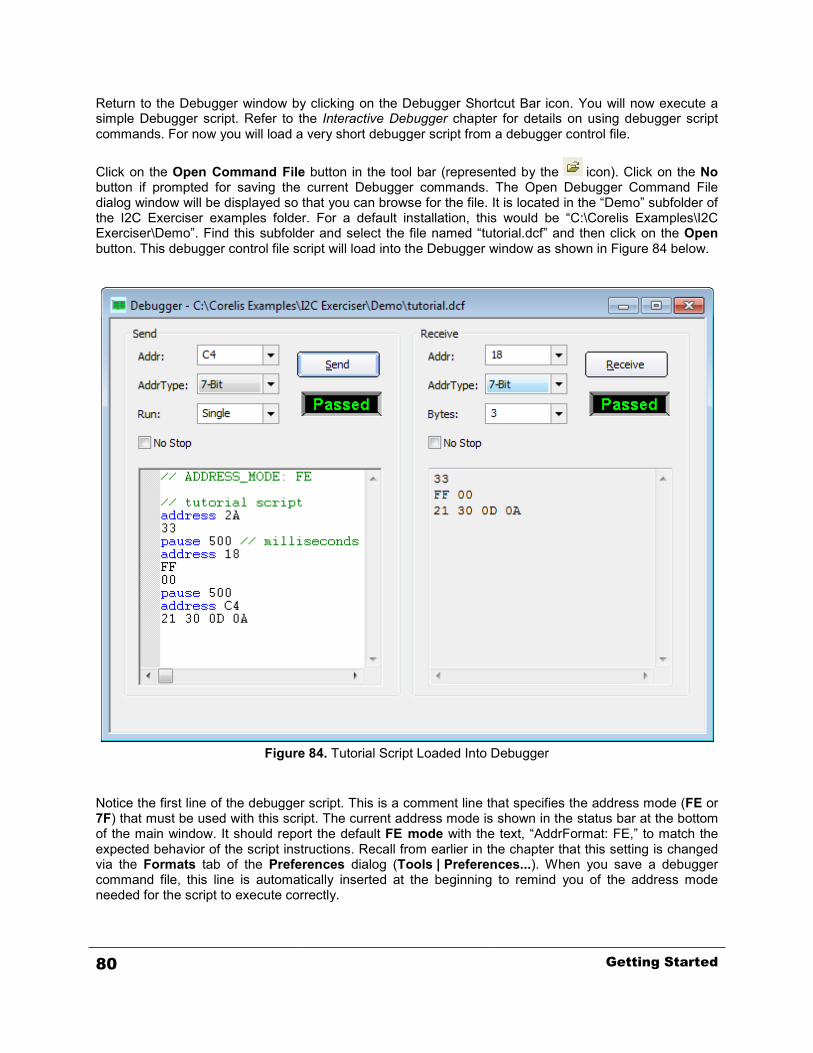
Return to the Debugger window by clicking on the Debugger Shortcut Bar icon. You will now execute a simple Debugger script. Refer to the Interactive Debugger chapter for details on using debugger script commands. For now you will load a very short debugger script from a debugger control file.
Click on the Open Command File button in the tool bar (represented by the icon). Click on the No button if prompted for saving the current Debugger commands. The Open Debugger Command File dialog window will be displayed so that you can browse for the file. It is located in the “Demo” subfolder of the I2C Exerciser examples folder. For a default installation, this would be “C:\Corelis Examples\I2C Exerciser\Demo”. Find this subfolder and select the file named “tutorial.dcf” and then click on the Open button. This debugger control file script will load into the Debugger window as shown in Figure 84 below.
Figure 84. Tutorial Script Loaded Into Debugger
Notice the first line of the debugger script. This is a comment line that specifies the address mode (FE or 7F) that must be used with this script. The current address mode is shown in the status bar at the bottom of the main window. It should report the default FE mode with the text, “AddrFormat: FE,” to match the expected behavior of the script instructions. Recall from earlier in the chapter that this setting is changed via the Formats tab of the Preferences dialog (Tools | Preferences...). When you save a debugger command file, this line is automatically inserted at the beginning to remind you of the address mode needed for the script to execute correctly.
80 Getting Started
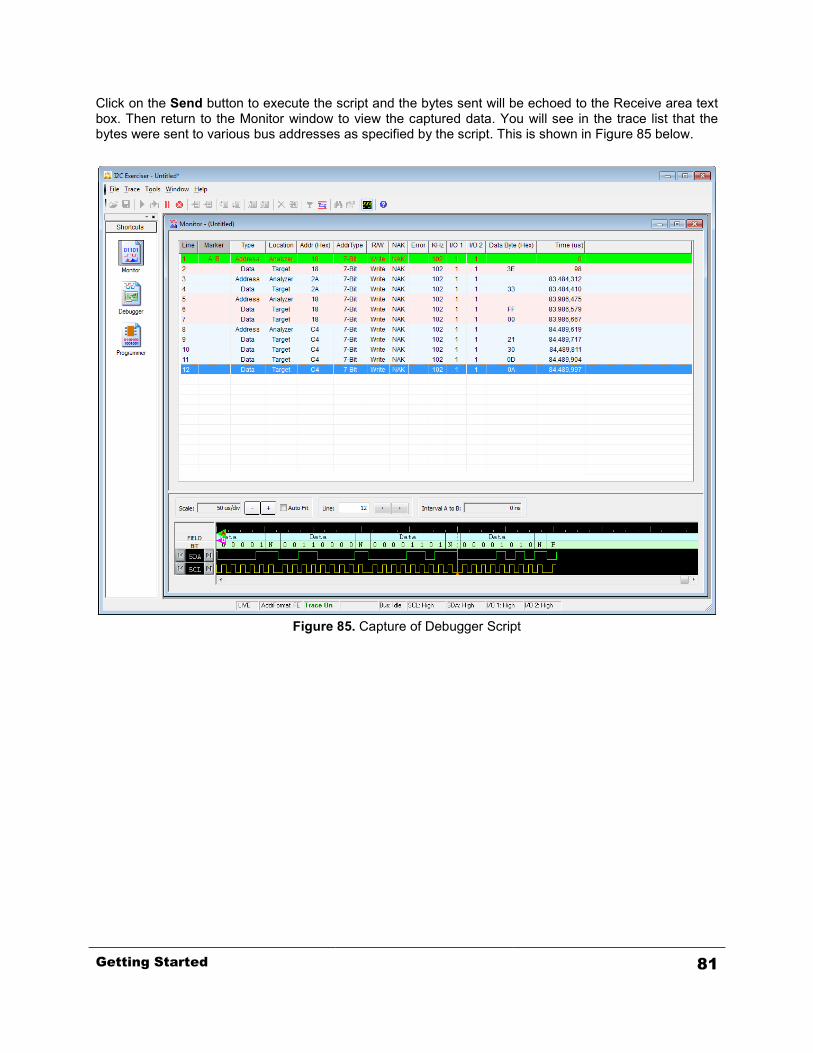
Click on the Send button to execute the script and the bytes sent will be echoed to the Receive area text box. Then return to the Monitor window to view the captured data. You will see in the trace list that the bytes were sent to various bus addresses as specified by the script. This is shown in Figure 85 below.
Figure 85. Capture of Debugger Script
Getting Started 81
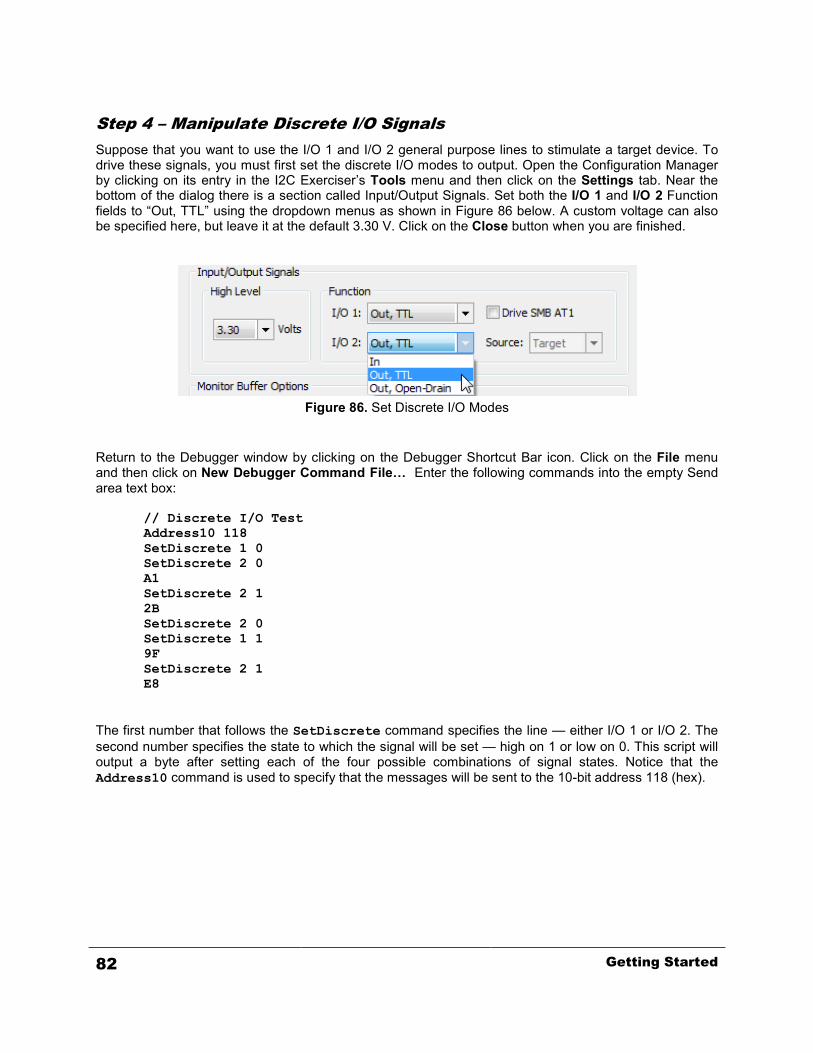
Step 4 – Manipulate Discrete I/O Signals Suppose that you want to use the I/O 1 and I/O 2 general purpose lines to stimulate a target device. To drive these signals, you must first set the discrete I/O modes to output. Open the Configuration Manager by clicking on its entry in the I2C Exerciser’s Tools menu and then click on the Settings tab. Near the bottom of the dialog there is a section called Input/Output Signals. Set both the I/O 1 and I/O 2 Function fields to “Out, TTL” using the dropdown menus as shown in Figure 86 below. A custom voltage can also be specified here, but leave it at the default 3.30 V. Click on the Close button when you are finished.
Figure 86. Set Discrete I/O Modes
Return to the Debugger window by clicking on the Debugger Shortcut Bar icon. Click on the File menu and then click on New Debugger Command File… Enter the following commands into the empty Send area text box:
// Discrete I/O Test Address10 118 SetDiscrete 1 0 SetDiscrete 2 0 A1 SetDiscrete 2 1 2B SetDiscrete 2 0 SetDiscrete 1 1 9F SetDiscrete 2 1 E8
The first number that follows the SetDiscrete command specifies the line — either I/O 1 or I/O 2. The second number specifies the state to which the signal will be set — high on 1 or low on 0. This script will output a byte after setting each of the four possible combinations of signal states. Notice that the Address10 command is used to specify that the messages will be sent to the 10-bit address 118 (hex).
82 Getting Started
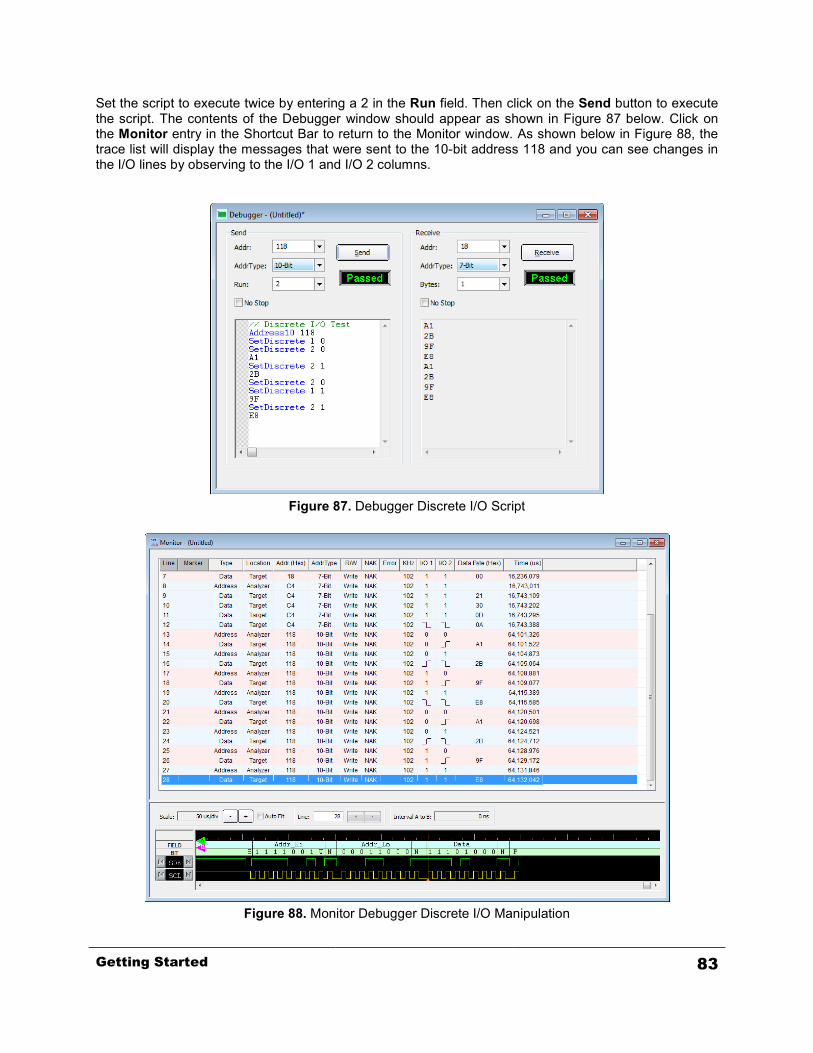
Set the script to execute twice by entering a 2 in the Run field. Then click on the Send button to execute the script. The contents of the Debugger window should appear as shown in Figure 87 below. Click on the Monitor entry in the Shortcut Bar to return to the Monitor window. As shown below in Figure 88, the trace list will display the messages that were sent to the 10-bit address 118 and you can see changes in the I/O lines by observing to the I/O 1 and I/O 2 columns.
Figure 87. Debugger Discrete I/O Script
Figure 88. Monitor Debugger Discrete I/O Manipulation
Getting Started 83
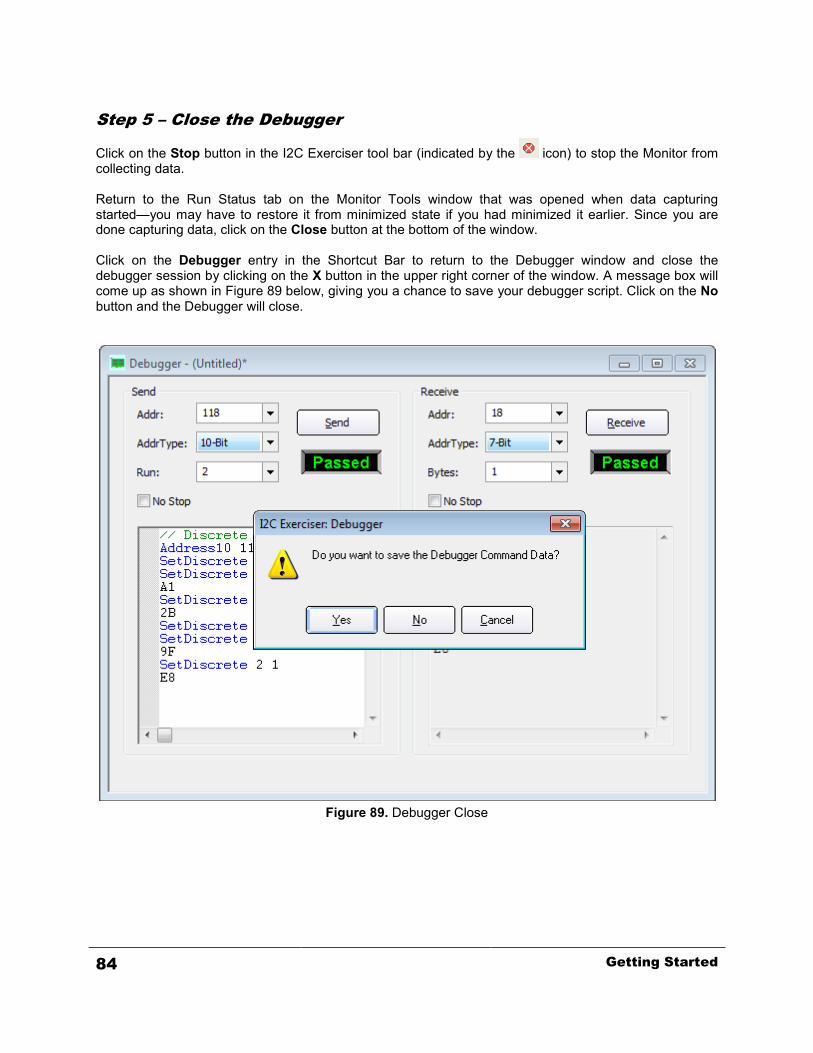
Step 5 – Close the Debugger
Click on the Stop button in the I2C Exerciser tool bar (indicated by the icon) to stop the Monitor from collecting data. Return to the Run Status tab on the Monitor Tools window that was opened when data capturing started—you may have to restore it from minimized state if you had minimized it earlier. Since you are done capturing data, click on the Close button at the bottom of the window. Click on the Debugger entry in the Shortcut Bar to return to the Debugger window and close the debugger session by clicking on the X button in the upper right corner of the window. A message box will come up as shown in Figure 89 below, giving you a chance to save your debugger script. Click on the No button and the Debugger will close.
Figure 89. Debugger Close
84 Getting Started
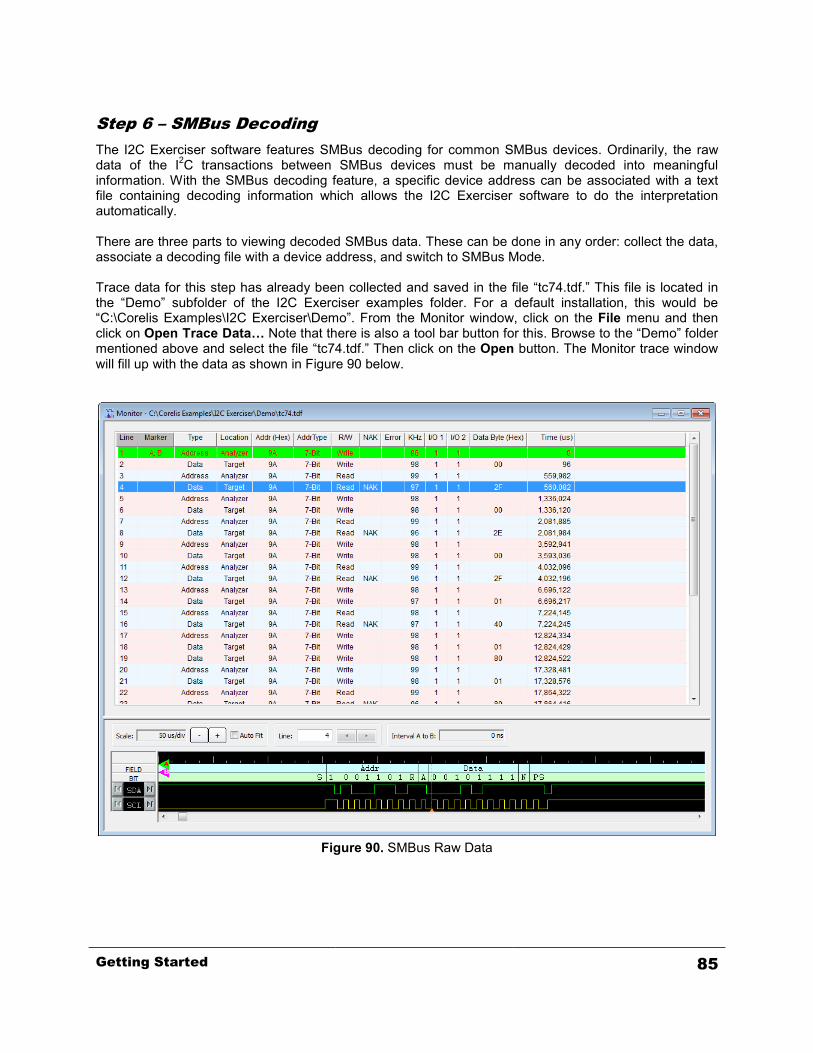
Step 6 – SMBus Decoding The I2C Exerciser software features SMBus decoding for common SMBus devices. Ordinarily, the raw data of the I2C transactions between SMBus devices must be manually decoded into meaningful information. With the SMBus decoding feature, a specific device address can be associated with a text file containing decoding information which allows the I2C Exerciser software to do the interpretation automatically. There are three parts to viewing decoded SMBus data. These can be done in any order: collect the data, associate a decoding file with a device address, and switch to SMBus Mode. Trace data for this step has already been collected and saved in the file “tc74.tdf.” This file is located in the “Demo” subfolder of the I2C Exerciser examples folder. For a default installation, this would be “C:\Corelis Examples\I2C Exerciser\Demo”. From the Monitor window, click on the File menu and then click on Open Trace Data… Note that there is also a tool bar button for this. Browse to the “Demo” folder mentioned above and select the file “tc74.tdf.” Then click on the Open button. The Monitor trace window will fill up with the data as shown in Figure 90 below.
Figure 90. SMBus Raw Data
Getting Started 85
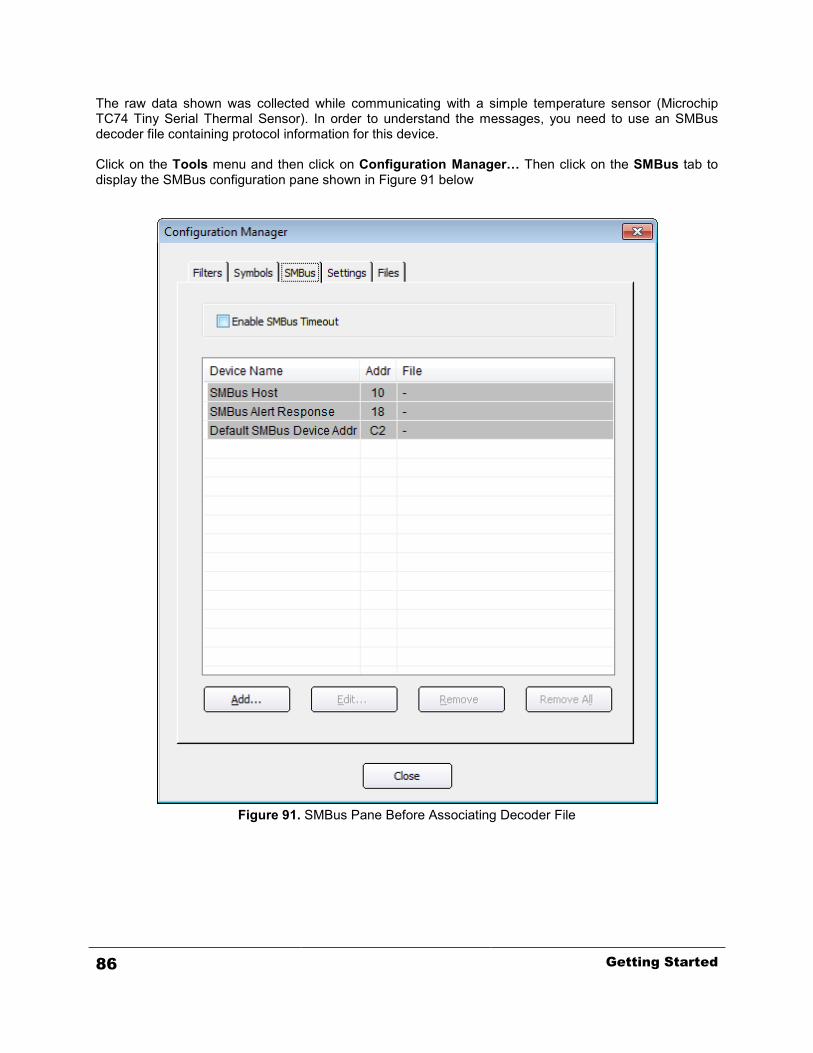
The raw data shown was collected while communicating with a simple temperature sensor (Microchip TC74 Tiny Serial Thermal Sensor). In order to understand the messages, you need to use an SMBus decoder file containing protocol information for this device. Click on the Tools menu and then click on Configuration Manager… Then click on the SMBus tab to display the SMBus configuration pane shown in Figure 91 below
Figure 91. SMBus Pane Before Associating Decoder File
86 Getting Started
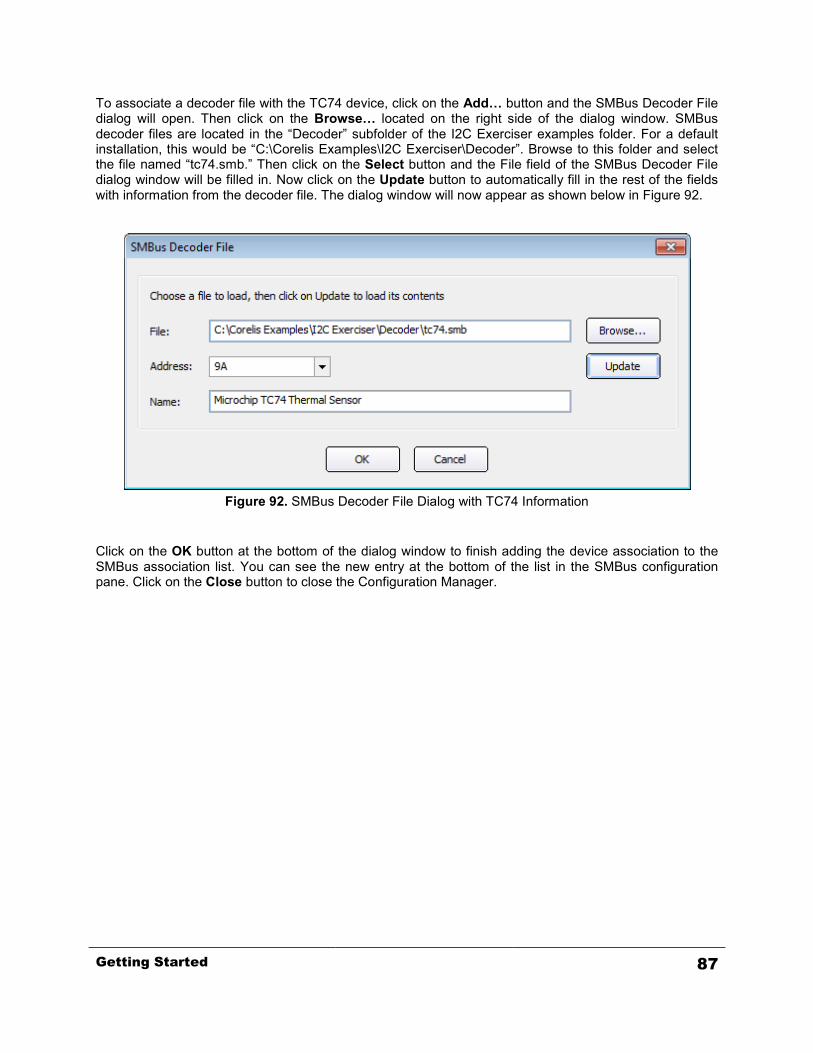
To associate a decoder file with the TC74 device, click on the Add… button and the SMBus Decoder File dialog will open. Then click on the Browse… located on the right side of the dialog window. SMBus decoder files are located in the “Decoder” subfolder of the I2C Exerciser examples folder. For a default installation, this would be “C:\Corelis Examples\I2C Exerciser\Decoder”. Browse to this folder and select the file named “tc74.smb.” Then click on the Select button and the File field of the SMBus Decoder File dialog window will be filled in. Now click on the Update button to automatically fill in the rest of the fields with information from the decoder file. The dialog window will now appear as shown below in Figure 92.
Figure 92. SMBus Decoder File Dialog with TC74 Information
Click on the OK button at the bottom of the dialog window to finish adding the device association to the SMBus association list. You can see the new entry at the bottom of the list in the SMBus configuration pane. Click on the Close button to close the Configuration Manager.
Getting Started 87
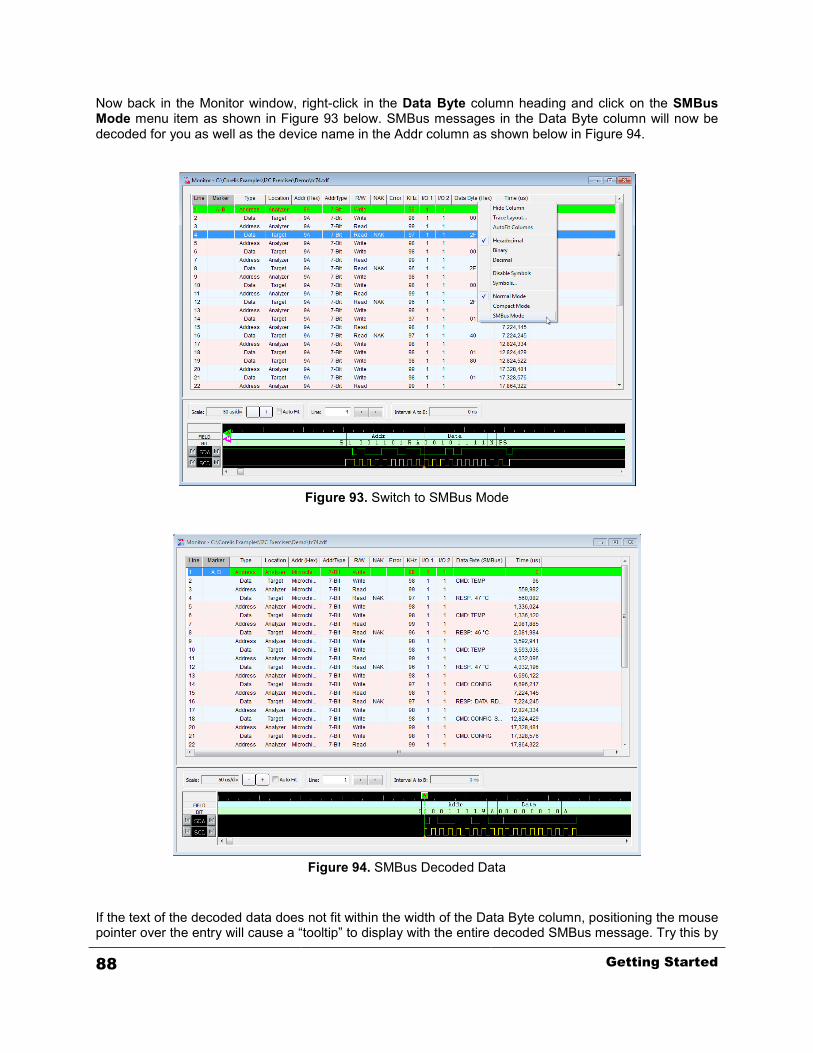
Now back in the Monitor window, right-click in the Data Byte column heading and click on the SMBus Mode menu item as shown in Figure 93 below. SMBus messages in the Data Byte column will now be decoded for you as well as the device name in the Addr column as shown below in Figure 94.
Figure 93. Switch to SMBus Mode
Figure 94. SMBus Decoded Data
If the text of the decoded data does not fit within the width of the Data Byte column, positioning the mouse pointer over the entry will cause a “tooltip” to display with the entire decoded SMBus message. Try this by
88 Getting Started
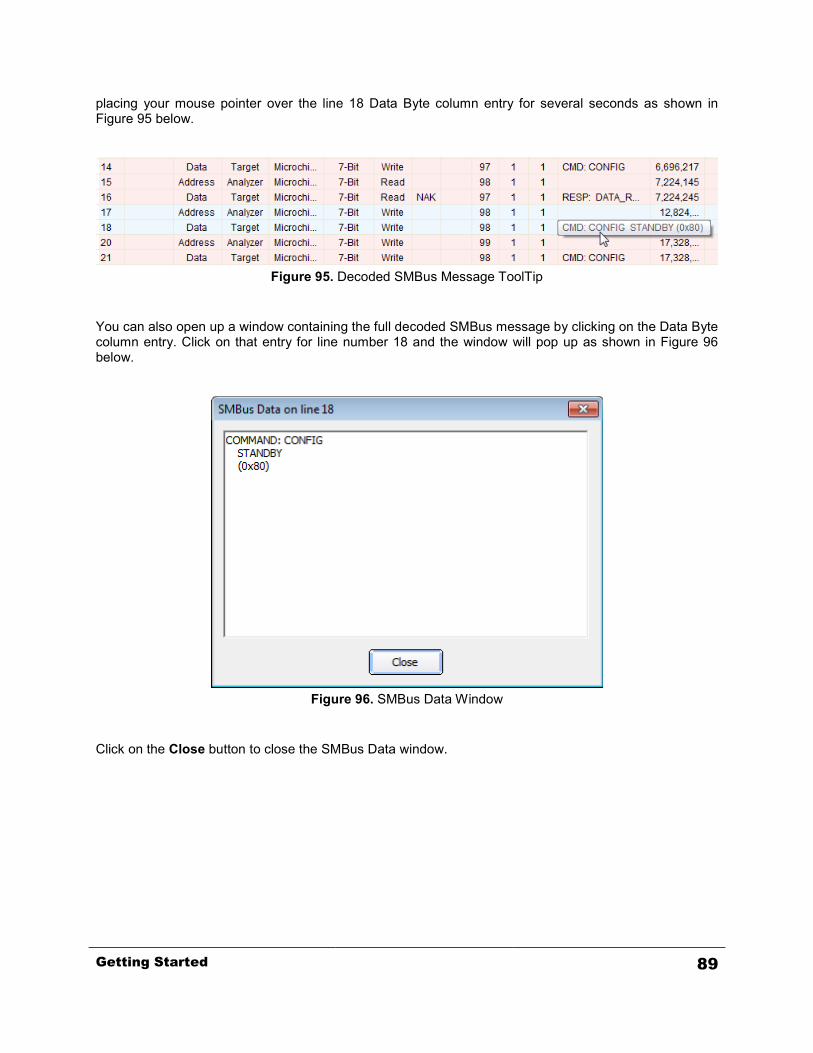
placing your mouse pointer over the line 18 Data Byte column entry for several seconds as shown in Figure 95 below.
Figure 95. Decoded SMBus Message ToolTip
You can also open up a window containing the full decoded SMBus message by clicking on the Data Byte column entry. Click on that entry for line number 18 and the window will pop up as shown in Figure 96 below.
Figure 96. SMBus Data Window
Click on the Close button to close the SMBus Data window.
Getting Started 89

This completes the I2C Exerciser tutorial. Please refer to chapters 5 and on for more detailed information on the I2C Exerciser graphical user interface.
90 Getting Started

Chapter 4 Connecting to a Target
CAS-1000-I2C analyzer connection instructions and pin assignments
Connecting the I2C Signals The CAS-1000-I2C connects to the target’s I2C bus through the RJ45 socket on the front panel labeled Serial Bus. This connector provides access to the I2C bus and discrete I/O signals. NOTE 1: The CAS-1000-I2C should not be connected to a target I2C bus without also being plugged in to the USB 2.0 port of a powered host PC, otherwise the target I2C bus may not function properly. NOTE 2: The RJ45 connector is not for Ethernet and should NEVER be mistakenly connected to a network. The only proper connection to the host PC is through the USB 2.0 port. Two types of test cables are available to plug into the Serial Bus connector according to your target needs. One, included in the standard CAS-1000-I2C package, terminates in sleeved flying leads with detachable mini clips for arbitrary target test point hookup. The pin assignments of this cable are presented in Table 2. The other optional cable terminates to a 4-pin crimp target connector that is compatible with the Philips I2C demo board. Table 3 shows the pin assignments of this cable. In addition, SMB connectors are provided to allow synchronization with external instruments. These connectors are labeled AT1 and AT2 on the CAS-1000-I2C front panel and are compatible with standard 50-ohm coaxial cables (not included).
RJ45Pin
Signal Name Signal Description Cable Wire Color Target End
Sleeve Color
1 I/O1 Programmable Input/Output White with Orange YELLOW
2 Reserved Orange -
3 GND White with Green BLACK *
4 SCL I2C Clock Blue RED
5 GND White with Blue BLACK *
6 SDA I2C Data Green BLUE
7 I/O2 Programmable Input/Output White with Brown WHITE
8 Reserved Brown -
* tied together into a single sleeve. Table 2. Flying Leads Serial Bus Connector Pin Assignments
Connecting to a Target 91
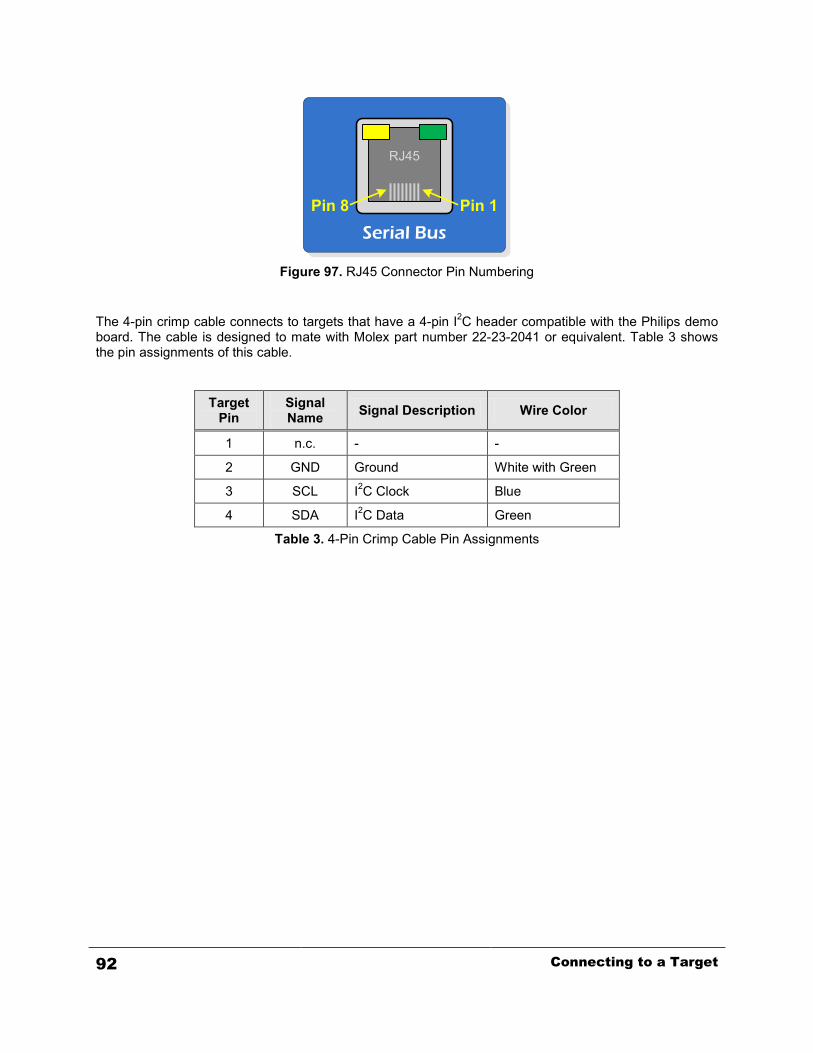
RJ45
Serial Bus
Pin 8 Pin 1
Figure 97. RJ45 Connector Pin Numbering
The 4-pin crimp cable connects to targets that have a 4-pin I2C header compatible with the Philips demo board. The cable is designed to mate with Molex part number 22-23-2041 or equivalent. Table 3 shows the pin assignments of this cable.
Target Pin
Signal Name Signal Description Wire Color
1 n.c. - -
2 GND Ground White with Green
3 SCL I2C Clock Blue
4 SDA I2C Data Green
Table 3. 4-Pin Crimp Cable Pin Assignments
92 Connecting to a Target

Interface Setup Aside from setting up the physical connections between the CAS-1000-I2C and the target I2C bus, it is important to set up various configuration options in the I2C Exerciser application so that the CAS-1000-I2C is ready to interface properly with the bus and commence traffic collection and viewing with minimal complications. The I2C Exerciser’s Configuration Manager provides access to these settings. Once configured by the user, most of the settings and custom preferences are conveniently saved by the I2C Exerciser with each project. A new project always begins with the CAS-1000-I2C’s factory default settings, but a previously saved project configuration file can be opened to load a particular saved setup. Important factors to consider when configuring the I2C Exerciser include:
• Whether a target is connected • Whether the target has its own pull-up voltage source • Whether the target is expected to exhibit slow signal rise-times (because of excessively high
capacitance or excessively high pull-up resistance) • Whether the target has a master lacking support for multi-master operation • What signal clock rate is supported by the target
When the CAS-1000-I2C analyzer is first used to interact with the target bus, it checks for a target supplied pull-up. If a target supplied pull-up is detected but the analyzer expects to provide the pull-up source, then a prompt will be displayed so that the analyzer may be set to not provide the pull-up source in order to avoid contention with the target. Conversely, if no target pull-up is detected and the analyzer is not set to provide the pull-up source, then a prompt will be displayed so that the analyzer may be set to provide the pull-up source for the bus.
Connecting to a Target 93
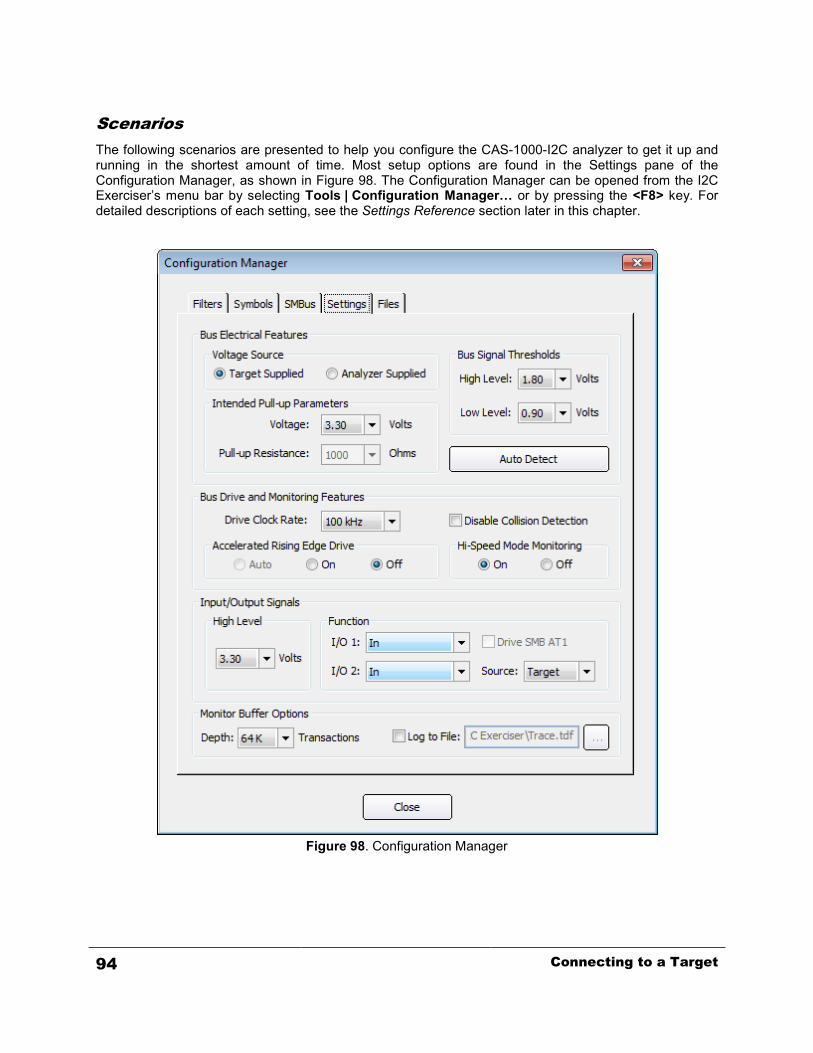
Scenarios The following scenarios are presented to help you configure the CAS-1000-I2C analyzer to get it up and running in the shortest amount of time. Most setup options are found in the Settings pane of the Configuration Manager, as shown in Figure 98. The Configuration Manager can be opened from the I2C Exerciser’s menu bar by selecting Tools | Configuration Manager… or by pressing the <F8> key. For detailed descriptions of each setting, see the Settings Reference section later in this chapter.
Figure 98. Configuration Manager
94 Connecting to a Target
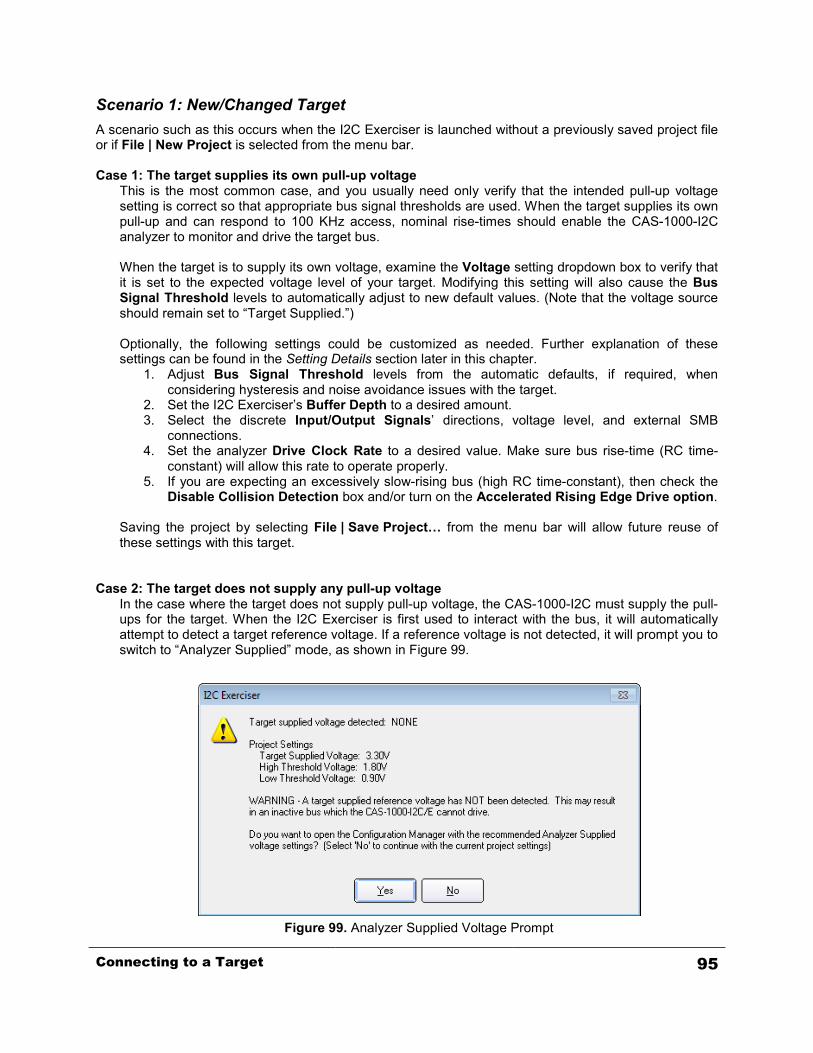
Scenario 1: New/Changed Target A scenario such as this occurs when the I2C Exerciser is launched without a previously saved project file or if File | New Project is selected from the menu bar. Case 1: The target supplies its own pull-up voltage
This is the most common case, and you usually need only verify that the intended pull-up voltage setting is correct so that appropriate bus signal thresholds are used. When the target supplies its own pull-up and can respond to 100 KHz access, nominal rise-times should enable the CAS-1000-I2C analyzer to monitor and drive the target bus. When the target is to supply its own voltage, examine the Voltage setting dropdown box to verify that it is set to the expected voltage level of your target. Modifying this setting will also cause the Bus Signal Threshold levels to automatically adjust to new default values. (Note that the voltage source should remain set to “Target Supplied.”) Optionally, the following settings could be customized as needed. Further explanation of these settings can be found in the Setting Details section later in this chapter.
1. Adjust Bus Signal Threshold levels from the automatic defaults, if required, when considering hysteresis and noise avoidance issues with the target.
2. Set the I2C Exerciser’s Buffer Depth to a desired amount. 3. Select the discrete Input/Output Signals’ directions, voltage level, and external SMB
connections. 4. Set the analyzer Drive Clock Rate to a desired value. Make sure bus rise-time (RC time-
constant) will allow this rate to operate properly. 5. If you are expecting an excessively slow-rising bus (high RC time-constant), then check the
Disable Collision Detection box and/or turn on the Accelerated Rising Edge Drive option.
Saving the project by selecting File | Save Project… from the menu bar will allow future reuse of these settings with this target.
Case 2: The target does not supply any pull-up voltage
In the case where the target does not supply pull-up voltage, the CAS-1000-I2C must supply the pull-ups for the target. When the I2C Exerciser is first used to interact with the bus, it will automatically attempt to detect a target reference voltage. If a reference voltage is not detected, it will prompt you to switch to “Analyzer Supplied” mode, as shown in Figure 99.
Figure 99. Analyzer Supplied Voltage Prompt
Connecting to a Target 95

Click on the Yes button to allow the application to automatically switch to “Analyzer Supplied” from the “Target Supplied” setting and the Configuration Manager will open for you to review the new settings. Additionally, you can select the desired bus pull-up resistance and voltage, as well as change the settings described in Case 1 above. Note that the Pull-up Resistance setting is enabled only when the Analyzer Supplied voltage source is selected, as seen in Figure 100. When the CAS-1000-I2C is to supply pull-ups, examine the following settings:
1. Make sure that the Analyzer Supplied radio button is selected. 2. Select an appropriate pull-up Voltage for the bus. 3. Select the bus Pull-up Resistance (this is for both the SCL and the SDA signal), taking into
consideration its capacitance (keep RC time constant small enough for expected SCL rates).
Figure 100. Configuration Manager Analyzer Supplied
96 Connecting to a Target

Auto Detect At any time, you may have the I2C Exerciser check for a voltage on the target bus and automatically pick recommended default electrical settings for you by clicking on the Auto Detect button in the Configuration Manager Settings pane.
Scenario 2: Previously Tested Target This scenario occurs when you load a previously saved project file either during launch of the application or by selecting File | Open Project from the menu bar. Since the software has already saved the settings for the target bus in the project file, no additional setup should be necessary. Scenario 3: No Target This scenario occurs when no target is attached to the bus. Because a nonexistent target means that there will be a lack of pull-up voltage, the software will behave as in Case 2 of Scenario 1 above. Depending on whether the program is already set up, you will either perform the necessary setup or do nothing at all. Case 1: Program not set up When you first try to interact with the bus, a reference voltage will not be detected and you will be prompted to change to Analyzer Supplied. Select Yes and follow the steps in Case 2 of Scenario 1 described above. With no target attached, the CAS-1000-I2C will effectively talk to itself. Case 2: Program already set up If the program is already set up, such as from a loaded project or from prior usage, you should not need to do anything.
Connecting to a Target 97
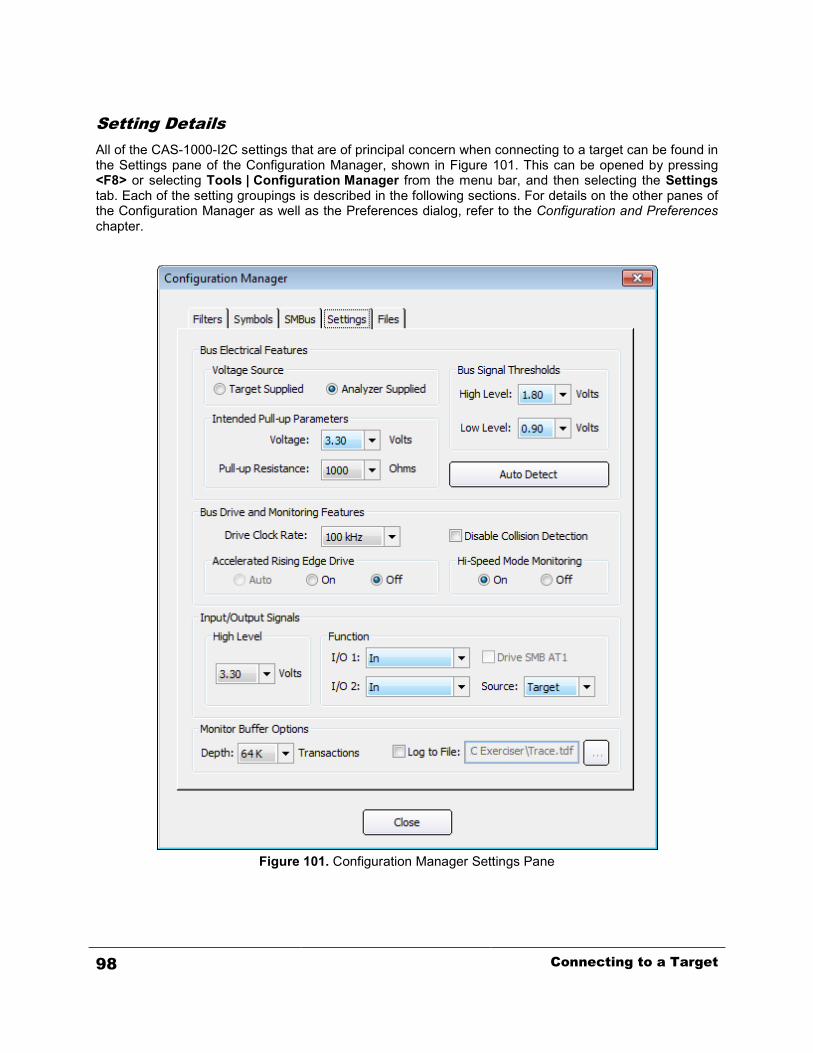
Setting Details All of the CAS-1000-I2C settings that are of principal concern when connecting to a target can be found in the Settings pane of the Configuration Manager, shown in Figure 101. This can be opened by pressing <F8> or selecting Tools | Configuration Manager from the menu bar, and then selecting the Settings tab. Each of the setting groupings is described in the following sections. For details on the other panes of the Configuration Manager as well as the Preferences dialog, refer to the Configuration and Preferences chapter.
Figure 101. Configuration Manager Settings Pane
98 Connecting to a Target
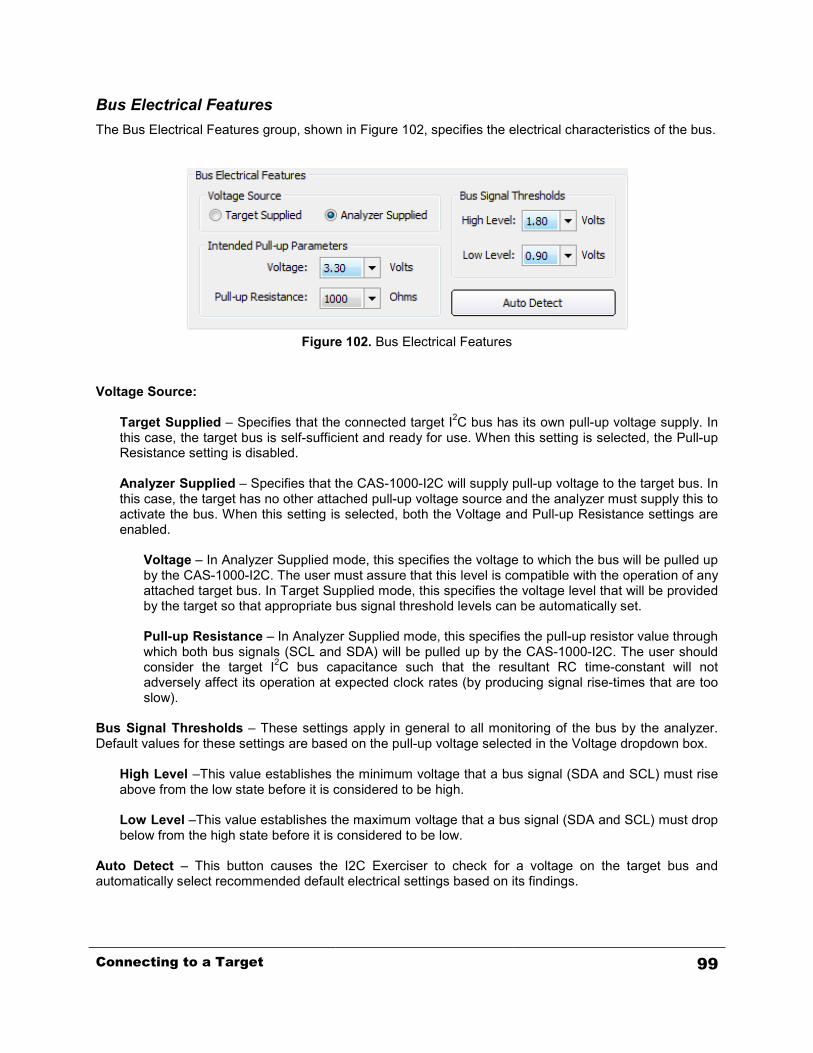
Bus Electrical Features The Bus Electrical Features group, shown in Figure 102, specifies the electrical characteristics of the bus.
Figure 102. Bus Electrical Features
Voltage Source:
Target Supplied – Specifies that the connected target I2C bus has its own pull-up voltage supply. In this case, the target bus is self-sufficient and ready for use. When this setting is selected, the Pull-up Resistance setting is disabled. Analyzer Supplied – Specifies that the CAS-1000-I2C will supply pull-up voltage to the target bus. In this case, the target has no other attached pull-up voltage source and the analyzer must supply this to activate the bus. When this setting is selected, both the Voltage and Pull-up Resistance settings are enabled.
Voltage – In Analyzer Supplied mode, this specifies the voltage to which the bus will be pulled up by the CAS-1000-I2C. The user must assure that this level is compatible with the operation of any attached target bus. In Target Supplied mode, this specifies the voltage level that will be provided by the target so that appropriate bus signal threshold levels can be automatically set. Pull-up Resistance – In Analyzer Supplied mode, this specifies the pull-up resistor value through which both bus signals (SCL and SDA) will be pulled up by the CAS-1000-I2C. The user should consider the target I2C bus capacitance such that the resultant RC time-constant will not adversely affect its operation at expected clock rates (by producing signal rise-times that are too slow).
Bus Signal Thresholds – These settings apply in general to all monitoring of the bus by the analyzer. Default values for these settings are based on the pull-up voltage selected in the Voltage dropdown box.
High Level –This value establishes the minimum voltage that a bus signal (SDA and SCL) must rise above from the low state before it is considered to be high. Low Level –This value establishes the maximum voltage that a bus signal (SDA and SCL) must drop below from the high state before it is considered to be low.
Auto Detect – This button causes the I2C Exerciser to check for a voltage on the target bus and automatically select recommended default electrical settings based on its findings.
Connecting to a Target 99

Bus Drive and Monitoring Features The Bus Drive and Monitoring Features group of settings, shown in Figure 103, specify the clock rate, accelerated rising edge drive, collision detection, and high-speed mode options for the CAS-1000-I2C when it is driving the target bus.
Figure 103. Bus Drive and Monitoring Features
Drive Clock Rate – Specifies the nominal clock rate of the SCL signal when the CAS-1000-I2C drives the bus. Note that the I2C bus is not of a continuously clocking type since various conditions can stretch the clock or require resynchronization between multiple sources. Therefore, a constant period is not expected. Disable Collision Detection – Under normal circumstances, when the CAS-1000-I2C drives the bus (acting like a master) it is required to detect that the signal levels it drives match (within a reasonable time) what it senses on the bus. Failure to detect a match would imply a collision with another master. If the bus has excessive capacitance or high pull-up/capacitance combinations which cause its rise-time to be slow, a false collision may be repeatedly detected and prevent the CAS-1000-I2C from completing its transactions. Enabling this Disable Collision Detection option accommodates such slow busses and allows the CAS-1000-I2C driving to proceed, but without the I2C arbitration mechanism. Therefore, the user needs to keep any target I2C bus master(s) quiet while the CAS-1000-I2C drives the bus when collision detection is disabled. Accelerated Rising Edge Drive – In general, when a driver on the bus makes a positive signal transition, the rise-time is determined by the RC time-constant of the bus. The rise-time governs the upper limit on effective clock rates. When the CAS-1000-I2C drives the bus, it can apply a strong rising drive during the signal transition to overcome the RC time-constant, creating a rapid edge. This can then allow an increase in the clock rate for a given RC value of the bus. If this option is set to AUTO, the CAS-1000-I2C will engage the fast rising edge mechanism automatically whenever it is operating with the I2C high-speed mode (Hs-mode) protocol—note, however, that the High-Speed Mode emulation is not currently supported by the CAS-1000-I2C and so the AUTO setting will have the same effect as OFF. If this option is set to ON, the CAS-1000-I2C employs the mechanism at all times. Setting this option to OFF fully disables the mechanism, letting the pull-ups or the target capacitance determine rise times. High-Speed Mode Monitoring – This setting provides an option to turn on or off the Hi-Speed Mode monitoring mechanism. When it is turned off, the glitch filtering mechanism of CAS-1000-I2C becomes enabled. The glitch filtering mechanism filters out glitches that are less than 50 ns in duration for protocol decoding, but indicates their occurrences on the timing display. At Drive Clock Rate higher than 1 MHz, this option is forced to be ON to avoid any over-filtering of glitches.
100 Connecting to a Target
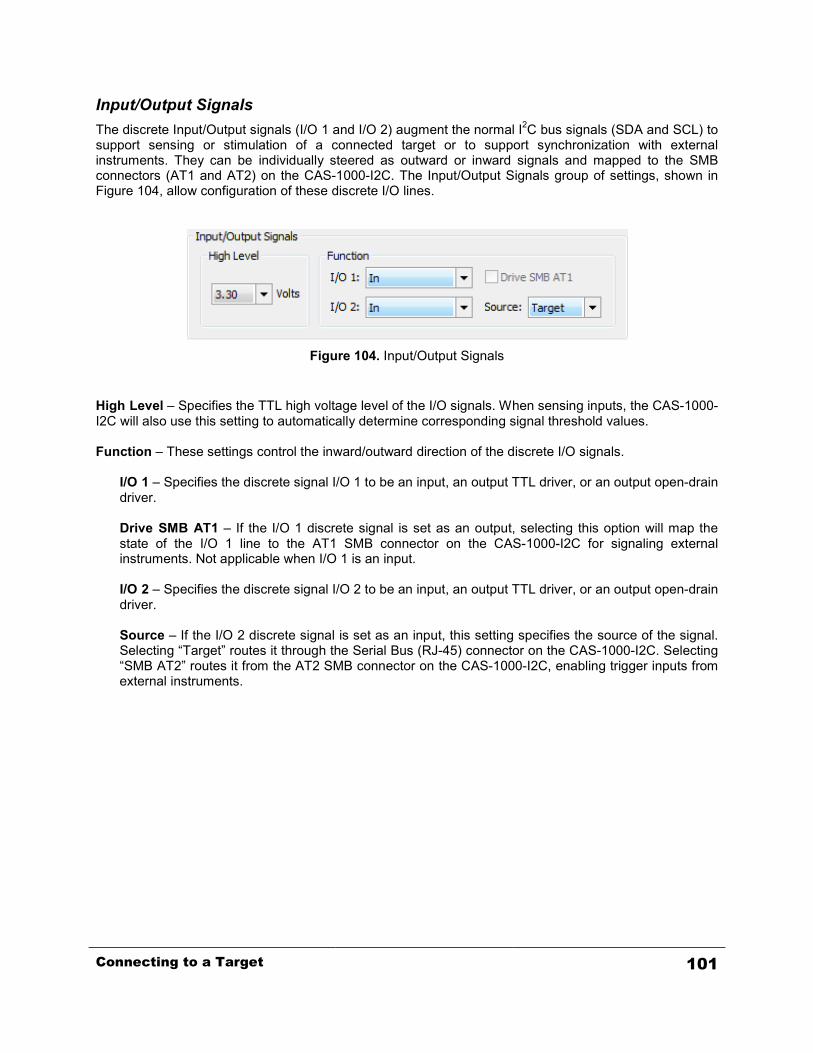
Input/Output Signals The discrete Input/Output signals (I/O 1 and I/O 2) augment the normal I2C bus signals (SDA and SCL) to support sensing or stimulation of a connected target or to support synchronization with external instruments. They can be individually steered as outward or inward signals and mapped to the SMB connectors (AT1 and AT2) on the CAS-1000-I2C. The Input/Output Signals group of settings, shown in Figure 104, allow configuration of these discrete I/O lines.
Figure 104. Input/Output Signals
High Level – Specifies the TTL high voltage level of the I/O signals. When sensing inputs, the CAS-1000-I2C will also use this setting to automatically determine corresponding signal threshold values. Function – These settings control the inward/outward direction of the discrete I/O signals.
I/O 1 – Specifies the discrete signal I/O 1 to be an input, an output TTL driver, or an output open-drain driver. Drive SMB AT1 – If the I/O 1 discrete signal is set as an output, selecting this option will map the state of the I/O 1 line to the AT1 SMB connector on the CAS-1000-I2C for signaling external instruments. Not applicable when I/O 1 is an input. I/O 2 – Specifies the discrete signal I/O 2 to be an input, an output TTL driver, or an output open-drain driver. Source – If the I/O 2 discrete signal is set as an input, this setting specifies the source of the signal. Selecting “Target” routes it through the Serial Bus (RJ-45) connector on the CAS-1000-I2C. Selecting “SMB AT2” routes it from the AT2 SMB connector on the CAS-1000-I2C, enabling trigger inputs from external instruments.
Connecting to a Target 101

Monitor Buffer Options Monitor Buffer Depth – The Monitor Buffer Depth setting, shown in Figure 105, allows the user to select the buffer depth specified by the number of transactions. This value indicates the number of transactions that occur before the monitor trace is considered to be full.
Figure 105. Monitor Buffer Options
The Monitor Buffer Depth ranges from 1 K (1,024) to 1 M (1,048,576) transactions. Note that this option may be limited by the available RAM in the host computer and requires much more storage in bytes than the actual number of transactions indicated. Choosing a large depth may considerably slow down the application when running the monitor if there is not enough memory in the host computer. The default of 64 K (65,536) transactions should be adequate for most monitoring needs. Monitor Buffer Log to File – This option provides continuous logging of trace data to the host computer’s hard disk and, during "Run Repetitive" monitoring, can record and store endless hours of I2C bus traffic limited only by available disk space. When this option is selected, the captured Monitor trace data is saved to files as described below. The trace data is stored in files with the extension "*.tdf", each of which holds up to 1M of consecutive I2C bus transactions. The trace data path and base filename are user-specified and then a numerical index is appended to each filename ("_nnnn") to indicate the chronological order in which the data was captured and saved. Note that each 1M-transaction trace data file uses about 260MB of disk space as it contains all captured I2C bus transaction data, including signal waveforms, timing and timestamp information. Use the Monitor Window's "Run Repetitive" button to continuously capture the traffic. Data will be captured into a *.tdf file and when the file exceeds 1M transactions, another file will be opened to continue storing transactions, and so forth. Note that when the "Run" or the "Run Repetitive" button is clicked and trace data files with the same base filename already exist in the specified location, the user will be prompted to overwrite them. While running, the Monitor Window displays the most recent 1M transactions of data, and the Run Status tab on the Monitor Tools window lists the name of the trace data file currently being logged to. After data capture has finished, you may double-click on the listed filenames to load the trace data to the Monitor Window.
102 Connecting to a Target
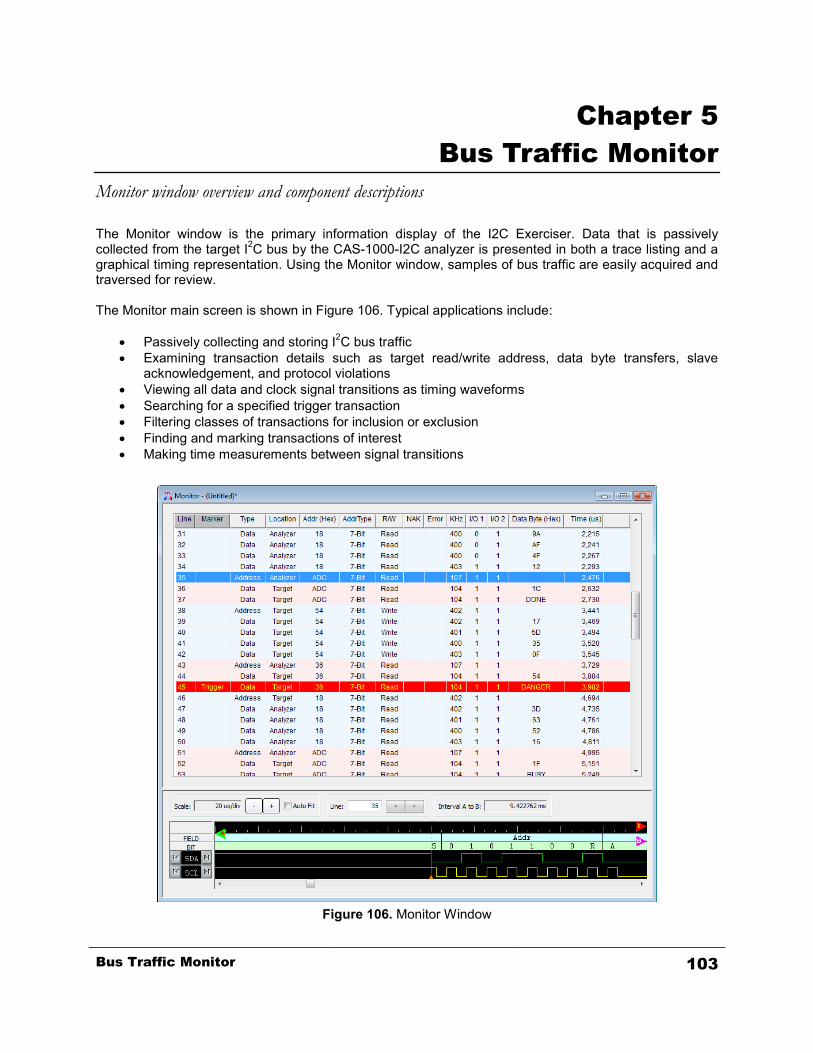
Chapter 5 Bus Traffic Monitor
Monitor window overview and component descriptions
The Monitor window is the primary information display of the I2C Exerciser. Data that is passively collected from the target I2C bus by the CAS-1000-I2C analyzer is presented in both a trace listing and a graphical timing representation. Using the Monitor window, samples of bus traffic are easily acquired and traversed for review. The Monitor main screen is shown in Figure 106. Typical applications include:
• Passively collecting and storing I2C bus traffic • Examining transaction details such as target read/write address, data byte transfers, slave
acknowledgement, and protocol violations • Viewing all data and clock signal transitions as timing waveforms • Searching for a specified trigger transaction • Filtering classes of transactions for inclusion or exclusion • Finding and marking transactions of interest • Making time measurements between signal transitions
Figure 106. Monitor Window
Bus Traffic Monitor 103

Trace Listing The trace listing, located in the top portion of the Monitor window, provides the fundamental presentation of traffic acquired from the target I2C bus. Each row is considered to represent a transaction which describes a complete read/write address or data byte sequence that is conveyed over the bus. All of the transaction details are included as columns in the listing. Figure 107 shows the Monitor window trace listing.
Figure 107. Monitor Trace Listing
Column Descriptions Line – This column contains a line number for each trace line. The numbering can be relative to the start of the collected traffic or to the line that has been marked as “Trigger,” depending on the preference that has been set. Refer to the Monitor Options section of the Preferences Dialog description in the Configuration and Preferences chapter. Marker – This column is used to mark particular lines of interest. It may contain one of the following identifiers:
• Trigger – A trigger is a special user-defined transaction event that determines when the monitor will automatically stop data collection. See the Trigger section later in this chapter for more information on Triggers.
• Cursor A, B – Each of the two cursors is a special indicator that is used in the timing field to measure time intervals. As a cursor is positioned in the timing field, the trace listing transaction which occurs nearest to the cursor is marked for reference.
• Tagged – This marker identifies any number of user-designated lines of interest. Lines in the trace listing can be tagged by double-clicking on them, making the lines easy to locate both visually and using the “Go to Tagged Row” function available from the Monitor’s Tool Bar or Trace menu. Double-clicking on a line that is already tagged will clear this marker.
104 Bus Traffic Monitor

Type – This column contains an identifier that indicates one of the two major classes of transactions:
• Address – The I2C bus transaction cycle during which a START or repeated START condition leads to the shifting of a transfer address for a target slave device and write or read qualifier onto the bus. This action precedes subsequent data byte transfers to the indicated target slave and that data transfer is terminated by either a STOP or repeated START condition. The transfer address is shown in the Addr column and the read/write qualifier in the R/W column.
• Data – The I2C bus transaction cycle during which data bytes are conveyed to or from a target slave device. The address of the target slave is determined by the previous address cycle and is shown in the Addr column. The read/write qualifier indicated in the R/W column designates whether the data bytes are being written to or read from the target slave. For data cycle transactions, the data byte(s) conveyed will be present in the Data Byte column.
Location – This column indicates whether the CAS-1000-I2C analyzer is involved in the transaction. For address cycle transactions, “Analyzer” signifies that the analyzer is acting as a master (through the Debugger or Emulator, for example), while “Target” signifies that a master on the target I2C bus is driving. For data cycle transactions, “Analyzer” signifies that the addressed slave is in fact being emulated by the analyzer, while “Target” signifies that a live target slave device is involved. Addr – This column indicates the I2C bus address of the target slave device for the transaction. The address is either a 7-bit, 10-bit, or Hs-mode type depending on which is indicated in the AddrType column. Various numerical formats are available for displaying the address value, including hex, decimal, and binary. The current display format is shown in parenthesis in the column heading and right-clicking on the column heading will display a popup menu that allows selection of the display format. If symbols are enabled and there is an address symbol defined for the target slave, then that symbolic name will appear in place of the numeric value (refer to the Symbols section later in this chapter). When using SMBus Mode, the address value of each transaction is decoded into the name of the SMBus device if there is a decoding file associated with the address value (refer to the SMBus section of this chapter for more information). Note that 7-bit I2C addresses are represented numerically as 8-bit values and their format is dependent on the current address mode setting (FE mode or 7F mode). Please refer to the Formats section of the Preferences Dialog description in the Configuration and Preferences chapter for more information. AddrType – This column indicates whether the address value in the Addr column is a 7-bit, 10-bit, or Hs-mode address. R/W – This column indicates the state of the read/write bit that is conveyed during an address cycle. From this state, the direction of data flow is determined relative to the master: “R” signifies that data is read from a target slave and “W” signifies that data is written to a target slave. NAK – This column indicates whether a transaction terminated with a not-acknowledge (NAK). If this column entry is blank, an acknowledge (ACK) occurred, otherwise it contains the identifier, “NAK.” Error – This column indicates whether an I2C protocol violation has been detected. If so, the column entry contains the identifier, “Error,” otherwise it is blank. If an error is detected, left-clicking on the cell will display a popup that reveals the location in the transaction where the error occurred (such as during the address cycle, data cycle, START or STOP, etc). Reviewing the associated timing field graph can help provide more details regarding the Error. Note that an error can cause the analyzer to lose synchronization and all signal edge transitions that occur while the analyzer attempts to resynchronize will be associated with the same trace list entry. KHz – This column indicates the approximate average clock rate for the transaction in units of kilohertz.
Bus Traffic Monitor 105

I/O 1 – This column indicates the state of discrete I/O line 1 during the transaction. I/O 2 – This column indicates the state of discrete I/O line 2 during the transaction. Data Byte – This column indicates the data byte values conveyed to or from the target slave device by the transaction. Various numerical formats are available for displaying the values, including hex, decimal, and binary. The current display format is shown in parenthesis in the column heading and right-clicking on the column heading will display a popup menu that allows selection of the display format. If symbols are enabled and there is a data byte symbol defined for the target slave, then that symbolic name will appear in place of the numeric value (refer to the Symbols section later in this chapter). When using Compact mode, all data byte transactions following an address transaction will be displayed on a single trace listing line. Left-clicking the column entry will display all of the bytes as an array of hex values in a separate scrollable dialog. When using SMBus Mode, each data byte value of the transaction is decoded into a text SMBus message if the value is associated in an SMBus decoding file (refer to the SMBus section later in this chapter). In this mode, positioning the mouse pointer over a data column entry will bring up a “tooltip” containing the entire SMBus message. Also, left-clicking the column entry will display the entire message in a separate scrollable dialog. Right-clicking on the column heading will display a popup menu that allows selection (or de-selection) of Compact mode, SMBus mode, or the default Normal mode. Time – This column indicates the timestamp that is assigned to the beginning time of each transaction. Various time display units are supported, including nanoseconds, microseconds, milliseconds, and seconds. The current time unit is shown in parenthesis in the column heading and right-clicking on the column heading will display a popup menu that allows selection of the time unit. Timestamps can be displayed in relative mode (the time between transactions) or absolute mode (the accumulative time starting from zero). Time zero can also be selected to start at the first transaction or at the Trigger transaction (with prior transactions having negative time). Refer to the Monitor Options section of the Preferences Dialog description in the Configuration and Preferences chapter.
106 Bus Traffic Monitor
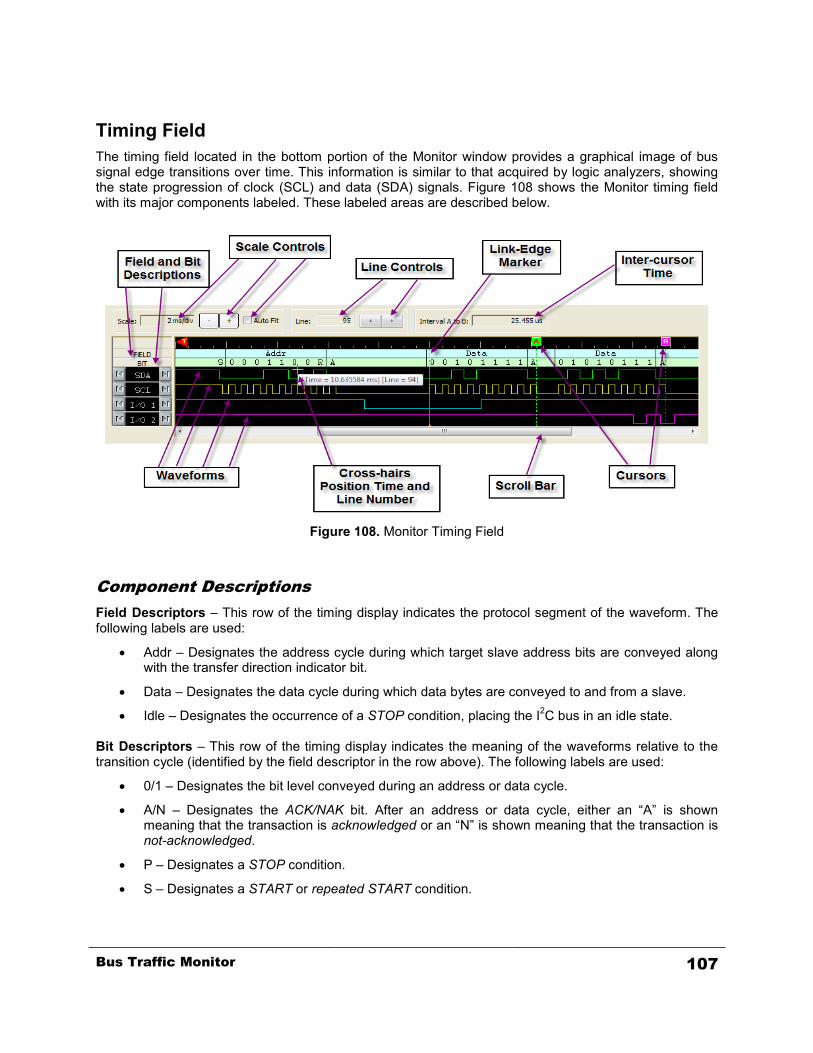
Timing Field The timing field located in the bottom portion of the Monitor window provides a graphical image of bus signal edge transitions over time. This information is similar to that acquired by logic analyzers, showing the state progression of clock (SCL) and data (SDA) signals. Figure 108 shows the Monitor timing field with its major components labeled. These labeled areas are described below.
Figure 108. Monitor Timing Field
Component Descriptions Field Descriptors – This row of the timing display indicates the protocol segment of the waveform. The following labels are used:
• Addr – Designates the address cycle during which target slave address bits are conveyed along with the transfer direction indicator bit.
• Data – Designates the data cycle during which data bytes are conveyed to and from a slave.
• Idle – Designates the occurrence of a STOP condition, placing the I2C bus in an idle state. Bit Descriptors – This row of the timing display indicates the meaning of the waveforms relative to the transition cycle (identified by the field descriptor in the row above). The following labels are used:
• 0/1 – Designates the bit level conveyed during an address or data cycle.
• A/N – Designates the ACK/NAK bit. After an address or data cycle, either an “A” is shown meaning that the transaction is acknowledged or an “N” is shown meaning that the transaction is not-acknowledged.
• P – Designates a STOP condition.
• S – Designates a START or repeated START condition.
Bus Traffic Monitor 107

• W/R – Designates the transfer direction indicator bit. During an address cycle, either a “W” is shown meaning that a master is writing data to a target slave device or an “R” is shown meaning that a master is reading data from a target slave device.
Scale controls – These controls adjust the zoom level of the timing graph waveforms.
• Scale text box – This indicates the length of time between each of the larger tick marks across the top of the timing display (based on the current zoom level).
• -/+ buttons – These buttons enable zooming out (-) or in (+) to show the timing waveforms expanded (more detail) or contracted (more transitions over the length of the graph). Zooming is relative to the point at the center of the timing graph, which remains fixed as both ends of the waveforms stretch closer to or farther from it.
• Auto Fit checkbox – If checked, the zoom level automatically adjusts to an “optimum” scale such that about 20 SCL clock periods are shown over the timing graph.
Line controls – These controls reflect the location of the timing graph’s Link-Edge Marker (described below) relative to the trace listing and allow easy navigation through the transactions.
• Line text box – This indicates the trace listing line that corresponds to the location of the Link-Edge Marker in the timing waveform (whether in view or not). An arbitrary number may be entered here to jump to that transaction line. The Link-Edge Marker will then attach to the beginning of the transaction waveform and the graph will center on this new location.
• Line buttons – These left and right arrow buttons assign the Link-Edge Marker to the previous or following transaction, respectively. The graph will center on this new location.
Link-Edge Marker – This vertical line in the waveform graph indicates the beginning of a particular transaction. It corresponds to the trace listing line that is identified in the Line text box (described above). Interval A to B – This indicates the time difference between the position of Cursor A and Cursor B. Waveforms – These waveforms show the graphical time sequence of SDA, SCL, I/O 1, and I/O 2 signal states as they transition from low to high. Cross-hairs indicator – As the mouse cursor is positioned over the timing graph, the time at its position and the nearest corresponding trace listing line number to that time are displayed next to the cross-hairs indicator. Left-clicking, holding, and dragging the cross-hairs will drag the timing display in the direction of the mouse movement. Performing the same action with the CTRL key pressed will show the relative time displacement dragged out. Cursor A/B – These are two vertical line markers which can be placed anywhere in the timing graph (by left-clicking and dragging). The markers will remain where placed, even when not in view, and are used to measure time intervals (see the Interval A to B component above). The transaction line nearest a cursor is indicated in the trace listing with special highlighting and an entry in the Marker column.
108 Bus Traffic Monitor

Timing Field Popup Menu The Timing Field Popup Menu is accessed by right-clicking in the waveform area of the timing field window as shown in Figure 109. It provides various functions to help users to navigate and examine the waveform display.
Figure 109. Timing Field Popup Menu
Zoom In – Zooms into the waveform by one scale-step at the right-clicked point. Zoom Out – Zooms out from the waveform by one scale-step at the right-clicked point. Go To – Jumps the display to the points of interest such as the trigger, cursors, next, and previous lines. Place Cursor – Places the cursor A or B at the right-clicked point. Hide Monitor Timing – Hides the Monitor timing field. Print Monitor Timing – Sends the image of Monitor timing field as shown on the screen to the Windows printer. Preferences – Opens the Preferences dialog.
Bus Traffic Monitor 109

Monitor Configurations Various configuration options relevant to the Monitor Window can be specified by opening the Configuration Manager from the Tools menu. The Configuration Manager can be used to configure the Filters, Symbols, and SMBus features which are applicable to use of the Monitor Window.
Filters A filter defines a class of transactions by specifying a set of particular transaction features. Each filter can be individually activated or not via the checkbox beside the filter’s name. The combined selection of active filters can be set to either determine which transaction classes are included or which are excluded from the trace listing. Use of filters allows you to view only the bus activity of interest, with items considered clutter removed. If a transaction is removed from the monitor trace listing, it is also effectively removed from the timing display graph where it will appear as a non-busy bus. The Filters pane dialog is shown in Figure 110.
110 Bus Traffic Monitor
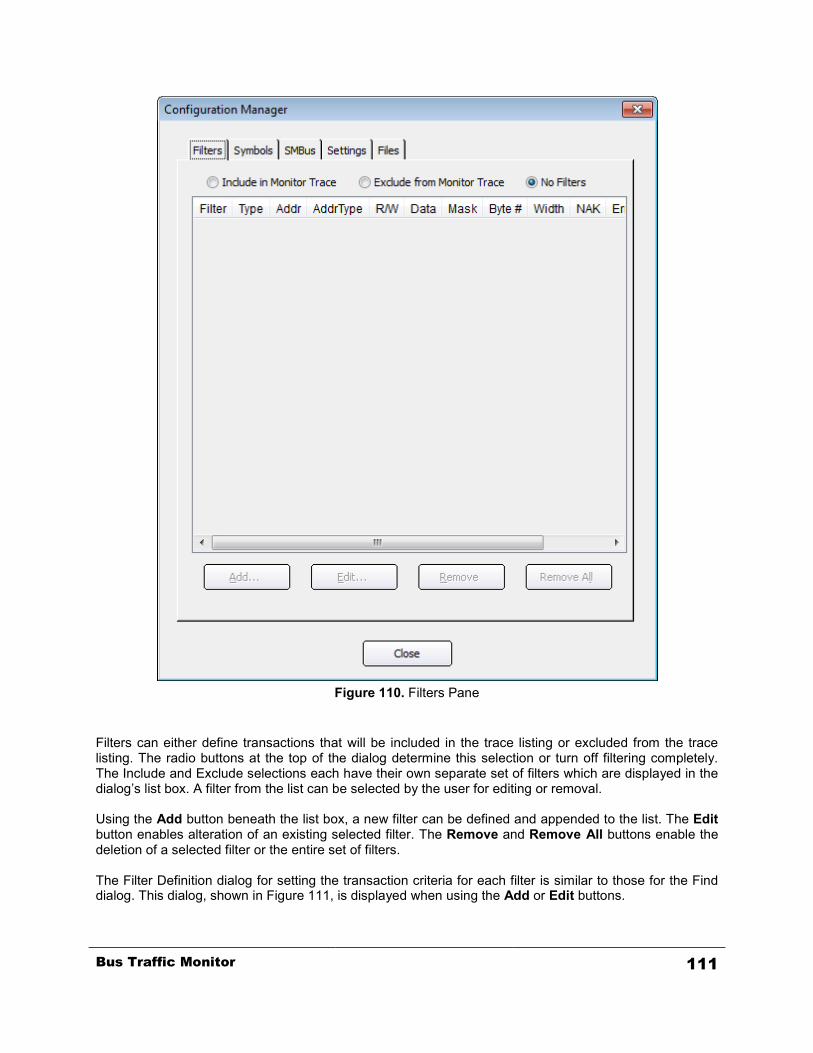
Figure 110. Filters Pane
Filters can either define transactions that will be included in the trace listing or excluded from the trace listing. The radio buttons at the top of the dialog determine this selection or turn off filtering completely. The Include and Exclude selections each have their own separate set of filters which are displayed in the dialog’s list box. A filter from the list can be selected by the user for editing or removal. Using the Add button beneath the list box, a new filter can be defined and appended to the list. The Edit button enables alteration of an existing selected filter. The Remove and Remove All buttons enable the deletion of a selected filter or the entire set of filters. The Filter Definition dialog for setting the transaction criteria for each filter is similar to those for the Find dialog. This dialog, shown in Figure 111, is displayed when using the Add or Edit buttons.
Bus Traffic Monitor 111
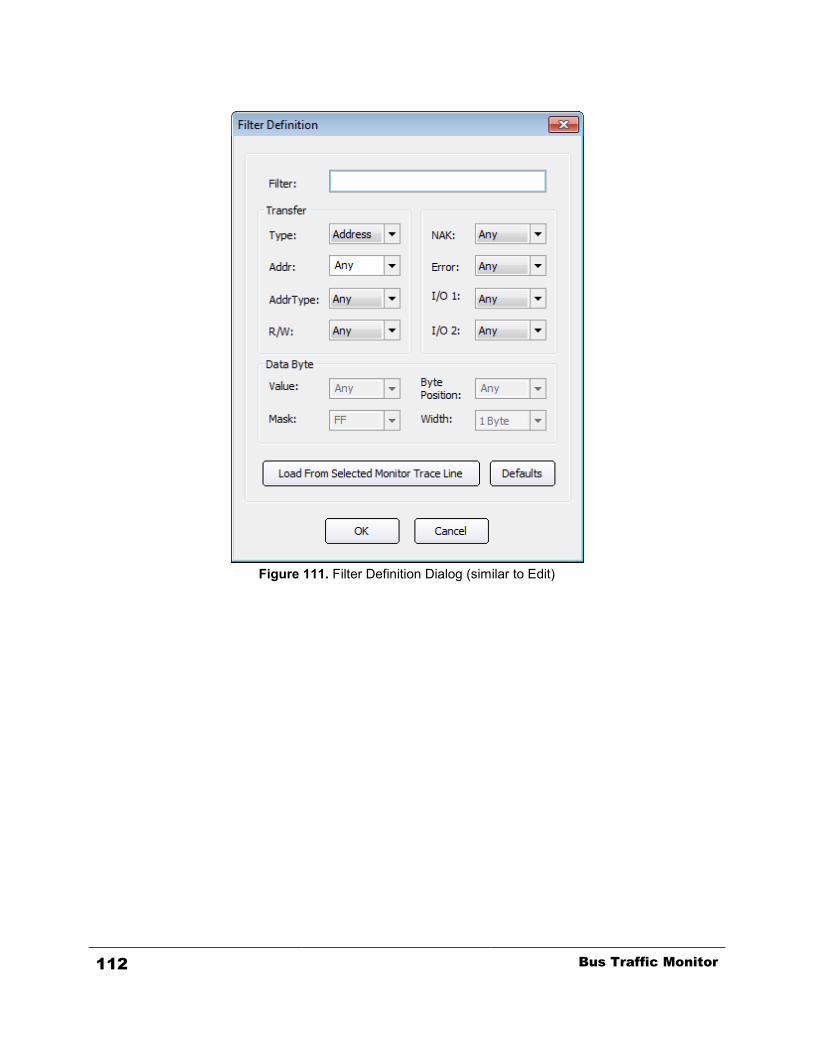
Figure 111. Filter Definition Dialog (similar to Edit)
112 Bus Traffic Monitor
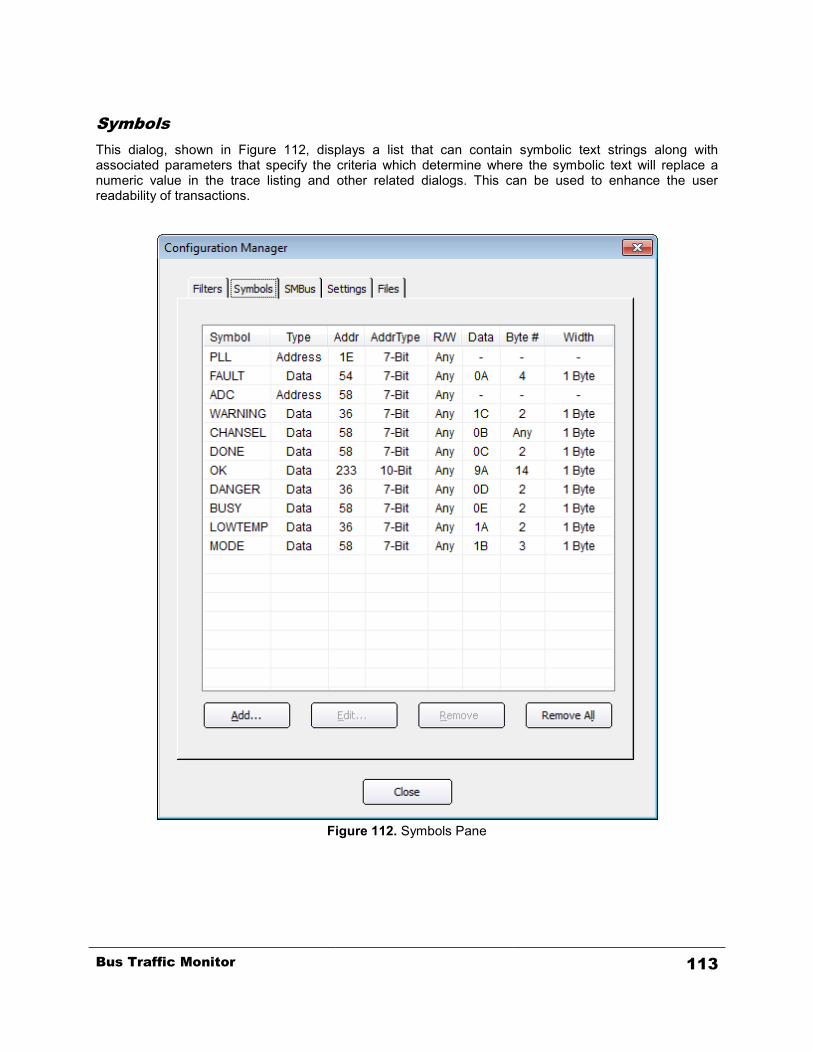
Symbols This dialog, shown in Figure 112, displays a list that can contain symbolic text strings along with associated parameters that specify the criteria which determine where the symbolic text will replace a numeric value in the trace listing and other related dialogs. This can be used to enhance the user readability of transactions.
Figure 112. Symbols Pane
Bus Traffic Monitor 113
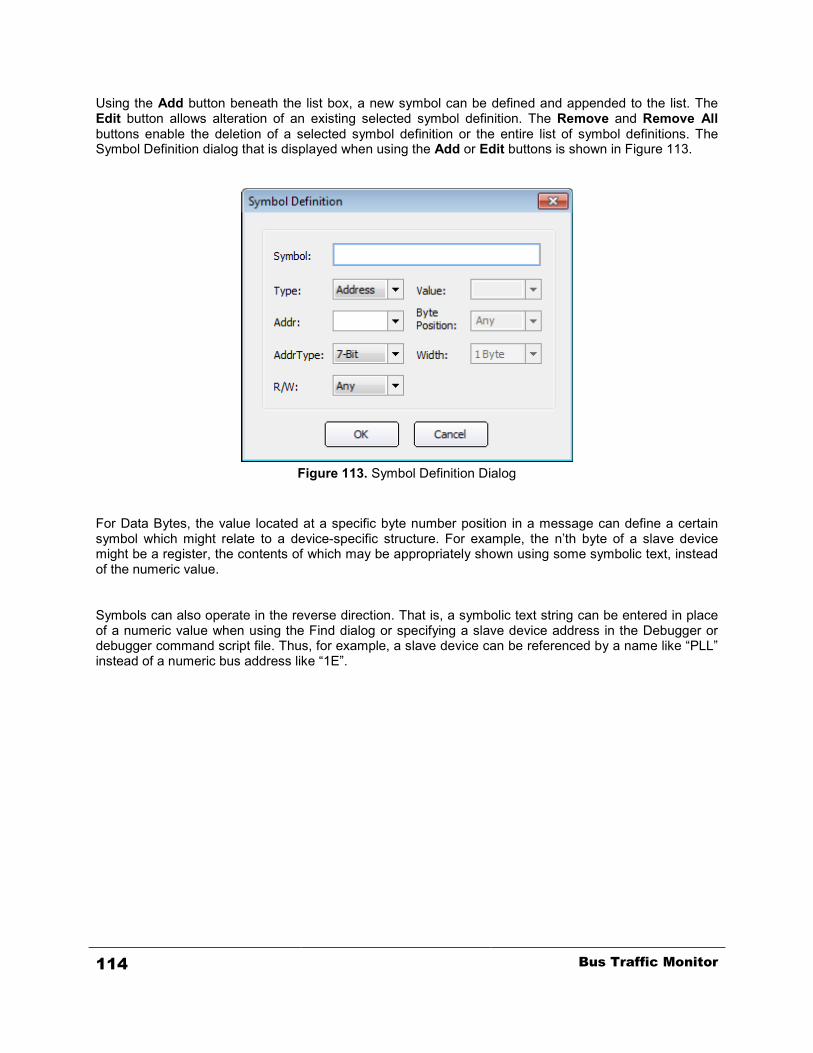
Using the Add button beneath the list box, a new symbol can be defined and appended to the list. The Edit button allows alteration of an existing selected symbol definition. The Remove and Remove All buttons enable the deletion of a selected symbol definition or the entire list of symbol definitions. The Symbol Definition dialog that is displayed when using the Add or Edit buttons is shown in Figure 113.
Figure 113. Symbol Definition Dialog
For Data Bytes, the value located at a specific byte number position in a message can define a certain symbol which might relate to a device-specific structure. For example, the n’th byte of a slave device might be a register, the contents of which may be appropriately shown using some symbolic text, instead of the numeric value. Symbols can also operate in the reverse direction. That is, a symbolic text string can be entered in place of a numeric value when using the Find dialog or specifying a slave device address in the Debugger or debugger command script file. Thus, for example, a slave device can be referenced by a name like “PLL” instead of a numeric bus address like “1E”.
114 Bus Traffic Monitor
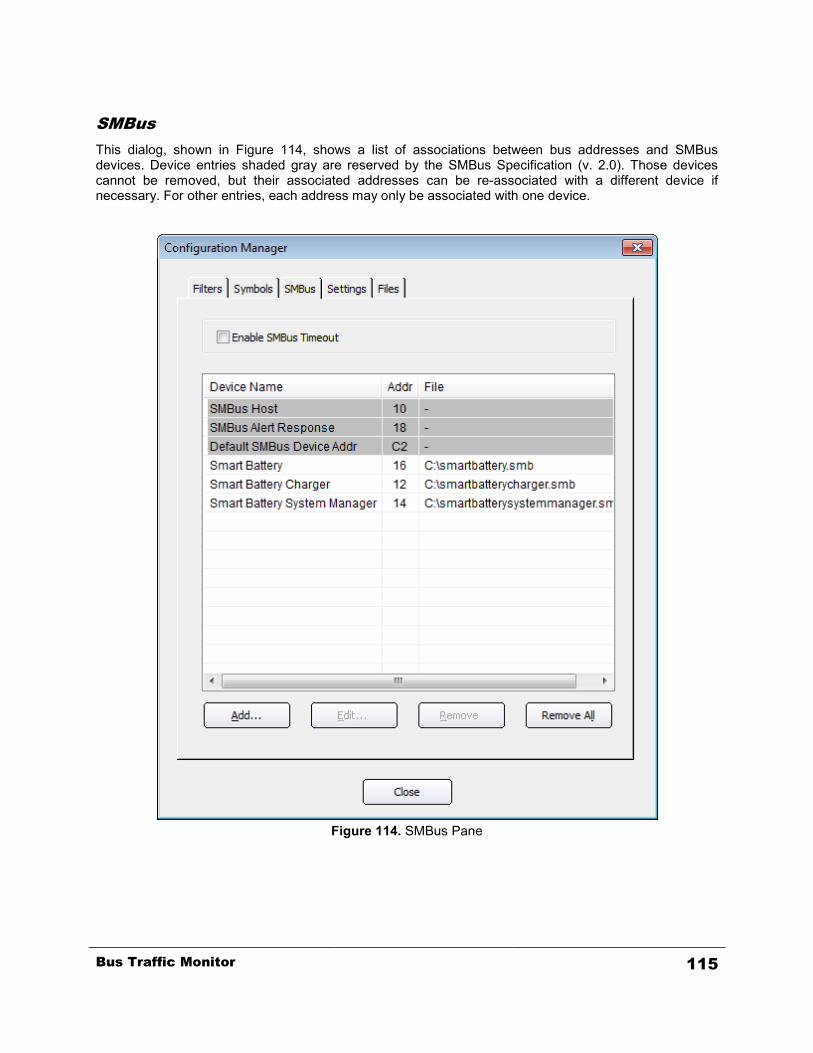
SMBus This dialog, shown in Figure 114, shows a list of associations between bus addresses and SMBus devices. Device entries shaded gray are reserved by the SMBus Specification (v. 2.0). Those devices cannot be removed, but their associated addresses can be re-associated with a different device if necessary. For other entries, each address may only be associated with one device.
Figure 114. SMBus Pane
Bus Traffic Monitor 115
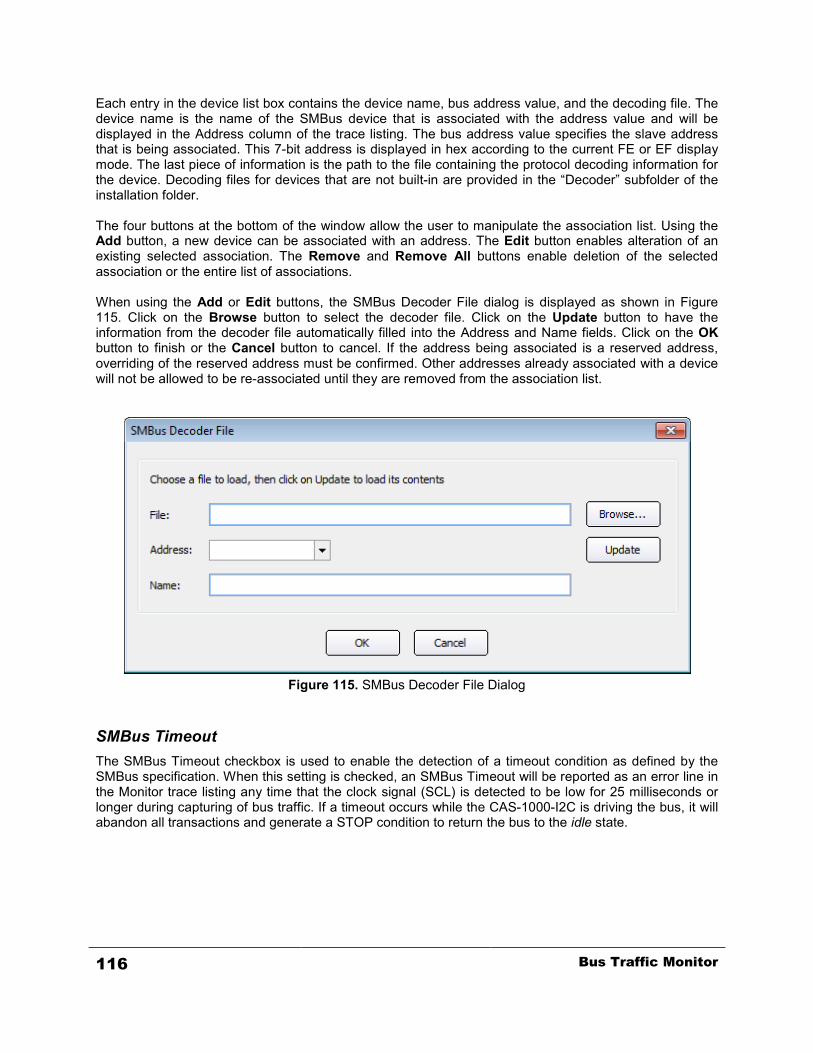
Each entry in the device list box contains the device name, bus address value, and the decoding file. The device name is the name of the SMBus device that is associated with the address value and will be displayed in the Address column of the trace listing. The bus address value specifies the slave address that is being associated. This 7-bit address is displayed in hex according to the current FE or EF display mode. The last piece of information is the path to the file containing the protocol decoding information for the device. Decoding files for devices that are not built-in are provided in the “Decoder” subfolder of the installation folder. The four buttons at the bottom of the window allow the user to manipulate the association list. Using the Add button, a new device can be associated with an address. The Edit button enables alteration of an existing selected association. The Remove and Remove All buttons enable deletion of the selected association or the entire list of associations. When using the Add or Edit buttons, the SMBus Decoder File dialog is displayed as shown in Figure 115. Click on the Browse button to select the decoder file. Click on the Update button to have the information from the decoder file automatically filled into the Address and Name fields. Click on the OK button to finish or the Cancel button to cancel. If the address being associated is a reserved address, overriding of the reserved address must be confirmed. Other addresses already associated with a device will not be allowed to be re-associated until they are removed from the association list.
Figure 115. SMBus Decoder File Dialog
SMBus Timeout The SMBus Timeout checkbox is used to enable the detection of a timeout condition as defined by the SMBus specification. When this setting is checked, an SMBus Timeout will be reported as an error line in the Monitor trace listing any time that the clock signal (SCL) is detected to be low for 25 milliseconds or longer during capturing of bus traffic. If a timeout occurs while the CAS-1000-I2C is driving the bus, it will abandon all transactions and generate a STOP condition to return the bus to the idle state.
116 Bus Traffic Monitor

Monitor Preferences Preferences relevant to the Monitor Window can be selected by opening the Preferences dialog from the Tools menu. The Preferences dialog can be used to specify the monitor colors and other monitor options, as well as address format.
Monitor Colors This pane enables altering of the colors of the trigger and cursor backgrounds and text in the trace listing. It also enables the background color pattern (color scheme) between line groupings to be changed. The options for the color scheme are no color, alternating background color per row, or alternating background color per messages (default). The color for background and text assigned to the alternating line groups can also be selected. Any changes made take effect immediately. A Use Defaults button restores the original default settings.
Figure 116. Monitor Colors Pane
Bus Traffic Monitor 117

Trigger – Changes the text and background color of the Trigger trace listing Cursor A – Changes the text and background color of the cursor marked “A” in the Timing Field Cursor B – Changes the text and background color of the cursor marked “B” in the Timing Field Timing View – Changes the colors of the SDA, SCL, IO1, and IO2 signals in the Timing Field Other – Specifies one of the three coloring schemes
• No color: no coloring of messages • Alternate color per message (default): each complete transaction is grouped together in one
color, the color alternates between adjacent messages. • Alternate color per row: alternates the color between adjacent rows Alternately, the user can select the two alternating colors for adjacent messages, both the text and background color, if a coloring scheme is selected.
118 Bus Traffic Monitor
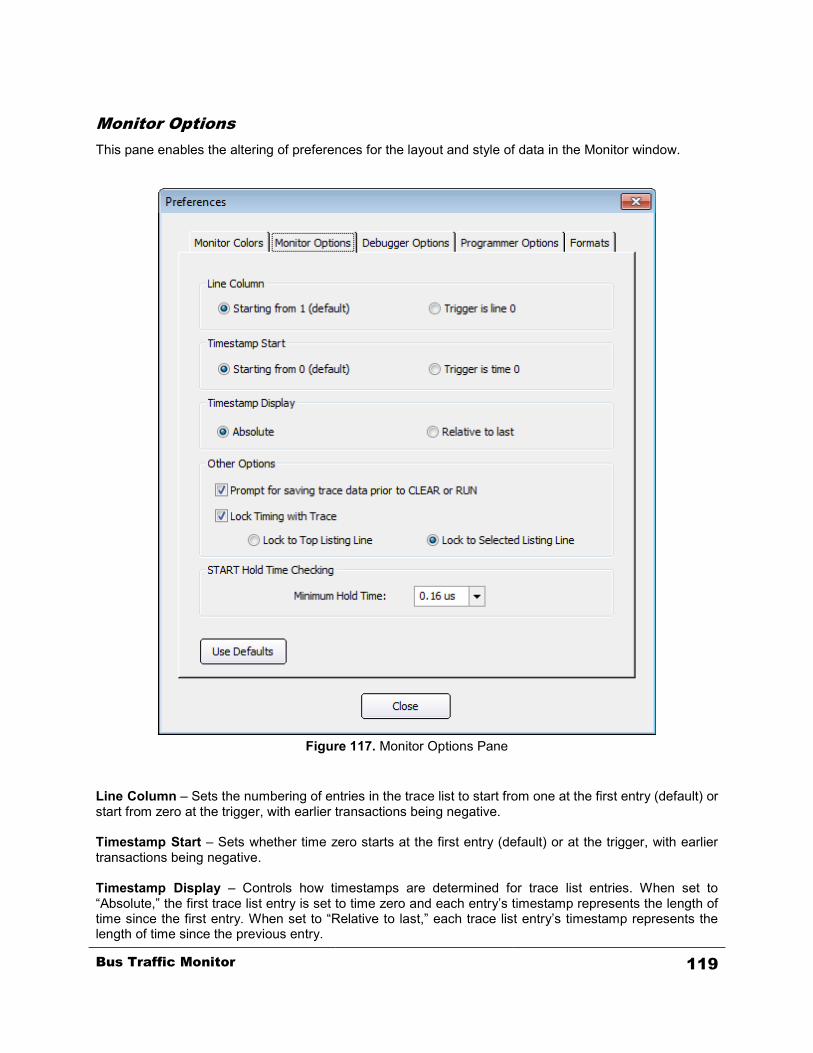
Monitor Options This pane enables the altering of preferences for the layout and style of data in the Monitor window.
Figure 117. Monitor Options Pane
Line Column – Sets the numbering of entries in the trace list to start from one at the first entry (default) or start from zero at the trigger, with earlier transactions being negative. Timestamp Start – Sets whether time zero starts at the first entry (default) or at the trigger, with earlier transactions being negative. Timestamp Display – Controls how timestamps are determined for trace list entries. When set to “Absolute,” the first trace list entry is set to time zero and each entry’s timestamp represents the length of time since the first entry. When set to “Relative to last,” each trace list entry’s timestamp represents the length of time since the previous entry.
Bus Traffic Monitor 119
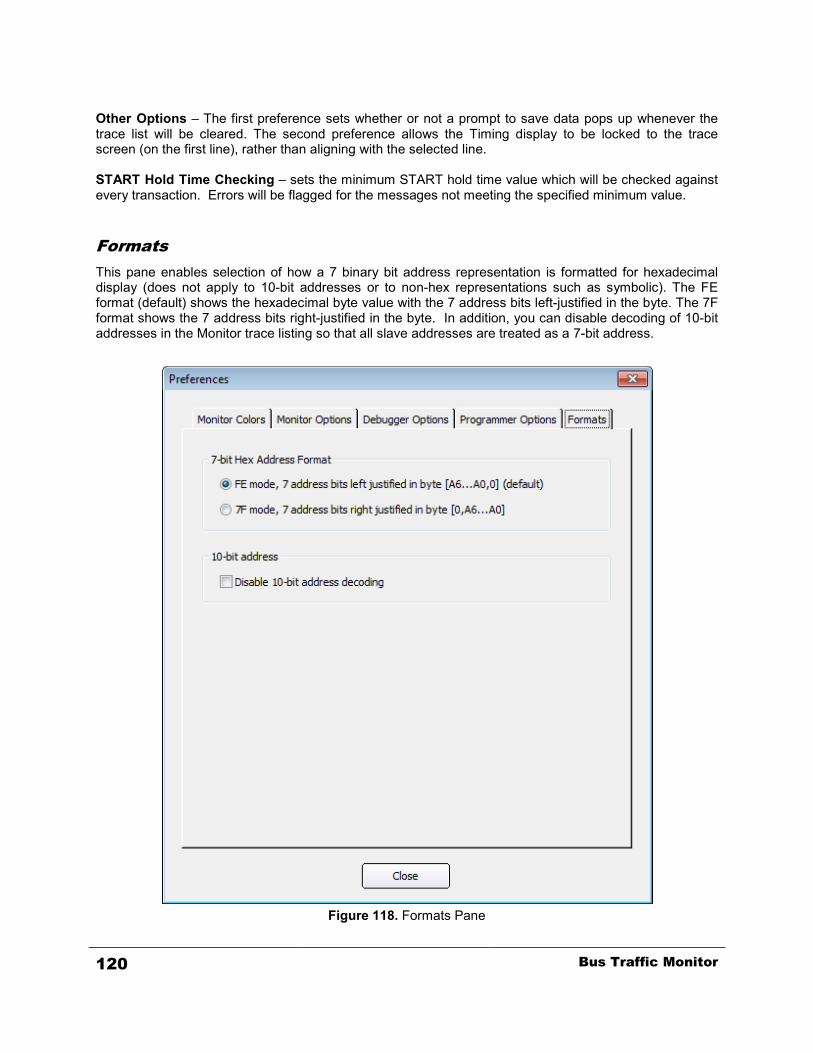
Other Options – The first preference sets whether or not a prompt to save data pops up whenever the trace list will be cleared. The second preference allows the Timing display to be locked to the trace screen (on the first line), rather than aligning with the selected line. START Hold Time Checking – sets the minimum START hold time value which will be checked against every transaction. Errors will be flagged for the messages not meeting the specified minimum value.
Formats This pane enables selection of how a 7 binary bit address representation is formatted for hexadecimal display (does not apply to 10-bit addresses or to non-hex representations such as symbolic). The FE format (default) shows the hexadecimal byte value with the 7 address bits left-justified in the byte. The 7F format shows the 7 address bits right-justified in the byte. In addition, you can disable decoding of 10-bit addresses in the Monitor trace listing so that all slave addresses are treated as a 7-bit address.
Figure 118. Formats Pane
120 Bus Traffic Monitor
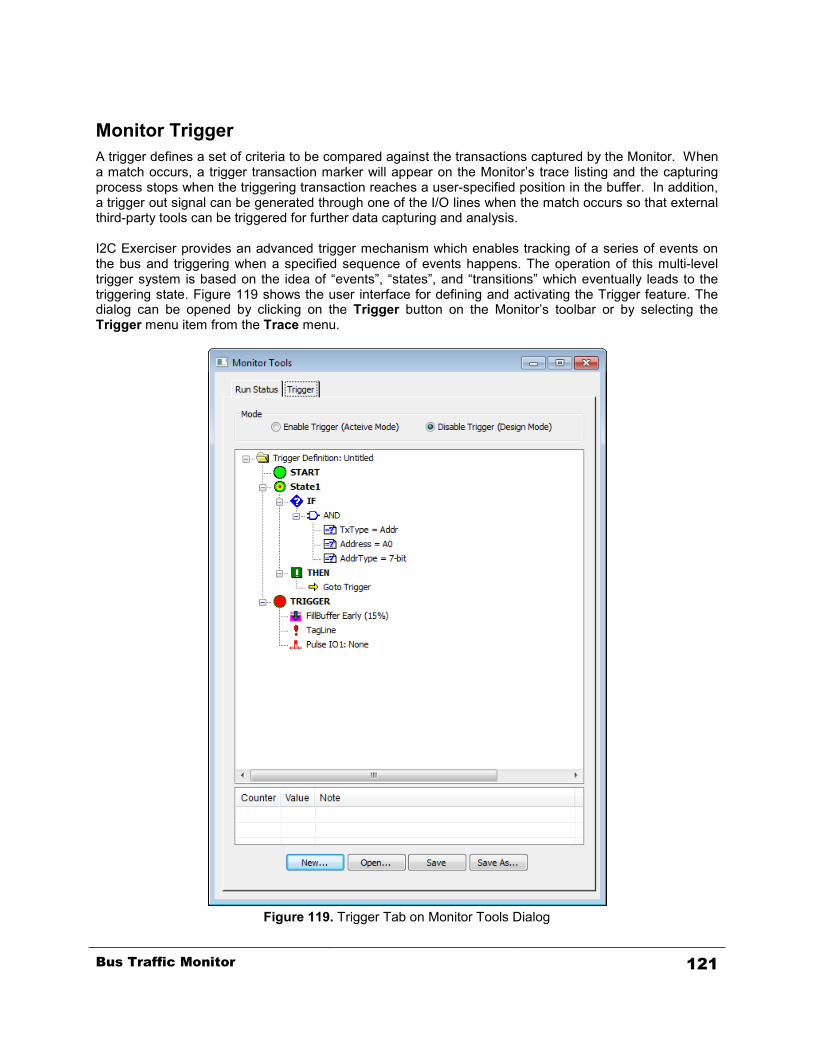
Monitor Trigger A trigger defines a set of criteria to be compared against the transactions captured by the Monitor. When a match occurs, a trigger transaction marker will appear on the Monitor’s trace listing and the capturing process stops when the triggering transaction reaches a user-specified position in the buffer. In addition, a trigger out signal can be generated through one of the I/O lines when the match occurs so that external third-party tools can be triggered for further data capturing and analysis. I2C Exerciser provides an advanced trigger mechanism which enables tracking of a series of events on the bus and triggering when a specified sequence of events happens. The operation of this multi-level trigger system is based on the idea of “events”, “states”, and “transitions” which eventually leads to the triggering state. Figure 119 shows the user interface for defining and activating the Trigger feature. The dialog can be opened by clicking on the Trigger button on the Monitor’s toolbar or by selecting the Trigger menu item from the Trace menu.
Figure 119. Trigger Tab on Monitor Tools Dialog
Bus Traffic Monitor 121

There are two special states in the Trigger definition tree. START is the default state in which the state machine begins when I2C data collection begins. TRIGGER is the ending state, which causes the triggering actions to occur. Between the START and TRIGGER states, there are one or more intermediate states, which have conditional branches to check for matching events and perform actions accordingly. The system can transition from one state to another, eventually leading to a final TRIGGER state when the specified sequence of events has been matched.
Trigger Components The following sections describe the components in the Monitor’s Trigger feature.
Component Symbol Types Available in START States TRIGGER
Events TxType √ Address √ AddrType √ R/W √ Ack/Nak √ Error √ IO1 / IO2 √ DataByte √ Counter √
States Start N/A N/A N/A
Trigger N/A N/A N/A
User Defined N/A N/A N/A State Logical Components
IF √ ELSEIF √
THEN √ ELSE √
AND √
OR √ Actions
Goto √
Set / Increment / Decrement Counter
√ √
Pulse IO √ √ √
Fill Buffer √
Tag Line √ Table 4. Summary of available Trigger Components
Events Events are defined by a set of matching criteria for the I2C transactions being captured. When there is a match between the user-defined event conditions and the captured transaction data, it initiates a set of actions including transitioning to another state and/or updating global counters. These event conditions can be AND’ed or OR’ed together in a nested manner so that more complex logical conditions can be generated. Each address and data transaction captured by the Monitor is compared against the specified
122 Bus Traffic Monitor

event condition at the current state of the Trigger state machine. Then actions specified in the matching IF/ELSE/THEN branch are executed. The following items are available criteria of an event and their possible values. If any of these conditions are not specified, they are considered as “don’t-care”. For example, if the TxType (transaction type) is not specified and an Address value of “A2” is set as the matching condition, not only the address transaction but also the data transaction communicating with a slave address “A2” will satisfy the condition. TxType – The type of I2C transaction. The possible values are “Address” or “Data”. Address – The address of I2C slave device, which the transaction is targeted to. The possible values are 7- or 10-bit hexadecimal numbers. AddrType – The address type of I2C slave device, which the transaction is targeted to. The possible values are “7-bit”, “10-bit”, or “HS-mode”. R/W – The direction of transfer. The possible values are “Read” or “Write”. Ack/Nak – The acknowledgement status of transaction. The possible values are “ACK” or “NAK”. Error – The occurrence of a protocol error. The possible values are “Yes” or “No”. IO1 / IO2 – The status of General Purpose I/O lines 1 and 2 within the transaction. The possible values for each line are “High”, “Low”, “Rising”, “Falling”, or “Any Transition”. DataByte – The value in a data transaction. The possible values are one or more 8-bit hex numbers. In addition, the mask bits and offset values can be specified with the data bytes. Counter – The current value of the counter. This is usually used for keeping track of the repeated number of matching events. States States are the intermediate points between the start of the trigger matching process and the final triggering state. At each state, a set of event criteria are compared with incoming transactions, and according to the result, it sets off actions such as transitioning to another state and/or updating the counter values. A virtually unlimited number of states can be created. The states contain the combinations of IF/ THEN, ELSEIF/THEN, and ELSE blocks. The IF and ELSEIF blocks contain AND/OR blocks with conditional statements. The THEN and ELSE blocks contain action statements. Actions At each state, a set of actions can be defined to be executed when certain event conditions have met. The actions include transitioning to another state and updating the global counters. In addition, an action can be defined to generate a pulse signal to one of the I/O lines, for example, to trigger external third-party tools. The following is list of available actions and their descriptions. Goto – Generates a transition from one state to another. The possible parameters are “Trigger” or “StateN” where N is a state number. Set / Increment / Decrement Counter – Updates the counter values by setting, incrementing, or decrementing by the specified value.
Bus Traffic Monitor 123

Pulse IO – Generates a pulse signal to one of the I/O lines. The pulse can be either “ActiveHigh”, which generates a high and then low signal, or “ActiveLow”, which generates a low and then high signal. The width of the pulse is about 0.5 ms, and the typical delay between the actual trigger event on the bus and the trigger out pulse is approximately 1.6 ms. This delay may vary from 1.5 ms to 150 ms depending on the data traffic load. Fill Buffer – Stop the monitor when the triggering transaction hits the 15%, 50%, or 85% mark of the trace buffer. This is a built-in action for the TRIGGER state. If the trigger event occurs, the capturing stops automatically when enough post-trigger transactions have been collected to fill the buffer, such that the trigger’s position in the buffer space reaches that which is specified by the Trigger Buffer Position setting of “Early,” “Middle,” or “Late”. Pre-trigger transactions would then constitute a portion of all transactions in the filled buffer equal to, at most, 15%, 50%, or 85% respectively. The percentage of pre-trigger transactions is less than this amount when there are not enough transactions collected before the trigger event occurs. Tag Line – Tag the triggering line in the Monitor’s trace list. This is a built-in action for the TRIGGER state Counters Counters are numerical variables that can be incremented, decremented, set, and compared to user-defined values during the course of the multi-level triggering process. This component allows users to keep track of the repeated number of matching events.
124 Bus Traffic Monitor
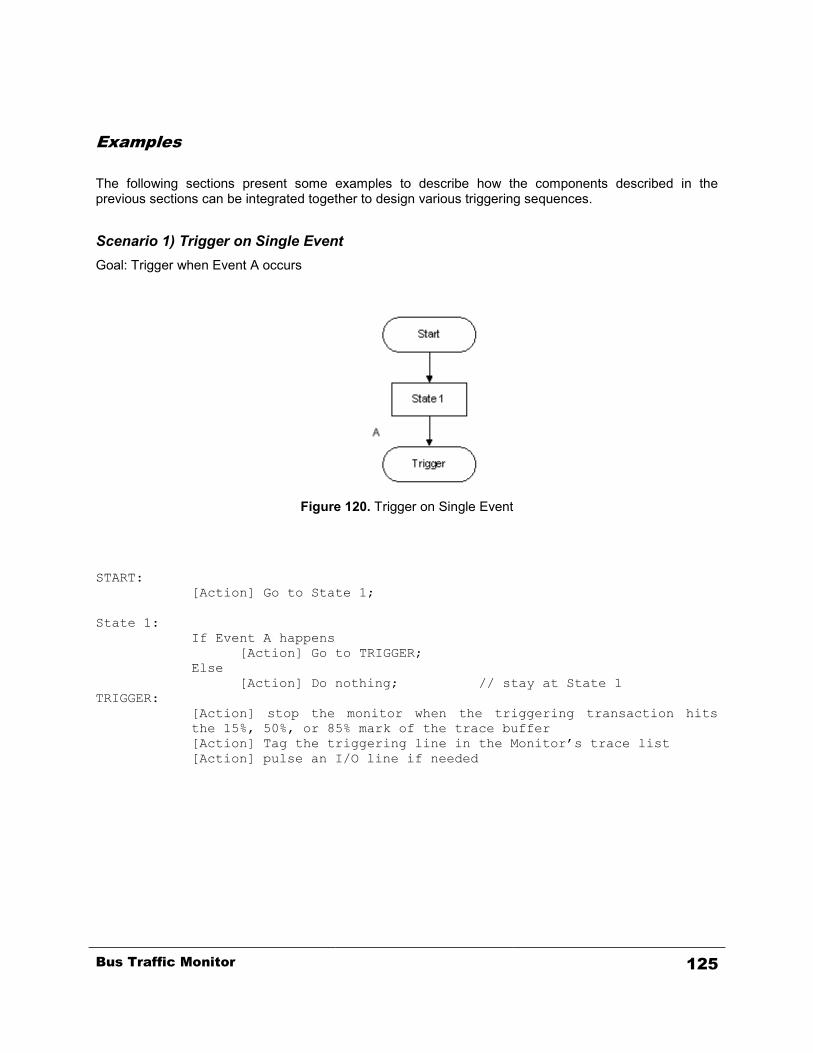
Examples The following sections present some examples to describe how the components described in the previous sections can be integrated together to design various triggering sequences. Scenario 1) Trigger on Single Event Goal: Trigger when Event A occurs
Figure 120. Trigger on Single Event
START:
[Action] Go to State 1; State 1:
If Event A happens [Action] Go to TRIGGER; Else [Action] Do nothing; // stay at State 1 TRIGGER:
[Action] stop the monitor when the triggering transaction hits the 15%, 50%, or 85% mark of the trace buffer
[Action] Tag the triggering line in the Monitor’s trace list [Action] pulse an I/O line if needed
Bus Traffic Monitor 125
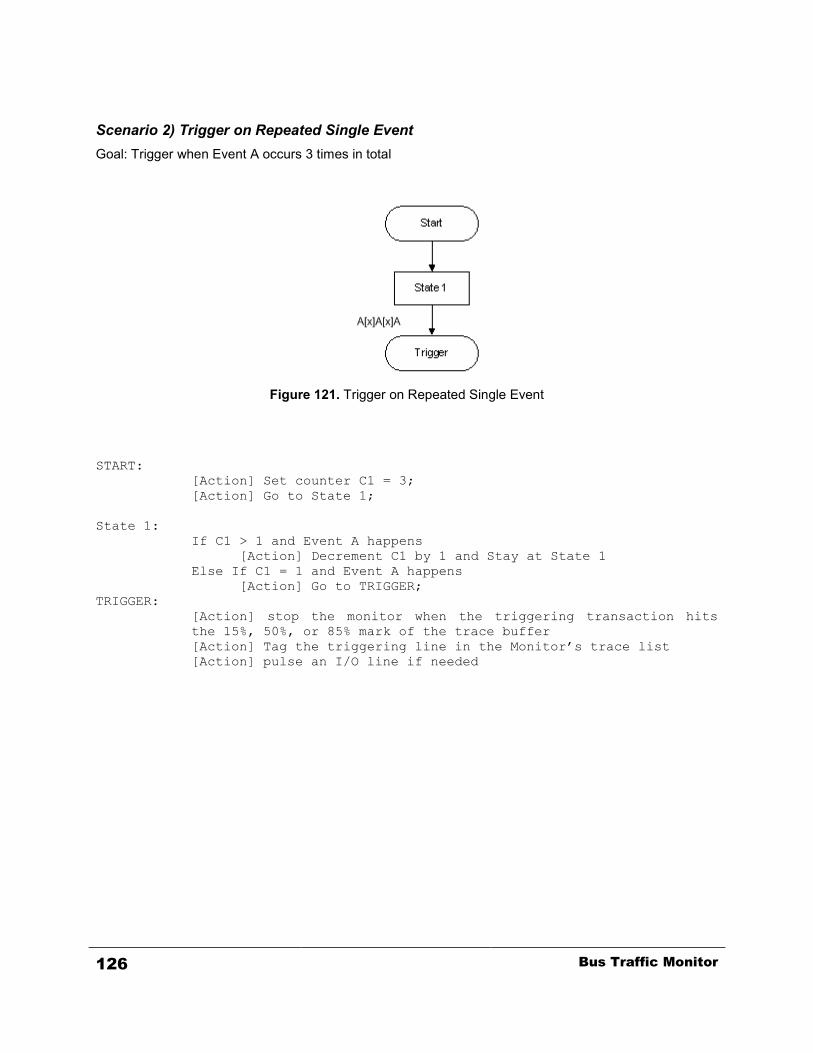
Scenario 2) Trigger on Repeated Single Event Goal: Trigger when Event A occurs 3 times in total
Figure 121. Trigger on Repeated Single Event
START:
[Action] Set counter C1 = 3; [Action] Go to State 1; State 1:
If C1 > 1 and Event A happens [Action] Decrement C1 by 1 and Stay at State 1 Else If C1 = 1 and Event A happens [Action] Go to TRIGGER; TRIGGER:
[Action] stop the monitor when the triggering transaction hits the 15%, 50%, or 85% mark of the trace buffer
[Action] Tag the triggering line in the Monitor’s trace list [Action] pulse an I/O line if needed
126 Bus Traffic Monitor
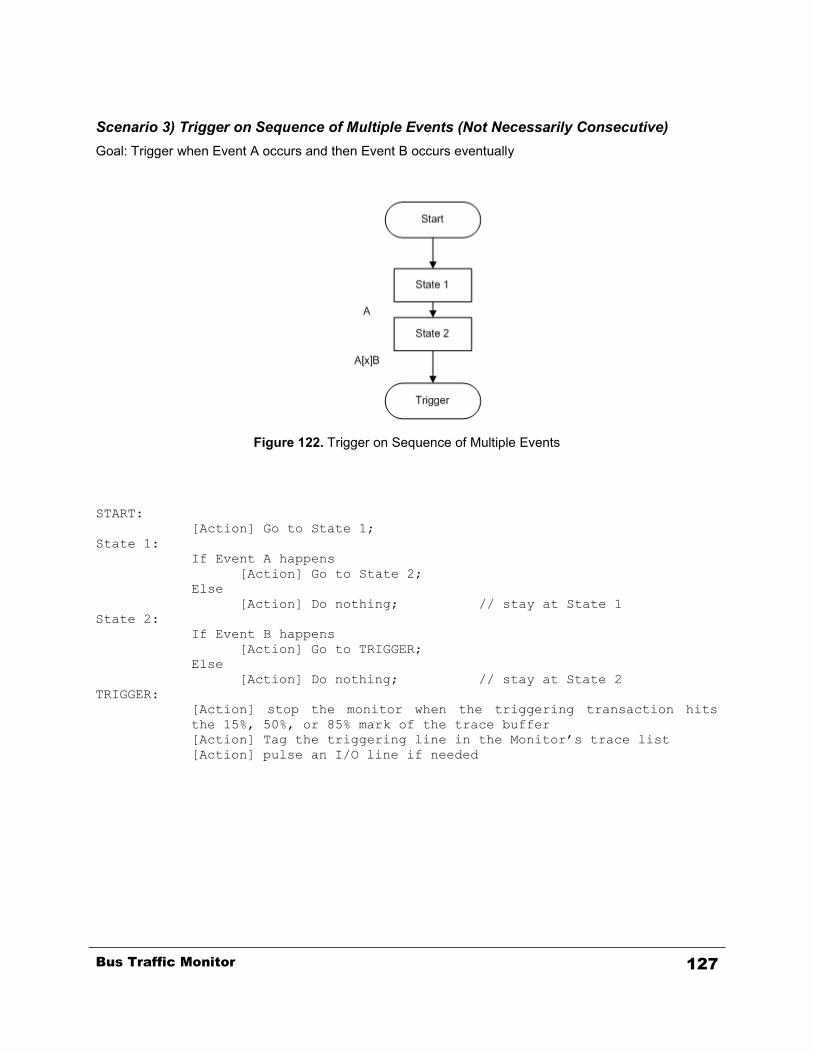
Scenario 3) Trigger on Sequence of Multiple Events (Not Necessarily Consecutive) Goal: Trigger when Event A occurs and then Event B occurs eventually
Figure 122. Trigger on Sequence of Multiple Events
START: [Action] Go to State 1; State 1:
If Event A happens [Action] Go to State 2; Else [Action] Do nothing; // stay at State 1 State 2:
If Event B happens [Action] Go to TRIGGER; Else
[Action] Do nothing; // stay at State 2 TRIGGER:
[Action] stop the monitor when the triggering transaction hits the 15%, 50%, or 85% mark of the trace buffer
[Action] Tag the triggering line in the Monitor’s trace list [Action] pulse an I/O line if needed
Bus Traffic Monitor 127
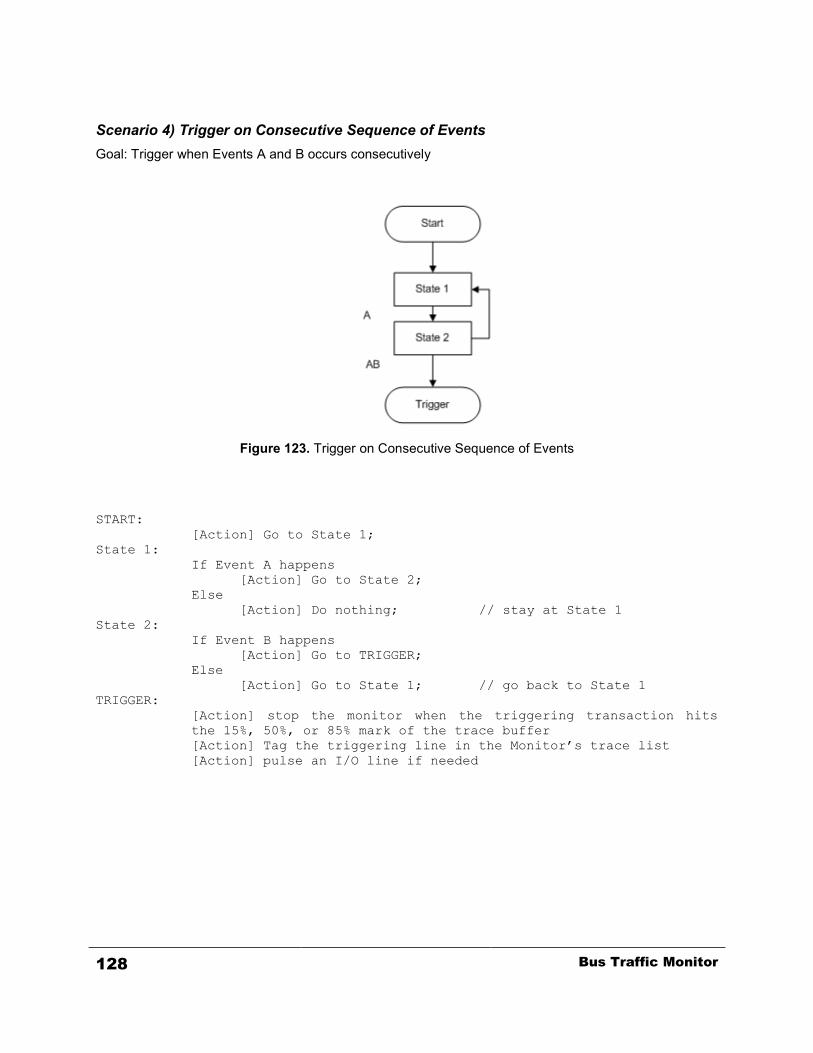
Scenario 4) Trigger on Consecutive Sequence of Events Goal: Trigger when Events A and B occurs consecutively
Figure 123. Trigger on Consecutive Sequence of Events
START: [Action] Go to State 1; State 1:
If Event A happens [Action] Go to State 2; Else [Action] Do nothing; // stay at State 1 State 2:
If Event B happens [Action] Go to TRIGGER; Else
[Action] Go to State 1; // go back to State 1 TRIGGER:
[Action] stop the monitor when the triggering transaction hits the 15%, 50%, or 85% mark of the trace buffer
[Action] Tag the triggering line in the Monitor’s trace list [Action] pulse an I/O line if needed
128 Bus Traffic Monitor
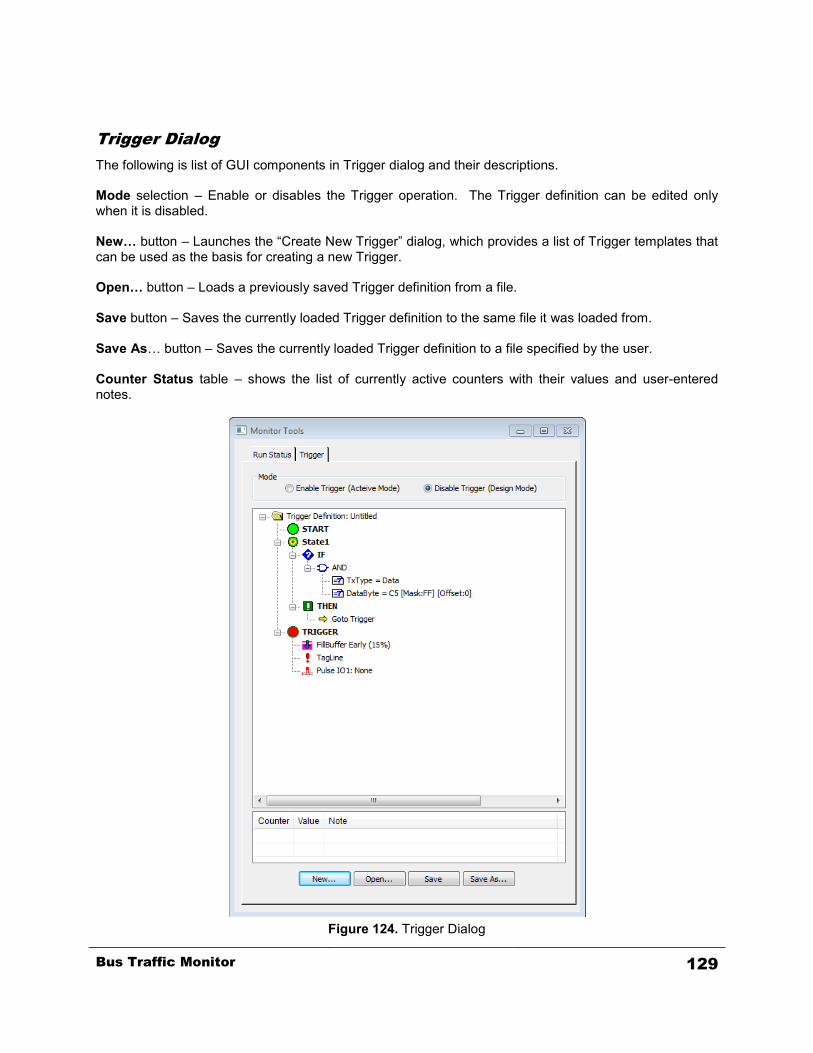
Trigger Dialog The following is list of GUI components in Trigger dialog and their descriptions. Mode selection – Enable or disables the Trigger operation. The Trigger definition can be edited only when it is disabled. New… button – Launches the “Create New Trigger” dialog, which provides a list of Trigger templates that can be used as the basis for creating a new Trigger. Open… button – Loads a previously saved Trigger definition from a file. Save button – Saves the currently loaded Trigger definition to the same file it was loaded from. Save As… button – Saves the currently loaded Trigger definition to a file specified by the user. Counter Status table – shows the list of currently active counters with their values and user-entered notes.
Figure 124. Trigger Dialog
Bus Traffic Monitor 129
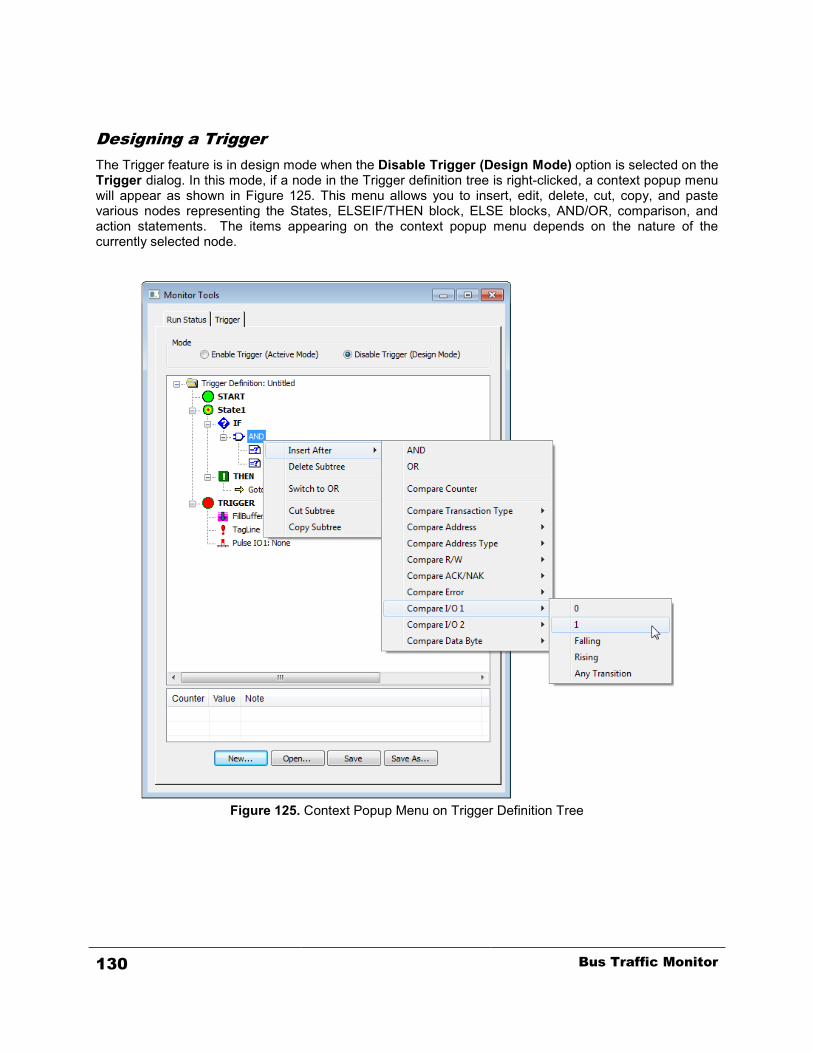
Designing a Trigger The Trigger feature is in design mode when the Disable Trigger (Design Mode) option is selected on the Trigger dialog. In this mode, if a node in the Trigger definition tree is right-clicked, a context popup menu will appear as shown in Figure 125. This menu allows you to insert, edit, delete, cut, copy, and paste various nodes representing the States, ELSEIF/THEN block, ELSE blocks, AND/OR, comparison, and action statements. The items appearing on the context popup menu depends on the nature of the currently selected node.
Figure 125. Context Popup Menu on Trigger Definition Tree
130 Bus Traffic Monitor
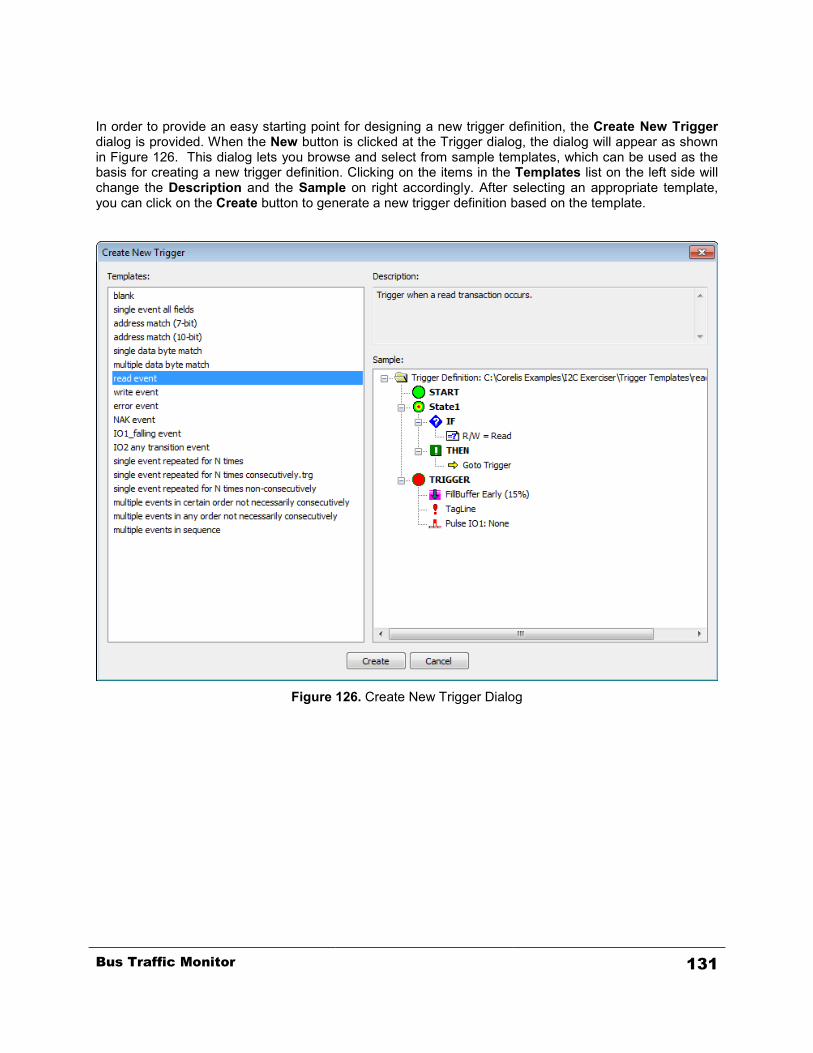
In order to provide an easy starting point for designing a new trigger definition, the Create New Trigger dialog is provided. When the New button is clicked at the Trigger dialog, the dialog will appear as shown in Figure 126. This dialog lets you browse and select from sample templates, which can be used as the basis for creating a new trigger definition. Clicking on the items in the Templates list on the left side will change the Description and the Sample on right accordingly. After selecting an appropriate template, you can click on the Create button to generate a new trigger definition based on the template.
Figure 126. Create New Trigger Dialog
Bus Traffic Monitor 131

Activating Trigger The Trigger feature is activated when the Enable Trigger option is selected at the Trigger dialog, and the Monitor is running. When I2C Exerciser is collecting bus data in Run Single mode and the Trigger is disabled, the capturing process will stop automatically once the buffer becomes full. No trigger operation will be performed, and no transaction marker will appear in the trace listing. If the Trigger is enabled, however, the monitor will continue to capture new transactions even after the buffer becomes full, until the trigger event occurs. Old transactions will be thrown out in order to accommodate the new ones once the buffer is full. If the trigger event occurs, the capturing stops automatically when enough post-trigger transactions have been collected to fill the buffer, such that the trigger’s position in the buffer space reaches that which is specified by the FillBuffer setting of “Early,” “Middle,” or “Late.” Pre-trigger transactions would then constitute a portion of all transactions in the filled buffer equal to, at most, 15%, 50%, or 85% respectively. The percentage of pre-trigger transactions is less than this amount when there are not enough transactions collected before the trigger event occurs. At any time, the capturing of transactions can be stopped by the user, in which case the rules for the positioning of the trigger transaction in the buffer space do not apply. When I2C Exerciser is collecting bus data in Run Repetitive mode, occurrence of the trigger event will not cause the capture process to stop. The monitor will stop capturing transactions only when the user explicitly invokes the stop command. Since the buffer space is limited, old transactions will be thrown out in order to accommodate the new ones once the buffer becomes full. In such cases, the trigger transaction may also get thrown out. The Pulse IO action provides a link between the incoming trigger events to a trigger out signal through one of the discrete I/O’s. When the Pulse IO action is set to one of two discrete I/O’s, the signal will pulse high or low according to the ActiveHigh or ActiveLow setting when the specified trigger event occurs. The width of the pulse is about 0.5 ms, and the typical delay between the actual trigger event on the bus and the trigger out pulse is approximately 1.6 ms. This delay may vary from 1.5 ms to 150 ms depending on the data traffic load. While the Trigger is in Active mode, the current state of the trigger operation is indicated with a flashing arrow, and the counter values are updated accordingly as shown in Figure 127.
132 Bus Traffic Monitor

Figure 127. Active Trigger Operation Status
Bus Traffic Monitor 133
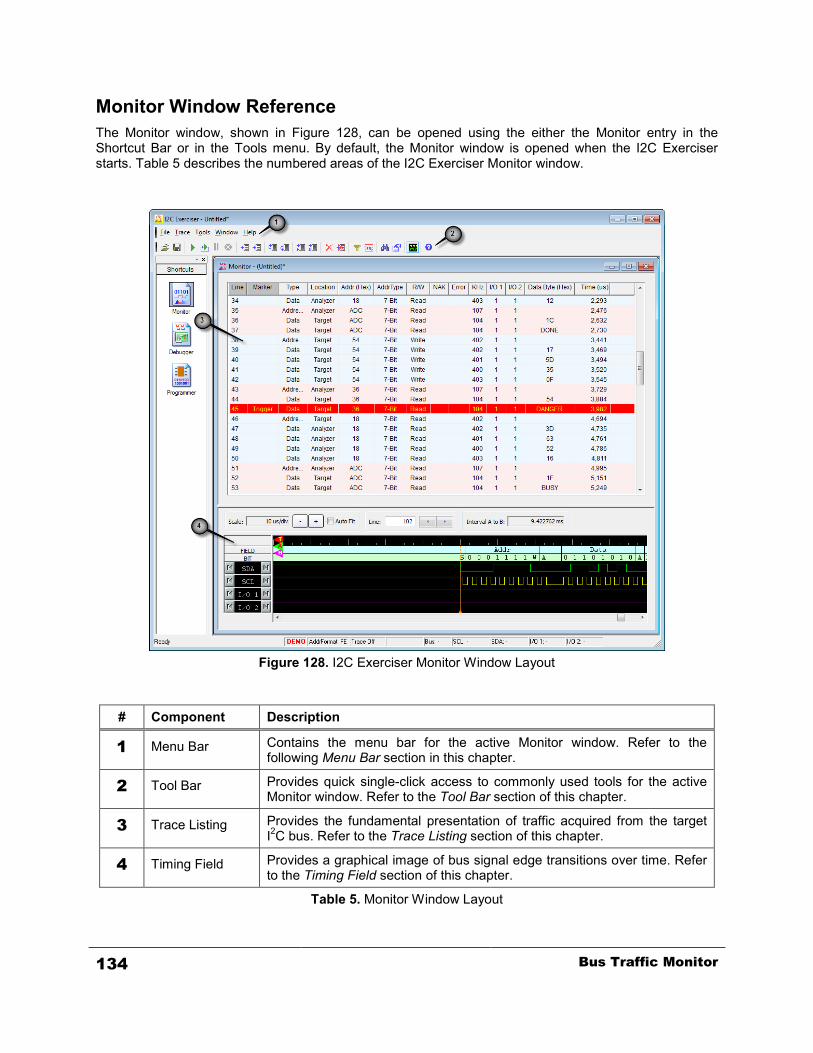
Monitor Window Reference The Monitor window, shown in Figure 128, can be opened using the either the Monitor entry in the Shortcut Bar or in the Tools menu. By default, the Monitor window is opened when the I2C Exerciser starts. Table 5 describes the numbered areas of the I2C Exerciser Monitor window.
Figure 128. I2C Exerciser Monitor Window Layout
# Component Description
1 Menu Bar Contains the menu bar for the active Monitor window. Refer to the following Menu Bar section in this chapter.
2 Tool Bar Provides quick single-click access to commonly used tools for the active Monitor window. Refer to the Tool Bar section of this chapter.
3 Trace Listing Provides the fundamental presentation of traffic acquired from the target I2C bus. Refer to the Trace Listing section of this chapter.
4 Timing Field Provides a graphical image of bus signal edge transitions over time. Refer to the Timing Field section of this chapter.
Table 5. Monitor Window Layout
134 Bus Traffic Monitor
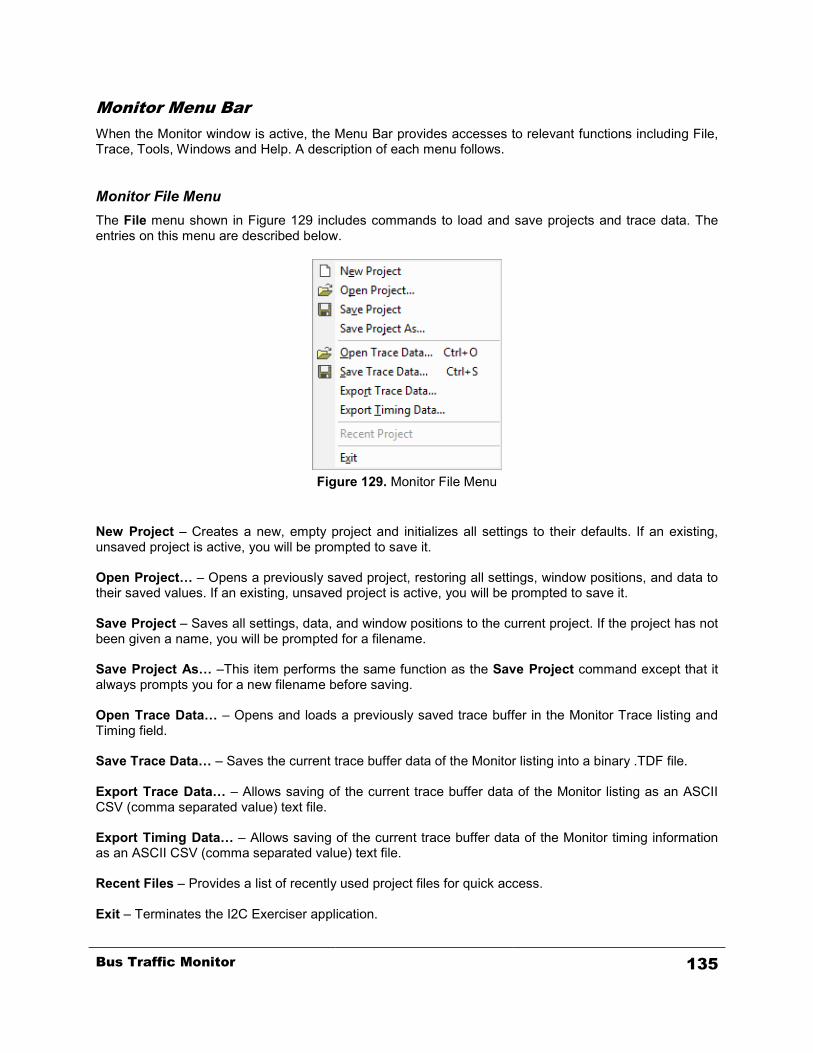
Monitor Menu Bar When the Monitor window is active, the Menu Bar provides accesses to relevant functions including File, Trace, Tools, Windows and Help. A description of each menu follows.
Monitor File Menu The File menu shown in Figure 129 includes commands to load and save projects and trace data. The entries on this menu are described below.
Figure 129. Monitor File Menu
New Project – Creates a new, empty project and initializes all settings to their defaults. If an existing, unsaved project is active, you will be prompted to save it. Open Project… – Opens a previously saved project, restoring all settings, window positions, and data to their saved values. If an existing, unsaved project is active, you will be prompted to save it. Save Project – Saves all settings, data, and window positions to the current project. If the project has not been given a name, you will be prompted for a filename. Save Project As… –This item performs the same function as the Save Project command except that it always prompts you for a new filename before saving. Open Trace Data… – Opens and loads a previously saved trace buffer in the Monitor Trace listing and Timing field. Save Trace Data… – Saves the current trace buffer data of the Monitor listing into a binary .TDF file. Export Trace Data… – Allows saving of the current trace buffer data of the Monitor listing as an ASCII CSV (comma separated value) text file. Export Timing Data… – Allows saving of the current trace buffer data of the Monitor timing information as an ASCII CSV (comma separated value) text file. Recent Files – Provides a list of recently used project files for quick access. Exit – Terminates the I2C Exerciser application.
Bus Traffic Monitor 135
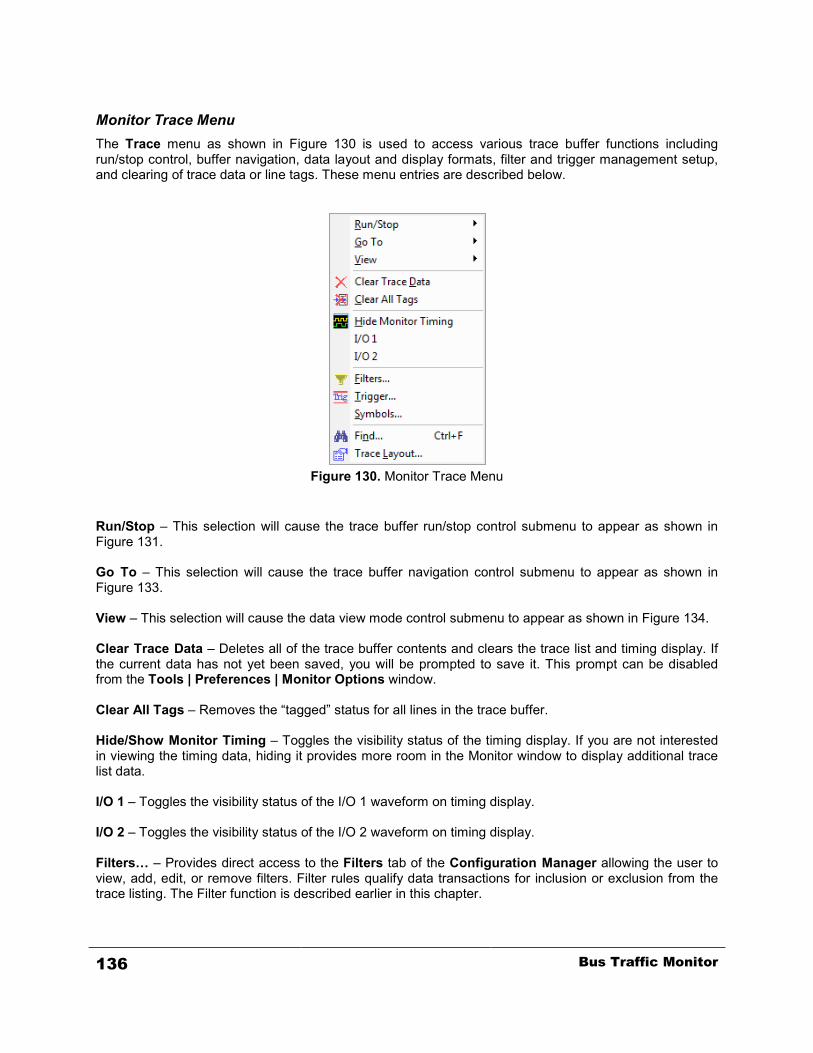
Monitor Trace Menu The Trace menu as shown in Figure 130 is used to access various trace buffer functions including run/stop control, buffer navigation, data layout and display formats, filter and trigger management setup, and clearing of trace data or line tags. These menu entries are described below.
Figure 130. Monitor Trace Menu
Run/Stop – This selection will cause the trace buffer run/stop control submenu to appear as shown in Figure 131. Go To – This selection will cause the trace buffer navigation control submenu to appear as shown in Figure 133. View – This selection will cause the data view mode control submenu to appear as shown in Figure 134. Clear Trace Data – Deletes all of the trace buffer contents and clears the trace list and timing display. If the current data has not yet been saved, you will be prompted to save it. This prompt can be disabled from the Tools | Preferences | Monitor Options window. Clear All Tags – Removes the “tagged” status for all lines in the trace buffer. Hide/Show Monitor Timing – Toggles the visibility status of the timing display. If you are not interested in viewing the timing data, hiding it provides more room in the Monitor window to display additional trace list data. I/O 1 – Toggles the visibility status of the I/O 1 waveform on timing display. I/O 2 – Toggles the visibility status of the I/O 2 waveform on timing display. Filters… – Provides direct access to the Filters tab of the Configuration Manager allowing the user to view, add, edit, or remove filters. Filter rules qualify data transactions for inclusion or exclusion from the trace listing. The Filter function is described earlier in this chapter.
136 Bus Traffic Monitor

Trigger… – Provides access to the Trigger dialog allowing the user to view or edit the trigger condition. The trigger defines conditions to mark a special transaction event in the trace buffer. The Trigger function is described earlier in this chapter. Symbols… – Provides access to the Symbols tab of the Configuration Manager allowing the viewing, adding, editing, or removing of the symbol definitions used for trace list address and data substitution. The Symbols function will be described in more detail later in this chapter. Find… – Launches the Find dialog in either the regular (“More”) or compact (“Less”) mode depending on the last used size as shown in Figure 135 and Figure 136. This dialog allows the user to search through the trace listing for transactions matching the specified pattern. Trace Layout… – Launches the Trace Layout dialog as in Figure 137 which allows customization of the trace listing columns. Trace | Run/Stop Submenu The Trace | Run/Stop submenu shown in Figure 131 provides run control of the Monitor window trace buffer.
Figure 131. Trace | Execute Submenu
Run Single – Begins bus traffic acquisition until the number of acquired transactions equals the configured trace buffer depth. The Run Status tab shown in Figure 132 will be displayed showing the progression of this activity until it completes either by the trace buffer becoming full or by the user manually stopping acquisition. The trace listing will scroll and update as new traffic is detected on the I2C test bus. If a Trigger is enabled, the Monitor will keep acquiring transactions, even if the buffer becomes full, until it detects the triggering event. When the event is detected, additional transactions will be acquired until either the specified trigger position (early, middle, or late) is reached or the user stops it manually. Some Monitor window commands are disabled while bus traffic is being accumulated. Run Repetitive – Begins bus traffic acquisition which will continue forever until the user stops the process. A Run Repetitive Status dialog similar to the Run Status tab in Figure 132 with identical functionality (as noted above for Run Single) will appear to show progress. If the buffer becomes full, the buffer will wrap and new entries will overwrite the oldest entries. When collecting transactions in this mode, having an active Trigger does not change the behavior. Some Monitor window commands are disabled while bus traffic is being accumulated. Pause – This command pauses bus traffic acquisition and enables all Monitor window commands. Subsequent Run Single or Run Repetitive command will continue to append newly acquired bus traffic to the existing trace data list. Stop – This command immediately stops bus traffic acquisition and enables all Monitor window commands.
Bus Traffic Monitor 137
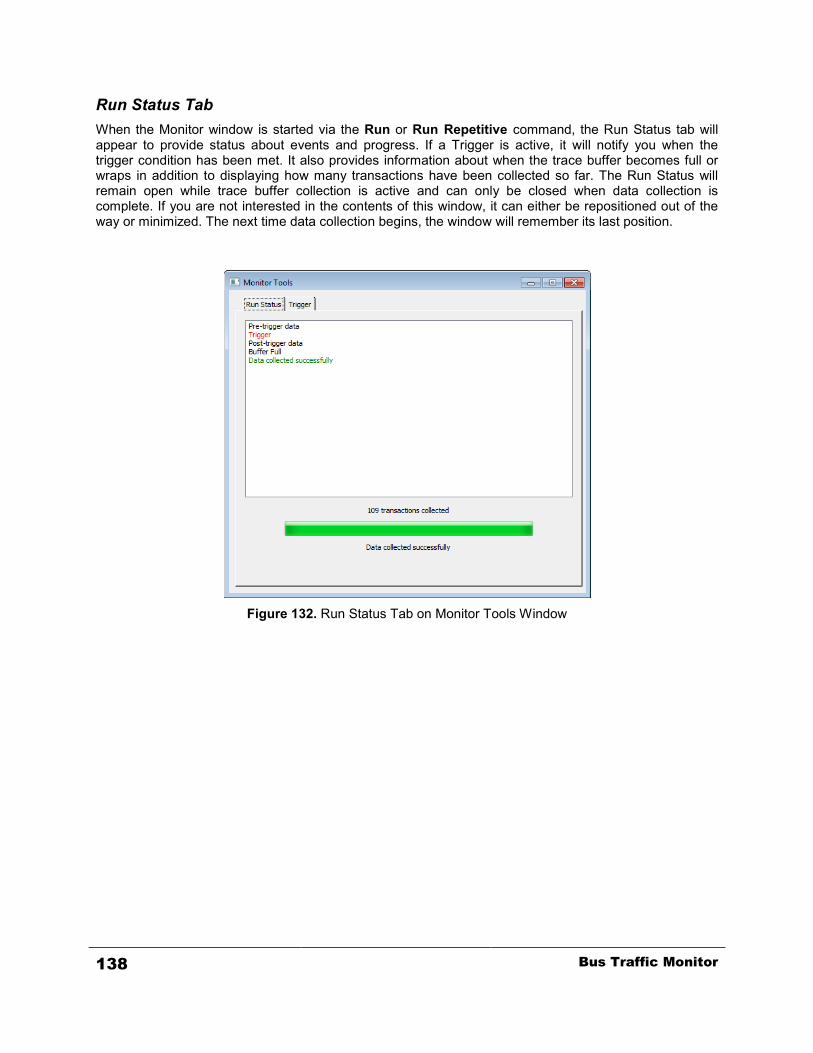
Run Status Tab When the Monitor window is started via the Run or Run Repetitive command, the Run Status tab will appear to provide status about events and progress. If a Trigger is active, it will notify you when the trigger condition has been met. It also provides information about when the trace buffer becomes full or wraps in addition to displaying how many transactions have been collected so far. The Run Status will remain open while trace buffer collection is active and can only be closed when data collection is complete. If you are not interested in the contents of this window, it can either be repositioned out of the way or minimized. The next time data collection begins, the window will remember its last position.
Figure 132. Run Status Tab on Monitor Tools Window
138 Bus Traffic Monitor

Trace | Go To Submenu The Trace | Go To submenu shown in Figure 133 provides navigation control for the Monitor window trace buffer.
Figure 133. Trace | Go To Submenu
Trigger – Causes the quick positioning of visible trace lines to bring the Trigger into view at the top of the screen. Tagged Row – Causes the quick positioning of visible trace lines to bring the next tagged line into view at the top of the screen. Start – Causes the quick positioning of visible trace lines to bring the first trace buffer line into view at the top of the screen. End – Causes the quick positioning of visible trace lines to bring the last trace buffer line into view at the bottom of the screen. Cursor A – Causes the quick positioning of visible trace lines to bring the Cursor A line into view at the top of the screen. Cursor B – Causes the quick positioning of visible trace lines to bring the Cursor B line into view at the top of the screen.
Bus Traffic Monitor 139

Trace | View Submenu The Trace | View submenu shown in Figure 134 provides data view mode control for the Monitor window Data Byte column.
Figure 134. Trace | View Submenu
Normal Mode – Causes the Data Byte column display to switch to the default Normal mode. When using Normal mode, the Data Byte column simply indicates the raw data byte values conveyed to or from a target slave device during a transaction, one byte per trace listing line. Compact Mode – Causes the Data Byte column display to switch to Compact mode. When using Compact mode, all data byte transactions following an address transaction will be displayed on a single trace listing line. SMBus Mode – Causes the Data Byte column display to switch to SMBus mode. When using SMBus mode, each data byte value of the transaction is decoded into a text SMBus message if the value is associated in an SMBus decoding file (refer to the SMBus section of this chapter).
140 Bus Traffic Monitor
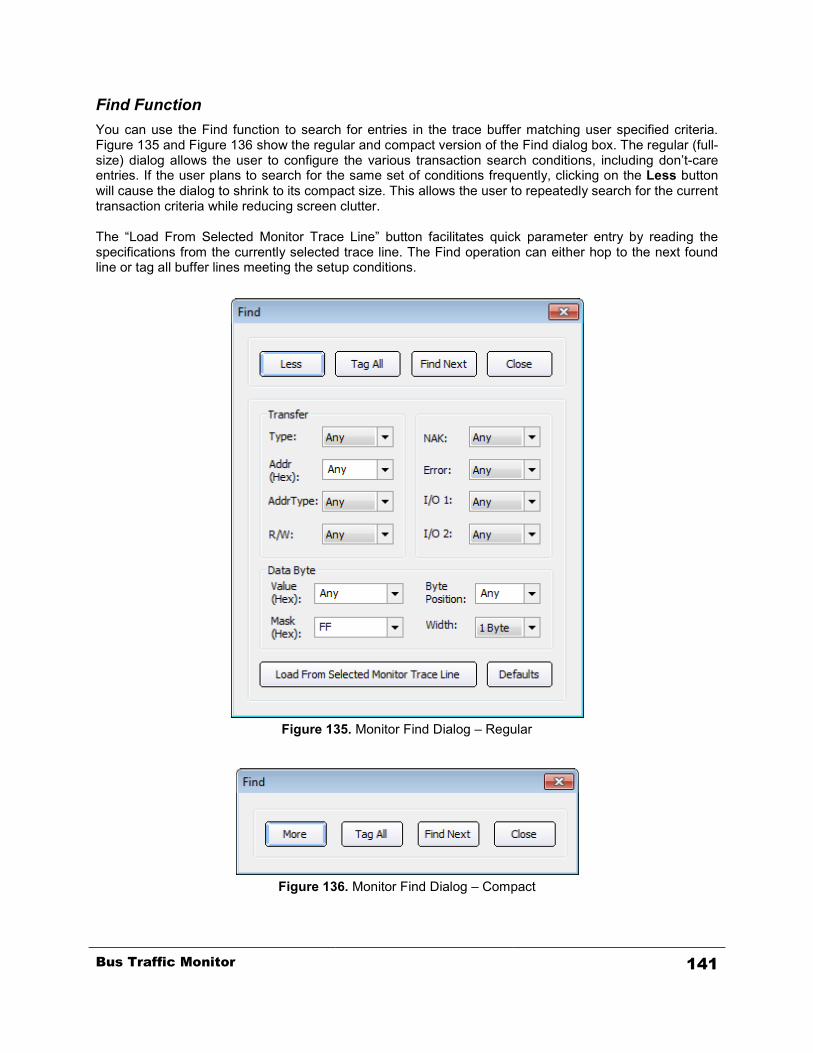
Find Function You can use the Find function to search for entries in the trace buffer matching user specified criteria. Figure 135 and Figure 136 show the regular and compact version of the Find dialog box. The regular (full-size) dialog allows the user to configure the various transaction search conditions, including don’t-care entries. If the user plans to search for the same set of conditions frequently, clicking on the Less button will cause the dialog to shrink to its compact size. This allows the user to repeatedly search for the current transaction criteria while reducing screen clutter. The “Load From Selected Monitor Trace Line” button facilitates quick parameter entry by reading the specifications from the currently selected trace line. The Find operation can either hop to the next found line or tag all buffer lines meeting the setup conditions.
Figure 135. Monitor Find Dialog – Regular
Figure 136. Monitor Find Dialog – Compact
Bus Traffic Monitor 141

Each of the Find window search criteria fields is described below. Type – Indicates that either an address or data transaction is being searched for. Select Any to specify “don’t-care.” Addr (Hex) – Specifies the address of interest. Select Any to specify “don’t-care”. If a 7-bit address is being entered, the hex address value should be entered properly according to the current “FE mode” or “7F mode” setting. Addr Type – Indicates that either a 7-bit, 10-bit, or Hs-mode address type transaction is being searched for. Select Any to specify “don’t-care.” Note that if there is an address in the Addr field, this field may not be Any. R/W – Indicates that either a read or write transaction is being searched for. Select Any to specify “don’t-care.” NAK – Indicates that a transaction with either an acknowledge (ACK) or not-acknowledge (NAK) is being searched for. Select Any to specify “don’t-care.” Error – Indicates that a transaction with a protocol error or no protocol error is being searched for. Select Any to specify “don’t-care.” I/O 1 – Indicates that discrete I/O line 1 should have a specific value of 0, 1, falling, rising, toggling, or any transition during a transaction. Select Any to specify “don’t-care.” I/O 2 – Indicates that discrete I/O line 2 should have a specific value of 0, 1, falling, rising, toggling, or any transition during a transaction. Select Any to specify “don’t-care.” Value – Specifies the data byte value of interest. Select Any to specify “don’t-care.” Mask – Specifies a data byte mask which is applied to all data bytes before comparing them to the configured data value of interest. This allows the user to isolate individual bits of interest. Select FF to always compare all eight bits of each data value. Byte Position – Allows the user to select a specific data byte position within each message to do the data value comparison on. Select Any to specify “don’t-care.” Width – Specifies the number of data bytes contained in the search pattern. The default value is one byte.
142 Bus Traffic Monitor
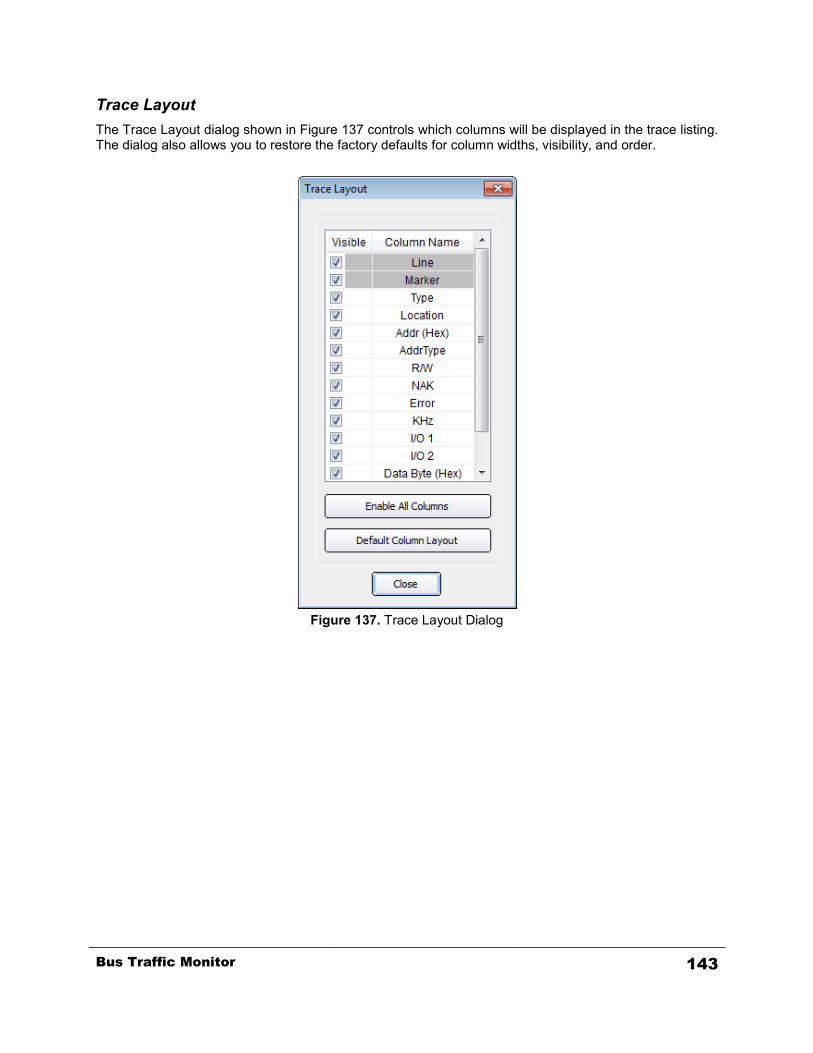
Trace Layout The Trace Layout dialog shown in Figure 137 controls which columns will be displayed in the trace listing. The dialog also allows you to restore the factory defaults for column widths, visibility, and order.
Figure 137. Trace Layout Dialog
Bus Traffic Monitor 143

Monitor Tools Menu The Tools menu shown in Figure 138 provides a path to the major application function windows.
Figure 138. Tools Menu
Monitor – Launches the Monitor window which provides acquisition and viewing of bus traffic transactions. Debugger – Launches the Debugger window which provides interactive sending and receiving of messages to and from the bus. Programmer – Launches the Programmer window which allows EEPROM memory programming and viewing of supported devices using the I2C bus. Emulator – Launches the Emulation Manager window which allows the configuration and assignment of script program files to virtual devices to be emulated by the CAS-1000-I2C. Test – Launches the Test window which provides execution of script files to generate customized bus interactions and measurements in order to validate target bus functionality Parameters Scope – Launches the Parameters Scope dialog which allows measurement of various bus signal parameters. Editor – Launches the Editor window which provides intelligent editing of master and slave script files. Glitch Pattern Editor – Launches the Glitch Pattern Editor window which allows creating, testing, and saving of glitch patterns to be used in emulation scripts. Demo Mode – Switches between Demo Mode and Live Data Mode. A check mark is placed to the left of this menu item to indicate that the I2C Exerciser application is in the demo mode. Self-Test – Launches a test sequence to validate the basic proper operation of the CAS-1000-I2C hardware.
144 Bus Traffic Monitor

Calibration – Launches an automated tool that calibrates the CAS-1000-I2C electrical outputs in order to improve analyzer supplied voltage source settings. Configuration Manager – Invokes the Configuration Manager window which allows the user to configure numerous system-wide settings including filters, symbols, SMBus, hardware options, and project files. Preferences – Invokes the Preferences dialog which allows the user to alter configurable settings of each individual tool window.
Bus Traffic Monitor 145
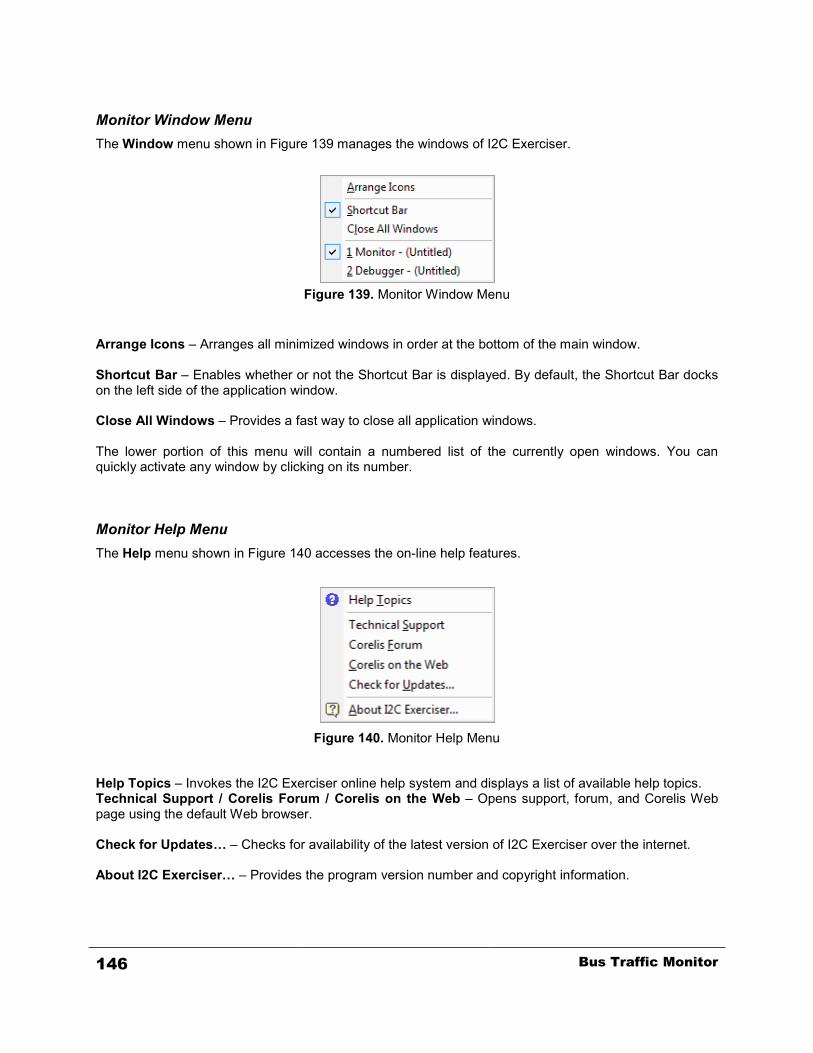
Monitor Window Menu The Window menu shown in Figure 139 manages the windows of I2C Exerciser.
Figure 139. Monitor Window Menu
Arrange Icons – Arranges all minimized windows in order at the bottom of the main window. Shortcut Bar – Enables whether or not the Shortcut Bar is displayed. By default, the Shortcut Bar docks on the left side of the application window. Close All Windows – Provides a fast way to close all application windows. The lower portion of this menu will contain a numbered list of the currently open windows. You can quickly activate any window by clicking on its number.
Monitor Help Menu The Help menu shown in Figure 140 accesses the on-line help features.
Figure 140. Monitor Help Menu
Help Topics – Invokes the I2C Exerciser online help system and displays a list of available help topics. Technical Support / Corelis Forum / Corelis on the Web – Opens support, forum, and Corelis Web page using the default Web browser. Check for Updates… – Checks for availability of the latest version of I2C Exerciser over the internet. About I2C Exerciser… – Provides the program version number and copyright information.
146 Bus Traffic Monitor
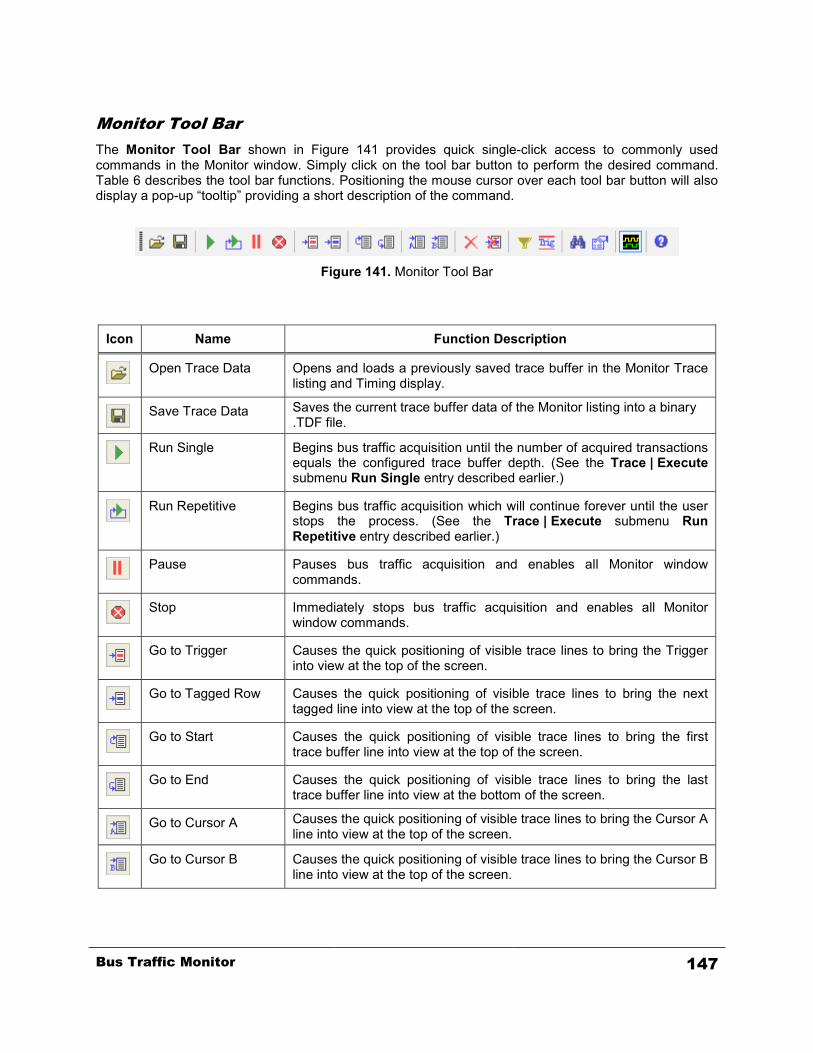
Monitor Tool Bar The Monitor Tool Bar shown in Figure 141 provides quick single-click access to commonly used commands in the Monitor window. Simply click on the tool bar button to perform the desired command. Table 6 describes the tool bar functions. Positioning the mouse cursor over each tool bar button will also display a pop-up “tooltip” providing a short description of the command.
Figure 141. Monitor Tool Bar
Icon Name Function Description
Open Trace Data Opens and loads a previously saved trace buffer in the Monitor Trace
listing and Timing display.
Save Trace Data Saves the current trace buffer data of the Monitor listing into a binary
.TDF file.
Run Single Begins bus traffic acquisition until the number of acquired transactions
equals the configured trace buffer depth. (See the Trace | Execute submenu Run Single entry described earlier.)
Run Repetitive Begins bus traffic acquisition which will continue forever until the user
stops the process. (See the Trace | Execute submenu Run Repetitive entry described earlier.)
Pause Pauses bus traffic acquisition and enables all Monitor window
commands.
Stop Immediately stops bus traffic acquisition and enables all Monitor
window commands.
Go to Trigger Causes the quick positioning of visible trace lines to bring the Trigger
into view at the top of the screen.
Go to Tagged Row Causes the quick positioning of visible trace lines to bring the next
tagged line into view at the top of the screen.
Go to Start Causes the quick positioning of visible trace lines to bring the first
trace buffer line into view at the top of the screen.
Go to End Causes the quick positioning of visible trace lines to bring the last
trace buffer line into view at the bottom of the screen.
Go to Cursor A Causes the quick positioning of visible trace lines to bring the Cursor A
line into view at the top of the screen.
Go to Cursor B Causes the quick positioning of visible trace lines to bring the Cursor B
line into view at the top of the screen.
Bus Traffic Monitor 147

Icon Name Function Description
Clear Trace Data Deletes all of the trace buffer contents and clears the trace list and
timing display. If the current data has not yet been saved, you will be prompted to save it. This prompt can be disabled from the Tools | Preferences | Monitor Options screen.
Clear Tagged Rows Removes the “tagged” status for all lines in the trace buffer.
Filters Provides direct access to the Filters tab of the Configuration
Manager allowing the user to view, add, edit, or remove filters. Filter rules qualify data transactions for inclusion or exclusion from the trace listing.
Triggers Provides access to the Trigger dialog allowing the user to view or edit
the trigger condition. The trigger defines conditions to mark a special transaction event in the trace buffer
Find Launches the Find dialog allowing the user to search through the trace
listing for transactions matching the specified pattern.
Trace Layout Launches the Trace Layout dialog allowing customization of the trace
listing columns.
Hide/Show Monitor Timing
Toggles the visibility status of the timing display. If you are not interested in viewing the timing data, hiding it provides more room in the Monitor window to display additional trace list data.
Help Provides quick access to the online help topics.
Table 6. Monitor Tool Bar Functions
148 Bus Traffic Monitor

Bus Traffic Monitor 149
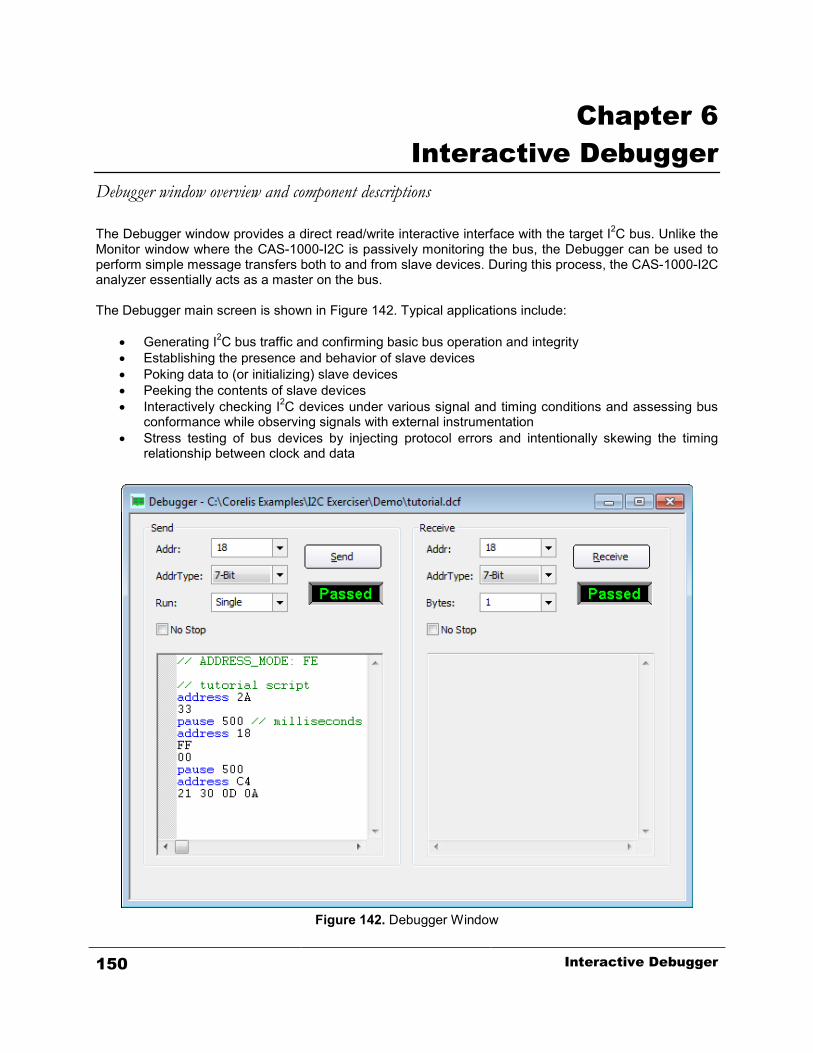
Chapter 6 Interactive Debugger
Debugger window overview and component descriptions
The Debugger window provides a direct read/write interactive interface with the target I2C bus. Unlike the Monitor window where the CAS-1000-I2C is passively monitoring the bus, the Debugger can be used to perform simple message transfers both to and from slave devices. During this process, the CAS-1000-I2C analyzer essentially acts as a master on the bus. The Debugger main screen is shown in Figure 142. Typical applications include:
• Generating I2C bus traffic and confirming basic bus operation and integrity • Establishing the presence and behavior of slave devices • Poking data to (or initializing) slave devices • Peeking the contents of slave devices • Interactively checking I2C devices under various signal and timing conditions and assessing bus
conformance while observing signals with external instrumentation • Stress testing of bus devices by injecting protocol errors and intentionally skewing the timing
relationship between clock and data
Figure 142. Debugger Window
150 Interactive Debugger
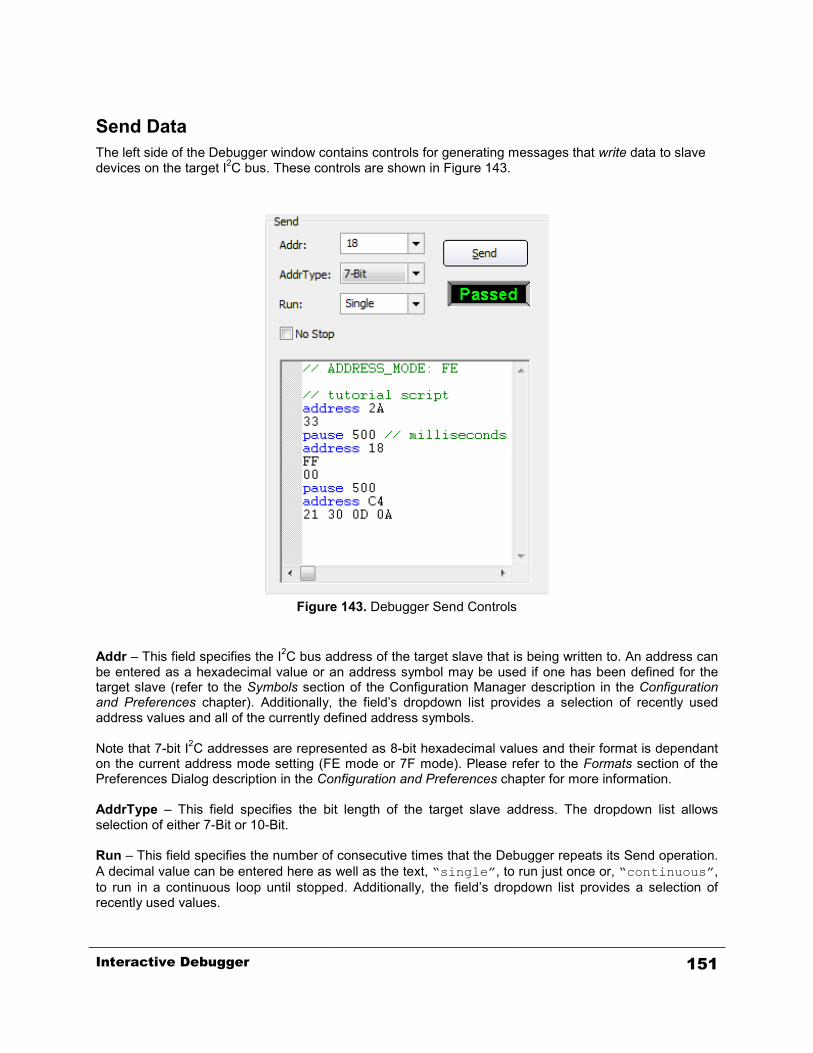
Send Data The left side of the Debugger window contains controls for generating messages that write data to slave devices on the target I2C bus. These controls are shown in Figure 143.
Figure 143. Debugger Send Controls
Addr – This field specifies the I2C bus address of the target slave that is being written to. An address can be entered as a hexadecimal value or an address symbol may be used if one has been defined for the target slave (refer to the Symbols section of the Configuration Manager description in the Configuration and Preferences chapter). Additionally, the field’s dropdown list provides a selection of recently used address values and all of the currently defined address symbols. Note that 7-bit I2C addresses are represented as 8-bit hexadecimal values and their format is dependant on the current address mode setting (FE mode or 7F mode). Please refer to the Formats section of the Preferences Dialog description in the Configuration and Preferences chapter for more information. AddrType – This field specifies the bit length of the target slave address. The dropdown list allows selection of either 7-Bit or 10-Bit. Run – This field specifies the number of consecutive times that the Debugger repeats its Send operation. A decimal value can be entered here as well as the text, “single”, to run just once or, “continuous”, to run in a continuous loop until stopped. Additionally, the field’s dropdown list provides a selection of recently used values.
Interactive Debugger 151

No Stop – This check box specifies whether a STOP condition is generated at the end of a message. When unchecked (default), the STOP condition is included after all of a message’s data bytes have been written. Checking this box causes the STOP condition to be omitted. Under the I2C bus protocol, absence of the STOP condition means that a master is not yet done transmitting. The previous data transfer can then be followed by a repeated START condition and another data transfer. This can be used to support some slave devices which require that the first data transfer specify the value of an offset register (or a command) and then the following data is written to (or read from) the device at that offset location. Send text box – The large text area constituting the bottom portion of the Debugger’s Send controls is used to specify the data bytes that are written to a target slave device. These data bytes are entered as sequences of two-digit hexadecimal values. Debugger script commands can also be entered here in order to execute more complex Send operations or to perform Error Injection. These script commands are explained later in this chapter. Send button – Clicking on this button begins the operation of writing to a target slave device. During the Send operation, this button becomes a Stop button that allows the operation to be cancelled. Depending on the user preference that has been set, the Debugger may abort its Send operation if a message is not acknowledged (NAK’d) by the specified target slave device (by default, the Debugger continues to send data even when NAK’d). Additionally, all data bytes that are successfully transmitted using the Debugger are listed in the text box on the Receive side of the Debugger window by default. Refer to the Debugger Options section of this chapter for more information on user preferences. Status Box – This indicator is located just below the Send button and displays the resulting status of the last Send operation. The following can be indicated:
Indicates that the Send operation completed successfully with the proper number of data bytes written to the target slave.
Indicates that an I2C bus protocol violation was detected during the Send operation. Using the I2C Exerciser’s Monitor window to capture the Debugger’s bus transactions can help to acquire more details about the cause of the error.
Indicates that the Send operation was not completed. When a timeout occurs, a message box is displayed to suggest possible reasons for the timeout.
152 Interactive Debugger
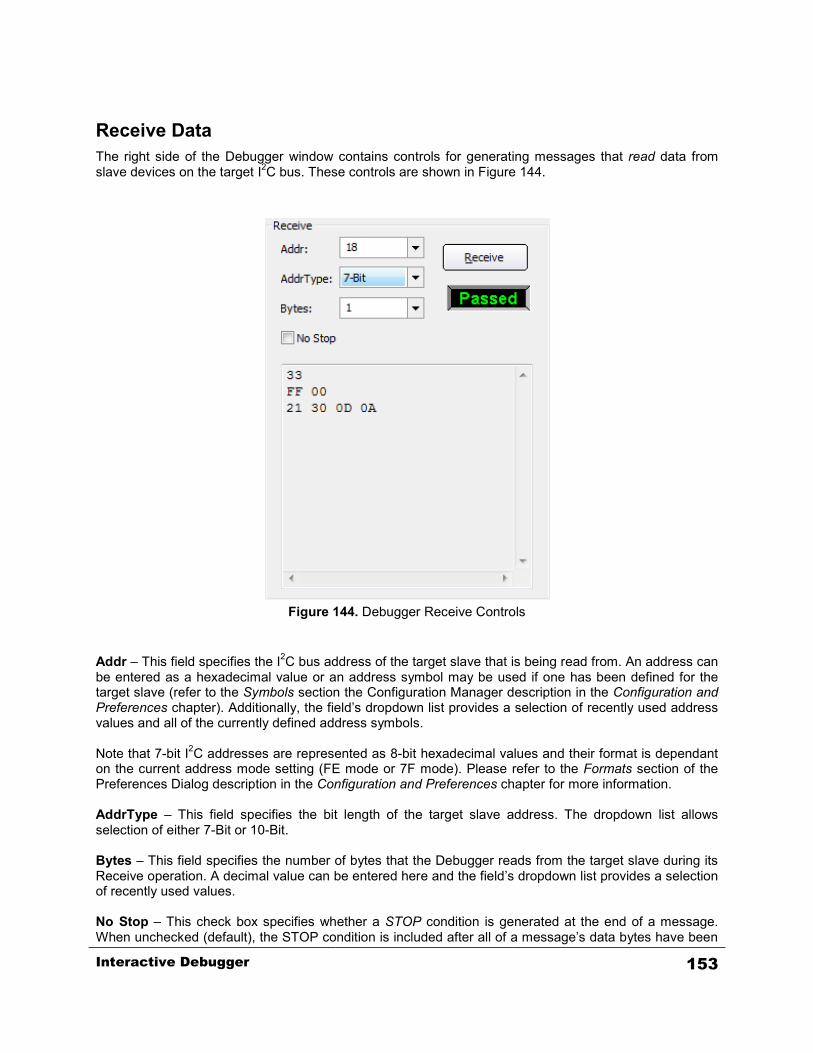
Receive Data The right side of the Debugger window contains controls for generating messages that read data from slave devices on the target I2C bus. These controls are shown in Figure 144.
Figure 144. Debugger Receive Controls
Addr – This field specifies the I2C bus address of the target slave that is being read from. An address can be entered as a hexadecimal value or an address symbol may be used if one has been defined for the target slave (refer to the Symbols section the Configuration Manager description in the Configuration and Preferences chapter). Additionally, the field’s dropdown list provides a selection of recently used address values and all of the currently defined address symbols. Note that 7-bit I2C addresses are represented as 8-bit hexadecimal values and their format is dependant on the current address mode setting (FE mode or 7F mode). Please refer to the Formats section of the Preferences Dialog description in the Configuration and Preferences chapter for more information. AddrType – This field specifies the bit length of the target slave address. The dropdown list allows selection of either 7-Bit or 10-Bit. Bytes – This field specifies the number of bytes that the Debugger reads from the target slave during its Receive operation. A decimal value can be entered here and the field’s dropdown list provides a selection of recently used values. No Stop – This check box specifies whether a STOP condition is generated at the end of a message. When unchecked (default), the STOP condition is included after all of a message’s data bytes have been
Interactive Debugger 153

read. Checking this box causes the STOP condition to be omitted. Under the I2C bus protocol, absence of the STOP condition means that a master is not yet done transmitting. The previous data transfer can then be followed by a repeated START condition and another data transfer. This can be used to support some slave devices which require that the first data transfer specify the value of an offset register (or a command) and then the following data is read from (or written to) the device at that offset location. Receive text box – The large text area constituting the bottom portion of the Debugger’s Receive controls displays the data bytes that are successfully read from the I2C bus. By default all data bytes that are successfully transmitted using the Debugger are automatically listed here, however the user can elect to not echo the sent data. Refer to the Debugger Options section of this chapter for more information on user preferences. Receive button – Clicking on this button begins the operation of reading from a target slave device. Depending on the user preference that has been set, the Debugger may abort its Receive operation if a message is not acknowledged (NAK’d) by the specified target slave device (by default, the Debugger continues to receive data even when NAK’d). Refer to the Debugger Options section of the Preferences Dialog description in the Configuration and Preferences chapter for more information on user preferences. Status Box – This indicator is located just below the Receive button and displays the resulting status of the last Receive operation. The following can be indicated:
Indicates that the Receive operation completed successfully with the proper number of data bytes read from the target slave.
Indicates that an I2C bus protocol violation was detected during the Receive operation. Using the I2C Exerciser’s Monitor window to capture the Debugger’s bus transactions can help to acquire more details about the cause of the error.
Indicates that the Receive operation was not completed. When a timeout occurs, a message box is displayed to suggest possible reasons for the timeout.
154 Interactive Debugger

Debugger Script The large text area constituting the bottom portion of the Debugger’s Send controls is used to specify the byte values that are written to target slave devices. This text field also supports the use of special commands that can override the settings of the other Send controls as well as insert pauses in the message transmission sequence, manipulate the CAS-1000-I2C analyzer’s two discrete I/O lines, or activate Error Injection. Using script commands provides the ability to write a series of data bytes while progressing automatically through a sequence of various slave addresses. In this manner, for example, a complete target initialization could be performed. The ability to control the discrete I/O lines allows a connected target to be stimulated during this process. Additionally, Debugger scripts can be saved to or loaded from .DCF text files (using the Debugger’s File Menu or Tool Bar described later in this chapter) for convenient reusability. While not as comprehensive as the Master Emulation and Test window tools, this scripting offers significant message transfer automation facility that can be combined with the capture capability of the Monitor window for immediate analysis of the target I2C bus. The left side of the Debugger Script text area contains a gutter that is used to mark errors when a syntax error occurs and can optionally display line numbers. Syntax highlighting is also provided to help identify debugger script keywords.
Debugger Script Command Keywords The Debugger script keywords are listed in Table 7 on the next page. Debugger commands are not case-sensitive and are always immediately followed by their parameters. While multiple data bytes can be listed together on a single line, each command (along with its associated parameters) must be placed on its own separate line—although a trailing comment is allowed on the same line. An example debugger script follows the table of keywords. Command keywords will be highlighted blue when entered in the Debugger script text area. In addition to these keywords and the hex values, the user may also enter symbols that are defined in the Symbols tab in the Configuration Manager. These symbols can be used anywhere a hex value is expected. However, an address symbols can only be used where an address is expected and a data symbol can only appear in the byte position defined. Refer to the Symbols section of the Configuration Manager description in the Configuration and Preferences chapter to learn more about how to define symbols.
Interactive Debugger 155
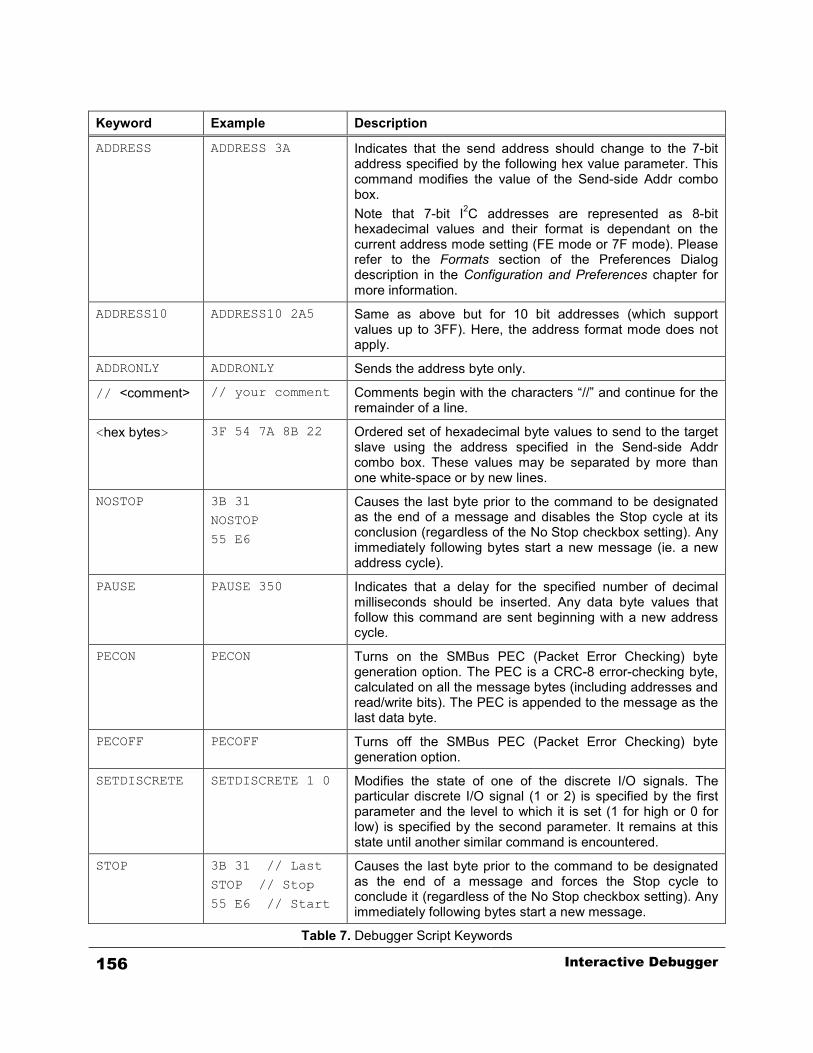
Keyword Example Description
ADDRESS ADDRESS 3A Indicates that the send address should change to the 7-bit address specified by the following hex value parameter. This command modifies the value of the Send-side Addr combo box. Note that 7-bit I2C addresses are represented as 8-bit hexadecimal values and their format is dependant on the current address mode setting (FE mode or 7F mode). Please refer to the Formats section of the Preferences Dialog description in the Configuration and Preferences chapter for more information.
ADDRESS10 ADDRESS10 2A5 Same as above but for 10 bit addresses (which support values up to 3FF). Here, the address format mode does not apply.
ADDRONLY ADDRONLY Sends the address byte only.
// <comment> // your comment Comments begin with the characters “//” and continue for the remainder of a line.
<hex bytes> 3F 54 7A 8B 22 Ordered set of hexadecimal byte values to send to the target slave using the address specified in the Send-side Addr combo box. These values may be separated by more than one white-space or by new lines.
NOSTOP 3B 31
NOSTOP
55 E6
Causes the last byte prior to the command to be designated as the end of a message and disables the Stop cycle at its conclusion (regardless of the No Stop checkbox setting). Any immediately following bytes start a new message (ie. a new address cycle).
PAUSE PAUSE 350 Indicates that a delay for the specified number of decimal milliseconds should be inserted. Any data byte values that follow this command are sent beginning with a new address cycle.
PECON PECON
Turns on the SMBus PEC (Packet Error Checking) byte generation option. The PEC is a CRC-8 error-checking byte, calculated on all the message bytes (including addresses and read/write bits). The PEC is appended to the message as the last data byte.
PECOFF PECOFF Turns off the SMBus PEC (Packet Error Checking) byte generation option.
SETDISCRETE SETDISCRETE 1 0 Modifies the state of one of the discrete I/O signals. The particular discrete I/O signal (1 or 2) is specified by the first parameter and the level to which it is set (1 for high or 0 for low) is specified by the second parameter. It remains at this state until another similar command is encountered.
STOP 3B 31 // Last
STOP // Stop
55 E6 // Start
Causes the last byte prior to the command to be designated as the end of a message and forces the Stop cycle to conclude it (regardless of the No Stop checkbox setting). Any immediately following bytes start a new message.
Table 7. Debugger Script Keywords
156 Interactive Debugger
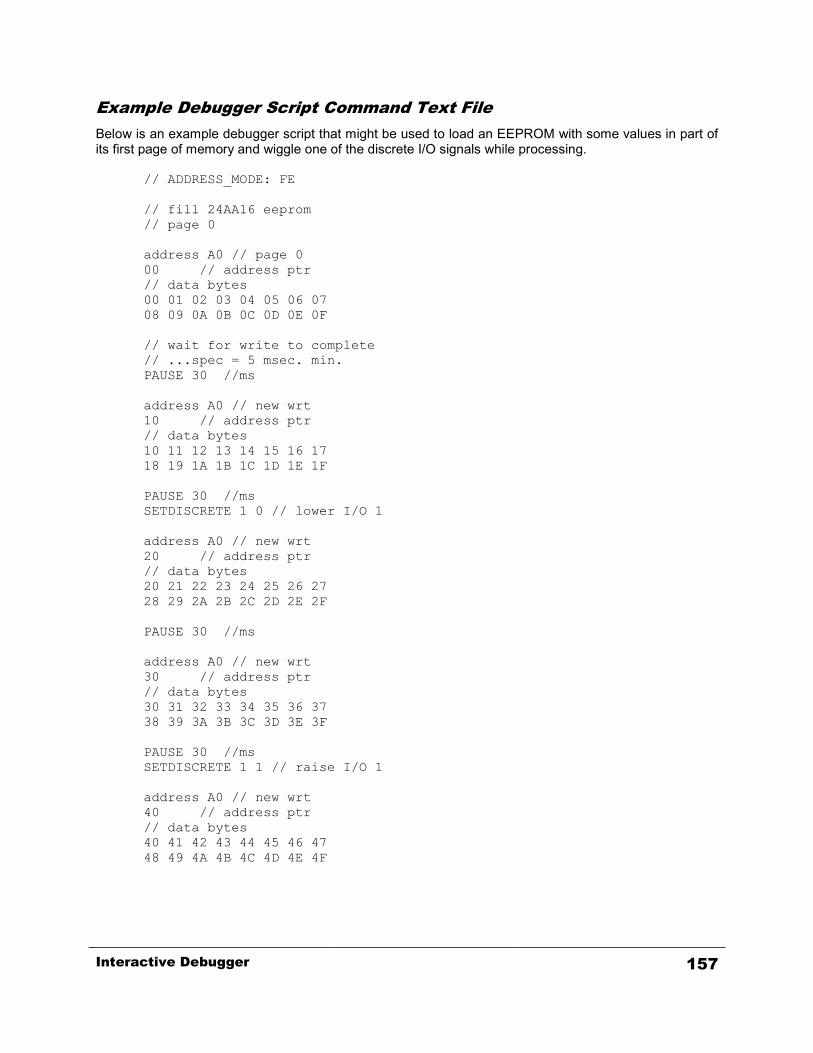
Example Debugger Script Command Text File Below is an example debugger script that might be used to load an EEPROM with some values in part of its first page of memory and wiggle one of the discrete I/O signals while processing.
// ADDRESS_MODE: FE // fill 24AA16 eeprom // page 0 address A0 // page 0 00 // address ptr // data bytes 00 01 02 03 04 05 06 07 08 09 0A 0B 0C 0D 0E 0F // wait for write to complete // ...spec = 5 msec. min. PAUSE 30 //ms address A0 // new wrt 10 // address ptr // data bytes 10 11 12 13 14 15 16 17 18 19 1A 1B 1C 1D 1E 1F PAUSE 30 //ms SETDISCRETE 1 0 // lower I/O 1 address A0 // new wrt 20 // address ptr // data bytes 20 21 22 23 24 25 26 27 28 29 2A 2B 2C 2D 2E 2F PAUSE 30 //ms address A0 // new wrt 30 // address ptr // data bytes 30 31 32 33 34 35 36 37 38 39 3A 3B 3C 3D 3E 3F PAUSE 30 //ms SETDISCRETE 1 1 // raise I/O 1 address A0 // new wrt 40 // address ptr // data bytes 40 41 42 43 44 45 46 47 48 49 4A 4B 4C 4D 4E 4F
Interactive Debugger 157

Error Injection The Debugger can be used to insert intentional errors into sent data. This feature is often used to cause I2C protocol violations on the bus in order to test the bus devices’ handling of error conditions and how well these devices recover from the errors. By using the I2C Exerciser Monitor window to capture bus traffic while injecting errors with the Debugger, the effect of these violations can be observed. The following are common violations that can be produced with the error injection feature:
• Lengthening/shortening of address or data cycle transfer bit count • Corruption of the START condition • Zero setup or hold time of data relative to clock signal • Skipping of address or data cycle acknowledgement bit
In addition to forcing errors with the Debugger commands, the Timing Skew mechanism of the CAS-1000-I2C can be activated while using the Debugger in order to:
• Vary the data setup time relative to the clock, in 20 nanosecond step increments • Vary the data hold time relative to the clock, in 20 nanosecond step increments
This signal timing feature stresses the target slaves by phase shifting the data and clock signal transitions over a wide range. Refer to the Timing Skew section of the Configuration Manager description in the Configuration and Preferences chapter for more information. The target bus can also be electrically stressed by setting the CAS-1000-I2C to supply user programmable interface levels, including:
• Programmable pull-up resistance • Programmable output voltage level • Accelerated Rising Edge Drive to force fast signal rise time
Employing these features allows further analysis of the behavioral limits of target slave devices. Refer to the Settings section of the Configuration Manager description in the Configuration and Preferences chapter. The Debugger command keywords listed in Table 8 are used for error injection. These special commands cause the debugger to generate the errors described in the table when performing the transaction immediately following the keyword. ADDR keywords must be placed at the beginning of the line where they appear. Error injection keywords are colored maroon in the Debugger script text are. NOTE: When injecting errors, make sure that Collision Detection is disabled. To disable Collision Detection, open the Configuration Manager from the Tools menu and check the “Disable Collision Detection” checkbox in the Settings pane. For more information on this option, refer to the Configuration and Preferences chapter.
158 Interactive Debugger
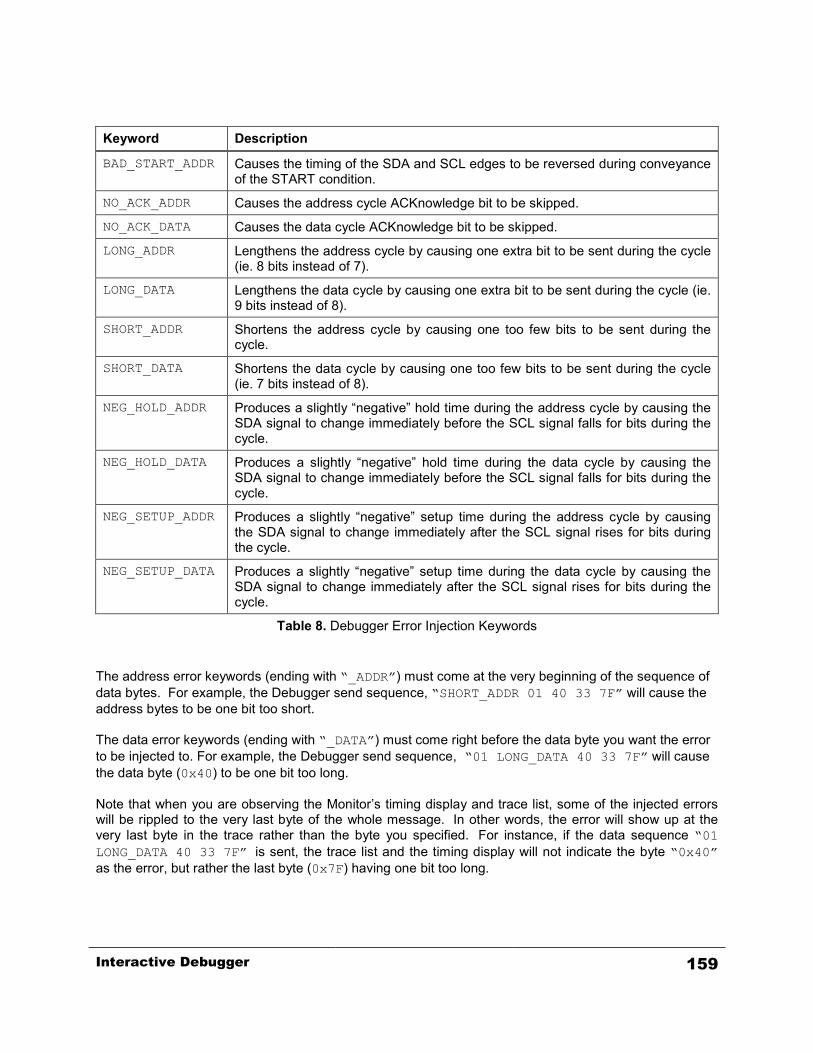
Keyword Description
BAD_START_ADDR Causes the timing of the SDA and SCL edges to be reversed during conveyance of the START condition.
NO_ACK_ADDR Causes the address cycle ACKnowledge bit to be skipped.
NO_ACK_DATA Causes the data cycle ACKnowledge bit to be skipped.
LONG_ADDR Lengthens the address cycle by causing one extra bit to be sent during the cycle (ie. 8 bits instead of 7).
LONG_DATA Lengthens the data cycle by causing one extra bit to be sent during the cycle (ie. 9 bits instead of 8).
SHORT_ADDR Shortens the address cycle by causing one too few bits to be sent during the cycle.
SHORT_DATA Shortens the data cycle by causing one too few bits to be sent during the cycle (ie. 7 bits instead of 8).
NEG_HOLD_ADDR Produces a slightly “negative” hold time during the address cycle by causing the SDA signal to change immediately before the SCL signal falls for bits during the cycle.
NEG_HOLD_DATA Produces a slightly “negative” hold time during the data cycle by causing the SDA signal to change immediately before the SCL signal falls for bits during the cycle.
NEG_SETUP_ADDR Produces a slightly “negative” setup time during the address cycle by causing the SDA signal to change immediately after the SCL signal rises for bits during the cycle.
NEG_SETUP_DATA Produces a slightly “negative” setup time during the data cycle by causing the SDA signal to change immediately after the SCL signal rises for bits during the cycle.
Table 8. Debugger Error Injection Keywords The address error keywords (ending with “_ADDR”) must come at the very beginning of the sequence of data bytes. For example, the Debugger send sequence, “SHORT_ADDR 01 40 33 7F” will cause the address bytes to be one bit too short. The data error keywords (ending with “_DATA”) must come right before the data byte you want the error to be injected to. For example, the Debugger send sequence, “01 LONG_DATA 40 33 7F” will cause the data byte (0x40) to be one bit too long. Note that when you are observing the Monitor’s timing display and trace list, some of the injected errors will be rippled to the very last byte of the whole message. In other words, the error will show up at the very last byte in the trace rather than the byte you specified. For instance, if the data sequence “01 LONG_DATA 40 33 7F” is sent, the trace list and the timing display will not indicate the byte “0x40” as the error, but rather the last byte (0x7F) having one bit too long.
Interactive Debugger 159
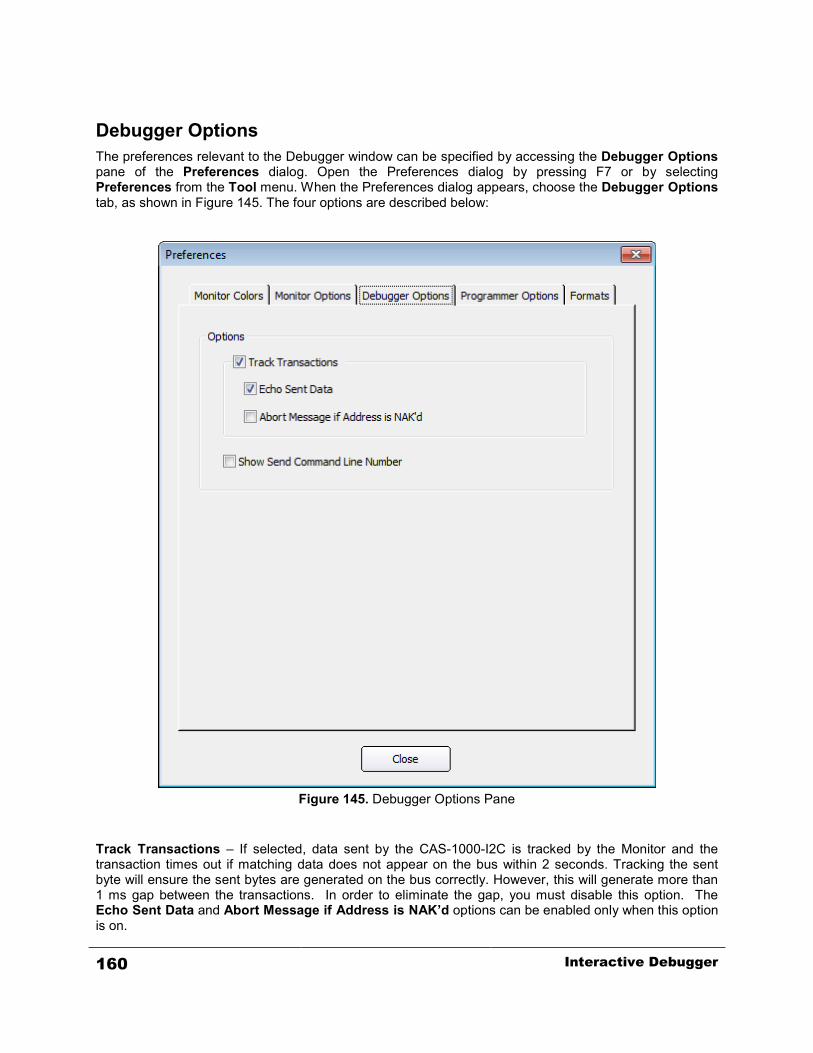
Debugger Options The preferences relevant to the Debugger window can be specified by accessing the Debugger Options pane of the Preferences dialog. Open the Preferences dialog by pressing F7 or by selecting Preferences from the Tool menu. When the Preferences dialog appears, choose the Debugger Options tab, as shown in Figure 145. The four options are described below:
Figure 145. Debugger Options Pane
Track Transactions – If selected, data sent by the CAS-1000-I2C is tracked by the Monitor and the transaction times out if matching data does not appear on the bus within 2 seconds. Tracking the sent byte will ensure the sent bytes are generated on the bus correctly. However, this will generate more than 1 ms gap between the transactions. In order to eliminate the gap, you must disable this option. The Echo Sent Data and Abort Message if Address is NAK’d options can be enabled only when this option is on.
160 Interactive Debugger

Echo Sent Data – If selected, data sent by the CAS-1000-I2C is echoed in the Receive-side text box along with all other incoming traffic during the send operation. This option is available only when the Track Transaction option is enabled. Abort Message if Address is NAK’d – If selected, the debugger aborts sending the message data bytes if the address is NAKed. This option is available only when the Track Transaction option is enabled. Show Send Command Line Number – If selected, the debugger script text box will display line numbers in the gutter.
Interactive Debugger 161
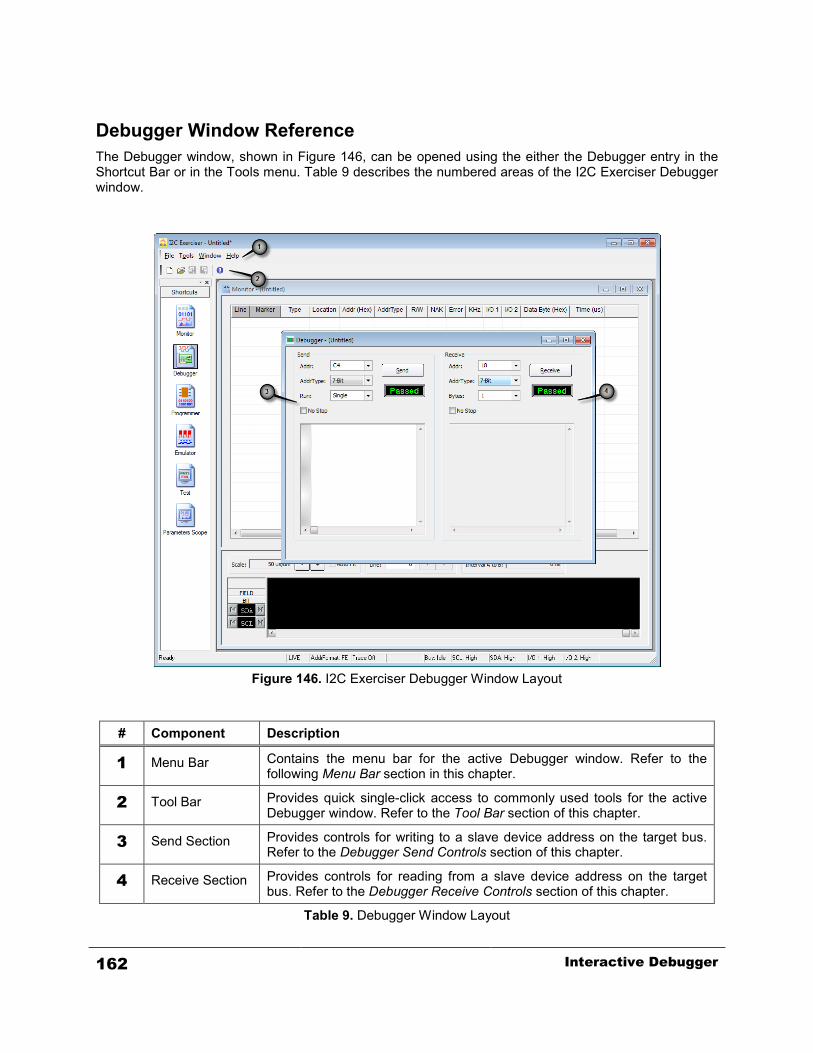
Debugger Window Reference The Debugger window, shown in Figure 146, can be opened using the either the Debugger entry in the Shortcut Bar or in the Tools menu. Table 9 describes the numbered areas of the I2C Exerciser Debugger window.
Figure 146. I2C Exerciser Debugger Window Layout
# Component Description
1 Menu Bar Contains the menu bar for the active Debugger window. Refer to the following Menu Bar section in this chapter.
2 Tool Bar Provides quick single-click access to commonly used tools for the active Debugger window. Refer to the Tool Bar section of this chapter.
3 Send Section Provides controls for writing to a slave device address on the target bus. Refer to the Debugger Send Controls section of this chapter.
4 Receive Section Provides controls for reading from a slave device address on the target bus. Refer to the Debugger Receive Controls section of this chapter.
Table 9. Debugger Window Layout
162 Interactive Debugger

Debugger Menu Bar When the Debugger window is active, the Menu Bar contains entries relevant to the Debugger functions including File, Tools, Windows and Help. A description of each menu follows.
Debugger File Menu The File menu shown in Figure 147 includes options to load and save projects and debugger command files as well as an option to save debugger data from the Debugger window’s Receive section. The options related to the loading and saving of projects are identical to those described in the Monitor Menu Bar section of the Bus Traffic Monitor chapter.
Figure 147. Debugger File Menu
New Debugger Command File… – Clears the Debugger window’s Send text box in preparation for entering new debugger commands and data. If the text box contains existing unsaved commands and data, a prompt is displayed to save it.
Open Debugger Command File… – Opens a previously saved command file and restores the saved debugger commands and data to the Debugger window’s Send text box. If the text box contains existing unsaved commands and data, a prompt is displayed to save it.
Save Debugger Command File… – Saves the debugger commands and data from the Debugger window’s Send text box to a .DCF text file. If not already working with an opened command file, a prompt is displayed to save it.
Save Debugger Command File As… – Same as Save Debugger Command File above, except that it always prompts for a new filename before saving.
Save Debugger Data – Stores the data collected from the bus in the Receive text box into a .DDF text file.
Recent Files – Provides a list of recently used project files for quick access. Exit – Terminates the I2C Exerciser application.
Debugger Tools Menu The Tools menu provides a path to the major application function windows. This is identical to the Monitor Tools Menu described in the Bus Traffic Monitor chapter.
Interactive Debugger 163

Debugger Window Menu The Window menu manages the various windows of I2C Exerciser and is identical to the Monitor Window Menu described in the Bus Traffic Monitor chapter.
Debugger Help Menu The Help menu accesses the on-line help features and is identical to the Monitor Help Menu described in the Bus Traffic Monitor chapter.
Debugger Tool Bar The Debugger Tool Bar shown in Figure 148 provides quick single-click access to commonly used commands in the Debugger window. Simply click the tool bar button to perform the desired command. Table 10 describes the tool bar functions. Positioning the mouse cursor over each tool bar button also displays a pop-up “tooltip” providing a short description of the command.
Figure 148. Debugger Tool Bar
Icon Name Function Description
New Command File Clears the Debugger window’s Send text box in preparation for
entering new debugger commands and data. If the text box contains existing unsaved commands and data, a prompt is displayed to save it.
Open Command File Opens a previously saved command file and restores the saved
debugger commands and data to the Debugger window’s Send text box. If the text box contains existing unsaved commands and data, a prompt is displayed to save it.
Save Command File Saves the debugger commands and data from the Debugger window’s
Send text box to a .DCF text file. If not already working with an opened command file, a prompt is displayed to save it.
Save Data File Stores the data collected from the bus in the Receive text box into a
.DDF text file.
Help Provides quick access to the online help topics.
Table 10. Debugger Tool Bar Functions
164 Interactive Debugger

Interactive Debugger 165

Chapter 7 Serial EEPROM Programmer
Programmer Window Overview and component descriptions
The Programmer Window provides an interface specifically tailored for convenient interaction with standard I2C EEPROM devices on the target I2C bus. It enables file-linked programming and viewing of the content of such devices. It further supports comparing current contents against the data loaded from a file. Device content can also be viewed and saved to a file. Standard file formats supported include;
• EXO
• BIN
• MCS
• HEX
In addition, a simple user-friendly text file format can specify the EEPROM content. The user selects the target device type from a pull-down list of known manufacturers and types, whose standard address and address-type (7 or 10 bit width) is preloaded. This latter information can be overwritten by the user for non-standard systems. In addition to selecting a related data file, the user can enter an additive/subtractive adjustment to the internal device offset declared in the file. Various device interaction buttons enable the following actions:
• Read – read and display the EEPROM content in a popup which supports scrolling and page-hopping through the data. This information can be saved to a file.
• Program – load the EEPROM with the contents of the referenced data file.
• Verify – compare the EEPROM with the referenced file and indicate a pass/fail outcome.
• Erase – clear the content of the EEPROM
During any of the above operations, if the Monitor is running, the related traffic transactions with the device can be viewed.
166 Serial EEPROM Programmer
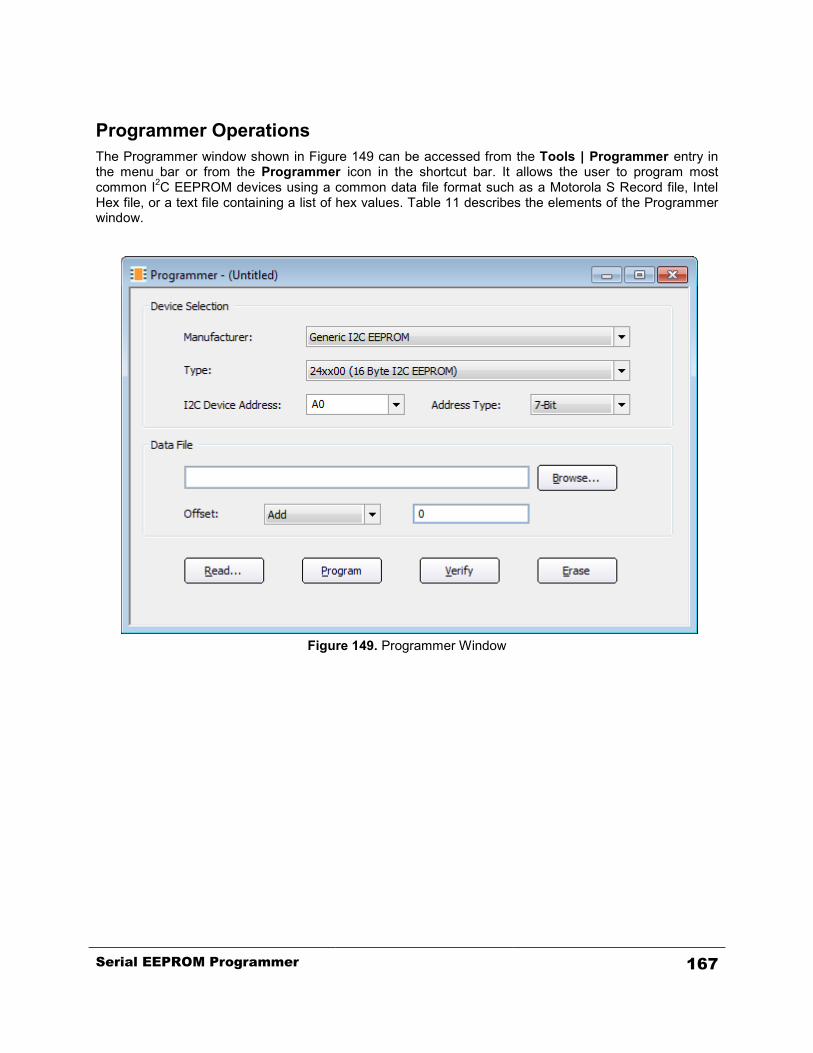
Programmer Operations The Programmer window shown in Figure 149 can be accessed from the Tools | Programmer entry in the menu bar or from the Programmer icon in the shortcut bar. It allows the user to program most common I2C EEPROM devices using a common data file format such as a Motorola S Record file, Intel Hex file, or a text file containing a list of hex values. Table 11 describes the elements of the Programmer window.
Figure 149. Programmer Window
Serial EEPROM Programmer 167

Component Description
Manufacturer combo box Specifies the manufacturer of the I2C EEPROM device to be programmed. Most devices can be programmed as a “Generic” manufacturer device if they are compatible with the ATMEL 24xxXXX series of I2C EEPROM devices.
Type combo box Specifies the type of the EEPROM device to program. Various selections are available for supported devices from each of the manufactures in the Manufacturer combo box. The types that are available when using the “Generic” manufacturer support all of the ATMEL 24xxXXX series of I2C EEPROM devices.
I2C Device Address combo box
Specifies the I2C device address of the EEPROM. Initially, this is set to the manufacturer’s specified default address. If the device is configured to use an address other than the manufacturer default, that address can be entered into this field. The address format complies with the Preference option in force. FE mode is an 8-bit format with the 7 address bits left-justified and 7F mode makes the 7 address bits right-justified. The example in the figure is in FE format.
Address Type combo box Specifies the size of the address (7-bit or 10-bit). At this time, the only EEPROM devices that the Programmer supports use 7-bit addresses, so only 7-bit may be selected here.
Data File edit box and Browse button
Specifies the file containing data to be programmed. Use the browse button to locate the data file.
Offset combo box and edit box
Specifies an offset for the programming. The drop-down combo box allows for selection of whether to “Add” or “Subtract” the offset value which is entered into the edit box on the right. The offset value must be entered in hexadecimal format.
Table 11. Programmer Function Descriptions
168 Serial EEPROM Programmer
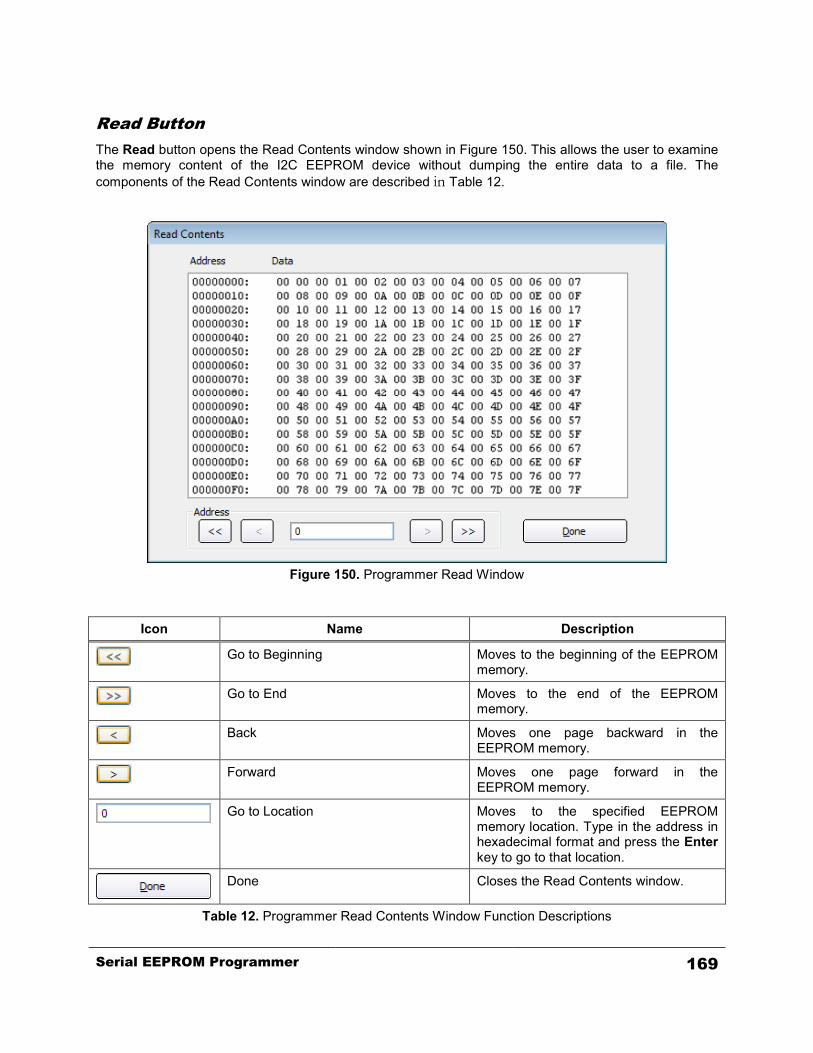
Read Button The Read button opens the Read Contents window shown in Figure 150. This allows the user to examine the memory content of the I2C EEPROM device without dumping the entire data to a file. The components of the Read Contents window are described in Table 12.
Figure 150. Programmer Read Window
Icon Name Description
Go to Beginning Moves to the beginning of the EEPROM memory.
Go to End Moves to the end of the EEPROM memory.
Back Moves one page backward in the EEPROM memory.
Forward Moves one page forward in the EEPROM memory.
Go to Location Moves to the specified EEPROM memory location. Type in the address in hexadecimal format and press the Enter key to go to that location.
Done Closes the Read Contents window.
Table 12. Programmer Read Contents Window Function Descriptions
Serial EEPROM Programmer 169

Program Button The Program button allows the user to program and verify the I2C EEPROM device. With a single click on the button, the I2C Exerciser will program the device using the specified data file. If the Preferences is set to verify after programming (see the Programmer Options section of this chapter), the I2C Exerciser will automatically verify that the data is written to the device by performing a read. During the programming operation, the progress dialog box shown in Figure 151 will pop up to show the programming status.
Figure 151. Programming Progress Window
Verify Button The Verify button allows you to verify the content of the I2C EEPROM device against the specified data file. During the verifying operation, the progress dialog box shown in Figure 152 will pop up to show the verification status.
Figure 152. Verifying Progress Window
Erase Button The Erase button allows you to initialize the device memory contents with the value FF. During the erasing operation, the progress dialog box shown in Figure 153 will pop up to show the erasing status.
Figure 153. Erasing Progress Window
170 Serial EEPROM Programmer

Programmer Options The user can change Programmer options by accessing the Programmer Options pane of the Preferences dialog. To open the Preferences dialog, press F7 or select Preferences… from the Tools menu. Once the Preferences dialog appears, select the Programmer Options pane as shown in Figure 154.
Figure 154. Programmer Options Pane
Verify After Programming – If selected, the programmer will verify that the data was written properly after a write operation.
Serial EEPROM Programmer 171
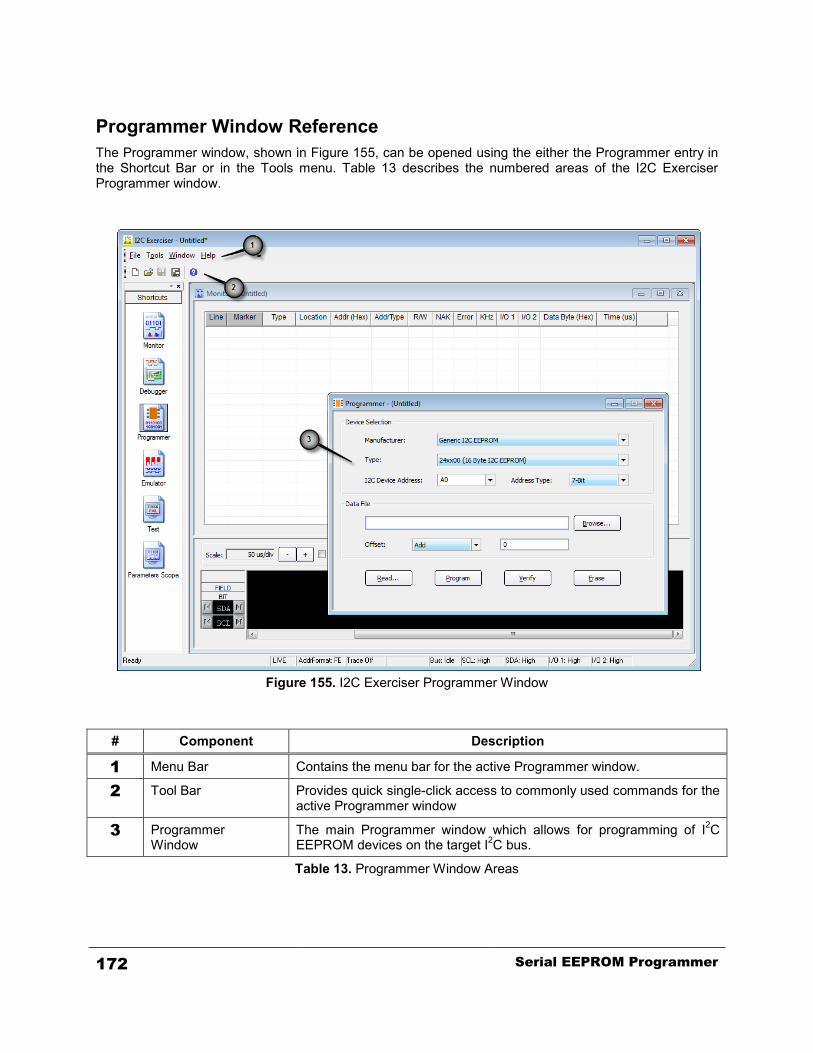
Programmer Window Reference The Programmer window, shown in Figure 155, can be opened using the either the Programmer entry in the Shortcut Bar or in the Tools menu. Table 13 describes the numbered areas of the I2C Exerciser Programmer window.
Figure 155. I2C Exerciser Programmer Window
# Component Description
1 Menu Bar Contains the menu bar for the active Programmer window.
2 Tool Bar Provides quick single-click access to commonly used commands for the active Programmer window
3 Programmer Window
The main Programmer window which allows for programming of I2C EEPROM devices on the target I2C bus.
Table 13. Programmer Window Areas
172 Serial EEPROM Programmer
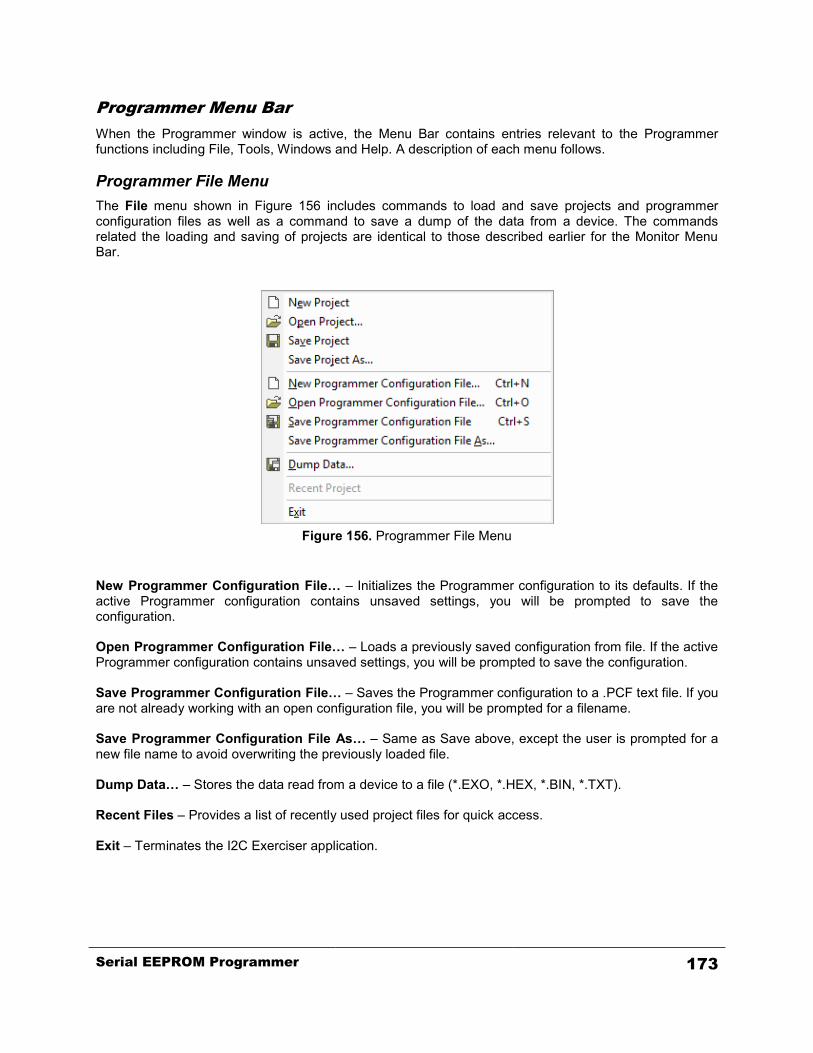
Programmer Menu Bar When the Programmer window is active, the Menu Bar contains entries relevant to the Programmer functions including File, Tools, Windows and Help. A description of each menu follows. Programmer File Menu The File menu shown in Figure 156 includes commands to load and save projects and programmer configuration files as well as a command to save a dump of the data from a device. The commands related the loading and saving of projects are identical to those described earlier for the Monitor Menu Bar.
Figure 156. Programmer File Menu
New Programmer Configuration File… – Initializes the Programmer configuration to its defaults. If the active Programmer configuration contains unsaved settings, you will be prompted to save the configuration. Open Programmer Configuration File… – Loads a previously saved configuration from file. If the active Programmer configuration contains unsaved settings, you will be prompted to save the configuration. Save Programmer Configuration File… – Saves the Programmer configuration to a .PCF text file. If you are not already working with an open configuration file, you will be prompted for a filename. Save Programmer Configuration File As… – Same as Save above, except the user is prompted for a new file name to avoid overwriting the previously loaded file. Dump Data… – Stores the data read from a device to a file (*.EXO, *.HEX, *.BIN, *.TXT). Recent Files – Provides a list of recently used project files for quick access. Exit – Terminates the I2C Exerciser application.
Serial EEPROM Programmer 173
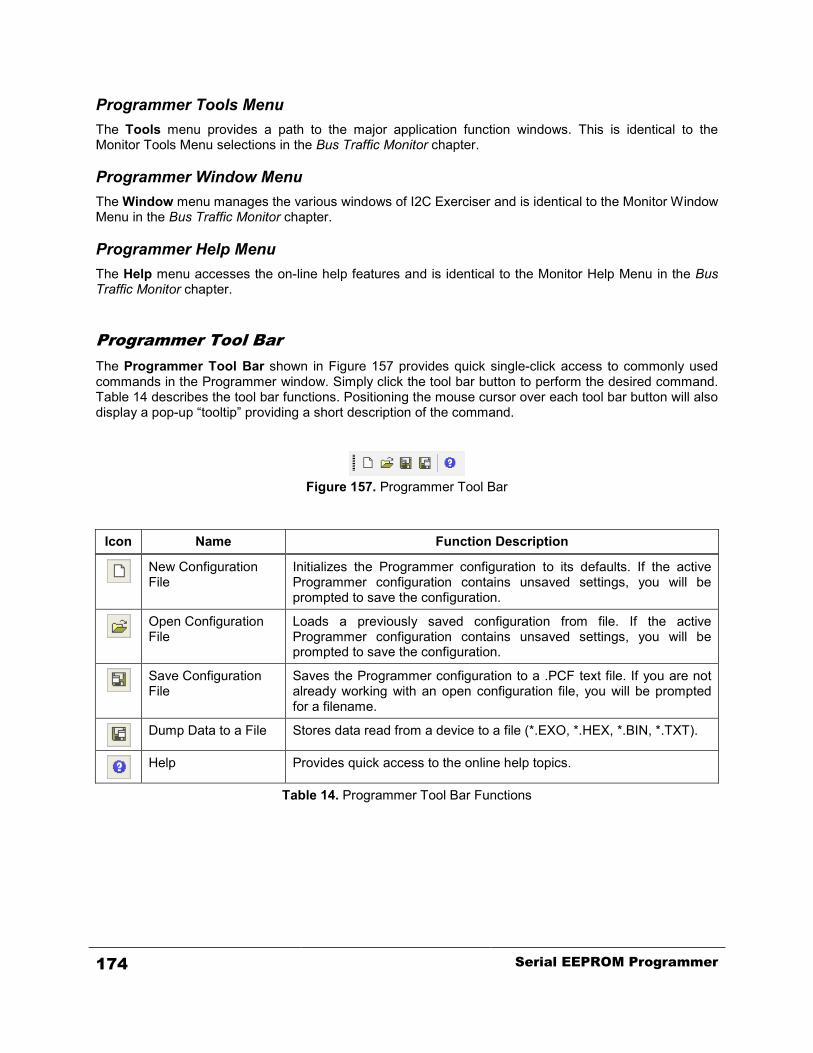
Programmer Tools Menu The Tools menu provides a path to the major application function windows. This is identical to the Monitor Tools Menu selections in the Bus Traffic Monitor chapter. Programmer Window Menu The Window menu manages the various windows of I2C Exerciser and is identical to the Monitor Window Menu in the Bus Traffic Monitor chapter. Programmer Help Menu The Help menu accesses the on-line help features and is identical to the Monitor Help Menu in the Bus Traffic Monitor chapter.
Programmer Tool Bar The Programmer Tool Bar shown in Figure 157 provides quick single-click access to commonly used commands in the Programmer window. Simply click the tool bar button to perform the desired command. Table 14 describes the tool bar functions. Positioning the mouse cursor over each tool bar button will also display a pop-up “tooltip” providing a short description of the command.
Figure 157. Programmer Tool Bar
Icon Name Function Description
New Configuration File
Initializes the Programmer configuration to its defaults. If the active Programmer configuration contains unsaved settings, you will be prompted to save the configuration.
Open Configuration File
Loads a previously saved configuration from file. If the active Programmer configuration contains unsaved settings, you will be prompted to save the configuration.
Save Configuration File
Saves the Programmer configuration to a .PCF text file. If you are not already working with an open configuration file, you will be prompted for a filename.
Dump Data to a File Stores data read from a device to a file (*.EXO, *.HEX, *.BIN, *.TXT).
Help Provides quick access to the online help topics.
Table 14. Programmer Tool Bar Functions
174 Serial EEPROM Programmer

Serial EEPROM Programmer 175

Chapter 8 Configuration and Preferences
Configuration Manager and Preferences dialogs overview and component descriptions
Configuration Manager The Configuration Manager allows the user to change the setting for the various tools provided by the I2C Exerciser in one easily accessible location. The user can access certain Configurations Manager tabs directly from some of the tools such as the Filters and Trigger toolbar in the Monitor window. The user can also access the most recently used Configuration Manager tab by using the Tools | Configuration Manager menu command accessible from all windows. The Configuration Manager is used to perform the following tasks:
• Configuring settings o Setting the I2C bus electrical features such as voltage source and bus signal threshold o Setting the bus drive and monitoring features such as clock rate o Configuring external discrete signals o Setting the amount of traffic to monitor
• Associating files with the current project • Setting filters • Associating SMBus devices with decoding files • Associating and detecting target slaves • Setting timing skew options
176 Configuration and Preferences
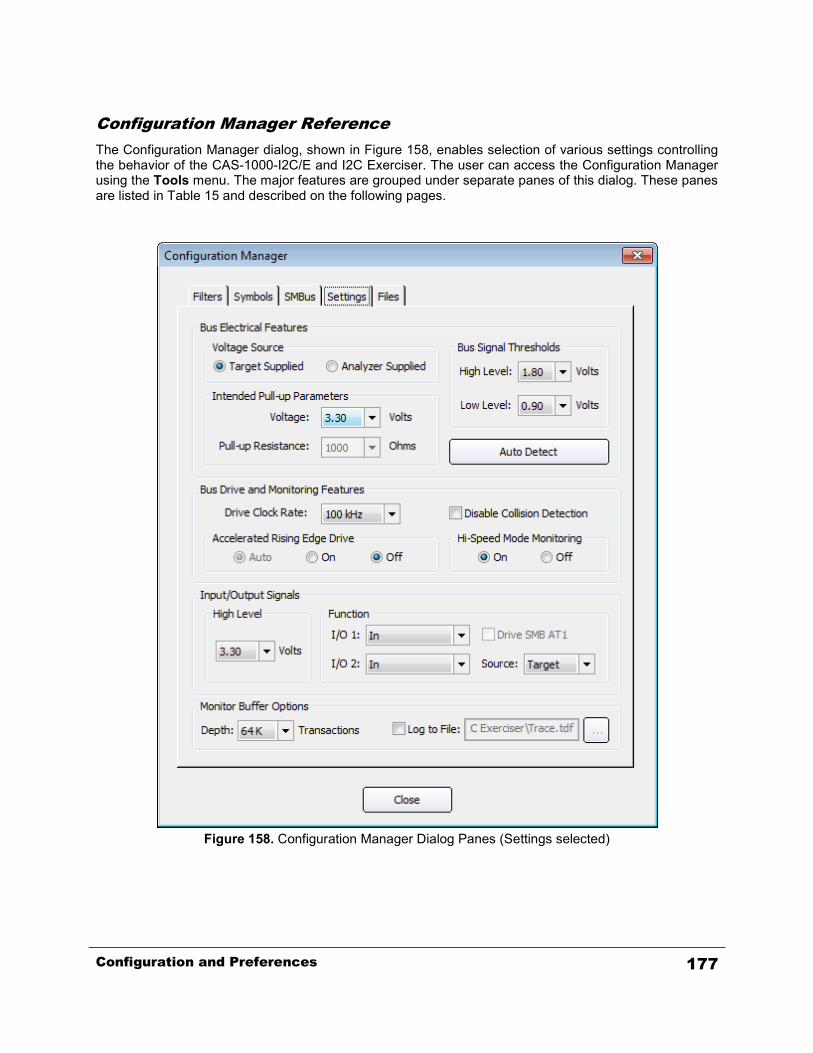
Configuration Manager Reference The Configuration Manager dialog, shown in Figure 158, enables selection of various settings controlling the behavior of the CAS-1000-I2C/E and I2C Exerciser. The user can access the Configuration Manager using the Tools menu. The major features are grouped under separate panes of this dialog. These panes are listed in Table 15 and described on the following pages.
Figure 158. Configuration Manager Dialog Panes (Settings selected)
Configuration and Preferences 177
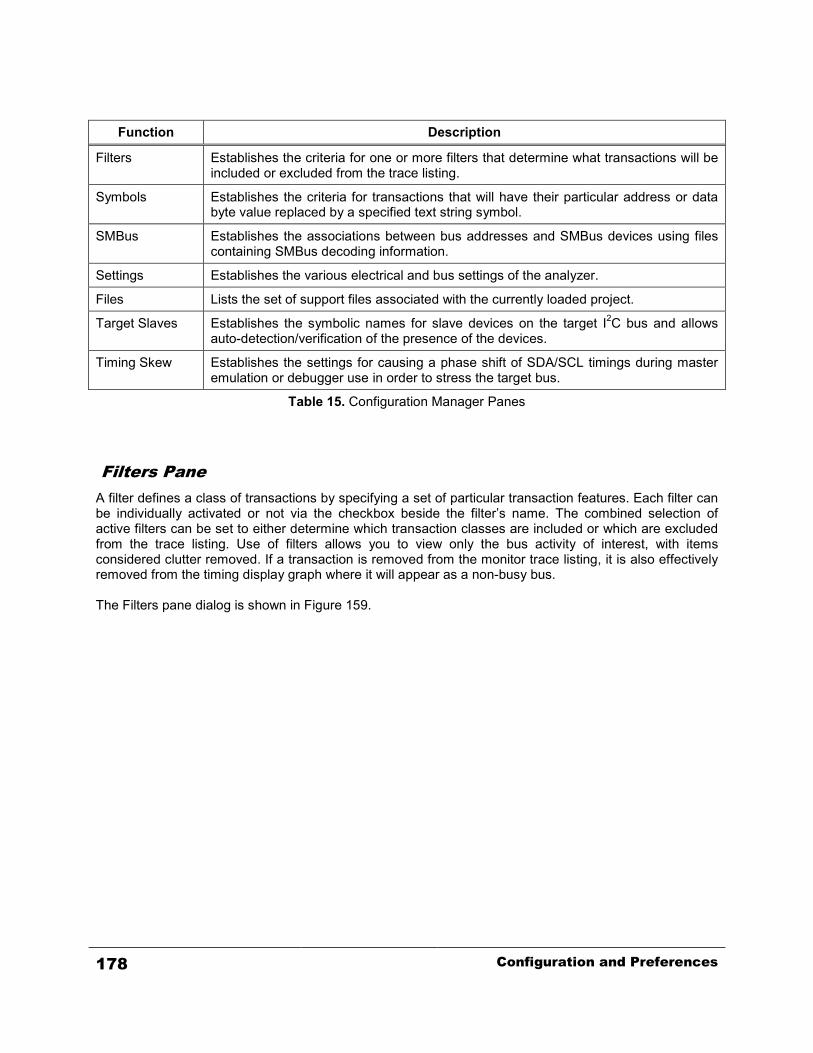
Function Description
Filters Establishes the criteria for one or more filters that determine what transactions will be included or excluded from the trace listing.
Symbols Establishes the criteria for transactions that will have their particular address or data byte value replaced by a specified text string symbol.
SMBus Establishes the associations between bus addresses and SMBus devices using files containing SMBus decoding information.
Settings Establishes the various electrical and bus settings of the analyzer.
Files Lists the set of support files associated with the currently loaded project.
Target Slaves Establishes the symbolic names for slave devices on the target I2C bus and allows auto-detection/verification of the presence of the devices.
Timing Skew Establishes the settings for causing a phase shift of SDA/SCL timings during master emulation or debugger use in order to stress the target bus.
Table 15. Configuration Manager Panes
Filters Pane A filter defines a class of transactions by specifying a set of particular transaction features. Each filter can be individually activated or not via the checkbox beside the filter’s name. The combined selection of active filters can be set to either determine which transaction classes are included or which are excluded from the trace listing. Use of filters allows you to view only the bus activity of interest, with items considered clutter removed. If a transaction is removed from the monitor trace listing, it is also effectively removed from the timing display graph where it will appear as a non-busy bus. The Filters pane dialog is shown in Figure 159.
178 Configuration and Preferences
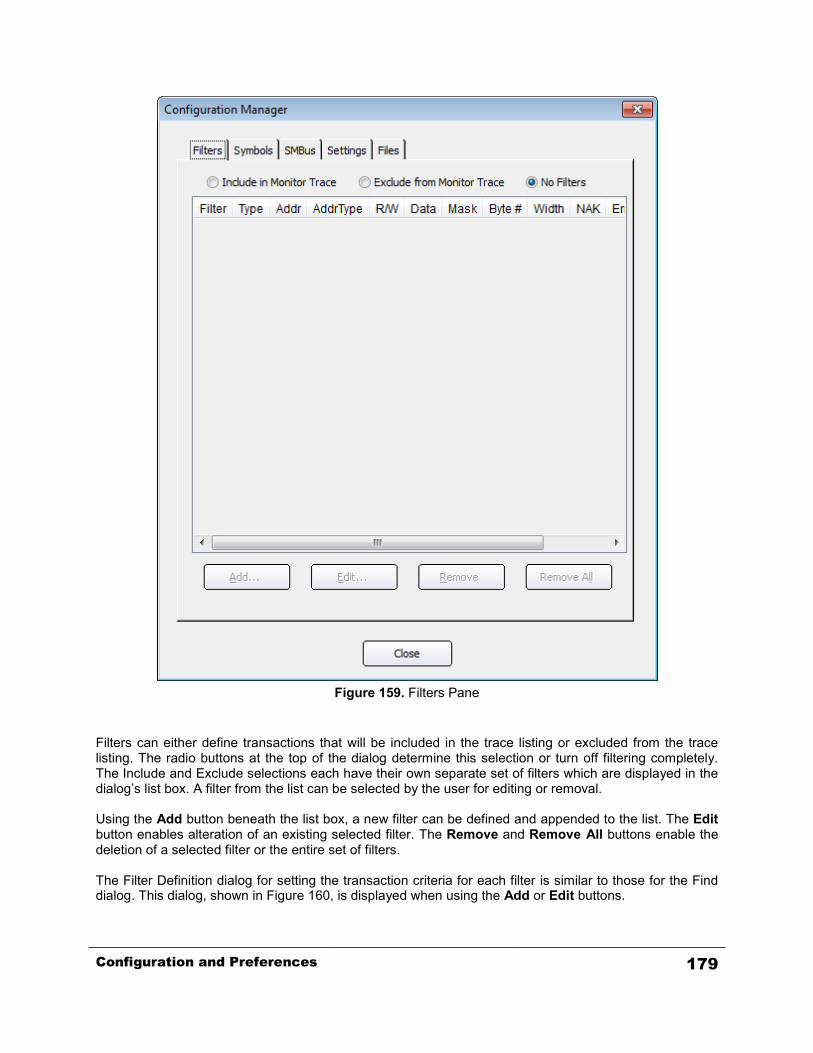
Figure 159. Filters Pane
Filters can either define transactions that will be included in the trace listing or excluded from the trace listing. The radio buttons at the top of the dialog determine this selection or turn off filtering completely. The Include and Exclude selections each have their own separate set of filters which are displayed in the dialog’s list box. A filter from the list can be selected by the user for editing or removal. Using the Add button beneath the list box, a new filter can be defined and appended to the list. The Edit button enables alteration of an existing selected filter. The Remove and Remove All buttons enable the deletion of a selected filter or the entire set of filters. The Filter Definition dialog for setting the transaction criteria for each filter is similar to those for the Find dialog. This dialog, shown in Figure 160, is displayed when using the Add or Edit buttons.
Configuration and Preferences 179

Figure 160. Filter Definition Dialog (similar to Edit)
180 Configuration and Preferences
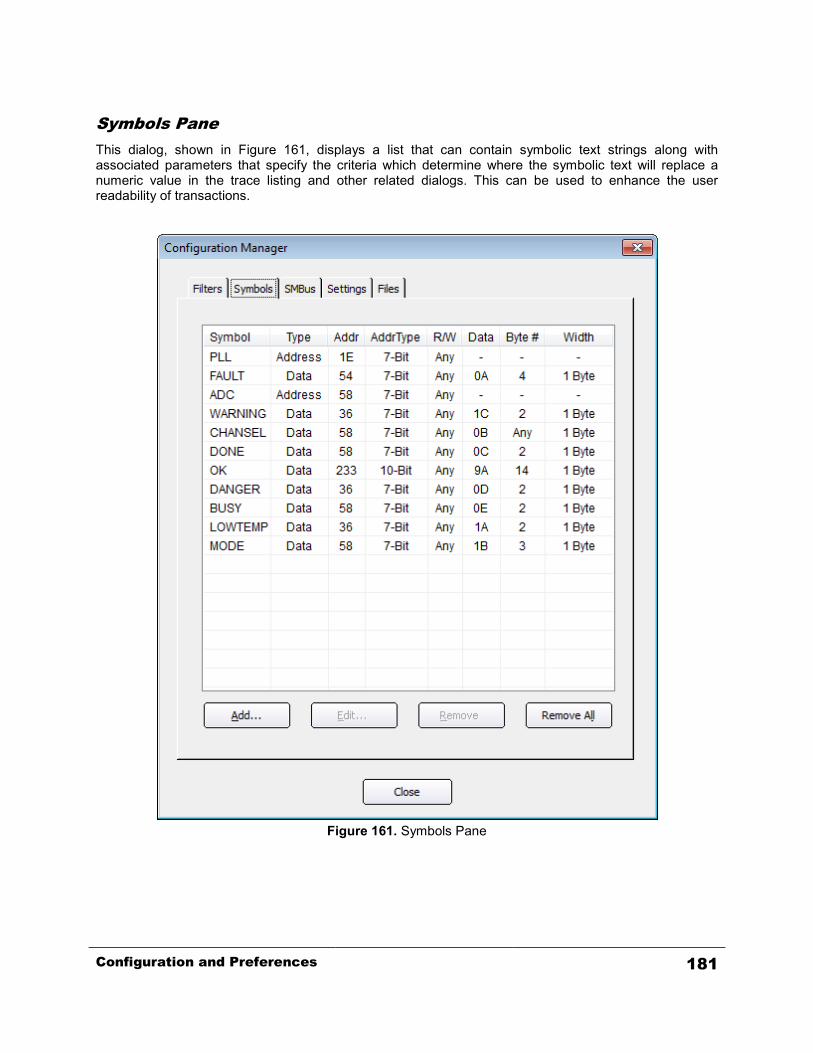
Symbols Pane This dialog, shown in Figure 161, displays a list that can contain symbolic text strings along with associated parameters that specify the criteria which determine where the symbolic text will replace a numeric value in the trace listing and other related dialogs. This can be used to enhance the user readability of transactions.
Figure 161. Symbols Pane
Configuration and Preferences 181
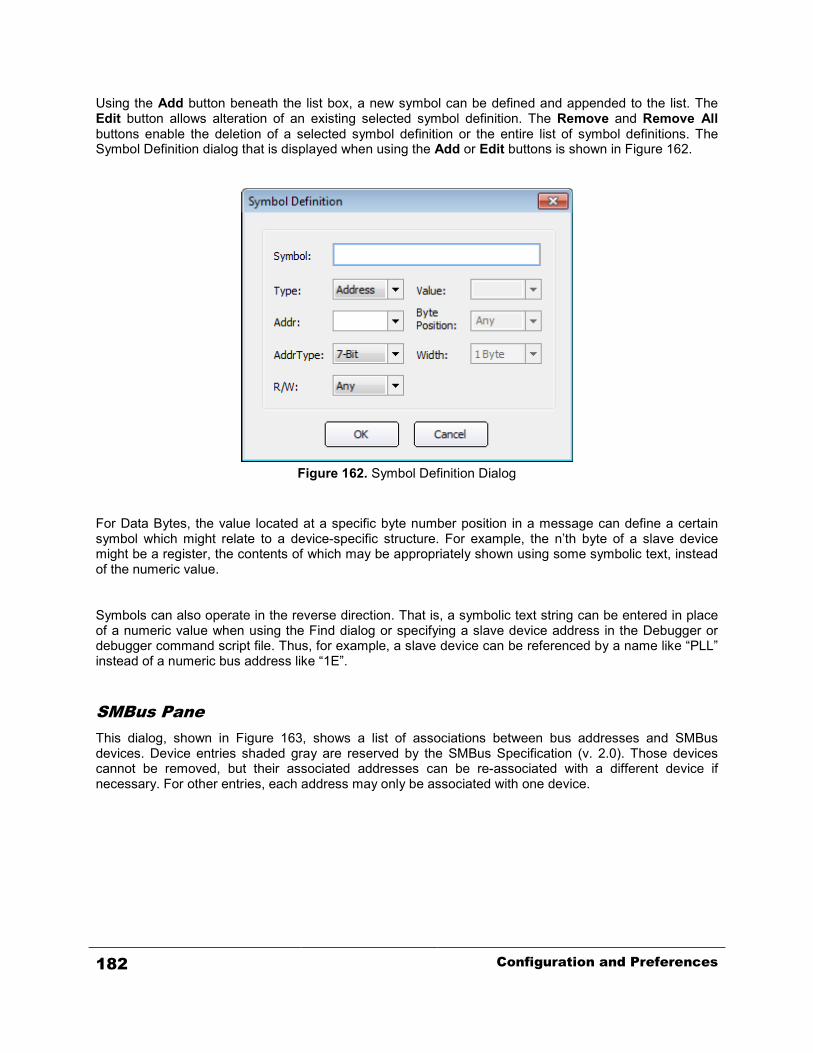
Using the Add button beneath the list box, a new symbol can be defined and appended to the list. The Edit button allows alteration of an existing selected symbol definition. The Remove and Remove All buttons enable the deletion of a selected symbol definition or the entire list of symbol definitions. The Symbol Definition dialog that is displayed when using the Add or Edit buttons is shown in Figure 162.
Figure 162. Symbol Definition Dialog
For Data Bytes, the value located at a specific byte number position in a message can define a certain symbol which might relate to a device-specific structure. For example, the n’th byte of a slave device might be a register, the contents of which may be appropriately shown using some symbolic text, instead of the numeric value. Symbols can also operate in the reverse direction. That is, a symbolic text string can be entered in place of a numeric value when using the Find dialog or specifying a slave device address in the Debugger or debugger command script file. Thus, for example, a slave device can be referenced by a name like “PLL” instead of a numeric bus address like “1E”.
SMBus Pane This dialog, shown in Figure 163, shows a list of associations between bus addresses and SMBus devices. Device entries shaded gray are reserved by the SMBus Specification (v. 2.0). Those devices cannot be removed, but their associated addresses can be re-associated with a different device if necessary. For other entries, each address may only be associated with one device.
182 Configuration and Preferences
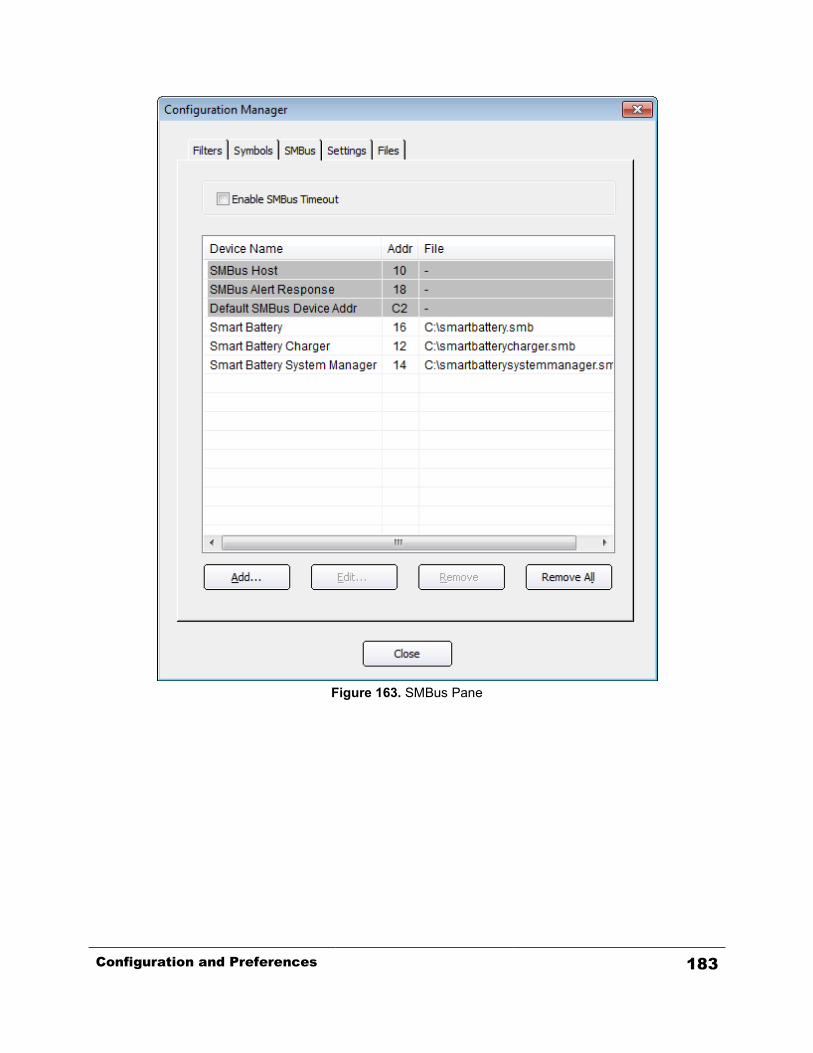
Figure 163. SMBus Pane
Configuration and Preferences 183
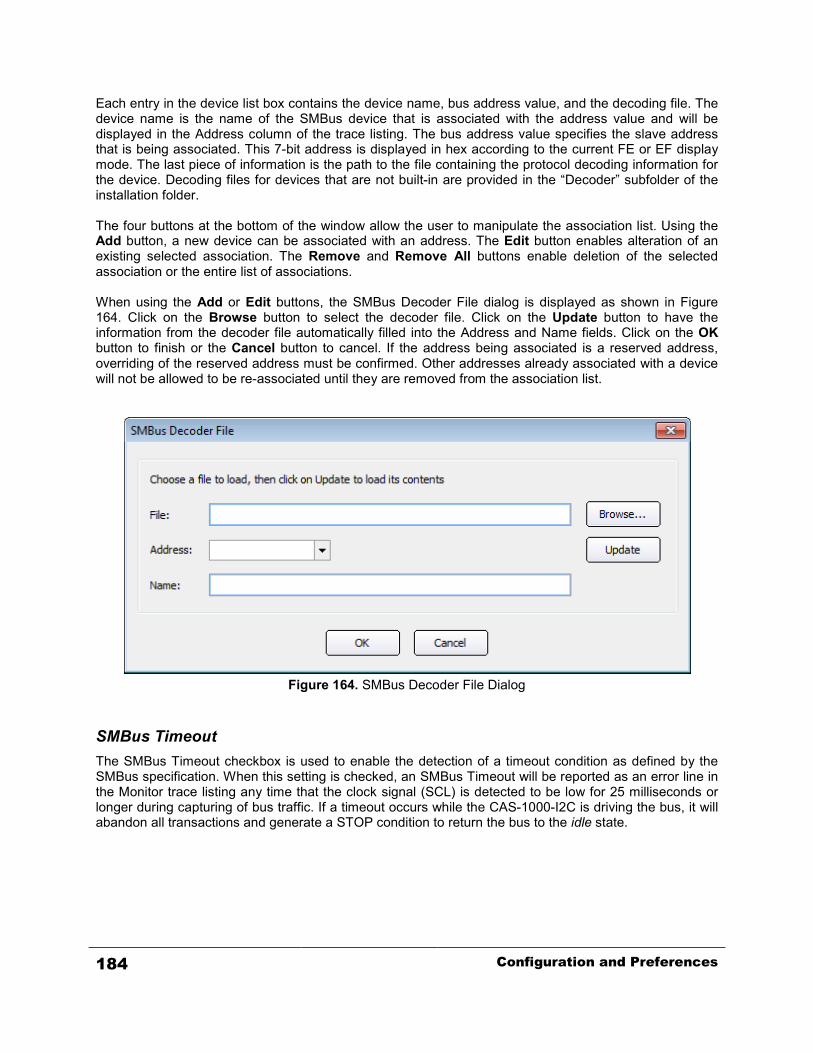
Each entry in the device list box contains the device name, bus address value, and the decoding file. The device name is the name of the SMBus device that is associated with the address value and will be displayed in the Address column of the trace listing. The bus address value specifies the slave address that is being associated. This 7-bit address is displayed in hex according to the current FE or EF display mode. The last piece of information is the path to the file containing the protocol decoding information for the device. Decoding files for devices that are not built-in are provided in the “Decoder” subfolder of the installation folder. The four buttons at the bottom of the window allow the user to manipulate the association list. Using the Add button, a new device can be associated with an address. The Edit button enables alteration of an existing selected association. The Remove and Remove All buttons enable deletion of the selected association or the entire list of associations. When using the Add or Edit buttons, the SMBus Decoder File dialog is displayed as shown in Figure 164. Click on the Browse button to select the decoder file. Click on the Update button to have the information from the decoder file automatically filled into the Address and Name fields. Click on the OK button to finish or the Cancel button to cancel. If the address being associated is a reserved address, overriding of the reserved address must be confirmed. Other addresses already associated with a device will not be allowed to be re-associated until they are removed from the association list.
Figure 164. SMBus Decoder File Dialog
SMBus Timeout The SMBus Timeout checkbox is used to enable the detection of a timeout condition as defined by the SMBus specification. When this setting is checked, an SMBus Timeout will be reported as an error line in the Monitor trace listing any time that the clock signal (SCL) is detected to be low for 25 milliseconds or longer during capturing of bus traffic. If a timeout occurs while the CAS-1000-I2C is driving the bus, it will abandon all transactions and generate a STOP condition to return the bus to the idle state.
184 Configuration and Preferences
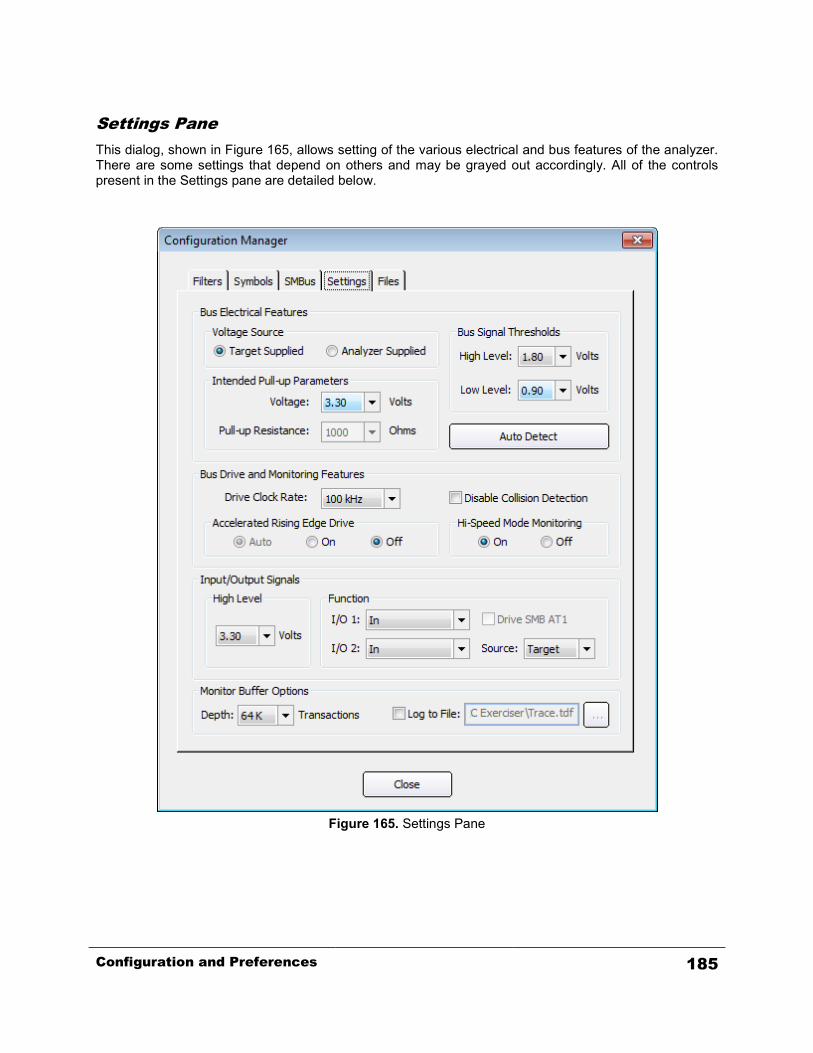
Settings Pane This dialog, shown in Figure 165, allows setting of the various electrical and bus features of the analyzer. There are some settings that depend on others and may be grayed out accordingly. All of the controls present in the Settings pane are detailed below.
Figure 165. Settings Pane
Configuration and Preferences 185

Target Supplied – Specifies that the connected target I2C bus has its own pull-up voltage supply. In this case, the target bus is self-sufficient and ready for use. When this setting is selected, the Pull-up Resistance setting is disabled. Analyzer Supplied – Specifies that the CAS-1000-I2C will supply pull-up voltage to the target bus. In this case, the target has no other attached pull-up voltage source and the analyzer must supply this to activate the bus. When this setting is selected, both the Voltage and Pull-up Resistance settings are enabled.
Voltage – In Analyzer Supplied mode, this specifies the voltage to which the bus will be pulled up by the CAS-1000-I2C. The user must assure that this level is compatible with the operation of any attached target bus. In Target Supplied mode, this specifies the voltage level that will be provided by the target so that appropriate bus signal threshold levels can be automatically set. Pull-up Resistance – In Analyzer Supplied mode, this specifies the pull-up resistor value through which both bus signals (SCL and SDA) will be pulled up by the CAS-1000-I2C. The user should consider the target I2C bus capacitance such that the resultant RC time-constant will not adversely affect its operation at expected clock rates (by producing signal rise-times that are too slow).
Bus Signal Threshold High Level – This value establishes the minimum voltage that a bus signal (SDA and SCL) must rise above from the low state before it is considered to be high. This setting applies in general to all monitoring of the bus by the analyzer. Default values for these settings are based on the pull-up voltage selected in the Voltage dropdown box. Bus Signal Threshold Low Level –This value establishes the maximum voltage that a bus signal (SDA and SCL) must drop below from the high state before it is considered to be low. This setting applies in general to all monitoring of the bus by the analyzer. Default values for these settings are based on the pull-up voltage selected in the Voltage dropdown box. Auto Detect – This button causes the I2C Exerciser to check for a voltage on the target bus and automatically select recommended default electrical settings based on its findings. Drive Clock Rate – Specifies the nominal clock rate of the SCL signal when the CAS-1000-I2C drives the bus. Note that the I2C bus is not of a continuously clocking type since various conditions can stretch the clock or require resynchronization between multiple sources. Therefore, a constant period is not expected. Disable Collision Detection – Under normal circumstances, when the CAS-1000-I2C drives the bus (acting like a master) it is required to detect that the signal levels it drives match (within a reasonable time) what it senses on the bus. Failure to detect a match would imply a collision with another master. If the bus has excessive capacitance or high pull-up/capacitance combinations which cause its rise-time to be slow, a false collision may be repeatedly detected and prevent the CAS-1000-I2C from completing its transactions. Enabling this Disable Collision Detection option accommodates such slow busses and allows the CAS-1000-I2C driving to proceed, but without the I2C arbitration mechanism. Therefore, the user needs to keep any target I2C bus master(s) quiet while the CAS-1000-I2C drives the bus when collision detection is disabled.
186 Configuration and Preferences

Accelerated Rising Edge Drive – In general, when a driver on the bus makes a positive signal transition, the rise-time is determined by the RC time-constant of the bus. The rise-time governs the upper limit on effective clock rates. When the CAS-1000-I2C drives the bus, it can apply a strong rising drive during the signal transition to overcome the RC time-constant, creating a rapid edge. This can then allow an increase in the clock rate for a given RC value of the bus. If this option is set to AUTO, the CAS-1000-I2C/E will engage the fast rising edge mechanism automatically whenever it is operating with the I2C high-speed mode (Hs-mode) protocol—note, however, that the High-Speed Mode emulation is not currently supported by the CAS-1000-I2C and so the AUTO setting will have the same effect as OFF. If this option is set to ON, the CAS-1000-I2C employs the mechanism at all times. Setting this option to OFF fully disables the mechanism, letting the pull-ups or the target capacitance determine rise times. High-Speed Mode Monitoring – This setting provides an option to turn on or off the Hi-Speed Mode monitoring mechanism. When it is turned off, the glitch filtering mechanism of CAS-1000-I2C becomes enabled. The glitch filtering mechanism filters out glitches that are less than 50 ns in duration for protocol decoding, but indicates their occurrences on the timing display. At Drive Clock Rate higher than 1 MHz, this option is forced to be ON to avoid any over-filtering of glitches. Input/Output Signals High Level – Specifies the TTL high voltage level of the I/O signals. When sensing inputs, the CAS-1000-I2C will also use this setting to automatically determine commensurate signal threshold values. I/O 1 – Specifies the discrete signal I/O 1 to be an input, an output TTL driver, or an output open-drain driver. Drive SMB AT1 – If I/O 1 discrete signal is set as an output, selecting this option will map the state of the I/O 1 line to the AT1 SMB connector on the CAS-1000-I2C for signaling external instruments. Not applicable when I/O 1 is an input. I/O 2 – Specifies the discrete signal I/O 2 to be an input, an output TTL driver, or an output open-drain driver. Source – If I/O 2 discrete signal is set as an input, this setting specifies the source of the signal. Selecting Target routes it through the Serial Bus (RJ-45) connector on the CAS-1000-I2C. Selecting SMB AT2 routes it from the AT2 SMB connector on the CAS-1000-I2C, enabling triggers in from external instruments. Monitor Buffer Depth – This value indicates the number of transactions that occur before the monitor trace is considered to be full. The transaction depth ranges from 1 K (1,024) to 1 M (1,048,576) transactions. Monitor Buffer Log to File – This option provides continuous logging of trace data to host computer’s hard disk and, during "Run Repetitive" monitoring, can record and store endless hours of I2C bus traffic limited only by the available disk space. When this option is selected, the captured Monitor trace data is saved to files as described below. The trace data is stored in files with the extension "*.tdf", each of which holds up to 1M of consecutive I2C bus transactions. The trace data path and base filename are user-specified and then a numerical index is appended to each filename ("_nnnn") to indicate the chronological order in which the data was captured and saved. Note that each 1M-transaction trace data file uses about 260MB of disk space as it contains all captured I2C bus transaction data, including signal waveforms, timing and time stamp information. Use the Monitor Window's "Run Repetitive" button to continuously capture the traffic. Data will be captured into a *.tdf file and, once the file exceeds 1M transactions, another file will be opened to continue storing transactions, and so forth. Note that when the "Run" or the "Run Repetitive" button is clicked and trace data files with the same base filename already exist in the specified location, the user
Configuration and Preferences 187

will be prompted to overwrite them. While running, the Monitor Window displays the most recent 1M transactions of data, and the Run Status tab on the Monitor Tools window lists the name of the trace data file currently being logged to. After finishing capturing, you may double-click on the listed filenames to load the trace data to the Monitor Window.
Driving Bus Clock Rate Considerations When adjusting the SCL clock rate at which the analyzer operates the bus as a master (during Debugger and Emulation functions), the user must be aware of limitations imposed by the target bus itself. For example, if the bus rise-time is too slow for the selected rate (signals take a long time to reach the high threshold voltage) it may appear to the analyzer that another master is colliding and overriding its own SDA level. For very long rise-times, the signal might not even reach this level before turning around to fall. This may result in the analyzer protocol tracker reporting errors or it may even hang the bus if it seems like a new clock state has not arrived. Such a bus is therefore not suitable for the selected clock rate without additional methods to account for it. The Disable Collision Detection option restores better clock rate capability but eliminates the possibility of legitimate collisions getting detected and flagged in the trace listing. Forcing the Accelerated Rising Edge Drive mode on (even when not in high-speed mode) will allow better driving clock rate range since the analyzer will force rising edges up quickly despite the excess capacitance. This of course only fixes the bus when the analyzer is the master and does not cure slow rise-times for target resident masters. Finally, the above slow rise-time issues are strongly affected by analyzer supplied reference voltage and pull-up selections, which determine when the rising signal reaches the upper threshold to become detected as high. This applies when the analyzer is driving the bus. The two Bus Signal Threshold values further affect sensitivity to slow busses for either driver of the bus (analyzer or target) since signal level decision points are adjusted.
Files Pane When a project is saved, an .I2C file is created that stores all preferences, options, and settings for the session. Some of the project information, however, is stored separately from the main .I2C project file. This includes the configuration of trigger conditions (stored in a .TRG file), filters (stored in a .FIL file), and symbols (stored in a .SYM file). Separating this information from the project file allows for it to be easily imported into other projects where the same trigger, filter, or symbol configuration might be required. When a project is saved, the Files pane dialog, shown in Figure 166, will be automatically populated with any trigger, filter, or symbol configuration files that are created. The Browse… button is used to select a file for importing the relevant information from another project.
188 Configuration and Preferences
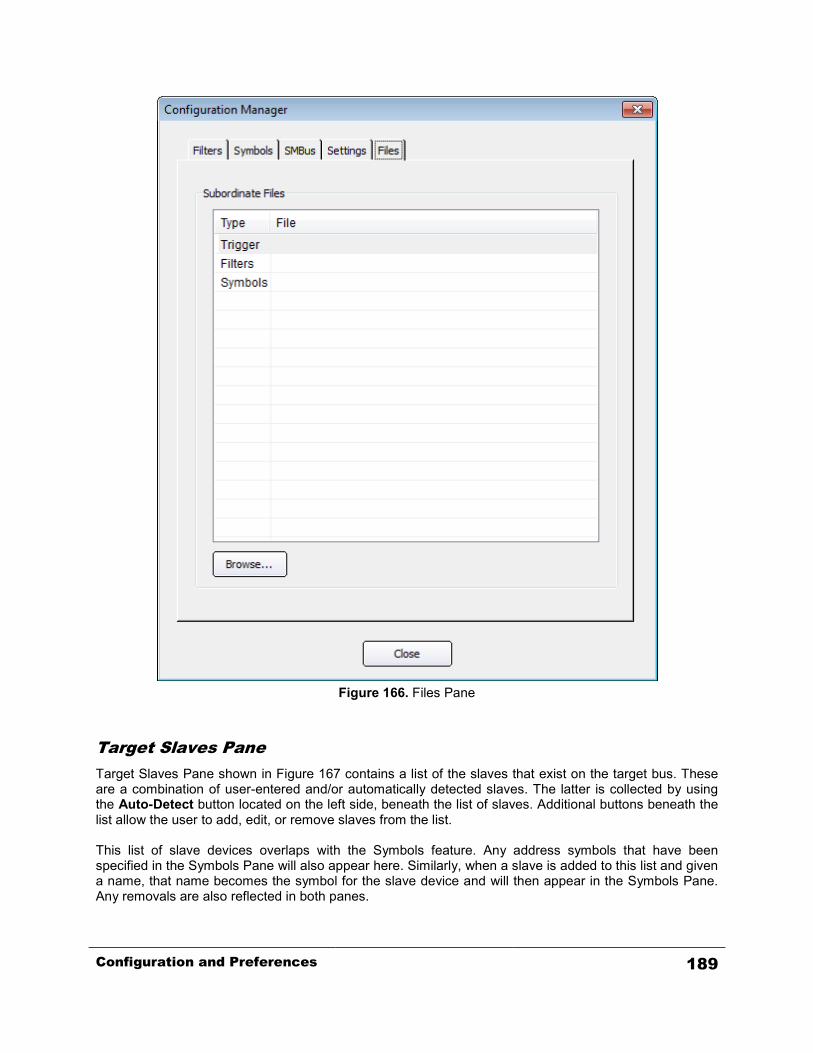
Figure 166. Files Pane
Target Slaves Pane Target Slaves Pane shown in Figure 167 contains a list of the slaves that exist on the target bus. These are a combination of user-entered and/or automatically detected slaves. The latter is collected by using the Auto-Detect button located on the left side, beneath the list of slaves. Additional buttons beneath the list allow the user to add, edit, or remove slaves from the list. This list of slave devices overlaps with the Symbols feature. Any address symbols that have been specified in the Symbols Pane will also appear here. Similarly, when a slave is added to this list and given a name, that name becomes the symbol for the slave device and will then appear in the Symbols Pane. Any removals are also reflected in both panes.
Configuration and Preferences 189
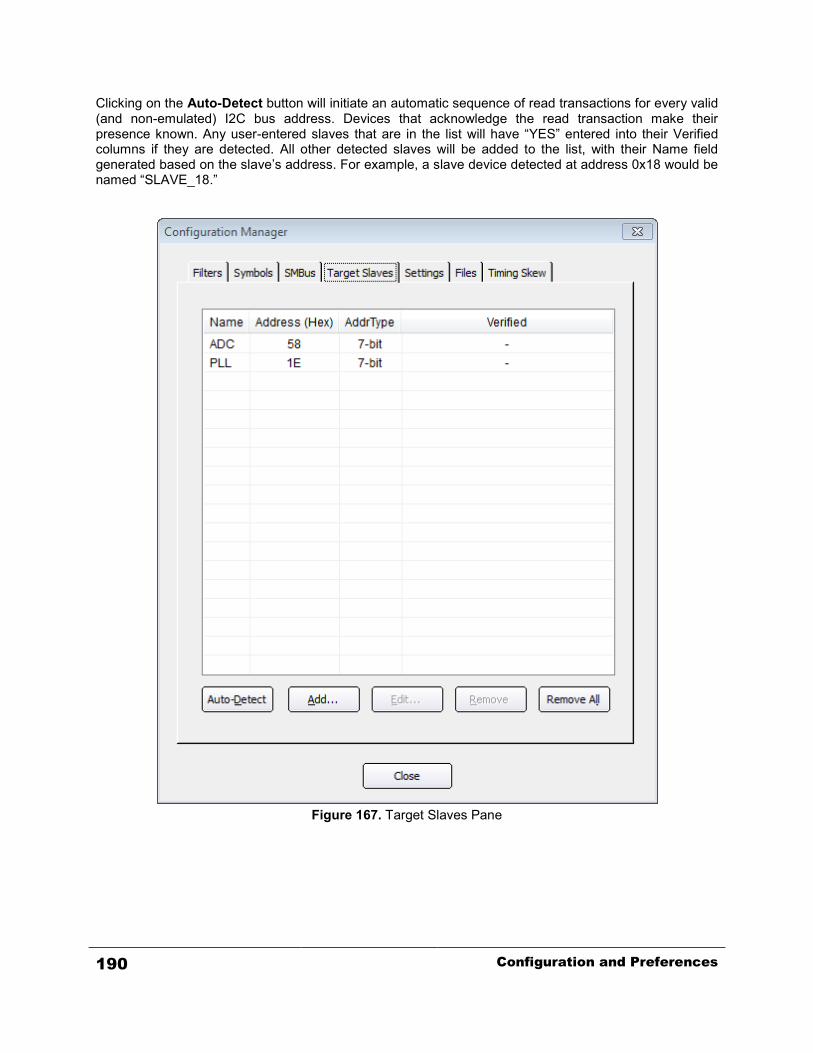
Clicking on the Auto-Detect button will initiate an automatic sequence of read transactions for every valid (and non-emulated) I2C bus address. Devices that acknowledge the read transaction make their presence known. Any user-entered slaves that are in the list will have “YES” entered into their Verified columns if they are detected. All other detected slaves will be added to the list, with their Name field generated based on the slave’s address. For example, a slave device detected at address 0x18 would be named “SLAVE_18.”
Figure 167. Target Slaves Pane
190 Configuration and Preferences

Timing Skew Pane The Timing Skew feature enables the analyzer to adjust its waveforms when it communicates with the target using master emulation or the debugger. According to the options and values set in this pane, shown in Figure 168, the phase between SDA and SCL are caused to shift later or earlier than normal. This is a useful deviation from normal bus communications as a means of stressing a particular slave with regard to signal edge timings (such as setup and hold times). Since such phase shifted signals might violate the bus protocol, if the monitor trace capture is running, the analyzer may report errors (this should be anticipated). Furthermore, to avoid the CAS-1000-I2C analyzer becoming halted by such protocol corruption and not completing the sending of messages toward the bus, the Collision Detection feature must be disabled when Timing Skew is in use. This Timing Skew mode is enabled or disabled by selecting one of the radio buttons in this pane. If the “Normal” option is selected, there will be no shifting of phase. If “Setup Time” is selected, users can specify how long the setup time between the SDA signal edge and the SCL rising edge will be. Similarly, “Hold Time” can be selected and specified to control the hold time between the falling edge of SCL and the SDA signal edge. The selectable ranges of the setup and hold times vary depending on the current SCL rate. They are roughly one eighth of a clock period on either negative or positive side in 20 ns steps. For example, for a 100 KHz SCL rate, the selectable range is from -1160 ns to 1240 ns. Users may select the values using the up/down arrows or type them in directly. The typed in values will be rounded to the nearest 20 ns steps automatically. The user should keep in mind that at certain points in the signal stream, the protocol changes the driver of the signal (such as during address ACK/NAK) when the master (the CAS-1000-I2C analyzer in this case) relinquishes SDA control to the slave. In the shifted case, this releasing of the bus is also delayed as is the re-establishment of driving control in the following bit. The resulting waveform will then be effected by the behavior of the interaction between these time shifted data bits and the slave.
Configuration and Preferences 191
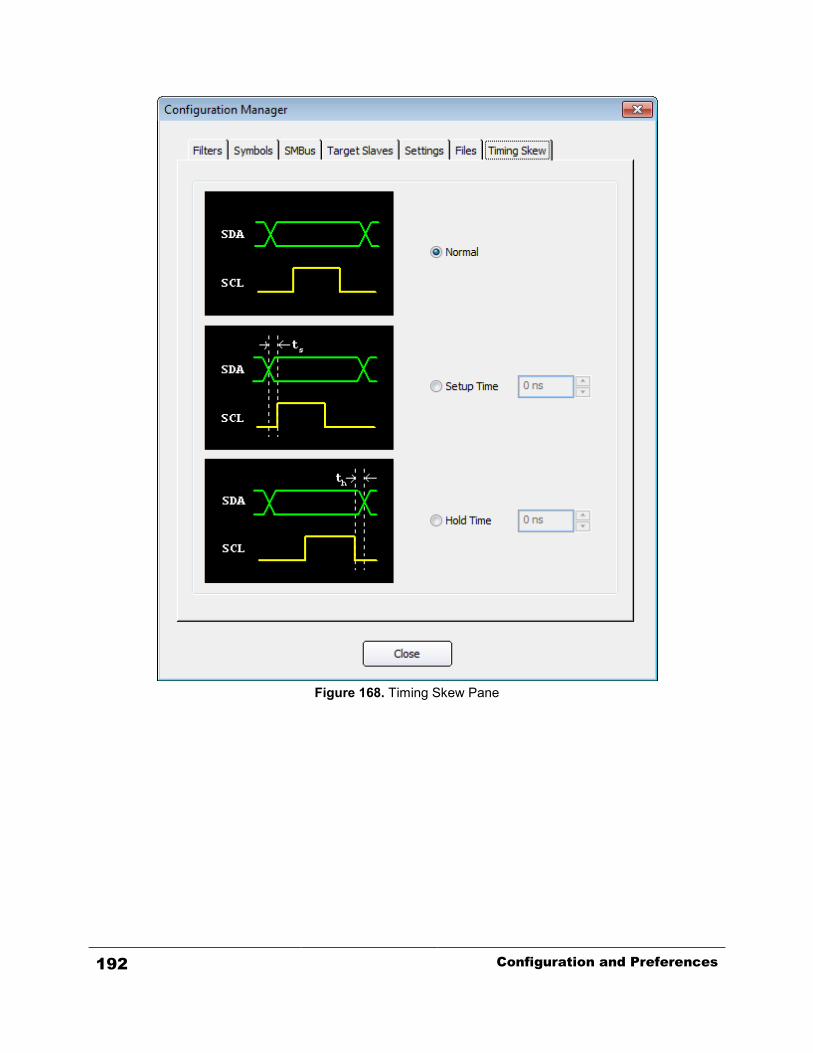
Figure 168. Timing Skew Pane
192 Configuration and Preferences
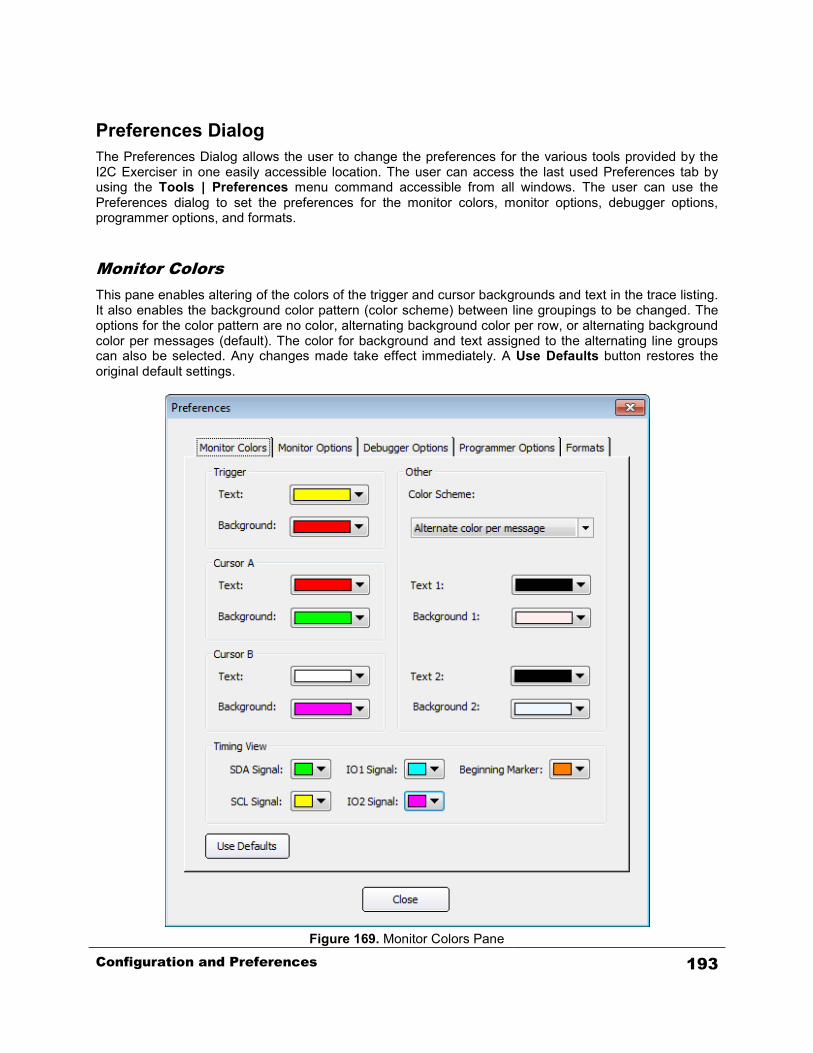
Preferences Dialog The Preferences Dialog allows the user to change the preferences for the various tools provided by the I2C Exerciser in one easily accessible location. The user can access the last used Preferences tab by using the Tools | Preferences menu command accessible from all windows. The user can use the Preferences dialog to set the preferences for the monitor colors, monitor options, debugger options, programmer options, and formats.
Monitor Colors This pane enables altering of the colors of the trigger and cursor backgrounds and text in the trace listing. It also enables the background color pattern (color scheme) between line groupings to be changed. The options for the color pattern are no color, alternating background color per row, or alternating background color per messages (default). The color for background and text assigned to the alternating line groups can also be selected. Any changes made take effect immediately. A Use Defaults button restores the original default settings.
Figure 169. Monitor Colors Pane
Configuration and Preferences 193
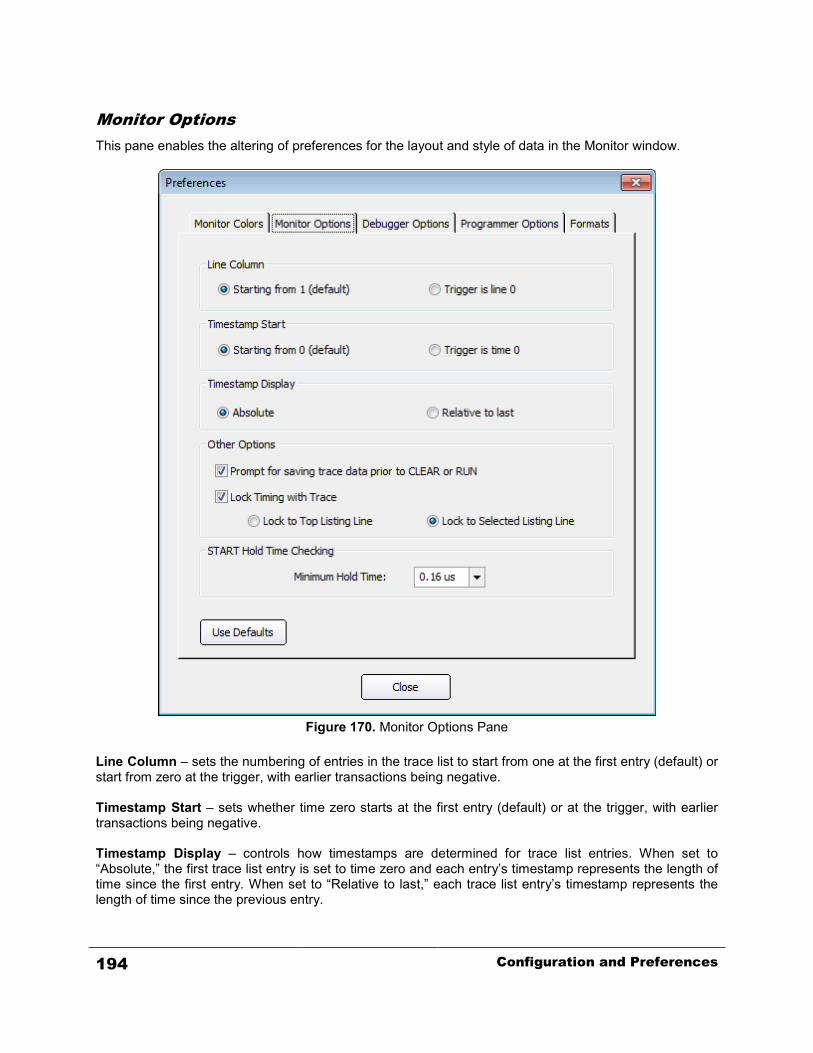
Monitor Options This pane enables the altering of preferences for the layout and style of data in the Monitor window.
Figure 170. Monitor Options Pane
Line Column – sets the numbering of entries in the trace list to start from one at the first entry (default) or start from zero at the trigger, with earlier transactions being negative. Timestamp Start – sets whether time zero starts at the first entry (default) or at the trigger, with earlier transactions being negative. Timestamp Display – controls how timestamps are determined for trace list entries. When set to “Absolute,” the first trace list entry is set to time zero and each entry’s timestamp represents the length of time since the first entry. When set to “Relative to last,” each trace list entry’s timestamp represents the length of time since the previous entry.
194 Configuration and Preferences
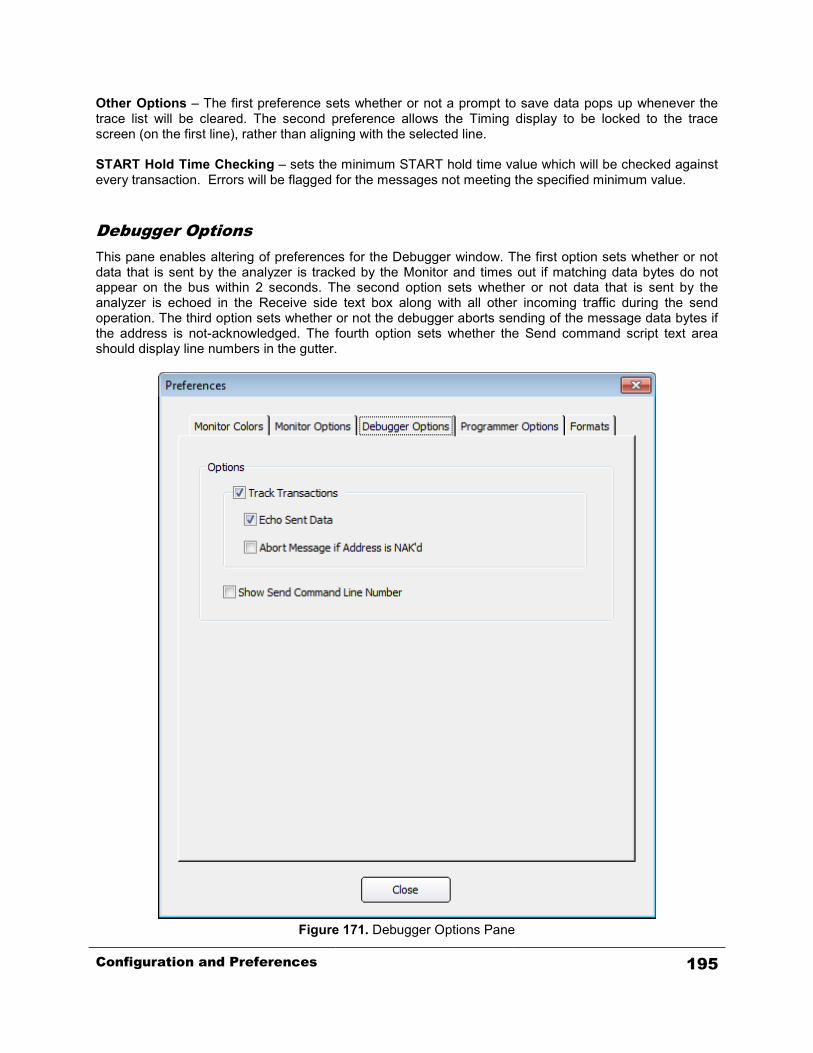
Other Options – The first preference sets whether or not a prompt to save data pops up whenever the trace list will be cleared. The second preference allows the Timing display to be locked to the trace screen (on the first line), rather than aligning with the selected line. START Hold Time Checking – sets the minimum START hold time value which will be checked against every transaction. Errors will be flagged for the messages not meeting the specified minimum value.
Debugger Options This pane enables altering of preferences for the Debugger window. The first option sets whether or not data that is sent by the analyzer is tracked by the Monitor and times out if matching data bytes do not appear on the bus within 2 seconds. The second option sets whether or not data that is sent by the analyzer is echoed in the Receive side text box along with all other incoming traffic during the send operation. The third option sets whether or not the debugger aborts sending of the message data bytes if the address is not-acknowledged. The fourth option sets whether the Send command script text area should display line numbers in the gutter.
Figure 171. Debugger Options Pane
Configuration and Preferences 195
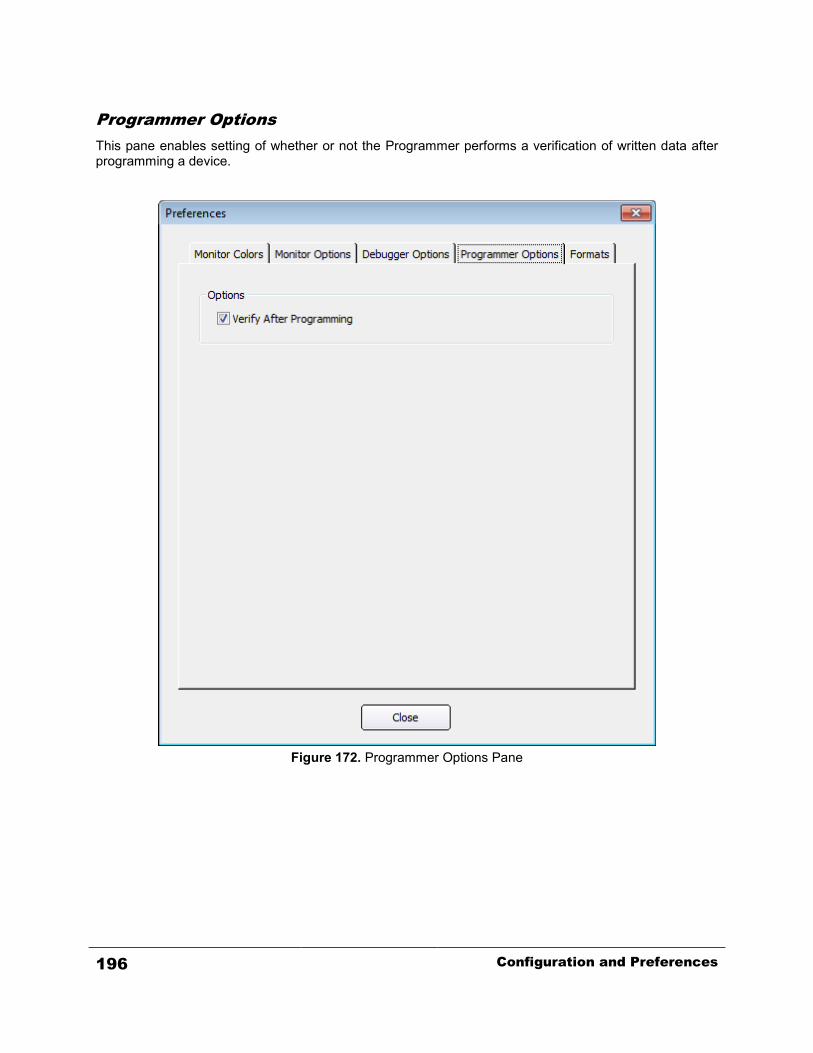
Programmer Options This pane enables setting of whether or not the Programmer performs a verification of written data after programming a device.
Figure 172. Programmer Options Pane
196 Configuration and Preferences
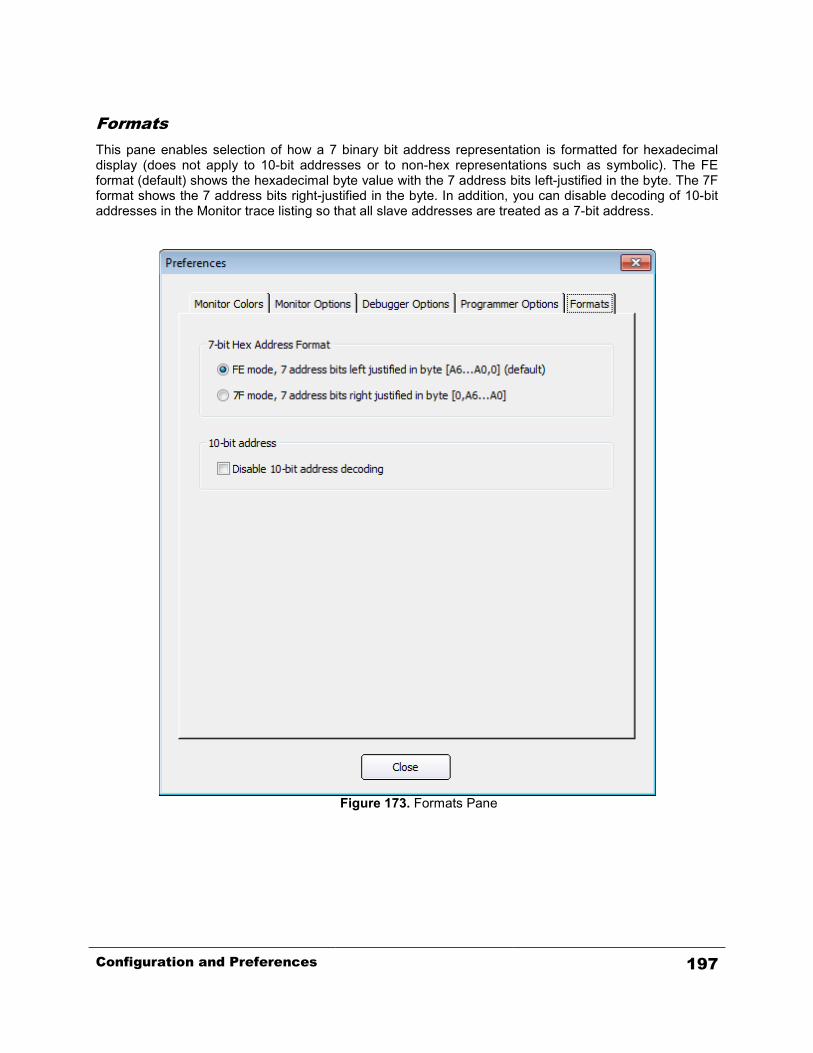
Formats This pane enables selection of how a 7 binary bit address representation is formatted for hexadecimal display (does not apply to 10-bit addresses or to non-hex representations such as symbolic). The FE format (default) shows the hexadecimal byte value with the 7 address bits left-justified in the byte. The 7F format shows the 7 address bits right-justified in the byte. In addition, you can disable decoding of 10-bit addresses in the Monitor trace listing so that all slave addresses are treated as a 7-bit address.
Figure 173. Formats Pane
Configuration and Preferences 197

Using Project Files When the I2C Exerciser saves and loads project files, it saves and loads all of your customized settings and preferences with these files. It is recommended that you become familiar with this feature and make use of it as much as possible. This functionality allows you to save an environment that you have set up for a particular target bus, debugging session, or test routine, and then load up that environment whenever needed. Using this feature, you can not only save and retrieve the bus interface settings, but also preserve the look and feel of the project by storing options such as color schemes, data formats, and window sizes, layouts, and positions. This can provide a great way to let multiple users have their own separate project setting defaults. Following is a list of settings that are saved in the project file:
• All settings from the Configuration Manager including: o Filters o Symbols o SMBus decoding file list o Bus interface settings o Project sub-file list o Target slave lists o Timing skew settings
• All settings from the Preferences dialog including: o Monitor colors and options o Debugger options o Programmer options o Address format options
• All settings from the Trigger dialog • Window sizes and positions of the Monitor, Debugger, Programmer, Emulator, Test, Parameters
Scope, and Monitor Tools windows • Monitor window’s layout, column settings, and trace data file path • Debugger window’s send and receive settings including address, address types, run repetitions,
number of bytes to read, no-stop-bit options, and debugger command file path • Programmer window’s configuration file path • Emulation Manager device list and configurations • Test window’s script file path
When you launch the I2C Exerciser for the first time, either from its shortcut on the desktop or the I2C Exerciser program group of the Windows Start menu, you are staring with a new project using the application default configuration settings. You will notice that in this case the title bar of the main application window displays the project name “Untitled” as shown in Figure 174. To give a name to your project, simply select the Save Project menu item from the File menu and then specify a name and the path for the project file. If you want to rename your project at a later time, you can choose the Save Project As menu item from the File menu and provide a new file name and path.
Figure 174. Title Bar for a New Project
198 Configuration and Preferences

Once you have saved a project to a file, the title bar will display the current project file name as shown in Figure 175.
Figure 175. Title Bar for a Saved Project
The project settings are saved in a file with “.i2c” extension. Along with this main *.i2c file, several secondary files are created and associated with the project whenever you create a new project. They are the trigger (*.trg), filters (*.fil), and symbols (*.sym) files. Having these separate project sub-files allows you to re-use the settings that they contain from within another project. This can be achieved by selecting the sub-files from the Files tab of the Configuration Manager. By default, when you create and save a new project, the application will automatically give the same name to these sub-files as the main project file (only the file extension will differ). The I2C Exerciser keeps track of any changes made to a project’s settings during a session. Upon exiting the application or closing the current project, it will ask you whether you want to save the changes or not. You may choose not to save it, to preserve your original project settings, or to save the latest changes to the project for next time. Along with the configuration settings, preferences, and window positions, a project also remembers the names and paths of certain data files associated with the project. These data files include: the monitor trace data file (*.tdf), the debugger command file (*.dcf), the programmer configuration file (*.pcf), and the test script file (*.scr). Note that the project file only stores the names and paths of these data files, not their actual contents. Once you have saved a project, you can load it again later in three different ways. You may start the I2C Exerciser and then select the Open Project menu item from the File menu to bring up a dialog that allows you to browse for and select the desired project file. Secondly, you may select the project name from among the MRU (Most Recently Used) list in the File menu (see Figure 176). This list includes up to the last four projects that have been opened. Finally, you can also launch the I2C Exerciser and load a project file in a single step by double clicking on the associated project file from the Windows Explorer.
Figure 176. File Menu MRU Project List
Configuration and Preferences 199
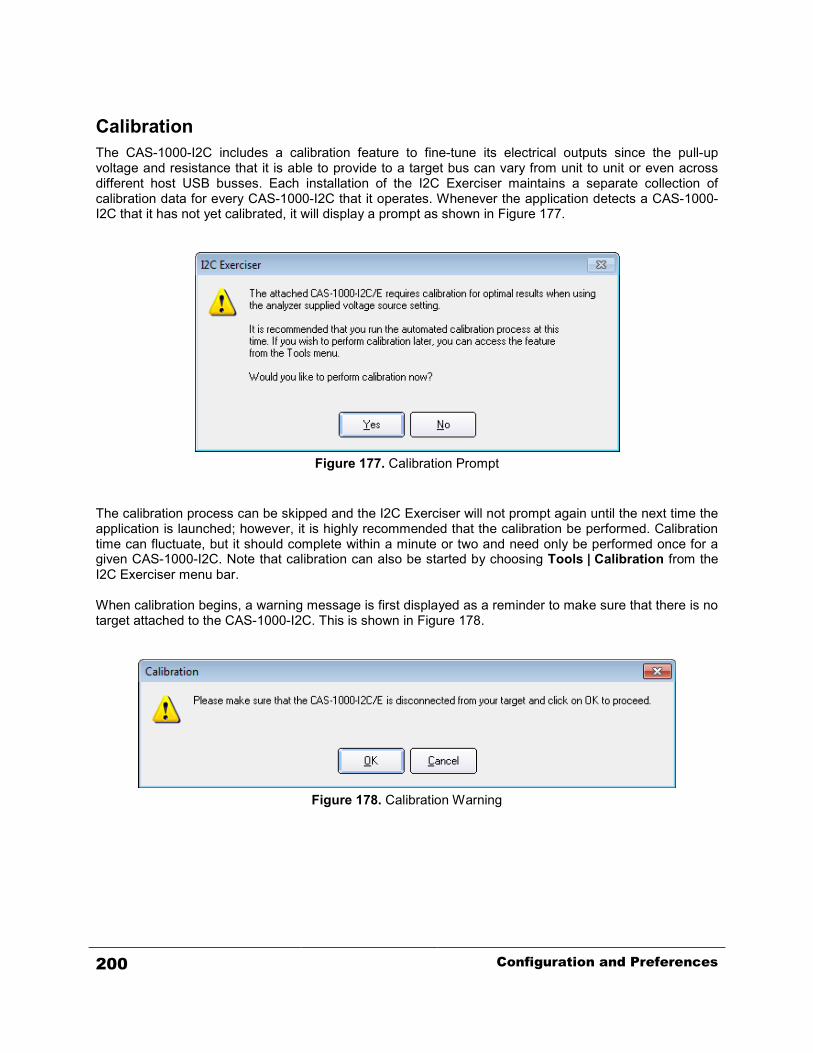
Calibration The CAS-1000-I2C includes a calibration feature to fine-tune its electrical outputs since the pull-up voltage and resistance that it is able to provide to a target bus can vary from unit to unit or even across different host USB busses. Each installation of the I2C Exerciser maintains a separate collection of calibration data for every CAS-1000-I2C that it operates. Whenever the application detects a CAS-1000-I2C that it has not yet calibrated, it will display a prompt as shown in Figure 177.
Figure 177. Calibration Prompt
The calibration process can be skipped and the I2C Exerciser will not prompt again until the next time the application is launched; however, it is highly recommended that the calibration be performed. Calibration time can fluctuate, but it should complete within a minute or two and need only be performed once for a given CAS-1000-I2C. Note that calibration can also be started by choosing Tools | Calibration from the I2C Exerciser menu bar. When calibration begins, a warning message is first displayed as a reminder to make sure that there is no target attached to the CAS-1000-I2C. This is shown in Figure 178.
Figure 178. Calibration Warning
200 Configuration and Preferences
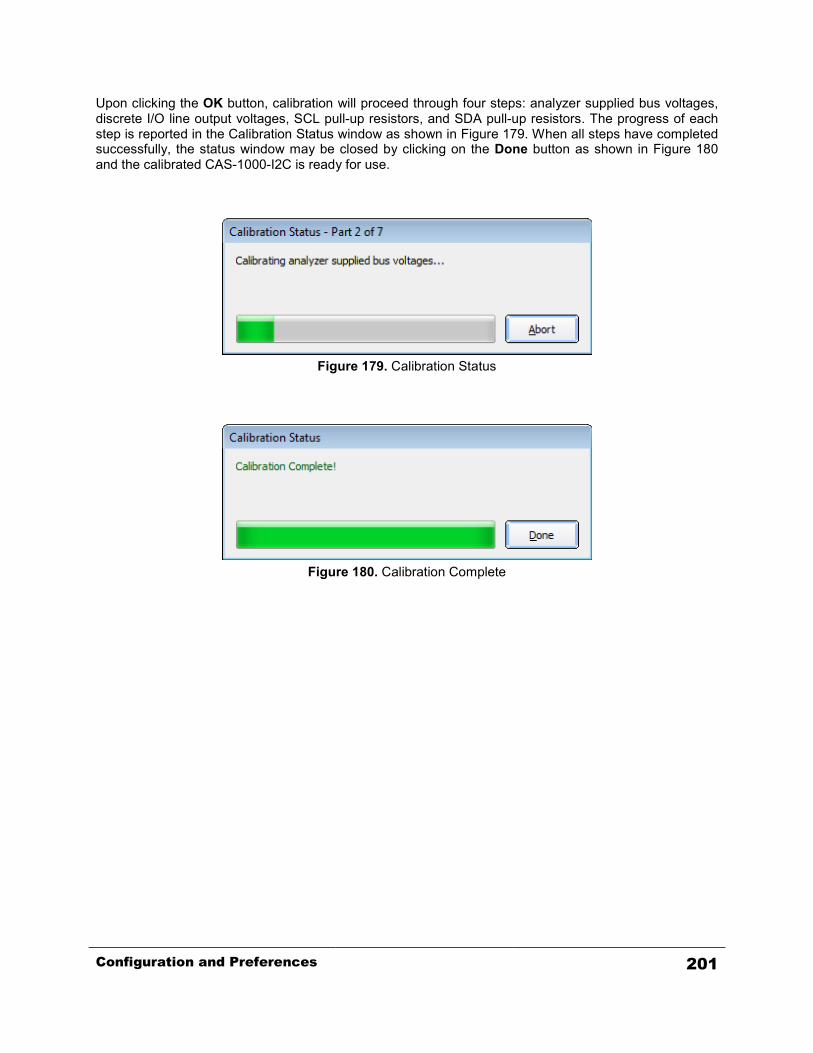
Upon clicking the OK button, calibration will proceed through four steps: analyzer supplied bus voltages, discrete I/O line output voltages, SCL pull-up resistors, and SDA pull-up resistors. The progress of each step is reported in the Calibration Status window as shown in Figure 179. When all steps have completed successfully, the status window may be closed by clicking on the Done button as shown in Figure 180 and the calibrated CAS-1000-I2C is ready for use.
Figure 179. Calibration Status
Figure 180. Calibration Complete
Configuration and Preferences 201

202 Configuration and Preferences

Chapter 9 Third Party Application Interface
Description of using the CAS-1000-I2C with third party software
Overview The CAS-1000-I2C provides the ability to operate some of its features by using function calls from third party software. In this manner, such applications can access the connected I2C bus of the target, including observing its traffic, interacting with it, and performing bus measurements. This effectively provides such software with a portal to the connected I2C bus. One set of common third party applications includes the National Instruments LabWindows/CVI and LabVIEW software. These are capable of accessing external routines by using DLL function calls. Therefore, the DLL library described in this chapter can be used by these popular applications. More generally, any application which can call DLL routines can invoke the library routines described in this chapter and gain control and visibility of the CAS-1000-I2C resources and the connected I2C bus.
Third Party Application Interface 203
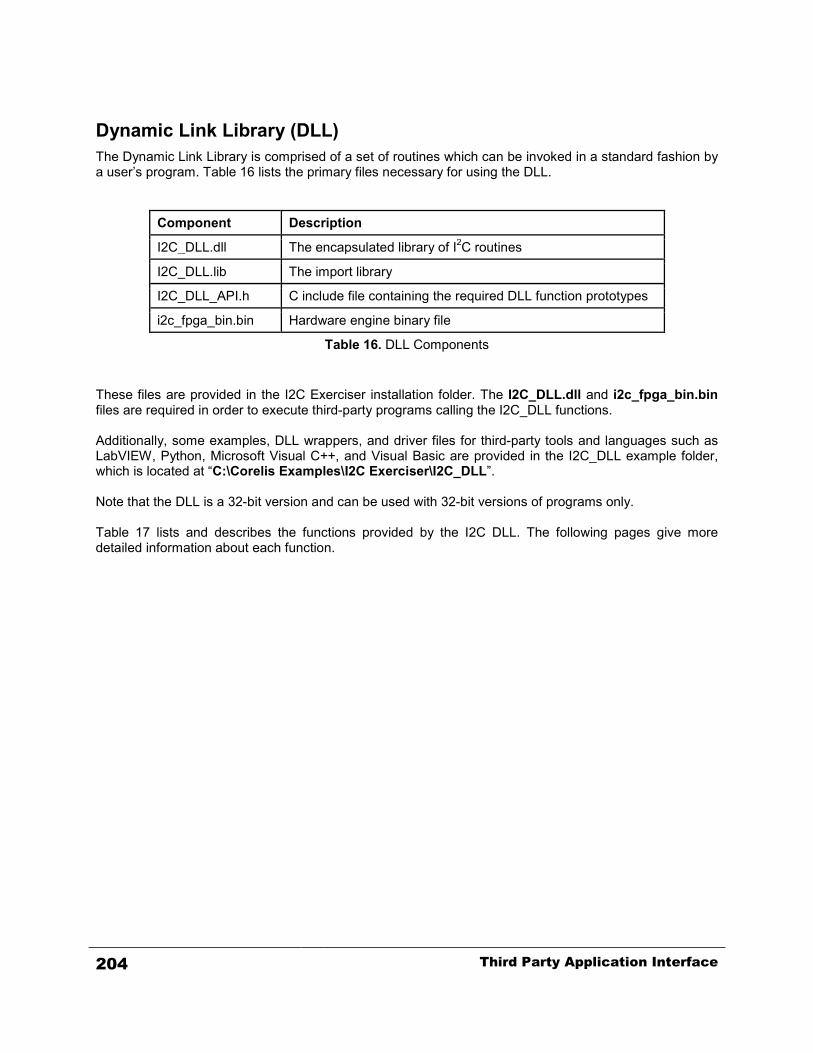
Dynamic Link Library (DLL) The Dynamic Link Library is comprised of a set of routines which can be invoked in a standard fashion by a user’s program. Table 16 lists the primary files necessary for using the DLL.
Component Description
I2C_DLL.dll The encapsulated library of I2C routines
I2C_DLL.lib The import library
I2C_DLL_API.h C include file containing the required DLL function prototypes
i2c_fpga_bin.bin Hardware engine binary file
Table 16. DLL Components These files are provided in the I2C Exerciser installation folder. The I2C_DLL.dll and i2c_fpga_bin.bin files are required in order to execute third-party programs calling the I2C_DLL functions. Additionally, some examples, DLL wrappers, and driver files for third-party tools and languages such as LabVIEW, Python, Microsoft Visual C++, and Visual Basic are provided in the I2C_DLL example folder, which is located at “C:\Corelis Examples\I2C Exerciser\I2C_DLL”. Note that the DLL is a 32-bit version and can be used with 32-bit versions of programs only. Table 17 lists and describes the functions provided by the I2C DLL. The following pages give more detailed information about each function.
204 Third Party Application Interface

General Calling Sequence Certain DLL function calls are required to properly initiate, setup, operate, and shut down the CAS-1000-I2C. This sequence of calls is summarized as follows:
I2C_InitHardware // required connection to PC USB port + loading logic and firmware I2C_LoadSetup // optional… brings in previously saved setup information. I2C_SetFEAddrFormat // optional (default is FE mode)… establish address byte format. Assorted configuration and/or Overwrite functions // optional setting or over-writing loaded configuration. . . . Target interaction sequences // do various mission related target operations . . . I2C_ShutdownHardware // required shut down and disconnection from PC USB port.
The first and last function calls are mandatory. The first function call will enable most of the other operations. The last function call assures a clean disconnection of the CAS-1000-I2C so that it can be restarted trouble-free. If this is not done, it may be necessary to cycle-plug the analyzer in the USB port. Note that I2C_DLL.dll exports a dual set of functions, one using the _cdecl convention and the other using the _stdcall convention. For the set of functions using the standard call convention, the postfix "_StdCall" is added to each function name, and the list is provided in the “I2C_DLL.def” file. For example, “I2C_InitHardware()” is a _cdecl function while “I2C_InitHardware_StdCall()” is a _stdcall function.
Third Party Application Interface 205
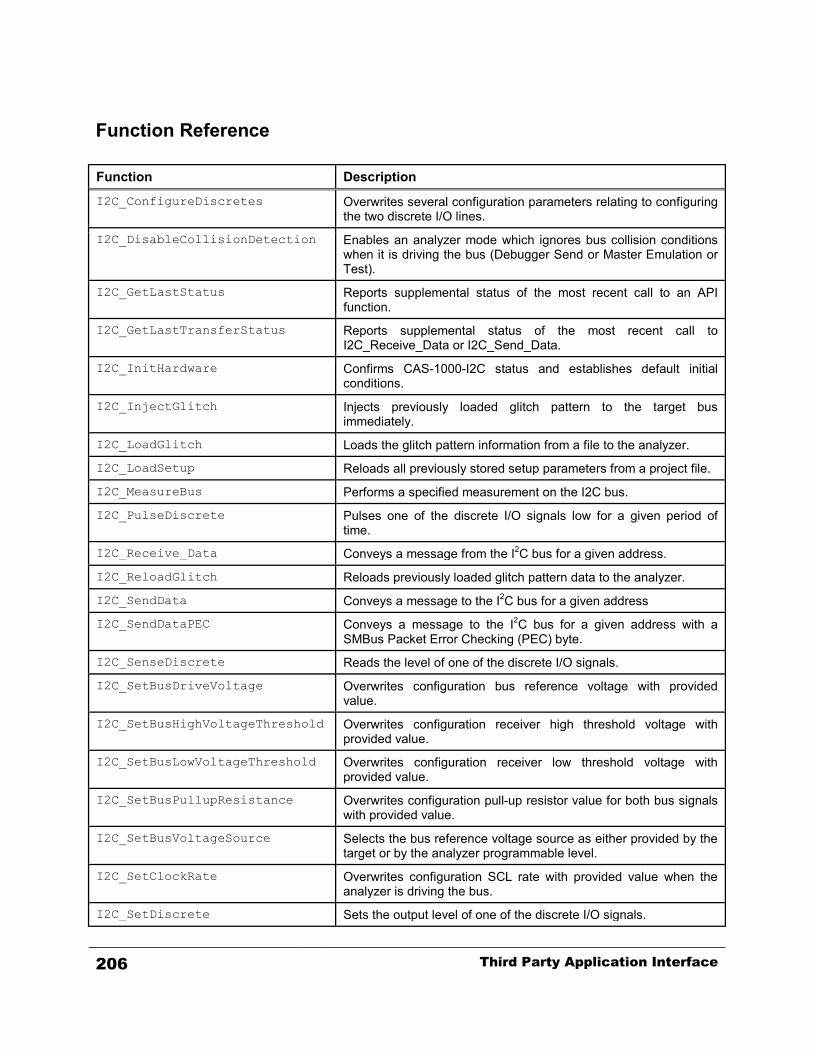
Function Reference Function Description
I2C_ConfigureDiscretes Overwrites several configuration parameters relating to configuring the two discrete I/O lines.
I2C_DisableCollisionDetection Enables an analyzer mode which ignores bus collision conditions when it is driving the bus (Debugger Send or Master Emulation or Test).
I2C_GetLastStatus Reports supplemental status of the most recent call to an API function.
I2C_GetLastTransferStatus Reports supplemental status of the most recent call to I2C_Receive_Data or I2C_Send_Data.
I2C_InitHardware Confirms CAS-1000-I2C status and establishes default initial conditions.
I2C_InjectGlitch Injects previously loaded glitch pattern to the target bus immediately.
I2C_LoadGlitch Loads the glitch pattern information from a file to the analyzer.
I2C_LoadSetup Reloads all previously stored setup parameters from a project file.
I2C_MeasureBus Performs a specified measurement on the I2C bus.
I2C_PulseDiscrete Pulses one of the discrete I/O signals low for a given period of time.
I2C_Receive_Data Conveys a message from the I2C bus for a given address.
I2C_ReloadGlitch Reloads previously loaded glitch pattern data to the analyzer.
I2C_SendData Conveys a message to the I2C bus for a given address
I2C_SendDataPEC Conveys a message to the I2C bus for a given address with a SMBus Packet Error Checking (PEC) byte.
I2C_SenseDiscrete Reads the level of one of the discrete I/O signals.
I2C_SetBusDriveVoltage Overwrites configuration bus reference voltage with provided value.
I2C_SetBusHighVoltageThreshold Overwrites configuration receiver high threshold voltage with provided value.
I2C_SetBusLowVoltageThreshold Overwrites configuration receiver low threshold voltage with provided value.
I2C_SetBusPullupResistance Overwrites configuration pull-up resistor value for both bus signals with provided value.
I2C_SetBusVoltageSource Selects the bus reference voltage source as either provided by the target or by the analyzer programmable level.
I2C_SetClockRate Overwrites configuration SCL rate with provided value when the analyzer is driving the bus.
I2C_SetDiscrete Sets the output level of one of the discrete I/O signals.
206 Third Party Application Interface
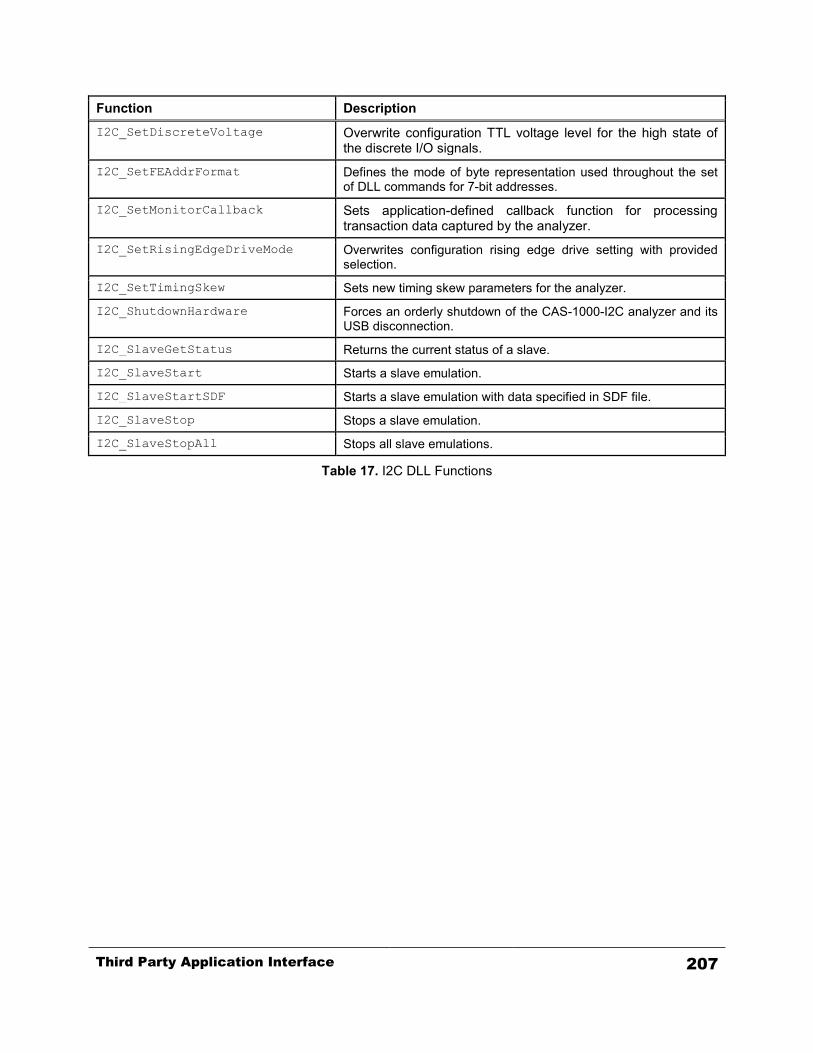
Function Description I2C_SetDiscreteVoltage Overwrite configuration TTL voltage level for the high state of
the discrete I/O signals.
I2C_SetFEAddrFormat Defines the mode of byte representation used throughout the set of DLL commands for 7-bit addresses.
I2C_SetMonitorCallback Sets application-defined callback function for processing transaction data captured by the analyzer.
I2C_SetRisingEdgeDriveMode Overwrites configuration rising edge drive setting with provided selection.
I2C_SetTimingSkew Sets new timing skew parameters for the analyzer.
I2C_ShutdownHardware Forces an orderly shutdown of the CAS-1000-I2C analyzer and its USB disconnection.
I2C_SlaveGetStatus Returns the current status of a slave.
I2C_SlaveStart Starts a slave emulation.
I2C_SlaveStartSDF Starts a slave emulation with data specified in SDF file.
I2C_SlaveStop Stops a slave emulation.
I2C_SlaveStopAll Stops all slave emulations.
Table 17. I2C DLL Functions
Third Party Application Interface 207
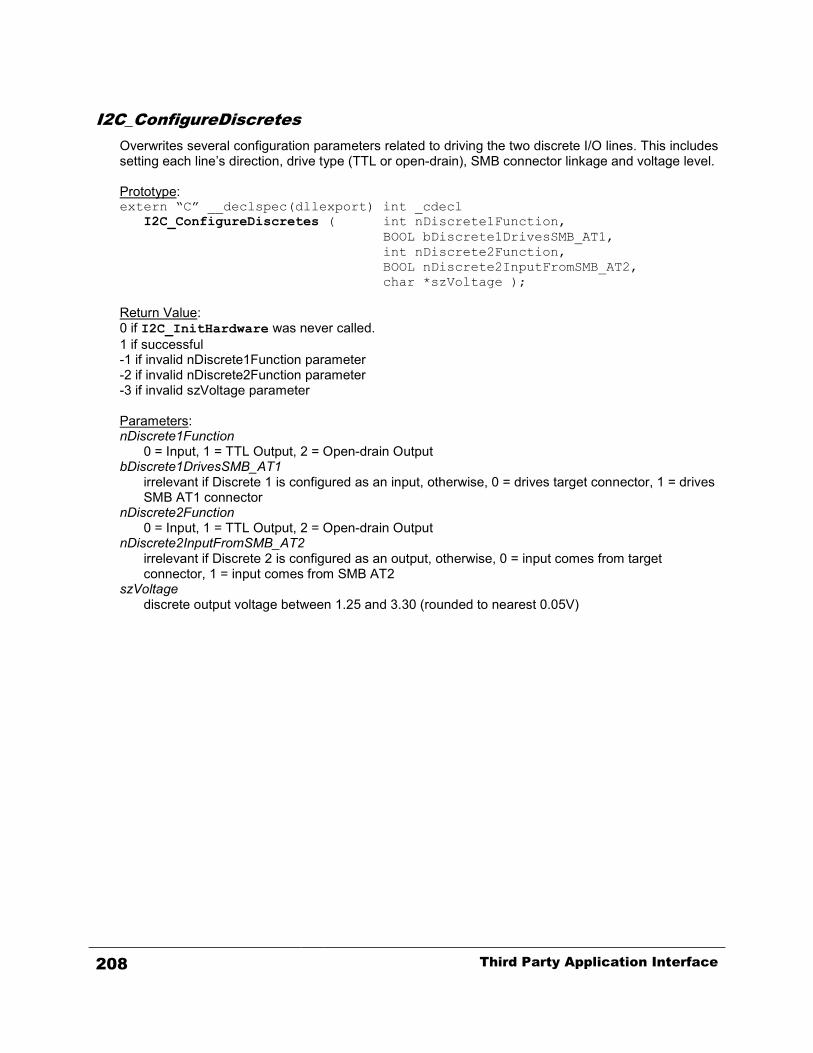
I2C_ConfigureDiscretes Overwrites several configuration parameters related to driving the two discrete I/O lines. This includes setting each line’s direction, drive type (TTL or open-drain), SMB connector linkage and voltage level. Prototype: extern “C” __declspec(dllexport) int _cdecl
I2C_ConfigureDiscretes ( int nDiscrete1Function, BOOL bDiscrete1DrivesSMB_AT1, int nDiscrete2Function, BOOL nDiscrete2InputFromSMB_AT2, char *szVoltage );
Return Value: 0 if I2C_InitHardware was never called. 1 if successful -1 if invalid nDiscrete1Function parameter -2 if invalid nDiscrete2Function parameter -3 if invalid szVoltage parameter
Parameters: nDiscrete1Function
0 = Input, 1 = TTL Output, 2 = Open-drain Output bDiscrete1DrivesSMB_AT1
irrelevant if Discrete 1 is configured as an input, otherwise, 0 = drives target connector, 1 = drives SMB AT1 connector
nDiscrete2Function 0 = Input, 1 = TTL Output, 2 = Open-drain Output
nDiscrete2InputFromSMB_AT2 irrelevant if Discrete 2 is configured as an output, otherwise, 0 = input comes from target connector, 1 = input comes from SMB AT2
szVoltage discrete output voltage between 1.25 and 3.30 (rounded to nearest 0.05V)
208 Third Party Application Interface

I2C_DisableCollisionDetection Enables an analyzer mode which ignores bus collision conditions when it is driving the bus. This may be useful for busses with overly slow rise-times. In such cases, the analyzer will not see its own high SDA drive level soon enough before deciding that another master is driving the bus and colliding with it. This mode will stop the analyzer from checking this condition and permit continued operation without an error condition. Prototype: extern “C” __declspec(dllexport) int _cdecl
I2C_DisableCollisionDetection ( int nEnable ); Return Value: 0 if I2C_InitHardware has not yet been called, otherwise, 1.
Parameters: nEnable
1 = disable collision detection. 0 = enable collision detection.
Third Party Application Interface 209

I2C_GetLastStatus Reports supplemental status of the most recent call to an API function. Prototype: extern “C” __declspec(dllexport) char * _cdecl
I2C_GetLastStatus ( void ); Return Value: The status string indicating the result of the most recent call to an API function, including any error messages.
Parameters: None.
210 Third Party Application Interface
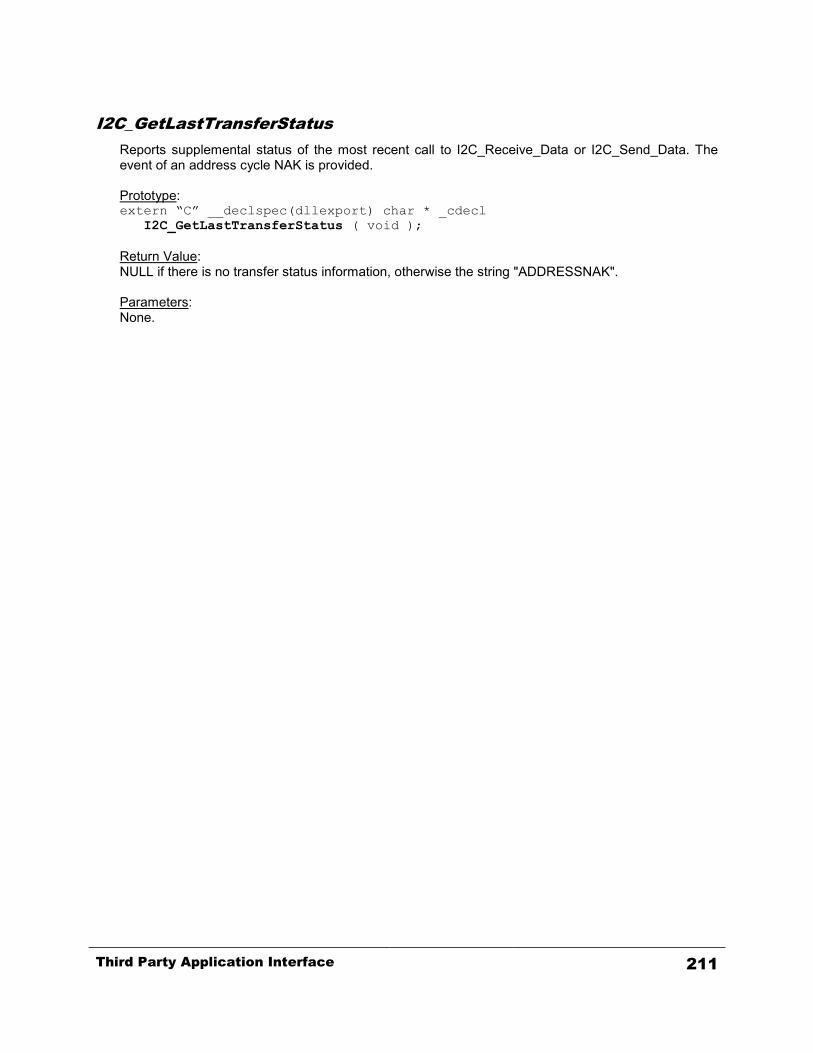
I2C_GetLastTransferStatus Reports supplemental status of the most recent call to I2C_Receive_Data or I2C_Send_Data. The event of an address cycle NAK is provided. Prototype: extern “C” __declspec(dllexport) char * _cdecl
I2C_GetLastTransferStatus ( void ); Return Value: NULL if there is no transfer status information, otherwise the string "ADDRESSNAK".
Parameters: None.
Third Party Application Interface 211

I2C_InitHardware Confirms that the CAS-1000-I2C is present and properly linked via its USB port. It initializes the hardware with logic and downloads the firmware, with all settings at factory default states. Prototype: extern “C” __declspec(dllexport) char * _cdecl
I2C_InitHardware ( void ); Return Value: NULL if the initialization was successful, otherwise, a pointer to a string containing text with an error message. Parameters: None.
212 Third Party Application Interface
I2C_InjectGlitch Injects previously loaded glitch pattern to the target bus immediately, without waiting for any armed trigger event. This function allows you to bypass the arming and triggering sequence of glitch injection. The I2C_LoadGlitch or I2C_ReloadGlitch function must be called prior to calling this function. Prototype: extern “C” __declspec(dllexport) int _cdecl
I2C_InjectGlitch ( void ); Return Value: 1 if successful 0 if error occurred Call I2C_GetLastStatus function to get the result of the call in a string format, including an error message. Parameters: None.
Third Party Application Interface 213
I2C_LoadGlitch Loads the glitch pattern information from a glitch pattern file (*.gpf) to the CAS-1000. This function must be called prior to a glitch injection. Depending on the second parameter, the trigger will be armed immediately or armed during an I2C_SendData function call. The actual injection of the glitch happens when the armed trigger condition is met. Prototype: extern “C” __declspec(dllexport) int _cdecl
I2C_LoadGlitch ( char *szGlitchPatternFilePath, int bArmGlitch);
Return Value: 1 if successful 0 if error occurred Call I2C_GetLastStatus function to get the result of the call in a string format, including an error message. Parameters: szGlitchPatternFilePath
String representing the path to the glitch pattern file (*.gpf) to be loaded. This file can be created using the “Glitch Pattern Editor” tool in I2C Exerciser program.
bArmGlitch Integer 1 (TRUE) or 0 (FALSE) indicating whether to arm the glitch trigger immediately. The trigger can be armed during the I2C_SendData function call if this parameter is set to FALSE. This provides a flexibility of arming the glitch trigger right before the nth byte of the data being sent.
214 Third Party Application Interface

I2C_LoadSetup Overwrites all settings from the referenced project (*.i2c) file. Following are the parameters being loaded.
LowThresholdVoltageSetting, HighThresholdVoltageSetting, InterfaceSpeedSetting, TolerateSlowRiseTimes, DisableCollisionDetection, AnalyzerSuppliesBusVoltage, BusDriveVoltageSetting, BusDrivePullUpSetting, SlopeControlMode, BufferDepthSetting, Discrete1IOmode, Discrete1Drives_SMB_AT1, Discrete2IOmode, Discrete2InputSource, DiscreteVoltage, HiSpeedMode, TimingSkewMode, TimingSkewSetupTime, TimingSkewHoldTime, SMBusTimeout, Is8BitAddrFormat
Prototype: extern “C” __declspec(dllexport) char * _cdecl
I2C_LoadSetup ( char * szFilename ); Return Value: NULL if the loading the parameters was successful, otherwise a pointer to a string containing an error message. Parameters: szFilename
The string holding the full path, including the filename of the project file containing the instrument settings.
Third Party Application Interface 215
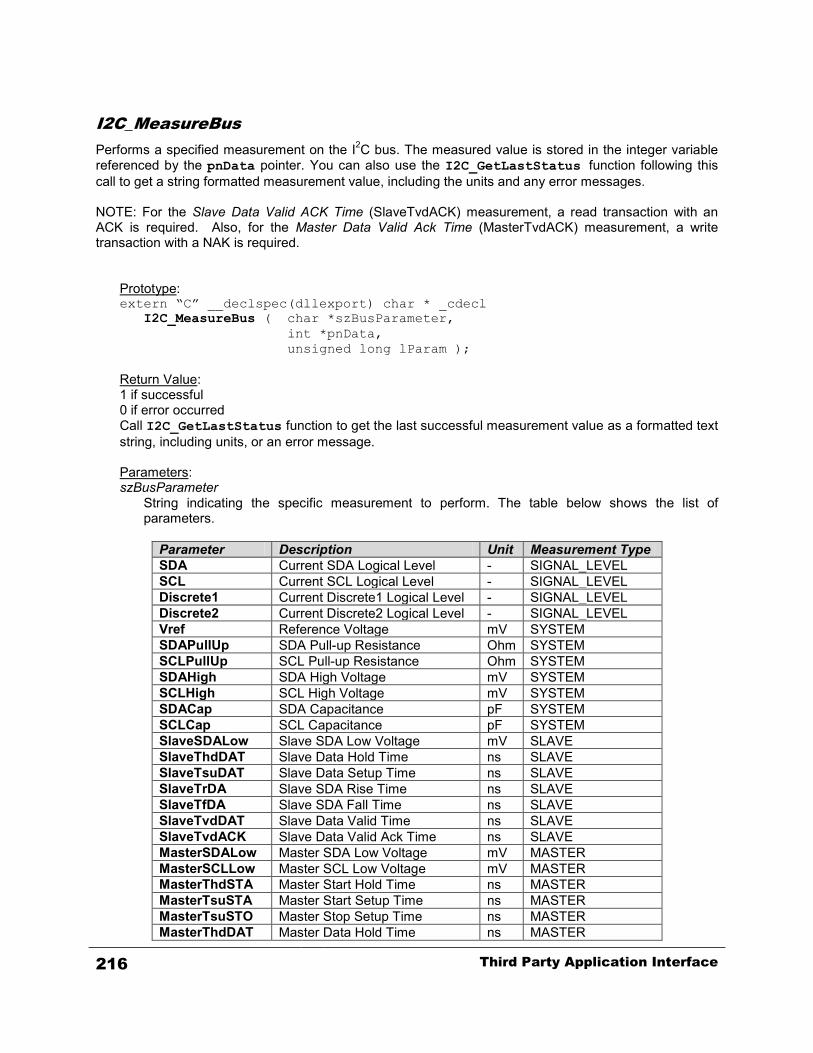
I2C_MeasureBus Performs a specified measurement on the I2C bus. The measured value is stored in the integer variable referenced by the pnData pointer. You can also use the I2C_GetLastStatus function following this call to get a string formatted measurement value, including the units and any error messages. NOTE: For the Slave Data Valid ACK Time (SlaveTvdACK) measurement, a read transaction with an ACK is required. Also, for the Master Data Valid Ack Time (MasterTvdACK) measurement, a write transaction with a NAK is required.
Prototype: extern “C” __declspec(dllexport) char * _cdecl
I2C_MeasureBus ( char *szBusParameter, int *pnData, unsigned long lParam );
Return Value: 1 if successful 0 if error occurred Call I2C_GetLastStatus function to get the last successful measurement value as a formatted text string, including units, or an error message. Parameters: szBusParameter
String indicating the specific measurement to perform. The table below shows the list of parameters.
Parameter Description Unit Measurement Type SDA Current SDA Logical Level - SIGNAL_LEVEL SCL Current SCL Logical Level - SIGNAL_LEVEL Discrete1 Current Discrete1 Logical Level - SIGNAL_LEVEL Discrete2 Current Discrete2 Logical Level - SIGNAL_LEVEL Vref Reference Voltage mV SYSTEM SDAPullUp SDA Pull-up Resistance Ohm SYSTEM SCLPullUp SCL Pull-up Resistance Ohm SYSTEM SDAHigh SDA High Voltage mV SYSTEM SCLHigh SCL High Voltage mV SYSTEM SDACap SDA Capacitance pF SYSTEM SCLCap SCL Capacitance pF SYSTEM SlaveSDALow Slave SDA Low Voltage mV SLAVE SlaveThdDAT Slave Data Hold Time ns SLAVE SlaveTsuDAT Slave Data Setup Time ns SLAVE SlaveTrDA Slave SDA Rise Time ns SLAVE SlaveTfDA Slave SDA Fall Time ns SLAVE SlaveTvdDAT Slave Data Valid Time ns SLAVE SlaveTvdACK Slave Data Valid Ack Time ns SLAVE MasterSDALow Master SDA Low Voltage mV MASTER MasterSCLLow Master SCL Low Voltage mV MASTER MasterThdSTA Master Start Hold Time ns MASTER MasterTsuSTA Master Start Setup Time ns MASTER MasterTsuSTO Master Stop Setup Time ns MASTER MasterThdDAT Master Data Hold Time ns MASTER
216 Third Party Application Interface

Parameter Description Unit Measurement Type MasterTsuDAT Master Data Setup Time ns MASTER MasterTbuf Master Bus Free Time ns MASTER MasterFscl Master SCL Frequency Hz MASTER MasterThi Master SCL High Period ns MASTER MasterTLo Master SCL Low Period ns MASTER MasterTrCL Master SCL Rise Time ns MASTER MasterTfCL Master SCL Fall Time ns MASTER MasterTrDA Master SDA Rise Time ns MASTER MasterTfDA Master SDA Fall Time ns MASTER MasterTvdDAT Master Data Valid Time ns MASTER MasterTvdACK Master Data Valid Ack Time ns MASTER
Table 18. List of I2C Bus Measurement Parameters When performing the SYSTEM type measurements, there must be no traffic on the bus, and all masters must remain quiet. When performing the SLAVE type measurements, CAS-1000 will attempt to read data from a target slave. Therefore, the slave device must be ready to provide data, and the data must include varying rising and falling edges. For the MASTER type measurements, the target master must produce traffic on the bus continually during the measurement.
pnData Pointer to the integer data storing measured value. The value ‘-1’ indicates an error or an invalid (out of range) measurement. Call I2C_GetLastStatus function to get the detailed error message string.
lParam 32-bit unsigned long data holding an optional parameter for the SLAVE and MASTER measurement types. For the SLAVE measurement type, this value indicates the 7-bit or 10-bit address of the target slave to be measured. For 10-bit addresses, the MSB of this parameter must be 1, else 0. For the MASTER measurement type, it indicates the maximum timeout interval (in seconds) while awaiting any activities from the target master during the measurements. If it is set to ‘0’, the default timeout value of 5 seconds will be used. The value of this parameter is not used for the SIGNAL_LEVEL and SYSTEM measurement types.
Third Party Application Interface 217

I2C_PulseDiscrete Pulses one of the discrete I/O signals low for a specified period of time, if it is configured as output. If discrete 1 is selected and it is configured as tied to the output trigger SMB, that signal will be operated instead of the line to the target. This will leave the discrete high regardless of what state it started at. Prototype: extern “C” __declspec (dllexport) int _cdecl
I2C_PulseDiscrete ( int nDiscreteNumber, int nMilliseconds );
Return Value: 0 if I2C_InitHardware was never called. -1 if illegal discrete number. -2 if selected discrete is not configured as an output 1 if successful Parameters: nDiscreteNumber
The index selecting the discrete to drive, either 1 or 2. nMilliseconds
Time period in milliseconds to hold the discrete low before going back to high.
218 Third Party Application Interface
I2C_Receive_Data Launches a Receive operation as in the Debugger function, conveying data bytes from a given bus address and checking for its timely completion. This function may not return quickly (up to the timeout interval) depending on the time it takes to receive and confirm completion. Use the I2C_GetLastTransferStatus function following this call to determine if the address cycle got NAK’ed. Prototype: extern “C” __declspec(dllexport) int _cdecl
I2C_Receive_Data ( int nAddress, int b10BitAddress, unsigned char * pReceiveData, int nDataCount, int bUseStopBits);
Return Value: -1 if I2C_InitHardware was never called. -2 if a timeout occurred. otherwise the number of bytes received (may be 0 if transfer was aborted due to address NAK) Parameters: nAddress
This is the 7-bit or 10-bit address of the source slave (depending on following parameter). b10BitAddress
If 1, the above address is a 10-bit value. If 0, it is a 7-bit address. pReceiveData
A pointer to a block of memory where the receive data bytes are to be stored. nDataCount
The number of storage bytes of the above block of memory. bUseStopBits
If 1, a stop cycle terminates the message after the last data byte read, otherwise, no stop cycle is issued (the analyzer continues to control the bus with SCL low, ready to perform a coming Repeat Start on the next access).
Third Party Application Interface 219
I2C_ReloadGlitch Reloads previously loaded glitch pattern data to the CAS-1000. This function can be called in place of the I2C_LoadGlitch function if the glitch pattern file intended to be used has already been loaded by an earlier I2C_LoadGlitch function call. This function will reuse the glitch pattern data stored in the memory instead of reading it from the physical file. Depending on the bArmGlitch parameter, the trigger will be armed immediately or armed during an I2C_SendData function call. The actual injection of the glitch happens when the armed trigger condition is met. Prototype: extern “C” __declspec(dllexport) int _cdecl
I2C_ReloadGlitch ( int bArmGlitch ); Return Value: 1 if successful 0 if error occurred Call I2C_GetLastStatus function to get the result of the call in a string format, including an error message. Parameters: bArmGlitch
Integer 1 (TRUE) or 0 (FALSE) indicating whether to arm the glitch trigger immediately. The trigger can be armed during the I2C_SendData function call if this parameter is set to FALSE. This provides a flexibility of arming the glitch trigger right before the nth byte of the data being sent.
220 Third Party Application Interface
I2C_Send_Data Sends a message (ie. performs a write operation) to the specified target slave address. This function may not return quickly (up to the timeout interval) depending on the time it takes to send and confirm completion. Use the I2C_GetLastTransferStatus function following this call to determine if the address cycle got NAK’ed. NOTE: This function is available for backward compatibility only. Use the new I2C_SendData function instead if possible. Prototype: extern “C” __declspec(dllexport) int _cdecl
I2C_Send_Data( int nAddress, int b10BitAddress, unsigned char * pSendData, unsigned char * pReceiveData, int nDataCount, int bUseStopBits);
Return Value: -1 if I2C_InitHardware was never called. -2 if a timeout occurred. otherwise the number of bytes sent (may be 0 if transfer was aborted due to address NAK)
Parameters: nAddress
This is the 7-bit or 10-bit address of the destination slave (depending on following parameter). b10BitAddress
If one, the above address is a 10-bit value. If zero, it is a 7-bit address. pSendData
A pointer to a block of memory where the send data bytes are provided. pReceiveData
A pointer to a block of memory where the successfully sent data bytes are returned. This is an optional parameter which can be NULL.
nDataCount The number of bytes contained in the above block of memory.
bUseStopBits If one, a stop cycle terminates the message after the last data byte sent, otherwise, no stop cycle is issued (the analyzer continues to control the bus with SCL low, ready to perform a coming Repeat Start on the next access).
Third Party Application Interface 221

I2C_SendData Sends a message (ie. performs a write operation) to the specified target slave address. This function may not return quickly (up to the timeout interval) depending on the time it takes to send and confirm completion. Use the I2C_GetLastStatus function following this call to determine if the address cycle got NAK’ed. The optional ulParam parameter can be used to set the location of the glitch trigger arming within the data bytes being sent. Prototype: extern “C” __declspec(dllexport) int _cdecl
I2C_SendData( int nAddress, int b10BitAddress, unsigned char * pSendData, unsigned char * pReceiveData, int nDataCount, int bUseStopBit, unsigned long ulParam);
Return Value: Number of bytes successfully sent 0 if error occurred -1 if address was NAK’d -2 if a timeout occurred Call I2C_GetLastStatus function to get the result of the call in a string format, including an error message. Parameters: nAddress
This is the 7-bit or 10-bit address of the destination slave (depending on following parameter). b10BitAddress
If one, the above address is a 10-bit value. If zero, it is a 7-bit address. pSendData
A pointer to a block of memory where the send data bytes are provided. pReceiveData
A pointer to a block of memory where the successfully sent data bytes are returned. This is an optional parameter which can be NULL.
nDataCount The number of bytes contained in the above block of memory.
bUseStopBit If one, a stop cycle terminates the message after the last data byte sent, otherwise, no stop cycle is issued (the analyzer continues to control the bus with SCL low, ready to perform a coming Repeat Start on the next access).
ulParam Optional parameter specifying the location of glitch trigger arming. This parameter must be set to ‘0’ if no glitch injection is to be performed. When I2C_LoadGlitch or I2C_ReloadGlitch is called prior to this function, a non-zero value of this parameter represents the byte index of the transaction data, which the glitch trigger should be armed for. For instance, the value of ‘1’ specifies the arming of glitch injection to be occurred right before the address byte of the transaction. The value of ‘2’ specifies arming to be occurred right before the first data byte. The value ‘3’ for the second data byte, and so on. Please refer to the descriptions for I2C_LoadGlitch and I2C_ReloadGlitch functions for more details.
222 Third Party Application Interface
I2C_SendDataPEC Sends a message (ie. performs a write operation) with a SMBus Packet Error Checking (PEC) byte to the specified target slave address. The PEC is a CRC-8 error-checking byte, calculated on all the message bytes (including addresses and read/write bits). The PEC is appended to the message as the last data byte. This function behaves same as the I2C_SendData function except for the addition of PEC byte. Prototype: extern “C” __declspec(dllexport) int _cdecl
I2C_SendDataPEC( int nAddress, int b10BitAddress, unsigned char * pSendData, unsigned char * pReceiveData, int nDataCount, int bUseStopBit, unsigned long ulParam);
Return Value: Number of bytes successfully sent 0 if error occurred -1 if address was NAK’d -2 if a timeout occurred Call I2C_GetLastStatus function to get the result of the call in a string format, including an error message. Parameters: nAddress
This is the 7-bit or 10-bit address of the destination slave (depending on following parameter). b10BitAddress
If one, the above address is a 10-bit value. If zero, it is a 7-bit address. pSendData
A pointer to a block of memory where the send data bytes are provided. pReceiveData
A pointer to a block of memory where the successfully sent data bytes are returned. This is an optional parameter which can be NULL.
nDataCount The number of bytes contained in the above block of memory.
bUseStopBit If one, a stop cycle terminates the message after the last data byte sent, otherwise, no stop cycle is issued (the analyzer continues to control the bus with SCL low, ready to perform a coming Repeat Start on the next access).
ulParam Optional parameter specifying the location of glitch trigger arming. This parameter must be set to ‘0’ if no glitch injection is to be performed. When I2C_LoadGlitch or I2C_ReloadGlitch is called prior to this function, a non-zero value of this parameter represents the byte index of the transaction data, which the glitch trigger should be armed for. For instance, the value of ‘1’ specifies the arming of glitch injection to be occurred right before the address byte of the transaction. The value of ‘2’ specifies arming to be occurred right before the first data byte. The value ‘3’ for the second data byte, and so on. Please refer to the descriptions for I2C_LoadGlitch and I2C_ReloadGlitch functions for more details.
Third Party Application Interface 223
I2C_SenseDiscrete Reads the level of one of the discrete I/O signals. If discrete 2 is selected and it is configured as tied to the input trigger SMB, that signal will drive this function instead of the target signal. The configured direction of the signal has no effect here. Prototype: extern “C” __declspec(dllexport) int _cdecl
I2C_SenseDiscrete ( int nDiscreteNumber, int * nLevel );
Return Value: 0 if I2C_InitHardware was never called. -1 if illegal discrete number. 1 if successful. Parameters: nDiscreteNumber
The index selecting the discrete to drive, either 1 or 2. nLevel
If not NULL, pointer to sensed value of the output.
224 Third Party Application Interface

I2C_SetBusDriveVoltage Overwrite configuration reference voltage with provided value. Prototype: extern “C” __declspec(dllexport) char * _cdecl
I2C_SetBusDriveVoltage ( char * szVoltage ); Return Value: NULL if I2C_InitHardware was never called, otherwise a pointer to a string containing the actual resulting reference voltage (closest available to requested). Parameters: szVoltage
The string holding text of the new bus reference level as a floating-point decimal value in volts.
Third Party Application Interface 225

I2C_SetBusHighVoltageThreshold Overwrite configuration high threshold voltage with provided value. This supports the hysteresis feature of the analyzer as it monitors the bus and improves noise immunity. If a bus signal is currently considered low, it must be sensed above this voltage before being switched to high by the analyzer. Note that for slow rising busses (high parasitic capacitance, with Accelerated Rising Edge Drive off), the rise time may limit the ability of a driver to achieve a desired clock rate (since the top of the pulse may not reach the high threshold before turning around again). The threshold levels may also impact proper sensing of the bus since level crossings may occur in the nearly horizontal (and noise sensitive) final stage of signal rising. Prototype: extern “C” __declspec(dllexport) char * _cdecl
I2C_SetBusHighVoltageThreshold ( char * szVoltage ); Return Value: NULL if I2C_InitHardware was never called, otherwise a pointer to a string containing the actual resulting high threshold voltage (closest available to requested). Parameters: szVoltage
The string holding text of the new bus high threshold level as a floating-point decimal value in volts.
226 Third Party Application Interface

I2C_SetBusLowVoltageThreshold Overwrite configuration low threshold voltage with provided value. This supports the hysteresis feature of the analyzer as it monitors the bus and improves noise immunity. If a bus signal is currently considered high, it must be sensed below this voltage before being switched to low by the analyzer. Note that for slow rising busses (high parasitic capacitance, with Accelerated Rising Edge Drive off), the rise time may limit the ability of a driver to achieve a desired clock rate (since the top of the pulse may not reach the high threshold before turning around again). The threshold levels may also impact proper sensing of the bus since level crossings may occur in the nearly horizontal (and noise sensitive) final stage of signal rising. Prototype: extern “C” __declspec(dllexport) char * _cdecl
I2C_SetBusLowVoltageThreshold ( char * szVoltage ); Return Value: NULL if I2C_InitHardware was never called, otherwise a pointer to a string containing the actual resulting low threshold voltage (closest available to requested). Parameters: szVoltage
The string holding text of the new bus low threshold level as a floating-point decimal value in volts.
Third Party Application Interface 227

I2C_SetBusPullupResistance Overwrite configuration pull-up resistors with provided value (same for both bus signals). Note that high pull-up values may increase the signal rise times impacting the bus monitoring function and affecting clock rate performance. This is also affected by Accelerated Rising Edge Drive and threshold values. Prototype: extern “C” __declspec(dllexport) char * _cdecl
I2C_SetBusPullupResistance ( char * szResistance ); Return Value: NULL if I2C_InitHardware was never called, otherwise a pointer to a string containing the actual resulting resistor value (closest available to requested). Parameters: szResistance
The string holding text of the new pull-up resistor values as a floating-point decimal value in ohms.
228 Third Party Application Interface

I2C_SetBusVoltageSource Selects the bus reference voltage source as either provided by the target, or by the analyzer programmable level (the target pull-ups should be removed). Prototype: extern “C” __declspec(dllexport) int _cdecl
I2C_SetBusVoltageSource ( int nSource ); Return Value: 0 if I2C_InitHardware was never called, otherwise 1. Parameters: nSource
0 if target should drive the voltage (enter Target Supplied mode). 1 if the CAS-1000-I2C should drive the voltage (enter Analyzer Supplied mode).
Third Party Application Interface 229
I2C_SetClockRate Overwrite configuration SCL clock rate with the provided value. This is the rate at which the analyzer attempts to run when it drives the bus. Note that for slow rising busses (high parasitic capacitance, with Accelerated Rising Edge Drive off), the rise time may limit the ability of a driver to achieve a desired clock rate (since the top of the pulse may not reach the high threshold before turning around again). The threshold levels may also impact proper sensing of the bus since level crossings may occur in the nearly horizontal (and noise sensitive) final stage of signal rising. Prototype: extern “C” __declspec(dllexport) char * _cdecl
I2C_SetClockRate ( char * szClockRateKhz ); Return Value: NULL if I2C_InitHardware was never called, otherwise a pointer to a string containing the actual resulting clock rate (closest available to requested). Parameters: szClockRateKhz
The string holding text of the new SCL clock rate as a floating-point decimal value in kilohertz. The actual clock rate set will be rounded to the nearest value in the following list:
4 kHz, 5 kHz, 6 kHz, 7 kHz, 8 kHz, 9 kHz, 10 kHz, 20 kHz, 30 kHz, 40 kHz, 50 kHz, 60 kHz, 70 kHz, 80 kHz, 90 kHz, 100 kHz, 150 kHz, 200 kHz, 250 kHz, 301 kHz, 352 kHz, 397 kHz, 446 kHz, 500 kHz, 556 kHz, 595 kHz, 658 kHz, 694 kHz, 758 kHz, 806 kHz, 862 kHz, 893 kHz, 962 kHz, 1.000 MHz, 1.471 MHz, 1.923 MHz, 2.500 MHz, 3.125 MHz, 4.167 MHz, 5.000 MHz
230 Third Party Application Interface
I2C_SetDiscrete Drives the level of one of the discrete I/O signals to the state passed in, if configured as output. If discrete 1 is selected and it is configured as tied to the output trigger SMB, that path will be operated instead of the line to the target. Note, if the output is configured as open-collector, it is possible to normally read back a value different than driven out. Prototype: extern “C” __declspec(dllexport) int _cdecl
I2C_SetDiscrete ( int nDiscreteNumber, int nLevel, int * nSensedLevel );
Return Value: 0 if I2C_InitHardware was never called. -1 if illegal discrete number. -2 if illegal discrete level. -3 if selected discrete not configured as an output 1 if successful. Parameters: nDiscreteNumber
The index selecting the discrete to drive, either 1 or 2. nLevel
The binary drive level for the discrete (0 or 1). nSensedLevel If not NULL, pointer to sensed value of the output, after setting it.
Third Party Application Interface 231

I2C_SetDiscreteVoltage Overwrite configuration TTL voltage level for the high state of the discrete I/O signals. Prototype: extern “C” __declspec(dllexport) char * _cdecl
I2C_SetDiscreteVoltage ( char * szVoltage ); Return Value: NULL if I2C_InitHardware was never called, otherwise a pointer to a string containing the actual resulting voltage (closest available to requested). Parameters: szVoltage
The string holding text of the new TTL high voltage level of the discrete I/O as a floating-point decimal value in volts.
232 Third Party Application Interface
I2C_SetFEAddrFormat Defines the mode of byte representation used throughout the set of DLL commands for 7-bit addresses. That is, the 7 bits of the protocol address is always given in a byte, but these bits can be placed in the byte either left justified where the LSB is zero (FE mode), or right justified where the MSB is zero (7F mode). Suppose the protocol slave address is binary 0110101; it can be represented in a byte as hex 6A (left justified = FE mode) or 35 (right justified = 7F mode). Prototype: extern “C” __declspec(dllexport) int _cdecl
I2C_SetFEAddrFormat ( int bEnable ); Return Value: 0 if I2C_InitHardware was never called, otherwise 1. Parameters: bEnable
1 for FE mode. 0 for 7F mode.
Third Party Application Interface 233
I2C_SetMonitorCallback Sets application-defined callback function for processing transaction data. This callback function is called whenever CAS-1000-I2C detects any new transactions on the target I2C bus. The callback function should perform minimal necessary work and return immediately to avoid overflowing of CAS-1000-I2C buffer. When this API function is called the current timestamp value is also reset to zero. Prototype: extern “C” __declspec(dllexport) unsigned int _cdecl
I2C_SetMonitorCallback (TXDATAHANDLERPROC TxDataHnadlerProc, void* pWnd );
Return Value: 1 if successful 0 if failed
Parameters: nTxDataHnadlerProc
Pointer to application defined callback function. The definition of callback function is: typedef UINT (CALLBACK* TXDATAHANDLERPROC)(ULONG, ULONGLONG, LPARAM); The first parameter, ULONG, is the encoded transaction data (See below for the details). The second parameter, ULONGLONG, is the transaction timestamp in nanoseconds. The third parameter, LPARAM, is the pointer to application supplied data.
pWnd Pointer to application-supplied data. This pointer is passed to the callback function along with the transaction data and timestamp information.
Transaction Data Format
Address Transaction Type: TxType[3:0] = 0x1
TxType[3]
TxType[2]
TxType[1]
TxType[0]
Write Tx
10-bit Addr
I/O 2
I/O 1
NAK
Addr[9]
Addr[8]
Addr[7]
Addr[6]
Addr[5]
Addr[4]
Addr[3]
Addr[2]
Addr[1]
Addr[0]
31
30
29
28
27
26
25
24
23
22
21
20
19
18
17
16
15
14
13
12
11
10 9 8 7 6 5 4 3 2 1 0
Data Transaction Type: TxType[3:0] = 0x2
234 Third Party Application Interface

TxType[3]
TxType[2]
TxType[1]
TxType[0]
I/O 2
I/O 1
NAK
Data[7]
Data[6]
Data[5]
Data[4]
Data[3]
Data[2]
Data[1]
Data[0]
31
30
29
28
27
26
25
24
23
22
21
20
19
18
17
16
15
14
13
12
11
10 9 8 7 6 5 4 3 2 1 0
Error Transaction Type: TxType[3:0] = 0x3
TxType[3]
TxType[2]
TxType[1]
TxType[0]
ErrCode[3]
ErrCode[2]
ErrCode[1]
ErrCode[0]
I/O 2
I/O 1
31
30
29
28
27
26
25
24
23
22
21
20
19
18
17
16
15
14
13
12
11
10 9 8 7 6 5 4 3 2 1 0
Summary of Error Codes:
00H: no error
01H: ADDR_ERR - Protocol violation found during address transaction
02H: START_ERR - START hold time violation (i.e. less than minimum hold time)
03H: DATA_ERR - Protocol violation found during data transaction
04H: reserved
05H: reserved
06H: reserved
07H: SCL_HUNG_ERR - SMBus timeout (SCL held low for more than 25 msec) when enabled
08H-FFH: reserved
Third Party Application Interface 235

I2C_SetRisingEdgeDriveMode
Overwrite configuration rising edge drive setting with provided selection. When enabled and driving the bus, the analyzer will assert hard drivers on the bus momentarily, during signal rising edges. This should overcome parasitic capacitance on the bus resulting in fast rise-times. Prototype: extern “C” __declspec(dllexport) int _cdecl
I2C_SetRisingEdgeDriveMode ( int nMode ); Return Value: 0 if I2C_InitHardware was never called, otherwise 1. Parameters: nMode
0 is off. 1 is on.
236 Third Party Application Interface
I2C_SetTimingSkew Sets new timing skew parameters for the analyzer. Following execution of this function, the timing relationship between SCL and SDA during analyzer driven communications will be adjusted according to the provided settings.
Prototype: extern “C” __declspec(dllexport) int _cdecl
I2C_SetTimingSkew ( int nMode, int nTime );
Return Value: 1 if successful 0 if error occurred. Call I2C_GetLastStatus function to get the result of the call in a string format, including an error message. Parameters: nMode
An integer value representing the new mode. Must be 0 (normal), 1 (setup_time), or 2 (hold_time).
nTime An integer value representing the new amount for setup or hold time. The value is in nanoseconds and will be rounded to the nearest 20 ns. The valid range is up to one eighth of the current SCL period on the positive side and a little less (80 ns) on the negative side. For example, for a 100 KHz SCL rate, the valid range is from -1160 ns to 1240 ns.
Third Party Application Interface 237

I2C_ShutdownHardware Forces an orderly shutdown of the CAS-1000-I2C analyzer and its USB disconnection. This function must be invoked prior to any new I2C_InitHardware call, for trouble-free operation. Otherwise, the analyzer must be unplugged and re-plugged into the PC before being initialized again. This function may not return immediately, until the disconnection is complete. Prototype: extern “C” __declspec(dllexport) void _cdecl
I2C_ShutdownHardware ( void ); Return Value: None. Parameters: None.
238 Third Party Application Interface

I2C_SlaveGetStatus Returns the current status of the slave specified. Prototype: extern “C” __declspec(dllexport) int _cdecl
I2C_SlaveGetStatus ( int nID, int* pnAddr, int* pnStatus, int* pnLoops);
Return Value: 1 if successful 0 if error occurred Call I2C_GetLastStatus function to get the result of the call in a string format, including an error message. Parameters: nID
ID number of the slave device to get the status for. Valid numbers are from 1 to 10. pnAddr
Pointer to a buffer to hold the current address of the slave device. pnStatus
Pointer to a buffer to hold the current status of the slave device. The meaning of the status number is following: 2: Running Otherwise: Not running.
4: Completed. Specified data stream is all consumed. 5: Aborted. Emulation was terminated by the program.
pnLoops Pointer to a buffer to hold the number of loops for the slave device.
Third Party Application Interface 239
I2C_SlaveStart Starts a slave emulation with specified parameters. This function takes a pointer to a data buffer in the memory and feeds the data to the slave device. You may not specify duplicate ID or address with any slaves currently running. Prototype: extern “C” __declspec(dllexport) int _cdecl
I2C_SlaveStart ( int nID, int nAddr, int nLoops, int nByteCount, unsigned char* pucData);
Return Value: 1 if successful 0 if error occurred Call I2C_GetLastStatus function to get the result of the call in a string format, including an error message. Parameters: nID
ID number of the slave to activate. Valid numbers are from 1 to 10. Error will occur if a slave with an identical ID number is already running.
nAddr Address of the slave device to be emulated. Only 7-bit address is valid, and the default format is in FE mode. You may use I2C_SetFEAddrFormat function to change the format. Error will occur if a slave with an identical address is already running.
nLoops Number of times to loop through the specified data set. You may set it to -1 to specify infinite number of loops.
nDataCount Number of data bytes in the data set.
pucData Pointer to a block of memory where the data bytes are provided.
240 Third Party Application Interface
I2C_SlaveStartSDF Starts a slave emulation with specified parameters. This function takes a Slave Data File (SDF) as the source of input data and feeds it to the slave device. You may not specify duplicate ID or address with any slaves currently running. Prototype: extern “C” __declspec(dllexport) int _cdecl
I2C_SlaveStartSDF ( int nID, int nAddr, int nLoops, char* szFilename);
Return Value: 1 if successful 0 if error occurred Call I2C_GetLastStatus function to get the result of the call in a string format, including an error message. Parameters: nID
ID number of the slave to activate. Valid numbers are from 1 to 10. Error will occur if a slave with an identical ID number is already running.
nAddr Address of the slave device to be emulated. Only 7-bit address is valid, and the default format is in FE mode. You may use I2C_SetFEAddrFormat function to change the format. Error will occur if a slave with an identical address is already running.
nLoops Number of times to loop through the specified data set. You may set it to -1 to specify infinite number of loops.
szFilename Full file path of the SDF file to load.
Third Party Application Interface 241

I2C_SlaveStop Terminates the slave emulations specified by the ID number. Use this function to ensure the slave device is stopped before starting a new emulation session. Prototype: extern “C” __declspec(dllexport) int _cdecl
I2C_SlaveStop ( int nID ); Return Value: 1 if successful 0 if error occurred Call I2C_GetLastStatus function to get the result of the call in a string format, including an error message. Parameters: nID
ID number of the slave emulation to terminate. Valid numbers are from 1 to 10.
242 Third Party Application Interface
I2C_SlaveStopAll Terminates all slave emulations currently running. Use this function to ensure all slave emulations are stopped before starting a new test session. Prototype: extern “C” __declspec(dllexport) int _cdecl
I2C_SlaveStopAll ( void ); Return Value: 1 if successful 0 if error occurred Call I2C_GetLastStatus function to get the result of the call in a string format, including an error message. Parameters: None.
Third Party Application Interface 243


Chapter 10 I2C Device Emulator
Emulator window overview and component descriptions
The Emulator tool enables exercising the I2C bus by programmed interaction. In this mode the CAS-1000-I2C unit can be set to emulate either bus master or bus slave devices. Once set in emulation mode, the CAS-1000-I2C autonomously communicates as a virtual I2C bus master and/or provides pre-programmed responses to external I2C bus master accesses, thereby emulating several virtual bus slave devices. The Emulation tool is useful for a range of applications where additional traffic is needed to check the overall I2C bus performance in a system. This includes:
• Enabling users to develop software for a master or slave device while this device is still under development and is not ready to be deployed in the system
• Validating software behavior under special and/or extreme conditions • Checking system compliance with future expansions • Checking system performance with varying I2C bus traffic volume • Modeling device behavior before the silicon is actually developed
The Emulation tool supports the following features and capabilities:
• Emulating up to 1 bus master and up to 10 bus slave devices • Thoroughly exercising external I2C bus over its entire range • Validating behavior of all target slave devices • Fully initializing target slave devices • Extracting target slave device contents • Enabling target master interaction with non-existent slaves • Mimicking a suite of resources environment as seen by the external I2C bus • Simulating and testing of nonexistent I2C bus devices
The single emulated master device operates according to commands in a script text file which progresses its bus interactions. This supports essentially unlimited read and write bus cycles to/from slave devices. When emulating a bus master, the CAS-1000-I2C communicates with and responds to slave read information as dictated by the script file. Programmed conditional branching and schedule control enables a comprehensive bus and target exercising sequence, ranging from simple target initialization to complex behavioral stimulation, stressing and evaluation. Up to 10 independent I2C bus slave devices can be emulated concurrently. Each slave device is assigned its own address and operates according to information in its own data file. These provide real-time behavior to accesses by the external bus master(s). Besides ACK/NAK responses, reads of each device respond with its sequential data values, as extracted from the data file. Device writes are stored, along with the other traffic, in the Monitor trace supporting full bidirectional data flow with the target. Intentional error injection capability enables testing under marginal and/or extreme conditions. In addition to normal writes and reads of the bus, the emulated master can employ a number of protocol and timing corruptions (error injection) to stress target devices and illuminate appropriate responses. The controlling script files for the above virtual master devices employ a simplified C-like syntax. The built-in Editor tool facilitates their construction including syntax assistance. Since they are pure text files, the user may opt to edit these off-line.
I2C Device Emulator 245

The Emulation tool enables configuring, launching, stopping, looping, and stepping these virtual devices. This includes assigning names, slave addresses, among other features, and attaching the appropriate controlling script or data file.
246 I2C Device Emulator
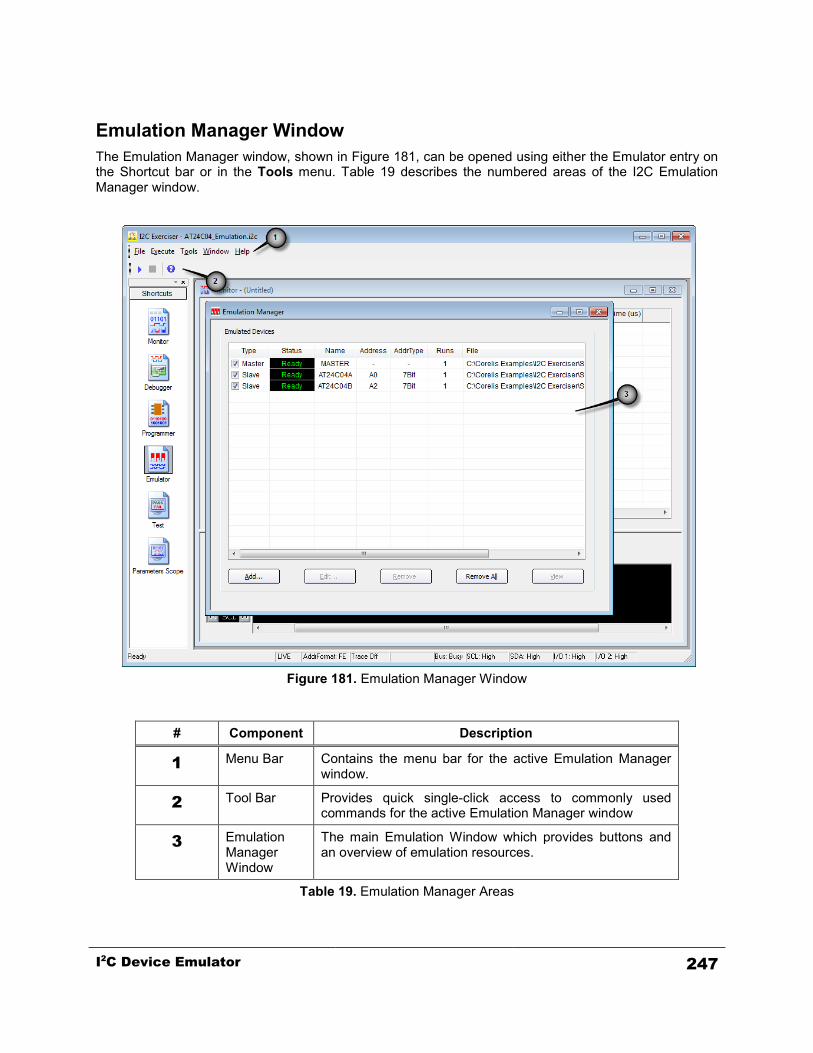
Emulation Manager Window The Emulation Manager window, shown in Figure 181, can be opened using either the Emulator entry on the Shortcut bar or in the Tools menu. Table 19 describes the numbered areas of the I2C Emulation Manager window.
Figure 181. Emulation Manager Window
# Component Description
1 Menu Bar Contains the menu bar for the active Emulation Manager window.
2 Tool Bar Provides quick single-click access to commonly used commands for the active Emulation Manager window
3 Emulation Manager Window
The main Emulation Window which provides buttons and an overview of emulation resources.
Table 19. Emulation Manager Areas
I2C Device Emulator 247
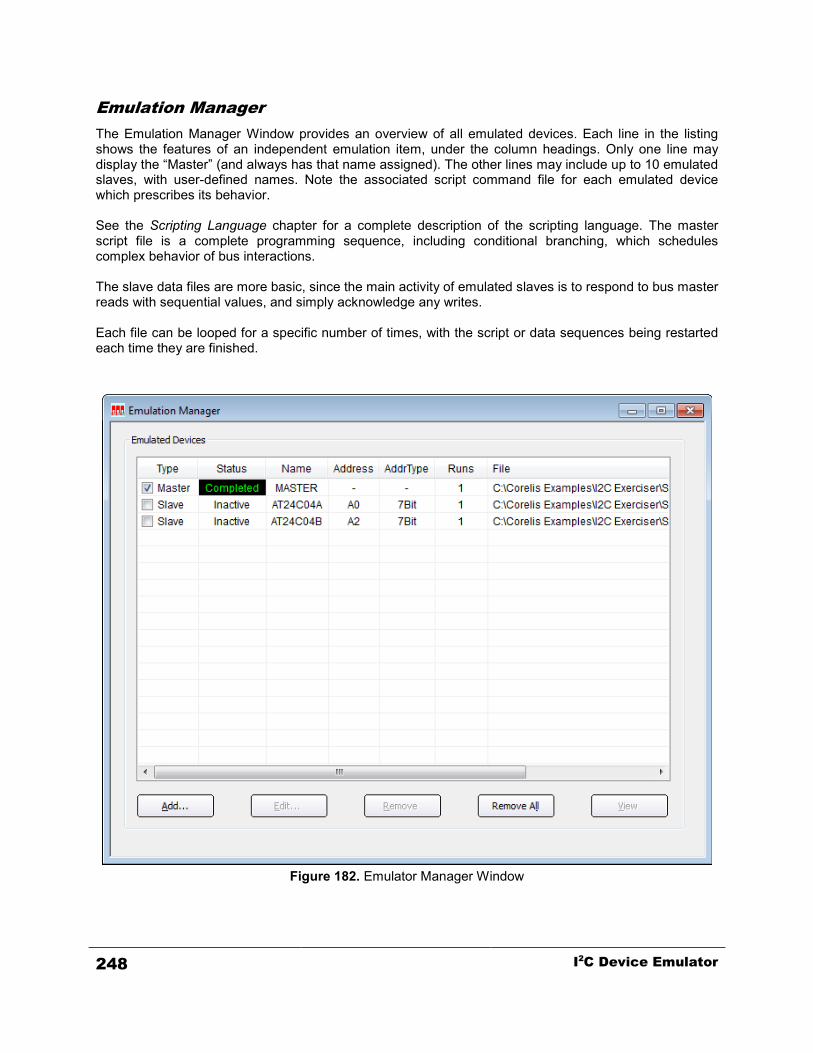
Emulation Manager The Emulation Manager Window provides an overview of all emulated devices. Each line in the listing shows the features of an independent emulation item, under the column headings. Only one line may display the “Master” (and always has that name assigned). The other lines may include up to 10 emulated slaves, with user-defined names. Note the associated script command file for each emulated device which prescribes its behavior. See the Scripting Language chapter for a complete description of the scripting language. The master script file is a complete programming sequence, including conditional branching, which schedules complex behavior of bus interactions. The slave data files are more basic, since the main activity of emulated slaves is to respond to bus master reads with sequential values, and simply acknowledge any writes. Each file can be looped for a specific number of times, with the script or data sequences being restarted each time they are finished.
Figure 182. Emulator Manager Window
248 I2C Device Emulator

The Emulation Manager window provides a list of emulated devices and the script or data files associated with them. Each emulated device contains the following column headings:
Type – Specifies whether the device is a master or slave. Only one master device may be active at any given time. A check box in front of this text specifies whether the device is currently active. Active devices are executed when the Run toolbar button is clicked. The user can activate or deactivate a device by selecting or deselecting the checkbox. Status – Specifies the current execution status of the device. The status can be one of the following:
Ready – indicates that emulation of the device has not been executed. Running – indicates that emulation of the device is currently being executed. Paused – indicates that emulation of the device is currently stopped at a particular line shown in the Emulated Master window. Completed – indicates that emulation of the device has successfully finished execution. Aborted – indicates that the user has stopped emulation of the device before it had completed executing. Inactive – indicates that the device is disabled and will be excluded from execution.
Name – Specifies the name of the device. The master device is named “MASTER.” Address – The address of the device, displayed in the current address mode (FE or EF). The master device does not have an address associated with it. AddrType – Specifies whether the device address is a 10-bit address or a 7-bit address. Runs – Specifies the number of times to iterate the script or data sequence associated with this device. File – The location of the script or data file associated with this device. Double-clicking on an entry in this column will open the Emulated Master or Emulated Slave dialog.
In addition, the Emulation Manager provides five buttons to allow the user to manipulate the list of emulated devices when the Emulator is not running:
Add – Associates a new script file with an emulated device. Edit – Modifies the settings of the selected emulated device. Remove – Removes the selected emulated device from the Emulated Devices list. Remove All – Removes all devices displayed in the Emulated Devices list. View – Opens the Emulated Master or Emulated Slave window for the selected emulated device and displays the script file source code or data listing. The Emulated Master window allows editing of the script, setting of breakpoints, running, pausing, and single-stepping through the device’s script. The Emulated Slave window allows editing of the sequential data to be provided by the slave device. Both the Emulated Master and Emulated Slave windows are described later in this chapter.
I2C Device Emulator 249
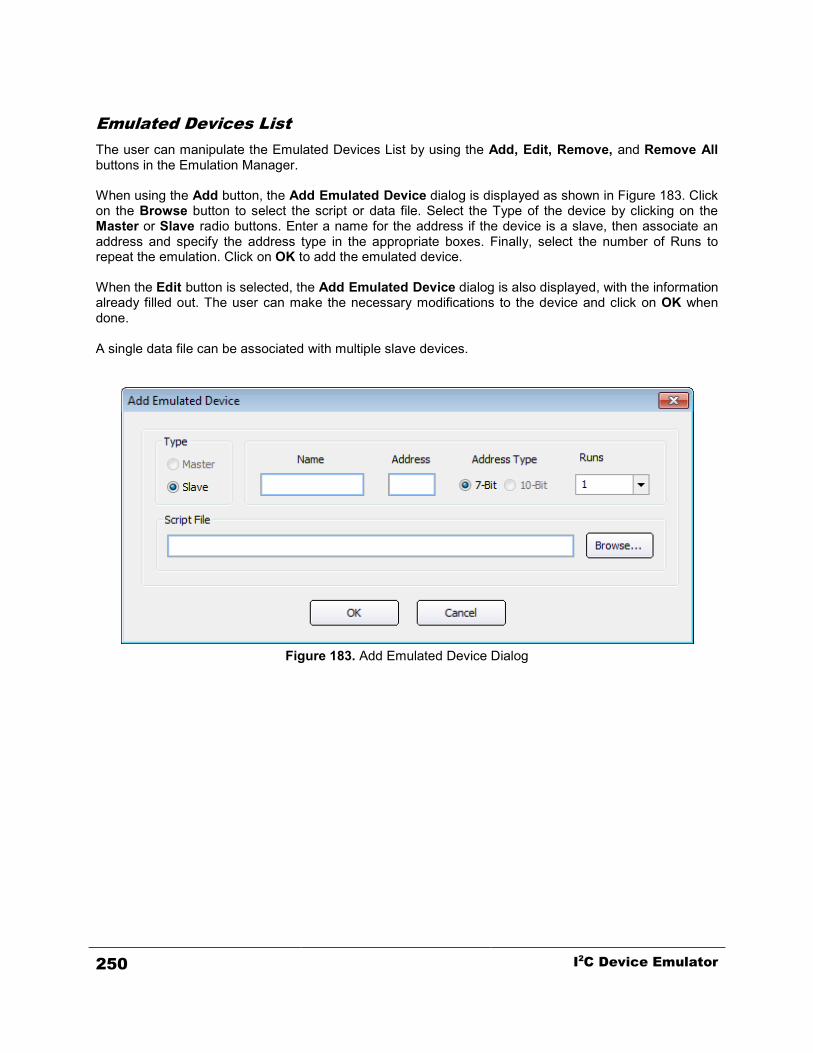
Emulated Devices List The user can manipulate the Emulated Devices List by using the Add, Edit, Remove, and Remove All buttons in the Emulation Manager. When using the Add button, the Add Emulated Device dialog is displayed as shown in Figure 183. Click on the Browse button to select the script or data file. Select the Type of the device by clicking on the Master or Slave radio buttons. Enter a name for the address if the device is a slave, then associate an address and specify the address type in the appropriate boxes. Finally, select the number of Runs to repeat the emulation. Click on OK to add the emulated device. When the Edit button is selected, the Add Emulated Device dialog is also displayed, with the information already filled out. The user can make the necessary modifications to the device and click on OK when done. A single data file can be associated with multiple slave devices.
Figure 183. Add Emulated Device Dialog
250 I2C Device Emulator

Emulator Menu Bar When the Emulation Manager window is active, the Menu Bar contains entries relevant to the Emulator functions including File, Tools, Windows and Help. A description of each menu follows. Emulator File Menu The File menu includes options to load and save projects. These project-related entries are identical to those described in the Monitor File Menu section of the Bus Traffic Monitor chapter. Emulator Execute Menu The Execute menu shown in Figure 184 contains commands pertaining to running and stopping all active emulated devices.
Figure 184. Emulator Execute Menu
Run – Executes all active devices. Stop – Aborts execution of all active devices. Emulator Tools Menu The Tools menu provides a path to the major application function windows. This is identical to the Monitor Tools Menu described in the Bus Traffic Monitor chapter. Emulator Window Menu The Window menu manages the various windows of I2C Exerciser and is identical to the Monitor Window Menu described in the Bus Traffic Monitor chapter. Emulator Help Menu The Help menu accesses the on-line help features and is identical to the Monitor Help Menu described in the Bus Traffic Monitor chapter.
Emulator Tool Bar The Emulator Tool Bar shown in Figure 185 provides quick single-click access to commonly used commands in the Emulator window. Simply click the tool bar button to perform the desired command. Table 20 describes the tool bar functions. Positioning the mouse cursor over each tool bar button will also display a pop-up “tooltip” providing a short description of the command.
I2C Device Emulator 251
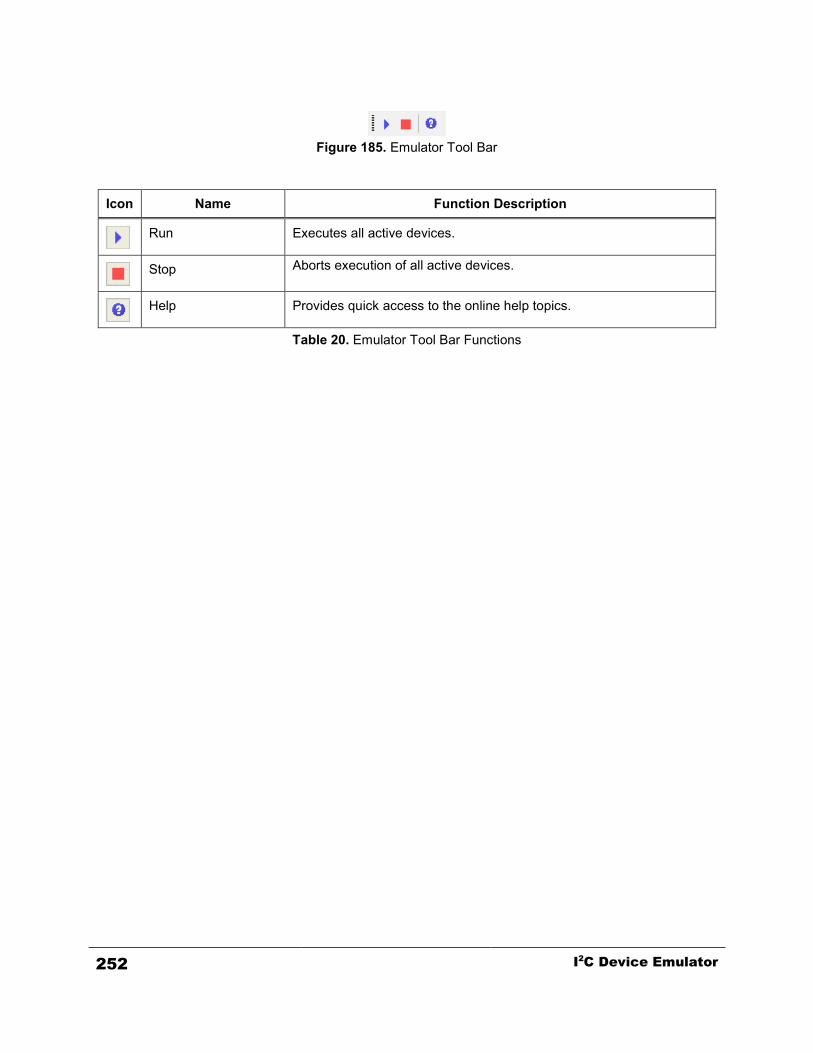
Figure 185. Emulator Tool Bar
Icon Name Function Description
Run Executes all active devices.
Stop Aborts execution of all active devices.
Help Provides quick access to the online help topics.
Table 20. Emulator Tool Bar Functions
252 I2C Device Emulator
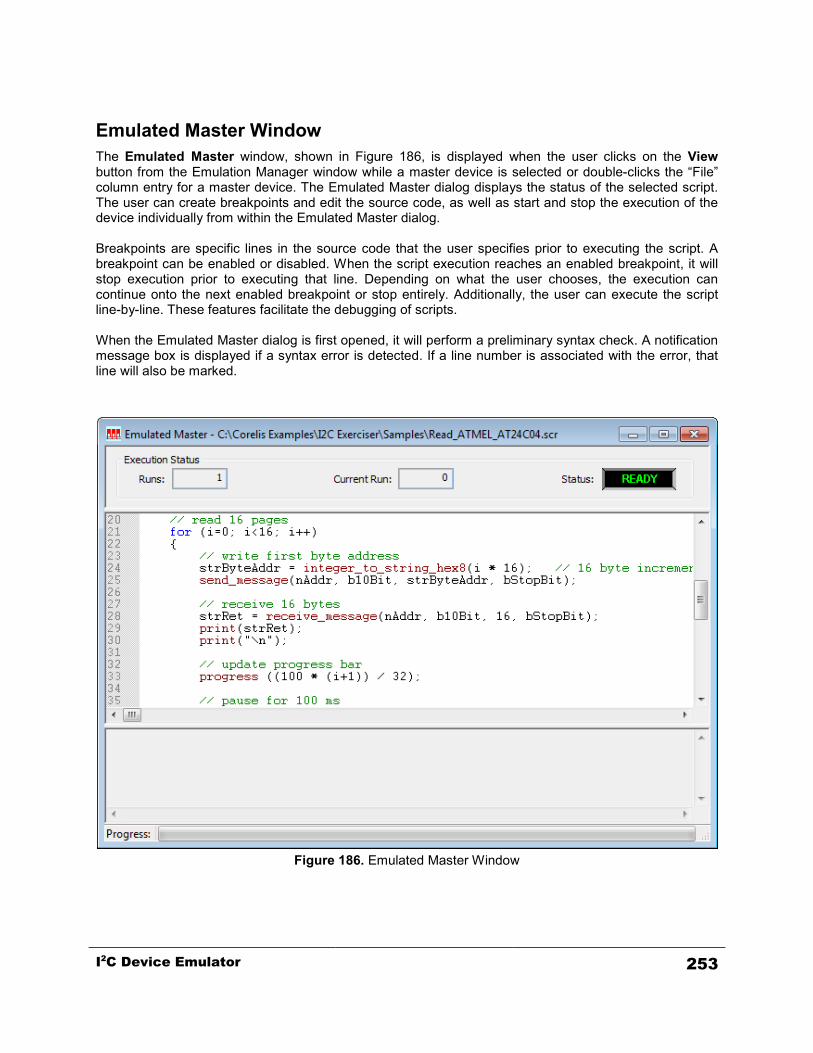
Emulated Master Window The Emulated Master window, shown in Figure 186, is displayed when the user clicks on the View button from the Emulation Manager window while a master device is selected or double-clicks the “File” column entry for a master device. The Emulated Master dialog displays the status of the selected script. The user can create breakpoints and edit the source code, as well as start and stop the execution of the device individually from within the Emulated Master dialog. Breakpoints are specific lines in the source code that the user specifies prior to executing the script. A breakpoint can be enabled or disabled. When the script execution reaches an enabled breakpoint, it will stop execution prior to executing that line. Depending on what the user chooses, the execution can continue onto the next enabled breakpoint or stop entirely. Additionally, the user can execute the script line-by-line. These features facilitate the debugging of scripts. When the Emulated Master dialog is first opened, it will perform a preliminary syntax check. A notification message box is displayed if a syntax error is detected. If a line number is associated with the error, that line will also be marked.
Figure 186. Emulated Master Window
I2C Device Emulator 253

Runs – Indicates the number of times that the script is set to run. If the script is to be repeated indefinitely, the text box will display, “Forever.” Current Run – Indicates the count of the current iteration. This value is incremented at the beginning of each script iteration. Status – Indicates the current execution status of the script by displaying one of the following:
Indicates that the script is loaded and ready to execute.
Indicates that the script is executing.
Indicates that script execution has been paused.
Indicates that the script has successfully finished execution. At this point it is ready to execute again.
Indicates that script execution has been user-terminated before completion.
Script Source – Displays the content of the script file associated with the emulated master. The script can be scrolled through and edited when it is not being executed. Syntax highlighting is applied to the script text so that keywords are colored blue, comments are colored green, and names of built-in functions are colored maroon. If any changes are made to the script, the script file must be saved before it can be executed. Right-clicking in the script source will display the Emulated Master Source Popup Menu, enabling manipulation of breakpoints and bookmarks as well as editing and execution operations. The Emulated Master Source Popup Menu is described in the next section. Left-hand Gutter – Displays line numbers and special line indicators such as breakpoint information for the script. The following icons can appear:
Indicates an enabled breakpoint.
Indicates a disabled breakpoint.
Indicates a bookmark.
Indicates the next execution line. This can be seen when execution is paused, such as during single-step execution.
Indicates a line near a syntax error. Often the syntax error can be located on the line immediately above this indicator.
Output – Displays text output from an executing script. This output is updated through the use of a built-in “print” function provided by the scripting language. Progress Bar – Displays the progress of an executing script. This progress bar is updated through the use of a built-in “progress” function provided by the scripting language.
254 I2C Device Emulator
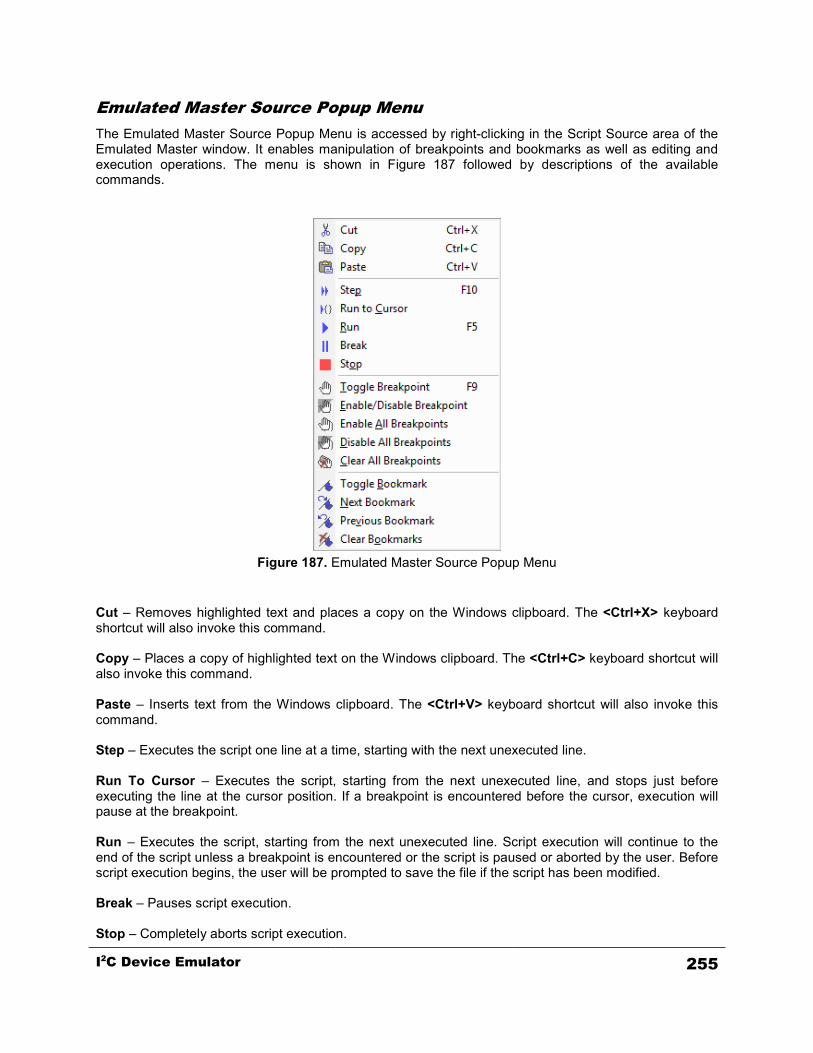
Emulated Master Source Popup Menu The Emulated Master Source Popup Menu is accessed by right-clicking in the Script Source area of the Emulated Master window. It enables manipulation of breakpoints and bookmarks as well as editing and execution operations. The menu is shown in Figure 187 followed by descriptions of the available commands.
Figure 187. Emulated Master Source Popup Menu
Cut – Removes highlighted text and places a copy on the Windows clipboard. The <Ctrl+X> keyboard shortcut will also invoke this command. Copy – Places a copy of highlighted text on the Windows clipboard. The <Ctrl+C> keyboard shortcut will also invoke this command. Paste – Inserts text from the Windows clipboard. The <Ctrl+V> keyboard shortcut will also invoke this command. Step – Executes the script one line at a time, starting with the next unexecuted line. Run To Cursor – Executes the script, starting from the next unexecuted line, and stops just before executing the line at the cursor position. If a breakpoint is encountered before the cursor, execution will pause at the breakpoint. Run – Executes the script, starting from the next unexecuted line. Script execution will continue to the end of the script unless a breakpoint is encountered or the script is paused or aborted by the user. Before script execution begins, the user will be prompted to save the file if the script has been modified. Break – Pauses script execution. Stop – Completely aborts script execution.
I2C Device Emulator 255

Toggle Breakpoint – Adds a breakpoint at a line or removes a breakpoint if one is already set. If the line is blank or contains only comments, the breakpoint will be applied to the next line of code. The <F9> keyboard shortcut will also invoke this command. Enable/Disable Breakpoint – If a breakpoint is already set, this command enables or disables the breakpoint. Enable all Breakpoints – Sets the status of all breakpoints to “Enabled.” Disable all Breakpoints – Sets the status of all breakpoints to “Disabled.” Clear all Breakpoints – Removes all breakpoints from the script. Toggle Bookmark – Adds a bookmark at a line or removes a bookmark if one is already set. Next Bookmark – Moves the cursor to the next bookmarked line below the current cursor position. If there are no bookmarked lines below the cursor, the cursor will be moved to the first bookmarked line from the beginning of the script. Previous Bookmark – Moves the cursor to the previous bookmarked line above the current cursor position. If there are no bookmarked lines above the cursor, the cursor will be moved to the last bookmarked line from the end of the script. Clear Bookmarks – Removes all bookmarks from the script.
256 I2C Device Emulator

Emulated Master Menu Bar When the Emulated Master window is active, the Menu Bar contains entries relevant to the Emulated Master functions including File, Edit, Execute, Breakpoint, Tools, Window, and Help. A description of each menu follows. Emulated Master File Menu In addition to facilitating the loading and saving of projects, the Emulated Master File menu shown in Figure 188 also enables the user to load and save script files. Opening a new master script file will automatically associate it with the current Emulated Master device. Similarly, the current script file can be saved under a different file name, which will also automatically associate the device with this new file. Because the master script file is a plain text file, the program does not save the breakpoint locations when saving the script. The options related to the loading and saving of projects are identical to those described in the Monitor Menu Bar section of the Bus Traffic Monitor chapter.
Figure 188. Emulated Master File Menu
Open Script File… – Loads the content from another file into the Script Source text area. All breakpoints and bookmarks are cleared. If the current script has been modified, a prompt will be displayed to save it. The newly opened file will be automatically associated with the current Emulated Master device. Save Script File – Saves the currently open script to a .SCR text file. Note that this does not save any set breakpoints or bookmarks. Save Script File As – Same as Save Script File above, except that it always prompts for a new filename before saving. The new script file name will be automatically associated with the current Emulated Master device. Print Preview – Previews the current script before printing it. Print – Prints the current script. Recent Files … – Provides a list of recently used project files for quick access. Exit – Terminates the I2C Exerciser application.
I2C Device Emulator 257

Emulated Master Edit Menu The Edit menu shown in Figure 189 provides commands that apply to the editing of the current script.
Figure 189. Emulated Master Edit Menu
Undo – Reverts a previously completed editing operation. Redo – Restores a previously undone editing operation. Cut – Removes highlighted text and places a copy on the Windows clipboard. Copy – Places a copy of highlighted text on the Windows clipboard. Paste – Inserts text from the Windows clipboard. Toggle Bookmark – Adds a bookmark at the line where the cursor is located or removes a bookmark if one is already set. Next Bookmark – Moves the cursor to the next bookmarked line below the current cursor position. If there are no bookmarked lines below the cursor, the cursor will be moved to the first bookmarked line from the beginning of the script. Previous Bookmark – Moves the cursor to the previous bookmarked line above the current cursor position. If there are no bookmarked lines above the cursor, the cursor will be moved to the last bookmarked line from the end of the script. Clear Bookmarks – Removes all bookmarks from the script. Find… – Opens a standard text search dialog where the text of interest is entered. The current script is searched for the specified text and, if found, that text is brought into view and highlighted. Replace… – Opens a standard text replace dialog where the search text of interest is entered along with the replacement text. The current script is searched and any occurrences of the search text are substituted with the replacement text.
258 I2C Device Emulator

Syntax Check – Checks the syntax of the current script without executing it. The result of the syntax check is displayed in a popup message box. If a syntax error is found, any line associated with the error will also be marked in the left-hand gutter. Note that some errors cannot be detected before execution, such as function calls with an invalid number of arguments or unexpected argument types. Emulated Master Execute Menu The Execute menu shown in Figure 190 contains commands pertaining to running and stepping through the current script.
Figure 190. Emulated Master Execute Menu
Step – Executes the script one line at a time, starting with the next unexecuted line. Run Until Cursor – Executes the script, starting from the next unexecuted line, and stops just before executing the line at the cursor position. If a breakpoint is encountered before the cursor, execution will pause at the breakpoint. Run – Executes the script, starting from the next unexecuted line. Script execution will continue to the end of the script unless a breakpoint is encountered or the script is paused or aborted by the user. Before script execution begins, the user will be prompted to save the file if the script has been modified. Break – Pauses script execution. Stop – Completely aborts script execution.
I2C Device Emulator 259

Emulated Master Breakpoint Menu The Breakpoint menu shown in Figure 191 contains commands for the manipulation of breakpoints in the current script.
Figure 191. Emulated Master Breakpoint Menu
Toggle Breakpoint – Adds a breakpoint to the line at the current cursor location or removes a breakpoint if one is already set. If the line is blank or contains only comments, the breakpoint will be applied to the next line of code. Enable/Disable Breakpoint – If a breakpoint is already set for the line at the current cursor location, this command enables or disables the breakpoint. Enable All – Sets the status of all breakpoints to “Enabled.” Disable All – Sets the status of all breakpoints to “Disabled.” Clear All – Removes all breakpoints from the script. Emulated Master Tools Menu The Tools menu provides a path to the major application function windows. This is identical to the Monitor Tools Menu selections in the Bus Traffic Monitor chapter. Emulated Master Window Menu The Window menu manages the various windows of I2C Exerciser and is identical to the Monitor Window Menu shown in the Bus Traffic Monitor chapter. Emulated Master Help Menu The Help menu accesses the on-line help features and is identical to the Monitor Help Menu shown in the Bus Traffic Monitor chapter.
260 I2C Device Emulator

Emulated Master Tool Bar The Emulated Master Tool Bar provides quick single-click access to commonly used commands in the Emulated Master window. Simply click the tool bar button to perform the specific command. The tool bar buttons are shown in Figure 192 and described in Table 21.
Figure 192. Emulated Master Tool Bar
Icon Name Function Description
Open Script Loads the content from another file into the Script Source text
area. All breakpoints and bookmarks are cleared. If the current script has been modified, a prompt will be displayed to save it. The newly opened file will be automatically associated with the current Emulated Master device.
Save Script Saves the currently open script to a .SCR text file. Note that this
does not save any set breakpoints or bookmarks.
Step Executes the script one line at a time, starting with the next
unexecuted line.
Run To Cursor Executes the script, starting from the next unexecuted line, and
stops just before executing the line at the cursor position. If a breakpoint is encountered before the cursor, execution will pause at the breakpoint.
Run Executes the script, starting from the next unexecuted line.
Script execution will continue to the end of the script unless a breakpoint is encountered or the script is paused or aborted by the user. Before script execution begins, the user will be prompted to save the file if the script has been modified.
Break Pauses script execution.
Stop Completely aborts script execution.
Toggle Breakpoint Adds a breakpoint at a line or removes a breakpoint if one is
already set. If the line is blank or contains only comments, the breakpoint will be applied to the next line of code.
Enable/Disable Breakpoint
If a breakpoint is already set, this command enables or disables the breakpoint.
Enable All Breakpoints
Sets the status of all breakpoints to “Enabled.”
Disable All Breakpoints
Sets the status of all breakpoints to “Disabled.”
Clear All Breakpoints
Removes all breakpoints from the script.
I2C Device Emulator 261

Icon Name Function Description
Undo Reverts a previously completed editing operation.
Redo Restores a previously undone editing operation.
Cut Removes highlighted text and places a copy on the Windows
clipboard.
Copy Places a copy of highlighted text on the Windows clipboard.
Paste Inserts text from the Windows clipboard.
Toggle Bookmark Adds a bookmark at a line or removes a bookmark if one is
already set.
Next Bookmark Moves the cursor to the next bookmarked line below the current
cursor position. If there are no bookmarked lines below the cursor, the cursor will be moved to the first bookmarked line from the beginning of the script.
Previous Bookmark Moves the cursor to the previous bookmarked line above the
current cursor position. If there are no bookmarked lines above the cursor, the cursor will be moved to the last bookmarked line from the end of the script.
Clear Bookmarks Removes all bookmarks from the script.
Find Opens a standard text search dialog where the text of interest is
entered. The current script is searched for the specified text and, if found, that text is brought into view and highlighted.
Replace Opens a standard text replace dialog where the search text of
interest is entered along with the replacement text. The current script is searched and any occurrences of the search text are substituted with the replacement text.
Syntax Check Checks the syntax of the current script without executing it. The
result of the syntax check is displayed in a popup message box. If a syntax error is found, any line associated with the error will also be marked in the left-hand gutter. Note that some errors cannot be detected before execution, such as function calls with an invalid number of arguments or unexpected argument types.
Print Prints the current script file.
Help Provides quick access to the online help topics.
Table 21. Emulated Master Tool Bar Functions
262 I2C Device Emulator
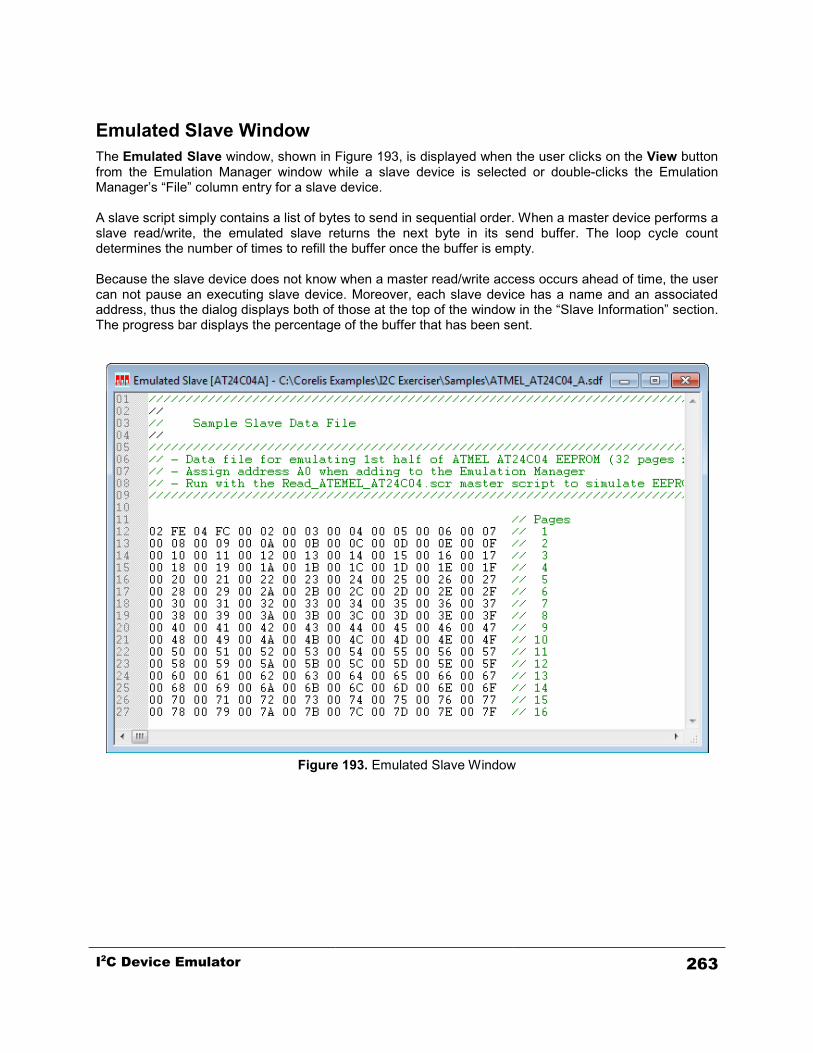
Emulated Slave Window The Emulated Slave window, shown in Figure 193, is displayed when the user clicks on the View button from the Emulation Manager window while a slave device is selected or double-clicks the Emulation Manager’s “File” column entry for a slave device. A slave script simply contains a list of bytes to send in sequential order. When a master device performs a slave read/write, the emulated slave returns the next byte in its send buffer. The loop cycle count determines the number of times to refill the buffer once the buffer is empty. Because the slave device does not know when a master read/write access occurs ahead of time, the user can not pause an executing slave device. Moreover, each slave device has a name and an associated address, thus the dialog displays both of those at the top of the window in the “Slave Information” section. The progress bar displays the percentage of the buffer that has been sent.
Figure 193. Emulated Slave Window
I2C Device Emulator 263
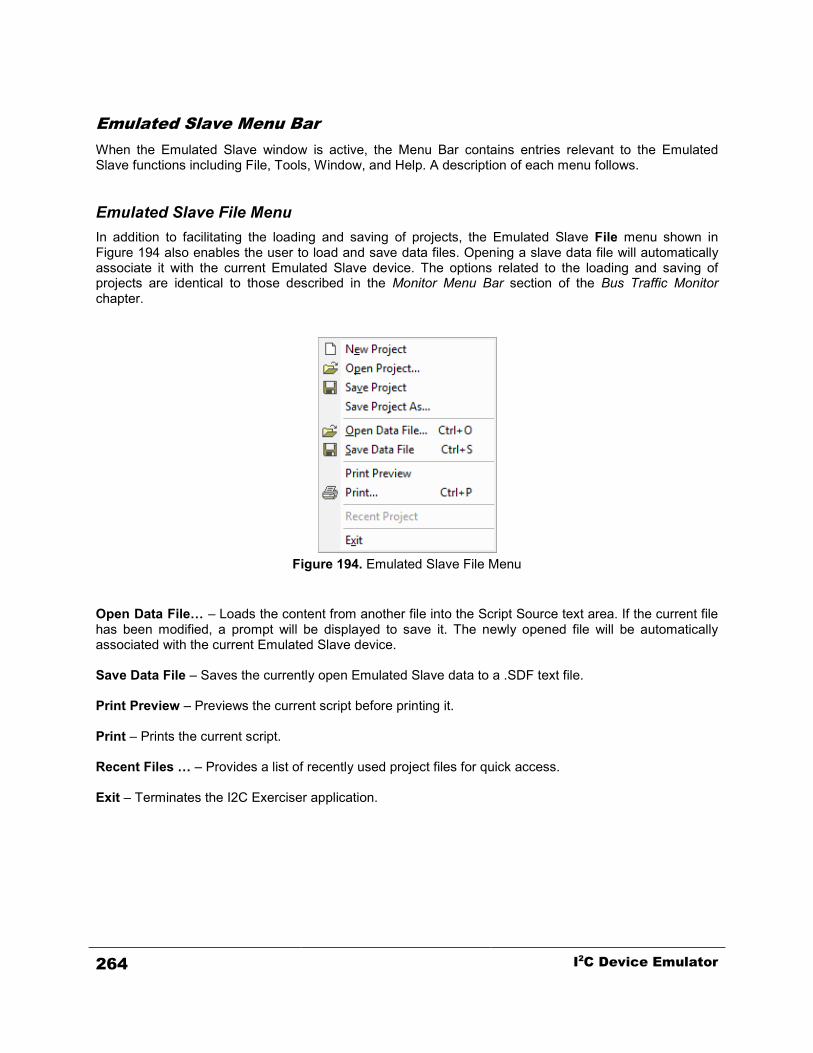
Emulated Slave Menu Bar When the Emulated Slave window is active, the Menu Bar contains entries relevant to the Emulated Slave functions including File, Tools, Window, and Help. A description of each menu follows. Emulated Slave File Menu In addition to facilitating the loading and saving of projects, the Emulated Slave File menu shown in Figure 194 also enables the user to load and save data files. Opening a slave data file will automatically associate it with the current Emulated Slave device. The options related to the loading and saving of projects are identical to those described in the Monitor Menu Bar section of the Bus Traffic Monitor chapter.
Figure 194. Emulated Slave File Menu
Open Data File… – Loads the content from another file into the Script Source text area. If the current file has been modified, a prompt will be displayed to save it. The newly opened file will be automatically associated with the current Emulated Slave device. Save Data File – Saves the currently open Emulated Slave data to a .SDF text file. Print Preview – Previews the current script before printing it. Print – Prints the current script. Recent Files … – Provides a list of recently used project files for quick access. Exit – Terminates the I2C Exerciser application.
264 I2C Device Emulator

Emulated Slave Edit Menu The Edit menu shown in Figure 195 provides commands that apply to the editing of the current slave data file.
Figure 195. Emulated Slave Edit Menu
Undo – Reverts a previously completed editing operation. Redo – Restores a previously undone editing operation. Cut – Removes highlighted text and places a copy on the Windows clipboard. Copy – Places a copy of highlighted text on the Windows clipboard. Paste – Inserts text from the Windows clipboard. Toggle Bookmark – Adds a bookmark at the line where the cursor is located or removes a bookmark if one is already set. Next Bookmark – Moves the cursor to the next bookmarked line below the current cursor position. If there are no bookmarked lines below the cursor, the cursor will be moved to the first bookmarked line from the beginning of the file. Previous Bookmark – Moves the cursor to the previous bookmarked line above the current cursor position. If there are no bookmarked lines above the cursor, the cursor will be moved to the last bookmarked line from the end of the file. Clear Bookmarks – Removes all bookmarks from the listing. Find… – Opens a standard text search dialog where the text of interest is entered. The current file is searched for the specified text and, if found, that text is brought into view and highlighted. Replace… – Opens a standard text replace dialog where the search text of interest is entered along with the replacement text. The current file is searched and any occurrences of the search text are substituted with the replacement text.
I2C Device Emulator 265
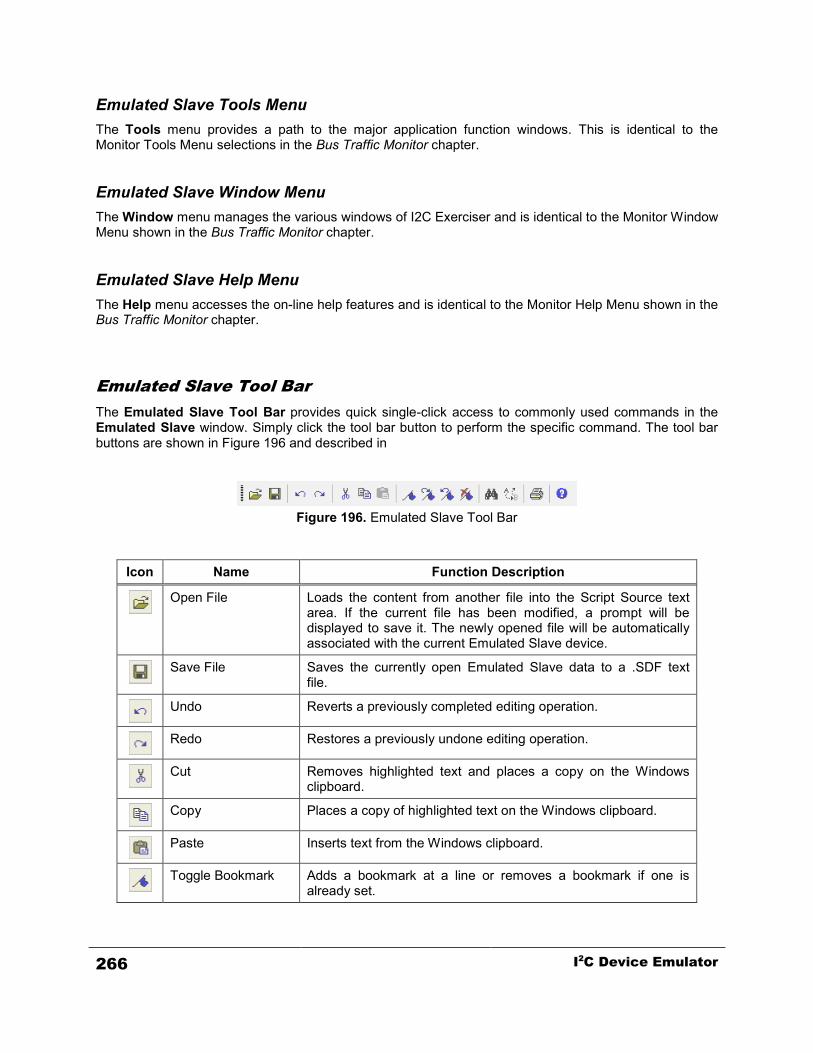
Emulated Slave Tools Menu The Tools menu provides a path to the major application function windows. This is identical to the Monitor Tools Menu selections in the Bus Traffic Monitor chapter. Emulated Slave Window Menu The Window menu manages the various windows of I2C Exerciser and is identical to the Monitor Window Menu shown in the Bus Traffic Monitor chapter. Emulated Slave Help Menu The Help menu accesses the on-line help features and is identical to the Monitor Help Menu shown in the Bus Traffic Monitor chapter.
Emulated Slave Tool Bar The Emulated Slave Tool Bar provides quick single-click access to commonly used commands in the Emulated Slave window. Simply click the tool bar button to perform the specific command. The tool bar buttons are shown in Figure 196 and described in
Figure 196. Emulated Slave Tool Bar
Icon Name Function Description
Open File Loads the content from another file into the Script Source text
area. If the current file has been modified, a prompt will be displayed to save it. The newly opened file will be automatically associated with the current Emulated Slave device.
Save File Saves the currently open Emulated Slave data to a .SDF text
file.
Undo Reverts a previously completed editing operation.
Redo Restores a previously undone editing operation.
Cut Removes highlighted text and places a copy on the Windows
clipboard.
Copy Places a copy of highlighted text on the Windows clipboard.
Paste Inserts text from the Windows clipboard.
Toggle Bookmark Adds a bookmark at a line or removes a bookmark if one is
already set.
266 I2C Device Emulator

Icon Name Function Description
Next Bookmark Moves the cursor to the next bookmarked line below the current
cursor position. If there are no bookmarked lines below the cursor, the cursor will be moved to the first bookmarked line from the beginning of the file.
Previous Bookmark Moves the cursor to the previous bookmarked line above the
current cursor position. If there are no bookmarked lines above the cursor, the cursor will be moved to the last bookmarked line from the end of the file.
Clear Bookmarks Removes all bookmarks from the listing.
Find Opens a standard text search dialog where the text of interest is
entered. The current file is searched for the specified text and, if found, that text is brought into view and highlighted.
Replace Opens a standard text replace dialog where the search text of
interest is entered along with the replacement text. The current file is searched and any occurrences of the search text are substituted with the replacement text.
Print Prints the current data file.
Help Provides quick access to the online help topics.
Table 22. Emulated Slave Tool Bar Functions
I2C Device Emulator 267

Emulated Slave Clock Stretching I2C bus protocol allows an addressed slave to delay its response to a bus master message by stretching the SCL clock signal just before the acknowledgement bit. This feature is supported by the CAS-1000 to enable users to test how well their master device works when the clock is stretched. When CAS-1000 is emulating a slave device, the clock period for the acknowledgement bit can be stretched up to 5.2 ms. The stretch time and the particular message byte number is user programmable. Clock Stretching is done by using a special enable_clock_stretching macro in the slave data file (*.sdf) which specifies at which byte during a write message the stretching should occur, and how long it should be. An example of using the macro is shown below. In this case, the SCL clock signal low (“0”) period prior to the third data byte acknowledgement bit is stretched for 20 µs. #enable_clock_stretching(3, 20000) // clock stretched on third byte, for 20 µs When using the clock stretching this macro should be the only item in the slave data file since the write transaction does not require any data to be returned by the slave. Only one slave can be active when using this feature, and the emulated slave continues to be active (until the user aborts the slave emulation session). That is, in the above case, each third byte of a write message to the emulated slave will produce the stretched acknowledgement bit. However, the user must assure that enough time (20 ms) is allotted between the transactions when the master is repeatedly writing to the slave in order for the clock stretching mechanism to re-arm itself. You can try the Clock Stretching feature by using the Debugger mode as the I2C bus master and the Slave Emulation mode as the I2C bus slave. The following are step by step instructions on how to set and view a slave emulation with clock stretching.
1. Start the I2C Exerciser application with the CAS-1000 connected to the host PC. Do not attach the target for this example.
2. Start the Monitor tool by pressing the F11 key. Click on the Yes and Close buttons if prompted for voltage settings. Minimize the Monitor Tools dialog.
3. Open up the Emulation window by selecting the Emulator menu item from the Tools menu. Click on the Add button. At the Add Emulated Device dialog, set the type to “Slave”, the name to “SLAVE1”, and the address to “18”. Then select the “slave_clock_stretching.sdf” file from the “Samples” subfolder under the I2C Exerciser’s installation folder. See Figure 8-17. Close the dialog by clicking on the OK button.
268 I2C Device Emulator

Figure 197. Configuring Emulated Slave Device
4. Start the slave emulation by pressing the F5 key. Click on the OK button if a warning comes up. 5. Start the Debugger tool by clicking on the Tools menu and selecting the Debugger menu item.
Using the Debugger, send 3 bytes (e.g. 12 34 AB) to the default slave address (0x18). 6. After doing this, you will notice in the Monitor’s timing window that a SCL low period is stretched
for about 20 µs at the acknowledgement bit of the third data byte – as shown in Figure 8-18.
Figure 198. Clock Stretched on ACK Bit
I2C Device Emulator 269


Chapter 11 Script-Driven Bus Tester
Test window overview and component descriptions
The Test window provides tools for testing of the target I2C bus to make sure that it performs within desired limits. It is oriented around comprehensively evaluating the target I2C bus and making a go/no-go decision about its performance characteristics. In essence, the Test mode is a superset of the bus master Emulator feature of the CAS-1000-I2C with additional capabilities specially designed for Acceptance Test Procedure at engineering or production time. Note that while in Test mode one or more emulated slaves may be launched to augment target observations. Test Mode Features include:
• Invoking bus parameter measurements • Comparing measured bus characteristics against expected values • Reporting runtime status messages to the user to show progress • Consolidating findings to make a ‘pass/fail’ indication • Providing emulated slave environment to the target aiding in its evaluation • Manipulating/sensing the I/O bits to coordinate testing with target states or external equipment
The Test tool is very useful for a variety of Acceptance Test Procedure (ATP) related applications such as:
• Production testing of I2C compatible silicon devices such as serial EEPROMs and multi-function system monitors
• Qualification testing of I2C based products such as consumer products, servers, embedded systems, etc.
• Engineering and/or production ATP of I2C based devices • Regressive testing of systems and devices to make sure that performance is still up par after
having gone through engineering changes Like the Master Emulator script, the Test scripting language also employs a simplified C-like syntax, with a larger repertoire of built-in functions. With support for conditional branching and looping, the scripting language allows the tester to perform conditional tests depending on previous test results. The Test window, as well as the built-in script Editor, provides support for Test construction, including syntax checking. The dedicated screen for this tool enables editing, launching, stopping, looping, and stepping through this test script. The script file listing can be observed with source-level breaking and progress control available. The execution status text area, progress bar, and test result icon provide a method for the script to notify the user the status of the test. They can be controlled via calls to built-in functions provided by the scripting language.
Script-Driven Bus Tester 271
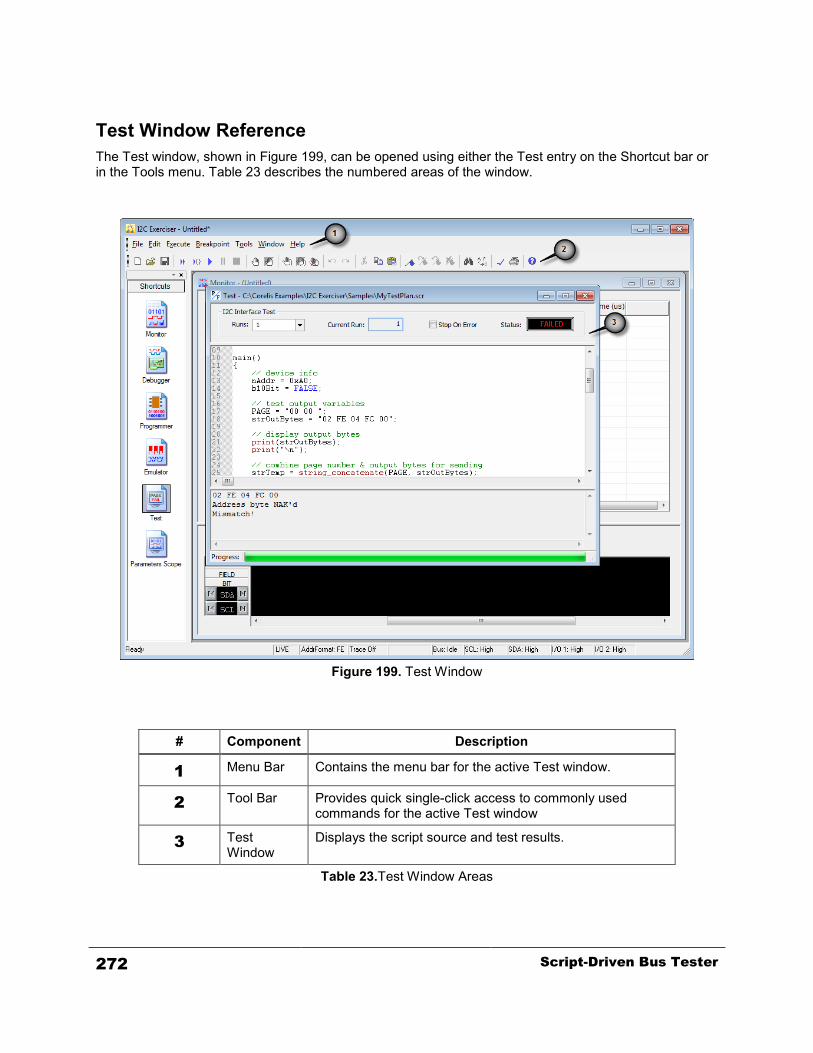
Test Window Reference The Test window, shown in Figure 199, can be opened using either the Test entry on the Shortcut bar or in the Tools menu. Table 23 describes the numbered areas of the window.
Figure 199. Test Window
# Component Description
1 Menu Bar Contains the menu bar for the active Test window.
2 Tool Bar Provides quick single-click access to commonly used commands for the active Test window
3 Test Window
Displays the script source and test results.
Table 23.Test Window Areas
272 Script-Driven Bus Tester

Test Window Operations The Test window, shown in Figure 200, lists the script text file containing the scrollable Test program instructions which get executed to validate a target I2C bus. This is similar to a master emulation file, but is focused on making a go/no-go decision about the target bus. Besides interacting with the target, it typically includes measurements and observes target behavior to assess its condition. It can loop a given number of times and be setup to stop if an error is indicated. A ‘Passed/Failed’ indication is under the control of the script program. Tests can be run, paused, or stopped using the respective toolbar buttons. Breakpoints are specific lines in the source code that the user specifies prior to executing the script. A breakpoint can be enabled or disabled. When the script execution reaches an enabled breakpoint, it will stop execution prior to executing that line. Depending on what the user chooses, the execution can continue onto the next enabled breakpoint or stop entirely. Additionally, the user can execute the script line-by-line.
Figure 200. Test Window
Script-Driven Bus Tester 273

Runs – The number in the dropdown menu indicates how many times to run the test. “Forever” indicates that the test will run indefinitely until stopped by the user. Current Run – Display the current iteration of the test. When the test is first loaded, the current run is 0. If the script is not currently running, it displays the last iteration executed before execution terminated. Stop On Error – If checked, the program will halt execution of the Test script when it raises an error. If not, the program will continue with the script. Test Status – – Indicates the current execution status of the test script by displaying one of the following:
Indicates that the test script is loaded and ready to execute.
Indicates that the test is executing.
Indicates that test execution has been paused.
Indicates that the test has successfully finished execution. At this point it is ready to execute again.
Indicates that test execution has been user-terminated before completion.
Indicates that an error has been raised by the test script. This icon can be activated by calling the built-in “exit” function with a nonzero parameter.
Indicates that the test had completed execution with a pass condition. This icon can be activated by calling the built-in “exit” function with the parameter 0.
Script Source – Displays the content of the test script file. The script can be scrolled through and edited when it is not being executed. Syntax highlighting is applied to the script text so that keywords are colored blue, comments are colored green, and names of built-in functions are colored maroon. If any changes are made to the test script, the test script file must be saved before it can be executed. Right-clicking in the test plan will display the Test Source Popup Menu, enabling manipulation of breakpoints and bookmarks as well as editing and execution operations. The Test Source Popup Menu is described in the next section.
274 Script-Driven Bus Tester

Left-hand Gutter – Displays line numbers and special line indicators such as breakpoint information for the test script. The following icons can appear:
Indicates an enabled breakpoint.
Indicates a disabled breakpoint.
Indicates a bookmark.
Indicates the next execution line. This can be seen when execution is paused, such as during single-step execution.
Indicates a line near a syntax error. Often the syntax error can be located on the line immediately above this indicator.
Output – Displays text output from an executing test. This output is updated through the use of a built-in “print” function provided by the scripting language. Progress Bar – Displays the progress of an executing test. This progress bar is updated through the use of a built-in “progress” function provided by the scripting language.
Script-Driven Bus Tester 275

Test Source Popup Menu The Test Source Popup Menu is accessed when the user right-clicks in the Script Source text area of the Test Window. It is the same as the source popup menu used in the Emulator and enables manipulation of breakpoints and bookmarks as well as editing and execution operations. The menu is shown in Figure 201. followed by descriptions of the available commands.
Figure 201. Test Source Popup Menu
Cut – Removes highlighted text and places a copy on the Windows clipboard. The <Ctrl+X> keyboard shortcut will also invoke this command. Copy – Places a copy of highlighted text on the Windows clipboard. The <Ctrl+C> keyboard shortcut will also invoke this command. Paste – Inserts text from the Windows clipboard. The <Ctrl+V> keyboard shortcut will also invoke this command. Step – Executes the script one line at a time, starting with the next unexecuted line. Run To Cursor – Executes the script, starting from the next unexecuted line, and stops just before executing the line at the cursor position. If a breakpoint is encountered before the cursor, execution will pause at the breakpoint. Run – Executes the script, starting from the next unexecuted line. Script execution will continue to the end of the script unless a breakpoint is encountered or the script is paused or aborted by the user. Before script execution begins, the user will be prompted to save the file if the script has been modified. Break – Pauses script execution.
276 Script-Driven Bus Tester

Stop – Completely aborts script execution. Toggle Breakpoint – Adds a breakpoint at a line or removes a breakpoint if one is already set. If the line is blank or contains only comments, the breakpoint will be applied to the next line of code. The <F9> keyboard shortcut will also invoke this command. Enable/Disable Breakpoint – If a breakpoint is already set, this command enables or disables the breakpoint. Enable all Breakpoints – Sets the status of all breakpoints to “Enabled.” Disable all Breakpoints – Sets the status of all breakpoints to “Disabled.” Clear all Breakpoints – Removes all breakpoints from the script. Toggle Bookmark – Adds a bookmark at a line or removes a bookmark if one is already set. Next Bookmark – Moves the cursor to the next bookmarked line below the current cursor position. If there are no bookmarked lines below the cursor, the cursor will be moved to the first bookmarked line from the beginning of the script. Previous Bookmark – Moves the cursor to the previous bookmarked line above the current cursor position. If there are no bookmarked lines above the cursor, the cursor will be moved to the last bookmarked line from the end of the script. Clear Bookmarks – Removes all bookmarks from the script.
Script-Driven Bus Tester 277
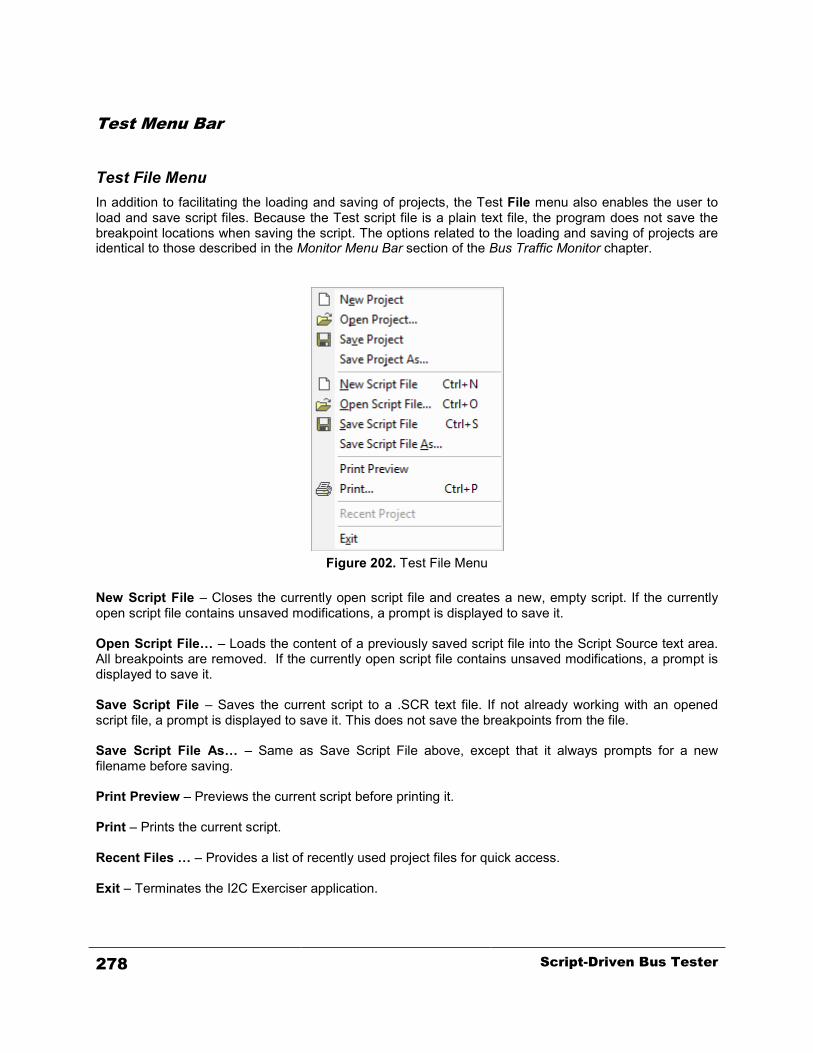
Test Menu Bar Test File Menu In addition to facilitating the loading and saving of projects, the Test File menu also enables the user to load and save script files. Because the Test script file is a plain text file, the program does not save the breakpoint locations when saving the script. The options related to the loading and saving of projects are identical to those described in the Monitor Menu Bar section of the Bus Traffic Monitor chapter.
Figure 202. Test File Menu
New Script File – Closes the currently open script file and creates a new, empty script. If the currently open script file contains unsaved modifications, a prompt is displayed to save it. Open Script File… – Loads the content of a previously saved script file into the Script Source text area. All breakpoints are removed. If the currently open script file contains unsaved modifications, a prompt is displayed to save it. Save Script File – Saves the current script to a .SCR text file. If not already working with an opened script file, a prompt is displayed to save it. This does not save the breakpoints from the file. Save Script File As… – Same as Save Script File above, except that it always prompts for a new filename before saving. Print Preview – Previews the current script before printing it. Print – Prints the current script. Recent Files … – Provides a list of recently used project files for quick access. Exit – Terminates the I2C Exerciser application.
278 Script-Driven Bus Tester
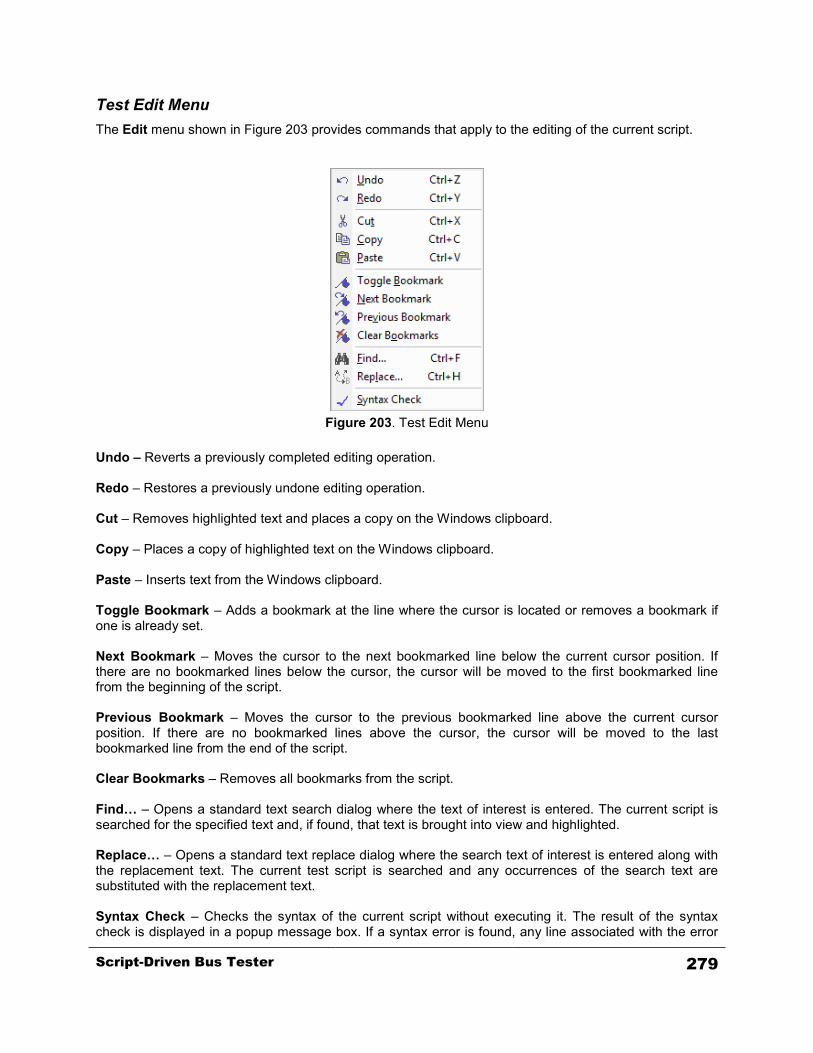
Test Edit Menu The Edit menu shown in Figure 203 provides commands that apply to the editing of the current script.
Figure 203. Test Edit Menu
Undo – Reverts a previously completed editing operation. Redo – Restores a previously undone editing operation. Cut – Removes highlighted text and places a copy on the Windows clipboard. Copy – Places a copy of highlighted text on the Windows clipboard. Paste – Inserts text from the Windows clipboard. Toggle Bookmark – Adds a bookmark at the line where the cursor is located or removes a bookmark if one is already set. Next Bookmark – Moves the cursor to the next bookmarked line below the current cursor position. If there are no bookmarked lines below the cursor, the cursor will be moved to the first bookmarked line from the beginning of the script. Previous Bookmark – Moves the cursor to the previous bookmarked line above the current cursor position. If there are no bookmarked lines above the cursor, the cursor will be moved to the last bookmarked line from the end of the script. Clear Bookmarks – Removes all bookmarks from the script. Find… – Opens a standard text search dialog where the text of interest is entered. The current script is searched for the specified text and, if found, that text is brought into view and highlighted. Replace… – Opens a standard text replace dialog where the search text of interest is entered along with the replacement text. The current test script is searched and any occurrences of the search text are substituted with the replacement text. Syntax Check – Checks the syntax of the current script without executing it. The result of the syntax check is displayed in a popup message box. If a syntax error is found, any line associated with the error
Script-Driven Bus Tester 279
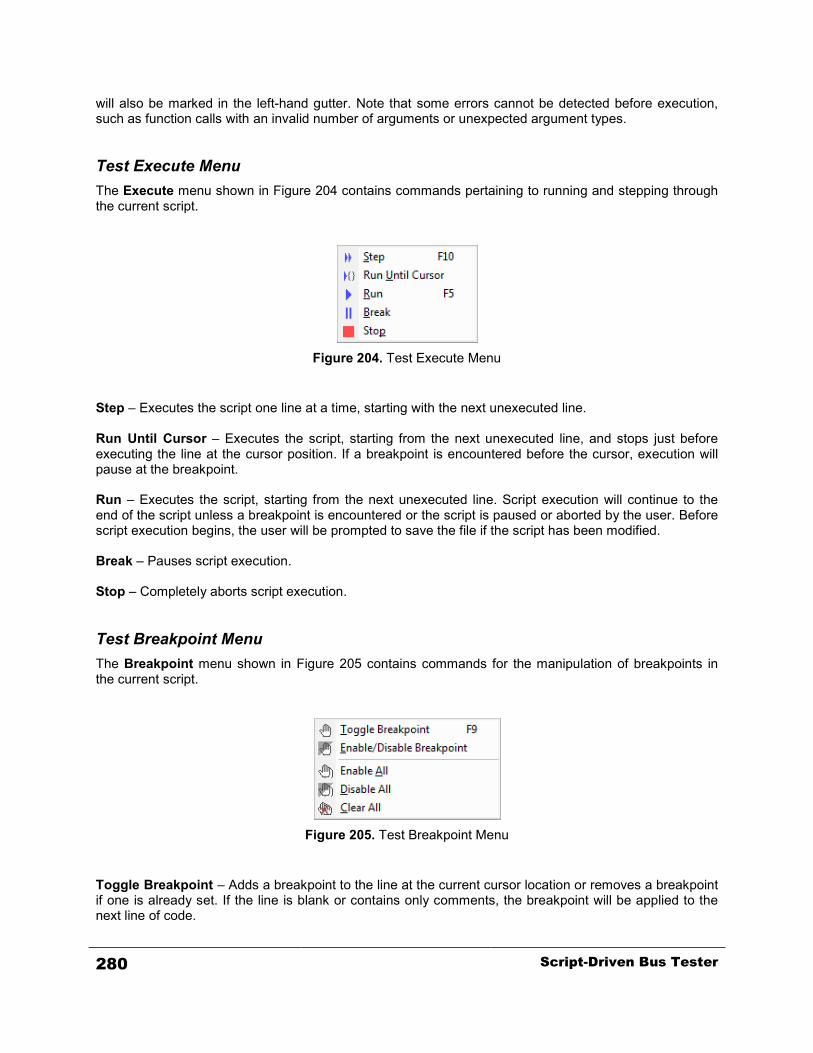
will also be marked in the left-hand gutter. Note that some errors cannot be detected before execution, such as function calls with an invalid number of arguments or unexpected argument types. Test Execute Menu The Execute menu shown in Figure 204 contains commands pertaining to running and stepping through the current script.
Figure 204. Test Execute Menu
Step – Executes the script one line at a time, starting with the next unexecuted line. Run Until Cursor – Executes the script, starting from the next unexecuted line, and stops just before executing the line at the cursor position. If a breakpoint is encountered before the cursor, execution will pause at the breakpoint. Run – Executes the script, starting from the next unexecuted line. Script execution will continue to the end of the script unless a breakpoint is encountered or the script is paused or aborted by the user. Before script execution begins, the user will be prompted to save the file if the script has been modified. Break – Pauses script execution. Stop – Completely aborts script execution. Test Breakpoint Menu The Breakpoint menu shown in Figure 205 contains commands for the manipulation of breakpoints in the current script.
Figure 205. Test Breakpoint Menu
Toggle Breakpoint – Adds a breakpoint to the line at the current cursor location or removes a breakpoint if one is already set. If the line is blank or contains only comments, the breakpoint will be applied to the next line of code.
280 Script-Driven Bus Tester

Enable/Disable Breakpoint – Enables or disables the breakpoint at the line containing the cursor. If no breakpoint exists at that line, it will create an enabled breakpoint. Enable All – Enables all the existing breakpoints. Disable All – Disables all the existing breakpoints. Clear All – Removes all existing breakpoints. Test Tools Menu The Tools menu provides a path to the major application function windows. This is identical to the Monitor Tools Menu selections in the Bus Traffic Monitor chapter. Test Window Menu The Window menu manages the various windows of I2C Exerciser and is identical to the Monitor Window Menu shown in the Bus Traffic Monitor chapter. Test Help Menu The Help menu accesses the on-line help features and is identical to the Monitor Help Menu shown in the Bus Traffic Monitor chapter.
Script-Driven Bus Tester 281

Test Tool Bar The Test Tool Bar provides quick single-click access to commonly used commands in the Test window. Simply click the tool bar button to perform the specific command. It is identical to the Master Emulator Tool Bar. The tool bar buttons are shown in Figure 206 and described in Table 24.
Figure 206. TestTool Bar
Icon Name Function Description
New Script Closes the currently open script file and creates a new, empty
script. If the currently open script file contains unsaved modifications, a prompt is displayed to save it.
Open Script Loads the content of a previously saved script file into the Script
Source text area. All breakpoints are removed. If the currently open script file contains unsaved modifications, a prompt is displayed to save it.
Save Script Saves the currently open script to a .SCR text file. Note that this
does not save any set breakpoints or bookmarks.
Step Executes the script one line at a time, starting with the next
unexecuted line.
Run To Cursor Executes the script, starting from the next unexecuted line, and
stops just before executing the line at the cursor position. If a breakpoint is encountered before the cursor, execution will pause at the breakpoint.
Run Executes the script, starting from the next unexecuted line.
Script execution will continue to the end of the script unless a breakpoint is encountered or the script is paused or aborted by the user. Before script execution begins, the user will be prompted to save the file if the script has been modified.
Break Pauses script execution.
Stop Completely aborts script execution.
Toggle Breakpoint Adds a breakpoint at a line or removes a breakpoint if one is
already set. If the line is blank or contains only comments, the breakpoint will be applied to the next line of code.
Enable/Disable Breakpoint
If a breakpoint is already set, this command enables or disables the breakpoint.
Enable All Breakpoints
Sets the status of all breakpoints to “Enabled.”
Disable All Breakpoints
Sets the status of all breakpoints to “Disabled.”
282 Script-Driven Bus Tester

Icon Name Function Description
Clear All Breakpoints
Removes all breakpoints from the script.
Undo Reverts a previously completed editing operation.
Redo Restores a previously undone editing operation.
Cut Removes highlighted text and places a copy on the Windows
clipboard.
Copy Places a copy of highlighted text on the Windows clipboard.
Paste Inserts text from the Windows clipboard.
Toggle Bookmark Adds a bookmark at a line or removes a bookmark if one is
already set.
Next Bookmark Moves the cursor to the next bookmarked line below the current
cursor position. If there are no bookmarked lines below the cursor, the cursor will be moved to the first bookmarked line from the beginning of the script.
Previous Bookmark Moves the cursor to the previous bookmarked line above the
current cursor position. If there are no bookmarked lines above the cursor, the cursor will be moved to the last bookmarked line from the end of the script.
Clear Bookmarks Removes all bookmarks from the script.
Find Opens a standard text search dialog where the text of interest is
entered. The current script is searched for the specified text and, if found, that text is brought into view and highlighted.
Replace Opens a standard text replace dialog where the search text of
interest is entered along with the replacement text. The current script is searched and any occurrences of the search text are substituted with the replacement text.
Syntax Check Checks the syntax of the current script without executing it. The
result of the syntax check is displayed in a popup message box. If a syntax error is found, any line associated with the error will also be marked in the left-hand gutter. Note that some errors cannot be detected before execution, such as function calls with an invalid number of arguments or unexpected argument types.
Print Prints the current script file.
Help Provides quick access to the online help topics.
Table 24. Test Tool Bar Functions
Script-Driven Bus Tester 283

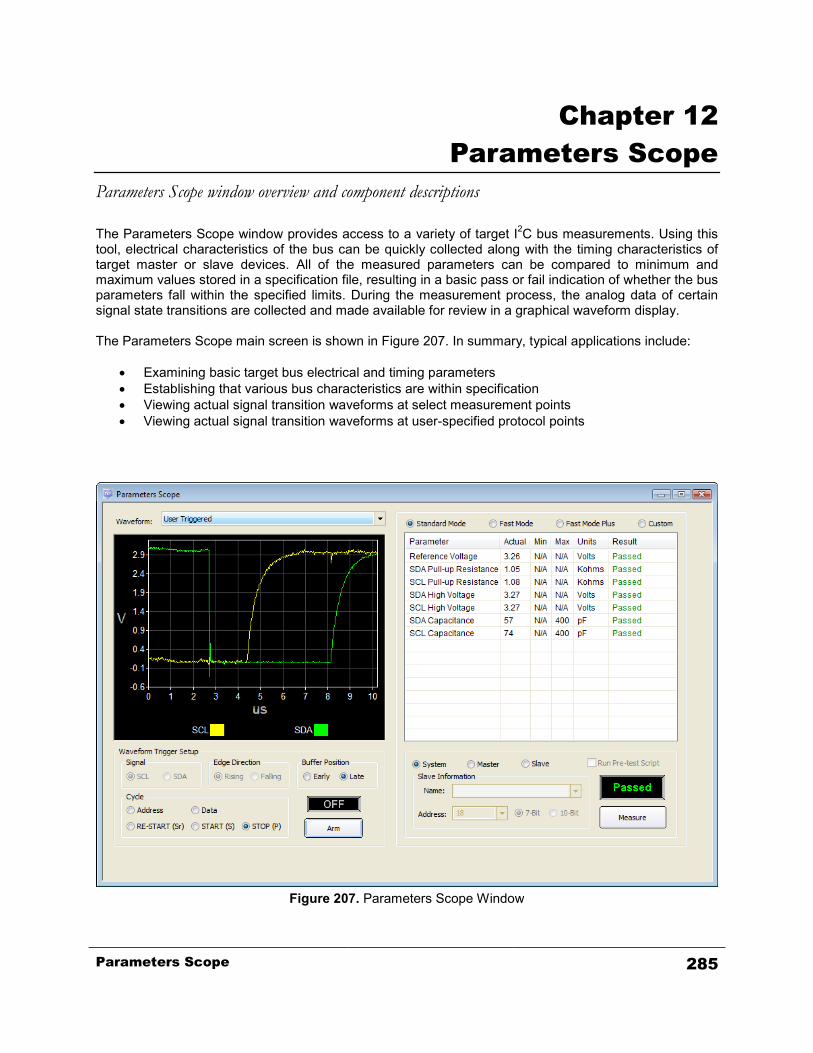
Chapter 12 Parameters Scope
Parameters Scope window overview and component descriptions
The Parameters Scope window provides access to a variety of target I2C bus measurements. Using this tool, electrical characteristics of the bus can be quickly collected along with the timing characteristics of target master or slave devices. All of the measured parameters can be compared to minimum and maximum values stored in a specification file, resulting in a basic pass or fail indication of whether the bus parameters fall within the specified limits. During the measurement process, the analog data of certain signal state transitions are collected and made available for review in a graphical waveform display. The Parameters Scope main screen is shown in Figure 207. In summary, typical applications include:
• Examining basic target bus electrical and timing parameters • Establishing that various bus characteristics are within specification • Viewing actual signal transition waveforms at select measurement points • Viewing actual signal transition waveforms at user-specified protocol points
Figure 207. Parameters Scope Window
Parameters Scope 285
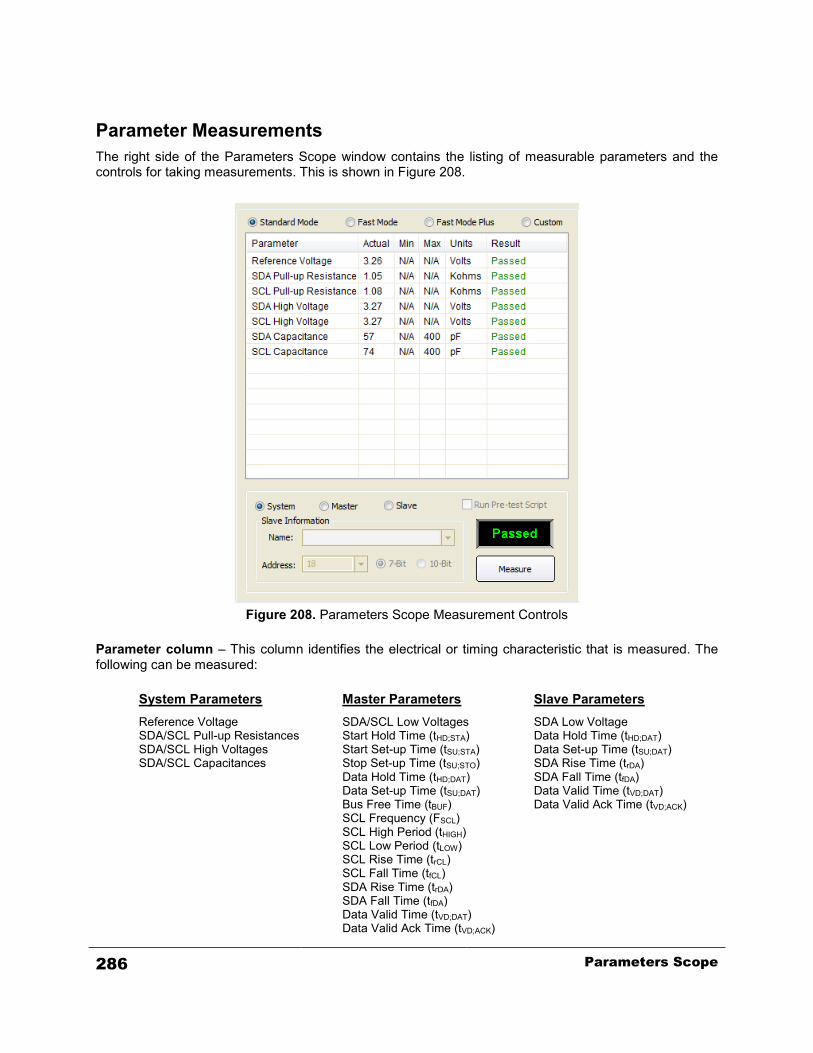
Parameter Measurements The right side of the Parameters Scope window contains the listing of measurable parameters and the controls for taking measurements. This is shown in Figure 208.
Figure 208. Parameters Scope Measurement Controls
Parameter column – This column identifies the electrical or timing characteristic that is measured. The following can be measured:
System Parameters Master Parameters Slave Parameters Reference Voltage SDA/SCL Pull-up Resistances SDA/SCL High Voltages SDA/SCL Capacitances
SDA/SCL Low Voltages Start Hold Time (tHD;STA) Start Set-up Time (tSU;STA) Stop Set-up Time (tSU;STO) Data Hold Time (tHD;DAT) Data Set-up Time (tSU;DAT) Bus Free Time (tBUF) SCL Frequency (FSCL) SCL High Period (tHIGH) SCL Low Period (tLOW) SCL Rise Time (trCL) SCL Fall Time (tfCL) SDA Rise Time (trDA) SDA Fall Time (tfDA) Data Valid Time (tVD;DAT) Data Valid Ack Time (tVD;ACK)
SDA Low Voltage Data Hold Time (tHD;DAT) Data Set-up Time (tSU;DAT) SDA Rise Time (trDA) SDA Fall Time (tfDA) Data Valid Time (tVD;DAT) Data Valid Ack Time (tVD;ACK)
286 Parameters Scope

Actual – This column indicates the actual resultant value from the measurement. If this column entry is empty, then the parameter has not yet been measured. For timing characteristics, certain special measurement limitations apply. The CAS-1000-I2C analyzer has a 512 sample measurement buffer and runs at a sample rate of 50 MHz. This provides approximately 10 µs (10,000 ns) worth of analog data for measurement. If a timing characteristic measurement would be greater than this amount of time, then it cannot be determined and the Actual column will contain “> 10000” (all timing results are in nanoseconds). Similarly, the analyzer has a lower limit on measurement accuracy and any result that would be less than 60 ns will be indicated as “< 60”. Note that all timing measurements may be ±20 ns. The actual value of SCL Frequency (Fscl) will be indicated as “< 100” when either SCL High Period (Thi) or SCL Low Period (Tlow) is measured as “> 1000”. Min – This column indicates the minimum passing value for the measurement. If the actual measurement returns lower than this, then “Failed” will be indicated in the Result column. This column entry may contain “N/A” if there is no minimum specified. Minimum and maximum parameter values are loaded from a file as described in the Parameter Specification File section later in this chapter. Max – This column indicates the maximum passing value for the measurement. If the actual measurement returns higher than this, then “Failed” will be indicated in the Result column. This column entry may contain “N/A” if there is no maximum specified. Maximum and minimum parameter values are loaded from a file as described in the Parameter Specification File section later in this chapter. Units – This column indicates the units of measurement for the parameter (volts, Kohms, pF, ns, or KHz). Result – This column indicates the status of the particular measurement. When there is no value present in the Actual column, meaning that the measurement has yet to be taken, this column entry contains the text, “Not Tested.” When a value is present in the Actual column, this entry can be “Passed” or “Failed” depending on whether the measurement result is within the range specified by the Min and Max columns. If both the Min and the Max entries indicate “N/A” then any measurement value is considered to pass. For timing characteristics, if both the value in the Actual column and the value in the Min column are “< 60” (ns), or if both the value in the Actual column and the value in the Max column are “> 10000” (ns), then the Result column entry will contain “Not Tested”. This is because, under these conditions, a pass or fail cannot be determined. Standard Mode / Fast Mode / Fast Mode Plus / Custom – These radio buttons select the I2C mode for the parameter measurements. When one of the buttons is clicked on, the min and max values of the specified mode are used as the pass/fail criteria. System / Master / Slave – These radio buttons select the source for the parameter measurements. When one of the buttons is clicked on, the listing of parameters changes to show the associated entries noted previously in the Parameter Column description. System parameters include electrical characteristics that apply to the overall bus and should be measured while there is no traffic on the bus. The I2C Exerciser will display a reminder message box before taking these measurements. Master parameters are measured by observing traffic generated by a target master and each measurement will wait for appropriate traffic before continuing. It is recommended that a master be set to produce continual traffic for these measurements. The traffic must also meet all of the conditions necessary to complete the measurements, including:
• Rising and falling SDA edges during the address cycle. For example generate read or write transactions to slave device address 1010101.
• Presence of START, repeated START, and STOP conditions. The I2C Exerciser will display a reminder message box before taking these measurements.
Parameters Scope 287

Slave parameters are measured by performing read transactions with the target slave. To complete successfully, these measurements require that the data provided by the target slave produce both rising and falling SDA edges during the data cycle. Thus, it may be necessary to set up the slave device appropriately before initiating the measurements. Slave Information – These controls are enabled when the Slave radio button (described above) is selected and are used to specify the target slave device for measurement.
Name – This dropdown box allows quick selection of target slaves whose presence on the bus has been verified. Slave device verification is performed by the Auto-Detect feature in the Target Slaves pane of the Configuration Manager. Refer to the Configuration and Preferences chapter for more information. Address – This field specifies the I2C bus address of the target slave that is being measured. An address can be entered as a hexadecimal value or an address symbol may be used if one has been defined for the target slave (refer to the Symbols section of the Configuration Manager details in the Configuration and Preferences chapter). Additionally, the field’s dropdown list provides a selection of recently used address values and all of the currently defined address symbols. Note that 7-bit I2C addresses are represented as 8-bit hexadecimal values and their format is dependant on the current address mode setting (FE mode or 7F mode). Please refer to the Formats section of the Preferences dialog details in the Configuration and Preferences chapter for more information. 7-Bit / 10-Bit – These radio buttons specify the bit length of the target slave address. Run Pre-test Script – When this option is selected, the current script in the Debugger’s Send window is executed before the read transactions for the Slave measurements are performed. This can be useful for setting up the control registers of the target slave device prior to the read transactions.
Measure button – Clicking on this button begins the measurement operation. When measurement begins, a message box will pop up to provide instructions on any target bus conditions that are required for the operation. During Master measurements, while waiting for traffic from the target master, this button becomes a Cancel button that allows the measurement operation to be cancelled. Status Box – This indicator is located just above the Measure button and displays the status of the measurement operation. The following can be indicated:
Indicates that no measurements have yielded a pass or fail result. In this case, the Result column will contain “Not Tested” for all parameters.
Indicates that measurements are in progress. This status is indicated upon clicking on the Measure button and remains until all measurements have completed or been canceled.
This indicates that measurements have completed and ALL measurement results (displayed in the Actual column) have been labeled as “Passed” (in the Results column). Refer to the description of the Results column for details on what constitutes a pass or fail.
288 Parameters Scope

This indicates that measurements have completed and that at least one measurement result (displayed in the Actual column) has been labeled as “Failed” (in the Results column). Refer to the description of the Results column for details on what constitutes a pass or fail.
Parameters Scope 289

Parameter Specification File There can be minimum and maximum values defined for each parameter which establishes a range of acceptable measurement results. These minimums and maximums are displayed in the Min and Max columns respectively. When “N/A” appears in the column entry, it indicates that there is no associated limit. If the actual measurement value is outside of the acceptable range, the result of the parameter measurement is labeled as “Failed.” Otherwise the result is labeled as “Passed.” For more details on pass or fail results, refer to the previous descriptions of the Result, Max, Min, and Actual columns. When the Custom mode is selected for the measurements, the minimum and maximum values are loaded from the parameter specification file, “ParameterSpec.ini”, located in the I2C Exerciser installation folder. By default, this file contains the maximum and minimum values defined for Fast-Mode by the I2C-bus Specification (Version 2.1, January 2000). However, this file is in a text format and can be opened with any text editor in order to customize the specification. The format of the parameter specification file is simple. A portion of the file is shown in Figure 209 below. Each measurable parameter constitutes a section of the file represented by an identifier enclosed in the bracket characters ‘[‘ and ‘]’. Comments, beginning with a semicolon (‘;’), help to point out each parameter section and indicate the measurement units. After the section identifier, there are two lines—one beginning with “min=” and one with “max=”—that define the respective minimum and maximum values. Simply place the desired value after the equals sign. If no value is indicated after the equals sign, then there is considered to be no lower or upper limit to the associated parameter measurement.
Figure 209. Parameter Specification File Example
290 Parameters Scope
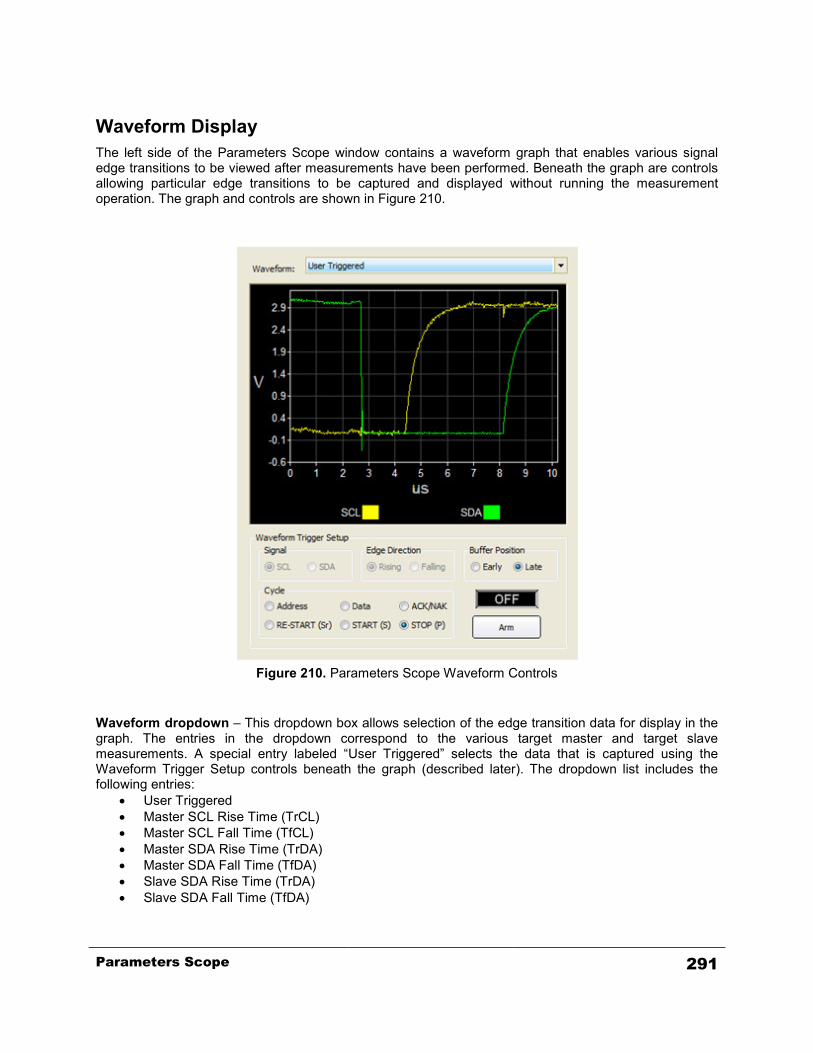
Waveform Display The left side of the Parameters Scope window contains a waveform graph that enables various signal edge transitions to be viewed after measurements have been performed. Beneath the graph are controls allowing particular edge transitions to be captured and displayed without running the measurement operation. The graph and controls are shown in Figure 210.
Figure 210. Parameters Scope Waveform Controls
Waveform dropdown – This dropdown box allows selection of the edge transition data for display in the graph. The entries in the dropdown correspond to the various target master and target slave measurements. A special entry labeled “User Triggered” selects the data that is captured using the Waveform Trigger Setup controls beneath the graph (described later). The dropdown list includes the following entries:
• User Triggered • Master SCL Rise Time (TrCL) • Master SCL Fall Time (TfCL) • Master SDA Rise Time (TrDA) • Master SDA Fall Time (TfDA) • Slave SDA Rise Time (TrDA) • Slave SDA Fall Time (TfDA)
Parameters Scope 291

Graph – The graph displays the analog SDA and SCL signal data at a selected signal edge transition. Signals are drawn in the graph in the same color as in the Monitor window timing display. Refer to the Monitor Colors section of the Preferences dialog described in the Configuration and Preferences chapter. Waveform Trigger Setup controls – These controls allow a signal edge transition to be captured and displayed in the graph.
Signal – Specifies the bus signal for which an edge will be captured: SDA or SCL. Edge Direction – Specifies the direction of the edge to be captured: rising or falling. Cycle – Specifies the I2C message cycle during which the edge capture will occur:
• Address – Looks for the first matching address cycle edge • Data – Looks for the first matching data cycle edge • ACK/NAK – Captures the first ACK or NAK cycle • RE-START (Sr) – Captures the edges of a repeated START condition • START (S) – Captures the edges of a START condition • STOP (P) – Captures the edges of a STOP condition Note that if RE-START, START, or STOP is selected, then the Signal and Edge Direction selections do not apply.
Buffer Position – Specifies whether the captured signal edge will be stored early or late in the analog data buffer. This thus determines whether the edge will appear towards the beginning or end of the graph, respectively. Arm button – Clicking on this button arms the trigger. The next signal edge matching the selected conditions triggers the capture and display of the analog data. While waiting for an appropriate signal transition to occur, this button becomes a Cancel button that allows the trigger to be disarmed. Status box – This indicator is located just above the Arm button and displays the status of the waveform triggering. The following can be indicated:
Indicates that the trigger is not armed. This is the initial status of waveform triggering and also the status to which it returns upon capturing a matching signal edge transition.
Indicates the trigger is armed and waiting for a signal edge matching the selected trigger conditions.
292 Parameters Scope

Parameters Scope Window Reference
Parameters Scope Menu Bar When the Parameters Scope window is active, the menu bar contains entries for File, Tools, Windows, and Help. These windows are similar to those described in the Monitor Menu Bar section of the Bus Traffic Monitor chapter.
Parameters Scope Tool Bar
When using the Parameters Scope window, the tool bar provides access only to the online help.
Parameters Scope 293

294 Parameters Scope
Chapter 13 Scripting Language
I2C Exerciser test scripting language reference
Overview The I2C Exerciser application enables automatic programmed operations of the CAS-1000-I2C for several distinct behavior types, by reading user-provided text files. The types differ by their application, but share many common features. The syntax is generally of the same style and format, distinguished mainly by which commands they use. The built-in Editor (described later in this chapter) assists in script manipulation by providing syntax highlighting and syntax checking. These types of script command text files consist of:
• Master Emulation – prescribes each step to be taken as a virtual master interacting on the bus with addressed slaves. This includes reading/writing, pausing, observing bus activity, operating/sensing discrete I/O signals and/or trigger pulses, looping, and taking conditional branches.
• Test – this is a super-set of Master Emulation, with additional commands to perform various measurements on the bus. It can compare parameters against limit file table values to make in-of/out-of specification decisions. The basic outcome of this program is a PASS/FAIL indication.
An example script program is provided below. This chapter assumes that the reader has a working knowledge of writing programs in “C” and is familiar with its syntax. There is no attempt to teach “C” programming, but instead its methods will be applied to the subject script commands, by means of example.
Scripting Language 295
The Essential Syntax Elements The various script command files are comprised of variables, statements (if, else, while, break, etc.), commands (built-in function calls; read/write the bus, etc.), operators (<, =, >=, etc.), calls to user defined functions, and comments. It is organized into callable functions, with the top entry level being the mandatory main() function. The built-in functions constitute standard commands to the CAS-1000-I2C while user defined functions enable stratification of the logic. The syntax is generally a subset of the “C” programming language. If you can write simple “C” programs, you should be able to easily write script command files. Functions are presented in these command files in a very similar fashion to “C” functions, including the naming convention, parameters, and braces { } containing blocks of statements. The following is a more detailed description of the major elements that go into a command file. Variables
A variable is a named storage location that contains data that can be modified during program execution. Each variable has a name that uniquely identifies it within its level of scope.
Variable names:
must begin with an alphabetic character. must be no longer than 255 characters. must not contain white-space characters. Variable can contain data of the following types: string String (less than 4096 characters) int 64 bit unsigned integer
float double-precision float value
To simplify the syntax of command files, no variable declaration is needed. The script interpreter automatically casts type of variable at runtime based on its first assignment. Several helper conversion functions are provided. These are:
float_to_string, integer_to_string, integer_to_string_hex8, integer_to_string_hex32, and integer_to_string_hex64 functions which construct data text strings converted from a variable.
Similar to strcmp() in C standard string library, the function:
string_compare() provides string comparisons. Similar to strstr() in C standard string library, the function:
string_substring() finds a substring in a string, pointing to its location. Similar to strcat() in C standard string library, the function:
string_concatenate() concatenates a second string to a first, pointing to the first.
In addition to the base variable data types of integer, string, and floating-point numbers, following array variable types are also available.
array of string collection of string data type array of int collection of int data type array of float collection of double-precision
296 Scripting Language

An array is a collection of objects of a single data type. The individual objections in the collection are accessed by their positions in the array. The expression in a bracket pair (“[]”) following an array variable denotes the index of an object in the array. The indexing is zero based and the size of array is non-predetermined. The array variables must be declared before being used in the script as following. Array of string: call string_array() function and assign the return value to a variable name arrStrNames = string_array();
// declaring a new array variable “arrStrNames”
arrStrCities = string_array(“New York”, “LA”, “Chicago”, “Washington”); // declaring a new array variable “arrStrCities” and // initializing the values of first four items
Array of int: call int_array() function and assign the return value to a variable name arrInt1 = int_array();
// declaring a new array variable “arrInt1”
arrInt2 = int_array(1, 2, 3, 5, 7, 11, 13, 17); // declaring a new array variable “arrInt2” and // initializing the values of first eight items
Array of float: call float_array() function and assign the return value to a variable name arrFloat1 = float_array();
// declaring a new array variable “arrFloat1”
arrFloat2 = float_array(0.5, 1.0, 1.5, 2.0, 2.5); // declaring a new array variable “arrFloat2” and // initializing the values of first five items
After the declarations, you can access and assign the items in the array using bracket pairs (“[]”) as following.
arrStrNames[0] = “Tom”; // assign the first element of “arrStrNames” array with “Tom”; strCity = arrStrCities[2]; // retrieve the second element of “arrStrCities” and // assign it to variable “strCity” printf(“%s lives in %s.”, arrStrNames[0], strCity); // prints out “Tom lives in Chicago.” for (i=0; i<8; i++) arrInt1[i] = arrInt2[7-i]; // reverses the order of elements in “arrInt2” and // copy them to “arrIn1”. for (i=0; i<8; i++)
Scripting Language 297
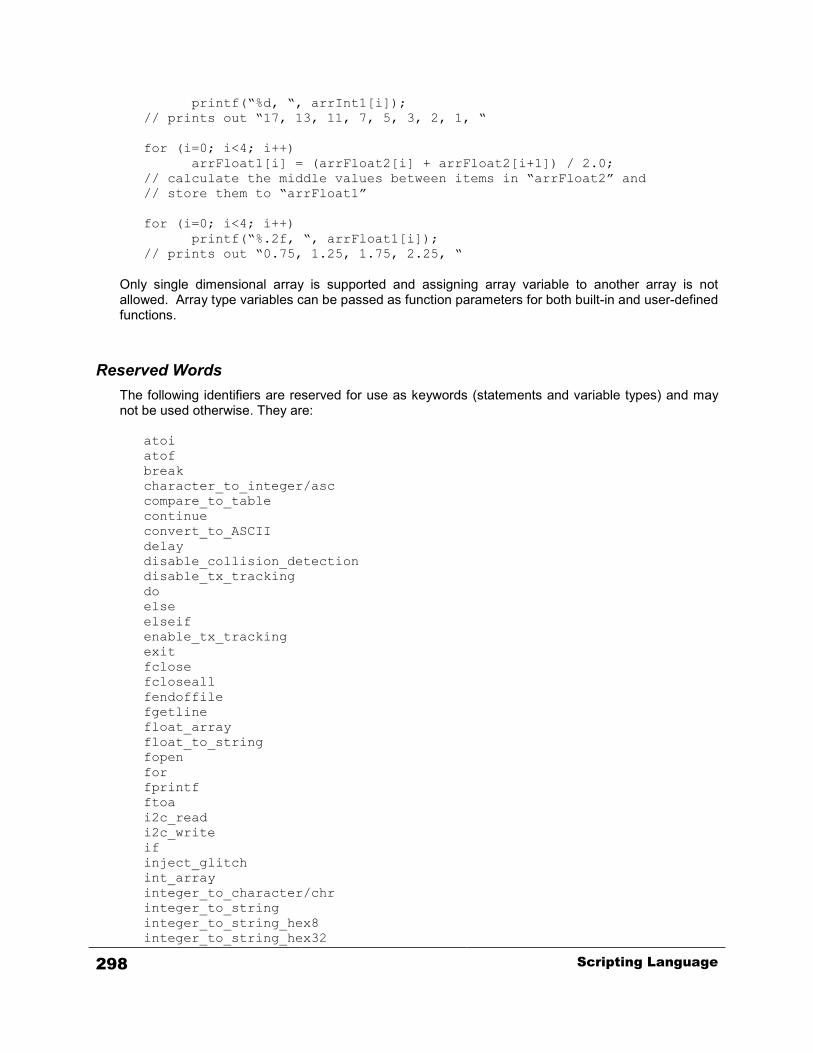
printf(“%d, “, arrInt1[i]); // prints out “17, 13, 11, 7, 5, 3, 2, 1, “ for (i=0; i<4; i++) arrFloat1[i] = (arrFloat2[i] + arrFloat2[i+1]) / 2.0; // calculate the middle values between items in “arrFloat2” and // store them to “arrFloat1” for (i=0; i<4; i++) printf(“%.2f, “, arrFloat1[i]); // prints out “0.75, 1.25, 1.75, 2.25, “
Only single dimensional array is supported and assigning array variable to another array is not allowed. Array type variables can be passed as function parameters for both built-in and user-defined functions.
Reserved Words The following identifiers are reserved for use as keywords (statements and variable types) and may not be used otherwise. They are:
atoi atof break character_to_integer/asc compare_to_table continue convert_to_ASCII delay disable_collision_detection disable_tx_tracking do else elseif enable_tx_tracking exit fclose fcloseall fendoffile fgetline float_array float_to_string fopen for fprintf ftoa i2c_read i2c_write if inject_glitch int_array integer_to_character/chr integer_to_string integer_to_string_hex8 integer_to_string_hex32
298 Scripting Language
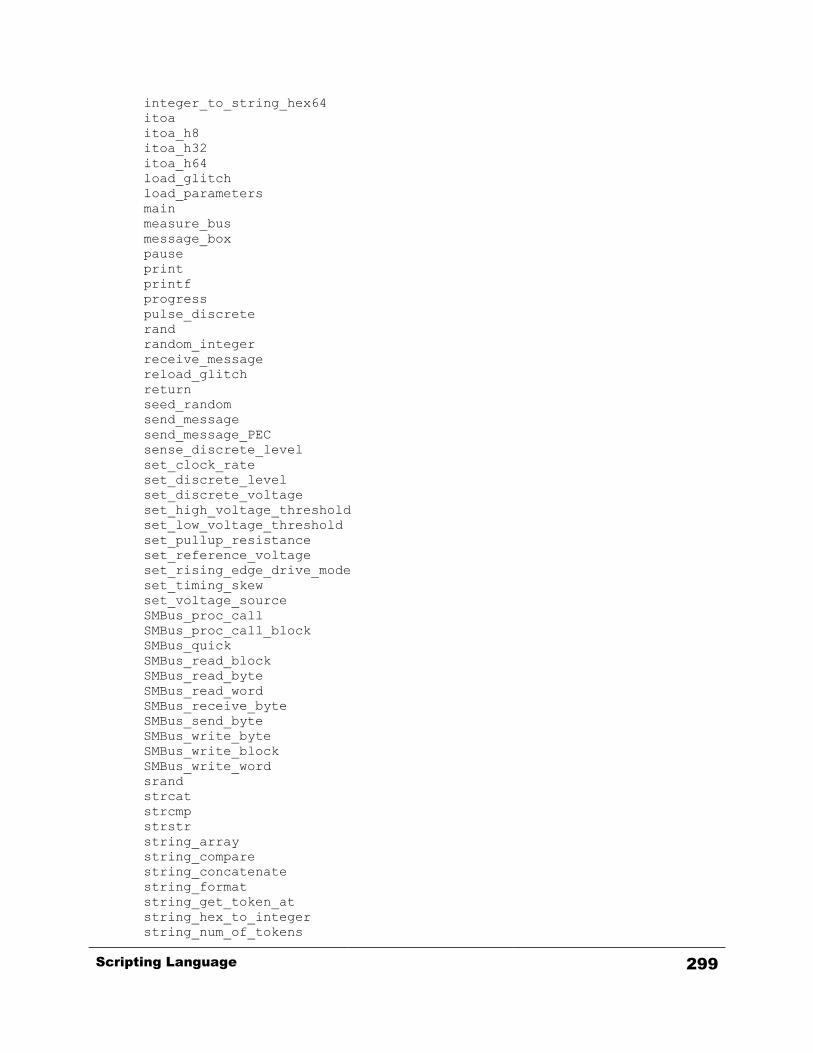
integer_to_string_hex64 itoa itoa_h8 itoa_h32 itoa_h64 load_glitch load_parameters main measure_bus message_box pause print printf progress pulse_discrete rand random_integer receive_message reload_glitch return seed_random send_message send_message_PEC sense_discrete_level set_clock_rate set_discrete_level set_discrete_voltage set_high_voltage_threshold set_low_voltage_threshold set_pullup_resistance set_reference_voltage set_rising_edge_drive_mode set_timing_skew set_voltage_source SMBus_proc_call SMBus_proc_call_block SMBus_quick SMBus_read_block SMBus_read_byte SMBus_read_word SMBus_receive_byte SMBus_send_byte SMBus_write_byte SMBus_write_block SMBus_write_word srand strcat strcmp strstr string_array string_compare string_concatenate string_format string_get_token_at string_hex_to_integer string_num_of_tokens
Scripting Language 299

string_substring string_to_float string_to_integer then while
Statements The following statements are supported:
if (expression)
statement or block of statements elseif (expression)
statement or block of statements else
statement or block of statements while (expression)
statement or block of statements do
statement or block of statements . . break; . . statement or block of statements . . continue; . . statement or block of statements
while (expression); return; return expression; for ( expression; expression; expression) statement or block of statements . . break; . . continue; . . statement or block of statements
300 Scripting Language

Operators There are four arithmetic, seven logical and five bitwise operators.
The arithmetic ones are:
Operator + sums two variables Operator – find difference between two numbers Operator * multiples two numbers Operator / divides two numbers Operator % yield reminder from the division of two numbers Operator ++ increment Operator -- decrement
Type of results is always a 64-bit integer. The logical operators are:
Operator || performs logical disjunction on 2 expressions Operator && performs logical conjunction on 2 expressions Operator > performs logical greater than comparison Operator < performs logical smaller than comparison Operator >= performs logical greater than or equal to Operator <= performs logical smaller than or equal to Operator != performs logical negation on an expression Operator == performs logical equality on an expression
Type of results is always an Integer value representing TRUE (1) or FALSE (0). The bitwise operators are:
Operator << bit-shift left Operator >> bit-shift right Operator ~ bitwise inverse Operator & bitwise AND Operator | bitwise OR
Strings A string is represented as a sequence of characters surrounded by double quotes, as in “…”. A string has the type “array of characters” and is initialized with the given character ASCII code bytes. Unlike the C programming language, individual characters in the string cannot be accessed.
Comments There are two types of comments: block comments and line comments.
The characters /* introduce a block comment, which terminates with the characters */. Block comments do not nest. Once a block comment has begun, all text afterwards is considered a comment until */ is seen. The characters // introduce a line comment. They may appear anywhere in a line. Any characters after the characters // to the end of the line are considered to be comments, and are ignored. The next line following a line comment is “back to normal” and is no longer considered a comment.
Legal Identifiers
Scripting Language 301

Legal identifiers are a sequence of letters and digits (no white-space), which comprise variables or function names. The first character must be a letter. The underscore _ counts as a letter. Identifiers are case sensitive, so “test” is considered a different identifier than “Test”.
Built-in Constants
TRUE: integer value 1 FALSE: integer value 0
Example Script // EEPROM Test Script main() { // device info nAddr = 0xA0; b10Bit = FALSE; // test output variables PAGE = "00 00 "; strOutBytes = "02 FE 04 FC 00"; // display output bytes print(strOutBytes); print("\n"); // combine page number & output bytes for sending strTemp = string_concatenate(PAGE, strOutBytes); // send msg send_message(nAddr, b10Bit, strTemp, TRUE); // update progress bar - 33% progress(33); // break // (needed because EEPROM expects more data to be sent) nCount = 0; do { // send 0x00 up to 5 time, until ACK strResult = send_message(nAddr, b10Bit, "00", TRUE); if( ++nCount == 5 ) break; } while( string_compare(strResult, "Address byte NAKed") == 0 ); // update progress bar - 66% progress(66); // read back bytes from page 0 send_message(nAddr, b10Bit, PAGE, FALSE); strInBytes = receive_message(nAddr, FALSE, 5, TRUE); // display input bytes
302 Scripting Language
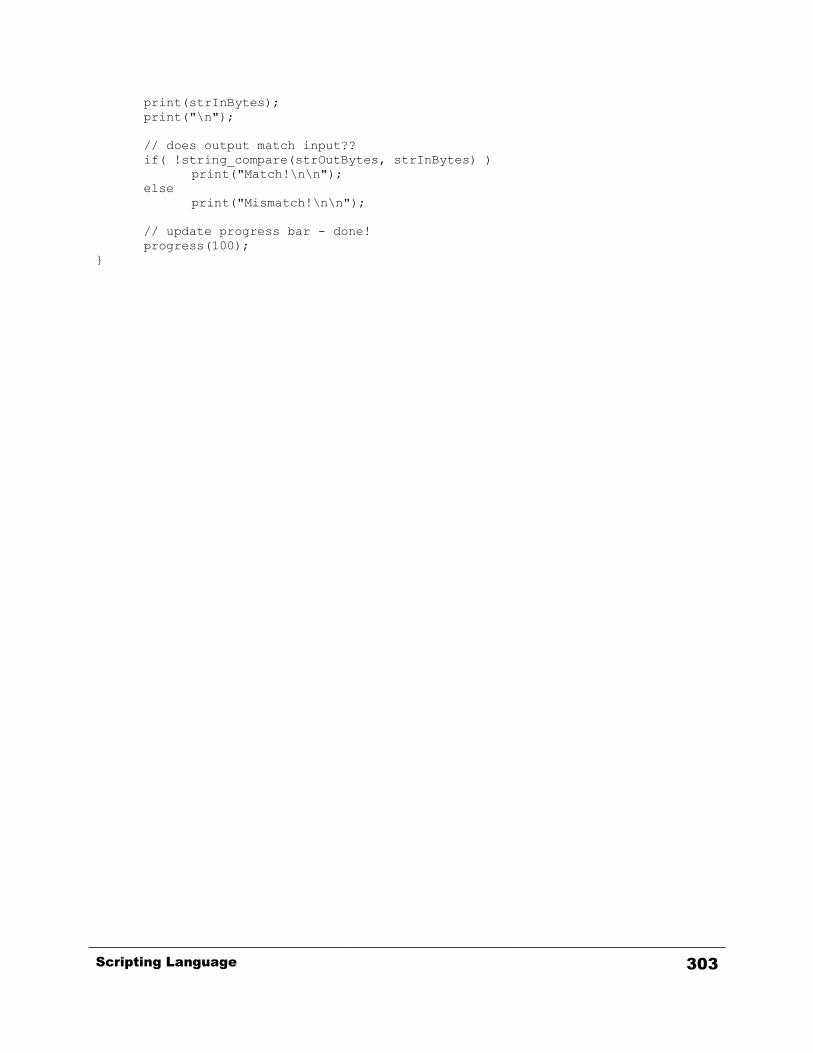
print(strInBytes); print("\n"); // does output match input?? if( !string_compare(strOutBytes, strInBytes) ) print("Match!\n\n"); else print("Mismatch!\n\n"); // update progress bar - done! progress(100); }
Scripting Language 303

Built-in Functions: Summary The I2C Exerciser script language does not support the usage of the standard “C” libraries, nor does it allow importing of external libraries. Therefore, the following built-in functions are provided as a substitute.
Function Description
character_to_integer()
asc()
Converts a character into an integer value, which represents the character’s ASCII code.
compare_to_table() Performs a comparison of a value with the parameter specified in a table file.
convert_to_ASCII() Converts a string containing a list of bytes in hexadecimal format into a string of corresponding ASCII characters.
delay() Adds delay between transactions for the specified amount of microseconds.
disable_collision_detection() Disables the Collision Detection mechanism.
disable_tx_tracking() Turns off the transmission tracking feature.
enable_tx_tracking() Turns on the transmission tracking feature.
exit() Terminates script execution and passes an exit code back to the application.
fclose() Closes a file opened for IO earlier.
fcloseall() Closes all files opened for IO earlier.
fendoffile() Determines whether the end of a file has been reached during fgetline() function.
fgetline() Reads in a line of text from a file. The fopen function must be called before using this function.
float_array() Declares and initializes an array of floating point numbers.
float_to_string() Converts a floating point input to a decimal string representation of that floating point value.
fopen() Opens a file for writing and reading.
fprintf() Writes a formatted string to the specified file.
i2c_read() Reads data from the specified target slave address.
i2c_write() Writes data to the specified target slave address.
inject_glitch() Injects previously loaded glitch pattern to the target bus.
int_array() Declares and initializes an array of integers.
integer_to_character()
chr() Converts an ASCII code into a character.
304 Scripting Language
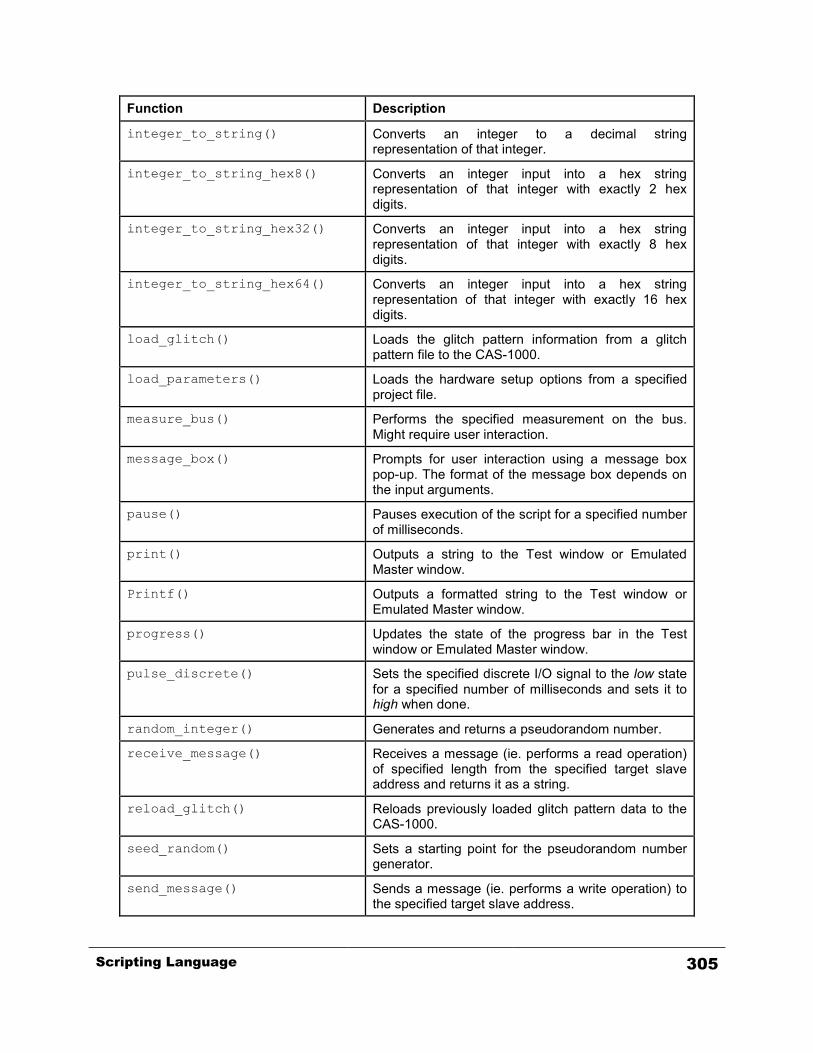
Function Description
integer_to_string() Converts an integer to a decimal string representation of that integer.
integer_to_string_hex8() Converts an integer input into a hex string representation of that integer with exactly 2 hex digits.
integer_to_string_hex32() Converts an integer input into a hex string representation of that integer with exactly 8 hex digits.
integer_to_string_hex64() Converts an integer input into a hex string representation of that integer with exactly 16 hex digits.
load_glitch() Loads the glitch pattern information from a glitch pattern file to the CAS-1000.
load_parameters() Loads the hardware setup options from a specified project file.
measure_bus() Performs the specified measurement on the bus. Might require user interaction.
message_box() Prompts for user interaction using a message box pop-up. The format of the message box depends on the input arguments.
pause() Pauses execution of the script for a specified number of milliseconds.
print() Outputs a string to the Test window or Emulated Master window.
Printf() Outputs a formatted string to the Test window or Emulated Master window.
progress() Updates the state of the progress bar in the Test window or Emulated Master window.
pulse_discrete() Sets the specified discrete I/O signal to the low state for a specified number of milliseconds and sets it to high when done.
random_integer() Generates and returns a pseudorandom number.
receive_message() Receives a message (ie. performs a read operation) of specified length from the specified target slave address and returns it as a string.
reload_glitch() Reloads previously loaded glitch pattern data to the CAS-1000.
seed_random() Sets a starting point for the pseudorandom number generator.
send_message() Sends a message (ie. performs a write operation) to the specified target slave address.
Scripting Language 305

Function Description
send_message_PEC() Sends a message (ie. performs a write operation) with a SMBus Packet Error Checking (PEC) byte to the specified target slave address.
sense_discrete_level() Senses the state of the specified discrete I/O signal and return it as a string.
set_discrete_voltage() Sets a new TTL voltage level for the high state of the discrete I/O signals.
set_clock_rate() Sets the SCL signal clock rate of the analyzer to the specified value in KHz.
set_discrete_level() Sets the static state of the specified discrete I/O line.
set_high_voltage_threshold() Sets the high threshold voltage of the analyzer to the specified value in Volts.
set_low_voltage_threshold() Sets the low threshold voltage of the analyzer to the specified value in Volts.
set_pullup_resistance () Sets the pull-up resistance of the analyzer for both SDA and SCL signals to the specified value in Ohms.
set_reference_voltage() Sets the reference voltage level for analyzer supplied voltage.
set_rising_edge_drive_mode() Sets the rising edge drive mode of the analyzer to the specified value.
set_timing_skew() Sets the timing skew parameters such as setup time and hold time.
set_voltage_source() Sets the bus reference voltage source as either provided by the target or by the analyzer.
SMBus_proc_call() Performs SMBus Process Call operation, which sends a command with a word of data to a slave and receives a word of data back from the slave as the return value.
SMBus_proc_call_block() Performs SMBus Block Write – Block Read Process Call operation, which sends a command with a block of data to a slave and receives a block of data back from the slave as the return value.
SMBus_quick() Performs SMBus Quick command operation, which sends a slave address with a R/W# bit.
SMBus_read_block() Performs SMBus Block Read operation, which sends a command and receives a block of data from a slave.
SMBus_read_byte() Performs SMBus Read byte operation, which sends a command and receives a byte of data from a slave.
SMBus_read_word() Performs SMBus Read word operation, which sends a command and receives a word of data from a slave.
306 Scripting Language
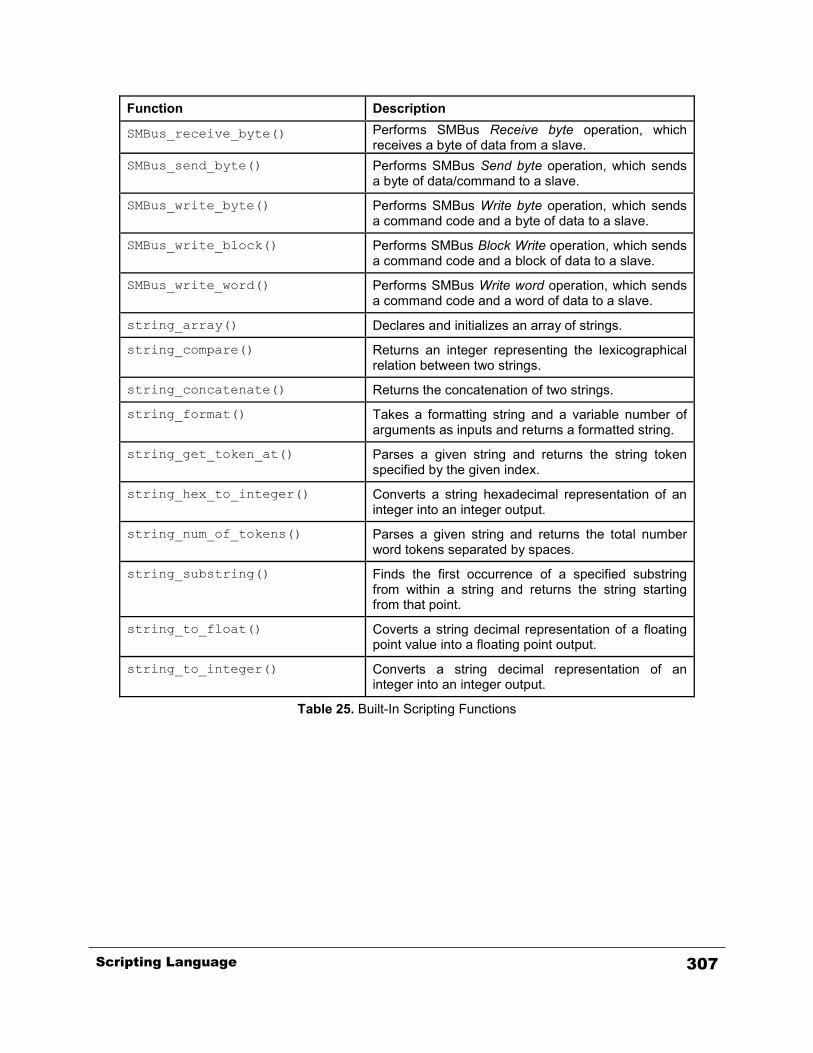
Function Description
SMBus_receive_byte() Performs SMBus Receive byte operation, which receives a byte of data from a slave.
SMBus_send_byte() Performs SMBus Send byte operation, which sends a byte of data/command to a slave.
SMBus_write_byte() Performs SMBus Write byte operation, which sends a command code and a byte of data to a slave.
SMBus_write_block() Performs SMBus Block Write operation, which sends a command code and a block of data to a slave.
SMBus_write_word() Performs SMBus Write word operation, which sends a command code and a word of data to a slave.
string_array() Declares and initializes an array of strings.
string_compare() Returns an integer representing the lexicographical relation between two strings.
string_concatenate() Returns the concatenation of two strings.
string_format() Takes a formatting string and a variable number of arguments as inputs and returns a formatted string.
string_get_token_at() Parses a given string and returns the string token specified by the given index.
string_hex_to_integer() Converts a string hexadecimal representation of an integer into an integer output.
string_num_of_tokens() Parses a given string and returns the total number word tokens separated by spaces.
string_substring() Finds the first occurrence of a specified substring from within a string and returns the string starting from that point.
string_to_float() Coverts a string decimal representation of a floating point value into a floating point output.
string_to_integer() Converts a string decimal representation of an integer into an integer output.
Table 25. Built-In Scripting Functions
Scripting Language 307

Built-In Functions: Detailed Descriptions
character_to_integer() / asc()
Description:
Converts a character into an integer value, which represents the character’s ASCII code. Used In:
Master Emulation, Test Prototype: character_to_integer (strValue) asc(strValue) Example Call: strVal = "A"; nVal = character_to_integer(strVal); // nVal will be 65 nVal = asc("B"); // nVal will be 66 Input Parameters:
strValue: One character long string to be converted into a decimal value representing an ASCII code of the character. If string is more than one character
Return Value:
The integer value of the input character’s ASCII code.
308 Scripting Language
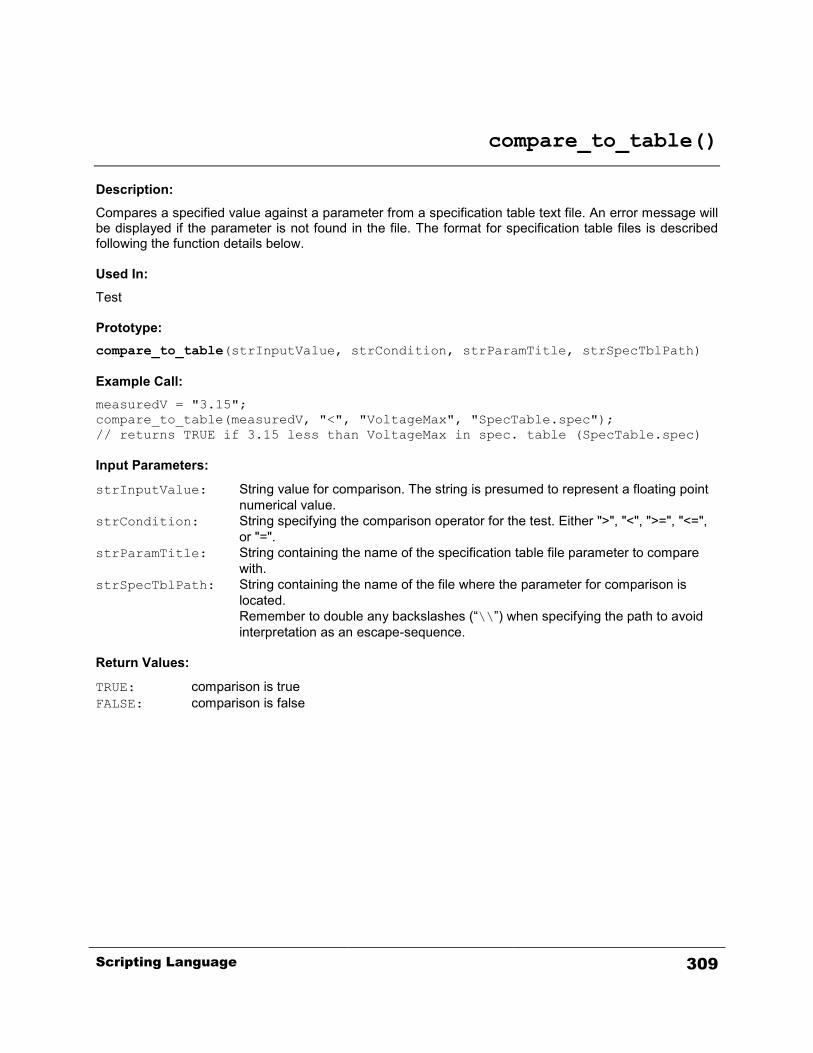
compare_to_table()
Description:
Compares a specified value against a parameter from a specification table text file. An error message will be displayed if the parameter is not found in the file. The format for specification table files is described following the function details below. Used In:
Test Prototype: compare_to_table(strInputValue, strCondition, strParamTitle, strSpecTblPath) Example Call: measuredV = "3.15"; compare_to_table(measuredV, "<", "VoltageMax", "SpecTable.spec"); // returns TRUE if 3.15 less than VoltageMax in spec. table (SpecTable.spec) Input Parameters:
strInputValue: String value for comparison. The string is presumed to represent a floating point numerical value.
strCondition: String specifying the comparison operator for the test. Either ">", "<", ">=", "<=", or "=".
strParamTitle: String containing the name of the specification table file parameter to compare with.
strSpecTblPath: String containing the name of the file where the parameter for comparison is located. Remember to double any backslashes (“\\”) when specifying the path to avoid interpretation as an escape-sequence.
Return Values:
TRUE: comparison is true FALSE: comparison is false
Scripting Language 309

Specification Table Files Specification table files are simple text files based on the Windows .INI file format. They consist of a section label, “[main]”, followed by a list of variable names and assigned values. Comments can be included in the file by preceding text with a semicolon (“;”). The following is an example of a specification table file:
; SpecTable.spec ; <= comment [main] ; <= section label VoltageMax = "3.50" VoltageMin = "3.00"
NOTE: Comments are not allowed on the variable lines.
310 Scripting Language
convert_to_ASCII()
Description:
Converts a string containing a list of bytes in hexadecimal format into a string of corresponding ASCII characters. This function is useful for translating and printing the string value returned by the "receive_message" function in ASCII character format. Used In:
Master Emulation, Test Prototype: convert_to_ASCII(strValue, nCharsPerLine=0) Example Call: strRet = "41 42 43 44 45 46 47 48 49 4A 4B 4C 4D 4E 4F"; strASCII = convert_to_ASCII(strRet, 4); // convert to ASCII characters print(strASCII); // display 4 chars per line // output: // ABCD // EFGH // IJKL // MNO Input Parameters:
strValue: String containing a list of bytes in hexadecimal format. Each byte must be separated by a white space.
nCharsPerLine: Number of characters to be grouped as a single line when printing the output string. A new line character will be inserted after every nCharsPerLine characters. This parameter is optional with the default value of “0”, which disables the feature.
Return Value:
A string value representing the ASCII characters.
Scripting Language 311
delay()
Description:
Adds delay between transactions for the specified amount of microseconds. This function is effective only when the transaction tracking is disabled. To disable the transaction tracking, call the ‘disable_tx_tracking’ function. Used In:
Master Emulation, Test Prototype: delay(nMicroseconds) Example Call: disable_tx_tracking(); // disable transaction tracking send_message(0xA0, FALSE, "AA BB CC", TRUE); delay(100); // insert delay of 100 us between transactions receive_message(0xA0, FALSE, 3, TRUE); Input Parameters:
nMicroseconds: Integer indicating amount of time to be delayed in microseconds. Return Value:
None
312 Scripting Language
disable_collision_detection()
Description:
Disables the Collision Detection mechanism, which allows the CAS-1000-I2C driving (emulating master) to proceed even on buses with slow-rising edges. Used In:
Master Emulation, Test Prototype: disable_collision_detection(bDisable) Example Call: disable_collision_detection(1); //disables the collision detection Input Parameters:
bDisable: Integer indicating the disable/enable mode to be set. “1” for disable and “0” for enable.
Return Value:
TRUE: configuration set successfully FALSE: configuration failed
Scripting Language 313

disable_tx_tracking()
Description:
Turns off the transmission tracking feature, which tracks and verifies transactions generated by the analyzer. By default, the transaction tracking is enabled at the start of every script run session. You may use this function to turn off the feature. While the tracking is enabled, the read or write transaction generated by the CAS-1000 is tracked until the result is captured and returned by the Monitor. If the Monitor is unable to capture the matching transaction from the bus within 2 seconds, the transactions will be timed out. Also, if the target slave is not responding to the address sent, the returning string of the ‘send_message’ and ‘receive_message’ functions will indicate that the address is NAK’d. Since the ‘send_message’ and ‘receive_message’ functions wait until the result of the transaction when the tracking is on, there will be a gap (> 1ms) between back to back transactions. Also note that when this feature is disabled, the ‘receive_message’ function will not be able to return the bytes read from the target. You have to refer to the Monitor’s trace list for the data in this case. Used In:
Master Emulation, Test Prototype: disable_tx_tracking(); Example Call: // disable transaction tracking disable_tx_tracking(); // generate multiple transactions with no gaps send_message(0x18, FALSE, "00 01", TRUE); receive_message(0x18, FALSE, 4, TRUE); send_message(0x18, FALSE, "00 02", TRUE); receive_message(0x18, FALSE, 4, TRUE); // re-enable transaction tracking enable_tx_tracking(); Input Parameters:
None Return Value:
None
314 Scripting Language
enable_tx_tracking()
Description:
Turns on the transmission tracking feature, which tracks and verifies transactions generated by the analyzer. By default, the transaction tracking is enabled at the start of every script run session. You may use the ‘disable_tx_tracking’ function to turn off the feature. While the tracking is enabled, the read or write transaction generated by the CAS-1000 is tracked until the result is captured and returned by the Monitor. If the Monitor is unable to capture the matching transaction from the bus within 2 seconds, the transactions will be timed out. Also, if the target slave is not responding to the address sent, the returning string of the ‘send_message’ and ‘receive_message’ functions will indicate that the address is NAK’d. Since the ‘send_message’ and ‘receive_message’ functions wait until the result of the transaction when the tracking is on, there will be a gap (> 1ms) between back to back transactions. Also note that when this feature is disabled, the ‘receive_message’ function will not be able to return the bytes read from the target. You have to refer to the Monitor’s trace list for the data in this case. Used In:
Master Emulation, Test Prototype: enable_tx_tracking(); Example Call: // disable transaction tracking disable_tx_tracking(); // generate multiple transactions with no gaps send_message(0x18, FALSE, "00 01", TRUE); receive_message(0x18, FALSE, 4, TRUE); send_message(0x18, FALSE, "00 02", TRUE); receive_message(0x18, FALSE, 4, TRUE); // re-enable transaction tracking enable_tx_tracking(); Input Parameters:
None Return Value:
None
Scripting Language 315

exit()
Description:
Terminates execution of the script and passes an exit code back to the application. An exit code of zero indicates a “pass” condition and a non-zero exit code indicates a “fail” condition. Used In:
Test Prototype: exit(nExitCode = 0) Used In:
Master Emulation, Slave Emulation, Test Example Calls: exit(); //exit the program with a pass condition exit(20); //exit the program with error condition 20 Input Parameters:
nExitCode: An integer value indicating the error condition. A value of 0 indicates a pass condition. This parameter can be omitted, causing the default value of 0 to be used.
Return Value:
None
316 Scripting Language
fclose()
Description:
Closes a file opened earlier. Used In:
Master Emulation, Test Prototype: fclose(hFile) Example Call: myFile = fopen("C:\\temp\\output.txt", 0); // open file to overwrite fprintf(myFile, "AB CD 12 34"); // write string to file fclose(myFile); // close file Input Parameters:
hFile: Handle of the file to close. Return Values:
None.
Scripting Language 317
fcloseall()
Description:
Closes all files opened earlier. Used In:
Master Emulation, Test Prototype: fcloseall() Example Call: myFile1 = fopen("C:\\temp\\output1.txt", 0); // open file to overwrite fprintf(myFile1, "12 34 56 78"); // write string to file myFile2 = fopen("C:\\temp\\output2.txt", 0); // open file to overwrite fprintf(myFile2, "AA BB CC DD"); // write string to file fcloseall(); // close all files Input Parameters:
None. Return Values:
None.
318 Scripting Language

fendoffile()
Description:
Determines whether the end of a file has been reached during fgetline() function. It is typically used in combination with a loop. If the file has not been read, it will return 0. Used In:
Master Emulation, Test Prototype: fendoffile(hFile) Example Call: myFile = fopen("c:\\temp\\output.txt"); // open a file for read while(!fendoffile(myFile)) // check for EOF { strLine = fgetline(myFile, "%s"); // read a line from file print(strLine); // print to screen } fclose(myFile); // close the file Input Parameters:
hFile: Handle of the file to check. Return Values:
None.
Scripting Language 319
fgetline()
Description:
Reads in a line of text from a file. The fopen function must be called before using this function. The format for the value to be returned is similar to the standard C functions, fprintf() and fscanf(). Used In:
Master Emulation, Test Prototype: fgetline(hFile, FormatString) Example Call: myFile = fopen("c:\\temp\\input.txt"); // open a file for read while(!fendoffile(myFile)) // check for EOF { strLine = fgetline(myFile, "%s"); // read a line from file print(strLine); // print to screen print("\n"); } fclose(myFile); // close the file Input Parameters:
hFile: Handle of the file to read from. FormatString: Format string. Refer to the string_format() function for the detailed
description. Return Values:
The formatted value of the line. It can be a string, integer, or float. An empty string is returned if the end of file has been reached before the read.
320 Scripting Language
float_array()
Description:
Declares and initializes an array of floating point numbers. Used In:
Master Emulation, Test Prototype: float_array(f1, f2, ...) Example Call: arrFloat1 = float_array(); // declares a new array variable "arrFloat1" arrFloat2 = float_array(0.5, 1.0, 1.5, 2.0, 2.5); // declares a new array variable "arrFloat2" and // initializes the values of first five items printf("arrFloat2[3] = %.2f", arrFloat2[3]); // // expected output: // // arrFloat2[3] = 2.00 //
Input Parameters:
f1, f2, ... : A variable number floating point numbers to be used as initial values.
Return Values:
A new array object to be assigned to a floating point array variable.
Scripting Language 321

float_to_string()
Description:
Converts a floating point input to a decimal string representation of that floating point value. Used In:
Master Emulation, Test Prototype: float_to_String(fValue) Example Call: fVal = 3.14; str = float_to_string(fVal); print(str); // print "3.14" Input Parameters:
fValue: The value of the float to convert to a string. Return Value:
A string containing the decimal representation of the input floating point value.
322 Scripting Language
fopen()
Description:
Opens a file for writing and reading. If the file does not exist, it will be created. If no path is specified, the file is assumed to be located in the local path of the script file. Used In:
Master Emulation, Test Prototype: fopen(strFilename, bAppend = 1) Example Call: myFile1 = fopen("C:\\temp\\output1.txt", 0); // open file to overwrite fprintf(myFile1, "12 34 56 78"); // write string to file fclose(myFile1); // close file myFile2 = fopen("C:\\temp\\output2.txt", 1); // open file to append fprintf(myFile2, "AA BB CC DD"); // write string to file fclose(myFile2); // close file myFile3 = fopen("c:\\temp\\input.txt"); // open file to read strLine = fgetline(myFile3, "%s"); // read a line from file print(strLine); // print to screen fclose(myFile3); // close file Input Parameters:
strFilename: Name of file to be opened including path. Use double back slash (“\\”) instead of single (“\”) when specifying a path.
bAppend: Optional flag for file append for writing. The value ‘0’ (FALSE) specifies the file is to be overwritten. The value ‘1’ (TRUE) specifies the files it be appended when written to it. The default value is ‘1’ when not specified.
Return Values:
Handle of the file opened.
Scripting Language 323

fprintf()
Description:
Writes a formatted string to the specified file. Used In:
Master Emulation, Test Prototype: fprintf(hFile, FormatString, arg1, arg2, ...) Example Call: nNum = 3; nAddr = 0x9A; myFile = fopen("c:\\temp\\output.txt"); fprintf(myFile, "Address number %d is: 0x%02X \n", nNum, nAddr); // string written to file: "Address number 3 is 0x9A \n" Input Parameters:
hFile: Handle of the file to write to. FormatString: Format string. Refer to the string_format() function for the detailed
description. arg1, arg2, etc: Variable number of arguments used in the format string. Return Values:
1: write completed successfully 0: write failed
324 Scripting Language
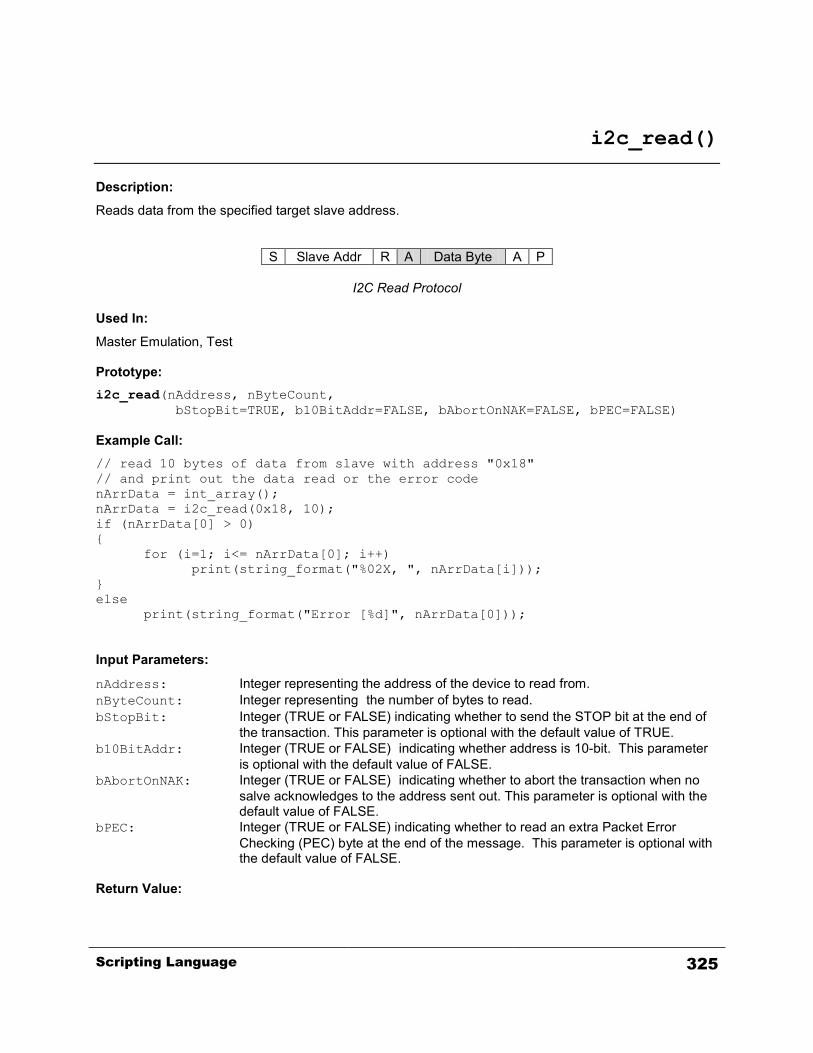
i2c_read()
Description:
Reads data from the specified target slave address.
S Slave Addr R A Data Byte A P
I2C Read Protocol Used In:
Master Emulation, Test Prototype: i2c_read(nAddress, nByteCount, bStopBit=TRUE, b10BitAddr=FALSE, bAbortOnNAK=FALSE, bPEC=FALSE) Example Call: // read 10 bytes of data from slave with address "0x18" // and print out the data read or the error code nArrData = int_array(); nArrData = i2c_read(0x18, 10); if (nArrData[0] > 0) { for (i=1; i<= nArrData[0]; i++) print(string_format("%02X, ", nArrData[i])); } else print(string_format("Error [%d]", nArrData[0])); Input Parameters:
nAddress: Integer representing the address of the device to read from. nByteCount: Integer representing the number of bytes to read. bStopBit: Integer (TRUE or FALSE) indicating whether to send the STOP bit at the end of
the transaction. This parameter is optional with the default value of TRUE. b10BitAddr: Integer (TRUE or FALSE) indicating whether address is 10-bit. This parameter
is optional with the default value of FALSE. bAbortOnNAK: Integer (TRUE or FALSE) indicating whether to abort the transaction when no
salve acknowledges to the address sent out. This parameter is optional with the default value of FALSE.
bPEC: Integer (TRUE or FALSE) indicating whether to read an extra Packet Error Checking (PEC) byte at the end of the message. This parameter is optional with the default value of FALSE.
Return Value:
Scripting Language 325

An array of integers storing the block of data read from the slave. The array elements at index [1] through [N] represents the data bytes received, and the first element (index [0]) of the array represents the number of bytes or the error code returned as described below. > 0: Number of data bytes received. 0: Unknown result. Transaction result was not tracked. -1: Transaction error. Error occurred during operation. -2: NACK. No acknowledgement received from slave. -3: Transaction timed out. Failed to detect transaction from the bus on time.
326 Scripting Language
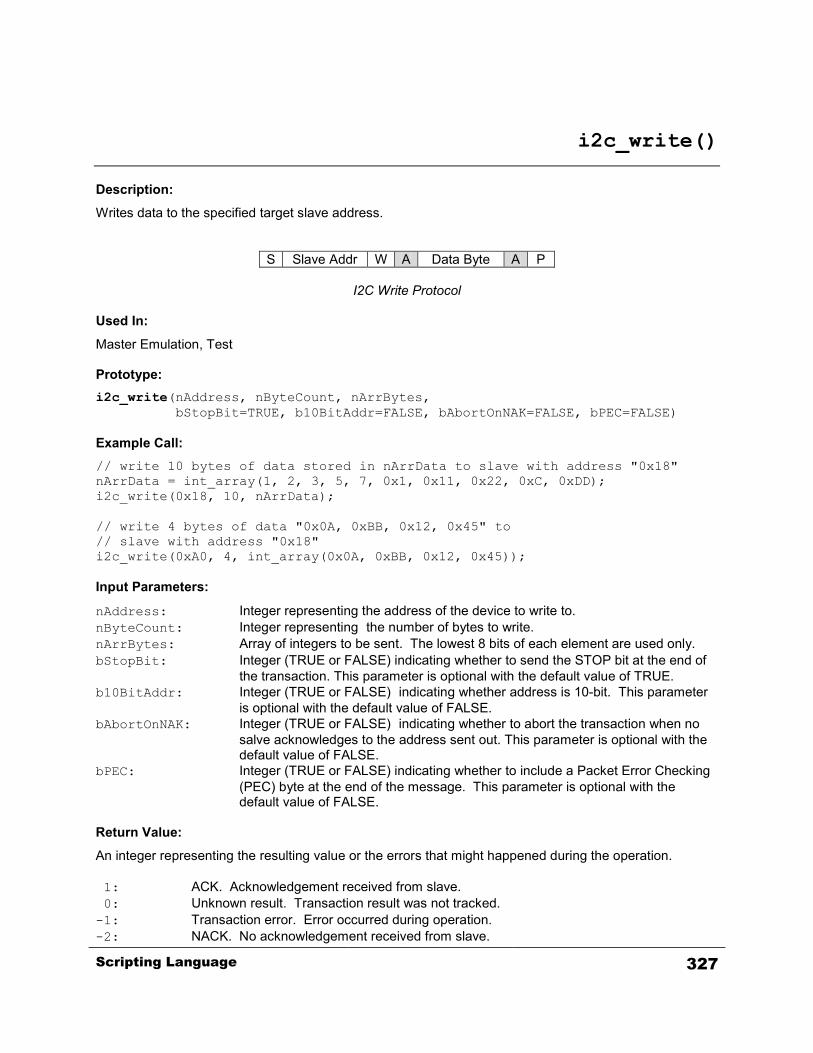
i2c_write()
Description:
Writes data to the specified target slave address.
S Slave Addr W A Data Byte A P
I2C Write Protocol Used In:
Master Emulation, Test Prototype: i2c_write(nAddress, nByteCount, nArrBytes, bStopBit=TRUE, b10BitAddr=FALSE, bAbortOnNAK=FALSE, bPEC=FALSE) Example Call: // write 10 bytes of data stored in nArrData to slave with address "0x18" nArrData = int_array(1, 2, 3, 5, 7, 0x1, 0x11, 0x22, 0xC, 0xDD); i2c_write(0x18, 10, nArrData); // write 4 bytes of data "0x0A, 0xBB, 0x12, 0x45" to // slave with address "0x18" i2c_write(0xA0, 4, int_array(0x0A, 0xBB, 0x12, 0x45)); Input Parameters:
nAddress: Integer representing the address of the device to write to. nByteCount: Integer representing the number of bytes to write. nArrBytes: Array of integers to be sent. The lowest 8 bits of each element are used only. bStopBit: Integer (TRUE or FALSE) indicating whether to send the STOP bit at the end of
the transaction. This parameter is optional with the default value of TRUE. b10BitAddr: Integer (TRUE or FALSE) indicating whether address is 10-bit. This parameter
is optional with the default value of FALSE. bAbortOnNAK: Integer (TRUE or FALSE) indicating whether to abort the transaction when no
salve acknowledges to the address sent out. This parameter is optional with the default value of FALSE.
bPEC: Integer (TRUE or FALSE) indicating whether to include a Packet Error Checking (PEC) byte at the end of the message. This parameter is optional with the default value of FALSE.
Return Value:
An integer representing the resulting value or the errors that might happened during the operation. 1: ACK. Acknowledgement received from slave. 0: Unknown result. Transaction result was not tracked. -1: Transaction error. Error occurred during operation. -2: NACK. No acknowledgement received from slave.
Scripting Language 327

-3: Transaction timed out. Failed to detect transaction from the bus on time.
328 Scripting Language
inject_glitch()
Description:
Injects previously loaded glitch pattern to the target bus immediately, without waiting for any armed trigger event. This function allows you to bypass the arming and triggering sequence of glitch injection. The ‘load_glitch’ or ‘reload_glitch’ function must be called prior to calling this function. Used In:
Master Emulation, Test Prototype: inject_glitch(); Example Call: // loads a glitch pattern from the 'simple1.gpf' file and // injects it to the target bus immediately load_glitch("C:\\test\\simple1.gpf", FALSE); // bArmGlitch="don’t_care" here inject_glitch(); // inject glitch pattern now Input Parameters:
None Return Value:
None
Scripting Language 329
int_array()
Description:
Declares and initializes an array of integers. Used In:
Master Emulation, Test Prototype: Int_array(n1, n2, ...) Example Call: arrInt1 = int_array(); // declares a new array variable "arrInt1" arrInt2 = int_array(1, 2, 3, 5, 7, 11, 13, 17); // declares a new array variable "arrInt2" and //initializes the values of first eight items printf("arrInt2[3] = %d", arrInt2[3]); // // expected output: // // arrInt2[3] = 5 //
Input Parameters:
n1, n2, ... : A variable number integer numbers to be used as initial values.
Return Values:
A new array object to be assigned to an integer array variable.
330 Scripting Language

integer_to_character() / chr()
Description:
Converts an ASCII code into a character. Used In:
Master Emulation, Test Prototype: integer_to_character(nValue) chr(nValue) Example Call: nVal = 65; strVal = integer_to_character(nVal); // strVal will be "A" strVal = chr(66); // strVal will be "B" Input Parameters:
nValue: ASCII code value to be converted into a character. Return Value:
A string representing the character converted from the ASCII code.
Scripting Language 331
integer_to_string()
Description:
Converts an integer to a decimal string representation of that integer. Used In:
Master Emulation, Test Prototype: integer_to_string(nValue) Example Call: nVal = 253; str = integer_to_string(nVal); print(str); // print "253" Input Parameters:
nValue: The value of the integer to convert to a string. Return Value:
A string containing the decimal representation of the input integer value.
332 Scripting Language

integer_to_string_hex8()
Description:
Converts the integer input into a string containing the hex representation of the integer. The returned string will have exactly 2 hex digits. If the value passed in is larger than 0xFF, the least significant 8 bits are used. Used In:
Master Emulation, Test Prototype: integer_to_string_hex8(nValue) Example Call: strSlave = integer_to_string_hex8(0x9A); //slave address is at "9A" Input Parameters:
nValue: the value of the integer to convert to a string. If the value is larger than 0xFF, the least significant 8 bits are used.
Return Value:
A string with exactly 2 digits containing the hexadecimal representation of the least significant 8 bits of the input integer value.
Scripting Language 333
integer_to_string_hex32()
Description:
Converts the integer input into a string containing the hex representation of the integer. The returned string will have exactly 8 hex digits. If the value passed in is larger than 0xFFFFFFFF, the least significant 32 bits are used. Used In:
Master Emulation, Test Prototype: integer_to_string_hex32(nValue) Example call: address = 43323; //convert 43323 to hex string: "0000A93B" address32 = integer_to_string_hex32(address); Input Parameters:
nValue: The value of the integer to convert to a string. If value is larger than 0xFFFFFFFF, the least significant 32 bits are used.
Return Value:
A string with exactly 8 digits containing the hexadecimal representation of the least significant 32 bits of the input integer value.
334 Scripting Language
integer_to_string_hex64()
Description:
Converts the integer input into a string containing the hex representation of the integer. The returned string will have exactly 16 hex digits. Used In:
Master Emulation, Test Prototype: integer_to_string_hex64(nValue) Example Call: index = 1; address64 = integer_to_string_hex64(0xFFFFFFFF80020000+index); Input Parameters:
nValue: The value of the integer to convert to a string Return Value:
A string with exactly 16 digits containing the hexadecimal representation of the input integer value.
Scripting Language 335
load_glitch()
Description:
Loads the glitch pattern information from a glitch pattern file (*.gpf) to the CAS-1000. This function must be called prior to a glitch injection. Depending on the second parameter, the trigger will be armed immediately or armed when the ‘ARM_GLITCH’ keyword is encountered during a ‘send_message’ operation. The actual injection of the glitch happens when the armed trigger condition is met. Used In:
Master Emulation, Test Prototype: load_glitch(strGPFPath, bArmGlitch); Example Call: // loads glitch pattern from the ‘simple1.gpf’ file and // arms the trigger immediately load_glitch("C:\\test\\simple1.gpf", TRUE); Input Parameters:
strGPFPath: String representing the path to the glitch pattern file (*.gpf) to be loaded. Must use double backslashes in the path string.
bArmGlitch: Integer (TRUE or FALSE) indicating whether to arm the glitch trigger immediately.
Return Value:
TRUE: loading completed successfully FALSE: loading failed
336 Scripting Language

load_parameters()
Description:
Loads all of the hardware setup options from a specified project file. These options include those specified in the Settings pane of the I2C Exerciser Configuration Manager. Used In:
Test Prototype: load_parameters(strProjFilePath); Example Call: load_parameters("C:\\MyProject.i2c"); //loads the parameters from file C:\MyProject.i2c Input Parameters:
strProjFilePath: A string containing the project file to load parameters from Remember to double any backslashes (“\\”) when specifying the path to avoid interpretation as an escape-sequence.
Return Values:
TRUE: successful FALSE: unsuccessful
Scripting Language 337

measure_bus()
Description:
Performs a specified measurement on the I2C bus. Returns a string with the outcome, including units and any assumptions made (such as target assumed to be quiet). NOTE: For the Slave Data Valid ACK Time (SlaveTvdACK) measurement, a read transaction with an ACK is required. Also, for the Master Data Valid Ack Time (MasterTvdACK) measurement, a write transaction with a NAK is required. Used In:
Test Prototypes: measure_bus(strParam) measure_bus(strParam, nAddress, b10BitAddr = FALSE) Example Call: measure_bus("SDAHIGH"); //measures the SDA High voltage Input Parameters:
strParam: String indicating the specific measurement to perform. Possible values (case-insensitive):
SDA: Current SDA Level SCL: Current SCL Level Discrete1: Current Discrete1 Level Discrete2: Current Discrete2 Level Vref: Reference Voltage SDAPullUp: SDA Pull-up Resistance SCLPullUp: SCL Pull-up Resistance SDAHigh: SDA High Voltage SCLHigh: SCL High Voltage SDACap: SDA Capacitance SCLCap: SCL Capacitance SlaveSDALow: Slave SDA Low Voltage (Requires address parameters) SlaveThdDAT: Slave Data Hold Time (Requires address parameters) SlaveTsuDAT: Slave Data Setup Time (Requires address parameters) SlaveTrDA: Slave SDA Rise Time (Requires address parameters) SlaveTfDA: Slave SDA Fall Time (Requires address parameters) SlaveTvdDAT: Slave Data Valid Time (Requires address parameters) SlaveTvdACK: Slave Data Valid Ack Time (Requires address parameters)
338 Scripting Language

MasterSDALow: Master SDA Low Voltage MasterSCLLow: Master SCL Low Voltage MasterThdSTA: Master Start Hold Time MasterTsuSTA: Master Start Setup Time MasterTsuSTO: Master Stop Setup Time MasterThdDAT: Master Data Hold Time MasterTsuDAT: Master Data Setup Time MasterTbuf: Master Bus Free Time MasterFscl: Master SCL Frequency MasterThi: Master SCL High Period MasterTLo: Master SCL Low Period MasterTrCL: Master SCL Rise Time MasterTfCL: Master SCL Fall Time MasterTrDA: Master SDA Rise Time MasterTfDA: Master SDA Fall Time MasterTvdDAT: Master Data Valid Time MasterTvdACK: Master Data Valid Ack Time
nAddress: Integer containing the slave address to measure if the parameter is specific to a
slave. b10BitAddr: Integer specifying whether the address is 10 bit. This parameter can be omitted,
causing the default value of FALSE to be used. Return Value:
A string with the measurement results, including units and any assumptions made.
Scripting Language 339

message_box()
Description:
Displays a string to message box pop-up and causes script execution to wait for a user response. The message box can either provide an “OK” button or the “Yes” and “No” buttons. Used In:
Test Prototype: message_box(strMessage, bYesNo = FALSE) Example Calls: answer = message_box("Do you want to start the test? ", TRUE); //pops up a window asking the user whether to start test message_box("Make sure the bus is quiet now. "); //reminds user to keep bus quiet Input Parameters:
strMessage: A string containing the message to display. bYesNo: An integer indicating whether the Yes and No buttons should be displayed. If
TRUE, displays the Yes and No buttons; if FALSE, displays the OK button. This parameter can be omitted, causing the default value of FALSE to be used.
Return Values:
An integer indicating what the user had clicked. TRUE: If user clicked on “Yes” or “OK” FALSE: If user clicked on “No”
340 Scripting Language

pause()
Description:
Halts execution of script commands for the specified amount of milliseconds before continuing. Used In:
Master Emulation, Test Prototype: pause(nMilliseconds) Example Call: pause(1000); //pause execution for 1 second Input Parameters:
nMilliseconds: Integer indicating amount of time in milliseconds to pause. Return Value:
None
Scripting Language 341
print()
Description:
Echoes a specified string to the Test window or Emulated Master window. Used In:
Master Emulation, Test Prototype: print(strOutput) Example Call: // send "Hello, world! " to the output window with a carriage return print("Hello, world!\n"); Input Parameters:
strOutput: String containing the text to echo. Return Value:
None
342 Scripting Language

printf()
Description:
Echoes a formatted string to the Test window or Emulated Master window. The parameters for this function are similar to the standard C functions, printf() and sprintf(). Used In:
Master Emulation, Test Prototype: printf(FormatString, arg1, arg2, ... ) Example Call: nNum = 3; nAddr = 0x9A; printf("Address number %d is: 0x%02X \n", nNum, nAddr); // output: // // Address number 3 is: 0x9A // Input Parameters:
FormatString: The format string is described below. arg1, arg2, etc: A variable number of arguments used in the format string. Return Values:
None
Scripting Language 343

The Format String A format string consists of ordinary characters and also special conversion specifications. These conversion specifications are sequences that begin with the percent sign (“%”) followed by one or more of the following elements, in order: %[sign][padding][.precision]type
1) [sign] – An optional sign specifier, “+”, that forces a plus or minus sign to be included when a numeric argument is converted to a string.
2) [padding] – An optional padding specifier that indicates the number of character-widths that a formatted argument should occupy in the output string. Blank spaces are inserted before the argument in order to fill this width. If the padding specifer is preceded by a zero (“0”), then the zero digit is used in place of blank spaces.
3) [.precision] – An optional precision specifier consisting of a period (“.”) followed by an integer value that specifies the number of decimal digits to be displayed for floating point numbers or, in the case of string arguments, the maximum string length.
4) type – A required specifier indicating the type of the associated argument: c character d or i signed decimal integer f decimal floating point s string of characters u unsigned decimal integer x unsigned hexadecimal integer X unsigned hexadecimal integer (capital letters)
344 Scripting Language

progress()
Description:
Updates the progress bar in the Test window or Emulated Master window by setting its percentage to a specified value. Used In:
Master Emulation, Test Prototype: progress(nPercent) Example Call: progress(95); // set progress bar to 95% Input Parameters:
nPercent: Integer specifying the percentage to which the progress bar will be set. Return Values:
None
Scripting Language 345
pulse_discrete()
Description:
Sets the specified discrete I/O line (if configured as an output) to the low state for a period of milliseconds before restoring it to the high state. Script execution will pause during this time period. Used In: Master Emulation, Test Prototype: pulse_discrete(nDiscreteNumber, nMilliseconds) Example Call: pulse_discrete(1, 500); //pulse discrete signal 1 for 500 msecs Input Parameters:
nDiscreteNumber: Integer indicating the discrete line to pulse (1 or 2). nMilliseconds: Integer representing the amount of time in milliseconds to pulse Return Values:
TRUE: successfully pulsed FALSE: unsuccessful or selected discrete not configured as output.
346 Scripting Language

random_integer()
Description:
Generates and returns a pseudorandom number. This function generates a pseudorandom integer in the range 0 to 32767. Use the ‘seed_random’ function to seed the pseudorandom-number generator before calling this function. Used In:
Master Emulation, Test Prototype: random_integer(); Example Call: // print out 10 random numbers // between 0 and 32767 seed_random(1234); for (i = 0; i < 10; i++) { print(random_integer()) print("\n"); } Input Parameters:
None Return Value:
The pseudorandom integer value
Scripting Language 347
receive_message()
Description:
Receives a message (ie. performs a read operation) of specified length from the specified target slave address and returns it as a string of hexadecimal bytes. NOTE: Use the new ‘i2c_read’ function for an alternate and better way to read from target slaves. Used In:
Master Emulation, Test Prototype: receive_message(nAddress, b10BitAddr, nDataCount, bStopBit) Example Call: //receive 1 byte of data from 0x9A, end transaction with STOP bit receive_message(0x9A, FALSE, 1, TRUE); Input Parameters:
nAddress: Integer representing the address of the device to receive from. b10BitAddr: Integer (TRUE or FALSE) indicating whether the address is 10-bit. nDataCount: Integer representing the number of bytes to read. bStopBit: Integer (TRUE or FALSE) indicating whether to send the STOP bit at the end of
the transaction. Return Value:
A string representation of the received data, in hexadecimal format, in the order of each received byte. If address was NAK’d , the string "Address byte NAK'd" is returned. If transaction tracking is disabled, an empty string is returned.
348 Scripting Language
reload_glitch()
Description:
Reloads previously loaded glitch pattern data to the CAS-1000. This function can be called in place of the ‘load_glitch’ function if the glitch pattern file intended to be used has already been loaded by an earlier ‘load_gltich’ function call. This function will reuse the glitch pattern data stored in the memory instead of reading it from the physical file. Used In:
Master Emulation, Test Prototype: reload_glitch(bArmGlitch); Example Call: // reloads previously loaded glitch pattern // arms the trigger immediately load_glitch("C:\\test\\simple1.gpf", TRUE); // initial load from file receive_message(0x18, FALSE, 4, TRUE); // inject glitch reload_glitch(TRUE); // reloading from memory receive_message(0x18, FALSE, 4, TRUE); // inject glitch Input Parameters:
bArmGlitch: Integer (TRUE or FALSE) indicating whether to arm the glitch trigger immediately.
Return Value:
TRUE: loading completed successfully FALSE: loading failed
Scripting Language 349

seed_random()
Description:
Sets a starting point for the ‘random_integer’ function. This function sets the starting point for generating a series of pseudorandom integers using the parameter value specified. If the optional parameter is not specified, an unsigned integer representation of the current time will be used instead. Call this function before using the ‘random_integer’ function. Used In:
Master Emulation, Test Prototype: seed_random (nSeedNum); Example Call: // generate and print out 10 random numbers // using the seed value of ‘1234’ seed_random(1234); for (i = 0; i < 10; i++) { print(random_integer) print("\n"); } // generate and print out 10 random numbers // using current time as the seed value // so that the numbers will be different every time we run seed_random(); for (i = 0; i < 10; i++) { print(random_integer) print("\n"); } Input Parameters:
nSeedNum: Integer to be used as the starting point for generating pseudorandom number. If not specified, current time will be used instead.
Return Value:
None
350 Scripting Language
send_message()
Description:
Sends a message (ie. performs a write operation) to the specified target slave address. The message to be sent is formatted as a string of comma- or space-separated hexadecimal byte values and Error Injection keywords. NOTE: Use the new ‘i2c_write’ function for an alternate and better way to write to target slaves. Used In:
Master Emulation, Test Prototype: send_message(nAddress, b10BitAddr, strMessage, bStopBit) Example Call: // send two bytes and then a byte with an error (extra bit) to address 0x18 send_message(0x18, FALSE, "01 40 LONG_DATA 7F", TRUE); Input Parameters:
nAddress: Integer representing the address of the device to send to. b10BitAddr: Integer (TRUE or FALSE) indicating whether address is 10-bit. strMessage: String containing the data to be sent. Consists of comma- or space-separated
hexadecimal byte values and Error Injection keywords. Remember when using Error Injection to send address errors that the keyword must precede any byte values in the string.
bStopBit: Integer (TRUE or FALSE) indicating whether to send the STOP bit at the end of the transaction.
Return Value:
A string indicating how many bytes were sent, or an error message if an error occurred. If address was NAK’d , the string "Address byte NAK'd" is returned. If transaction tracking is disabled, an empty string is returned.
Scripting Language 351

send_message_PEC()
Description:
Sends a message (ie. performs a write operation) with a SMBus Packet Error Checking (PEC) byte to the specified target slave address. The PEC is a CRC-8 error-checking byte, calculated on all the message bytes (including addresses and read/write bits). The PEC is appended to the message as the last data byte. The message to be sent is formatted as a string of comma- or space-separated hexadecimal byte values and Error Injection keywords. Used In:
Master Emulation, Test Prototype: send_message_PEC(nAddress, b10BitAddr, strMessage, bStopBit) Example Call: // send two bytes with a SMBus PEC byte to address 0x18 send_message_PEC(0x18, FALSE, "01 40", TRUE); Input Parameters:
nAddress: Integer representing the address of the device to send to. b10BitAddr: Integer (TRUE or FALSE) indicating whether address is 10-bit. strMessage: String containing the data to be sent. Consists of comma- or space-separated
hexadecimal byte values and Error Injection keywords. Remember when using Error Injection to send address errors that the keyword must precede any byte values in the string.
bStopBit: Integer (TRUE or FALSE) indicating whether to send the STOP bit at the end of the transaction.
Return Value:
A string indicating how many bytes were sent, or an error message if an error occurred. If address was NAK’d , the string "Address byte NAK'd" is returned. If transaction tracking is disabled, an empty string is returned.
352 Scripting Language
sense_discrete_level()
Description:
Reads the state of the specified discrete I/O line. Used In:
Master Emulation, Test Prototype: sense_discrete_level(nDiscreteNumber) Example Call: nStatus = sense_discrete_level(1); //read the status of discrete I/O signal 1 Input Parameters:
nDiscreteNumber: Integer indicating the discrete line to sense (1 or 2). Return Value:
An integer indicating the value detected: 0 for low and 1 for high. If sense was unsuccessful, -1 will be returned.
Scripting Language 353

set_clock_rate()
Description:
Overwrites a new hardware setup value for the SCL clock rate of the analyzer when talking on the bus. Used In:
Master Emulation, Test Prototype: set_clock_rate(strKilohertz) Example Call: set_clock_rate("30.5"); //set clock rate to 30.5 KHz Input Parameters:
strKilohertz: String containing the clock rate to set, in kilohertz. The string is presumed to represent a floating point numerical value.
Return Value:
The actual clock rate that is set is returned as a string. If unsuccessful, an empty string is returned. The actual clock rate will be rounded to the nearest value in the following list:
4 kHz, 5 kHz, 6 kHz, 7 kHz, 8 kHz, 9 kHz, 10 kHz, 20 kHz, 30 kHz, 40 kHz, 50 kHz, 60 kHz, 70 kHz, 80 kHz, 90 kHz, 100 kHz, 150 kHz, 200 kHz, 250 kHz, 301 kHz, 352 kHz, 397 kHz, 446 kHz, 500 kHz, 556 kHz, 595 kHz, 658 kHz, 694 kHz, 758 kHz, 806 kHz, 862 kHz, 893 kHz, 962 kHz, 1.000 MHz, 1.471 MHz, 1.923 MHz, 2.500 MHz, 3.125 MHz, 4.167 MHz, 5.000 MHz
354 Scripting Language
set_discrete_level()
Description:
Sets the static state of the specified discrete I/O line. Used In:
Master Emulation, Test Prototype: set_discrete_level(nDiscreteNumber, nState) Example Call: set_discrete_level(2, 0); //set discrete I/O signal 2 to low Input Parameters:
nDiscreteNumber: Integer indicating the discrete line to set (1 or 2). nState: Integer indicating the state to which the discrete will be set. “0” for low and “1” for
high. Return Value:
A string representing the actual value of the discrete bit. An empty string if setting was unsuccessful.
Scripting Language 355

set_discrete_voltage()
Description:
Sets a new TTL voltage level for the high state of the discrete I/O signals. When sensing inputs, the CAS-1000 will also use this setting to automatically determine adequate signal threshold values. Used In:
Master Emulation, Test Prototype: set_discrete_voltage(strVolts); Example Call: //set discrete I/O TTL high voltage level to 3.0 V set_discrete_voltage("3.0"); Input Parameters:
strVolts: String containing the voltage to set. The string is presumed to represent a floating point numerical value.
Return Value:
The actual voltage that is set is returned as a string (the analyzer picks the setting that most closely matches the specified value). If unsuccessful or not in analyzer supplied mode, an empty string is returned.
356 Scripting Language

set_high_voltage_thresold()
Description:
Overwrites a new hardware setup value for the high threshold voltage of the analyzer for detecting signal levels. Used In:
Master Emulation, Test Prototype: set_high_voltage_threshold(strVolts) Example Call: set_high_voltage_threshold("1.85"); //set the high threshold to 1.85 Volts Input Parameters:
strVolts: String containing the high level threshold in volts. The string is presumed to represent a floating point numerical value.
Return Value:
The actual high threshold voltage that is set is returned as a string. If unsuccessful, an empty string is returned. The actual value will be rounded to 0.05 Volt increments ranging from 0.00 to 5.00 Volts.
Scripting Language 357

set_low_voltage_thresold()
Description:
Overwrites a new hardware setup value for the low threshold voltage of the analyzer for detecting signal levels. Used In:
Master Emulation, Test Prototype: set_low_voltage_threshold(strVolts) Example Call: set_low_voltage_threshold("0.85"); //set the high threshold to 0.85 Volts Input Parameters:
strVolts: String containing the low level threshold in volts. The string is presumed to represent a floating point numerical value.
Return Value:
The actual low threshold voltage that is set is returned as a string. If unsuccessful, an empty string is returned. The actual value will be rounded to 0.05 Volt increments ranging from 0.00 to 5.00 Volts.
358 Scripting Language
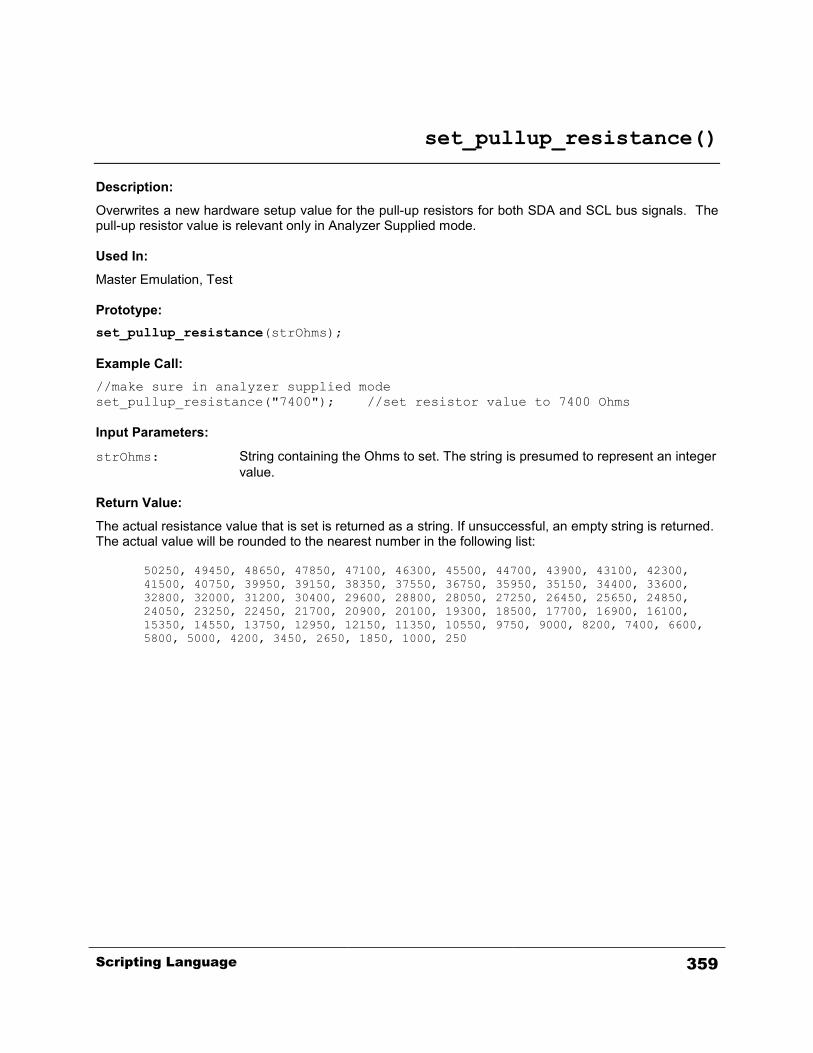
set_pullup_resistance()
Description:
Overwrites a new hardware setup value for the pull-up resistors for both SDA and SCL bus signals. The pull-up resistor value is relevant only in Analyzer Supplied mode. Used In:
Master Emulation, Test Prototype: set_pullup_resistance(strOhms); Example Call: //make sure in analyzer supplied mode set_pullup_resistance("7400"); //set resistor value to 7400 Ohms Input Parameters:
strOhms: String containing the Ohms to set. The string is presumed to represent an integer value.
Return Value:
The actual resistance value that is set is returned as a string. If unsuccessful, an empty string is returned. The actual value will be rounded to the nearest number in the following list:
50250, 49450, 48650, 47850, 47100, 46300, 45500, 44700, 43900, 43100, 42300, 41500, 40750, 39950, 39150, 38350, 37550, 36750, 35950, 35150, 34400, 33600, 32800, 32000, 31200, 30400, 29600, 28800, 28050, 27250, 26450, 25650, 24850, 24050, 23250, 22450, 21700, 20900, 20100, 19300, 18500, 17700, 16900, 16100, 15350, 14550, 13750, 12950, 12150, 11350, 10550, 9750, 9000, 8200, 7400, 6600, 5800, 5000, 4200, 3450, 2650, 1850, 1000, 250
Scripting Language 359
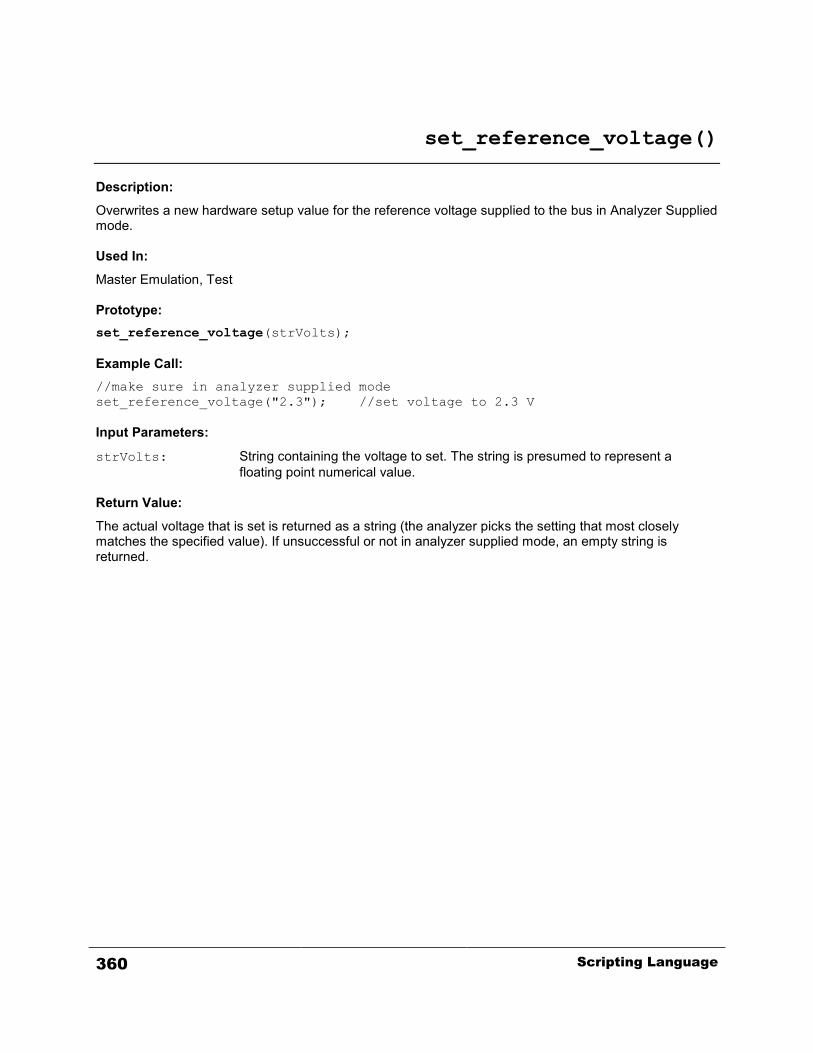
set_reference_voltage()
Description:
Overwrites a new hardware setup value for the reference voltage supplied to the bus in Analyzer Supplied mode. Used In:
Master Emulation, Test Prototype: set_reference_voltage(strVolts); Example Call: //make sure in analyzer supplied mode set_reference_voltage("2.3"); //set voltage to 2.3 V Input Parameters:
strVolts: String containing the voltage to set. The string is presumed to represent a floating point numerical value.
Return Value:
The actual voltage that is set is returned as a string (the analyzer picks the setting that most closely matches the specified value). If unsuccessful or not in analyzer supplied mode, an empty string is returned.
360 Scripting Language
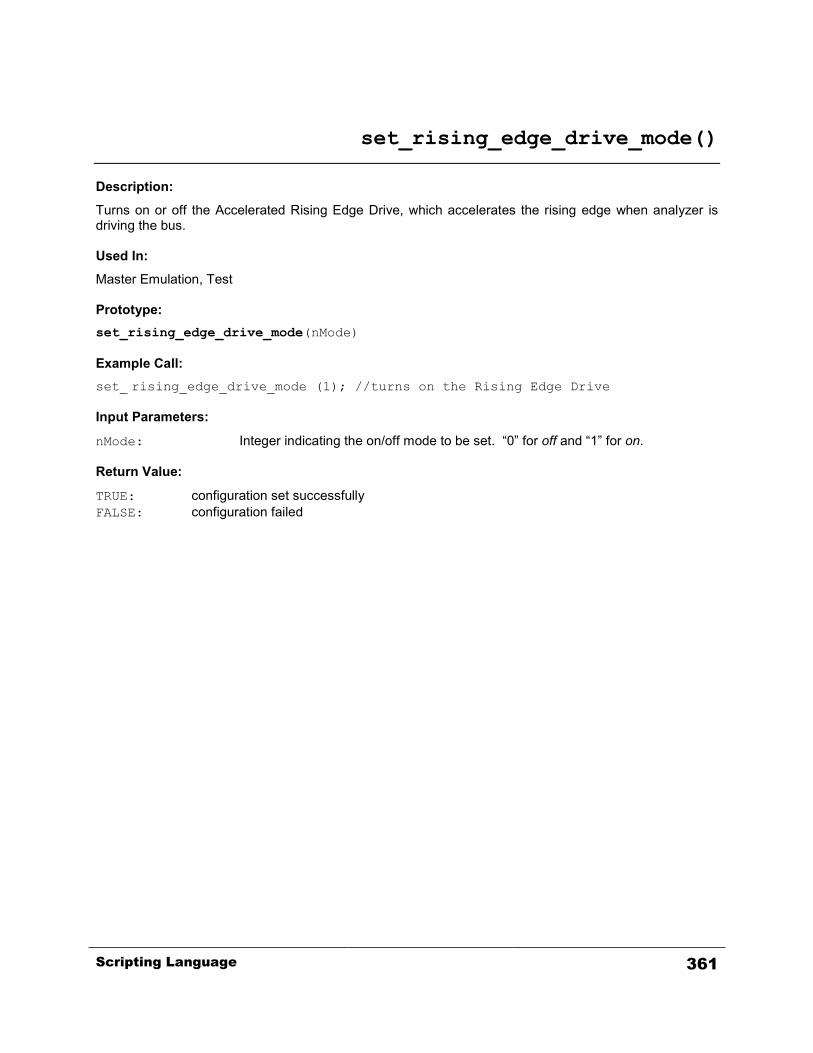
set_rising_edge_drive_mode()
Description:
Turns on or off the Accelerated Rising Edge Drive, which accelerates the rising edge when analyzer is driving the bus. Used In:
Master Emulation, Test Prototype: set_rising_edge_drive_mode(nMode) Example Call: set_ rising_edge_drive_mode (1); //turns on the Rising Edge Drive Input Parameters:
nMode: Integer indicating the on/off mode to be set. “0” for off and “1” for on. Return Value:
TRUE: configuration set successfully FALSE: configuration failed
Scripting Language 361

set_timing_skew()
Description:
Sets new timing skew parameters for the analyzer. Following execution of this function, the timing relationship between SCL and SDA during analyzer driven communications will be adjusted according to the provided settings. The new setting will remain in effect even after the script is completed. Used In:
Master Emulation, Test Prototype: set_timing_skew(nMode, nTime); Example Call: //set the setup time to be 100 ns set_timing_skew(1, 100); //set the hold time to be 1.2 us set_timing_skew(2, 1200); //turn off the timing skew (i.e. set to normal mode) set_timing_skew (0, 0); Input Parameters:
nMode: An integer value representing the new mode. Must be 0 (normal), 1 (setup_time), or 2 (hold_time).
nTime: An integer value representing the new amount for setup or hold time. The value is in nanoseconds and will be rounded to the nearest 20 ns. The valid range is up to one eighth of the current SCL period on the positive side and a little less (80 ns) on the negative side. For example, for a 100 KHz SCL rate, the valid range is from -1160 ns to 1240 ns.
Return Value:
A string representing the actual rounded setup/hold time value that will be used by the analyzer. If unsuccessful, an empty string is returned.
362 Scripting Language

set_voltage_source()
Description:
Sets the bus reference voltage source as either the target or the Analyzer. Used In:
Master Emulation, Test Prototype: set_voltage_source(nSource) Example Call: set_voltage_source(1); //set the voltage source to be the Analyzer Input Parameters:
nSource: Integer indicating the voltage source. “0” for the target, and “1” for the Analyzer. Return Value:
TRUE: configuration set successfully FALSE: configuration failed
Scripting Language 363

SMBus_proc_call()
Description:
Performs SMBus Process Call operation, which sends a command with a word of data to a slave and receives a word of data back from the slave as the return value.
S Slave Addr W A Command A Data Byte L A Data Byte H A …
S Slave Addr R A Data Byte L A Data Byte H A P
SMBus Process Call
S Slave Addr W A Command A Data Byte L A Data Byte H A …
S Slave Addr R A Data Byte L A Data Byte H A PEC A P
SMBus Process Call with PEC Used In:
Master Emulation, Test Prototype: SMBus_proc_call(nAddress, nCommand, nWord, bPEC=FALSE) Example Call: // send command "0x01" and word "0xAB12" to slave with address "0x18" // and receives a word from the slave and store it to nWordRet nWordRet = SMBus_proc_call(0x18, 0x01, 0xAB12); // send command "0x04" and word "0xCD34" and PEC to slave with address "0xA0" // and receives a word and PEC from the slave and store it to nWordRet nWordRet = SMBus_proc_call(0xA0, 0x04, 0xCD34, TRUE); Input Parameters:
nAddress: Integer representing the address of the device to read from. nCommand: Integer representing the command to be sent. The lowest 8 bits are used only. nWord: Integer representing the word to be sent. The lowest 16 bits are used only. bPEC: Integer (TRUE or FALSE) indicating whether to read an extra Packet Error
Checking (PEC) byte at the end of the message. This parameter is optional with the default value of FALSE.
Return Value:
An integer representing the resulting value or the errors that might happened during the operation. 0~65535: Value of data word received. 0: Unknown result. Transaction result was not tracked.
364 Scripting Language

-1: Transaction error. Error occurred during operation. -2: NACK. No acknowledgement received from slave. -3: Transaction timed out. Failed to detect transaction from the bus on time.
Scripting Language 365

SMBus_proc_call_block()
Description:
Performs SMBus Block Write – Block Read Process Call operation, which sends a command with a block of data to a slave and receives a block of data back from the slave as the return value.
S Slave Addr W A Command A Byte Cnt=M A Data Byte 1 A …
Data Byte 2 A … Data Byte M A …
S Slave Addr R A Byte Cnt=N A Data Byte 1 A …
Data Byte 2 A … Data Byte N A P
SMBus Block Write – Block Read Process Call
S Slave Addr W A Command A Byte Cnt=M A Data Byte 1 A …
Data Byte 2 A … Data Byte M A …
S Slave Addr R A Byte Cnt=N A Data Byte 1 A …
Data Byte 2 A … Data Byte N A PEC A P
SMBus Block Write – Block Read Process Call with PEC Used In:
Master Emulation, Test Prototype: SMBus_proc_call_block(nAddress, nCommand, nByteCount, nArrBytes, bPEC=FALSE) Example Call: // send command "0x01" and 10 bytes of data in nArrData // to slave with address "0x16", and then read a block of data // from the slave to be stored into array "nArrDataRet". // Print out the data received or the error code. nArrData = int_array(1, 2, 3, 5, 7, 0x1, 0x11, 0x22, 0xC, 0xDD); nArrDataRet = SMBus_proc_call_block(0x16, 0x01, 10, nArrData); if ((nArrDataRet[0] > 0) && (nArrDataRet[0] <= 32)) {
for (i=1; i<= nArrDataRet[0]; i++) print(string_format("%02X, ", nArrDataRet[i]));
} else
print(string_format("Error [%d]", nArrDataRet[0]));
366 Scripting Language
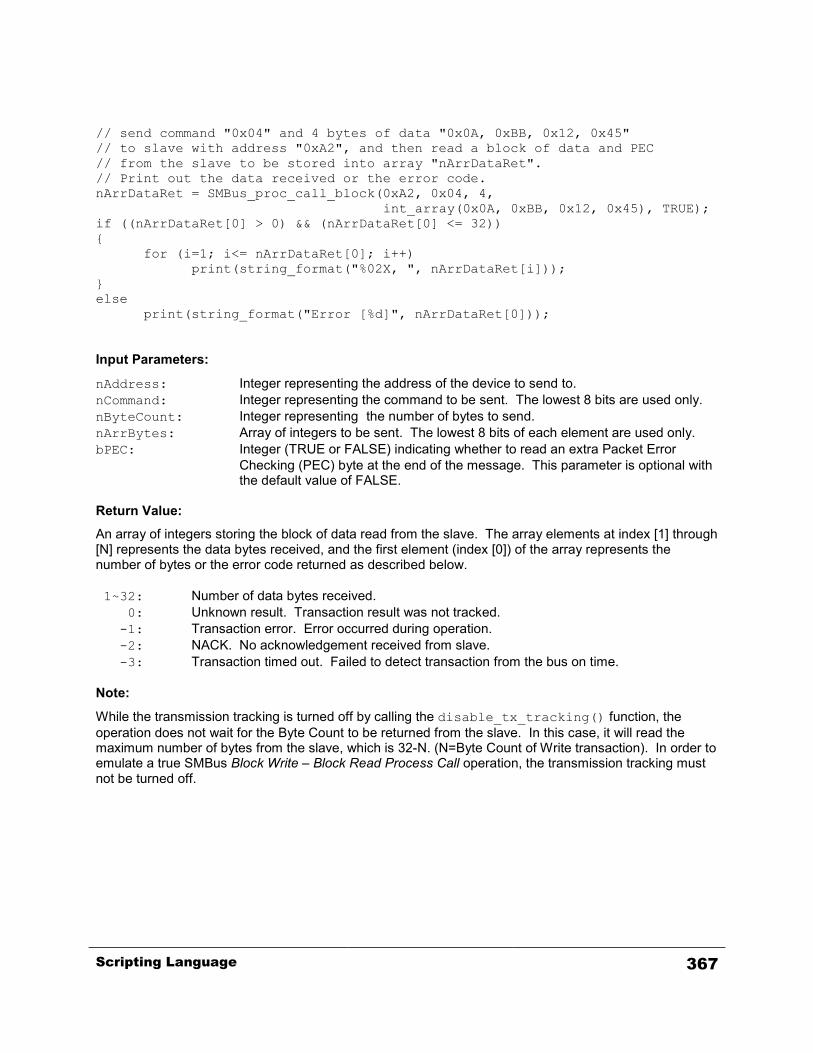
// send command "0x04" and 4 bytes of data "0x0A, 0xBB, 0x12, 0x45" // to slave with address "0xA2", and then read a block of data and PEC // from the slave to be stored into array "nArrDataRet". // Print out the data received or the error code. nArrDataRet = SMBus_proc_call_block(0xA2, 0x04, 4,
int_array(0x0A, 0xBB, 0x12, 0x45), TRUE); if ((nArrDataRet[0] > 0) && (nArrDataRet[0] <= 32)) {
for (i=1; i<= nArrDataRet[0]; i++) print(string_format("%02X, ", nArrDataRet[i]));
} else
print(string_format("Error [%d]", nArrDataRet[0])); Input Parameters:
nAddress: Integer representing the address of the device to send to. nCommand: Integer representing the command to be sent. The lowest 8 bits are used only. nByteCount: Integer representing the number of bytes to send. nArrBytes: Array of integers to be sent. The lowest 8 bits of each element are used only. bPEC: Integer (TRUE or FALSE) indicating whether to read an extra Packet Error
Checking (PEC) byte at the end of the message. This parameter is optional with the default value of FALSE.
Return Value:
An array of integers storing the block of data read from the slave. The array elements at index [1] through [N] represents the data bytes received, and the first element (index [0]) of the array represents the number of bytes or the error code returned as described below. 1~32: Number of data bytes received. 0: Unknown result. Transaction result was not tracked. -1: Transaction error. Error occurred during operation. -2: NACK. No acknowledgement received from slave. -3: Transaction timed out. Failed to detect transaction from the bus on time. Note:
While the transmission tracking is turned off by calling the disable_tx_tracking() function, the operation does not wait for the Byte Count to be returned from the slave. In this case, it will read the maximum number of bytes from the slave, which is 32-N. (N=Byte Count of Write transaction). In order to emulate a true SMBus Block Write – Block Read Process Call operation, the transmission tracking must not be turned off.
Scripting Language 367

SMBus_quick()
Description:
Performs SMBus Quick command operation, which sends a slave address with a R/W# bit.
S Slave Addr R/W A P
SMBus Quick Command Protocol Used In:
Master Emulation, Test Prototype: SMBus_quick(nAddress, nRW) Example Call: // send a quick command to a slave with address "0x18" with R/W# bit = 1 SMBus_quick(0x18, 1); // send a quick command to a slave with address "0xA0" with R/W# bit = 0 SMBus_quick(0xA0, 0); Input Parameters:
nAddress: Integer representing the address of the device to send the command to. nRW: Integer indicating the value of R/W# bit to be set to Return Value:
An integer representing the resulting value or the errors that might happened during the operation. 1: ACK. Acknowledgement received from slave. 0: Unknown result. Transaction result was not tracked. -1: Transaction error. Error occurred during operation. -2: NACK. No acknowledgement received from slave. -3: Transaction timed out. Failed to detect transaction from the bus on time.
368 Scripting Language
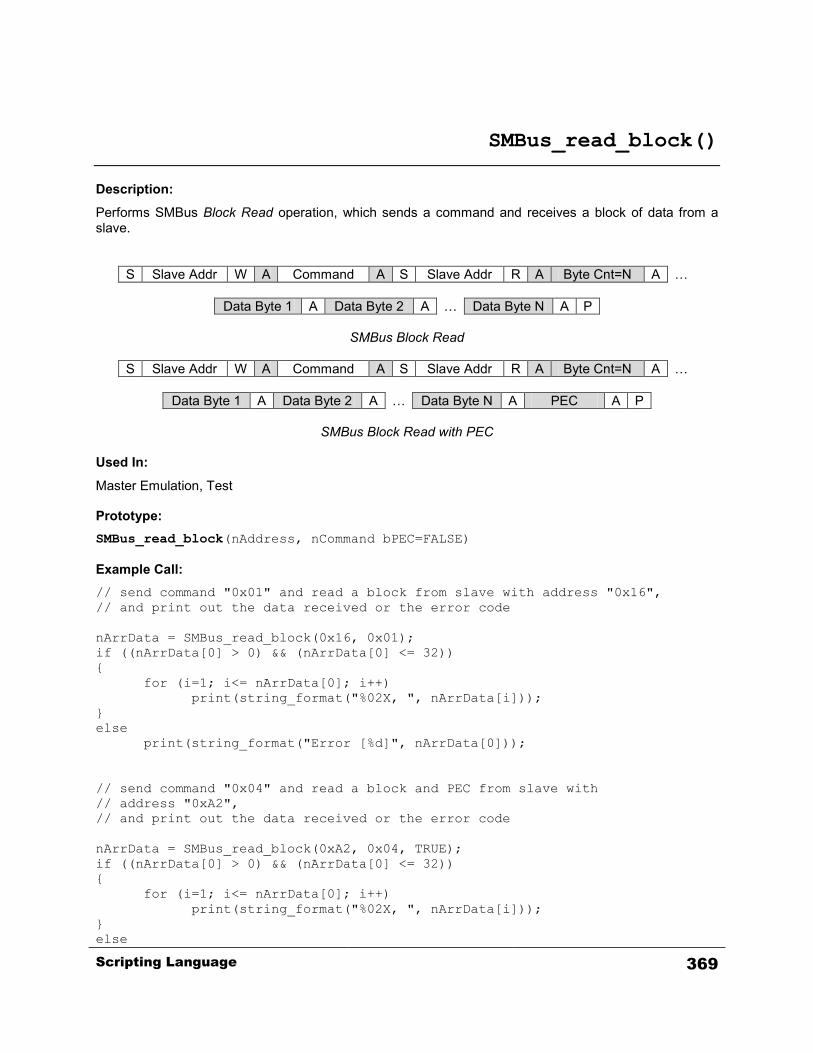
SMBus_read_block()
Description:
Performs SMBus Block Read operation, which sends a command and receives a block of data from a slave.
S Slave Addr W A Command A S Slave Addr R A Byte Cnt=N A …
Data Byte 1 A Data Byte 2 A … Data Byte N A P
SMBus Block Read
S Slave Addr W A Command A S Slave Addr R A Byte Cnt=N A …
Data Byte 1 A Data Byte 2 A … Data Byte N A PEC A P
SMBus Block Read with PEC Used In:
Master Emulation, Test Prototype: SMBus_read_block(nAddress, nCommand bPEC=FALSE) Example Call: // send command "0x01" and read a block from slave with address "0x16", // and print out the data received or the error code nArrData = SMBus_read_block(0x16, 0x01); if ((nArrData[0] > 0) && (nArrData[0] <= 32)) { for (i=1; i<= nArrData[0]; i++) print(string_format("%02X, ", nArrData[i])); } else print(string_format("Error [%d]", nArrData[0])); // send command "0x04" and read a block and PEC from slave with // address "0xA2", // and print out the data received or the error code nArrData = SMBus_read_block(0xA2, 0x04, TRUE); if ((nArrData[0] > 0) && (nArrData[0] <= 32)) { for (i=1; i<= nArrData[0]; i++) print(string_format("%02X, ", nArrData[i])); } else
Scripting Language 369

print(string_format("Error [%d]", nArrData[0])); Input Parameters:
nAddress: Integer representing the address of the device to read from. nCommand: Integer representing the command to be sent. The lowest 8 bits are used only. bPEC: Integer (TRUE or FALSE) indicating whether to read an extra Packet Error
Checking (PEC) byte at the end of the message. This parameter is optional with the default value of FALSE.
Return Value:
An array of integers storing the block of data read from the slave. The array elements at index [1] through [N] represents the data bytes received, and the first element (index [0]) of the array represents the number of bytes or the error code returned as described below. 1~32: Number of data bytes received. 0: Unknown result. Transaction result was not tracked. -1: Transaction error. Error occurred during operation. -2: NACK. No acknowledgement received from slave. -3: Transaction timed out. Failed to detect transaction from the bus on time. Note:
While the transmission tracking is turned off by calling the disable_tx_tracking() function, the operation does not wait for the Byte Count to be returned from the slave. In this case, it will read the maximum number of bytes from the slave, which is 32. In order to emulate a true SMBus Block Read operation, the transmission tracking must not be turned off.
370 Scripting Language

SMBus_read_byte()
Description:
Performs SMBus Read byte operation, which sends a command and receives a byte of data from a slave.
S Slave Addr W A Command A S Slave Addr R A Data Byte A P
SMBus Read Byte Protocol
S Slave Addr W A Command A S Slave Addr R A Data Byte A …
PEC A P
SMBus Read Byte Protocol with PEC Used In:
Master Emulation, Test Prototype: SMBus_read_byte(nAddress, nCommand bPEC=FALSE) Example Call: // send command "0x01" and read a byte from slave with address "0x18" nByte = SMBus_read_byte(0x18, 0x01); // send command "0x04" and read a byte with PEC from slave with // address "0xA0" nByte = SMBus_read_byte(0xA0, 0x04, TRUE); Input Parameters:
nAddress: Integer representing the address of the device to read from. nCommand: Integer representing the command to be sent. The lowest 8 bits are used only. bPEC: Integer (TRUE or FALSE) indicating whether to read an extra Packet Error
Checking (PEC) byte at the end of the message. This parameter is optional with the default value of FALSE.
Return Value:
An integer representing the resulting value or the errors that might happened during the operation. 0~255: Value of data byte received. 0: Unknown result. Transaction result was not tracked. -1: Transaction error. Error occurred during operation. -2: NACK. No acknowledgement received from slave. -3: Transaction timed out. Failed to detect transaction from the bus on time.
Scripting Language 371
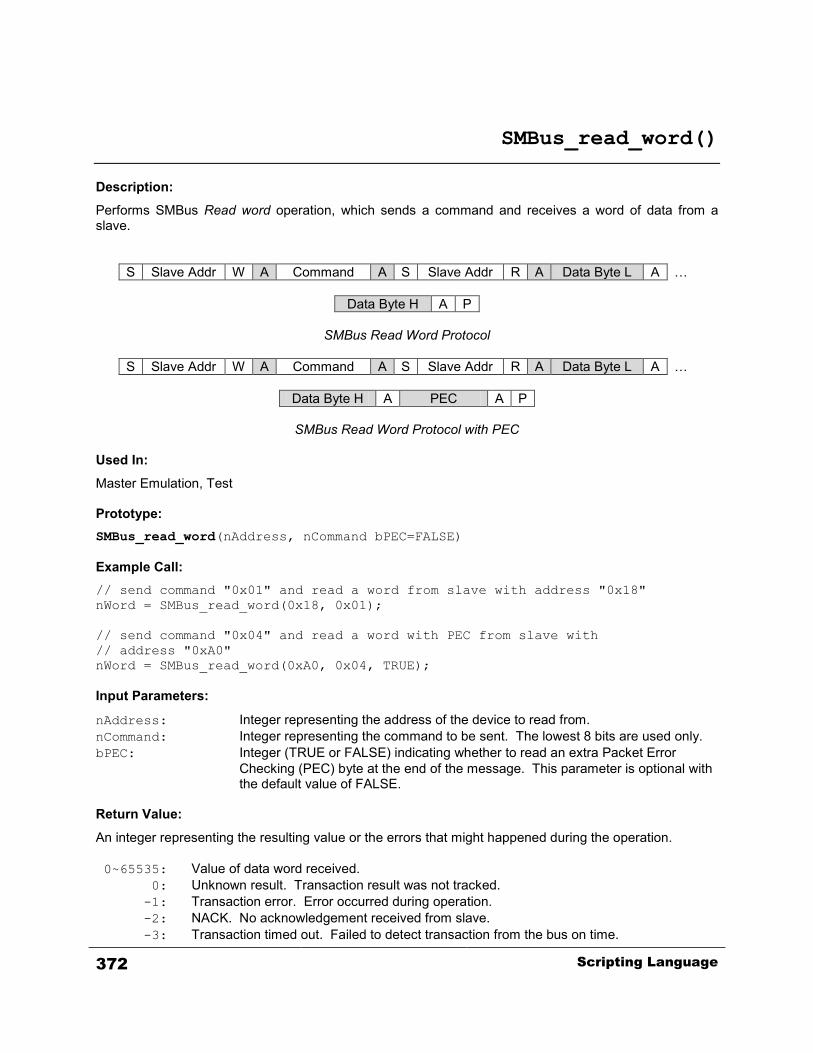
SMBus_read_word()
Description:
Performs SMBus Read word operation, which sends a command and receives a word of data from a slave.
S Slave Addr W A Command A S Slave Addr R A Data Byte L A …
Data Byte H A P
SMBus Read Word Protocol
S Slave Addr W A Command A S Slave Addr R A Data Byte L A …
Data Byte H A PEC A P
SMBus Read Word Protocol with PEC Used In:
Master Emulation, Test Prototype: SMBus_read_word(nAddress, nCommand bPEC=FALSE) Example Call: // send command "0x01" and read a word from slave with address "0x18" nWord = SMBus_read_word(0x18, 0x01); // send command "0x04" and read a word with PEC from slave with // address "0xA0" nWord = SMBus_read_word(0xA0, 0x04, TRUE); Input Parameters:
nAddress: Integer representing the address of the device to read from. nCommand: Integer representing the command to be sent. The lowest 8 bits are used only. bPEC: Integer (TRUE or FALSE) indicating whether to read an extra Packet Error
Checking (PEC) byte at the end of the message. This parameter is optional with the default value of FALSE.
Return Value:
An integer representing the resulting value or the errors that might happened during the operation. 0~65535: Value of data word received. 0: Unknown result. Transaction result was not tracked. -1: Transaction error. Error occurred during operation. -2: NACK. No acknowledgement received from slave. -3: Transaction timed out. Failed to detect transaction from the bus on time.
372 Scripting Language

SMBus_receive_byte()
Description:
Performs SMBus Receive byte operation, which receives a byte of data from a slave.
S Slave Addr R A Data Byte A P
SMBus Receive Byte Protocol
S Slave Addr R A Data Byte A PEC A P
SMBus Receive Byte Protocol with PEC Used In:
Master Emulation, Test Prototype: SMBus_receive_byte(nAddress, bPEC=FALSE) Example Call: // receive a data byte from slave with address "0x18" nByte = SMBus_receive_byte(0x18); // receive a data byte with PEC from slave with address "0xA0" nByte = SMBus_receive_byte(0xA0, TRUE); Input Parameters:
nAddress: Integer representing the address of the device to receive from. bPEC: Integer (TRUE or FALSE) indicating whether to read an extra Packet Error
Checking (PEC) byte at the end of the message. This parameter is optional with the default value of FALSE.
Return Value:
An integer representing the resulting value or the errors that might happened during the operation. 0~255: Value of data byte received. 0: Unknown result. Transaction result was not tracked. -1: Transaction error. Error occurred during operation. -2: NACK. No acknowledgement received from slave. -3: Transaction timed out. Failed to detect transaction from the bus on time.
Scripting Language 373
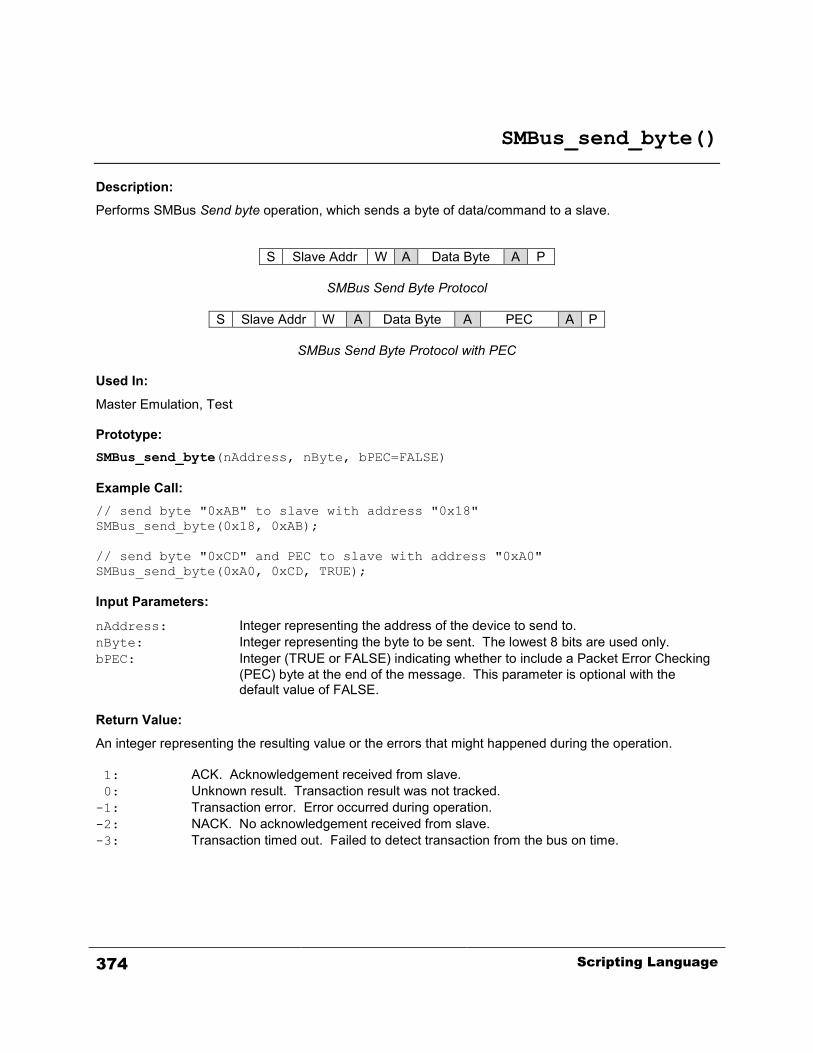
SMBus_send_byte()
Description:
Performs SMBus Send byte operation, which sends a byte of data/command to a slave.
S Slave Addr W A Data Byte A P
SMBus Send Byte Protocol
S Slave Addr W A Data Byte A PEC A P
SMBus Send Byte Protocol with PEC Used In:
Master Emulation, Test Prototype: SMBus_send_byte(nAddress, nByte, bPEC=FALSE) Example Call: // send byte "0xAB" to slave with address "0x18" SMBus_send_byte(0x18, 0xAB); // send byte "0xCD" and PEC to slave with address "0xA0" SMBus_send_byte(0xA0, 0xCD, TRUE); Input Parameters:
nAddress: Integer representing the address of the device to send to. nByte: Integer representing the byte to be sent. The lowest 8 bits are used only. bPEC: Integer (TRUE or FALSE) indicating whether to include a Packet Error Checking
(PEC) byte at the end of the message. This parameter is optional with the default value of FALSE.
Return Value:
An integer representing the resulting value or the errors that might happened during the operation. 1: ACK. Acknowledgement received from slave. 0: Unknown result. Transaction result was not tracked. -1: Transaction error. Error occurred during operation. -2: NACK. No acknowledgement received from slave. -3: Transaction timed out. Failed to detect transaction from the bus on time.
374 Scripting Language
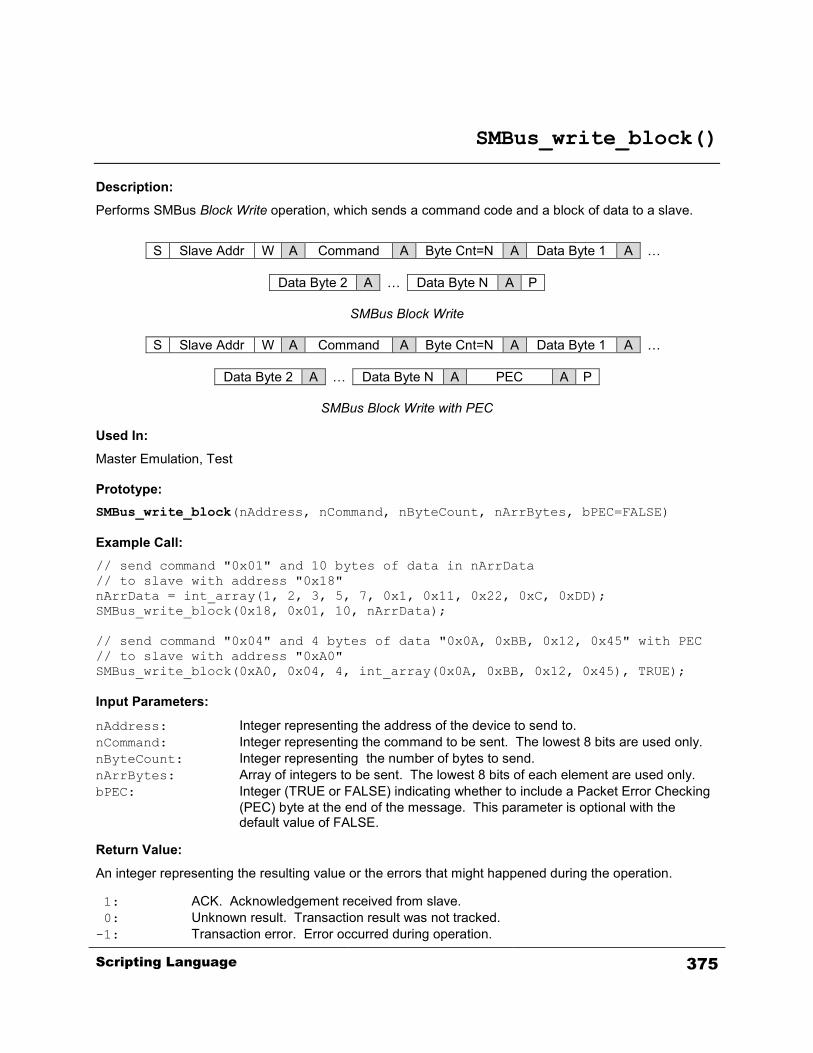
SMBus_write_block()
Description:
Performs SMBus Block Write operation, which sends a command code and a block of data to a slave.
S Slave Addr W A Command A Byte Cnt=N A Data Byte 1 A …
Data Byte 2 A … Data Byte N A P
SMBus Block Write
S Slave Addr W A Command A Byte Cnt=N A Data Byte 1 A …
Data Byte 2 A … Data Byte N A PEC A P
SMBus Block Write with PEC Used In:
Master Emulation, Test Prototype: SMBus_write_block(nAddress, nCommand, nByteCount, nArrBytes, bPEC=FALSE) Example Call: // send command "0x01" and 10 bytes of data in nArrData // to slave with address "0x18" nArrData = int_array(1, 2, 3, 5, 7, 0x1, 0x11, 0x22, 0xC, 0xDD); SMBus_write_block(0x18, 0x01, 10, nArrData); // send command "0x04" and 4 bytes of data "0x0A, 0xBB, 0x12, 0x45" with PEC // to slave with address "0xA0" SMBus_write_block(0xA0, 0x04, 4, int_array(0x0A, 0xBB, 0x12, 0x45), TRUE); Input Parameters:
nAddress: Integer representing the address of the device to send to. nCommand: Integer representing the command to be sent. The lowest 8 bits are used only. nByteCount: Integer representing the number of bytes to send. nArrBytes: Array of integers to be sent. The lowest 8 bits of each element are used only. bPEC: Integer (TRUE or FALSE) indicating whether to include a Packet Error Checking
(PEC) byte at the end of the message. This parameter is optional with the default value of FALSE.
Return Value:
An integer representing the resulting value or the errors that might happened during the operation. 1: ACK. Acknowledgement received from slave. 0: Unknown result. Transaction result was not tracked. -1: Transaction error. Error occurred during operation.
Scripting Language 375

-2: NACK. No acknowledgement received from slave. -3: Transaction timed out. Failed to detect transaction from the bus on time.
376 Scripting Language
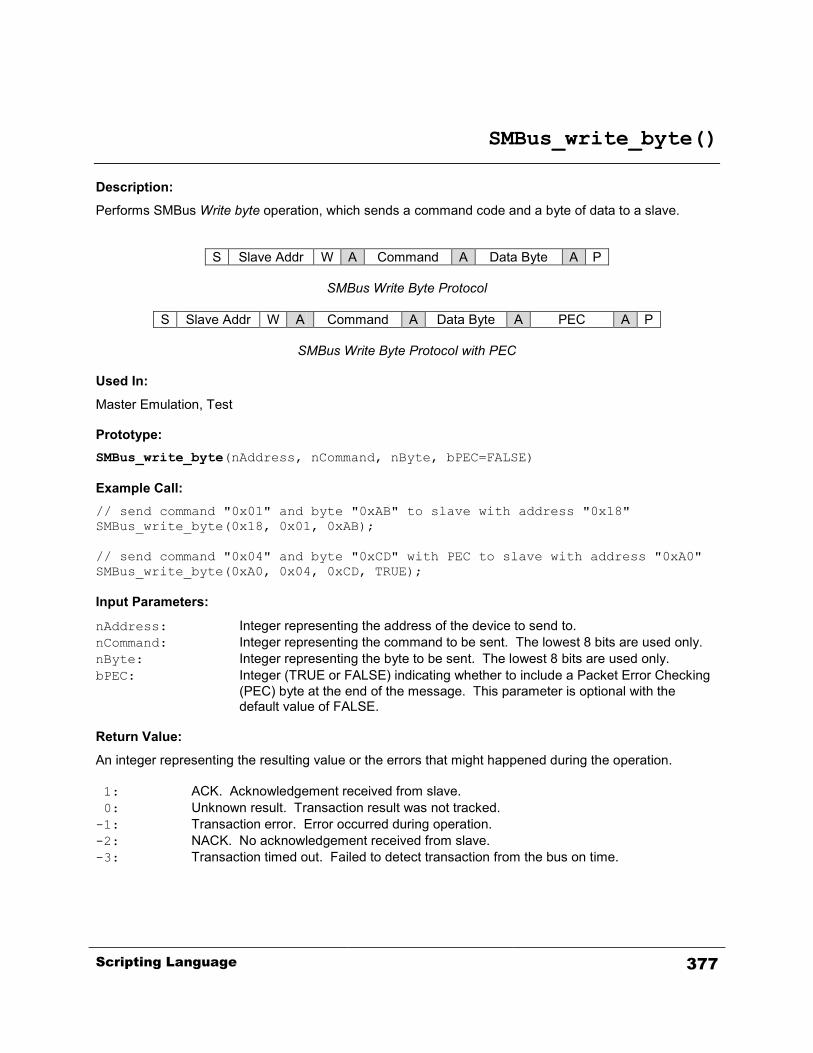
SMBus_write_byte()
Description:
Performs SMBus Write byte operation, which sends a command code and a byte of data to a slave.
S Slave Addr W A Command A Data Byte A P
SMBus Write Byte Protocol
S Slave Addr W A Command A Data Byte A PEC A P
SMBus Write Byte Protocol with PEC Used In:
Master Emulation, Test Prototype: SMBus_write_byte(nAddress, nCommand, nByte, bPEC=FALSE) Example Call: // send command "0x01" and byte "0xAB" to slave with address "0x18" SMBus_write_byte(0x18, 0x01, 0xAB); // send command "0x04" and byte "0xCD" with PEC to slave with address "0xA0" SMBus_write_byte(0xA0, 0x04, 0xCD, TRUE); Input Parameters:
nAddress: Integer representing the address of the device to send to. nCommand: Integer representing the command to be sent. The lowest 8 bits are used only. nByte: Integer representing the byte to be sent. The lowest 8 bits are used only. bPEC: Integer (TRUE or FALSE) indicating whether to include a Packet Error Checking
(PEC) byte at the end of the message. This parameter is optional with the default value of FALSE.
Return Value:
An integer representing the resulting value or the errors that might happened during the operation. 1: ACK. Acknowledgement received from slave. 0: Unknown result. Transaction result was not tracked. -1: Transaction error. Error occurred during operation. -2: NACK. No acknowledgement received from slave. -3: Transaction timed out. Failed to detect transaction from the bus on time.
Scripting Language 377

SMBus_write_word()
Description:
Performs SMBus Write word operation, which sends a command code and a word of data to a slave.
S Slave Addr W A Command A Data Byte L A Data Byte H A P
SMBus Write Word Protocol
S Slave Addr W A Command A Data Byte L A Data Byte H A …
PEC A P
SMBus Write Word Protocol with PEC Used In:
Master Emulation, Test Prototype: SMBus_write_word(nAddress, nCommand, nWord, bPEC=FALSE) Example Call: // send command "0x01" and word "0xAB12" to slave with address "0x18" SMBus_write_word(0x18, 0x01, 0xAB12); // send command "0x04" and word "0xCD34" with PEC to slave with // address "0xA0" SMBus_write_word(0xA0, 0x04, 0xCD34, TRUE); Input Parameters:
nAddress: Integer representing the address of the device to send to. nCommand: Integer representing the command to be sent. The lowest 8 bits are used only. nWord: Integer representing the word to be sent. The lowest 16 bits are used only. bPEC: Integer (TRUE or FALSE) indicating whether to include a Packet Error Checking
(PEC) byte at the end of the message. This parameter is optional with the default value of FALSE.
Return Value:
An integer representing the resulting value or the errors that might happened during the operation. 1: ACK. Acknowledgement received from slave. 0: Unknown result. Transaction result was not tracked. -1: Transaction error. Error occurred during operation. -2: NACK. No acknowledgement received from slave. -3: Transaction timed out. Failed to detect transaction from the bus on time.
378 Scripting Language
string_array()
Description:
Declares and initializes an array of strings. Used In:
Master Emulation, Test Prototype: string_array(str1, str2, ...) Example Call: arrStrNames = string_array(); // declares a new array variable "arrStrNames" arrStrCities = string_array("New York", "LA", "Chicago", "Washington"); // declares a new array variable "arrStrCities" and // initializes the values of first four items printf("arrStrCities[3] = %s", arrStrCities[3]); // // expected output: // // arrStrCities[3] = Washington //
Input Parameters:
str1, str2, ... : A variable number strings to be used as initial values.
Return Values:
A new array object to be assigned to a string array variable.
Scripting Language 379
string_compare()
Description:
String comparison helper function. Its behavior is similar to the standard string comparison function of the C library, strcmp(). Returns 0 if two strings contain the same contents, -1 if the first string is lexicographically before the second, and 1 otherwise. Used In:
Master Emulation, Test Prototype: string_compare(str1, str2) Example Call: name1 = "John"; name2 = "Mary"; comparision = string_compare(name1, name2); // comparison will be -1 Input Parameters:
str1: First string for comparison. str2: Second string for comparison. Return Values:
-1: str1 comes before str2 lexicographically 0: str1 is equal to str2 1: str2 comes before str1 lexicographically
380 Scripting Language
string_concatenate()
Description:
String concatenation helper function. Its behavior is somewhat similar to the standard string concatenation function of the C library, strcat(). Returns a new string containing the concatenation of the input strings. Used In:
Master Emulation, Test Prototype: string_concatenate(str1, str2) Example Call: byte1 = byte8(0x40); byte2 = byte8(0x01); byte1 = string_concatenate(byte1, byte2); //stores "4001" in byte1 Input Parameters:
str1: String which will become the beginning of the concatenated string. str2: String which will become the ending of the concatenated string. Return Value:
The new string containing str1 with str2 concatenated to the end.
Scripting Language 381
string_format()
Description:
Returns a string generated from a sequence of arguments and a special format string. The parameters for this function are similar to the standard C functions, printf() and sprintf(). Used In:
Master Emulation, Test Prototype: string_format(FormatString, arg1, arg2, ... ) Example Call: nNum = 3; nAddr = 0x9A; str = string_format("Address number %d is: 0x%02X \n", nNum, nAddr); // output: "Address number 3 is 0x9A \n" print(str); Input Parameters:
FormatString: The format string is described below. arg1, arg2, etc: A variable number of arguments used in the format string. Return Values:
The new formatted string.
382 Scripting Language

The Format String A format string consists of ordinary characters and also special conversion specifications. These conversion specifications are sequences that begin with the percent sign (“%”) followed by one or more of the following elements, in order: %[sign][padding][.precision]type
5) [sign] – An optional sign specifier, “+”, that forces a plus or minus sign to be included when a numeric argument is converted to a string.
6) [padding] – An optional padding specifier that indicates the number of character-widths that a formatted argument should occupy in the output string. Blank spaces are inserted before the argument in order to fill this width. If the padding specifer is preceded by a zero (“0”), then the zero digit is used in place of blank spaces.
7) [.precision] – An optional precision specifier consisting of a period (“.”) followed by an integer value that specifies the number of decimal digits to be displayed for floating point numbers or, in the case of string arguments, the maximum string length.
8) type – A required specifier indicating the type of the associated argument: c character d or i signed decimal integer f decimal floating point s string of characters u unsigned decimal integer x unsigned hexadecimal integer X unsigned hexadecimal integer (capital letters)
Scripting Language 383

string_get_token_at()
Description:
Parses a given string and returns the string token specified by the given index. This function is useful for retrieving the string data returned by the ‘receive_message’ function call. NOTE: Use the new ‘i2c_read’ function for an alternate and better way to read from target slaves and to process data. Used In:
Master Emulation, Test Prototype: string_get_token_at(strData, nIndex) Example Call: ///////////////////////////////////////////////////////////////////////////// // // Expected output: // // [10][10][11][18][12][60][171][160][239] // [A][A][B][12][C][3C][AB][A0][EF] // ///////////////////////////////////////////////////////////////////////////// main() { strData = "0a a b 12 c 3c AB A0 ef"; nCount = string_num_of_tokens(strData); for(i=0; i<nCount; i++) { nByte = string_hex_to_integer(string_get_token_at(strData, i)); print(string_format("[%d]", nByte)); } print("\n"); for(i=0; i<nCount; i++) { nByte = string_hex_to_integer(string_get_token_at(strData, i)); print(string_format("[%X]", nByte)); } }
Input Parameters:
strData: The string to be parsed. nIndex: The index of the string token to be returned.
384 Scripting Language

Return Values:
The integer value representing the number of tokens in the given string.
Scripting Language 385
string_hex_to_integer()
Description:
Converts a string hexadecimal representation of an integer into an integer output. Used In:
Master Emulation, Test Prototype: string_hex_to_integer(strValue) Example Call: strVal = "A5"; nVal = string_hex_to_integer(strVal); // an integer value of 165 in decimal is stored to nVal variable
Input Parameters:
strValue: The string hexadecimal representation to be converted to an integer.
Return Values:
The integer value represented by the input string.
386 Scripting Language
string_num_of_tokens()
Description:
Parses a given string and returns the total number word tokens separated by spaces. This function is useful for retrieving the string data returned by the ‘receive_message’ function call. NOTE: Use the new ‘i2c_read’ function for an alternate and better way to read from target slaves and to process data. Used In:
Master Emulation, Test Prototype: string_num_of_tokens(strData) Example Call: ///////////////////////////////////////////////////////////////////////////// // // Expected output: // // [10][10][11][18][12][60][171][160][239] // [A][A][B][12][C][3C][AB][A0][EF] // ///////////////////////////////////////////////////////////////////////////// main() { strData = "0a a b 12 c 3c AB A0 ef"; nCount = string_num_of_tokens(strData); for(i=0; i<nCount; i++) { nByte = string_hex_to_integer(string_get_token_at(strData, i)); print(string_format("[%d]", nByte)); } print("\n"); for(i=0; i<nCount; i++) { nByte = string_hex_to_integer(string_get_token_at(strData, i)); print(string_format("[%X]", nByte)); } }
Input Parameters:
strData: The string to be parsed.
Scripting Language 387

Return Values:
The integer value representing the number of tokens in the given string.
388 Scripting Language
string_substring()
Description:
Substring search helper function. Its behavior is somewhat similar to the standard substring search function of the C library, strstr(). Scans a base string for the first occurrence of some substring. If not found, returns an empty string, otherwise returns a string starting with the first occurrence of the substring in the base string and ending with the remainder of the base string. Used In:
Master Emulation, Test Prototype: string_substring(str1, str2) Example Call: mainstr = "43F7D2"; substr = "F7"; sub = string_substring(mainstr, substr); // sub will be "F7D2" Input Parameters:
str1: Base string to search in. str2: Substring to search for. Return Value:
A string starting with the first occurrence of the substring str2 in the base string str1 and ending with the remainder of the base string. Empty string if the substring str2 is not found.
Scripting Language 389
string_to_float()
Description:
Coverts a string decimal representation of a floating point value into a floating point output. Used In:
Master Emulation, Test Prototype: string_to_float(strValue) Example Call: strVal = "3.14"; fVal = string_to_float(strVal); Input Parameters:
strValue: The string decimal representation to convert to a float. Return Value:
The floating point value represented by the input string.
390 Scripting Language

string_to_integer()
Description:
Converts a string decimal representation of an integer into an integer output. Used In:
Master Emulation, Test Prototype: string_to_integer(strValue) Example Call: strVal = "253"; nVal = string_to_integer(strVal); Input Parameters:
strValue: The string decimal representation to convert to an integer. Return Value:
The integer value represented by the input string.
Scripting Language 391
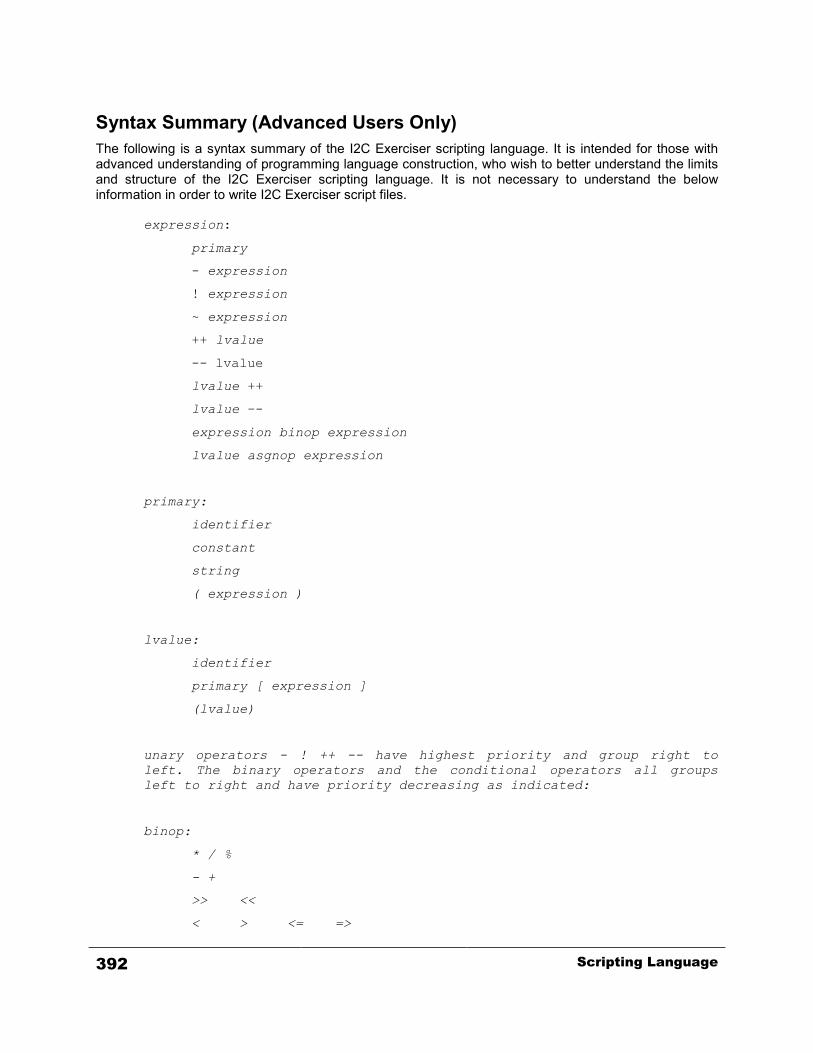
Syntax Summary (Advanced Users Only) The following is a syntax summary of the I2C Exerciser scripting language. It is intended for those with advanced understanding of programming language construction, who wish to better understand the limits and structure of the I2C Exerciser scripting language. It is not necessary to understand the below information in order to write I2C Exerciser script files.
expression:
primary
- expression
! expression
~ expression
++ lvalue
-- lvalue
lvalue ++
lvalue –-
expression binop expression
lvalue asgnop expression
primary:
identifier
constant
string
( expression )
lvalue:
identifier
primary [ expression ]
(lvalue)
unary operators - ! ++ -- have highest priority and group right to left. The binary operators and the conditional operators all groups left to right and have priority decreasing as indicated:
binop:
* / %
- +
>> <<
< > <= =>
392 Scripting Language
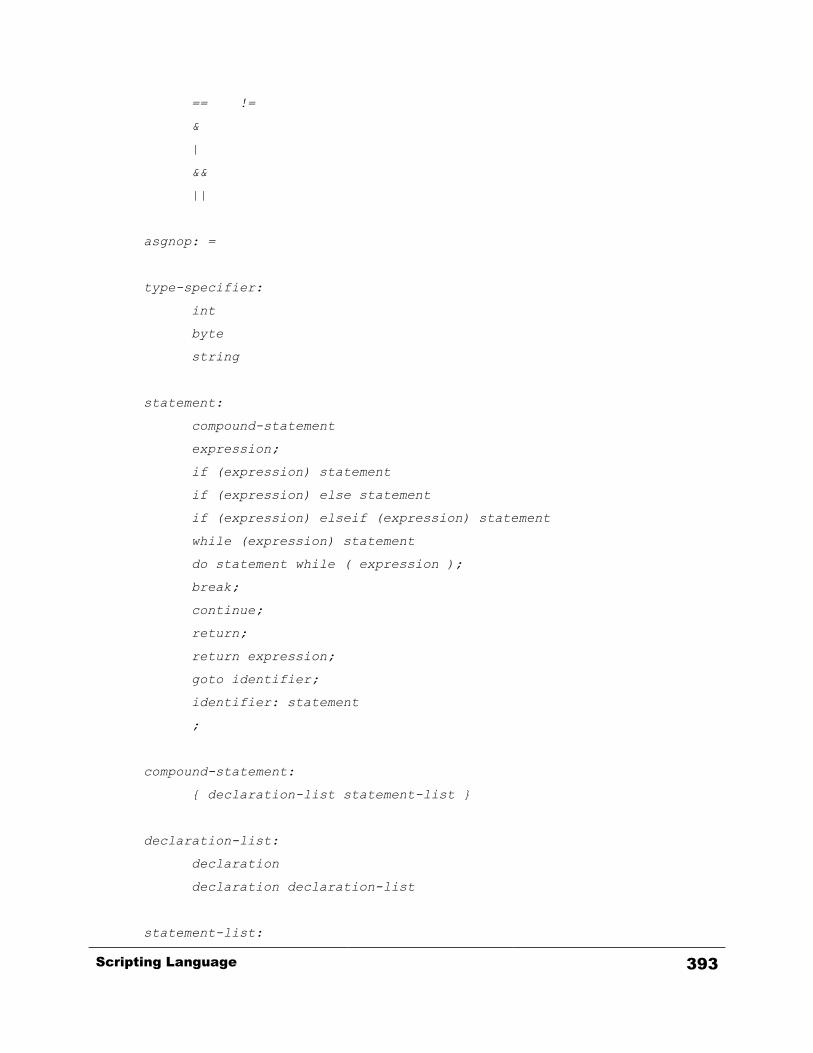
== !=
&
|
&&
||
asgnop: =
type-specifier:
int
byte
string
statement:
compound-statement
expression;
if (expression) statement
if (expression) else statement
if (expression) elseif (expression) statement
while (expression) statement
do statement while ( expression );
break;
continue;
return;
return expression;
goto identifier;
identifier: statement
;
compound-statement:
{ declaration-list statement-list }
declaration-list:
declaration
declaration declaration-list
statement-list:
Scripting Language 393
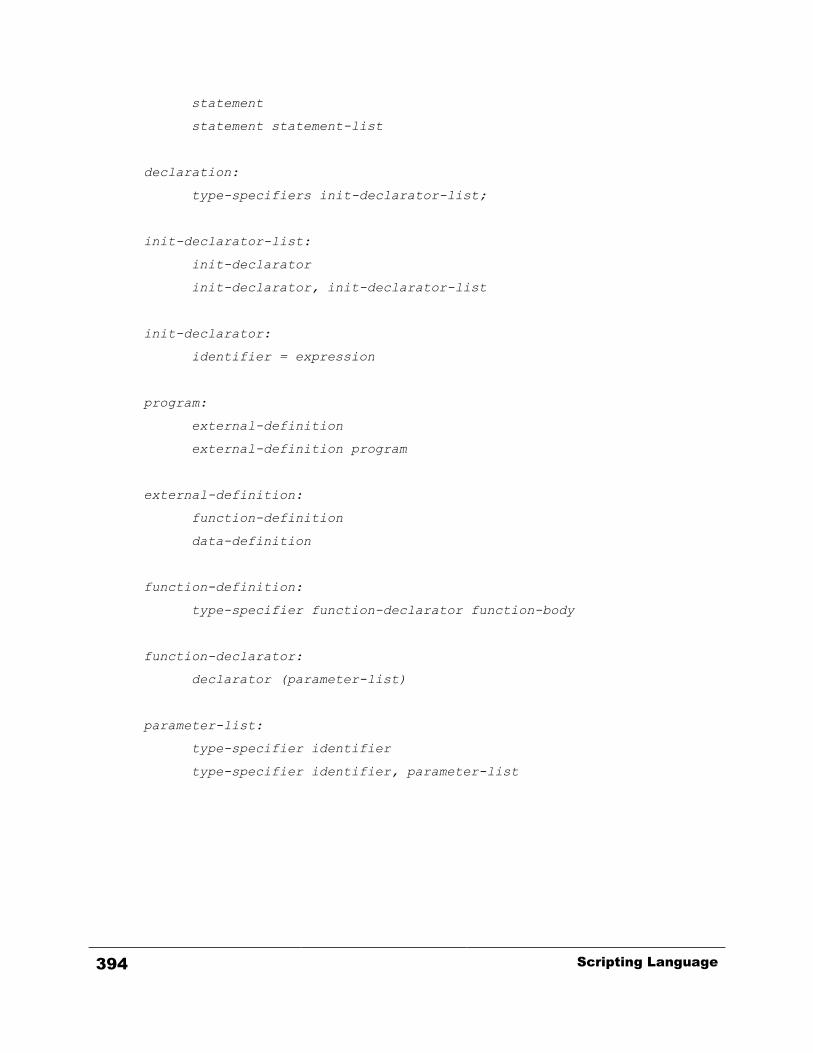
statement
statement statement-list
declaration:
type-specifiers init-declarator-list;
init-declarator-list:
init-declarator
init-declarator, init-declarator-list
init-declarator:
identifier = expression
program:
external-definition
external-definition program
external-definition:
function-definition
data-definition
function-definition:
type-specifier function-declarator function-body
function-declarator:
declarator (parameter-list)
parameter-list:
type-specifier identifier
type-specifier identifier, parameter-list
394 Scripting Language

function-body:
type-decl-list function-statement
function-statement:
{ declaration-list statement-list }
data-definition:
type-specifier init-declarator-list;
Scripting Language 395

Built-In Script Editor The Editor window provides an integrated tool for creating or updating script text files, with syntax cognizance assistance. The editor can support all three script types, including Master, Slave, and Test. Features of the Editor window include:
• Keyword color-coding • Syntax checking • Bookmarking • Full-featured find/replace with support for regular expressions • Standard editing tools, such as undo, redo, cut, copy, paste, print, and save.
With the Editor tool, the user can develop proper code even when the target device is not present. Keyword color-coding shows the user in real time whether certain words and function calls are recognized. Syntax checking will not only check for proper syntax, but also check whether functions referenced exist. The bookmark feature allows the user to mark relevant lines of the code for easy access. Lines containing syntax errors are marked for easy reference. As with any text editor, tools for finding and replacing text as well as cut, copy, paste, and print are included. Keyword color-coding is a feature that automatically colors keywords as they are being typed. When the editor recognizes that a word entered is a keyword in the scripting language or the name of a built-in function, that word is colored accordingly. This helps minimize inadvertent misspellings, and, coupled with syntax checking, allows the user to create syntactically correct scripts before executing them. Syntax checking is a useful tool that checks the syntax of the script. The user can check the syntax of the script by clicking on the “Syntax Check” button in the Editor Window. When a keyword is not recognized or there is a missing punctuation mark, the user will be alerted of that fact, and the line where the error occurred will be marked. In addition, the script also makes sure that all the functions referenced in the script exist and that the script follows the correct structure described earlier in this chapter. Bookmarking allows the user to mark certain lines in the script for later scrutiny. When the user inserts lines before the bookmark, the bookmarks are automatically moved along with the text. This is useful in long scripts to keep track of where important parts of the script are. The finding and replacing feature of the editor can mark all the lines found with a search. Users familiar with regular expressions will enjoy the flexibility offered by regular expression support. Standard editing tools such as undo, redo, cut, copy, paste, print, and save are included in the editor.
396 Scripting Language
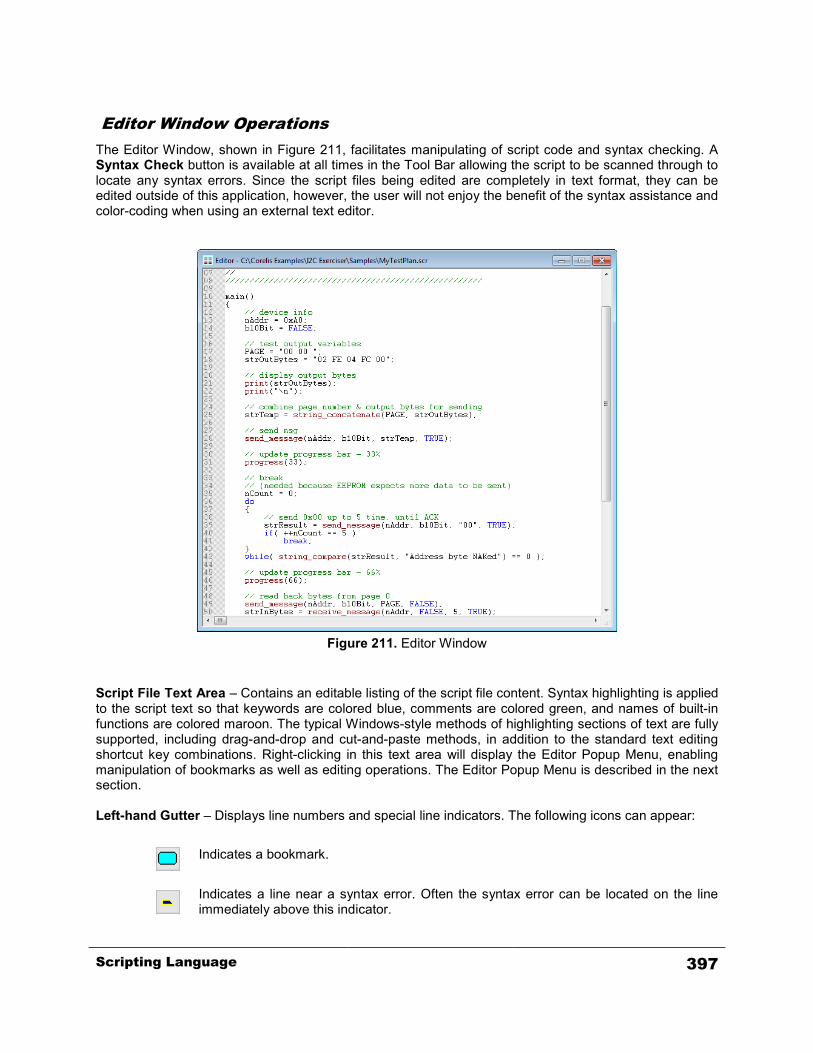
Editor Window Operations The Editor Window, shown in Figure 211, facilitates manipulating of script code and syntax checking. A Syntax Check button is available at all times in the Tool Bar allowing the script to be scanned through to locate any syntax errors. Since the script files being edited are completely in text format, they can be edited outside of this application, however, the user will not enjoy the benefit of the syntax assistance and color-coding when using an external text editor.
Figure 211. Editor Window
Script File Text Area – Contains an editable listing of the script file content. Syntax highlighting is applied to the script text so that keywords are colored blue, comments are colored green, and names of built-in functions are colored maroon. The typical Windows-style methods of highlighting sections of text are fully supported, including drag-and-drop and cut-and-paste methods, in addition to the standard text editing shortcut key combinations. Right-clicking in this text area will display the Editor Popup Menu, enabling manipulation of bookmarks as well as editing operations. The Editor Popup Menu is described in the next section. Left-hand Gutter – Displays line numbers and special line indicators. The following icons can appear:
Indicates a bookmark.
Indicates a line near a syntax error. Often the syntax error can be located on the line immediately above this indicator.
Scripting Language 397
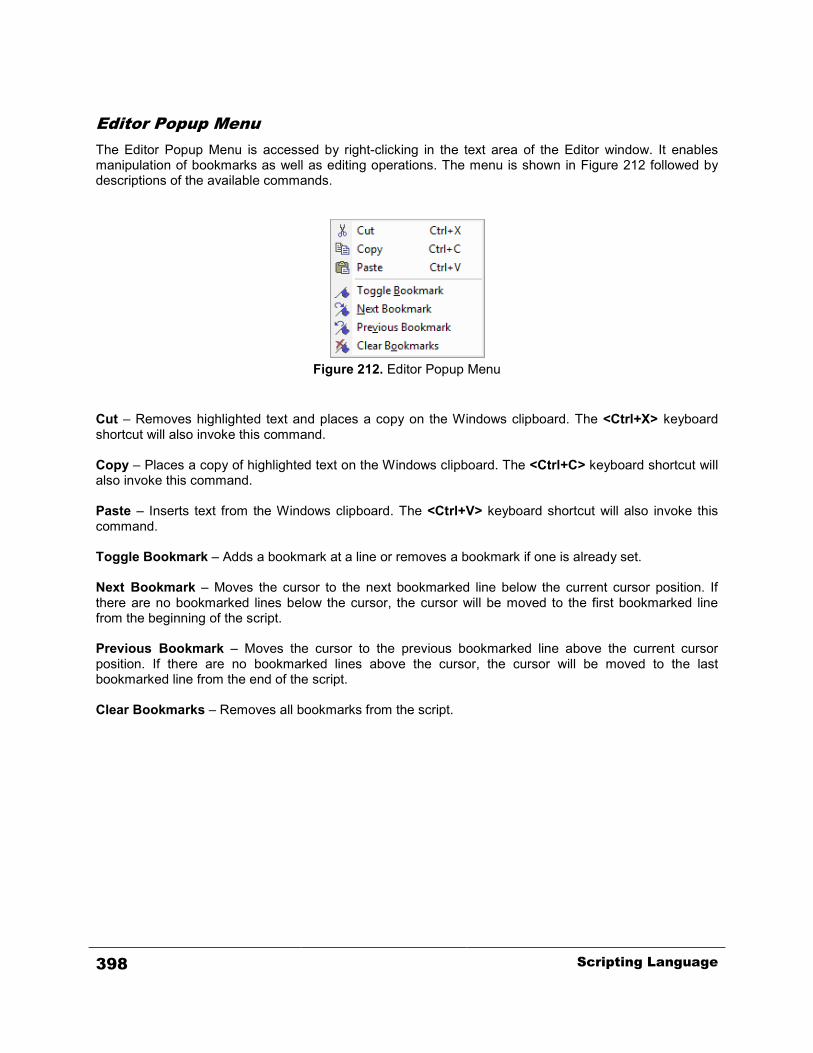
Editor Popup Menu The Editor Popup Menu is accessed by right-clicking in the text area of the Editor window. It enables manipulation of bookmarks as well as editing operations. The menu is shown in Figure 212 followed by descriptions of the available commands.
Figure 212. Editor Popup Menu
Cut – Removes highlighted text and places a copy on the Windows clipboard. The <Ctrl+X> keyboard shortcut will also invoke this command. Copy – Places a copy of highlighted text on the Windows clipboard. The <Ctrl+C> keyboard shortcut will also invoke this command. Paste – Inserts text from the Windows clipboard. The <Ctrl+V> keyboard shortcut will also invoke this command. Toggle Bookmark – Adds a bookmark at a line or removes a bookmark if one is already set. Next Bookmark – Moves the cursor to the next bookmarked line below the current cursor position. If there are no bookmarked lines below the cursor, the cursor will be moved to the first bookmarked line from the beginning of the script. Previous Bookmark – Moves the cursor to the previous bookmarked line above the current cursor position. If there are no bookmarked lines above the cursor, the cursor will be moved to the last bookmarked line from the end of the script. Clear Bookmarks – Removes all bookmarks from the script.
398 Scripting Language
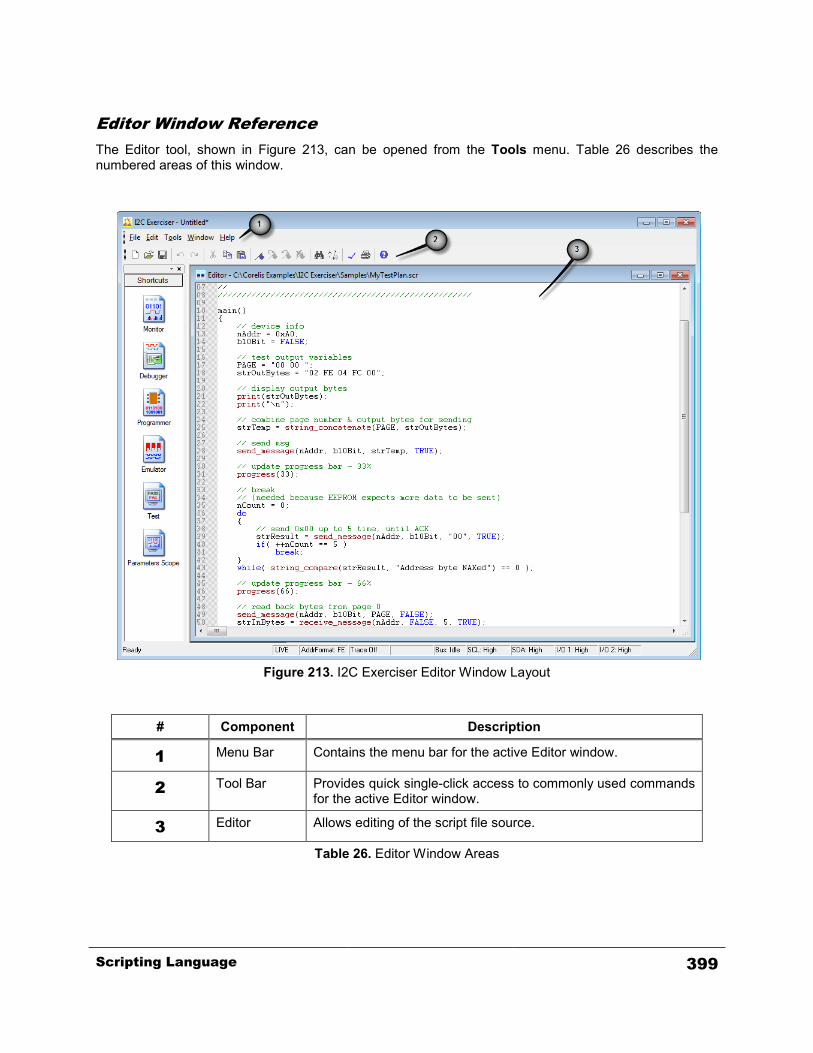
Editor Window Reference The Editor tool, shown in Figure 213, can be opened from the Tools menu. Table 26 describes the numbered areas of this window.
Figure 213. I2C Exerciser Editor Window Layout
# Component Description
1 Menu Bar Contains the menu bar for the active Editor window.
2 Tool Bar Provides quick single-click access to commonly used commands for the active Editor window.
3 Editor Allows editing of the script file source.
Table 26. Editor Window Areas
Scripting Language 399
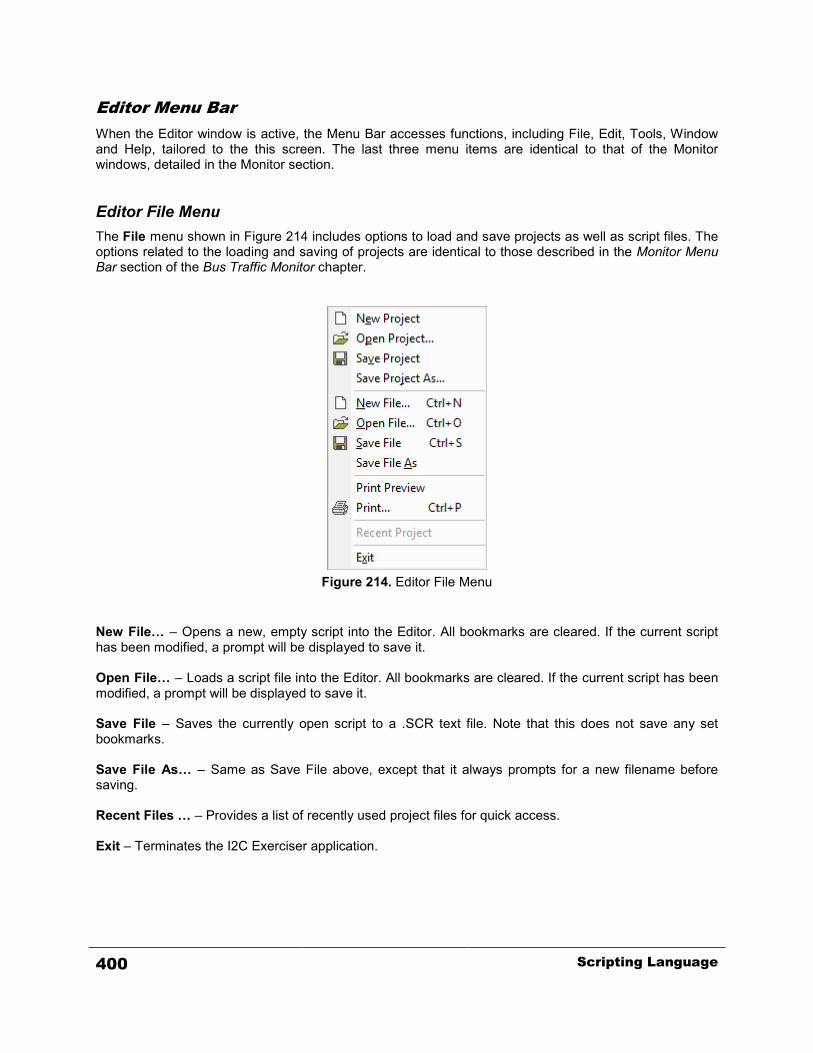
Editor Menu Bar When the Editor window is active, the Menu Bar accesses functions, including File, Edit, Tools, Window and Help, tailored to the this screen. The last three menu items are identical to that of the Monitor windows, detailed in the Monitor section. Editor File Menu The File menu shown in Figure 214 includes options to load and save projects as well as script files. The options related to the loading and saving of projects are identical to those described in the Monitor Menu Bar section of the Bus Traffic Monitor chapter.
Figure 214. Editor File Menu
New File… – Opens a new, empty script into the Editor. All bookmarks are cleared. If the current script has been modified, a prompt will be displayed to save it. Open File… – Loads a script file into the Editor. All bookmarks are cleared. If the current script has been modified, a prompt will be displayed to save it. Save File – Saves the currently open script to a .SCR text file. Note that this does not save any set bookmarks. Save File As… – Same as Save File above, except that it always prompts for a new filename before saving. Recent Files … – Provides a list of recently used project files for quick access. Exit – Terminates the I2C Exerciser application.
400 Scripting Language
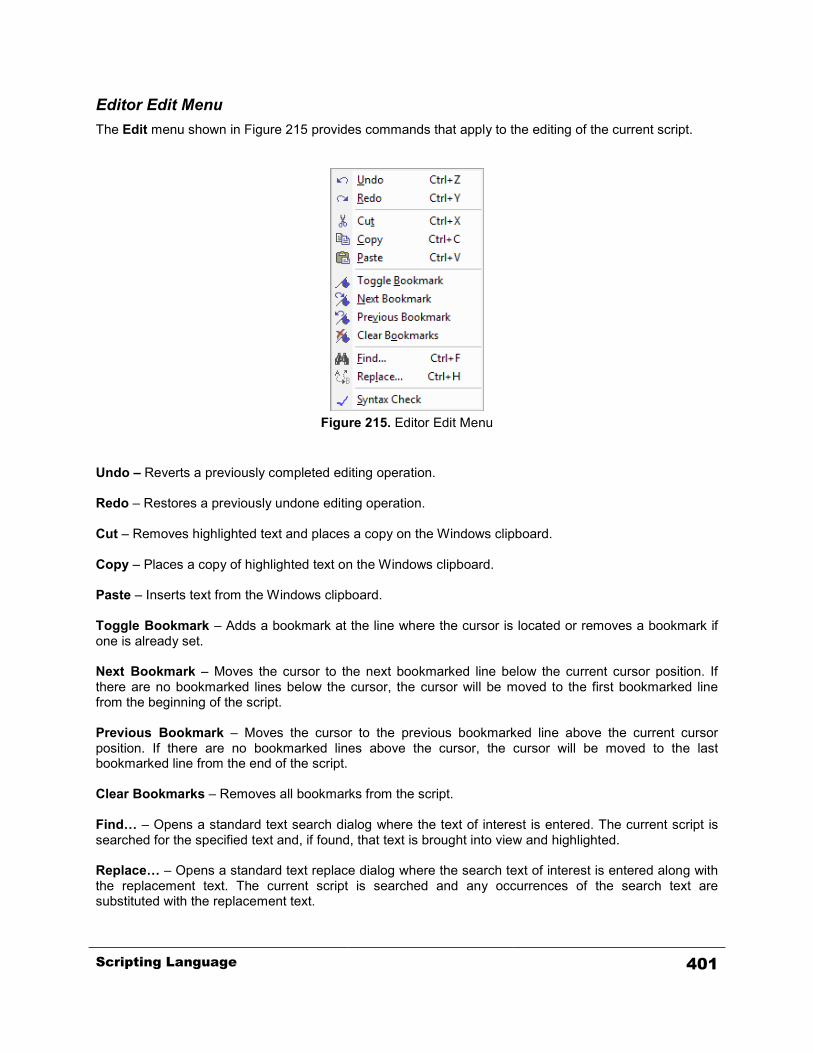
Editor Edit Menu The Edit menu shown in Figure 215 provides commands that apply to the editing of the current script.
Figure 215. Editor Edit Menu
Undo – Reverts a previously completed editing operation. Redo – Restores a previously undone editing operation. Cut – Removes highlighted text and places a copy on the Windows clipboard. Copy – Places a copy of highlighted text on the Windows clipboard. Paste – Inserts text from the Windows clipboard. Toggle Bookmark – Adds a bookmark at the line where the cursor is located or removes a bookmark if one is already set. Next Bookmark – Moves the cursor to the next bookmarked line below the current cursor position. If there are no bookmarked lines below the cursor, the cursor will be moved to the first bookmarked line from the beginning of the script. Previous Bookmark – Moves the cursor to the previous bookmarked line above the current cursor position. If there are no bookmarked lines above the cursor, the cursor will be moved to the last bookmarked line from the end of the script. Clear Bookmarks – Removes all bookmarks from the script. Find… – Opens a standard text search dialog where the text of interest is entered. The current script is searched for the specified text and, if found, that text is brought into view and highlighted. Replace… – Opens a standard text replace dialog where the search text of interest is entered along with the replacement text. The current script is searched and any occurrences of the search text are substituted with the replacement text.
Scripting Language 401

Syntax Check – Checks the syntax of the current script without executing it. The result of the syntax check is displayed in a popup message box. If a syntax error is found, any line associated with the error will also be marked in the left-hand gutter. Note that some errors cannot be detected before execution, such as function calls with an invalid number of arguments or unexpected argument types. Editor Tools Menu The Tools menu provides a path to the major application function windows. This is identical to the Monitor Tools Menu selections in the Bus Traffic Monitor chapter. Editor Window Menu The Window menu manages the various windows of I2C Exerciser and is identical to the Monitor Window Menu shown in the Bus Traffic Monitor chapter. Editor Help Menu The Help menu accesses the on-line help features and is identical to the Monitor Help Menu shown in the Bus Traffic Monitor chapter.
402 Scripting Language
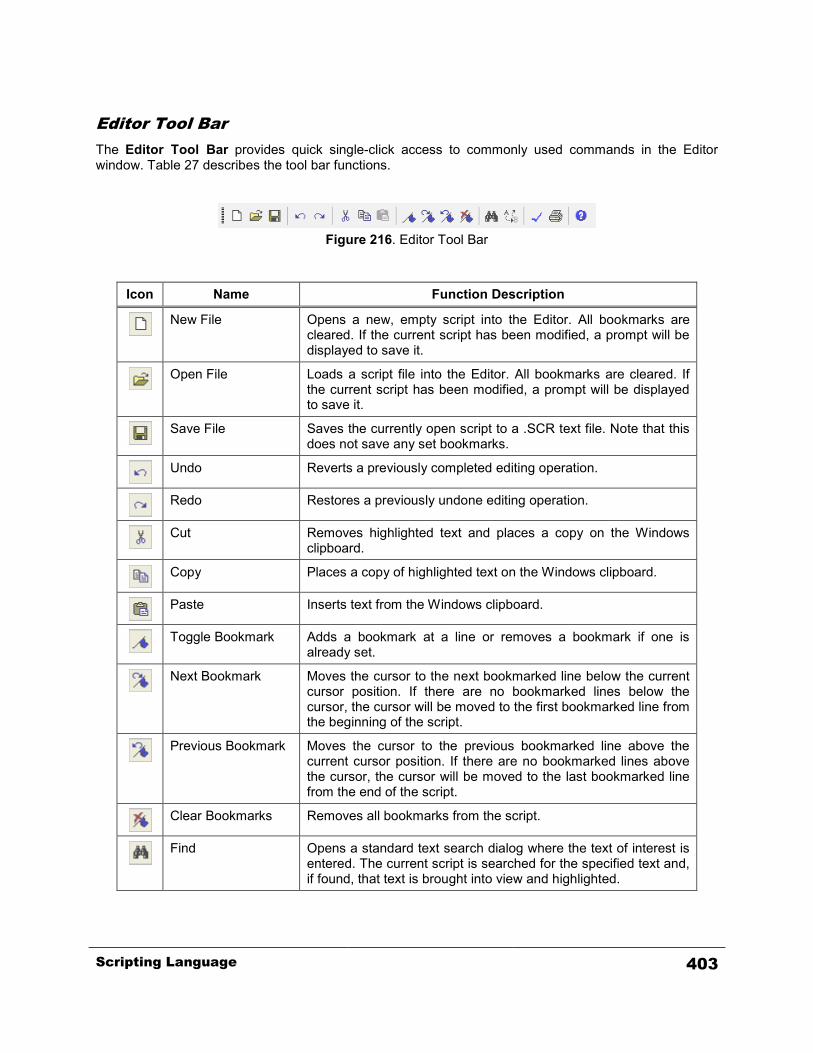
Editor Tool Bar The Editor Tool Bar provides quick single-click access to commonly used commands in the Editor window. Table 27 describes the tool bar functions.
Figure 216. Editor Tool Bar
Icon Name Function Description
New File Opens a new, empty script into the Editor. All bookmarks are
cleared. If the current script has been modified, a prompt will be displayed to save it.
Open File Loads a script file into the Editor. All bookmarks are cleared. If
the current script has been modified, a prompt will be displayed to save it.
Save File Saves the currently open script to a .SCR text file. Note that this
does not save any set bookmarks.
Undo Reverts a previously completed editing operation.
Redo Restores a previously undone editing operation.
Cut Removes highlighted text and places a copy on the Windows
clipboard.
Copy Places a copy of highlighted text on the Windows clipboard.
Paste Inserts text from the Windows clipboard.
Toggle Bookmark Adds a bookmark at a line or removes a bookmark if one is
already set.
Next Bookmark Moves the cursor to the next bookmarked line below the current
cursor position. If there are no bookmarked lines below the cursor, the cursor will be moved to the first bookmarked line from the beginning of the script.
Previous Bookmark Moves the cursor to the previous bookmarked line above the
current cursor position. If there are no bookmarked lines above the cursor, the cursor will be moved to the last bookmarked line from the end of the script.
Clear Bookmarks Removes all bookmarks from the script.
Find Opens a standard text search dialog where the text of interest is
entered. The current script is searched for the specified text and, if found, that text is brought into view and highlighted.
Scripting Language 403

Icon Name Function Description
Replace Opens a standard text replace dialog where the search text of
interest is entered along with the replacement text. The current script is searched and any occurrences of the search text are substituted with the replacement text.
Syntax Check Checks the syntax of the current script without executing it. The
result of the syntax check is displayed in a popup message box. If a syntax error is found, any line associated with the error will also be marked in the left-hand gutter. Note that some errors cannot be detected before execution, such as function calls with an invalid number of arguments or unexpected argument types.
Print Prints the current script file.
Help Provides quick access to the online help topics.
Table 27. Editor Tool Bar Icon Descriptions
404 Scripting Language

Chapter 14 Glitch Pattern Injection
Glitch Pattern Injection overview and descriptions
Overview The Glitch Pattern Injection feature allows you to inject glitches into the normal flow of traffic by forcing the SDA and SCL signals to high or low levels. Using this tool, you can inject most simple to very complex glitch patterns onto the target bus. This tool allows you to stress your unit under test with glitch errors and validate its robustness. Especially when designing SMBus compliant devices, this tool will allow you to easily test the glitch tolerance level of your devices. The Glitch Pattern Injection feature supports:
• Single glitch on SDA and/or SCL signal for durations from 20 ns to 5.2 ms • Complex glitch patterns with any combination of SDA and SCL signals for 1 to 1022 clock cycles
at a clock rate of 50 MHz down to 196 KHz • Configurable trigger condition using bus cycles and SDA / SCL edge directions • Triggering and injection of glitches independent of bus driver (target or analyzer) • Capturing and viewing of the glitch waveform
NOTE When the analyzer is driving the bus as an emulated master or slave, the glitch pattern operates as programmed. However, when a target is driving the bus, the outcome may vary for rising glitches injected while the target is driving the signals low. This outcome is unpredictable and varies depending on the electrical characteristics of the target since the analyzer is contending with an active driving source. Falling glitches do not suffer from this and always work when the bus is high, since the open-drain bus supports multiple low drivers. The glitch pattern is a combination of forcing the SDA and/or SCL signals high or low for specified durations at specified time delays from the trigger condition. The trigger condition consists of a bus cycle (Address, Data, Start, Stop, Restart or ACK/NAK) and/or an edge direction of the SDA or SCL signal. When the trigger condition is detected on the bus, the user defined glitch pattern is injected into the bus traffic. In order to use this powerful feature, you must follow the proper steps. To begin, you need to create the glitch pattern and the triggering conditions using the Glitch Pattern Editor tool. With this tool, you are able to draw the glitch patterns, define the trigger conditions, test them, and save them for later use in Master or Slave Emulation scripts. Since this tool lets you design and test the glitch injections interactively with live targets, you may choose not to use the Master or Slave Emulations. However, if you ever require automatic script-based test sessions, you can employ glitch injection commands in the emulation script files. The next two sections will describe how to use the Glitch Pattern Editor and how to add the glitch injections to Master and Slave Emulation scripts.
Glitch Pattern Injection 405
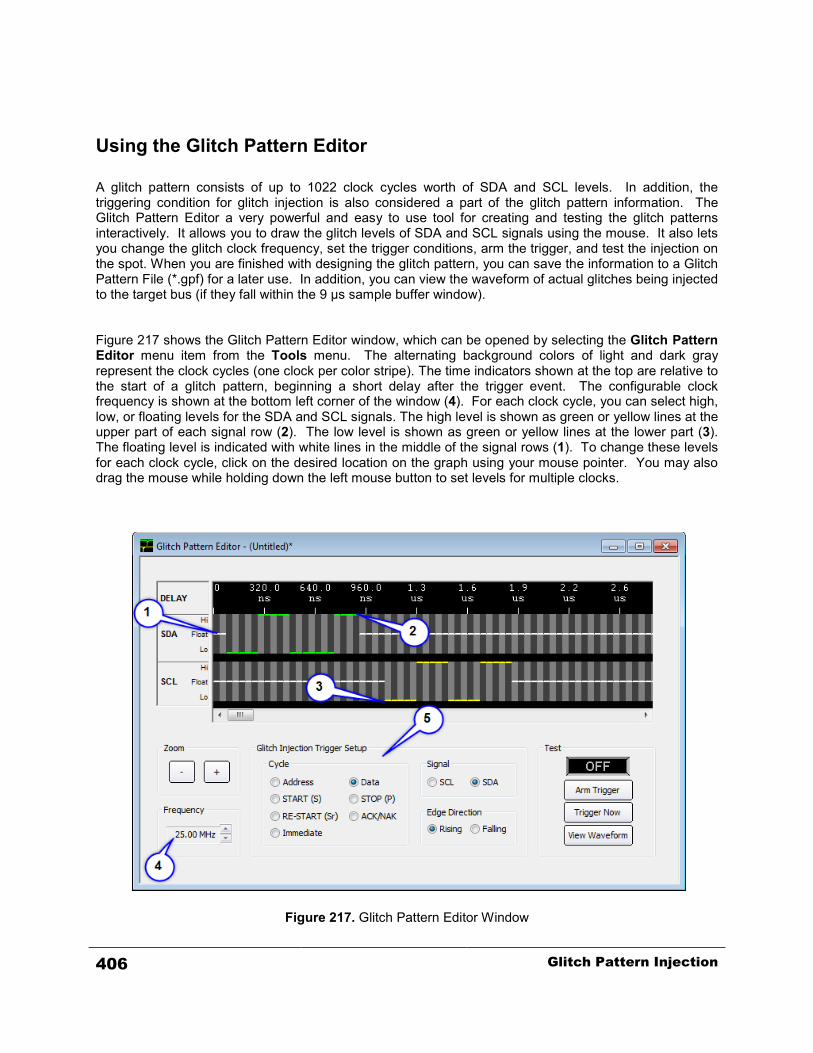
Using the Glitch Pattern Editor A glitch pattern consists of up to 1022 clock cycles worth of SDA and SCL levels. In addition, the triggering condition for glitch injection is also considered a part of the glitch pattern information. The Glitch Pattern Editor a very powerful and easy to use tool for creating and testing the glitch patterns interactively. It allows you to draw the glitch levels of SDA and SCL signals using the mouse. It also lets you change the glitch clock frequency, set the trigger conditions, arm the trigger, and test the injection on the spot. When you are finished with designing the glitch pattern, you can save the information to a Glitch Pattern File (*.gpf) for a later use. In addition, you can view the waveform of actual glitches being injected to the target bus (if they fall within the 9 µs sample buffer window). Figure 217 shows the Glitch Pattern Editor window, which can be opened by selecting the Glitch Pattern Editor menu item from the Tools menu. The alternating background colors of light and dark gray represent the clock cycles (one clock per color stripe). The time indicators shown at the top are relative to the start of a glitch pattern, beginning a short delay after the trigger event. The configurable clock frequency is shown at the bottom left corner of the window (4). For each clock cycle, you can select high, low, or floating levels for the SDA and SCL signals. The high level is shown as green or yellow lines at the upper part of each signal row (2). The low level is shown as green or yellow lines at the lower part (3). The floating level is indicated with white lines in the middle of the signal rows (1). To change these levels for each clock cycle, click on the desired location on the graph using your mouse pointer. You may also drag the mouse while holding down the left mouse button to set levels for multiple clocks.
Figure 217. Glitch Pattern Editor Window
406 Glitch Pattern Injection
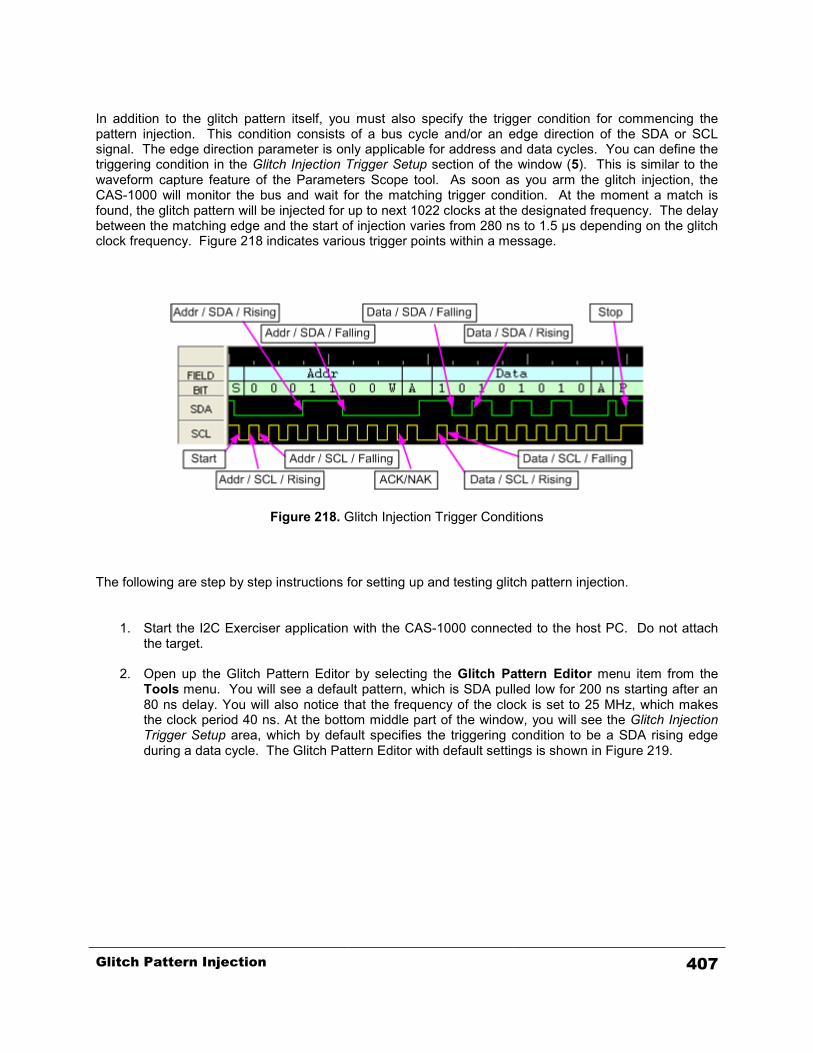
In addition to the glitch pattern itself, you must also specify the trigger condition for commencing the pattern injection. This condition consists of a bus cycle and/or an edge direction of the SDA or SCL signal. The edge direction parameter is only applicable for address and data cycles. You can define the triggering condition in the Glitch Injection Trigger Setup section of the window (5). This is similar to the waveform capture feature of the Parameters Scope tool. As soon as you arm the glitch injection, the CAS-1000 will monitor the bus and wait for the matching trigger condition. At the moment a match is found, the glitch pattern will be injected for up to next 1022 clocks at the designated frequency. The delay between the matching edge and the start of injection varies from 280 ns to 1.5 µs depending on the glitch clock frequency. Figure 218 indicates various trigger points within a message.
Figure 218. Glitch Injection Trigger Conditions The following are step by step instructions for setting up and testing glitch pattern injection.
1. Start the I2C Exerciser application with the CAS-1000 connected to the host PC. Do not attach the target.
2. Open up the Glitch Pattern Editor by selecting the Glitch Pattern Editor menu item from the
Tools menu. You will see a default pattern, which is SDA pulled low for 200 ns starting after an 80 ns delay. You will also notice that the frequency of the clock is set to 25 MHz, which makes the clock period 40 ns. At the bottom middle part of the window, you will see the Glitch Injection Trigger Setup area, which by default specifies the triggering condition to be a SDA rising edge during a data cycle. The Glitch Pattern Editor with default settings is shown in Figure 219.
Glitch Pattern Injection 407
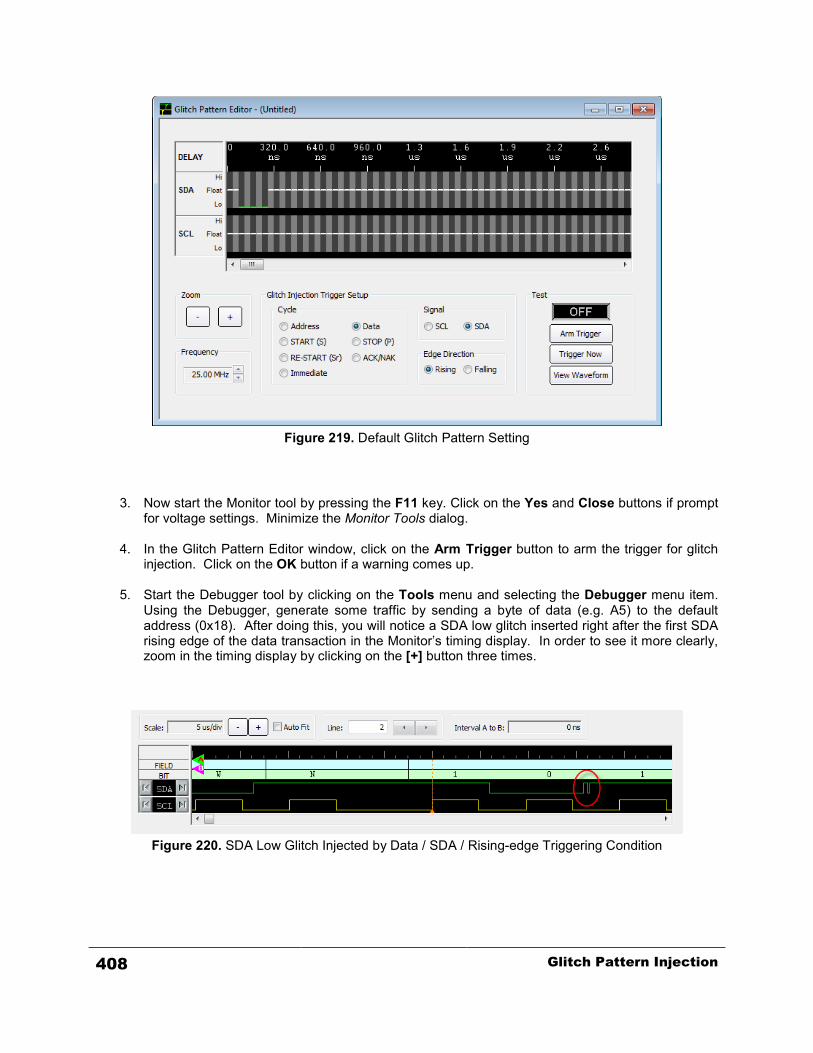
Figure 219. Default Glitch Pattern Setting
3. Now start the Monitor tool by pressing the F11 key. Click on the Yes and Close buttons if prompt for voltage settings. Minimize the Monitor Tools dialog.
4. In the Glitch Pattern Editor window, click on the Arm Trigger button to arm the trigger for glitch
injection. Click on the OK button if a warning comes up.
5. Start the Debugger tool by clicking on the Tools menu and selecting the Debugger menu item. Using the Debugger, generate some traffic by sending a byte of data (e.g. A5) to the default address (0x18). After doing this, you will notice a SDA low glitch inserted right after the first SDA rising edge of the data transaction in the Monitor’s timing display. In order to see it more clearly, zoom in the timing display by clicking on the [+] button three times.
Figure 220. SDA Low Glitch Injected by Data / SDA / Rising-edge Triggering Condition
408 Glitch Pattern Injection
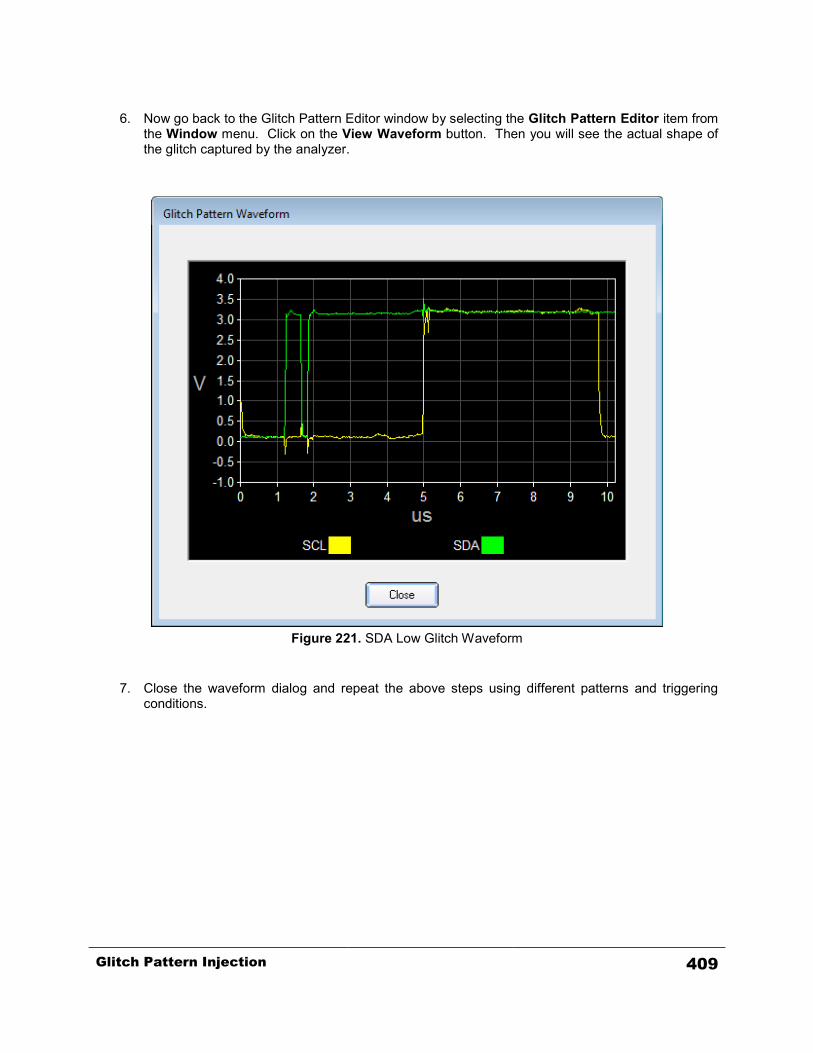
6. Now go back to the Glitch Pattern Editor window by selecting the Glitch Pattern Editor item from
the Window menu. Click on the View Waveform button. Then you will see the actual shape of the glitch captured by the analyzer.
Figure 221. SDA Low Glitch Waveform
7. Close the waveform dialog and repeat the above steps using different patterns and triggering conditions.
Glitch Pattern Injection 409
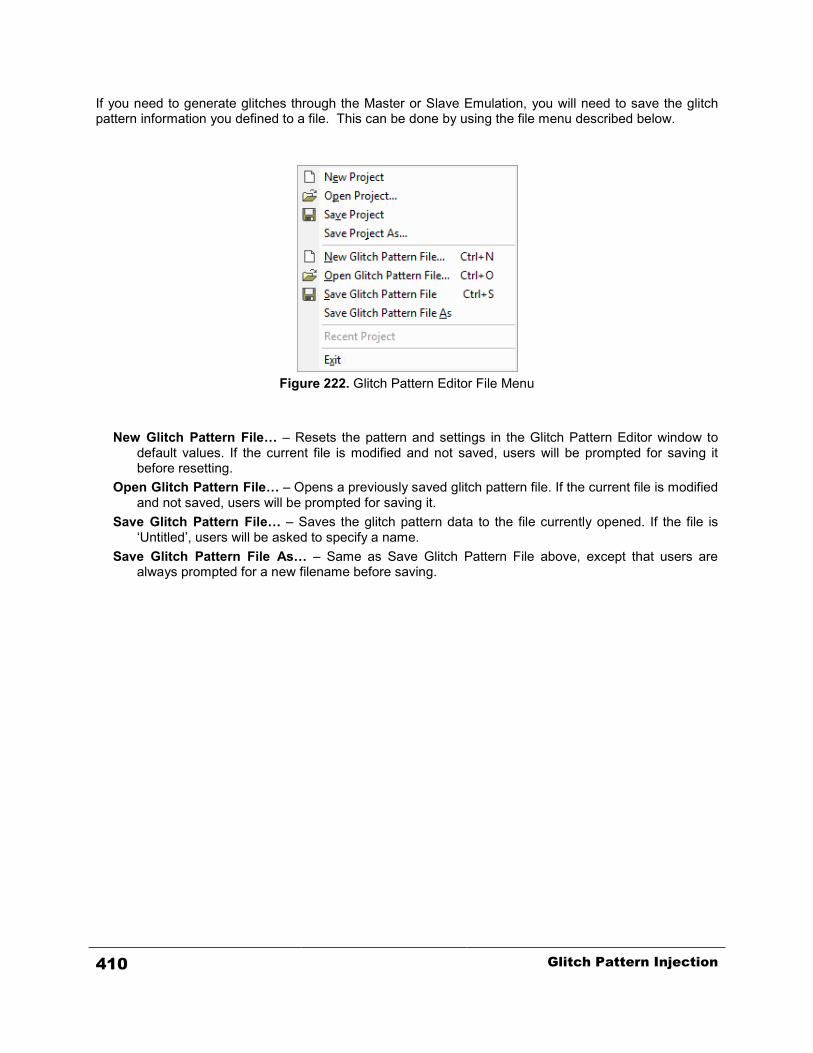
If you need to generate glitches through the Master or Slave Emulation, you will need to save the glitch pattern information you defined to a file. This can be done by using the file menu described below.
Figure 222. Glitch Pattern Editor File Menu
New Glitch Pattern File… – Resets the pattern and settings in the Glitch Pattern Editor window to default values. If the current file is modified and not saved, users will be prompted for saving it before resetting.
Open Glitch Pattern File… – Opens a previously saved glitch pattern file. If the current file is modified and not saved, users will be prompted for saving it.
Save Glitch Pattern File… – Saves the glitch pattern data to the file currently opened. If the file is ‘Untitled’, users will be asked to specify a name.
Save Glitch Pattern File As… – Same as Save Glitch Pattern File above, except that users are always prompted for a new filename before saving.
410 Glitch Pattern Injection

Adding Glitch Patterns to Master and Slave Emulation Once you have created a glitch pattern file, you can now use the file to insert glitches during Master or Slave emulation sessions. The ability to add glitch injection to the Master or Slave Emulation lets you create a portable test script that can be easily rerun over and over again for production or validation tests. During Master Emulation, when the master is sending data to a slave, you will have the ability to arm the glitch pattern right before any address or data transactions. When receiving data, however, you will be able to arm the injection only before the start of whole message. During Slave Emulation, when a master is reading from the emulated slave, you will be able to specify when the glitch is armed by placing a keyword in front of any byte in the slave data file. When the slave is receiving data (being written to), however, you will not have the choice.
Master Emulation and Glitch Injection In order to add glitches to the messages sent or received by the master during emulation, you have to use special functions and a keyword. The function ‘load_glitch’ must be called before every glitch injection. The first parameter of the function is the path to a glitch pattern file (*.gpf). The second parameter is to indicate whether the glitch trigger should be armed immediately or should be armed when it sees the ‘ARM_GLITCH’ keyword in the ‘send_message’ data stream. Using the keyword gives you the flexibility of specifying which byte in the message the trigger will be applied to. The following are some examples of using these functions and the keyword. For detailed descriptions of the functions used here, please refer to the Scripting Language chapter.
[Example 1] In the following example, the glitch pattern and the trigger are armed before the master starts sending the message. The trigger will be effective for the whole message beginning from the address byte. Therefore, depending on the triggering condition defined in the glitch pattern file (simple1.gpf), the glitch can be injected anywhere from the start bit to the stop bit of the message.
main() { load_glitch("C:\\Corelis Examples\\I2C Exerciser\\Samples\\simple1.gpf", TRUE); send_message(0x18, FALSE, "12 34 AB CD", TRUE); }
Glitch Pattern Injection 411

[Example 2]
In the following example, the glitch pattern is also loaded when the ‘load_glitch’ function is called. However, the trigger is not armed until the ‘ARM_GLITCH’ keyword is seen in the data stream. Therefore, the trigger will be applied to the data bytes 2, 3, and 4 of the message only, with the condition specified in the loaded file. If the trigger was specified for an address cycle, it would not find the match and would never inject the glitch. This type of injection is useful when you want to inject the glitch to a particular data byte within a message.
main() { load_glitch("C:\\Corelis Examples\\I2C Exerciser\\Samples\\simple1.gpf", FALSE); send_message(0x18, FALSE, "12 ARM_GLITCH 34 AB CD", TRUE); }
[Example 3]
In the following example, the glitch pattern and the trigger are armed before the master receives the message. The trigger will be effective for the whole message beginning from the address byte. For injecting glitch while master is receiving data, the arming must happen with the ‘load_glitch’ function because the ‘ARM_GLITCH’ keyword cannot be used for specifying a location within the data stream.
main() { load_glitch("C:\\Corelis Examples\\I2C Exerciser\\Samples\\simple1.gpf", TRUE); receive_message(0x18, FALSE, 4, TRUE); }
[Example 4]
The following example shows a repeated use of glitch injection using a looping method. Here, the ‘reload_glitch’ function is used to avoid loading of the pattern data from the file every time to improve performance. The ‘reload_glitch’ function will use the previously loaded pattern in the memory instead of loading it directly from the file. Therefore, it should only be used after the ‘load_glitch’ function is called at least once.
main() { load_glitch("C:\\Corelis Examples\\I2C Exerciser\\Samples\\simple1.gpf", FALSE); send_message(0x18, FALSE, "12 ARM_GLITCH 34 AB CD", TRUE); for (i=0; i<10; i++) // repeat 10 more times { reload_glitch(FALSE); send_message(0x18, FALSE, "12 ARM_GLITCH 34 AB CD", TRUE); } }
412 Glitch Pattern Injection
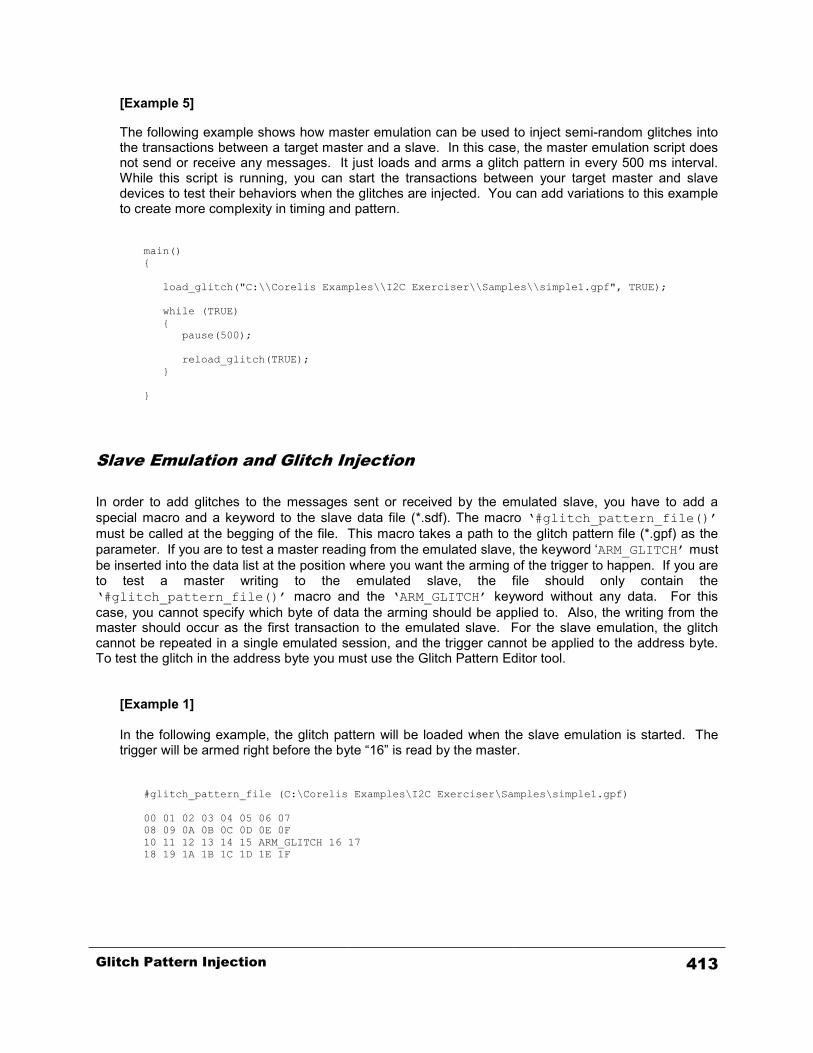
[Example 5]
The following example shows how master emulation can be used to inject semi-random glitches into the transactions between a target master and a slave. In this case, the master emulation script does not send or receive any messages. It just loads and arms a glitch pattern in every 500 ms interval. While this script is running, you can start the transactions between your target master and slave devices to test their behaviors when the glitches are injected. You can add variations to this example to create more complexity in timing and pattern.
main() { load_glitch("C:\\Corelis Examples\\I2C Exerciser\\Samples\\simple1.gpf", TRUE); while (TRUE) { pause(500); reload_glitch(TRUE); } }
Slave Emulation and Glitch Injection In order to add glitches to the messages sent or received by the emulated slave, you have to add a special macro and a keyword to the slave data file (*.sdf). The macro ‘#glitch_pattern_file()’ must be called at the begging of the file. This macro takes a path to the glitch pattern file (*.gpf) as the parameter. If you are to test a master reading from the emulated slave, the keyword ‘ARM_GLITCH’ must be inserted into the data list at the position where you want the arming of the trigger to happen. If you are to test a master writing to the emulated slave, the file should only contain the ‘#glitch_pattern_file()’ macro and the ‘ARM_GLITCH’ keyword without any data. For this case, you cannot specify which byte of data the arming should be applied to. Also, the writing from the master should occur as the first transaction to the emulated slave. For the slave emulation, the glitch cannot be repeated in a single emulated session, and the trigger cannot be applied to the address byte. To test the glitch in the address byte you must use the Glitch Pattern Editor tool.
[Example 1]
In the following example, the glitch pattern will be loaded when the slave emulation is started. The trigger will be armed right before the byte “16” is read by the master.
#glitch_pattern_file (C:\Corelis Examples\I2C Exerciser\Samples\simple1.gpf) 00 01 02 03 04 05 06 07 08 09 0A 0B 0C 0D 0E 0F 10 11 12 13 14 15 ARM_GLITCH 16 17 18 19 1A 1B 1C 1D 1E 1F
Glitch Pattern Injection 413

[Example 2]
In the following two cases, the glitch pattern will be loaded when the emulation is started. The trigger will be armed right after the master initiates the reading or writing to the emulated slave.
// case 1) Master Reading from Emulated Slave #glitch_pattern_file (C:\Corelis Examples\I2C Exerciser\Samples\simple1.gpf) ARM_GLITCH 00 01 02 03 04 05 06 07 08 09 0A 0B 0C 0D 0E 0F 10 11 12 13 14 15 16 17 18 19 1A 1B 1C 1D 1E 1F // case 2) Master Writing to Emulator Slave #glitch_pattern_file (C:\Corelis Examples\I2C Exerciser\Samples\simple1.gpf) ARM_GLITCH
For more Master and Slave Emulation sample scripts using glitch injections, refer to the “Samples” subfolder under the I2C Exerciser’s installation folder.
414 Glitch Pattern Injection

Glitch Pattern Injection 415

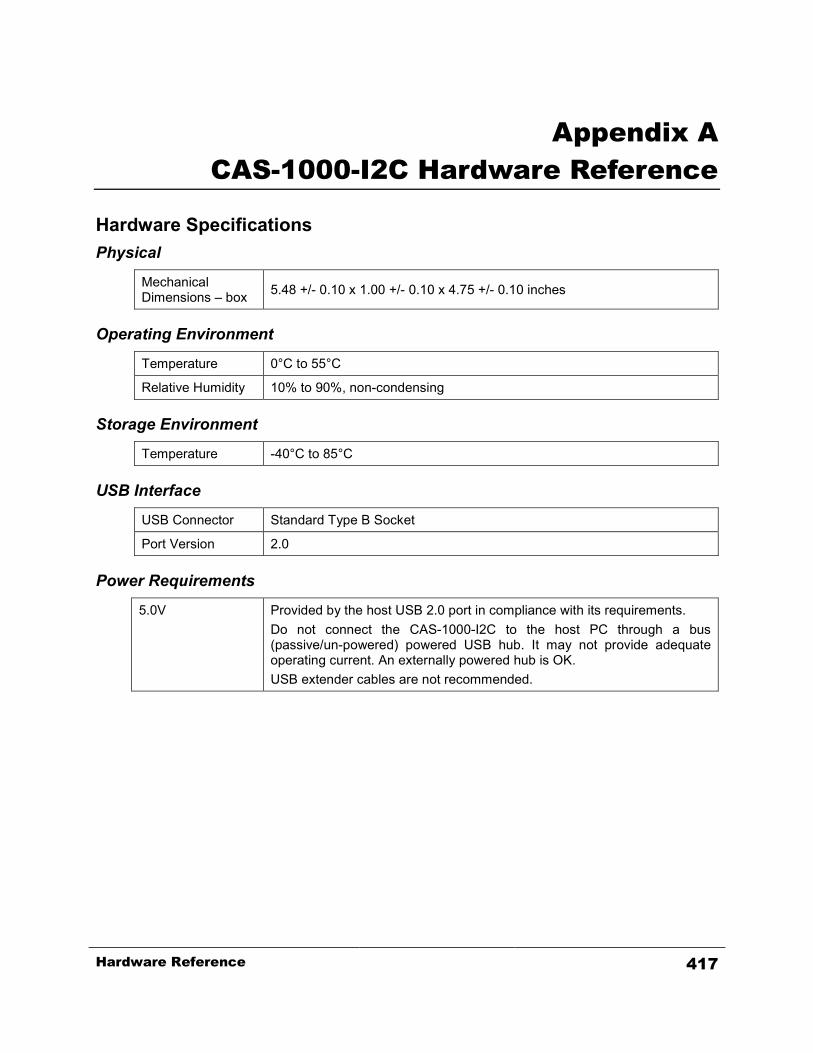
Appendix A CAS-1000-I2C Hardware Reference
Hardware Specifications Physical
Mechanical Dimensions – box 5.48 +/- 0.10 x 1.00 +/- 0.10 x 4.75 +/- 0.10 inches
Operating Environment
Temperature 0°C to 55°C
Relative Humidity 10% to 90%, non-condensing Storage Environment
Temperature -40°C to 85°C USB Interface
USB Connector Standard Type B Socket
Port Version 2.0 Power Requirements
5.0V Provided by the host USB 2.0 port in compliance with its requirements. Do not connect the CAS-1000-I2C to the host PC through a bus (passive/un-powered) powered USB hub. It may not provide adequate operating current. An externally powered hub is OK. USB extender cables are not recommended.
Hardware Reference 417
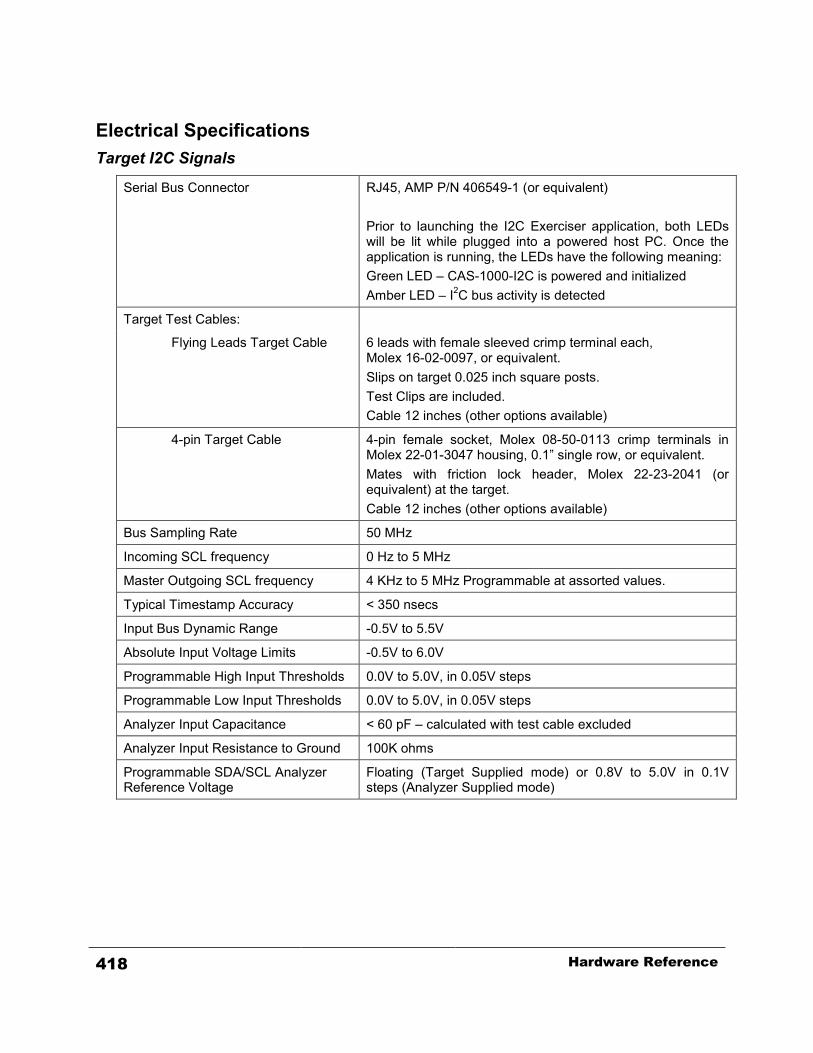
Electrical Specifications Target I2C Signals
Serial Bus Connector RJ45, AMP P/N 406549-1 (or equivalent) Prior to launching the I2C Exerciser application, both LEDs will be lit while plugged into a powered host PC. Once the application is running, the LEDs have the following meaning: Green LED – CAS-1000-I2C is powered and initialized Amber LED – I2C bus activity is detected
Target Test Cables:
Flying Leads Target Cable
6 leads with female sleeved crimp terminal each, Molex 16-02-0097, or equivalent. Slips on target 0.025 inch square posts. Test Clips are included. Cable 12 inches (other options available)
4-pin Target Cable 4-pin female socket, Molex 08-50-0113 crimp terminals in Molex 22-01-3047 housing, 0.1” single row, or equivalent. Mates with friction lock header, Molex 22-23-2041 (or equivalent) at the target. Cable 12 inches (other options available)
Bus Sampling Rate 50 MHz
Incoming SCL frequency 0 Hz to 5 MHz
Master Outgoing SCL frequency 4 KHz to 5 MHz Programmable at assorted values.
Typical Timestamp Accuracy < 350 nsecs
Input Bus Dynamic Range -0.5V to 5.5V
Absolute Input Voltage Limits -0.5V to 6.0V
Programmable High Input Thresholds 0.0V to 5.0V, in 0.05V steps
Programmable Low Input Thresholds 0.0V to 5.0V, in 0.05V steps
Analyzer Input Capacitance < 60 pF – calculated with test cable excluded
Analyzer Input Resistance to Ground 100K ohms
Programmable SDA/SCL Analyzer Reference Voltage
Floating (Target Supplied mode) or 0.8V to 5.0V in 0.1V steps (Analyzer Supplied mode)
418 Hardware Reference
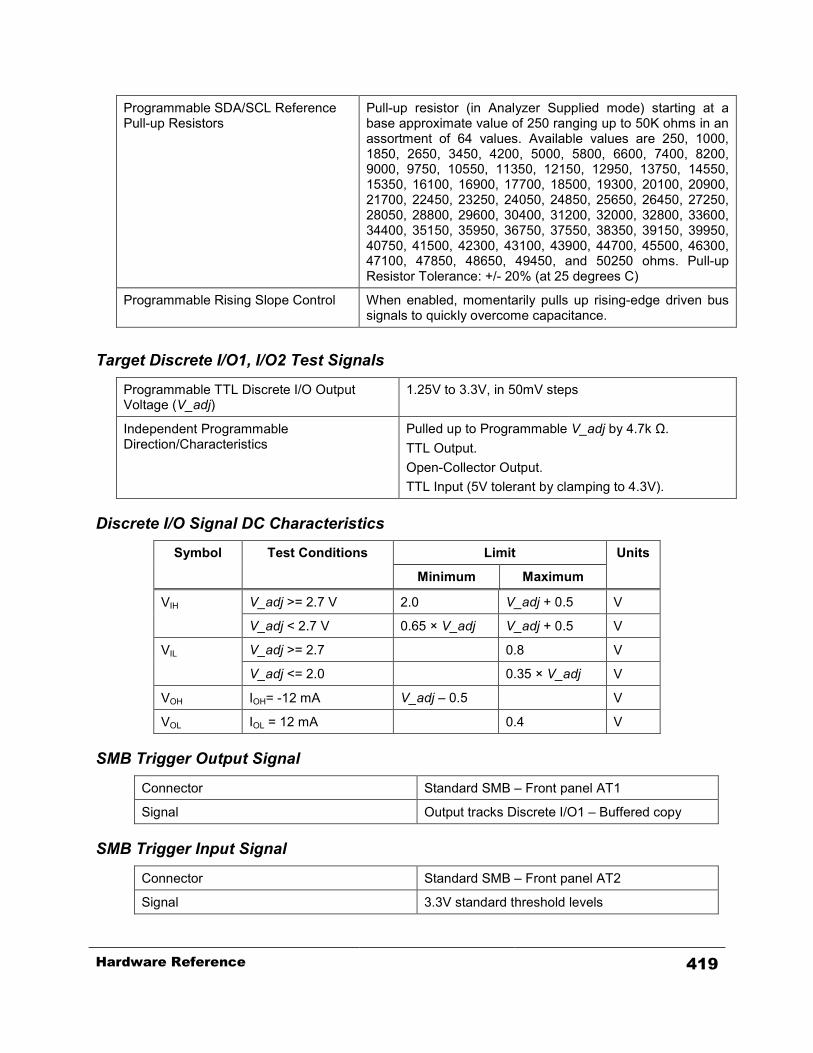
Programmable SDA/SCL Reference Pull-up Resistors
Pull-up resistor (in Analyzer Supplied mode) starting at a base approximate value of 250 ranging up to 50K ohms in an assortment of 64 values. Available values are 250, 1000, 1850, 2650, 3450, 4200, 5000, 5800, 6600, 7400, 8200, 9000, 9750, 10550, 11350, 12150, 12950, 13750, 14550, 15350, 16100, 16900, 17700, 18500, 19300, 20100, 20900, 21700, 22450, 23250, 24050, 24850, 25650, 26450, 27250, 28050, 28800, 29600, 30400, 31200, 32000, 32800, 33600, 34400, 35150, 35950, 36750, 37550, 38350, 39150, 39950, 40750, 41500, 42300, 43100, 43900, 44700, 45500, 46300, 47100, 47850, 48650, 49450, and 50250 ohms. Pull-up Resistor Tolerance: +/- 20% (at 25 degrees C)
Programmable Rising Slope Control When enabled, momentarily pulls up rising-edge driven bus
signals to quickly overcome capacitance.
Target Discrete I/O1, I/O2 Test Signals
Programmable TTL Discrete I/O Output Voltage (V_adj)
1.25V to 3.3V, in 50mV steps
Independent Programmable Direction/Characteristics
Pulled up to Programmable V_adj by 4.7k Ω. TTL Output. Open-Collector Output. TTL Input (5V tolerant by clamping to 4.3V).
Discrete I/O Signal DC Characteristics
Symbol Test Conditions Limit Units
Minimum Maximum
VIH V_adj >= 2.7 V 2.0 V_adj + 0.5 V
V_adj < 2.7 V 0.65 × V_adj V_adj + 0.5 V
VIL V_adj >= 2.7 0.8 V
V_adj <= 2.0 0.35 × V_adj V
VOH IOH= -12 mA V_adj – 0.5 V
VOL IOL = 12 mA 0.4 V SMB Trigger Output Signal
Connector Standard SMB – Front panel AT1
Signal Output tracks Discrete I/O1 – Buffered copy SMB Trigger Input Signal
Connector Standard SMB – Front panel AT2
Signal 3.3V standard threshold levels
Hardware Reference 419

- The CAS-1000-I2C/E supports SCL frequencies of up to 5 MHz, but actual performance may be limited due to target bus conditions, such as parasitic capacitance and pull-up resistance (rise-time). - Standard/Fast/Fast-mode Plus is supported for master emulation and monitoring up to 5MHz; Standard/Fast/Fast-mode Plus is supported for Slave emulation up to 1.9MHz; High-Speed mode is supported for target monitoring only up to 5 MHz (no emulation).
420 Hardware Reference