Embed Size (px)
Citation preview

Enbridge Energy Partners, L.P.
Completes Strategic Review;
Returning to a pure-play liquids MLP

Legal Notice
This presentation includes forward-looking statements and projections, which are statements that do not relate strictly to historical or current facts. These statements include future financial performance or frequently use the following words, variations thereon or comparable terminology: “anticipate,” “believe,” “consider,” “continue,” “could,” “estimate,” “expect,” “explore,” “evaluate,” “forecast,” “intend,” “may,” “opportunity,” “plan,” “position,” “projection,” “should,” “strategy,” “target,” “will” and similar words. Although the Partnership believes that such forward-looking statements are reasonable based on currently available information, such statements involve risks, uncertainties and assumptions and are not guarantees of performance. Future actions, conditions or events and future results of operations may differ materially from those expressed in these forward-looking statements. Many of the factors that will determine these results are beyond the Partnership’s ability to control or predict. Specific factors that could cause actual results to differ from those in the forward-looking statements include: (1) changes in the demand for or the supply of, forecast data for, and price trends related to crude oil, liquid petroleum, natural gas and NGLs, including the rate of development of the Alberta Oil Sands and shut-downs or cutbacks at refineries, petrochemical plants, utilities or other businesses for which the Partnership transports products or to whom the Partnership sells products; (2) the ability of the Partnership or its joint venture partners, as applicable, to successfully complete and finance projects, including the Bakken Pipeline transaction; (3) the effects of competition, in particular, by other pipeline systems; (4) hazards and operating risks that may not be covered fully by insurance; (5) costs in connection with complying with the settlement consent decree related to Line 6B and Line 6A, which is still subject to court approval, and/or the failure to receive court approval of, or material modifications to, such decree; (6) changes in or challenges to the Partnership’s tariff rates; (7) changes in laws or regulations to which the Partnership is subject, including compliance with environmental and operational safety regulations that may increase costs of system integrity testing and maintenance; and (8) permitting at federal, state and local levels or renewals of rights of way.
“Enbridge” refers collectively to Enbridge Inc. and its subsidiaries other than the Partnership and its subsidiaries.
Forward-looking statements regarding sponsor support transactions or sales of assets (to Enbridge or otherwise) are further qualified by the fact that Enbridge is under no obligation to provide additional sponsor support and neither Enbridge nor any third party is under any obligation to offer to buy or sell us assets, and we are under no obligation to buy or sell any such assets. As a result, we do not know when or if any such transactions will occur. Any statements regarding sponsor expectations or intentions are based on information communicated to us by Enbridge, but there can be no assurance that these expectations or intentions will not change in the future.
Except to the extent required by law, we assume no obligation to publicly update or revise any forward-looking statements, whether as a result of new information, future events or otherwise. Reference should also be made to the Partnership’s filings with the U.S. Securities and Exchange Commission (the “SEC”), including its Annual Report on Form 10-K , Current Reports on Form 8-K and any subsequently filed Quarterly Report on Form 10-Q for additional factors that may affect results. These filings are available to the public over the Internet at the SEC’s web site (www.sec.gov) and at the Partnership’s web site.
2
Restructuring Highlights Key Outcomes of Strategic Review
Redeemed
preferred units;
simplified IDRs
~96%
Cost of service or
equivalent*; Take-or-pay
3
Strong
Distribution
Coverage
1.2x total
1.5x cash
Growth
through
Secured JFAs
~3% Divested
gas business
Investment
Grade
Credit Profile
4.5x
4.0x 2017-2020
Consolidated Debt/EBITDA
DCF/Unit
growth CAGR
Low risk, pure-play liquids pipeline MLP provides attractive risk-adjusted returns for unitholders
Purified
Asset Mix
Low-risk,
“Utility-like”
Business
Simplified
Capital
Structure
*Contract terms for our Lakehead system expansion projects mitigate volume risk for all expansions subsequent to Alberta Clipper. In the event volumes were to decline by approximately 500Kbpd from current levels out of the Superior, Wisconsin terminal, Lakehead could be subject to volume risk, however, the pipeline could potentially file cost of service rates if there was a substantial divergence between costs and revenues mitigating volume risk. Similarly, our ND system can also file cost of service rates if there is a substantial divergence between costs and revenues on the pipeline.

Restructuring Objectives
A complete and sustainable restructuring
An attractive stand-alone value proposition
Improved risk profile
More visible growth outlook
Simplified structure
Aligned with Enbridge’s long-term sponsored vehicle strategy
4
A return to our roots: low risk, pure-play liquids pipeline MLP

• Quarterly distributions reduced 40% to $0.35/unit ($1.40/unit annualized). Expected 2017 pro forma total and cash distribution coverage of ~1.2x and ~1.5x, respectively.
• Sale of Midcoast Gas Gathering and Processing business to an Enbridge affiliate for $2.15B, including $840 million of debt (at March 31, 2017)
• Finalized joint-funding for the Bakken Pipeline System investment with EEP owning a 25% interest initially, with a 20% step up purchase option
• Redemption of $1.2 billion of Series 1 Preferred Units with proceeds from the issuance of $1.2 billion of new Class A common units to EECI and repayment of the accrued amounts ($360 million) with a portion of the cash from the Midcoast sale
• Restructured incentive distribution rights with a 23% top tier and elimination of Class D units
Transaction Details A complete and sustainable restructuring
5

Significantly Enhanced Balance Sheet
6
Consolidated Debt/EBITDA2 (2017-2020) Sources & Uses of Transaction Proceeds1 ($B)
Debt / EBITDA expected to improve as
high-quality projects are placed into service
Committed to strong investment-grade credit rating
~5.3
4.5x
.0x
1.0x
2.0x
3.0x
4.0x
5.0x
6.0x
2016A 2017 Pro Forma
2018 2019 2020
1Includes actions previously announced on January 27, 2017. 22017 Pro Forma assumes restructuring actions occurred on January 1, 2017
Sources Uses
Line 3 Step Down $0.45 EA Step Up $(0.36)
Class A Proceeds 1.20 Preferred Repayment (1.20)
G&P Sale incl. Debt 2.15 Preferred Deferral
Repayment (0.36)
Bakken Investment (0.37)
Receivable Agreement
Termination (0.16)
Debt Reduction (1.35)
Totals $3.80 $(3.80)
Significant debt reduction immediately
improves credit metrics
~5.3x

Strong Distribution Coverage
* 2017 Pro Forma assumes restructuring actions occurred on January 1, 2017.
~1.2x total distribution coverage targeted
7
Distribution Coverage Estimated to Strengthen
• Greater distribution stability and
sustainability
• Strong coverage given low risk
nature of business
• Retained cash alleviates near-term
equity funding requirements &
capital market risk
• Supports enhanced credit profile
and financial flexibility
.0x
.2x
.4x
.6x
.8x
1.0x
1.2x
1.4x
1.6x
2016A 2017 Pro Forma
2018 2019 2020
Total Coverage
.0x
.2x
.4x
.6x
.8x
1.0x
1.2x
1.4x
1.6x
2016A 2017 Pro Forma
2018 2019 2020
Cash Coverage

Simplified Capital and Incentive Structure
*Does not include GP interest, Class D units or Class F units
Eliminating preferred units and restructuring IDRs aligns GP and public LP interests
8
Limited Partner Equity Capitalization(*)
• Elimination of Class D units
• Marginal incentive split capped at 23%
• Limited burden and drag on cost of equity
- Incentive distribution at ~2% of total (pro forma 2017)
Eliminating $1.2B preferred units removes
overhang and strengthens balance sheet
66% 81%
20%
19% 11%
0%
20%
40%
60%
80%
100%
Before After
Preferreds (ENB)
I Units
LP Units
Incentive Distribution Rights
Restructured IDRs preserve incentive to grow
distributions with limited cost of capital impact
35% ENB
Ownership

Pure-Play Liquids Pipeline MLP World class liquids infrastructure spanning the U.S.
9
• Exceptional North American infrastructure
• Excellent market reach
• Low-risk commercial agreements
• Competitive and stable tolls
• Visible growth through secured Joint Funding Arrangements
Lakehead Cushing North Dakota
Cushing
10
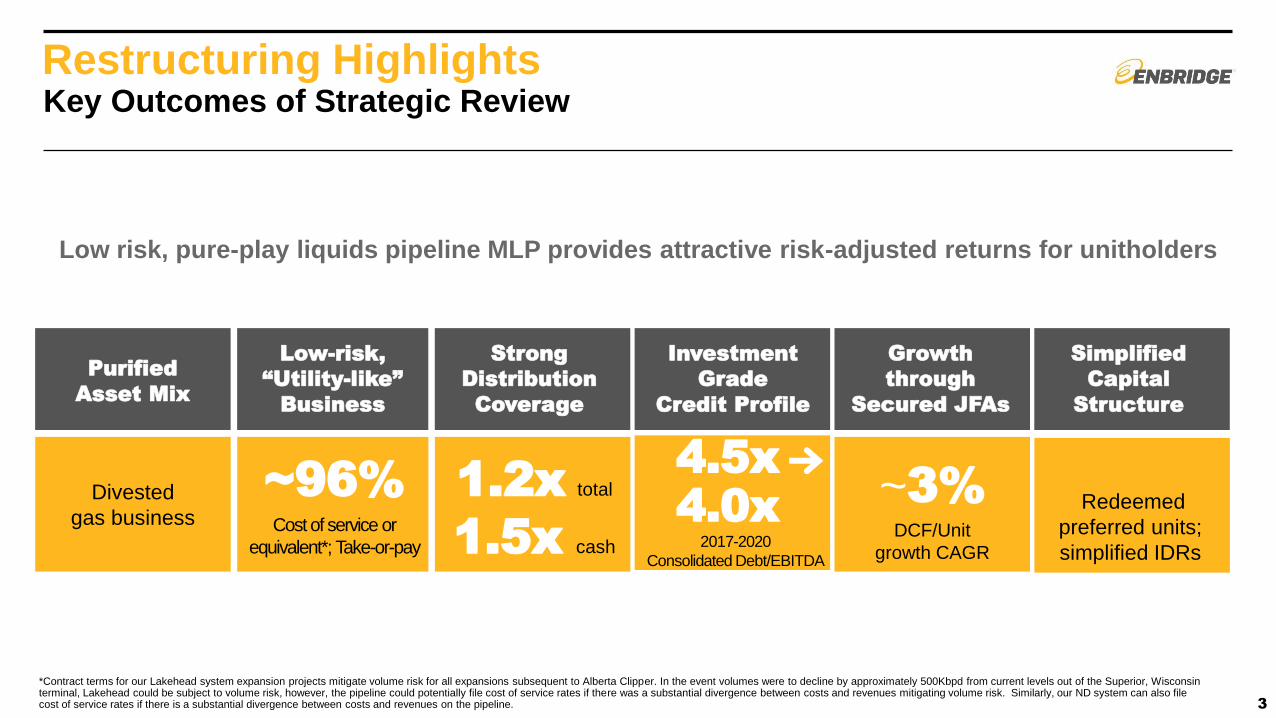
Mainline System
• Comprised of the Lakehead System in the United
States which is a continuation of the Canadian
Mainline System
• Combined annual operating capacity of
~2.85 MMbpd
– Record deliveries averaged 2.792 MMbpd in January 2017
– Accounted for 56% of CDN exports to the U.S. (2016)
• Access to ~3.5 MMbpd of connected refineries and
downstream pipelines
• Expansive terminal presence provides operational
flexibility
• Competitive tolls, best netback
• Top shippers include fully integrated oil companies
and refiners - strong credit counterparties
10
Canadian Mainline
Lakehead System
Largest, longest and most complex
petroleum pipeline system in the world
Overview

11
Lakehead – Commercial Model
0
500
1,000
1,500
2,000
2,500
3,000
$0.00
$0.50
$1.00
$1.50
$2.00
$2.50
$3.00
Q3 2014
Q4 2014
Q1 2015
Q2 2015
Q3 2015
Q4 2015
Q1 2016
Q2 2016
Q3 2016
Q4 2016
Q1 2017
Q2 2017
Lakehead Toll Lakehead System Deliveries (kbpd)
Tolls & Deliveries:
Deliveries (Kbpd)
Low-risk framework minimizes volume risk
27
26
21
8
Mainline Expansions
Eastern Access
Southern Access
Alberta Clipper
Tolling Agreements (% of EBITDA):
Years Contract length provides stability:
Tolls ($US)
Base toll 35% Expansion
Facility Surcharge
45%
Southern Access
10%
Alberta Clipper
10%
100% Cost of service or
equivalent agreements*
*Contract terms for our Lakehead system expansion projects mitigate volume risk for all expansions subsequent to Alberta Clipper. In the event volumes were to decline by approximately 500Kbpd from current levels out of the Superior, Wisconsin terminal, Lakehead could be subject to volume risk, however, the pipeline could potentially file cost of service rates if there was a substantial divergence between costs and revenues mitigating volume risk. Similarly, our ND system can also file cost of service rates if there is a substantial divergence between costs and revenues on the pipeline.

Lakehead - Extensive Market Reach
12
• Direct access to 2 MMbpd of refinery capacity
• 1.5 MMbpd of takeaway market access pipeline capability
• Overall total refining capacity of 9.9 MMbpd in the markets served
• Connected refineries:
• Downstream markets:
Premier connectivity to North American refining centers
Edmonton
Hardisty
W-USGC
5,000
Cushing
1,200
E-USGC
4,000
Spearhead 200
FSP/Seaway 600
SAX/Mustang 400
Line 9 300
Total Refining Capacity (kbpd)
Connected Refineries Demand
Market Access Pipelines
Regional Refining Capacity
Montreal
372
Patoka
820
Northern PADD II
Enbridge 400 Total 480
Chicago Enbridge 710
Total 830
Ontario/
PA Enbridge 460
Total 460
Michigan/ Ohio
Enbridge 340 Total 720
Minneapolis Flint Hills Resources & NTE
Superior Calumet
Chicago BP, ExxonMobil & Citgo
Detroit Marathon
Toledo BP/Husky, PBF Energy
Ontario/Warren Suncor, IOL, Shell & United
Line 9 Suncor & Valero
SAX Marathon & P66
Cushing/USGC Multiple refineries
FSP/Seaway 600
XYZ

13
2011 2012 2013 2014 2015 2016 2017e
Lakehead: Strengthening the Business
Lakehead Throughput (Kbpd) Mainline Expansion Options
0
500
1,000
1,500
2,000
2,500
3,000
2015 2016 2017 2018 2019
Project Kbpd
Line 3R 375
DRA Optimization 75
Line 4 Capacity Recovery 75
Horse Power Expansion 100
Total Incremental Capacity Potential 625
Cost Management
• Aggressive G&A management
• Power and DRA management
• Synergies from Spectra Energy acquisition
– Overhead and supply chain
• Financing cost improvements
M&I has levelized at lower go-forward rates
Maintenance & Integrity Spending

Low-Risk “Utility-Like” Business
Direct Commodity Exposure (CFaR)*
Investment Grade Customers
<1% of cash flow directly
subject to commodity price fluctuations
~100% of revenue from
investment grade or equivalent customers
Stable Business
~96% of cash flow underpinned
by long term cost of service or equivalent1 and take or pay
agreements
14
Reliable Business Model Provides Highly Predictable Cash Flows
2 Cash Flow at Risk is a statistical measure of the maximum adverse change in projected 12-month cash flow that could occur as a result of movements in market prices (over a one-month holding period) with a 97.5% level of
confidence **Predominately oil loss allowance
1 Contract terms for our Lakehead system expansion projects mitigate volume risk for all expansions subsequent to Alberta Clipper. In the event volumes were to decline by approximately 500Kbpd from current levels out of the Superior, Wisconsin terminal, Lakehead could be subject to volume risk, however, the pipeline could potentially file cost of service rates if there was a substantial divergence between costs and revenues mitigating volume risk. Similarly, our ND system can also file cost of service rates if there is a substantial divergence between costs and revenues on the pipeline.

• ~3% secured DCF/unit growth to 2020
– Southern Access to 1,200MMbpd
– Eastern Access +15% interest
– Bakken Pipeline System +20% interest
– Mainline Expansions +15% interest
– Line 3 +39% interest
• Organic growth outlook 2019+ – Low cost system expansions
– Bakken Pipeline expansion and interconnection
– Merchant contract terminalling
– Ongoing system investments related to downstream market expansion opportunities
• Acquisitions & drop downs – Dependent on valuation and transaction multiples
DCF/unit Growth Outlook
15
$0
$200
$400
$600
$800
$1,000
$1,200
$1,400
$1,600
2017 2018 2019 2020
L3 call option BPL call option ME call option
Base business
Embedded Growth Opportunities (DCF/unit)
Embedded growth supports longer term distribution growth….
SA to 1200

2017 Financial Outlook
1 Adjusted EBITDA reported on a fully consolidated basis; inclusive of non-controlling interest and other income. Adjusted EBITDA and distributable cash flow are non-GAAP financial measures. Reconciliations to comparable GAAP forward-looking measures are not available due to the challenges with estimating some of the items, particularly non-cash unrealized derivative fair value losses and gains, which are subject to market variability. 2 2017 Pro Forma assume restructuring actions occurred on January 1, 2017. 3 Consolidated
16
Metric ($ Millions) Pro Forma 20172
Adjusted EBITDA1 1,580 - 1,680
Distributable Cash Flow1 $700 - 750
Distribution / Unit (annualized) $1.40
Net Investment Capital ~$350
Debt/EBITDA ~4.5x
Distribution Coverage ~1.2x

EEP Investor Value Proposition
• Pure-play liquids pipeline MLP - Exceptional North American liquids infrastructure
• Improved business risk profile - Attractive commercial agreements and low-risk business model
• Strong Financial Position - Healthy distribution coverage and investment grade balance sheet
• Moderate visible growth - Secured through embedded organic growth and JFAs
17
EEP repositioned as premier, low risk, pure play liquids MLP
Attractive long term risk-return proposition

Q&A
18

Supplemental
Information
Asset Overview
19

20
Bakken Region
Extensive infrastructure accommodates
current and planned growth
• North Dakota System (210 kbpd) and Bakken Expansion Pipeline (150 kbpd) combined for total current system capacity of 360 kbpd
– Gathers crude from North Dakota and delivers to Enbridge Mainline which provides access to refineries in the US Midwest, Gulf Coast and Eastern Canada
• Dakota Access Pipeline & Energy Transfer crude oil pipeline
– DAPL originates in the Bakken/Three Forks Area and accesses Patoka, Illinois hub
– ETCO originates in Patoka and provides access to the Eastern U.S. Gulf Coast market
– Collective effective interest in DAPL is 27.6%
• Market access targets high value markets
20

21
North Dakota System – Strategic and Competitive Position
Commercial Structure
• North Dakota System: Common carrier with
indexed rates
• Bakken Expansion Pipeline: 5 & 10 year “Take or
Pay” agreements, utilizing ~70% of capacity
Competitive Positioning
• Established gathering system with multiple entry points
• Access to Enbridge Mainline system and superior
value markets
– Low cost transportation option
• High customer volume demand
– Merchant tankage opportunities
– Expansion and reversal capability
– Opportunities for synergies with connecting customers
Financial Modelling Considerations
• Stable results and utilization of Classic System
– Phase V and VI surcharge expired in 2015
• Stable cash flow from Bakken Expansion Pipeline
• Future growth tied to:
– Capital additions
– Repurpose under-utilized assets
Adjusted Operating Income ($ Millions)
0
50
100
150
200
2014 2015 2016
21

22
Cushing Terminal Significant presence in one of North America’s largest merchant terminals
Cushing
Midwest
Gulf Coast
WCSB
Permian
PADD IV
Commercial Structure
• 100% contracted
• Long term Take or Pay contracts in place
Competitive Positioning
• ~20 million barrels of storage capacity (25% of total)
• Excellent pipeline connectivity
– 3.5 MMbpd of Inbound Capacity
– 2.9 MMbpd of Outbound Capacity
Adjusted Operating Income ($ Millions)
0
10
20
30
40
50
60
70
2014 2015 2016

Revised IDR Structure
23
Revised IDR Tiers
Annualized Distribution
Per Unit
Incentive Distribution
(Class F Units)*
> $1.18 to $1.40 13%
In excess of $1.40 23%
*Does not include GP interest .