Embed Size (px)
Citation preview

Encompass Health 1
Encompass Health Rehabilitation Hospital of OregonCN #679 Public Meeting
October 15, 2019
Encompass Health is a national leader in integrated healthcare services offering both hospital-based and home-based patient care through its network of inpatient rehabilitation
hospitals, home health agencies, and hospice agencies. The Company is committed to delivering high-quality, cost-effective, integrated care across the healthcare continuum.
Encompass Health 2
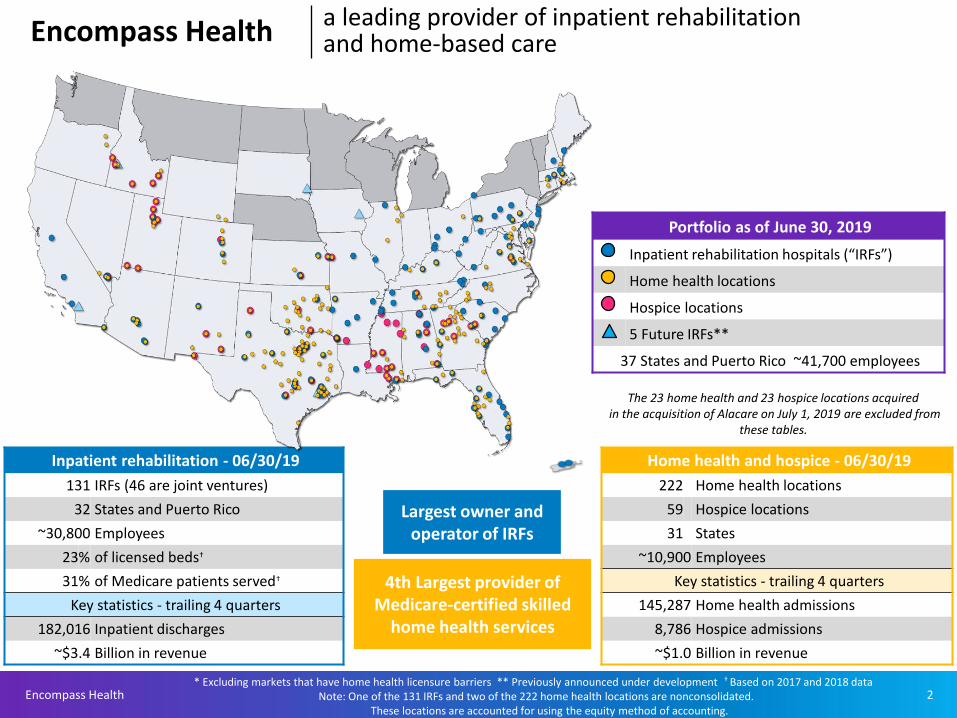
Inpatient rehabilitation - 06/30/19
131 IRFs (46 are joint ventures)
32 States and Puerto Rico
~30,800 Employees
23% of licensed beds†
31% of Medicare patients served†
Key statistics - trailing 4 quarters
182,016 Inpatient discharges
~$3.4 Billion in revenue
Portfolio as of June 30, 2019
Inpatient rehabilitation hospitals (“IRFs”)
Home health locations
Hospice locations
5 Future IRFs**
37 States and Puerto Rico ~41,700 employees
* Excluding markets that have home health licensure barriers ** Previously announced under development † Based on 2017 and 2018 dataNote: One of the 131 IRFs and two of the 222 home health locations are nonconsolidated.
These locations are accounted for using the equity method of accounting.
Encompass Health a leading provider of inpatient rehabilitation and home-based care
Largest owner and operator of IRFs
4th Largest provider of Medicare-certified skilled
home health services
Home health and hospice - 06/30/19
222 Home health locations
59 Hospice locations
31 States
~10,900 Employees
Key statistics - trailing 4 quarters
145,287 Home health admissions
8,786 Hospice admissions
~$1.0 Billion in revenue
The 23 home health and 23 hospice locations acquiredin the acquisition of Alacare on July 1, 2019 are excluded from
these tables.

Encompass Health 3
Comprehensive Services
• Rehabilitation physicians: manage and treat medical conditions and oversee rehabilitation program
• Rehabilitation nurses: provide personal care and oversee treatment plan for patients
• Physical therapists: address physical function, mobility, strength, balance, and safety
• Occupational therapists: promote independence through Activities of Daily Living
• Speech-language therapists: address speech/voice functions, swallowing, memory/cognition, and language/communication
• Respiratory therapists: provide assessment and treatment of patients with both acute and chronic dysfunction of the cardioplumonarysystem
• Pharmacists: oversee and manage medications to treat complex medical conditions pursuant to physician orders
• Case managers: coordinate care plan with physician, Care Transition Coordinators, caregivers and family
• Post-discharge services: outpatient therapy and transition to home health
Inpatient rehabilitationhospitals
118 of the Company’s IRFs hold one or more disease-specific certifications from The Joint Commission’s Disease-Specific Care Certification Program.
Inpatient Rehabilitation Overview

Encompass Health 4
Encompass Health: Patient Mix and OutcomesAdmission sources:
Average age of the Company’s IRF patients: all patients = 71 Medicare FFS = 76
Acute care hospitals – 90%Physician offices / community – 8%
Skilled nursing facilities – 2%
Rehabilitation impairment category YTD-19 2018RIC 01 Stroke 18.5% 18.0%
RIC 02/03 Brain dysfunction 10.0% 10.3%
RIC 04/05 Spinal cord dysfunction 3.9% 3.8%
RIC 06 Neurological conditions 21.5% 21.0%
RIC 07 Fracture of lower extremity 7.4% 7.7%
RIC 08 Replacement of lower extremity joint 3.4% 3.9%
RIC 09 Other orthopedic 8.5% 9.0%
RIC 10/11 Amputation 2.7% 2.6%
RIC 14 Cardiac 4.5% 4.5%
RIC 17/18 Major multiple trauma 5.2% 5.3%
RIC 20 Other disabling impairments 11.3% 11.1%— All other RICs 3.1% 2.8%
Discharge to community
Discharge to skilled nursing
Discharge to acute hospital
Percent of cases discharged to the
community, including home or home with home
health. Higher is better.
Percent of patients
discharged to a skilled nursing
facility. Lower is better.
Percent of patients
discharged to an acute care hospital.
Lower is better.
80.1%
UDSMR Encompass Health
High-quality care:
Rehabilitation Impairment Categories (RICs) represent how the Company admitted the patient; BPCI uses Diagnostic-Related Groups (DRGs) which represent how the acute care hospital discharged the patient.

Encompass Health 5
Encompass Health:Leading position in cost effectiveness
Medicare pays Encompass Health lessper discharge, on average, and Encompass Health treats a higheracuity patient.
#
Avg.beds
per IRF
Avg.Medicare discharges
per IRF
Casemix
index
Avg. est.total cost
perdischarge
for FY 2019
Avg. est.total
paymentper
dischargefor FY 2019
Encompass Health = 126 67 951 1.28 $13,622 $20,315
Free-standing =(Non-Encompass Health)
154 58 589 1.27 $18,107 $21,400
Hospitalunits = 846 24 228 1.22 $21,483 $21,569
Total 1,126 34 358 1.25 $18,388 $21,159
The average estimated total payment per discharge, as stated, does not reflect a 2% reduction for sequestration.
The Company differentiates itself by:
“Best Practices” clinical protocols
Supply chain efficiencies
Sophisticated
management information
systems
Economies of scale

Encompass Health 6
Encompass Health : Leading the way with National Partnerships
Encompass Health’s national sponsorship of AHA/ASA’s Together to End Stroke promotes stroke awareness and recovery.
• 20 pilot markets for Go Red for Women luncheons (includes 43 EH hospitals)
• Point of Care/Life After Stroke Guide (English & Spanish versions)
• Highlighting Encompass Health patient stories on AHA/ASA national blog
• Future co-branded patient and caregiver support tools
117Encompass Health hospitalshold stroke-specific certifications from The Joint Commission

Encompass Health 7
Inpatient Rehabilitation Hospital Patients
Admission Criteria
• Physicians, acute care hospital case managers, and therapists are key decision makers and partner with us to identify appropriate candidates for admission to an IRF level of care
• All IRF patients must meet medical necessity criteria and must be approved by a rehab physician.
• All IRF patients must be reasonably medically stable and have potential to participate in 3 hours of therapy 5 days per week (minimum).
• IRF patients receive 24-hour, 7 days a week rehabilitation nursing care.

Encompass Health 8
Rehabilitation Hospitals:A Different Level of Service
Inpatient rehabilitation hospital Nursing home
Average length of stay = 12.7 days Average length of stay = 37.3 days
Requirements: Requirements:
IRFs must also satisfy regulatory/policy requirements for hospitals, including Medicare hospital conditions of participation.
No similar requirement; Nursing homes are regulated as nursing
homes only
All patients must be admitted by a rehab physician. No similar requirement
Rehab physicians must re-confirm each admission within 24 hours. No similar requirement
All patients, regardless of diagnoses/condition, must demonstrate need and receive at least three hours of daily intensive therapy.
No similar requirement
All patients must see a rehabilitation physician “in person” at least three times weekly.
No similar requirement; some SNF patients may go a week or longer without seeing a physician, and often a non-rehabilitation physician.
IRFs are required to provide 24 hour, 7 days per week nursing care; many nurses are RNs and rehab nurses.
No similar requirement
IRFs are required to use a coordinated interdisciplinary team approach led by a rehab physician; includes a rehab nurse, a case manager, and a licensed therapist from each therapy discipline who must meet weekly to evaluate/discuss each patient’s case.
No similar requirement; Nursing homes are not required to
provide care on a interdisciplinary basis and are not required to hold regular meetings for each patient.
IRFs are required to follow stringent admission/coverage policies and must carefully document justification for each admission; further restricted in number/type of patients (60% Rule).
Nursing homes have comparatively few policies governing the
number or types of patients they treat.
Source: MedPAC, Medicare Payment Policy, March 2019 - pages 203, 213, 263, and 267.

Encompass Health 9
“Whenever possible, the American Stroke Association strongly recommends that stroke patients be treated at an inpatient rehabilitation facility rather than a skilled nursing
facility. While in an inpatient rehabilitation facility, a patient participates in at least three
hours of rehabilitation a day from physical therapists, occupational therapists, and speech therapists. Nurses are continuously available and
doctors typically visit daily.”*
“If the hospital suggests sending your loved one to a
skilled nursing facility after a stroke, advocate for the patient to go to an inpatient rehabilitation
facility instead…”*
“The studies that have compared outcomes in hospitalized stroke patients first
discharged to an IRF, a SNF, or a nursing home have generally shown that IRF patients have higher rates of return to community living and
greater functional recovery, whereas patients discharged to a SNF or a nursing home have higher rehospitalization rates and substantially poorer
survival.”**
AHA/ASA Guidelines conclude IRFs are a better rehabilitation option for stroke patients than SNFs

Encompass Health 10
VitalStim®
For those who suffer from dysphagia, a common condition among strokeand brain injury survivors, this therapy greatly improves swallowing abilitywith electrical stimulation.
Clinical technologies are invaluable tools in the therapy process and offer patients an exciting and enjoyable experience during their road to
recovery. Encompass Health’s Therapy Innovations Committee evaluates the most cutting-edge, innovative clinical technologies on the market
today. The committee establishes and maintains technology standards for new hospitals and identifies best-in-class technologies for Disease
Specific Certifications to support the gold star quality of care Encompass Health is known for. Some examples of these technologies are as follows:
Encompass HealthCutting-Edge Clinical Rehabilitation Technology
The Vector Gait & Safety System®
Enables rehabilitative teams to increase patient mobility while preventing falls and reducing the risk ofinjury. From stroke and spinal cord injury to amputee and orthopedic injury, the Vector provides acustomized gait training solution for patients of all levels. Leveraging dynamic body weight support,the Vector System allows patients to perform pre-gait activities, practice over-ground gaitrehabilitation, and accomplish ADL training.
Encompass Health 11
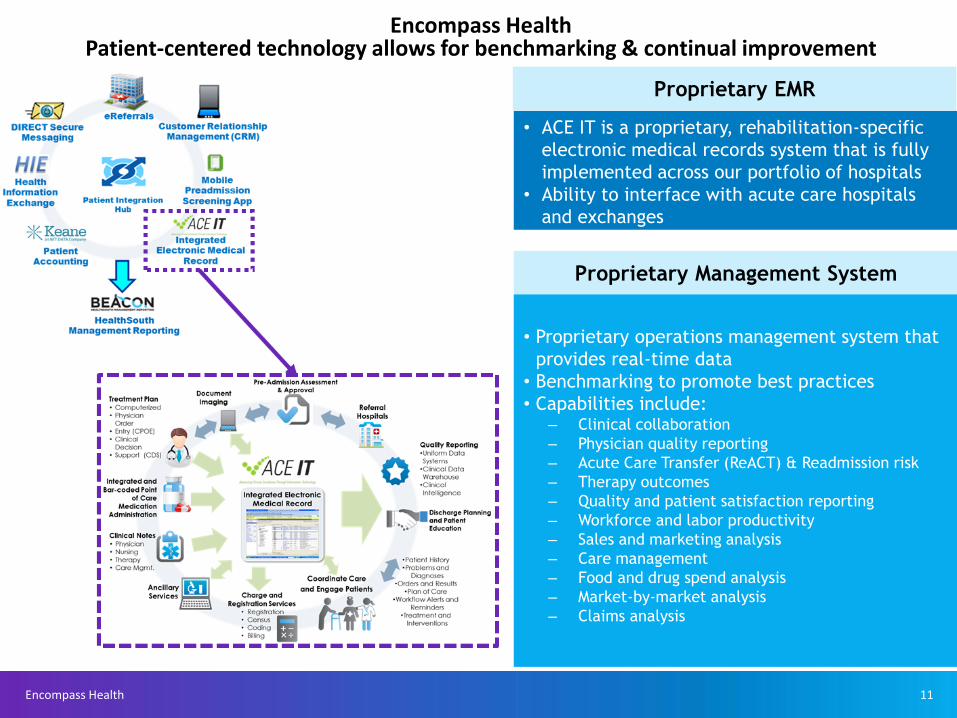
Encompass HealthPatient-centered technology allows for benchmarking & continual improvement
Proprietary EMR
• ACE IT is a proprietary, rehabilitation-specific
electronic medical records system that is fully
implemented across our portfolio of hospitals
• Ability to interface with acute care hospitals
and exchanges
Proprietary Management System
• Proprietary operations management system that
provides real-time data
• Benchmarking to promote best practices
• Capabilities include:‒ Clinical collaboration
‒ Physician quality reporting
‒ Acute Care Transfer (ReACT) & Readmission risk
‒ Therapy outcomes
‒ Quality and patient satisfaction reporting
‒ Workforce and labor productivity
‒ Sales and marketing analysis
‒ Care management
‒ Food and drug spend analysis
‒ Market-by-market analysis
‒ Claims analysis

Encompass Health 12
10.9%
2.6%
0%
2%
4%
6%
8%
10%
12%
SNF Patients - Potentially Avoidable
Rehospitalizations During Stay
IRF Patients - Potentially Avoidable
Rehospitalizations During Stay
40.0%
76.0%
0%
10%
20%
30%
40%
50%
60%
70%
80%
SNF Patients - Discharged to the
Community
IRF Patients - Discharged to the
Community
Medicare Patients Discharged to the Community by Care Setting (2017)
Medicare Patients’ Potentially Avoidable Re-hospitalizations During the Patient Stay by Care
Setting (2017)
Source: MedPAC Report to the Congress: Medicare Payment Policy, March 2019
Source: MedPAC Report to the Congress: Medicare Payment Policy, March 2019
Rehabilitation Hospitals:Better Outcomes

Encompass Health 13

Encompass Health 14
Oregon Bed Need Methodology
Division 645….directs applicants to:
• Compute the rehabilitation needs of a population using 7 beds per 100,000person standard as adjusted:
• Address specialty rehabilitation• Address the special needs population at risk in the proposed area• Address the sizes of population at risk in the proposed area• Address the current and historic rates of hospitalization in Oregon for these groups• Address the availability of existing IRF’s• Address accessibility of existing IRF’s• Address quality of existing IRF’s• Address levels of utilization of existing IRF services
CON Application, p. 9
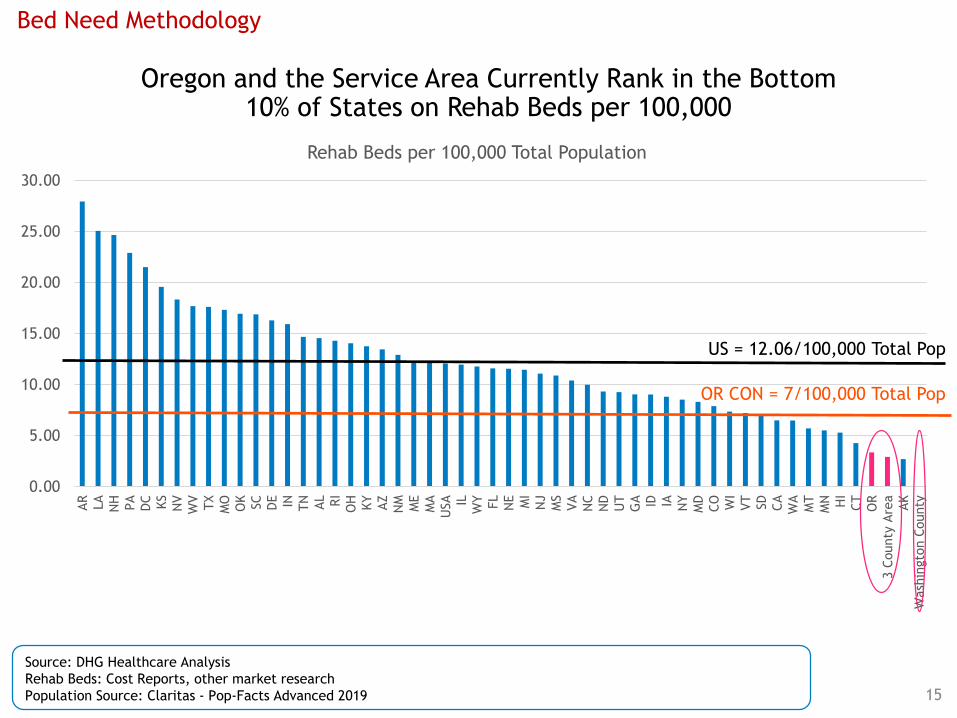
0.00
5.00
10.00
15.00
20.00
25.00
30.00
AR
LA
NH
PA
DC KS
NV
WV
TX
MO
OK
SC
DE IN TN AL RI
OH
KY
AZ
NM
ME
MA
USA IL
WY FL
NE MI
NJ
MS
VA
NC
ND
UT
GA ID IA NY
MD
CO WI
VT
SD
CA
WA
MT
MN HI
CT
OR
3 C
ounty
Are
a
AK
Wash
ingto
n C
ounty
Rehab Beds per 100,000 Total Population
Oregon and the Service Area Currently Rank in the Bottom 10% of States on Rehab Beds per 100,000
15
US = 12.06/100,000 Total Pop
Source: DHG Healthcare Analysis
Rehab Beds: Cost Reports, other market research
Population Source: Claritas - Pop-Facts Advanced 2019
Bed Need Methodology
OR CON = 7/100,000 Total Pop

Population Segmentation
16
72% of IRF Patients are Age 65+
0-44, 5.0%
45-54, 7.8%
55-64, 15.3%
65p, 71.9%
0-44 45-54 55-64 65p
*Typical EH Market age mix, Medicare regulations
IRF Services are Focused on Elderly Populations Where
Need is Greatest
The 60% Rule requires at least 60% of all patients admitted must have at least one
medical diagnosis or functional impairment from a list of 13 compliant
conditions (a.k.a "compliant conditions" or "CMS-13").
Medicare Clearly Focuses on Rehab Services for 65+ Complex
Patient

Population Change 2019-2024
Washington
County2019 2024 Numeric Percent
<65 521,957 544,658 22,701 4.35%
>65 82,404 101,350 18,946 22.99%
Total 604,361 646,008 41,647 6.89%
Clackamas &
Multnomah
Counties
<65 1,051,422 1,086,794 35,372 3.36%
>65 191,375 234,777 43,402 22.68%
Total 1,242,797 1,321,571 78,774 6.34%
Oregon
<65 3,464,158 3,567,592 103,434 2.99%
>65 759,054 901,773 142,719 18.80%
Total 4,223,212 4,469,365 246,153 5.83%
3 County Area– Population Segmentation Matters
Population Source: Claritas - Pop-Facts Advanced 2019
Population Segmentation
65+ Population is growing 5x
faster than the under 65+
population
17
65+ Population is growing 7x
faster than the under 65+
population

2019-2024 65+ Growth Rate Shows that the Elderly Population is Growing Dramatically Across the Service Area
Population Source: Claritas - Pop-Facts Advanced 2019
Population Segmentation
18

Oregon and the Service Area Rank at the Bottom of the US in Beds per 1000 for the 65+ Population
19
0
0.2
0.4
0.6
0.8
1
1.2
1.4
1.6
1.8
2
DC
AR
LA
TX
NH
PA KS
NV
OK
MO IN SC
WV
TN
DE
AL
UT
KY RI
OH IL AZ
USA
NM NE
WY
MA
NJ
MS
VA MI
GA
ND
NC
ME ID FL
CO
MD
NY IA CA
WI
SD
WA
VT
MN
MT HI
CT
AK
3 C
ounty
Are
a
OR
Wash
ingto
n C
ounty
Rehab Beds per 1,000 65+
US = .74/1,000 65+
Source: DHG Healthcare Analysis
Rehab Beds: Cost Reports, other market research
Population Source: Claritas - Pop-Facts Advanced 2019
Population Segmentation
The 65+ population of the 3 County Area has bed access
at roughly ¼ the rate of the United States

Access to Rehab Beds for the 65+ Population is Lowest in Oregon than any Other State
20
Rehab Beds: Cost Reports, other market research
Population Source: Claritas - Pop-Facts Advanced 2019
Medicare Advantage Penetration – CMS Report Sept 2019
Population Segmentation
Rehab Beds per 1,000 65+ 2019 Pop by State
Medicare Advantage
Penetration
OR 41.8%
CAL 40.6%
PA 40.4%

Oregon and the Service Area Rank at the Bottom of the US in Beds per 1000 for the 65+ Population
21
0
0.2
0.4
0.6
0.8
1
1.2
1.4
1.6
1.8
2
DC
AR
LA
TX
NH
PA KS
NV
OK
MO IN SC
WV
TN
DE
AL
UT
KY RI
OH IL AZ
USA
NM NE
WY
MA
NJ
MS
VA MI
GA
ND
NC
ME ID FL
CO
MD
NY IA CA
WI
SD
WA
VT
MN
MT HI
CT
AK
3 C
ounty
Are
a
OR
Wash
ingto
n C
ounty
Rehab Beds per 1,000 65+
US = .74/1,000 65+
Source: DHG Healthcare Analysis
Rehab Beds: Cost Reports, other market research
Population Source: Claritas - Pop-Facts Advanced 2019
Population Segmentation
The 65+ population of the three county area has bed
access at roughly ¼ the rate of the United States
States identified in yellow all have Medicare Advantage penetration rates similar or greater than Oregon (40%+).

0.00%
1.00%
2.00%
3.00%
4.00%
5.00%
6.00%
7.00%
8.00%
9.00%
10.00%
NV
TX
AR
LA
AZ
PA
NM SC
WV
NH AL
DE
OK
KS
TN
WY
MO FL
KY
NJ IN
USA
CO
UT
OH
ME HI
GA
MA
VA IL ID MS
CA MI
NE RI
NC
DC
NY
WI
IA VT
MT
SD
WA
AK
ND
CT
MD
MN
OR
3 C
ounty
Are
a
Wash
ingto
n…
Medicare Conversion Rate to Rehab(Medicare Rehab Discharges/Medicare Acute Discharges)
22
USA = 3.83%
Discharge Source: Medicare Standard Analytical IP File YE 2018Q3
By Other Common National Utilization Benchmarks this Area is Underserved with Rehab Services
Access to Appropriate Services
Access
To Care
is Limited
States Highlighted in Yellow Have Similar or Higher MA Penetration Rates than Oregon

23
Access to Appropriate Services
Acute Patients Discharged
to Rehab
USA = 3.83%
State = 1.14%
Washington County =
0.99%
Source: Medicare SAF YE
2018Q3.
Discharge Source: Medicare Standard Analytical IP File YE 2018Q3. Shows acute discharges with a discharge status of rehab as a % of
total. Acute discharges exclude LTAC hospitals, rehab hospitals and rehab DPUs. Product lines excluded: alcohol and drug abuse,
neonatology, normal newborns, OB, psych and rehab.
Low Utilization of Rehab is Evident Across the Service Area
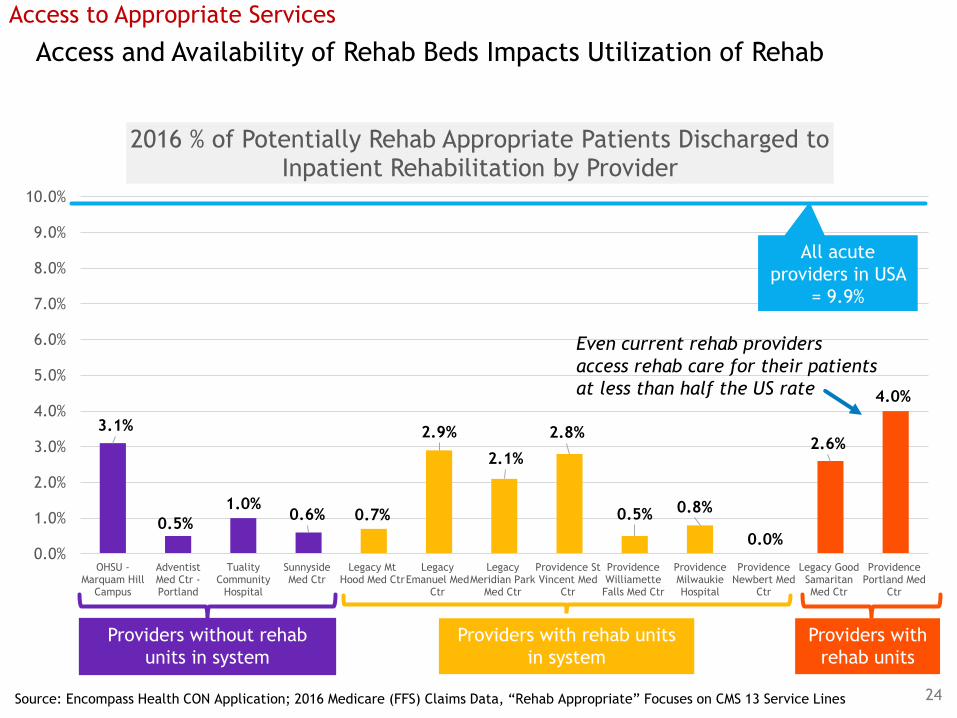
Access and Availability of Rehab Beds Impacts Utilization of Rehab
3.1%
0.5%
1.0%0.6% 0.7%
2.9%
2.1%
2.8%
0.5% 0.8%
0.0%
2.6%
4.0%
0.0%
1.0%
2.0%
3.0%
4.0%
5.0%
6.0%
7.0%
8.0%
9.0%
10.0%
OHSU -Marquam Hill
Campus
AdventistMed Ctr -Portland
TualityCommunity
Hospital
SunnysideMed Ctr
Legacy MtHood Med Ctr
LegacyEmanuel Med
Ctr
LegacyMeridian Park
Med Ctr
Providence StVincent Med
Ctr
ProvidenceWilliametteFalls Med Ctr
ProvidenceMilwaukieHospital
ProvidenceNewbert Med
Ctr
Legacy GoodSamaritanMed Ctr
ProvidencePortland Med
Ctr
2016 % of Potentially Rehab Appropriate Patients Discharged to Inpatient Rehabilitation by Provider
24
All acute
providers in USA
= 9.9%
Providers without rehab
units in system
Providers with rehab units
in system
Providers with
rehab units
Source: Encompass Health CON Application; 2016 Medicare (FFS) Claims Data, “Rehab Appropriate” Focuses on CMS 13 Service Lines
Access to Appropriate Services
Even current rehab providers
access rehab care for their patients
at less than half the US rate

Top 20 Largest Counties in US with no Rehab BedsCounty 2019 Total
Pop
1 San Mateo County, CA 779,473
2 Washington County, OR 604,361
3 Anne Arundel County, MD 579,979
4 Union County, NJ 569,042
5 Plymouth County, MA 519,639
6 Prince William County, VA 470,275
7 Pinal County, AZ 446,877
8 Dakota County, MN 427,370
9 Clackamas County, OR 421,801
10 Anoka County, MN 356,540
11 Lake County, FL 356,209
12 Larimer County, CO 353,332
13 Douglas County, CO 345,373
14 Somerset County, NJ 337,300
15 Howard County, MD 327,701
16 Lexington County, SC 296,997
17 Gloucester County, NJ 292,869
18 Clayton County, GA 292,252
19 Ottawa County, MI 291,072
20 Thurston County, WA 287,858 25
Source: DHG Healthcare Analysis
Rehab Beds: Cost Reports, other market research
Population Source: Claritas - Pop-Facts Advanced 2019
Access to Appropriate Services
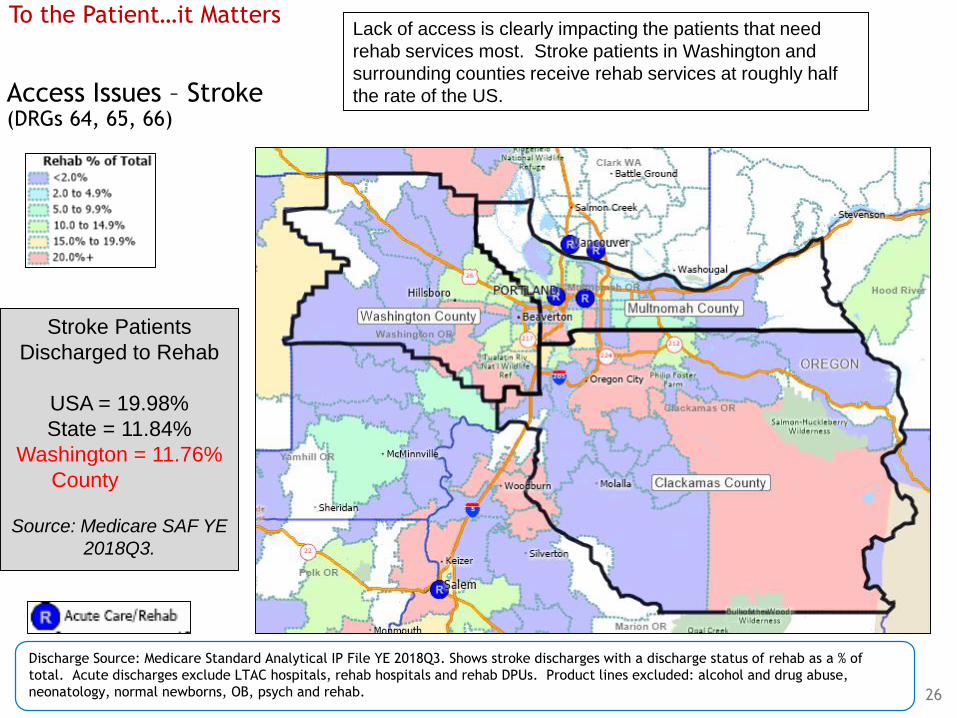
Access Issues – Stroke (DRGs 64, 65, 66)
Lack of access is clearly impacting the patients that need
rehab services most. Stroke patients in Washington and
surrounding counties receive rehab services at roughly half
the rate of the US.
Stroke Patients
Discharged to Rehab
USA = 19.98%
State = 11.84%
Washington = 11.76%
County
Source: Medicare SAF YE
2018Q3.
To the Patient…it Matters
26
Discharge Source: Medicare Standard Analytical IP File YE 2018Q3. Shows stroke discharges with a discharge status of rehab as a % of
total. Acute discharges exclude LTAC hospitals, rehab hospitals and rehab DPUs. Product lines excluded: alcohol and drug abuse,
neonatology, normal newborns, OB, psych and rehab.

Cardiac Valve
The Complex Patient is Best Served in IRF – One Example
(1) Source: Medicare Public Use Datasets, 2016-2017, analyzed by DHG Healthcare for Cardiac Valve DRG’s for One Major Health System
(2) Source: Encompass Health provided study of Medicare data including case mix and average costs and average payment
Shift from
IRF to SNFReduced First
PAC Spend
But Readmissions
SoaredAnd 90 Day Costs Actually
Increased Even When
Moved to Lower Setting
Medicare data indicates that readmitted patients “spend” in 90 days almost 2x the
patients with no readmission. A stroke patient, for instance, costs $24,603 without a
readmission and increases to $47,865 with a readmission.
To the Patient…it Matters