Embed Size (px)
Citation preview
Encorp Pacific (Canada) 206.2250 Boundary Road Burnaby, BC V5M 3Z3 1.800.330.9767 encorp.ca
Bank HSBC Bank Canada LegaL Firm Fasken martineau Dumoulin LLP auDitorS kPmg LLP
ECo Audit EnViRonMEntAl BEnEfits stAtEMEntthe 2006 Encorp Annual Report is printed with vegetable inks on Astrolite PC 100 which contains 100% post-consumer waste and produced chlorine-free & Chorus Art Gloss which contains
50% recycled & 25% post consumer waste and is fsC certified. By choosing post-consumer & recycled fibres instead of virgin paper for this printed material, the following savings to our natural resources were realized:
11.44 tREEs sAVEd 33.02 lBs WAtER-BoRnE WAstE not CREAtEd 4,858 GAl WAtER floW sAVEd 537 lBs solid WAstE not GEnERAtEd
1,059 lBs nEt GREEnHousE GAssEs PREVEntEd 899,708 Btu’s EnERGY not ConsuMEd
20
06
an
nu
aL
re
Po
rt
Encorp Pacific (Canada)
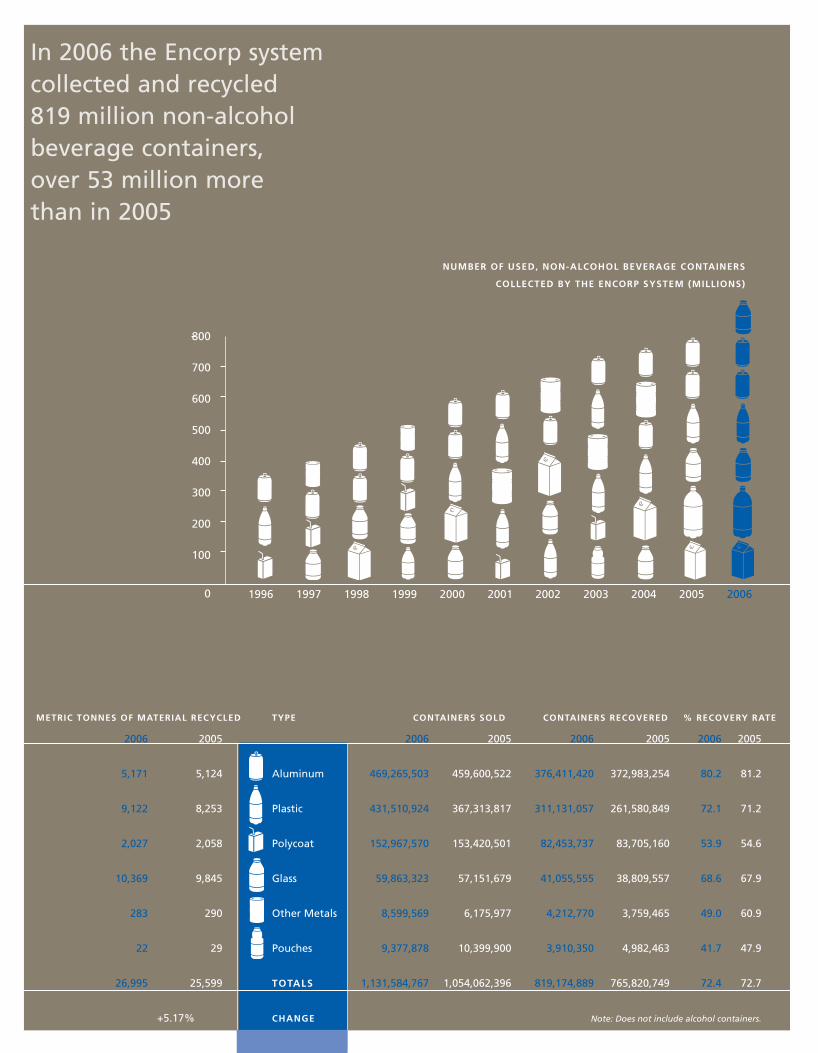
in 2006 the Encorp system collected and recycled 819 million non-alcohol beverage containers, over 53 million more than in 2005
numBer oF uSeD, non-aLCoHoL Beverage ContainerS
CoLLeCteD By tHe enCorP SyStem (miLLionS)
800
700
600
500
400
300
200
100
0 1996 1997 1998 1999 2000 2001 2002 2003 2004 2005 2006
tyPe ContainerS SoLD ContainerS reCovereD % reCovery rate
2006 2005 2006 2005 2006 2005
Aluminum 469,265,503 459,600,522 376,411,420 372,983,254 80.2 81.2
Plastic 431,510,924 367,313,817 311,131,057 261,580,849 72.1 71.2
Polycoat 152,967,570 153,420,501 82,453,737 83,705,160 53.9 54.6
Glass 59,863,323 57,151,679 41,055,555 38,809,557 68.6 67.9
other Metals 8,599,569 6,175,977 4,212,770 3,759,465 49.0 60.9
Pouches 9,377,878 10,399,900 3,910,350 4,982,463 41.7 47.9
totaLS 1,131,584,767 1,054,062,396 819,174,889 765,820,749 72.4 72.7
CHange Note:Doesnotincludealcoholcontainers.
metriC tonneS oF materiaL reCyCLeD
2006 2005
5,171 5,124
9,122 8,253
2,027 2,058
10,369 9,845
283 290
22 29
26,995 25,599
+5.17%
Neil Hastie Dan WongPresident & CEO Board Chair
Encorp Pacific (Canada) arrived at a
series of crossroads in 2006, each
with implications for the way we
operate and for the industries for
whom we act. Our core business,
the recovery of non-alcohol beverage
containers, is reaching maturity with
the newest of our container types,
aseptic cartons, having now been in
the system for six years.
Here, the crossroad we face brings
a number of new challenges, most
importantly, enhancing our already
high levels of consumer knowledge
and convenient access to Return-It™
depots to provide for the needs of
new consumers moving into the
Province and to ensure we have
the capacity to handle significant
increases in volume. Now, for
the first time, these efforts are
being augmented by targeted
collection initiatives to capture
containers going into landfill from
offices, multi-family dwellings and
commercial establishments. Our best
assessment is that these three (3)
sectors account for 70% of all the
beverage containers that currently
go to landfill.
Our performance in 2006, when
measured by the increase in the
number of containers recovered
for recycling, improved over 2005.
We recovered 819 million units,
an increase of 53 million over the
previous year, whereas our increase
in 2005 was only 19 million. At the
same time, healthy industry sales
were stimulated even further by the
Lower Mainland boil water advisory
in November and so, in total,
increased by 90 million containers.
The net result is that our recovery
rate stabilized at 72.4%, just under
the 72.7% we achieved in 2005.
While we continue to be focused
on initiatives to increase recovery
rates in our core business, we have
reached another crossroad as a
product stewardship corporation.
In 2006, we diversified outside the
beverage container deposit system
to undertake service provider
contracts with the BC Dairy Council
and the Electronics Stewardship
Association of BC. Then, early in
2007, we became the stewardship
agent for the Beverage Alcohol
Containers Management Council
of BC. In each of these cases, the
producer groups in question saw
the value of utilizing our province-
wide network of Return-It™ depots
and the synergies that could be
gained from our core competencies
in consumer awareness, logistics,
information technology and
finance/administration.
As we are structured, our founding
brandowners reap the benefits when
we strengthen the depot network
and are able to share some of our
overhead costs with other producer
programs while at all times remaining
true to our core principle that each
program must be fully responsible for
its costs.
A final crossroad for Encorp was
the submission of our revised
stewardship plan to the Ministry
of Environment in October 2006.
At the time of this report, we were
awaiting approval of our plan and
further details of the Ministry’s
commitment to review, some time in
2007, the beverage schedule that is
part of the Recycling Regulation.
As we choose courses when faced
with the many crossroads that
are suddenly upon us, we remain
committed to our fundamental
principle of delivering industry
self-managed, consumer friendly
and cost effective stewardship
programs that meet the specific
expectations of our industry partners
while respecting the environmental
expectations of other stakeholders.
Message froM the chair and the chief executive officer
Mo
neY
to
en
co
rP
total revenue
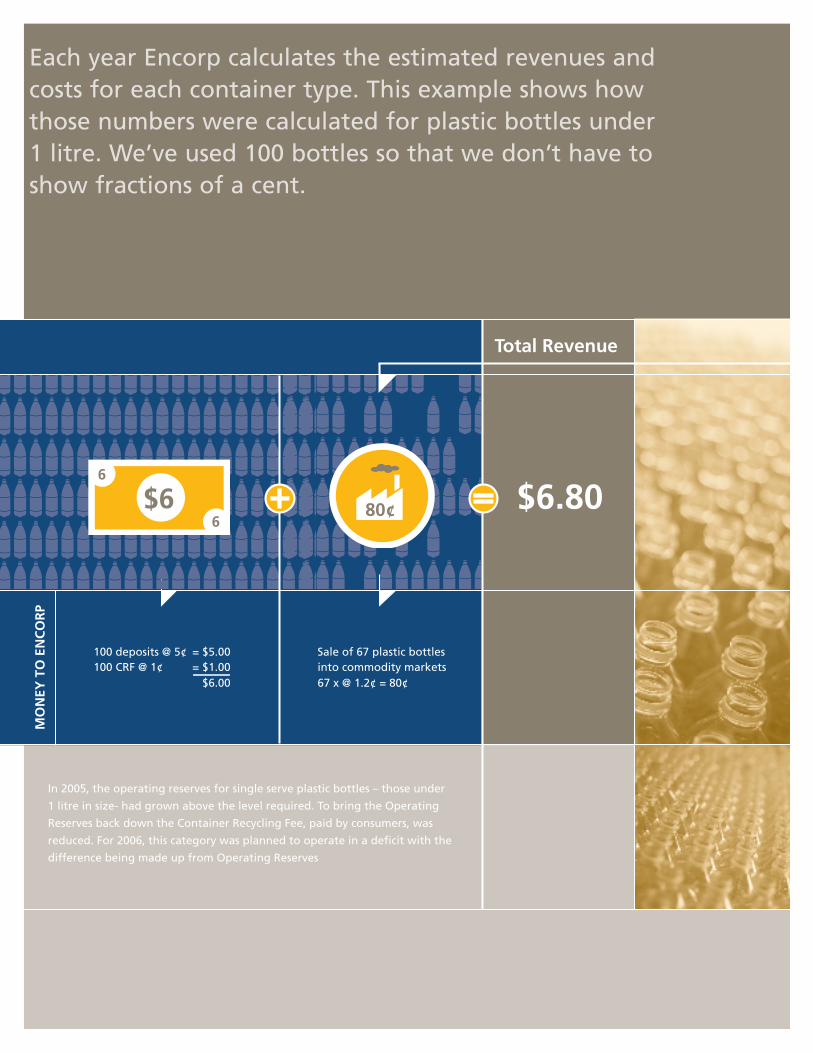
Each year Encorp calculates the estimated revenues and costs for each container type. This example shows how those numbers were calculated for plastic bottles under 1 litre. We’ve used 100 bottles so that we don’t have to show fractions of a cent.
In 2005, the operating reserves for single serve plastic bottles – those under
1 litre in size- had grown above the level required. To bring the Operating
Reserves back down the Container Recycling Fee, paid by consumers, was
reduced. For 2006, this category was planned to operate in a deficit with the
difference being made up from Operating Reserves
100 deposits @ 5¢ = $5.00 100 CRF @ 1¢ = $1.00
$6.00
Sale of 67 plastic bottles into commodity markets67 x @ 1.2¢ = 80¢
$6.80
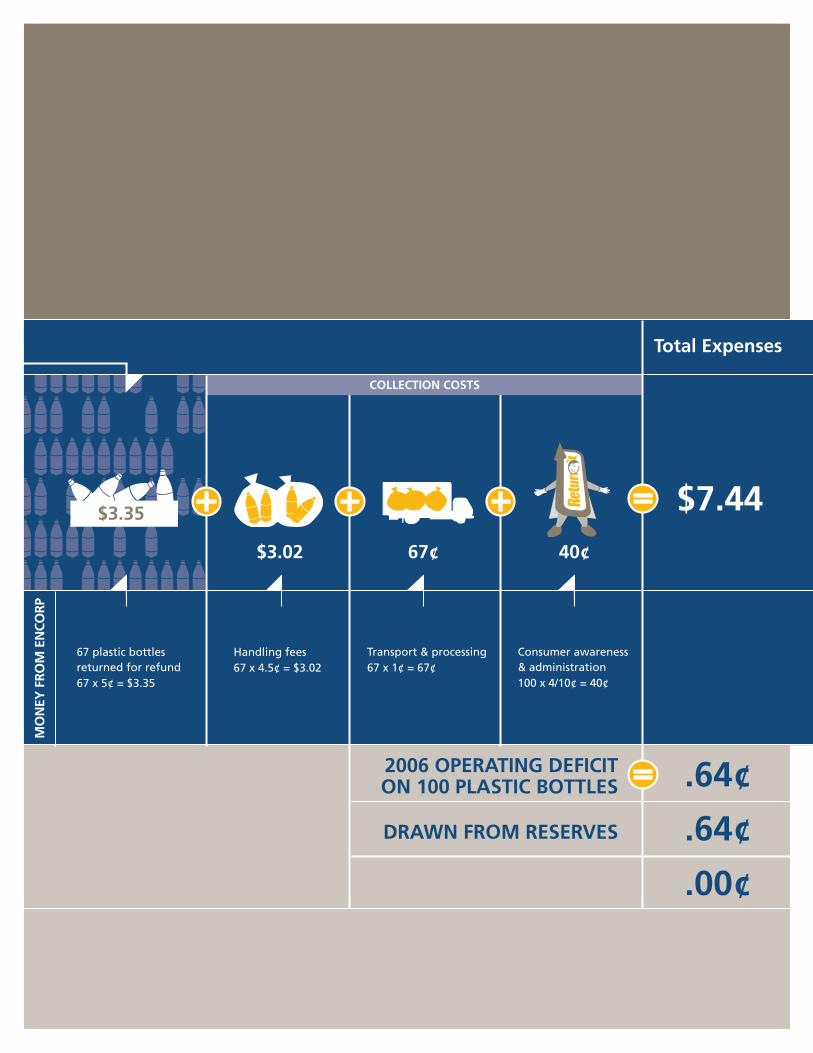
total expenses
$7.44
2006 oPerating deficit on 100 Plastic bottles .64¢
67 plastic bottles returned for refund67 x 5¢ = $3.35
Handling fees67 x 4.5¢ = $3.02
Transport & processing67 x 1¢ = 67¢
Consumer awareness & administration100 x 4/10¢ = 40¢
$3.35
$3.02 67¢ 40¢
.64¢
.00¢
drawn froM reserves
Mo
neY
fro
M e
nco
rP
collection costs
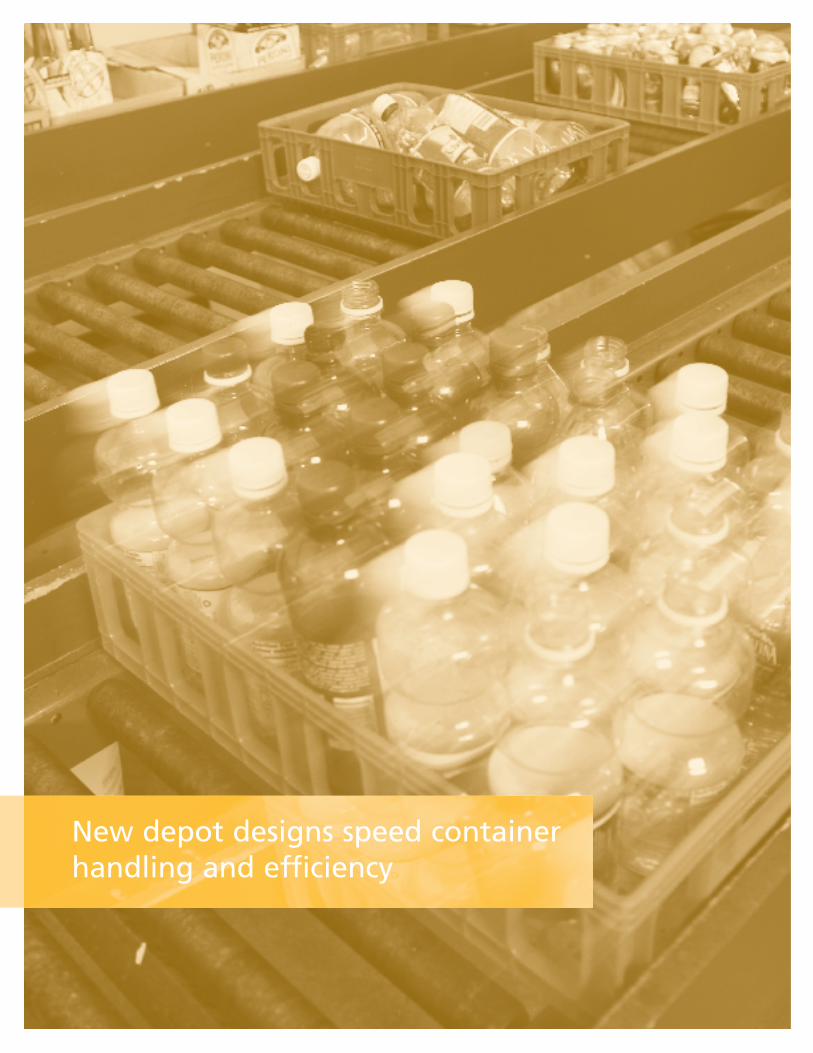
New depot designs speed container handling and efficiency
Just as the network of Bottle and
Return-It Depots is crucial to the
success of Encorp’s recovery of
beverage containers, so is the Encorp
beverage container system vital to
the viability of the depot system.
Without the steady revenues provided
for handling Encorp containers the
majority of depots could not survive.
The existence of the network makes
possible recovery programs for many
other products including stewardship
programs for things like leftover paint;
as well as for cardboard, plastics and,
in 2007, end-of-life electronics.
None of these individual recovery
streams, save for beverage containers,
provides sufficient, regular and
reliable revenues on their own, or
even in combination, to sustain the
depot network. The Encorp depot
network provides British Columbia
residents with the opportunity to
consider many other waste diversion
programs which, individually, would
be difficult and very expensive to
establish separately from the network.
In 2006 the program of upgrades and
improvements for depots continued.
The total number of depots
operational in 2006 remained
unchanged at 169 but, in the latter
part of the year, permission was
finally obtained for a new depot in
the City of Vancouver, one of the
eight additional depots that are
needed to serve that city. Encorp,
through its support for independent
depot operators, will continue to seek
permission for additional depots in
Vancouver since it continues to be
the most under-serviced area of the
province; a fact that is reflected in
the large number of containers being
thrown into the garbage in the city.
dePot uPdate
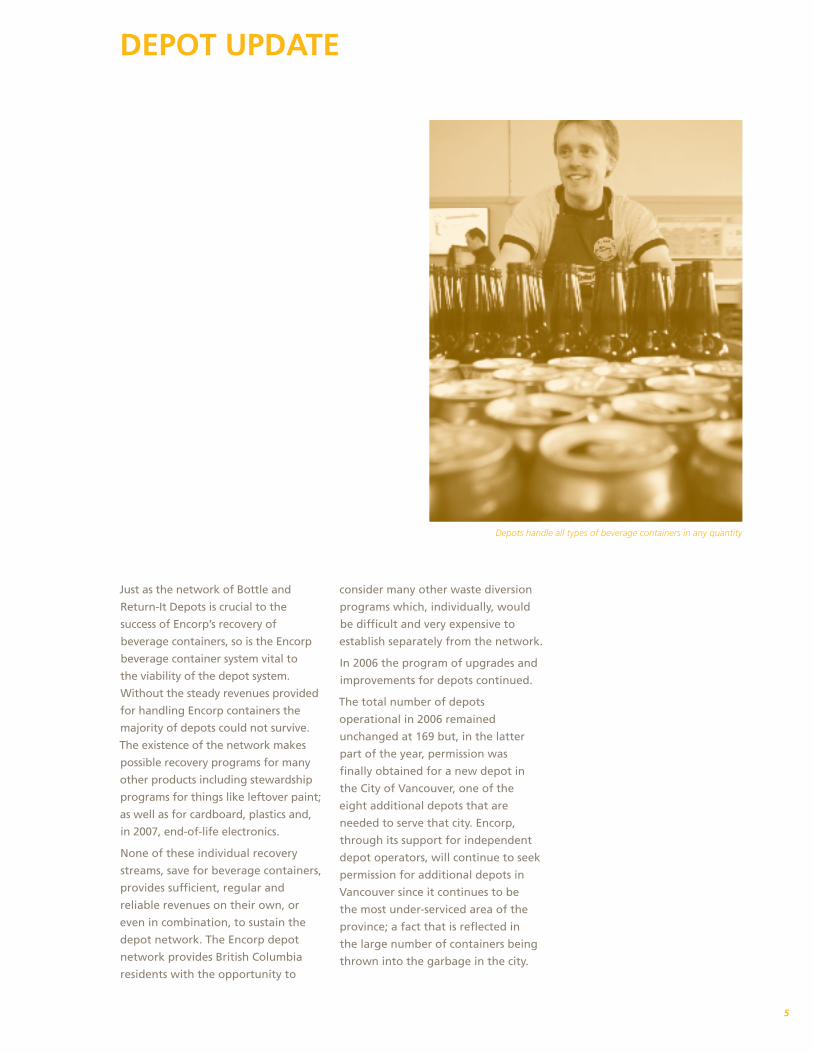
Depots handle all types of beverage containers in any quantity
5
Transporting and processing
containers is, after depot handling
fees, the largest cost item in Encorp’s
budget. Even small improvements
in the ways that containers are
transported and processed can add
up to significant improvements.
In 2006 a number of refinements
were implemented:
• A new baler was installed at the
Nanaimo processing site which
increased the weight of plastic
bales from 260 to 440 kilograms.
A new baler was also installed at
the Victoria site which also
increased bale weights. These
improvements allow for increases
in individual truck load weights
resulting in fewer trips with
consequent savings in fuel, labour
and greenhouse gases.
• Trials were initiated with 40’ trailer
units in place of the smaller trucks
now in use in most areas. Where
volumes justify them, these units
will be introduced over the next
few years and will reduce the
number of trips made to collect
containers.
logistics
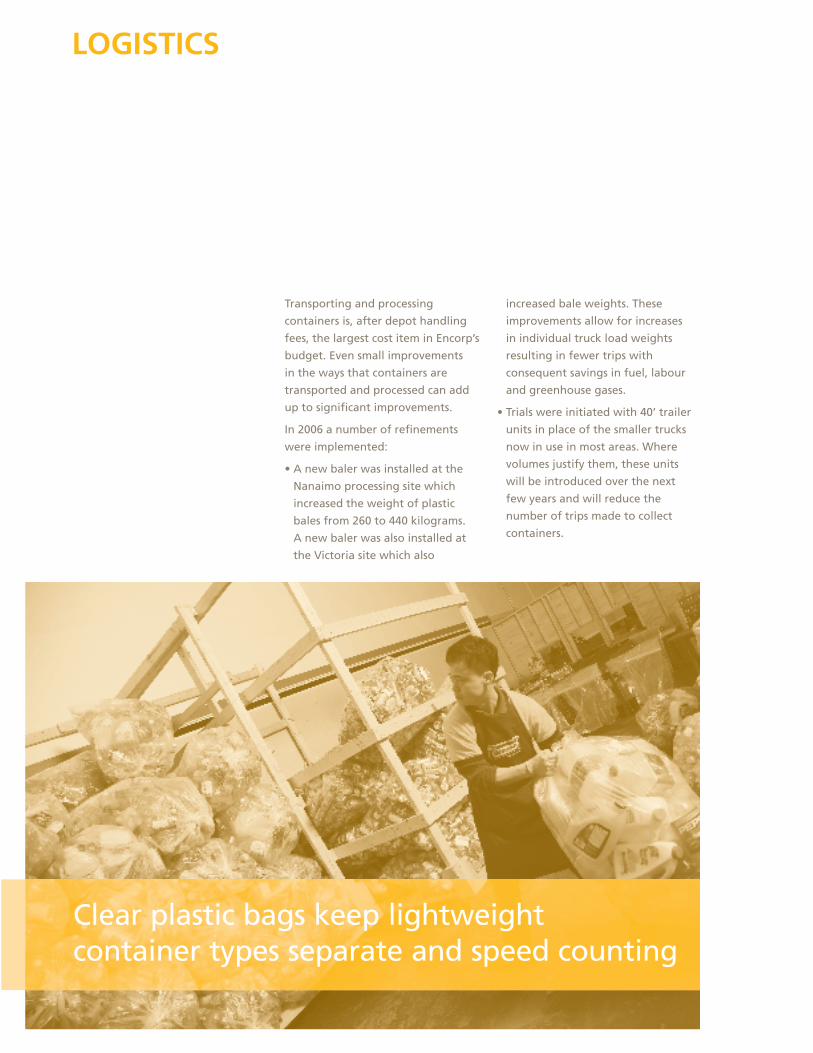
Clear plastic bags keep lightweight container types separate and speed counting
One of the ways Encorp maintains an
effective collection system for used
beverage containers is by providing
quality control assistance for new and
existing depot operators. With the ever
increasing volume of returns come new
brands and new challenges; to meet
these challenges improved methods of
container handling are required.
In 2006, the Quality Assurance centre
and the Depot Operations department
started a Depot Operator Training
Program. All new depot operators
are required to attend this training
before they can assume control of
their new operation. The effect of this
program was seen immediately with
new operators showing improved
handling of containers with fewer
non-conforming containers and fewer
errors with standard bag counts.
The Depot Operator Training
Program provides new operators
with knowledge on how to correctly
identify an acceptable, registered,
container versus one that is non-
conforming (e.g. a deposit-exempt
container). The program also explains
the whole quality assurance process
and why it is important not only
for Encorp but also for the viability
of individual depot operations.
New operators are walked through
the process and shown how audit
bags are handled, how percentage
variances are determined, and how
the deductions are calculated.
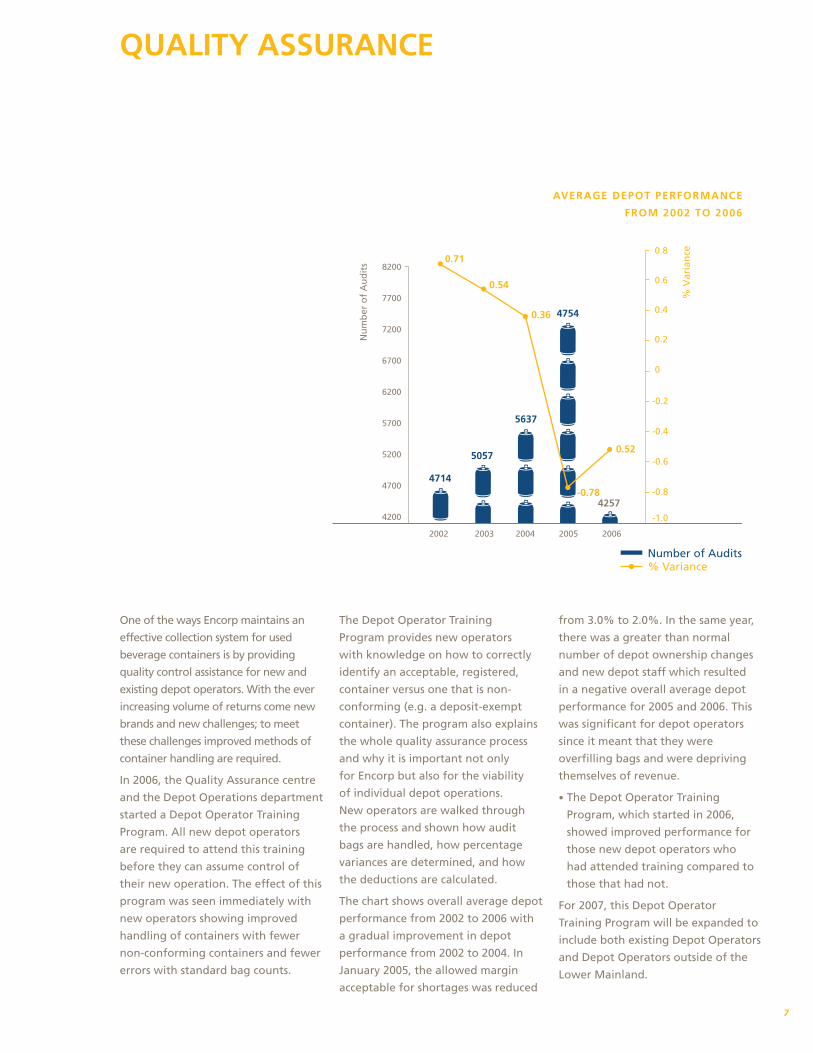
The chart shows overall average depot
performance from 2002 to 2006 with
a gradual improvement in depot
performance from 2002 to 2004. In
January 2005, the allowed margin
acceptable for shortages was reduced
from 3.0% to 2.0%. In the same year,
there was a greater than normal
number of depot ownership changes
and new depot staff which resulted
in a negative overall average depot
performance for 2005 and 2006. This
was significant for depot operators
since it meant that they were
overfilling bags and were depriving
themselves of revenue.
• The Depot Operator Training
Program, which started in 2006,
showed improved performance for
those new depot operators who
had attended training compared to
those that had not.
For 2007, this Depot Operator
Training Program will be expanded to
include both existing Depot Operators
and Depot Operators outside of the
Lower Mainland.
0.8
0.6
0.4
0.2
0
-0.2
-0.4
-0.6
-0.8
-1.0
% V
aria
nce
8200
7700
7200
6700
6200
5700
5200
4700
4200
Nu
mb
er o
f A
ud
its 0.71
2002 2003 2004 2005 2006
0.54
0.36
-0.784714
5057
5637
4754
0.52
4257
average dePot PerforMance
froM 2002 to 2006
Number of Audits% Variance
QualitY assurance
7
Each year, Encorp conducts
extensive consumer research to
determine how the upcoming
year’s consumer awareness
campaigns should be structured.
The 2005 surveys, upon which the
2006 campaign were based, was
the 7th such annual event.
There were two separate surveys
completed, one province-wide
and one which concentrated
on the Punjabi and Chinese-
speaking markets.
Results from the province-wide
survey, which consisted of 830
telephone interviews by Ipsos-Reid,
included the following:
• Overall awareness of Encorp/
Return-It throughout B.C. is 61%.
• Bottle depots are the most
commonly used method of
returning containers, except those
from multi-family residences where
the building’s recycling facilities are
most often used.
• Almost 25% of B.C. residents admit
to throwing containers away, and
those containers are most often
plastic water bottles.
• Only 57% of people in the
workplace put beverage containers
into recycling bins.
• Convenient ways of returning
containers were seen as more
important than any other specific
motivation to participate.
(environment, deposit refund, etc).
The ethnic market survey, conducted
through 201 interviews by
interviewers fluent in Cantonese and
Punjabi, was concentrated within the
Greater Vancouver Regional District.
The findings included:
• Awareness of the deposit system,
in general, is as high in these
two market sectors as it is in the
population as a whole, although
awareness was lower in
Cantonese- than in Punjabi-
speaking households.
• Punjabi-speaking households are
more likely to use bottle depots
than Cantonese households, likely
a reflection of the predominance
of Punjabi-speaking families living
in single-family households vs.
a predominance of Cantonese-
speaking families living in multi-
family residences.
In addition to the consumer surveys,
Encorp participated in an extensive
waste audit with the Greater
Vancouver Regional District. This was
done to determine actual consumer
behaviour, particularly in the multi-
family sector. The audit revealed
a considerable number of deposit
bearing containers were being
disposed of in the garbage from
the multi-family sector in the GVRD
but especially from within the City
of Vancouver.
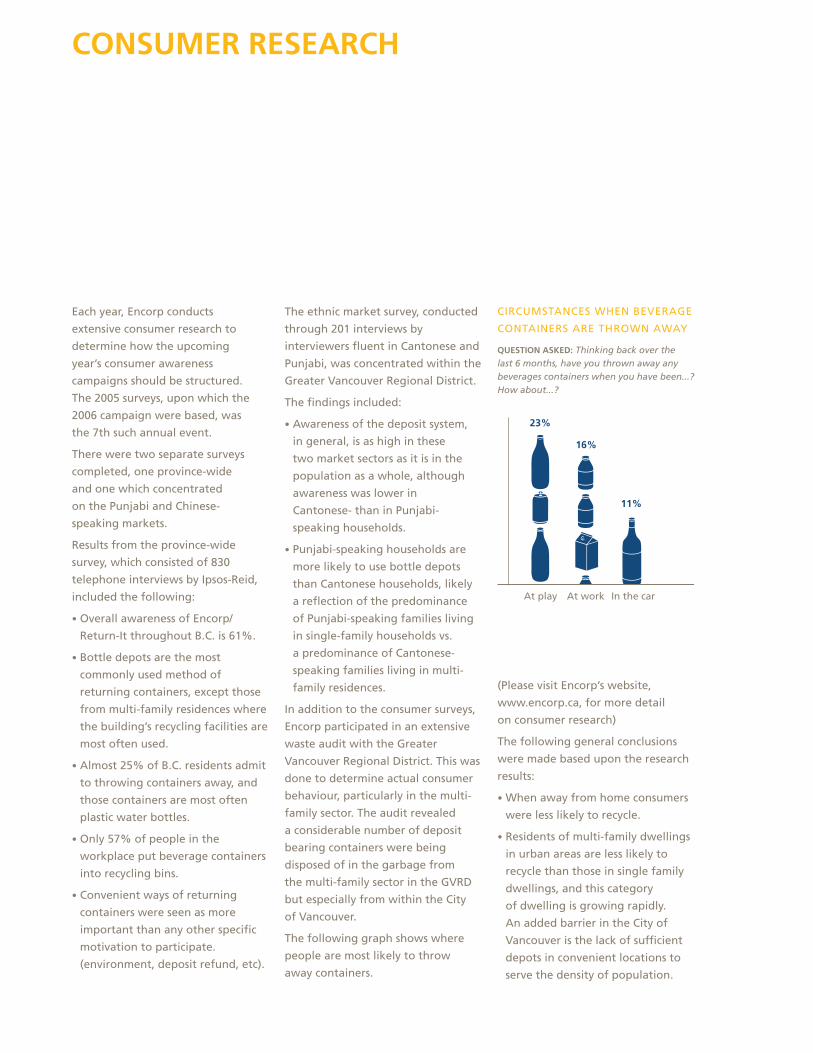
The following graph shows where
people are most likely to throw
away containers.
consuMer research
23%
16%
11%
At workAt play In the car
CIRCuMSTANCES WHEN BEVERAGE
CONTAINERS ARE THROWN AWAy
Question asked: Thinking back over the last 6 months, have you thrown away any beverages containers when you have been...? How about...?
(Please visit Encorp’s website,
www.encorp.ca, for more detail
on consumer research)
The following general conclusions
were made based upon the research
results:
• When away from home consumers
were less likely to recycle.
• Residents of multi-family dwellings
in urban areas are less likely to
recycle than those in single family
dwellings, and this category
of dwelling is growing rapidly.
An added barrier in the City of
Vancouver is the lack of sufficient
depots in convenient locations to
serve the density of population.
Soft Drinks Beer Juice Wine Sport Drinks
Spirits
98% 97%
87%82% 82% 80% 78%
Source: Consumer Research Findings 2006
54%58%
28%
6% 5% 3% 2%
Source: Consumer Research Findings 2006
2% 1% 1% 1%6%
Gro
cery
sto
re
Bo
ttle
dep
ots
Liq
uo
r st
ore
s
Conv
enie
nce
stor
es
Rec
yclin
g b
ins
Ch
ang
es
Mun
icip
al d
epot
s
Bott
le d
rive
s
G Thro
w a
way
Phar
mac
ies
D
Tota
l BC
res
po
nd
ents
(n
=83
0)
Water
Top
-of-
min
d
as s
tati
ons
t kn
ow
Tota
l un
aid
ed a
war
enes
s
31% 33% 11%
on’
s
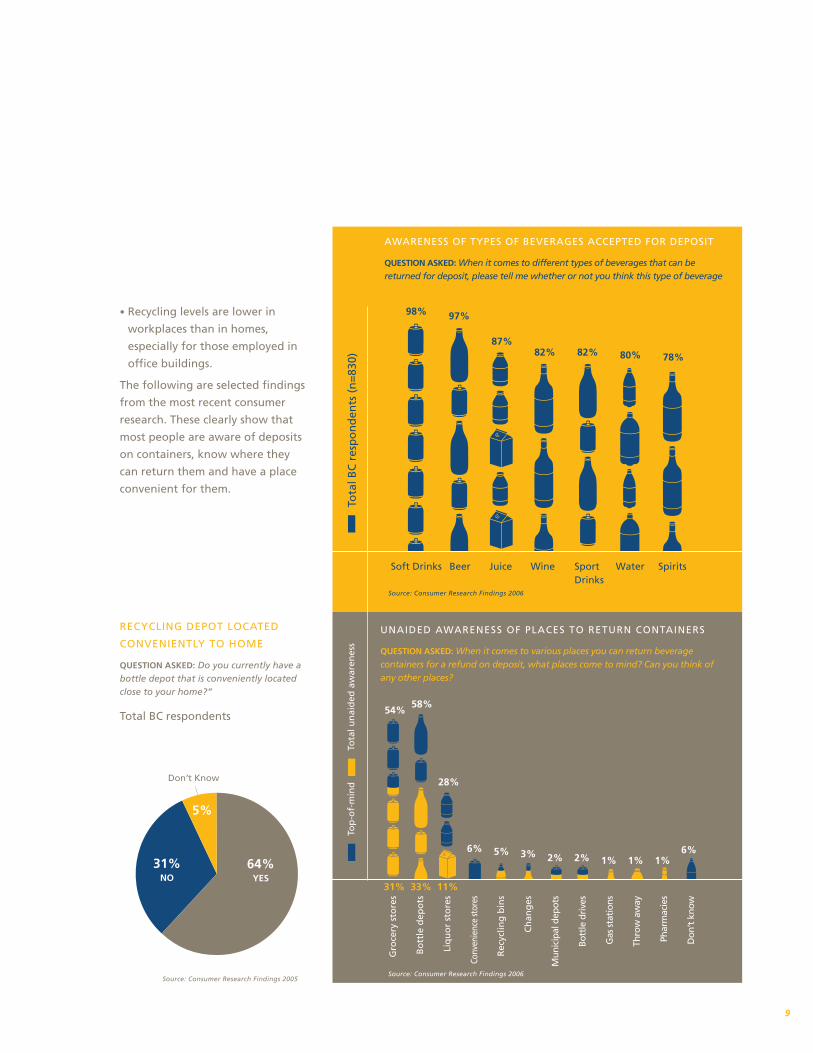
AWARENESS OF TyPES OF BEVERAGES ACCEPTED FOR DEPOSIT
Question asked: When it comes to different types of beverages that can be returned for deposit, please tell me whether or not you think this type of beverage
uNAIDED AWARENESS OF PLACES TO RETuRN CONTAINERS
Question asked: When it comes to various places you can return beverage containers for a refund on deposit, what places come to mind? Can you think of any other places?
9
Don’t Know
5%
64%YES
31%NO
RECyCLING DEPOT LOCATED
CONVENIENTLy TO HOME
Question asked: Do you currently have a bottle depot that is conveniently located close to your home?”
Total BC respondents
Source: Consumer Research Findings 2005
• Recycling levels are lower in
workplaces than in homes,
especially for those employed in
office buildings.
The following are selected findings
from the most recent consumer
research. These clearly show that
most people are aware of deposits
on containers, know where they
can return them and have a place
convenient for them.
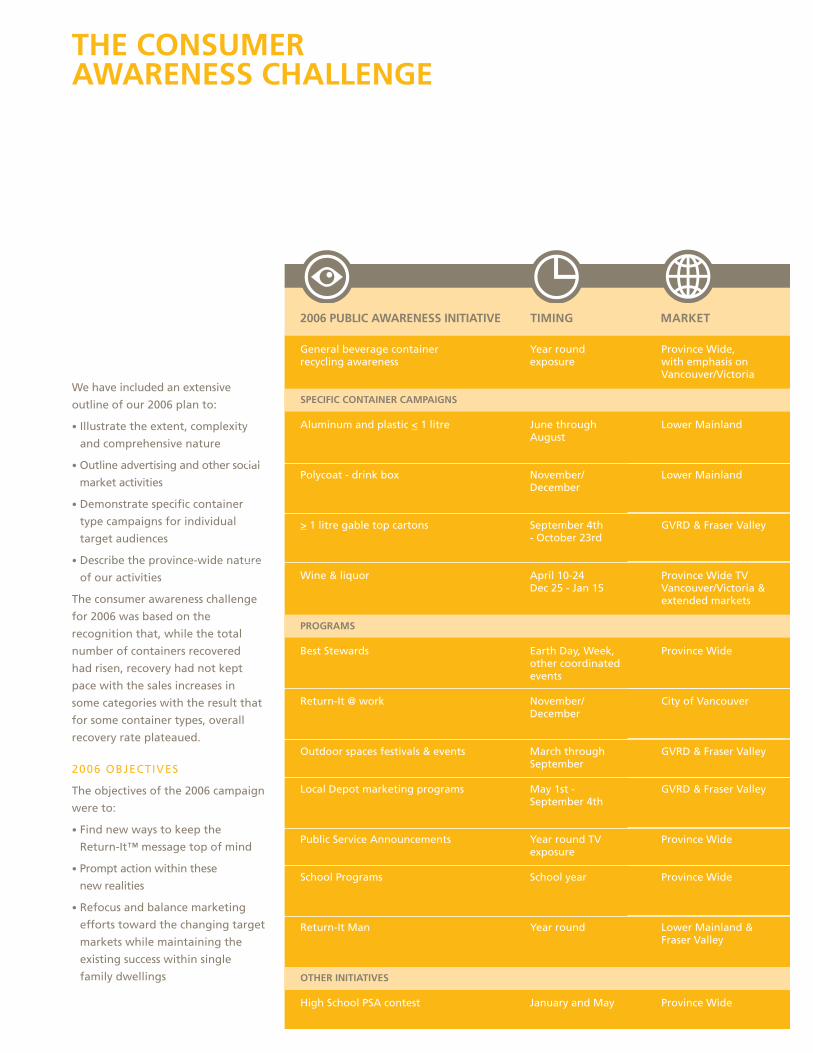
the consuMer awareness challenge
We have included an extensive
outline of our 2006 plan to:
• Illustrate the extent, complexity
and comprehensive nature
• Outline advertising and other social
market activities
• Demonstrate specific container
type campaigns for individual
target audiences
• Describe the province-wide nature
of our activities
The consumer awareness challenge
for 2006 was based on the
recognition that, while the total
number of containers recovered
had risen, recovery had not kept
pace with the sales increases in
some categories with the result that
for some container types, overall
recovery rate plateaued.
2006 OBJECTIVES
The objectives of the 2006 campaign
were to:
• Find new ways to keep the
Return-It™ message top of mind
• Prompt action within these
new realities
• Refocus and balance marketing
efforts toward the changing target
markets while maintaining the
existing success within single
family dwellings
2006 Public awareness initiative tiMing Market
General beverage container recycling awareness
sPecific container caMPaigns
Aluminum and plastic < 1 litre
Polycoat - drink box
> 1 litre gable top cartons
Wine & liquor
PrograMs
Best Stewards
Return-It @ work
Outdoor spaces festivals & events
Local Depot marketing programs
Public Service Announcements
School Programs
Return-It Man
other initiatives
High School PSA contest
year round exposure
June through August
November/ December
September 4th - October 23rd
April 10-24 Dec 25 - Jan 15
Earth Day, Week, other coordinated events
November/ December
March through September
May 1st - September 4th
year round TV exposure
School year
year round
January and May
Province Wide, with emphasis on Vancouver/Victoria
Lower Mainland
Lower Mainland
GVRD & Fraser Valley
Province Wide TV Vancouver/Victoria & extended markets
Province Wide
City of Vancouver
GVRD & Fraser Valley
GVRD & Fraser Valley
Province Wide
Province Wide
Lower Mainland & Fraser Valley
Province Wide
11
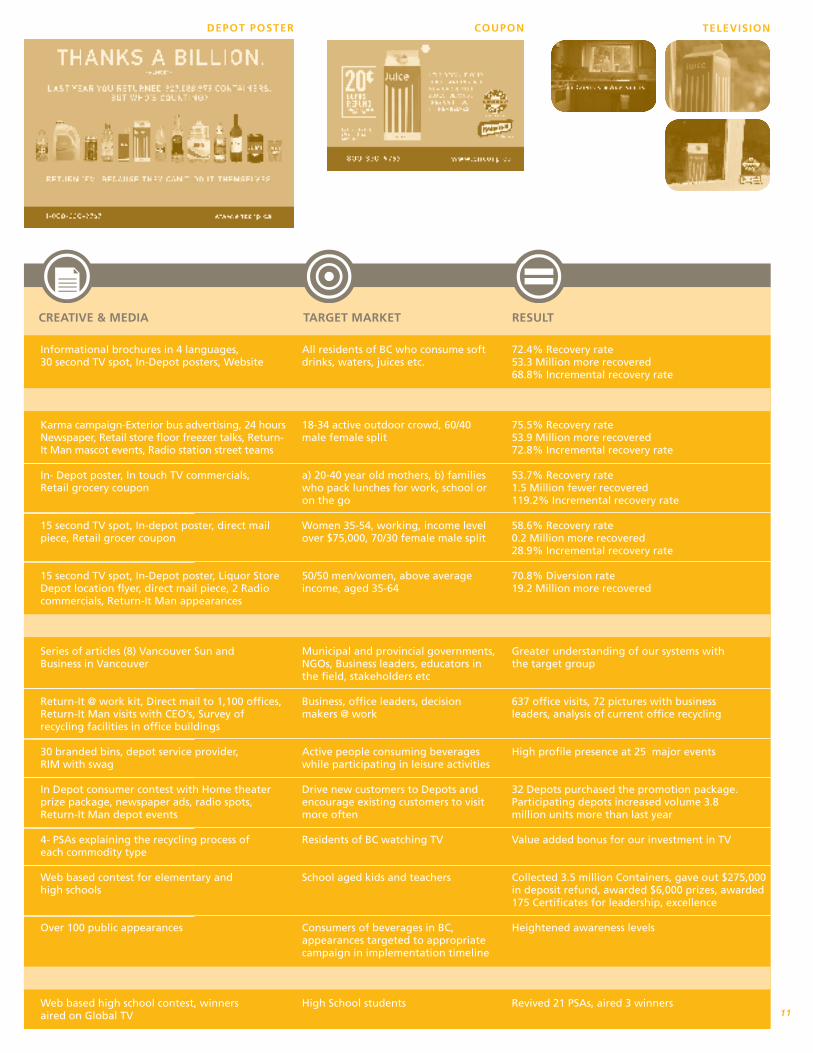
Informational brochures in 4 languages, 30 second TV spot, In-Depot posters, Website
Karma campaign-Exterior bus advertising, 24 hours Newspaper, Retail store floor freezer talks, Return-It Man mascot events, Radio station street teams
In- Depot poster, In touch TV commercials, Retail grocery coupon
15 second TV spot, In-depot poster, direct mail piece, Retail grocer coupon
15 second TV spot, In-Depot poster, Liquor Store Depot location flyer, direct mail piece, 2 Radio commercials, Return-It Man appearances
Series of articles (8) Vancouver Sun and Business in Vancouver
Return-It @ work kit, Direct mail to 1,100 offices, Return-It Man visits with CEO’s, Survey of recycling facilities in office buildings
30 branded bins, depot service provider, RIM with swag
In Depot consumer contest with Home theater prize package, newspaper ads, radio spots, Return-It Man depot events
4- PSAs explaining the recycling process of each commodity type
Web based contest for elementary and high schools
Over 100 public appearances
Web based high school contest, winners aired on Global TV
All residents of BC who consume soft drinks, waters, juices etc.
18-34 active outdoor crowd, 60/40 male female split
a) 20-40 year old mothers, b) families who pack lunches for work, school or on the go
Women 35-54, working, income level over $75,000, 70/30 female male split
50/50 men/women, above average income, aged 35-64
Municipal and provincial governments, NGOs, Business leaders, educators in the field, stakeholders etc
Business, office leaders, decision makers @ work
Active people consuming beverages while participating in leisure activities
Drive new customers to Depots and encourage existing customers to visit more often
Residents of BC watching TV
School aged kids and teachers
Consumers of beverages in BC, appearances targeted to appropriate campaign in implementation timeline
High School students
72.4% Recovery rate 53.3 Million more recovered 68.8% Incremental recovery rate
75.5% Recovery rate53.9 Million more recovered 72.8% Incremental recovery rate
53.7% Recovery rate 1.5 Million fewer recovered 119.2% Incremental recovery rate
58.6% Recovery rate 0.2 Million more recovered 28.9% Incremental recovery rate
70.8% Diversion rate19.2 Million more recovered
Greater understanding of our systems with the target group
637 office visits, 72 pictures with business leaders, analysis of current office recycling
High profile presence at 25 major events
32 Depots purchased the promotion package. Participating depots increased volume 3.8 million units more than last year
Value added bonus for our investment in TV
Collected 3.5 million Containers, gave out $275,000 in deposit refund, awarded $6,000 prizes, awarded 175 Certificates for leadership, excellence
Heightened awareness levels
Revived 21 PSAs, aired 3 winners
creative & Media target Market result
televisioncouPondePot Poster
In 2006 Encorp introduced a number
of new, additional, initiatives
designed to combat static or
declining recovery rates. The major
initiatives included:
• New Depots in the City of
Vancouver – Since the City of
Vancouver has less than half the
number of depots required to
provide its population with the
same level of service as the rest of
the province, and several attempts
to obtain approval by individual
depot operators were turned
down, Encorp provided logistical
and financial support directly
to potential depot operators in
their attempts to obtain planning
approval for new depots in the
City. After extensive efforts,
a new depot was given provisional
approval by the City’s Board of
Variance in the Fall of 2006.
Encorp will continue with this
activity in order to assist operators
to add the additional 8 depots
needed to provide adequate
coverage in the City.
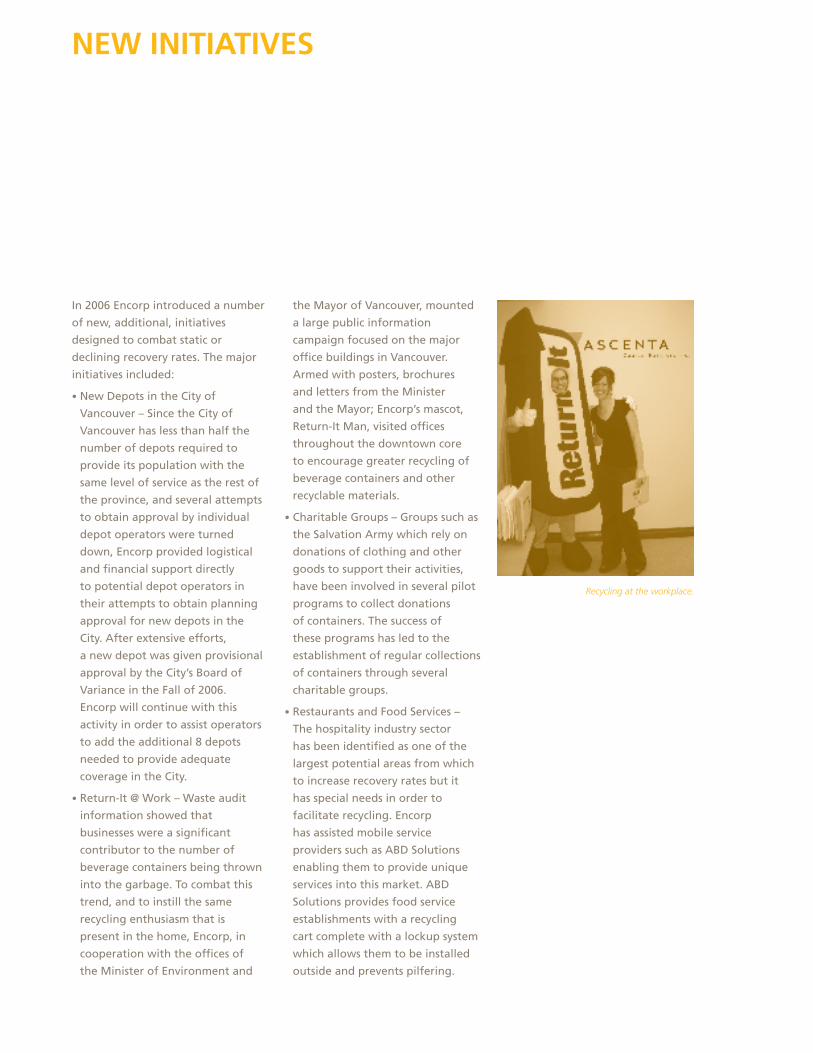
• Return-It @ Work – Waste audit
information showed that
businesses were a significant
contributor to the number of
beverage containers being thrown
into the garbage. To combat this
trend, and to instill the same
recycling enthusiasm that is
present in the home, Encorp, in
cooperation with the offices of
the Minister of Environment and
the Mayor of Vancouver, mounted
a large public information
campaign focused on the major
office buildings in Vancouver.
Armed with posters, brochures
and letters from the Minister
and the Mayor; Encorp’s mascot,
Return-It Man, visited offices
throughout the downtown core
to encourage greater recycling of
beverage containers and other
recyclable materials.
• Charitable Groups – Groups such as
the Salvation Army which rely on
donations of clothing and other
goods to support their activities,
have been involved in several pilot
programs to collect donations
of containers. The success of
these programs has led to the
establishment of regular collections
of containers through several
charitable groups.
• Restaurants and Food Services –
The hospitality industry sector
has been identified as one of the
largest potential areas from which
to increase recovery rates but it
has special needs in order to
facilitate recycling. Encorp
has assisted mobile service
providers such as ABD Solutions
enabling them to provide unique
services into this market. ABD
Solutions provides food service
establishments with a recycling
cart complete with a lockup system
which allows them to be installed
outside and prevents pilfering.
new initiatives
Recycling at the workplace.
beverage container stewardshiP Plan
13
A major task for Encorp in 2006 was
the development and submission
of a revised Stewardship Plan
as required by the Recycling
Regulation. Encorp’s current
Stewardship Plan, approved in
2000, was re-written with input and
assistance from Encorp’s Advisory
Committee and other stakeholder
groups. The plan was submitted to
the Ministry of Environment on time
in early October. When approved,
the Plan will be posted on Encorp’s
website.
the encorP business Model
The success of the industry product
stewardship model, of which Encorp
is the largest example in British
Columbia, is dependent on the
attainment of three goals:
• Consumer support for, and active
participation in, the objectives of
the program
• High governance standards
including public accountability and
transparency
• Economies of scale to reduce
operational costs
Consumer support for industry
product stewardship, and for
recycling in general, would diminish
rapidly if costs were not contained.
Some types of general recycling,
notably paper and metals, generate
enough money from the sale of
materials to cover their collection
costs and therefore don’t require
a subsidy. Product stewardship
agencies, however, cannot select
only the most valuable materials to
recover but must collect and recycle
all the types of materials used in their
product sector. They also cannot pick
and choose their collection areas
but must cover the entire province
and must also meet other regulatory
requirements which have an impact
on costs. These factors mean that
industry product stewardship
programs require additional funding
beyond the market value of the
collected materials and, in Encorp’s
case unredeemed deposits, to support
each system.
Regardless of how this additional
funding is collected, the most
efficient way is to do so through a
single collection agency, and to a
single standard, in order to ensure
equity and compliance amongst
brand owners, comparable collection
standards across the province and
consistent consumer messaging. Such
systems are expensive to establish
and maintain, but once in place,
can handle expansion into different
sectors with consequent savings, i.e.,
economies of scale for all participants.
To achieve these economies of
scale, and thereby minimize the
additional fee requirement, a
product stewardship agency will seek
managed, compatible, growth which
can come through the addition of
new product sectors or through
geographic expansion.
It is this single agency status,
and incentive for growth, which
causes some concern about the
development of ‘monopolies’ in
certain categories or geographic
areas. While this may be a concern in
conventional business sectors which
can stand financially alone on the
value of their products, it is most
likely the only way industry product
stewardship, with its requirement
for additional fees, equitably applied
to the sale price of all products in a
category, can successfully operate.
A degree of protection is also a
requirement for a viable depot
network which needs to be
provided with the security of
adequate volumes of materials and
revenues. The regular, consistent
and substantial payments Encorp
makes to depots for the collection
of non-alcoholic and some alcoholic
beverage containers sustains
the depot network and makes
it available for other, smaller,
stewardship programs which could
not support the network either
alone or combined.
Economies of scale are also a way
of obtaining the best prices for
the collected materials. Adequate,
consistent volumes of materials
are the only way for transporters
and processors to justify capital
investment in plant and equipment.
Encorp is a “monopoly” only in the
organizational area; namely depot
licensing, finance, administration,
producer/brand registration and
consumer education, where it needs
to be for successful, cost-efficient,
operation. In all other aspects it
contracts services in the competitive
marketplace to ensure the lowest
available costs at all times.
This philosophy is evident in the
two key areas in which Encorp enters
into contracts.
76%
75%
74%
73%
72%
71%
70%
69%
68%
67%
66%
65%
64%
63%
62%
61%
60%
59%%
Ret
urn
ed t
oD
epo
t vs
GLS
180.0
175.0
170.0
165.0
160.0
155.0
150.0
145.0
140.0
135.0
130.0
125.0
120.0
115.
110.0
Un
its
Mill
ion
s
0
62%
2002 2003 2004 2005 2006 YEAR
63%
68%
126.3
141.9
151.4
71%
158.4
75%
174.4
Number of Returns% Returned to Depots vs GLS
ldb container returns
15
CONTRACTS FOR THE
PROVISION OF SERVICES
By ENCORP
Encorp’s activities are divided into
two major sectors: the first, and
most important, is the delivery of
product stewardship agency services
for the non-alcoholic beverage
brand owners who are members
of Encorp. A key principle in the
delivery of these services is that
there be no cross-subsidy between
different container types. This
ensures that brand owners who
choose to package in one specific
type of container will neither receive
payment from, nor make payments
to, the costs of collecting a
different container type chosen
by a competitor.
The second major sector of Encorp’s
business is that of service provider
contracts for industry sectors which
are not part of Encorp’s beverage
company membership. For any such
contracts to be considered they must
enhance Encorp’s economies of scale
and meet some basic principles:
• Each contract must provide some
financial benefit to the existing
beverage container system, usually
through a reduction in overall
operational costs.
• The contract must enhance, or at
least be compatible with, Encorp’s
main business of recovering and
recycling beverage containers
the encorP business Model
• Each contract must pay its own way
with no-cross subsidy from Encorp’s
beverage container program nor
from any other contract
In 2006 Encorp was involved with the
following service provider contracts:
B.C. LIQuOR
DISTRIBuTION BRANCH
The BCLDB is currently the product
stewardship agency for all wine, spirits
and cooler containers as well as beer
sold in non-refillable bottles. Since
2001, the BCBLDB has contracted with
Encorp Pacific to recover containers
through the depot network and
to provide transportation services
for containers collected through
Government Liquor Stores.
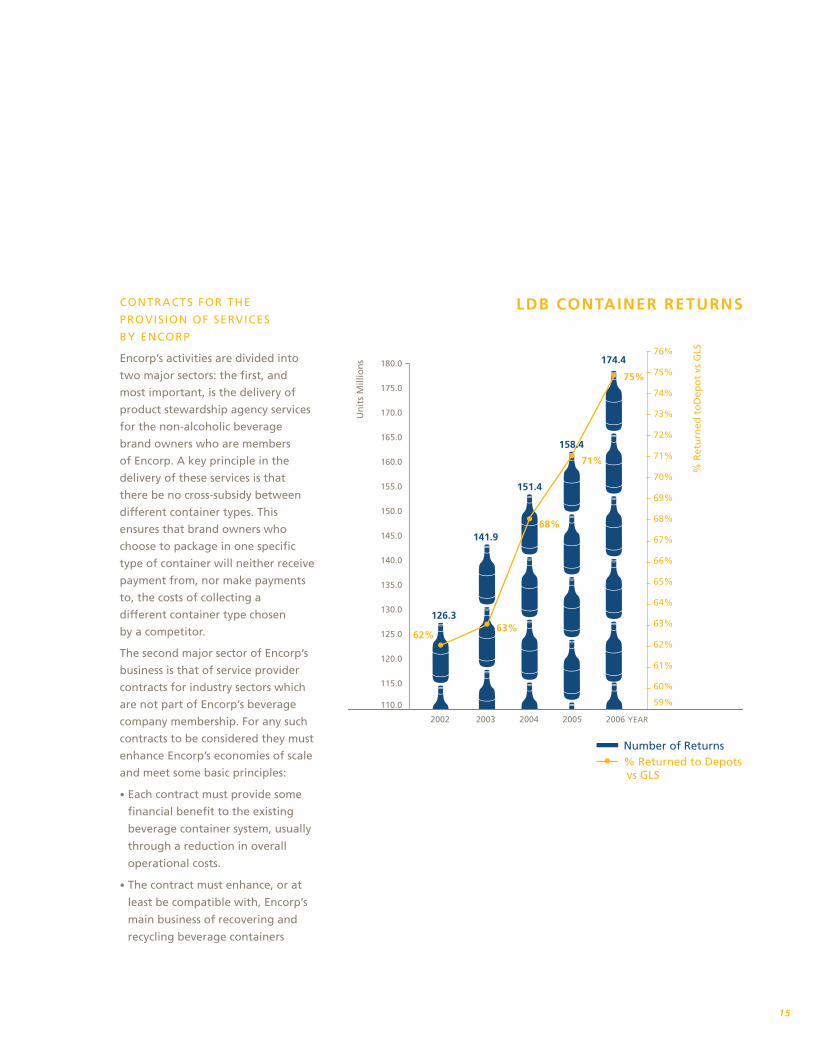
In 2006, the Encorp system collected
174 million used alcoholic beverage
containers weighing nearly 56
million KG. Nearly 75% of these
containers were returned by
consumers to Encorp Bottle and
Return-It Depots, an increase of 4%.
In the latter part of 2006, the BCLDB
announced that it no longer wished
to be the product stewardship
agency for these containers and that
it would seek to have the alcoholic
beverage industry assume the
responsibility. The organizational
arrangements for this changeover
will be finalized in 2007 but,
regardless of the final structure, no
changes to consumer requirements,
access or convenience are expected.
B.C. DAIRy COuNCIL
Milk cartons and jugs are exempt
from the Recycling Regulation and
are not subject to deposit or refund.
The B. C. Dairy Council opted to
establish a voluntary collection
program for these containers and
asked Encorp if it was interested in
providing services. As a result, Encorp
entered into a service provider
contract with the Dairy Council in
mid-2006 under which most Encorp
depots will, by the summer of 2007,
be collecting and recycling milk
cartons and jugs. The first phase of
the program was rolled out in the
Fraser Valley and Greater Vancouver
in October 2006, with the Interior,
Vancouver Island and the North to
follow in early 2007.
ELECTRONICS STEWARDSHIP
ASSOCIATION OF B.C.
In 2006, in response to an Order-In-
Council adding certain electronic
items to the Recycling Regulation,
Electronic Product Stewardship
Canada invited proposals from
several organizations to provide
administration, collection, consumer
awareness and recycling operations
for these designated, end-of-life
electronic products.
In June 2006, Encorp was selected
as the successful applicant with
the first task of developing a draft
stewardship plan, including public
consultation, for submission to the
Ministry of Environment. Public
consultation on the stewardship
plan took place during September
and the plan was submitted to
the Ministry in mid-October. The
plan was approved by the Ministry
in December and the program is
scheduled to begin in August 2007.
The plan calls for consumers to return
end-of-life computers, televisions
and desktop printers to selected
depots, and other sites, around the
province from which they will be
shipped to qualified recyclers. Encorp
will be responsible for managing
the collection program, including an
extensive public awareness campaign,
under the supervision of the
Electronics Stewardship Association of
B.C. which was formed expressly for
this purpose.
CONTRACTS FOR THE
PROVISION OF SERVICES
TO ENCORP
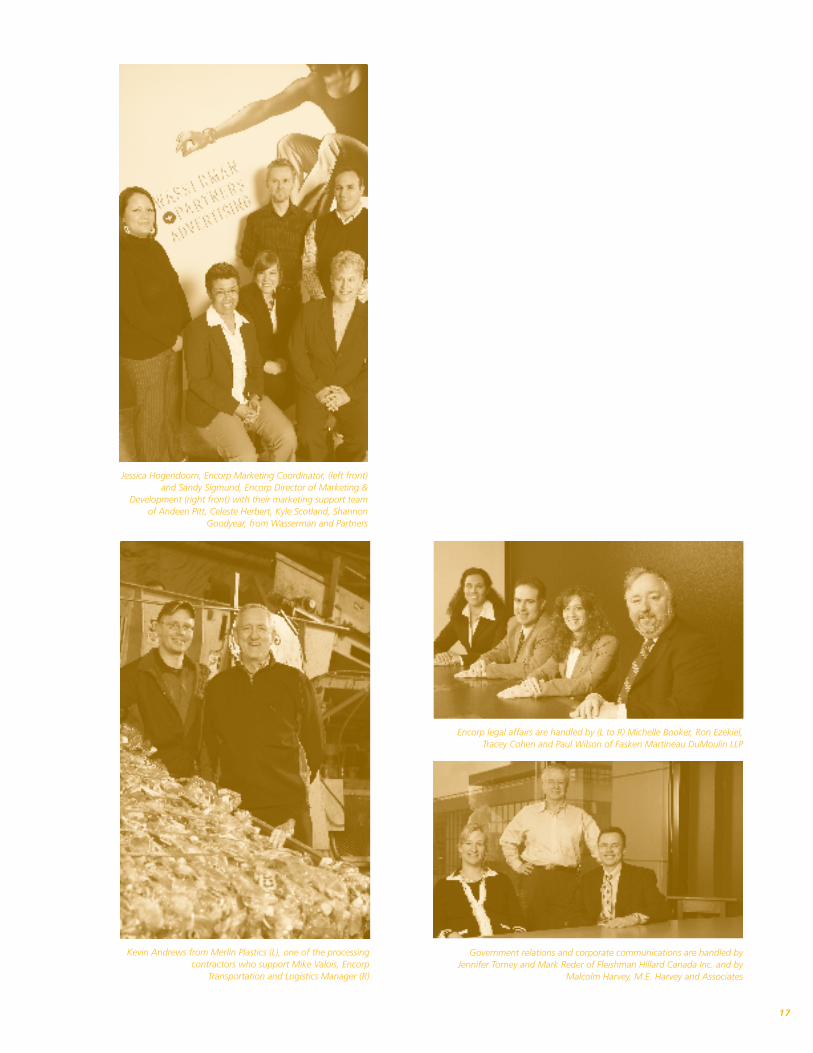
Another hallmark of the Encorp
system is that the majority of
services are delivered by third-party
contractors rather than by Encorp
employees. These services range
from the depots themselves, which
are independently owned, to
transportation, processing,
software development, design,
production and placement of
consumer awareness programs,
government relations and website
design and hosting.
A selection of some of the people
who provide services to Encorp are
featured in the following photos:
17
Government relations and corporate communications are handled by Jennifer Torney and Mark Reder of Fleishman Hillard Canada Inc. and by
Malcolm Harvey, M.E. Harvey and Associates
Jessica Hogendoorn, Encorp Marketing Coordinator, (left front) and Sandy Sigmund, Encorp Director of Marketing &
Development (right front) with their marketing support team of Andeen Pitt, Celeste Herbert, Kyle Scotland, Shannon
Goodyear, from Wasserman and Partners
Kevin Andrews from Merlin Plastics (L), one of the processing contractors who support Mike Valois, Encorp
Transportation and Logistics Manager (R)
Encorp legal affairs are handled by (L to R) Michelle Booker, Ron Ezekiel, Tracey Cohen and Paul Wilson of Fasken Martineau DuMoulin LLP

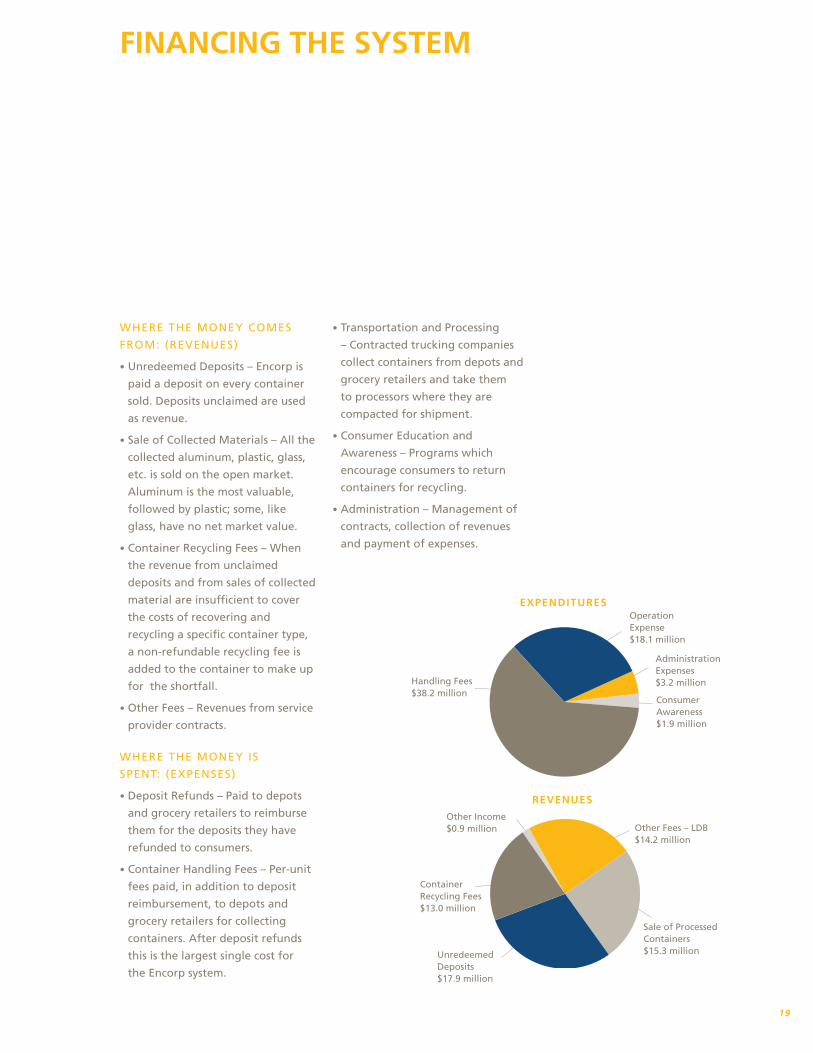
financing the sYsteM
WHERE THE MONEy COMES
FROM: (REVENuES)
• unredeemed Deposits – Encorp is
paid a deposit on every container
sold. Deposits unclaimed are used
as revenue.
• Sale of Collected Materials – All the
collected aluminum, plastic, glass,
etc. is sold on the open market.
Aluminum is the most valuable,
followed by plastic; some, like
glass, have no net market value.
• Container Recycling Fees – When
the revenue from unclaimed
deposits and from sales of collected
material are insufficient to cover
the costs of recovering and
recycling a specific container type,
a non-refundable recycling fee is
added to the container to make up
for the shortfall.
• Other Fees – Revenues from service
provider contracts.
WHERE THE MONEy IS
SPENT: (ExPENSES)
• Deposit Refunds – Paid to depots
and grocery retailers to reimburse
them for the deposits they have
refunded to consumers.
• Container Handling Fees – Per-unit
fees paid, in addition to deposit
reimbursement, to depots and
grocery retailers for collecting
containers. After deposit refunds
this is the largest single cost for
the Encorp system.
• Transportation and Processing
– Contracted trucking companies
collect containers from depots and
grocery retailers and take them
to processors where they are
compacted for shipment.
• Consumer Education and
Awareness – Programs which
encourage consumers to return
containers for recycling.
• Administration – Management of
contracts, collection of revenues
and payment of expenses.
19
unredeemed Deposits $17.9 million
Other Income $0.9 million
Administration Expenses $3.2 million
Operation Expense $18.1 million
Consumer Awareness $1.9 million
Handling Fees $38.2 million
Sale of Processed Containers $15.3 million
Other Fees – LDB $14.2 million
Container Recycling Fees $13.0 million
exPenditures
revenues
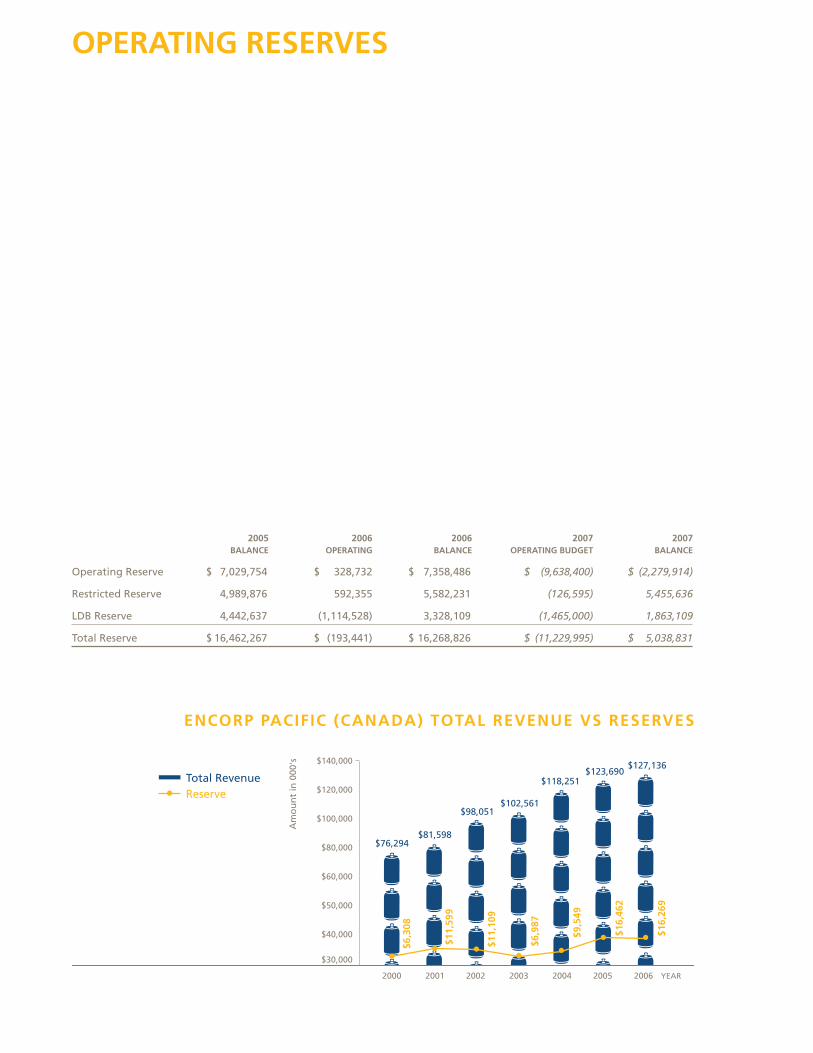
oPerating reserves
$140,000
$120,000
$100,000
$80,000
$60,000
$50,000
$40,000
$30,000
Am
ou
nt
in 0
00's
2000 2001 2002 2003 2004 2005 2006 YEAR
$76,294$81,598
$98,051$102,561
$118,251$123,690
$127,136
$6,3
08
$11,
599
$11,
109
$6,9
87
$9,5
49
$16,
462
$16,
269
2005 2006 2006 2007 2007 balance oPerating balance oPerating budget balance
Operating Reserve $ 7,029,754 $ 328,732 $ 7,358,486 $ (9,638,400) $ (2,279,914)
Restricted Reserve 4,989,876 592,355 5,582,231 (126,595) 5,455,636
LDB Reserve 4,442,637 (1,114,528) 3,328,109 (1,465,000) 1,863,109
Total Reserve $ 16,462,267 $ (193,441) $ 16,268,826 $ (11,229,995) $ 5,038,831
Total RevenueReserve
encorP Pacific (canada) total revenue vs reserves
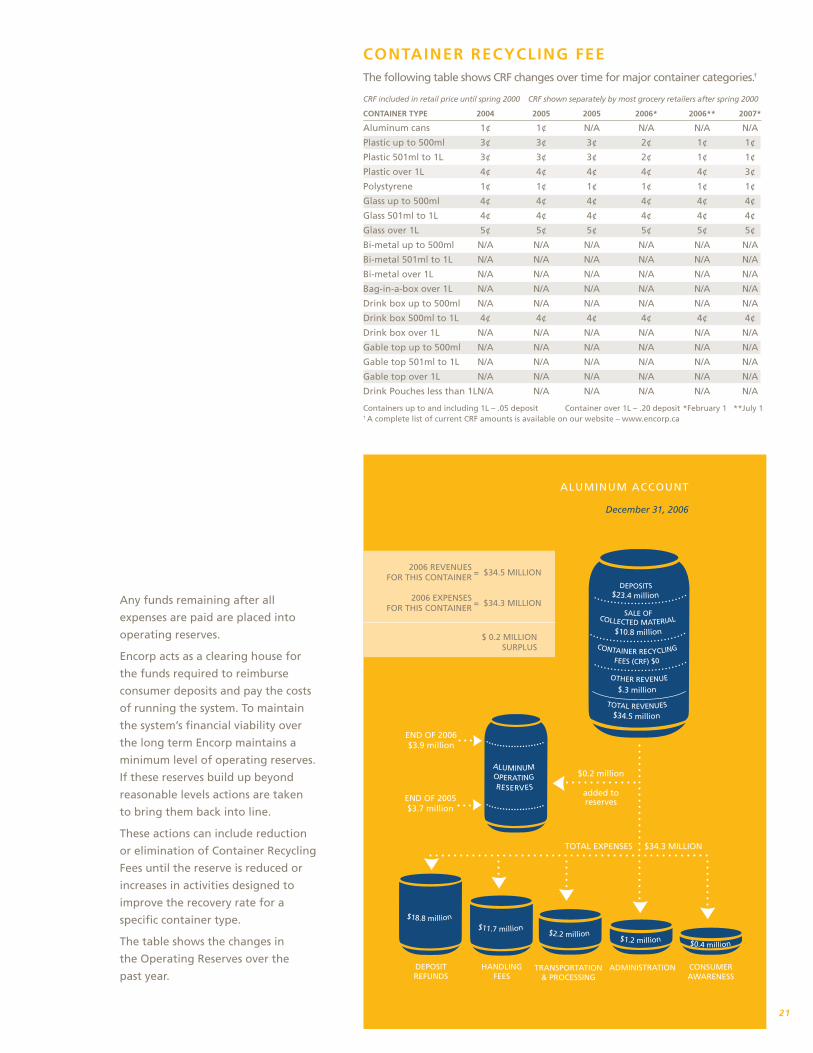
CONSUMERAWARENESS
$0.4 million
ADMINISTRATION
$1.2 million
TRANSPORTATION& PROCESSING
$2.2 million
HANDLINGFEES
$11.7 million
DEPOSITREFUNDS
$18.8 million
$0.2 million
added toreserves
END OF 2006$3.9 million
END OF 2005$3.7 million
ALUMINUM OPERATING RESERVES
DEPOSITS $23.4 million
SALE OF
OTHER REVENUE
COLLECTED MATERIAL
$10.8 million
CONTAINER RECYCLING
FEES (CRF) $0
$.3 million
TOTAL REVENUES $34.5 million
2006 REVENUESFOR THIS CONTAINER
2006 EXPENSESFOR THIS CONTAINER
= $34.5 MILLION
= $34.3 MILLION
$ 0.2 MILLIONSURPLUS
TOTAL EXPENSES $34.3 MILLION
Any funds remaining after all
expenses are paid are placed into
operating reserves.
Encorp acts as a clearing house for
the funds required to reimburse
consumer deposits and pay the costs
of running the system. To maintain
the system’s financial viability over
the long term Encorp maintains a
minimum level of operating reserves.
If these reserves build up beyond
reasonable levels actions are taken
to bring them back into line.
These actions can include reduction
or elimination of Container Recycling
Fees until the reserve is reduced or
increases in activities designed to
improve the recovery rate for a
specific container type.
The table shows the changes in
the Operating Reserves over the
past year.
container recYcling feeThe following table shows CRF changes over time for major container categories.†
CRF included in retail price until spring 2000 CRF shown separately by most grocery retailers after spring 2000
container tYPe 2004 2005 2005 2006* 2006** 2007*
Aluminum cans 1¢ 1¢ N/A N/A N/A N/A
Plastic up to 500ml 3¢ 3¢ 3¢ 2¢ 1¢ 1¢
Plastic 501ml to 1L 3¢ 3¢ 3¢ 2¢ 1¢ 1¢
Plastic over 1L 4¢ 4¢ 4¢ 4¢ 4¢ 3¢
Polystyrene 1¢ 1¢ 1¢ 1¢ 1¢ 1¢
Glass up to 500ml 4¢ 4¢ 4¢ 4¢ 4¢ 4¢
Glass 501ml to 1L 4¢ 4¢ 4¢ 4¢ 4¢ 4¢
Glass over 1L 5¢ 5¢ 5¢ 5¢ 5¢ 5¢
Bi-metal up to 500ml N/A N/A N/A N/A N/A N/A
Bi-metal 501ml to 1L N/A N/A N/A N/A N/A N/A
Bi-metal over 1L N/A N/A N/A N/A N/A N/A
Bag-in-a-box over 1L N/A N/A N/A N/A N/A N/A
Drink box up to 500ml N/A N/A N/A N/A N/A N/A
Drink box 500ml to 1L 4¢ 4¢ 4¢ 4¢ 4¢ 4¢
Drink box over 1L N/A N/A N/A N/A N/A N/A
Gable top up to 500ml N/A N/A N/A N/A N/A N/A
Gable top 501ml to 1L N/A N/A N/A N/A N/A N/A
Gable top over 1L N/A N/A N/A N/A N/A N/A
Drink Pouches less than 1L N/A N/A N/A N/A N/A N/A
Containers up to and including 1L – .05 deposit Container over 1L – .20 deposit *February 1 **July 1† A complete list of current CRF amounts is available on our website – www.encorp.ca
21
ALuMINuM ACCOuNT
December 31, 2006
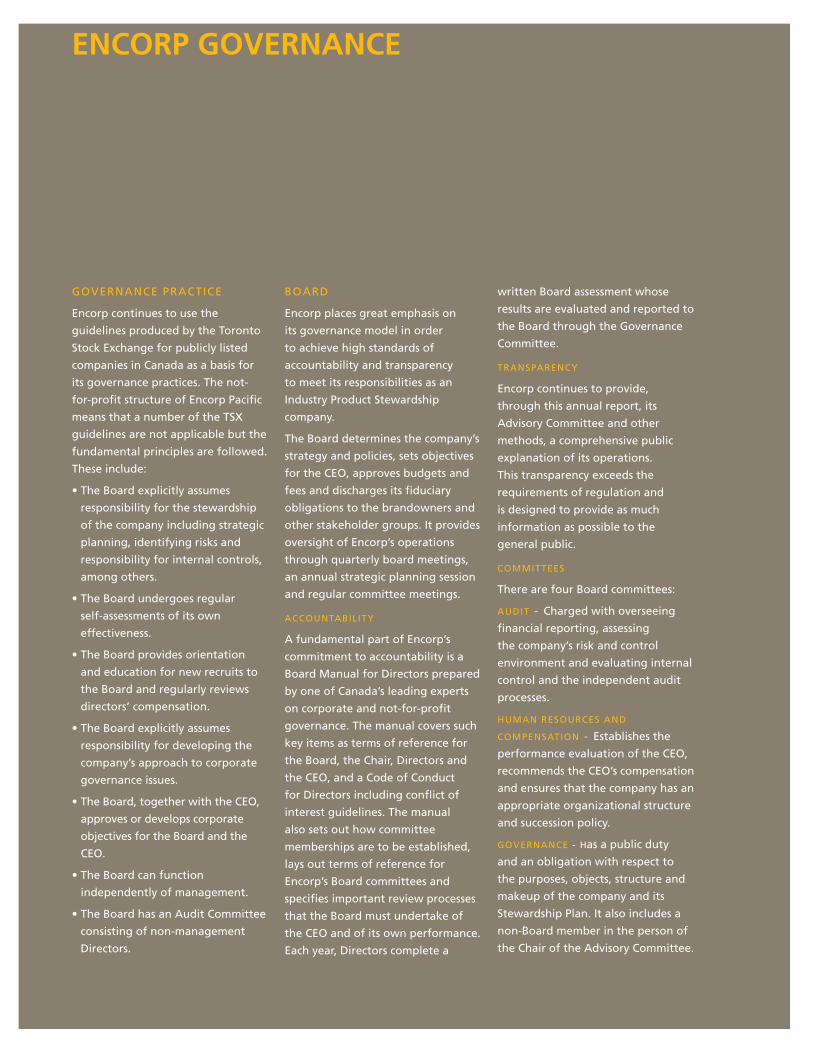
GOVERNANCE PRACTICE
Encorp continues to use the
guidelines produced by the Toronto
Stock Exchange for publicly listed
companies in Canada as a basis for
its governance practices. The not-
for-profit structure of Encorp Pacific
means that a number of the TSx
guidelines are not applicable but the
fundamental principles are followed.
These include:
• The Board explicitly assumes
responsibility for the stewardship
of the company including strategic
planning, identifying risks and
responsibility for internal controls,
among others.
• The Board undergoes regular
self-assessments of its own
effectiveness.
• The Board provides orientation
and education for new recruits to
the Board and regularly reviews
directors’ compensation.
• The Board explicitly assumes
responsibility for developing the
company’s approach to corporate
governance issues.
• The Board, together with the CEO,
approves or develops corporate
objectives for the Board and the
CEO.
• The Board can function
independently of management.
• The Board has an Audit Committee
consisting of non-management
Directors.
BOARD
Encorp places great emphasis on
its governance model in order
to achieve high standards of
accountability and transparency
to meet its responsibilities as an
Industry Product Stewardship
company.
The Board determines the company’s
strategy and policies, sets objectives
for the CEO, approves budgets and
fees and discharges its fiduciary
obligations to the brandowners and
other stakeholder groups. It provides
oversight of Encorp’s operations
through quarterly board meetings,
an annual strategic planning session
and regular committee meetings.
ACCOuNTABILITy
A fundamental part of Encorp’s
commitment to accountability is a
Board Manual for Directors prepared
by one of Canada’s leading experts
on corporate and not-for-profit
governance. The manual covers such
key items as terms of reference for
the Board, the Chair, Directors and
the CEO, and a Code of Conduct
for Directors including conflict of
interest guidelines. The manual
also sets out how committee
memberships are to be established,
lays out terms of reference for
Encorp’s Board committees and
specifies important review processes
that the Board must undertake of
the CEO and of its own performance.
Each year, Directors complete a
written Board assessment whose
results are evaluated and reported to
the Board through the Governance
Committee.
TRANSPARENCy
Encorp continues to provide,
through this annual report, its
Advisory Committee and other
methods, a comprehensive public
explanation of its operations.
This transparency exceeds the
requirements of regulation and
is designed to provide as much
information as possible to the
general public.
COMMITTEES
There are four Board committees:
AuDIT - Charged with overseeing
financial reporting, assessing
the company’s risk and control
environment and evaluating internal
control and the independent audit
processes.
HuMAN RESOuRCES AND
COMPENSATION - Establishes the
performance evaluation of the CEO,
recommends the CEO’s compensation
and ensures that the company has an
appropriate organizational structure
and succession policy.
GOVERNANCE - Has a public duty
and an obligation with respect to
the purposes, objects, structure and
makeup of the company and its
Stewardship Plan. It also includes a
non-Board member in the person of
the Chair of the Advisory Committee.
encorP governance
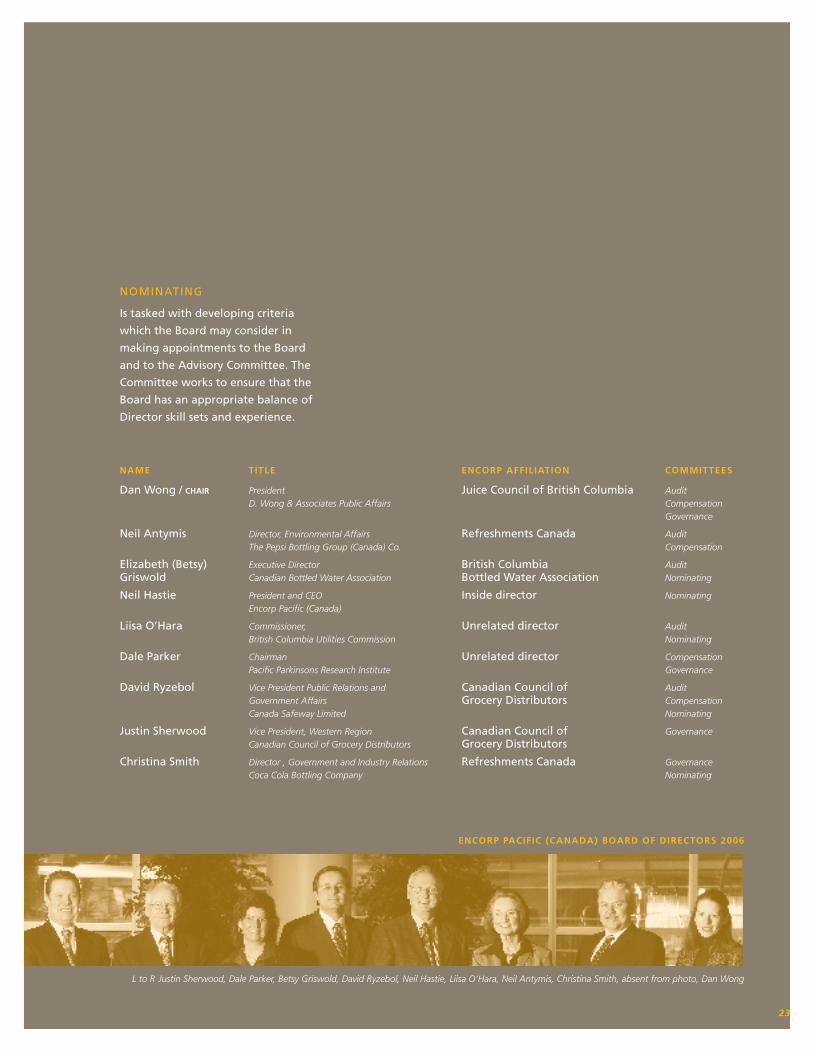
encorP Pacific (canada) board of directors 2006
naMe title encorP affiliation coMMittees
Dan Wong / chair President Juice Council of British Columbia Audit D. Wong & Associates Public Affairs Compensation Governance
Neil Antymis Director, Environmental Affairs Refreshments Canada Audit The Pepsi Bottling Group (Canada) Co. Compensation
Elizabeth (Betsy) Executive Director British Columbia AuditGriswold Canadian Bottled Water Association Bottled Water Association Nominating
Neil Hastie President and CEO Inside director Nominating Encorp Pacific (Canada)
Liisa O’Hara Commissioner, unrelated director Audit British Columbia Utilities Commission Nominating
Dale Parker Chairman unrelated director Compensation Pacific Parkinsons Research Institute Governance
David Ryzebol Vice President Public Relations and Canadian Council of Audit Government Affairs Grocery Distributors Compensation Canada Safeway Limited Nominating
Justin Sherwood Vice President, Western Region Canadian Council of Governance Canadian Council of Grocery Distributors Grocery Distributors
Christina Smith Director , Government and Industry Relations Refreshments Canada Governance Coca Cola Bottling Company Nominating
23
L to R Justin Sherwood, Dale Parker, Betsy Griswold, David Ryzebol, Neil Hastie, Liisa O’Hara, Neil Antymis, Christina Smith, absent from photo, Dan Wong
NOMINATING
Is tasked with developing criteria
which the Board may consider in
making appointments to the Board
and to the Advisory Committee. The
Committee works to ensure that the
Board has an appropriate balance of
Director skill sets and experience.
2006 Annual Report to the Board of Directors
The Encorp Pacific (Canada) governance structure includes an Advisory
Committee consisting of stakeholder representatives from local governments,
environmental organizations, institutions, small brandowners, non-profit
organizations and depots. The Advisory Committee controls its own
membership by recommending new and replacement members to the Board’s
Nominating Committee.
The Advisory Committee met three times in 2006 to review and comment
on the budget, financial statements and consumer awareness campaigns.
There was also discussion regarding the new electronics stewardship plan and
Encorp’s involvement as the service provider and its affect on the beverage
container stewardship program.
The Advisory Committee also led the consultation process on the new
Stewardship Plan required by the provincial Recycling Regulation.
The committee provided comments from their constituents and reviewed
all of the correspondence submitted by other interested parties. Committee
members reached consensus on some issues but not on others and reviewed
the final Stewardship Plan report before it was submitted to the Province.
The Committee welcomed 4 new members: Pat Fitzgerald from the university
of British Columbia, Linda Barnes, Councillor for the City of Richmond, Brock
MacDonald, Executive Director of the Recycling Council of BC and Janice
Song, owner operator of the Ironwood Bottle Depot in Richmond.
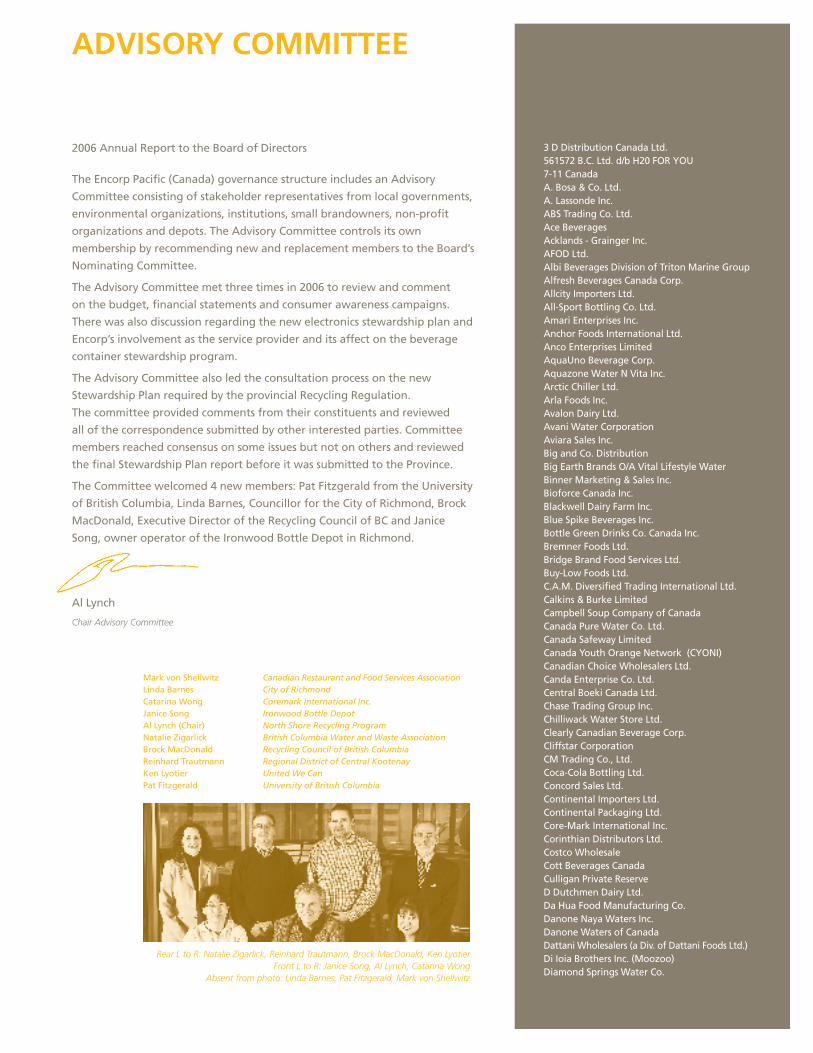
Al Lynch
Chair Advisory Committee
Rear L to R: Natalie Zigarlick, Reinhard Trautmann, Brock MacDonald, Ken LyotierFront L to R: Janice Song, Al Lynch, Catarina Wong
Absent from photo: Linda Barnes, Pat Fitzgerald, Mark von Shellwitz
advisorY coMMittee
3 D Distribution Canada Ltd.561572 B.C. Ltd. d/b H20 FOR yOu7-11 CanadaA. Bosa & Co. Ltd.A. Lassonde Inc.ABS Trading Co. Ltd. Ace BeveragesAcklands - Grainger Inc.AFOD Ltd. Albi Beverages Division of Triton Marine GroupAlfresh Beverages Canada Corp.Allcity Importers Ltd.All-Sport Bottling Co. Ltd.Amari Enterprises Inc.Anchor Foods International Ltd.Anco Enterprises LimitedAquauno Beverage Corp.Aquazone Water N Vita Inc.Arctic Chiller Ltd.Arla Foods Inc.Avalon Dairy Ltd.Avani Water CorporationAviara Sales Inc.Big and Co. DistributionBig Earth Brands O/A Vital Lifestyle WaterBinner Marketing & Sales Inc.Bioforce Canada Inc.Blackwell Dairy Farm Inc.Blue Spike Beverages Inc.Bottle Green Drinks Co. Canada Inc.Bremner Foods Ltd.Bridge Brand Food Services Ltd.Buy-Low Foods Ltd.C.A.M. Diversified Trading International Ltd.Calkins & Burke Limited Campbell Soup Company of CanadaCanada Pure Water Co. Ltd. Canada Safeway LimitedCanada youth Orange Network (CyONI)Canadian Choice Wholesalers Ltd.Canda Enterprise Co. Ltd.Central Boeki Canada Ltd.Chase Trading Group Inc. Chilliwack Water Store Ltd. Clearly Canadian Beverage Corp.Cliffstar Corporation CM Trading Co., Ltd.Coca-Cola Bottling Ltd.Concord Sales Ltd.Continental Importers Ltd.Continental Packaging Ltd.Core-Mark International Inc.Corinthian Distributors Ltd.Costco WholesaleCott Beverages CanadaCulligan Private ReserveD Dutchmen Dairy Ltd.Da Hua Food Manufacturing Co.Danone Naya Waters Inc.Danone Waters of CanadaDattani Wholesalers (a Div. of Dattani Foods Ltd.)Di Ioia Brothers Inc. (Moozoo)Diamond Springs Water Co.
Mark von Shellwitz Canadian Restaurant and Food Services AssociationLinda Barnes City of RichmondCatarina Wong Coremark International Inc.Janice Song Ironwood Bottle DepotAl Lynch (Chair) North Shore Recycling ProgramNatalie Zigarlick British Columbia Water and Waste AssociationBrock MacDonald Recycling Council of British ColumbiaReinhard Trautmann Regional District of Central KootenayKen Lyotier United We CanPat Fitzgerald University of British Columbia
Distribution Missum Inc.Diversified BrandsDole Foods of Canada Ltd.Double D Beverage Co.EAS Canada Edoko Food Importers Ltd.Elco Fine Foods Inc. Elko Developments Ltd.Eurobubblies Canada Inc.Falesca Importing Ltd.Far East North America Food Ltd.Far-Met Importers Ltd.Federated Cooperatives Ltd.Five Star Beverages Inc.Flexx Sports Equipment Ltd.Fluid Beverage CorporationFok’s Trading (Canada) Ltd.Fountain Drinks (Canada) Co. Ltd.Fresh Logistics Fukuda Trading Co. Ltd. FuZE Beverage, LLCG.I. Energy Drinks CorporationGagan Foods International Ltd.Garland International Holdings (Canada) Ltd.Garrod Food Brokers Ltd.Glacierwind Specialties Global H20 Resources Inc. Golden Boy Foods Inc.Golden Bright Enterprises Ltd.Great Western Brewing Company LimitedGreatwater Custom Label Inc.Guayaki Sustainable Rainforest Products Inc.H. J. Heinz Co. of Canada Ltd.H.y. Louie Co. Ltd.Hamilton Brands, Inc.c/o Future Brands uSA Inc.Hanif’s International Food LtdHappy Planet LLPHermann Pfanner Getranke Ges.m.b.H.Hi-Bridge Consulting CorporationHongdao Business Development Ltd.Horizon DistributorsHorsting’s Farm MarketHudson’s Bay Company Hung Gay Enterprises Ltd.Hydratech InnovationsI-D Foods Western Corp.Inform Brokerage Inc.Intersave West Buying & MerchandisingInvemere Hardware & Building Supplies Co. Ltd.Island BagelIsland Farms Dairies Co-op AssociationJ West Food Systems Ltd.J.W. Mason and Sons Ltd.Jace Holdings Ltd. (Thrifty)Jet Trading Co. Ltd.JFC International Inc.Jiva Organic Manufacturing & Distributors Inc.Jones Soda Co.Joriki Inc.Kan-Pak, LLCKeg Brands Inc.KO&C Enterprises Ltd.Konings Wholesale
Kraft Canada Inc.Lakeport Brewing CorporationLandmark Dairy Ltd.Laurance Milner HoldingsLe Kiu Importing Co., Ltd.Leading Brands of Canada, Inc.Left Coast Trading Company IncLekker Foods Distributors Ltd.Liquidation WorldLiusco Enterprises Co. Ltd.London Drugs LimitedM-13 Ventures Ltd. Malinda Distributors Inc.Mandisa, Inc.Martin-Brower of Canada Ltd.Matheson Creek Farm Ltd.McCain Foods (Canada)McKesson CanadaMiller Springs Ltd.Montage CorporationMotts Canada, Cadbury Beverage CanadaMountain Manna Water & Ice Co.Nanton Water & Soda Co.National Focus Distribution Logistics Inc.National Importers Ltd.Natural Glacial Waters Inc.Nature Land Products Ltd. Natures Perfection Nature’s Pop SalesNature’s Water Corp.Nestle Canada Inc.Nestle Waters CanadaNew World Imports Ltd. New World Natural Foods Ltd.Nishimoto Trading Co. Ltd.North American Tea & CoffeeNorthern Lights CollegeNorthleaf Foods Ltd.NTC Industrial Co. Inc.Nutrifresh Distributors Nutrition Zone Products Inc.Ocean Spray International Inc.OGEM Old Victoria Water Company Olympic Foods, Inc. Orque Tradevelop Corporation (Canada)Otis McAllister, Inc.Overwaitea Food Group/Save-On-FoodsPacific Bottleworks Company Ltd.Pacific Exotic Foods Inc.Park Tak International CorporationParmalat CanadaParmalat Dairy & Bakery Inc.Pepsi-QTG CanadaPolaris Water Company Inc.POM Wonderful LLC PRB Enterprise Inc.Principal Sales Inc.Profood International CorporationPSC Natural Foods, Ltd. Purely Juice, Inc. Purified Water Store CorporationQPro Canada Inc.
Que Pasa Mexican Foods Quixtar Canada CorporationReal WaterRenegade Private Stock Ltd.Revelstokes Own Water & Ice Co.Ripple Fx Water Inc. dba Promo H20RLB Enterprises (1991) Ltd.Rocky Mountain Chocolate FactoryRoy’s Ice N’ Bottled WaterSan Remo Importers Ltd.Santa Maria Foods Corp.Saputo Foods LimitedScott-Bathgate Ltd. Sea-Van Distributors Ltd.Shoppers Drug MartSiena Foods LimitedSkylar Haley LPSobeys Capital Inc.Sparkling Ice/Talking Rain BeverageStar Marketing Ltd.Stars Trading Co. Ltd. Stillcreek Distributing Ltd.Strait Water Inc.Sun Wah Foods Ltd.Sun-Rype Products Ltd.T&T Supermarket Inc.Taiwan Food Products Ltd. Tak Tai Trading Co. Ltd.Tazo Tea Company Tetley Canada Inc.TFB & Associates LimitedThe Apple Valley Juice Corp.The Healthy Beverage Company LLCThe Minute Maid Company Canada Inc.The North West Company Inc.The Pepsi Bottling GroupThe TDL Group Corp.Thomas Canning (Maidstone) LimitedTree of Life/Gourmet Award Food Canada - WestTree Top, Inc.Triple Jim’s Enterprises (1984Tun Hau Enterprises (Canada) Ltd.unisource Canada, Inc. uno Foods Inc.upper 49th Imports Inc.Van Isle Artesian SpringsVansky Trading Co. Ltd. Vitality Foodservice Canada Inc.Vivid Glas Water Sales & Distribution LimitedWah Loong Ltd.Wallace & Carey Ltd.Wal-Mart Canada Inc.Watermark Beverages Inc.West Coast Water Store Ltd.Westfair Foods Ltd.Wet Planet BeveragesWhitefish Marketing Ltd.Whole Foods MarketWild West Organic Harvest Co-oWorrenberg FarmsZ.A.S. International Inc.Zagu Foods CorporationZebroff’s Organic Farm
brandowners rePresented bY encorP
25
CHANGE IN ACCOuNTING
POLICy – CONTAINERS IN
TRANSIT
Containers In-Transit represents those
used Beverage Containers (uBCs) for
which the fee revenue (deposits and
Container Recycling Fees) have been
received but which have not been
returned for refund.
Since its inception in 1994, Encorp’s
accounting treatment of Containers
In Transit has been to recognize the
revenue from deposits and Container
Recycling fees and to accrue the
anticipated expenses for deposit
refunds, handling and processing
fees, and transportation, plus the
anticipated revenue from the sale of
the collected commodity.
In December 31, 2005 accrued expenses
were $11.6 million and accrued
commodity revenue was $2.0 million.
To better reflect the recent changes
in Canadian Generally Accepted
Accounting Principles (GAAP), Encorp
has changed its accounting policy
in the current year regarding the
timing of the recognition of revenue
and expenses relating to Containers
In Transit. Since there are activities
to be undertaken and obligations
to be fulfilled relating to Containers
In-Transit at December 31, 2006,
management has determined that a
more appropriate policy is to defer the
revenue and recognize the expenses
when they incur. This represents a
more conservative approach towards
recognizing both revenue and
expenses.
In summary, instead of recognizing the
revenue and accruing for the expenses,
the revenue will now be deferred
until the obligations are completely
fulfilled. The overall impact as a result
of the change in accounting policy is a
reduction in the operating reserves of
$1.7 million as of December 31, 2006.
The financial statements of Encorp Pacific (Canada) have been prepared by management in accordance with
generally accepted accounting principles in Canada. Any financial information contained elsewhere in this
report has been reviewed to ensure consistency with the financial statements.
Management is responsible for the integrity of the financial statements and has established systems of internal
control to provide reasonable assurance that assets are safeguarded, transactions are properly authorized and
financial statements are prepared in a timely manner.
Encorp Pacific (Canada) maintains a system of internal accounting and administrative controls. They are
designed to test the adequacy and consistency of internal controls, practices and procedures. KPMG LLP, the
independent auditors appointed by the Board of Directors, have audited the financial statements of Encorp
Pacific (Canada) in accordance with Canadian generally accepted auditing standards. The Auditors’ Report
outlines the scope of this independent audit and expresses an opinion on the financial statements of Encorp
Pacific (Canada).
Neil Hastie Bill Chan, CGA, MBA
President & Chief Executive Officer Vice President & Chief Financial Officer
May 2, 2007
27
ManageMent’s resPonsibilitY for financial rePorting
To the Members of Encorp Pacific (Canada)
We have audited the statement of financial position of Encorp Pacific (Canada) as at December 31, 2006 and the statements of
operations, changes in net assets and cash flows for the year then ended. These financial statements are the responsibility of
the Corporation’s management. Our responsibility is to express an opinion on these financial statements based on our audit.
We conducted our audit in accordance with Canadian generally accepted auditing standards. Those standards require that we
plan and perform an audit to obtain reasonable assurance whether the financial statements are free of material misstatement.
An audit includes examining, on a test basis, evidence supporting the amounts and disclosures in the financial statements.
An audit also includes assessing the accounting principles used and significant estimates made by management, as well as
evaluating the overall financial statement presentation.
In our opinion, these financial statements present fairly, in all material respects, the financial position of the Corporation as at
December 31, 2006 and the results of its operations and its cash flows for the year then ended in accordance with Canadian
generally accepted accounting principles.
Chartered Accountants
Burnaby, Canada
March 22, 2007
auditors’ rePort
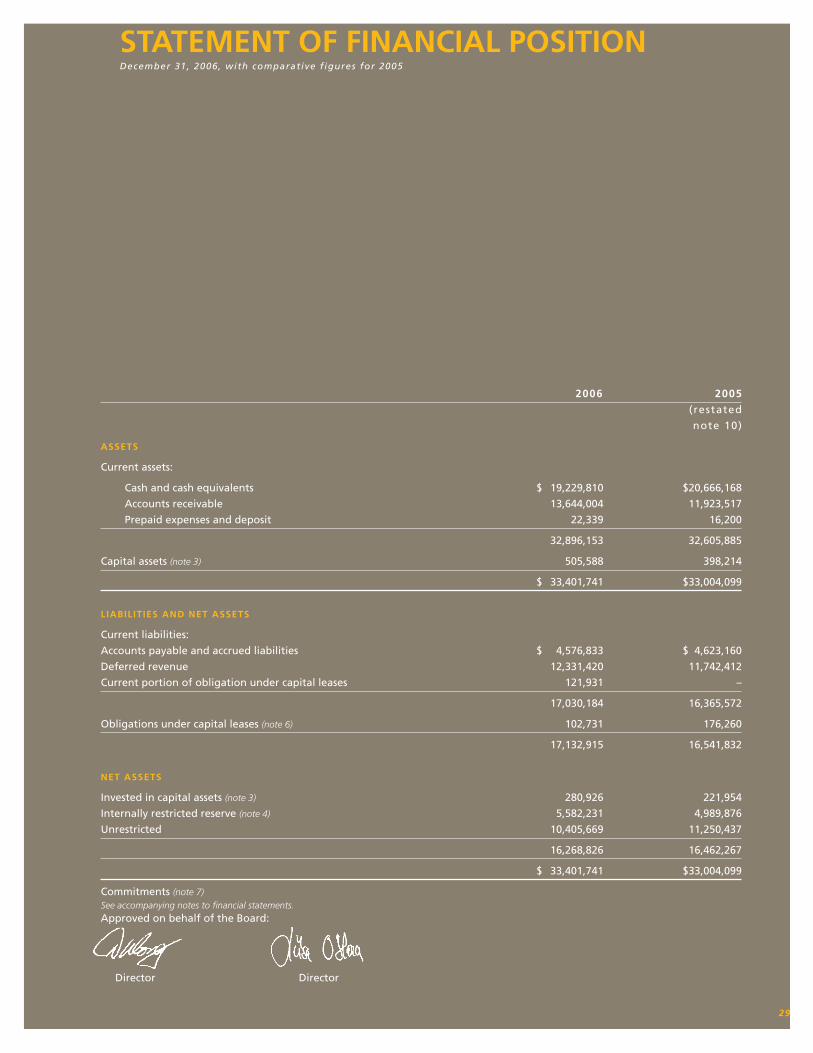
stateMent of financial Position December 31, 2006, with comparative f igures for 2005
2006 2005
(restated
note 10)
assets
Current assets:
Cash and cash equivalents $ 19,229,810 $ 20,666,168
Accounts receivable 13,644,004 11,923,517
Prepaid expenses and deposit 22,339 16,200
32,896,153 32,605,885
Capital assets (note 3) 505,588 398,214
$ 33,401,741 $ 33,004,099
liabilities and net assets
Current liabilities:
Accounts payable and accrued liabilities $ 4,576,833 $ 4,623,160
Deferred revenue 12,331,420 11,742,412
Current portion of obligation under capital leases 121,931 –
17,030,184 16,365,572
Obligations under capital leases (note 6) 102,731 176,260
17,132,915 16,541,832
net assets
Invested in capital assets (note 3) 280,926 221,954
Internally restricted reserve (note 4) 5,582,231 4,989,876
unrestricted 10,405,669 11,250,437
16,268,826 16,462,267
$ 33,401,741 $ 33,004,099
Commitments (note 7)See accompanying notes to financial statements.Approved on behalf of the Board:
Director Director
29
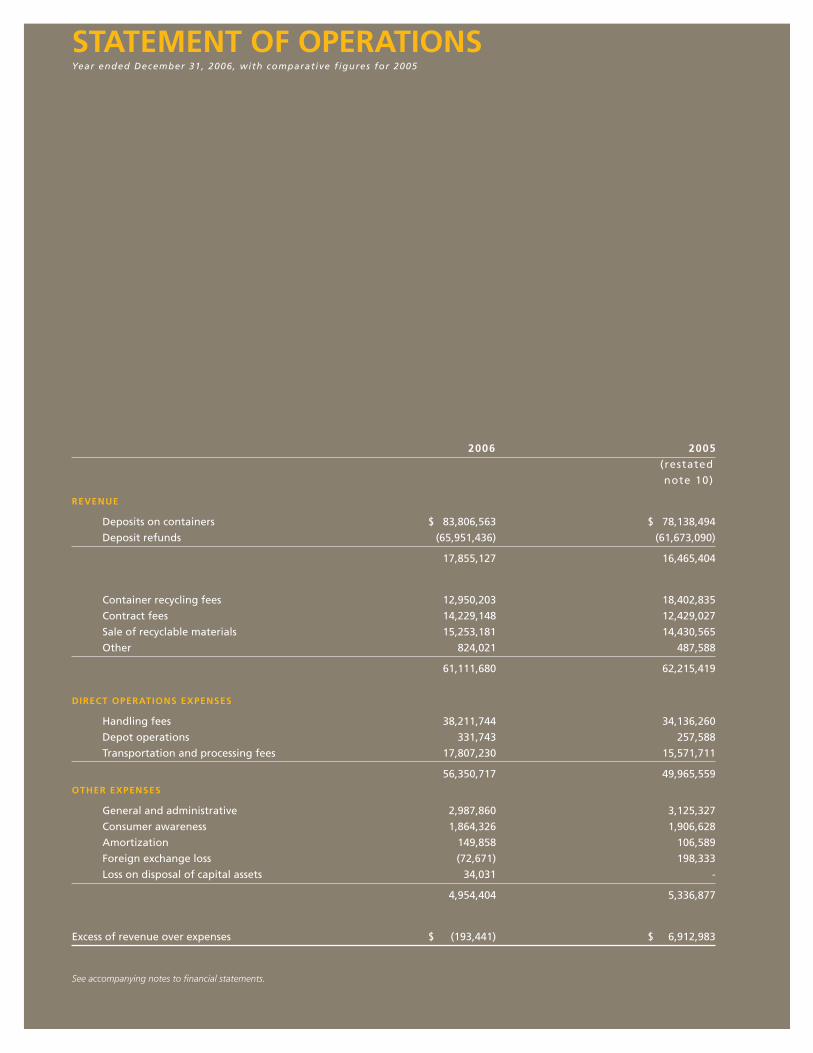
stateMent of oPerations Year ended December 31, 2006, with comparative f igures for 2005
2006 2005
(restated
note 10)
revenue
Deposits on containers $ 83,806,563 $ 78,138,494
Deposit refunds (65,951,436) (61,673,090)
17,855,127 16,465,404
Container recycling fees 12,950,203 18,402,835
Contract fees 14,229,148 12,429,027
Sale of recyclable materials 15,253,181 14,430,565
Other 824,021 487,588
61,111,680 62,215,419
direct oPerations exPenses
Handling fees 38,211,744 34,136,260
Depot operations 331,743 257,588
Transportation and processing fees 17,807,230 15,571,711
56,350,717 49,965,559
other exPenses
General and administrative 2,987,860 3,125,327
Consumer awareness 1,864,326 1,906,628
Amortization 149,858 106,589
Foreign exchange loss (72,671) 198,333
Loss on disposal of capital assets 34,031 -
4,954,404 5,336,877
Excess of revenue over expenses $ (193,441) $ 6,912,983
See accompanying notes to financial statements.
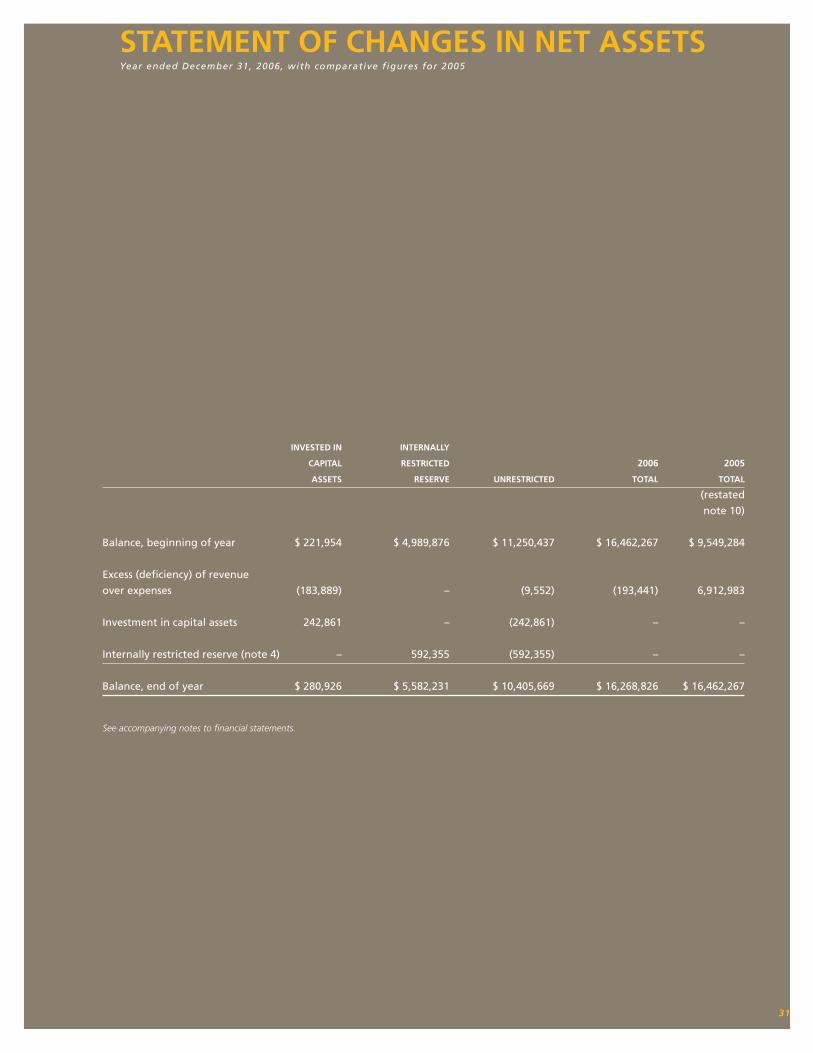
stateMent of oPerations Year ended December 31, 2006, with comparative f igures for 2005
invested in internallY
caPital restricted 2006 2005
assets reserve unrestricted total total
(restated
note 10)
Balance, beginning of year $ 221,954 $ 4,989,876 $ 11,250,437 $ 16,462,267 $ 9,549,284
Excess (deficiency) of revenue
over expenses (183,889) – (9,552) (193,441) 6,912,983
Investment in capital assets 242,861 – (242,861) – –
Internally restricted reserve (note 4) – 592,355 (592,355) – –
Balance, end of year $ 280,926 $ 5,582,231 $ 10,405,669 $ 16,268,826 $ 16,462,267
See accompanying notes to financial statements.
31
stateMent of changes in net assets Year ended December 31, 2006, with comparative f igures for 2005
2006 2005
(restated
note 10)
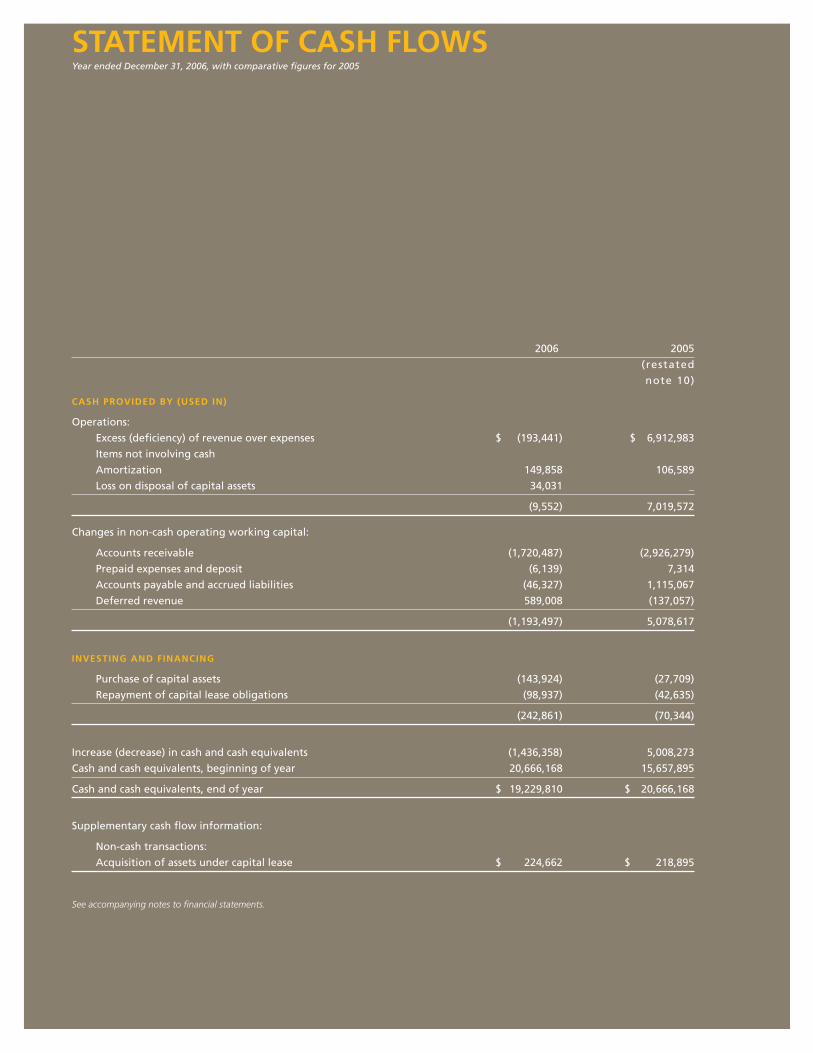
cash Provided bY (used in)
Operations:
Excess (deficiency) of revenue over expenses $ (193,441) $ 6,912,983
Items not involving cash
Amortization 149,858 106,589
Loss on disposal of capital assets 34,031 _
(9,552) 7,019,572
Changes in non-cash operating working capital:
Accounts receivable (1,720,487) (2,926,279)
Prepaid expenses and deposit (6,139) 7,314
Accounts payable and accrued liabilities (46,327) 1,115,067
Deferred revenue 589,008 (137,057)
(1,193,497) 5,078,617
investing and financing
Purchase of capital assets (143,924) (27,709)
Repayment of capital lease obligations (98,937) (42,635)
(242,861) (70,344)
Increase (decrease) in cash and cash equivalents (1,436,358) 5,008,273
Cash and cash equivalents, beginning of year 20,666,168 15,657,895
Cash and cash equivalents, end of year $ 19,229,810 $ 20,666,168
Supplementary cash flow information:
Non-cash transactions:
Acquisition of assets under capital lease $ 224,662 $ 218,895
See accompanying notes to financial statements.
stateMent of cash flows Year ended December 31, 2006, with comparative figures for 2005
stateMent of cash flows Year ended December 31, 2006, with comparative figures for 2005
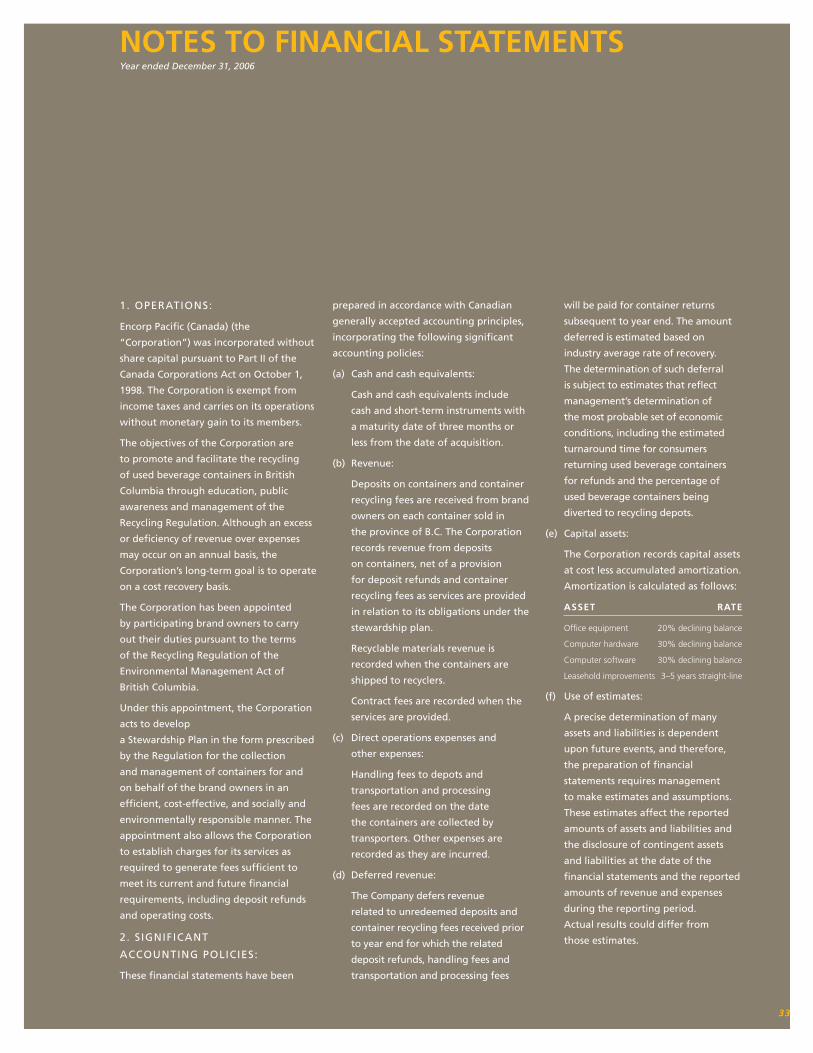
1. OPERATIONS:
Encorp Pacific (Canada) (the
“Corporation”) was incorporated without
share capital pursuant to Part II of the
Canada Corporations Act on October 1,
1998. The Corporation is exempt from
income taxes and carries on its operations
without monetary gain to its members.
The objectives of the Corporation are
to promote and facilitate the recycling
of used beverage containers in British
Columbia through education, public
awareness and management of the
Recycling Regulation. Although an excess
or deficiency of revenue over expenses
may occur on an annual basis, the
Corporation’s long-term goal is to operate
on a cost recovery basis.
The Corporation has been appointed
by participating brand owners to carry
out their duties pursuant to the terms
of the Recycling Regulation of the
Environmental Management Act of
British Columbia.
under this appointment, the Corporation
acts to develop
a Stewardship Plan in the form prescribed
by the Regulation for the collection
and management of containers for and
on behalf of the brand owners in an
efficient, cost-effective, and socially and
environmentally responsible manner. The
appointment also allows the Corporation
to establish charges for its services as
required to generate fees sufficient to
meet its current and future financial
requirements, including deposit refunds
and operating costs.
2. SIGNIFICANT
ACCOuNTING POLICIES:
These financial statements have been
prepared in accordance with Canadian
generally accepted accounting principles,
incorporating the following significant
accounting policies:
(a) Cash and cash equivalents:
Cash and cash equivalents include
cash and short-term instruments with
a maturity date of three months or
less from the date of acquisition.
(b) Revenue:
Deposits on containers and container
recycling fees are received from brand
owners on each container sold in
the province of B.C. The Corporation
records revenue from deposits
on containers, net of a provision
for deposit refunds and container
recycling fees as services are provided
in relation to its obligations under the
stewardship plan.
Recyclable materials revenue is
recorded when the containers are
shipped to recyclers.
Contract fees are recorded when the
services are provided.
(c) Direct operations expenses and
other expenses:
Handling fees to depots and
transportation and processing
fees are recorded on the date
the containers are collected by
transporters. Other expenses are
recorded as they are incurred.
(d) Deferred revenue:
The Company defers revenue
related to unredeemed deposits and
container recycling fees received prior
to year end for which the related
deposit refunds, handling fees and
transportation and processing fees
will be paid for container returns
subsequent to year end. The amount
deferred is estimated based on
industry average rate of recovery.
The determination of such deferral
is subject to estimates that reflect
management’s determination of
the most probable set of economic
conditions, including the estimated
turnaround time for consumers
returning used beverage containers
for refunds and the percentage of
used beverage containers being
diverted to recycling depots.
(e) Capital assets:
The Corporation records capital assets
at cost less accumulated amortization.
Amortization is calculated as follows:
asset rate
Office equipment 20% declining balance
Computer hardware 30% declining balance
Computer software 30% declining balance
Leasehold improvements 3–5 years straight-line
(f) use of estimates:
A precise determination of many
assets and liabilities is dependent
upon future events, and therefore,
the preparation of financial
statements requires management
to make estimates and assumptions.
These estimates affect the reported
amounts of assets and liabilities and
the disclosure of contingent assets
and liabilities at the date of the
financial statements and the reported
amounts of revenue and expenses
during the reporting period.
Actual results could differ from
those estimates.
33
notes to financial stateMents Year ended December 31, 2006
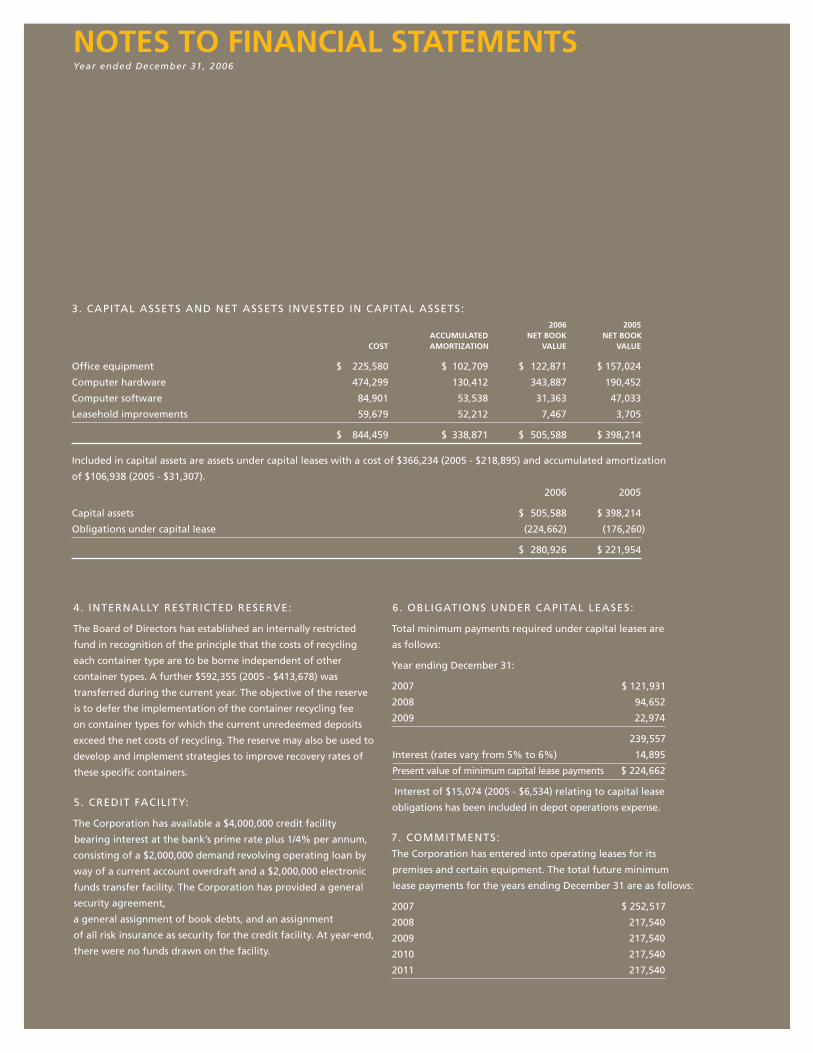
4. INTERNALLy RESTRICTED RESERVE:
The Board of Directors has established an internally restricted
fund in recognition of the principle that the costs of recycling
each container type are to be borne independent of other
container types. A further $592,355 (2005 - $413,678) was
transferred during the current year. The objective of the reserve
is to defer the implementation of the container recycling fee
on container types for which the current unredeemed deposits
exceed the net costs of recycling. The reserve may also be used to
develop and implement strategies to improve recovery rates of
these specific containers.
5. CREDIT FACILITy:
The Corporation has available a $4,000,000 credit facility
bearing interest at the bank’s prime rate plus 1/4% per annum,
consisting of a $2,000,000 demand revolving operating loan by
way of a current account overdraft and a $2,000,000 electronic
funds transfer facility. The Corporation has provided a general
security agreement,
a general assignment of book debts, and an assignment
of all risk insurance as security for the credit facility. At year-end,
there were no funds drawn on the facility.
6. OBLIGATIONS uNDER CAPITAL LEASES:
Total minimum payments required under capital leases are
as follows:
year ending December 31:
2007 $ 121,931
2008 94,652
2009 22,974
239,557
Interest (rates vary from 5% to 6%) 14,895
Present value of minimum capital lease payments $ 224,662
Interest of $15,074 (2005 - $6,534) relating to capital lease
obligations has been included in depot operations expense.
7. COMMITMENTS:
The Corporation has entered into operating leases for its
premises and certain equipment. The total future minimum
lease payments for the years ending December 31 are as follows:
2007 $ 252,517
2008 217,540
2009 217,540
2010 217,540
2011 217,540
3. CAPITAL ASSETS AND NET ASSETS INVESTED IN CAPITAL ASSETS: 2006 2005 accuMulated net book net book cost aMortization value value
Office equipment $ 225,580 $ 102,709 $ 122,871 $ 157,024
Computer hardware 474,299 130,412 343,887 190,452
Computer software 84,901 53,538 31,363 47,033
Leasehold improvements 59,679 52,212 7,467 3,705
$ 844,459 $ 338,871 $ 505,588 $ 398,214
Included in capital assets are assets under capital leases with a cost of $366,234 (2005 - $218,895) and accumulated amortization
of $106,938 (2005 - $31,307).
2006 2005
Capital assets $ 505,588 $ 398,214
Obligations under capital lease (224,662) (176,260)
$ 280,926 $ 221,954
notes to financial stateMents Year ended December 31, 2006

8. FAIR VALuE OF FINANCIAL INSTRuMENTS:
The carrying values of cash and cash equivalents, accounts
receivable and accounts payable and accrued liabilities
approximate their fair value due to the relatively short period
to maturity of the instruments. Obligations under capital leases
are of long-term nature and, as such, are impacted by changes in
market yields which can result in differences between carrying
value and market value. Management estimates that these
differences are not material to the financial statements..
9. RELATED PARTIES:
The Corporation owns 100% of Encorp Pacific Inc. (EPI), an
incorporated company. EPI is inactive and its statement of
financial position is as follows:
Cash $ 2
Shareholder’s equity $ 2
During the year, the Corporation paid $104,025 (2005 - $110,939)
in Board expenses, which includes fees for some directors as well as
reimbursable and meeting room expenses.
10. CHANGE IN ACCOuNTING POLICy:
The Company has changed its policy over the timing of
recognition of revenue and expenses relating to containers
in transit at the end of the year, and the sale of recyclable
material related to these containers. Previously, the Company
recognized the deposits and container recycling fees collected
by brand owners, as well as an estimate of the sales value of
the recyclable materials related to these containers in transit,
as revenue upon sale of the containers by the brand owners.
The Company also accrued as a liability the estimated deposit
refunds, handling fees, transportation costs and other related
expenses for containers sold by the brand owners prior to the
end of the year but not yet returned for refund.
In the current year, the Company has changed this policy to
record deposit refunds and handling fees expenses related
to containers in transit when the containers are returned
by consumers to depots or retailers, and to record other
related costs as they are incurred. The estimated revenue for
unredeemed deposits and container recycling fees collected
related to these containers is now recognized when the related
activities are undertaken and obligations fulfilled. Deposits and
container recycling fees collected as of the year-end relating
to containers in transit are now recorded as deferred revenue.
In addition, revenue from sales of recyclable material is now
recorded upon sale and delivery of the materials to
the purchaser.
These changes in policy have been applied retrospectively.
As a result, the opening net assets for the years ended
December 31, 2006 and 2005 have been adjusted as follows:
notes to financial stateMents Year ended December 31, 2006
notes to financial stateMents Year ended December 31, 2006
2006 2005
Net assets beginning of year, as previously reported $ 19,046,735 $ 12,573,110
Adjustment for change in accounting policy (2,584,468) (3,023,826)
Net assets beginning of year, as adjusted $ 16,462,267 $ 9,549,284
As a result of the change in timing of recognition of revenue
and expenses, the excess of revenue over expenses for the
year ended December 31, 2005 has increased by $439,358 over
the amount previously reported. The excess of revenue over
expenses for the year ended December 31, 2006 is $857,792
more than that which would have been reported under the
policy previously in place.
35