Embed Size (px)
Citation preview

End station for nanoscale magnetic materials study: Combination ofscanning tunneling microscopy and soft X-ray magnetic circular dichroismspectroscopyTetsuro Ueno, Masahiro Sawada, Yusuke Kishimizu, Akio Kimura, Hirofumi Namatame et al. Citation: Rev. Sci. Instrum. 83, 123903 (2012); doi: 10.1063/1.4770126 View online: http://dx.doi.org/10.1063/1.4770126 View Table of Contents: http://rsi.aip.org/resource/1/RSINAK/v83/i12 Published by the American Institute of Physics. Related ArticlesIntermetallic compound formation at Cu-Al wire bond interface J. Appl. Phys. 112, 123501 (2012) Length-dependent mechanical properties of gold nanowires J. Appl. Phys. 112, 114314 (2012) Chemical and structural investigations of the incorporation of metal manganese into ruthenium thin films for useas copper diffusion barrier layers Appl. Phys. Lett. 101, 231603 (2012) Single-step holographic fabrication of large-area periodically corrugated metal films J. Appl. Phys. 112, 113101 (2012) Role of Si in high Bs and low core-loss Fe85.2B10−XP4Cu0.8SiX nano-crystalline alloys J. Appl. Phys. 112, 103902 (2012) Additional information on Rev. Sci. Instrum.Journal Homepage: http://rsi.aip.org Journal Information: http://rsi.aip.org/about/about_the_journal Top downloads: http://rsi.aip.org/features/most_downloaded Information for Authors: http://rsi.aip.org/authors
Downloaded 19 Dec 2012 to 133.41.92.72. Redistribution subject to AIP license or copyright; see http://rsi.aip.org/about/rights_and_permissions
REVIEW OF SCIENTIFIC INSTRUMENTS 83, 123903 (2012)
End station for nanoscale magnetic materials study: Combinationof scanning tunneling microscopy and soft X-ray magnetic circulardichroism spectroscopy
Tetsuro Ueno,1 Masahiro Sawada,1,a) Yusuke Kishimizu,2 Akio Kimura,2
Hirofumi Namatame,1 and Masaki Taniguchi1,2
1Hiroshima Synchrotron Radiation Center, Hiroshima University, 2-313 Kagamiyama,Higashi-Hiroshima 739-0046, Japan2Graduate School of Science, Hiroshima University, 1-3-1 Kagamiyama, Higashi-Hiroshima 739-8526, Japan
(Received 1 October 2012; accepted 21 November 2012; published online 19 December 2012)
We have constructed an end station for nanoscale magnetic materials study at the soft X-ray beamlineHiSOR BL-14 at Hiroshima Synchrotron Radiation Center. An ultrahigh-vacuum scanning tunnel-ing microscope (STM) was installed for an in situ characterization of nanoscale magnetic materialsin combination with soft X-ray magnetic circular dichroism (XMCD) spectroscopy experiment. TheSTM was connected to the XMCD experimental station via damper bellows to isolate it from environ-mental vibrations, thus achieving efficient spatial resolution for observing Si(111) surface at atomicresolution. We performed an in situ experiment with STM and XMCD spectroscopy on Co nan-oclusters on an Au(111) surface and explored its practical application to investigate magnetic prop-erties for well-characterized nanoscale magnetic materials. © 2012 American Institute of Physics.[http://dx.doi.org/10.1063/1.4770126]
I. INTRODUCTION
Nanotechnology, based on material surfaces andnanoscale materials, has become increasingly importantto the sustainable development of today’s human society.Characteristic physical and chemical properties are usedfor industrial applications such as semiconductor devices,catalysts, fuel cells, sensors, optical materials, magneticmaterials, and so on. In particular, magnetic properties ofnanoscale magnetic materials such as perpendicular magneticanisotropy1 and giant magnetoresistance2, 3 are currentlyused for high-density magnetic storage devices and willbe extended to spintronics. These useful and remarkableproperties come from characteristic electronic and atomicstructures of nanoscale magnetic materials such as films,nanowires, nanodots, and surface magnetic molecules. Forexample, cobalt (Co) nanodots, each of which only consistsof several Co atoms, on a platinum (Pt) surface exhibit anextraordinary giant orbital magnetic moment and magneticanisotropy energy (MAE).4 Reduced number of coordina-tions of magnetic atoms at the surface result in unquenchedorbital magnetic moments and giant MAEs. It is believedthat the atomic structures of nanoscale magnetic materialsstrongly correlate with the magnetic properties. Therefore, itis essential to determine the atomic structures and magneticproperties of a sample at the same time, if possible.
Atomic structures of surface nanoscale materials are di-rectly observed by means of a scanning probe microscope(SPM) equipped with an atomic-scale apex probe. By scan-ning a probe on the surface and detecting electric charge,atomic force or other forces as a function of two-dimensional
a)Author to whom correspondence should be addressed. Electronic mail:[email protected].
positions, an SPM is able to visualize surface structures on theatomic scale. The scanning tunneling microscope (STM)5 is aprototype variation of the SPM that measures tunneling cur-rent between the surface and a probe. So far, STMs have beenused to investigate the morphology and atomic structures ofvarious nanoscale magnetic materials.6–10 In addition, spin-polarized STM11 has found novel magnetic orders such as thesurface skyrmion.12
However, an experimental method that directly observeselectronic structure is needed to characterize the physicalor chemical properties of nanoscale materials microscopi-cally. X-ray absorption spectroscopy (XAS) is a spectro-scopic method with synchrotron radiation that probes un-occupied electronic states of materials. Magnetic signalscan also be detected by XAS with X-ray magnetic circulardichroism (XMCD) by using circularly-polarized photons.13
Quantitative values of spin and orbital magnetic momentsare determined separately from the XMCD spectrum usingthe magneto-optical sum rules.14, 15 It is highly suitable fornanoscale materials because of its element specificity. Thismethod has so far been applied to various surface nanoscalemagnetic materials such as nanoclusters,16 nanowires,17, 18
nanodots,4 isolated atoms,19 and magnetic molecules.20
Thus, combining STM and XMCD spectroscopy is aneffective way to reveal the microscopic origins of the mag-netic properties of well-characterized nanoscale magnetic ma-terials. However, up to now, STM and XMCD spectroscopyare generally individual experimental techniques used in sep-arate apparatuses, except for very few examples such assynchrotron-radiation-excited STM.21–23, 25 Scanning tunnel-ing microscopy is very vibration-sensitive because it requiresa probe-sample distance on the nanometer order and high pre-cision of the lateral position of a probe. A synchrotron facil-ity is full of environmental vibrations from the mechanical
0034-6748/2012/83(12)/123903/6/$30.00 © 2012 American Institute of Physics83, 123903-1
Downloaded 19 Dec 2012 to 133.41.92.72. Redistribution subject to AIP license or copyright; see http://rsi.aip.org/about/rights_and_permissions
123903-2 Ueno et al. Rev. Sci. Instrum. 83, 123903 (2012)
pumps, refrigerators, or motion of users working at the beam-line. Thus, STM and synchrotron facilities are incompati-ble, and very few synchrotron facilities have beamlines withSTM.20, 22–25 To perform an in situ STM or XMCD exper-iment, all vacuum-chambers are interconnected with eachother, and samples can be transferred from one to the otherwithout breaking an ultrahigh-vacuum (UHV) condition. TheSTM system and a beamline must be connected rigidly to sat-isfy this requirement. However, the rigid connection impairsthe performance of the vibration-isolation table of STM andmakes it difficult to attain sufficient spatial resolution. There-fore, two conflicting conditions (rigid UHV connection andvibration isolation) must be overcome to combine STM andXMCD spectroscopy.
We have been constructing the end station for research-ing nanoscale magnetic materials at the soft X-ray beamlineHiSOR BL-14 at Hiroshima Synchrotron Radiation Center(HSRC).26 In this paper, we report the beamline connectionof a ready-made UHV-STM system at HiSOR BL-14 anddemonstrate its potential to study nanoscale magnetic materi-als in combination with soft X-ray spectroscopy experiment.It will be shown that damper bellows (bellows with supportrods and rubber dampers) sufficiently isolate the STM sys-tem from environmental vibrations for practical use. As a re-sult, we have successfully realized the suppressed vibrationcircumstance for general purpose via the newly installed in-termediate chamber.
II. EXPERIMENTAL SYSTEM
HiSOR BL-14 at HSRC equips an inverse-dragon typemonochromator at the bending-magnet source of the elec-tron storage ring. It is designed for experiments using polar-ized soft X-rays such as XMCD or X-ray linear dichroismspectroscopy.27 The photon energy range of this beamline (hν
= 100–1200 eV) is suitable for XAS experiments at the Kedge of light elements, L edges of 3d transition metals, and Medges of 4d transition metals. Lateral and vertical beam sizeat the sample position are 3 mm and 0.5 mm, respectively.Photon flux is approximately 1010 photons/s in the photon en-ergy range from 700 to 800 eV. Figure 1 shows the schematicof the end stations of HiSOR BL-14. An XMCD measure-ment apparatus is installed at the first focal point in the beam-line, which is composed of a UHV chamber with a permanentmagnet array (B = 1.3 T), an electromagnet (B = 0.3 T maxi-mum) for XMCD experiments and a sample manipulator witha liquid N2 cryostat. A sample preparation chamber is con-nected to the XMCD chamber in UHV. The sample prepara-tion chamber is equipped with instruments for thin-film fab-rication and characterization. Details of this system are givenin the literature.26
We have newly constructed an intermediate chamber forinterconnecting the existing XMCD experimental system anda stand-alone UHV-STM system. The intermediate chamberguarantees vibration-isolation docking of the STM systemand a sample transfer path to the XMCD chamber under UHV.Details of the intermediate chamber will be given in Sec. III.
The UHV-STM system (UHV 300, RHK Technology)has an independent sample preparation chamber that is di-
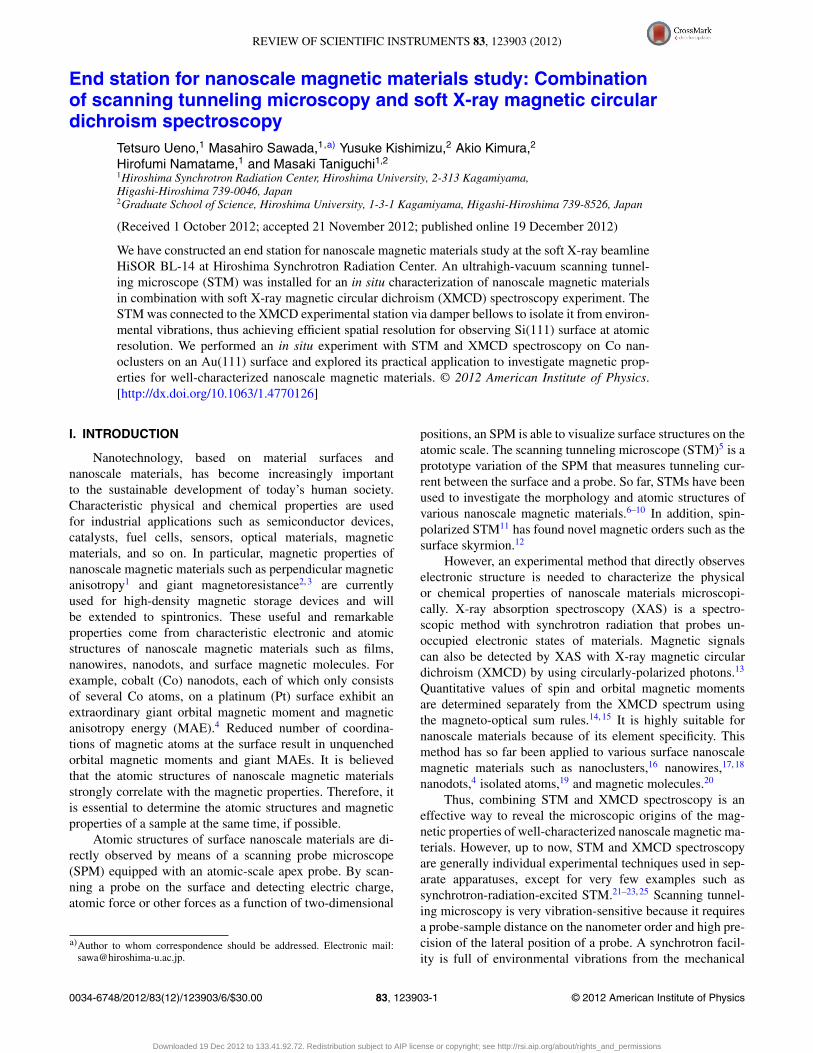
Top view
SR
1000 mm
Damperbellows
Sample stage
XMCDchamber
XMCD-sample-preparationchamber
STMchamber
STM-sample-preparationchamber
Intermediatechamber
Sample transfer path
FIG. 1. Schematic of the end station of HiSOR BL-14. The red dashed linerepresents the sample transfer path from the STM-sample-preparation cham-ber to the XMCD chamber. The purple wavy arrowed line represents the pho-ton incident direction to the XMCD chamber.
rectly connected to the STM chamber. The STM-sample-preparation chamber is equipped with sample fabrication andcharacterization instruments. We used this chamber to pre-pare the sample for the in situ STM and XMCD experimentdescribed in Sec. IV. A clean surface of an Au(111) singlecrystalline substrate was prepared with repeated cycles of Ar+
bombardment and annealing to 970 K. Negligible contamina-tion was found in Auger electron spectra. Co was depositedonto the substrate at room temperature by using an electronbeam evaporator.
III. CONNECTION OF STM APPARATUS AT BEAMLINE
A. Isolation of STM from environmental vibrations
Because the STM is extremely vibration-sensitive, it isnecessary to isolate the STM system from the vibrations gen-erated from various sources in the synchrotron facility. TheSTM chamber is mounted on a heavy stone table to remove vi-bration via air suspension. An eddy current damper is also in-stalled inside the STM chamber to isolate finely the vibrationpropagated to the measurement stage. The characteristic fre-quencies of the heavy stone table and the eddy current damperare about 10 Hz and 1.5 Hz, respectively. Thus, the STM sys-tem works well in a stand-alone operation with the duplexconfiguration of the vibration-isolation system, which cutsoff higher-frequency vibration components from the buildingfloor.
The intermediate chamber is rigidly interconnected withthe XMCD-sample-preparation chamber in UHV. To avoidgenerating mechanical vibrations, the intermediate chamberis only equipped with an ion pump (PST-100CX, ULVAC) tokeep UHV. A scroll pump and a turbo molecular pump areused only in rough pumping during bakeout and disconnectedafter running the ion pump. As mentioned above, it is neces-sary to connect all the chambers rigidly under UHV. How-ever, the rigid connection makes the intermediate chamberthe propagating path of vibrations from the XMCD experi-mental system. These contradicting situations seem to be set-tled by using simple bellows, because the bellows can prevent
Downloaded 19 Dec 2012 to 133.41.92.72. Redistribution subject to AIP license or copyright; see http://rsi.aip.org/about/rights_and_permissions
123903-3 Ueno et al. Rev. Sci. Instrum. 83, 123903 (2012)
Rubber damper
Support rod
FIG. 2. Damper bellows connected between the STM chamber and the inter-mediate chamber.
vibrations propagating to the STM system. However, contrac-tile forces shorten the length of bellows under UHV. As a con-sequence, the heavy stone table with air suspension is fixedbecause of the lateral shift via shorten bellows and the func-tionality of the vibration isolation is compromised.
Thus, bellows with support rods are necessary to avoidcontraction of bellows, though the support rods become thepropagating path of vibrations. Therefore, we introduceddamper bellows to a docking port of the intermediate cham-ber as shown in Fig. 2. Four support rods connected with rub-ber dampers prevent the bellows from contracting under UHV.Four rubber dampers damp down and cut off vibrations prop-agating through the intermediate chamber. The lateral posi-tion of the STM system is adjusted to the balanced positionunder UHV so as not to lock the air suspension table. Thus,
we achieve a vibration-isolation rigid connection of the STMsystem under UHV. The docking port is also equipped withan XY stage for fine adjustment of the docking positions. TheSTM chamber is connected to the docking port. However, thisport is not only for the current STM system, but also works asa utility port for other stand-alone experimental apparatusesthat require a vibration-isolation environment.
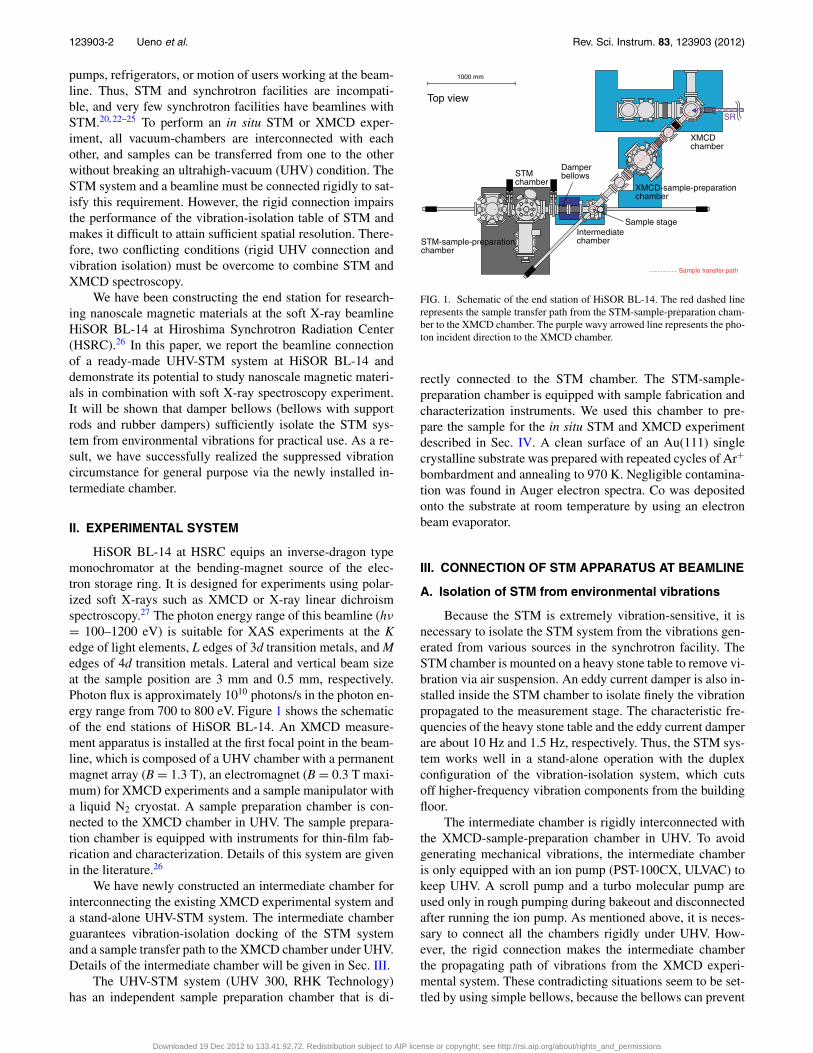
To confirm the vibration-isolation connection of the STMsystem, we measured the STM topography of the Si(111)surface with a tungsten tip as a standard sample for theUHV-STM system before and after the beamline connection.Figures 3(a) and 3(b) show STM topographic images ofSi(111) before (offline) and after (online) connection of theSTM chamber to the intermediate chamber. Both imagesclearly show the 7×7 reconstructed surface of Si(111) atatomic resolution. Height profiles along the white lines inFigs. 3(a) and 3(b) are shown in Figs. 3(c) and 3(d), respec-tively. These profiles are qualitatively identical before and af-ter the beamline connection except for the contrast, which isbetter in the offline experiment. The decrease in contrast is at-tributable to inevitable vibrations by the beamline connection.Two STM images were taken with use of tungsten tips withthe similar radius of curvature prepared by same etching treat-ment. However, the difference in contrast may be attributableto the minor change in tip conditions such as adsorbate onthe tip. The width of each peak in the height profiles is about2.8 Å and 3.5 Å for the offline and online experiments, respec-tively. Thus, the lateral spatial resolution becomes worse withthe beamline connection. Vertical spatial resolution after the
14121086420
x (nm)
0.20
0.16
0.12
0.08
y (n
m)
14121086420
x (nm)
(a) (b)
(c) Offline (d) Online
FIG. 3. STM topographic images of Si(111)7 × 7 surface (a) before and (b) after connection to the intermediate chamber. The tip bias was set to 2.0 V, and thetunneling current was set to 0.15 nA. The lateral size is 20×20 nm2. Height profiles along the white lines in (a) and (b) are shown in (c) and (d), respectively.
Downloaded 19 Dec 2012 to 133.41.92.72. Redistribution subject to AIP license or copyright; see http://rsi.aip.org/about/rights_and_permissions
123903-4 Ueno et al. Rev. Sci. Instrum. 83, 123903 (2012)
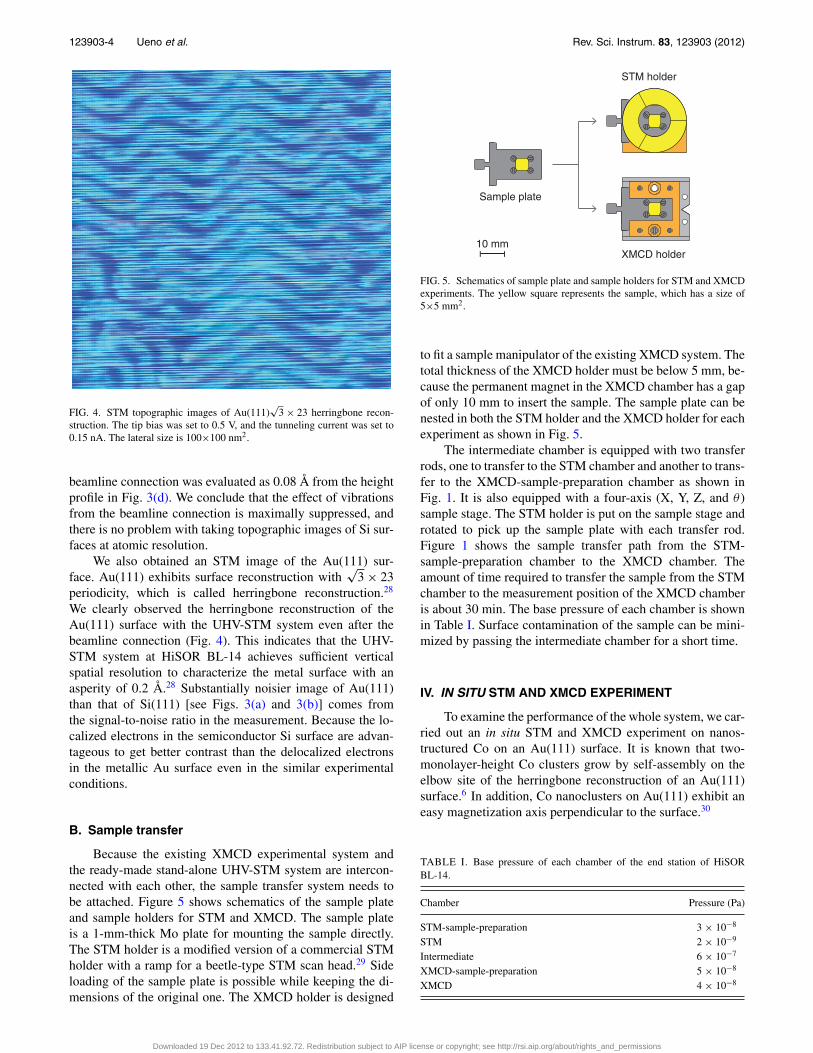
FIG. 4. STM topographic images of Au(111)√
3 × 23 herringbone recon-struction. The tip bias was set to 0.5 V, and the tunneling current was set to0.15 nA. The lateral size is 100×100 nm2.
beamline connection was evaluated as 0.08 Å from the heightprofile in Fig. 3(d). We conclude that the effect of vibrationsfrom the beamline connection is maximally suppressed, andthere is no problem with taking topographic images of Si sur-faces at atomic resolution.
We also obtained an STM image of the Au(111) sur-face. Au(111) exhibits surface reconstruction with
√3 × 23
periodicity, which is called herringbone reconstruction.28
We clearly observed the herringbone reconstruction of theAu(111) surface with the UHV-STM system even after thebeamline connection (Fig. 4). This indicates that the UHV-STM system at HiSOR BL-14 achieves sufficient verticalspatial resolution to characterize the metal surface with anasperity of 0.2 Å.28 Substantially noisier image of Au(111)than that of Si(111) [see Figs. 3(a) and 3(b)] comes fromthe signal-to-noise ratio in the measurement. Because the lo-calized electrons in the semiconductor Si surface are advan-tageous to get better contrast than the delocalized electronsin the metallic Au surface even in the similar experimentalconditions.
B. Sample transfer
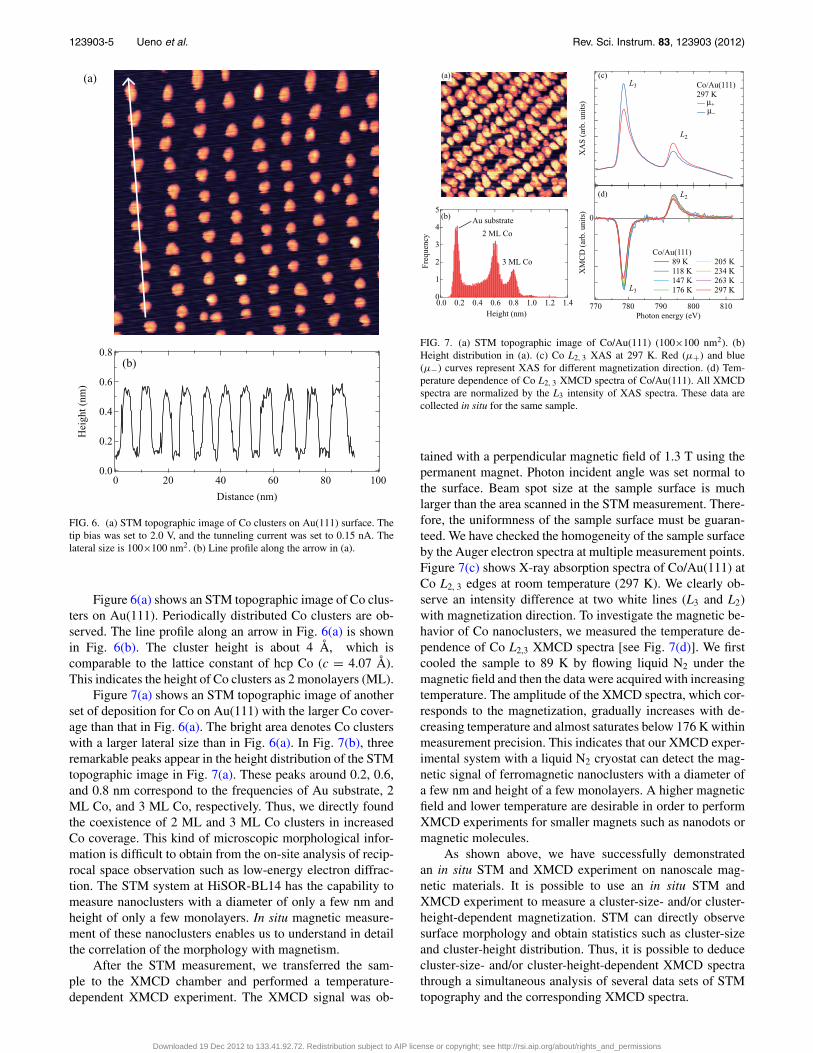
Because the existing XMCD experimental system andthe ready-made stand-alone UHV-STM system are intercon-nected with each other, the sample transfer system needs tobe attached. Figure 5 shows schematics of the sample plateand sample holders for STM and XMCD. The sample plateis a 1-mm-thick Mo plate for mounting the sample directly.The STM holder is a modified version of a commercial STMholder with a ramp for a beetle-type STM scan head.29 Sideloading of the sample plate is possible while keeping the di-mensions of the original one. The XMCD holder is designed
Sample plate
STM holder
XMCD holder10 mm
FIG. 5. Schematics of sample plate and sample holders for STM and XMCDexperiments. The yellow square represents the sample, which has a size of5×5 mm2.
to fit a sample manipulator of the existing XMCD system. Thetotal thickness of the XMCD holder must be below 5 mm, be-cause the permanent magnet in the XMCD chamber has a gapof only 10 mm to insert the sample. The sample plate can benested in both the STM holder and the XMCD holder for eachexperiment as shown in Fig. 5.
The intermediate chamber is equipped with two transferrods, one to transfer to the STM chamber and another to trans-fer to the XMCD-sample-preparation chamber as shown inFig. 1. It is also equipped with a four-axis (X, Y, Z, and θ )sample stage. The STM holder is put on the sample stage androtated to pick up the sample plate with each transfer rod.Figure 1 shows the sample transfer path from the STM-sample-preparation chamber to the XMCD chamber. Theamount of time required to transfer the sample from the STMchamber to the measurement position of the XMCD chamberis about 30 min. The base pressure of each chamber is shownin Table I. Surface contamination of the sample can be mini-mized by passing the intermediate chamber for a short time.
IV. IN SITU STM AND XMCD EXPERIMENT
To examine the performance of the whole system, we car-ried out an in situ STM and XMCD experiment on nanos-tructured Co on an Au(111) surface. It is known that two-monolayer-height Co clusters grow by self-assembly on theelbow site of the herringbone reconstruction of an Au(111)surface.6 In addition, Co nanoclusters on Au(111) exhibit aneasy magnetization axis perpendicular to the surface.30
TABLE I. Base pressure of each chamber of the end station of HiSORBL-14.
Chamber Pressure (Pa)
STM-sample-preparation 3 × 10⁻⁸
STM 2 × 10⁻⁹
Intermediate 6 × 10⁻⁷
XMCD-sample-preparation 5 × 10⁻⁸
XMCD 4 × 10⁻⁸
Downloaded 19 Dec 2012 to 133.41.92.72. Redistribution subject to AIP license or copyright; see http://rsi.aip.org/about/rights_and_permissions
123903-5 Ueno et al. Rev. Sci. Instrum. 83, 123903 (2012)
0.8
0.6
0.4
0.2
0.0
)mn( thgie
H
100806040200
Distance (nm)
(b)
(a)
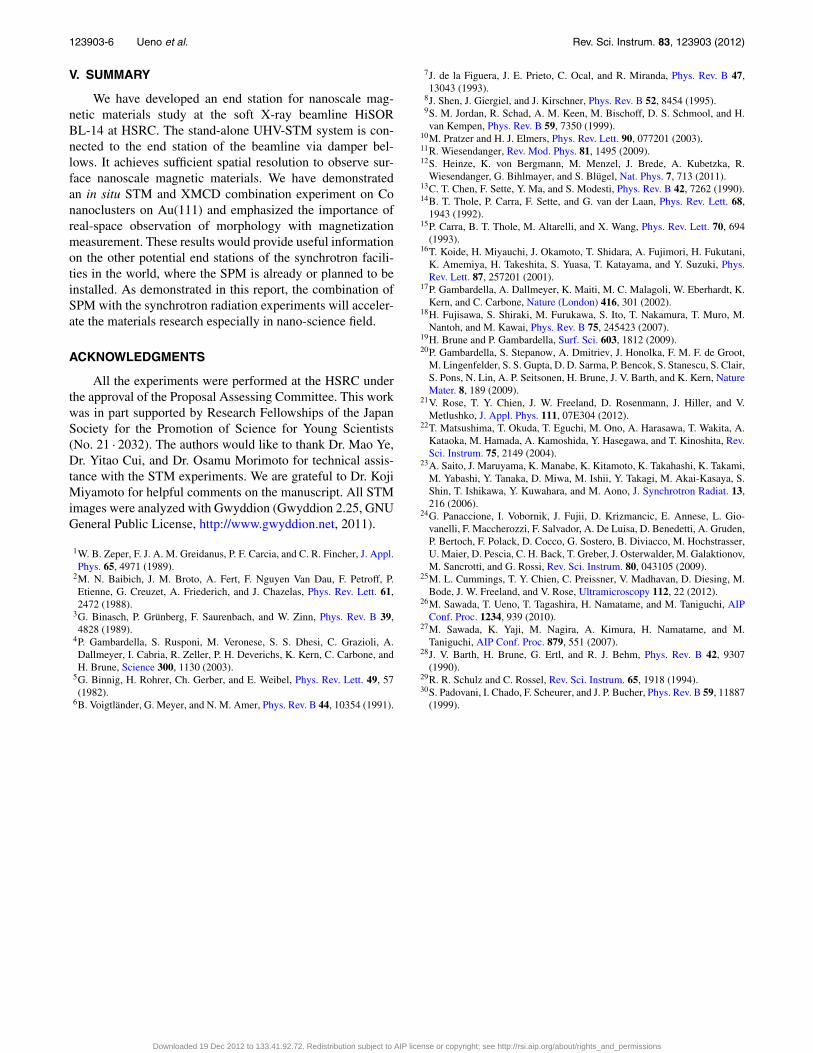
FIG. 6. (a) STM topographic image of Co clusters on Au(111) surface. Thetip bias was set to 2.0 V, and the tunneling current was set to 0.15 nA. Thelateral size is 100×100 nm2. (b) Line profile along the arrow in (a).
Figure 6(a) shows an STM topographic image of Co clus-ters on Au(111). Periodically distributed Co clusters are ob-served. The line profile along an arrow in Fig. 6(a) is shownin Fig. 6(b). The cluster height is about 4 Å, which iscomparable to the lattice constant of hcp Co (c = 4.07 Å).This indicates the height of Co clusters as 2 monolayers (ML).
Figure 7(a) shows an STM topographic image of anotherset of deposition for Co on Au(111) with the larger Co cover-age than that in Fig. 6(a). The bright area denotes Co clusterswith a larger lateral size than in Fig. 6(a). In Fig. 7(b), threeremarkable peaks appear in the height distribution of the STMtopographic image in Fig. 7(a). These peaks around 0.2, 0.6,and 0.8 nm correspond to the frequencies of Au substrate, 2ML Co, and 3 ML Co, respectively. Thus, we directly foundthe coexistence of 2 ML and 3 ML Co clusters in increasedCo coverage. This kind of microscopic morphological infor-mation is difficult to obtain from the on-site analysis of recip-rocal space observation such as low-energy electron diffrac-tion. The STM system at HiSOR-BL14 has the capability tomeasure nanoclusters with a diameter of only a few nm andheight of only a few monolayers. In situ magnetic measure-ment of these nanoclusters enables us to understand in detailthe correlation of the morphology with magnetism.
After the STM measurement, we transferred the sam-ple to the XMCD chamber and performed a temperature-dependent XMCD experiment. The XMCD signal was ob-
XA
S (
arb.
uni
ts)
Co/Au(111)297 K
µ+ µ
L2
L3
XM
CD
(ar
b. u
nits
)
810800790780770Photon energy (eV)
L2
L3
Co/Au(111) 89 K 118 K 147 K 176 K
205 K 234 K 263 K 297 K
0(b)
(c)
(d)
(a)
5
4
3
2
1
0
Fre
quen
cy
1.41.21.00.80.60.40.20.0Height (nm)
Au substrate
2 ML Co
3 ML Co
FIG. 7. (a) STM topographic image of Co/Au(111) (100×100 nm2). (b)Height distribution in (a). (c) Co L2, 3 XAS at 297 K. Red (μ+) and blue(μ−) curves represent XAS for different magnetization direction. (d) Tem-perature dependence of Co L2, 3 XMCD spectra of Co/Au(111). All XMCDspectra are normalized by the L3 intensity of XAS spectra. These data arecollected in situ for the same sample.
tained with a perpendicular magnetic field of 1.3 T using thepermanent magnet. Photon incident angle was set normal tothe surface. Beam spot size at the sample surface is muchlarger than the area scanned in the STM measurement. There-fore, the uniformness of the sample surface must be guaran-teed. We have checked the homogeneity of the sample surfaceby the Auger electron spectra at multiple measurement points.Figure 7(c) shows X-ray absorption spectra of Co/Au(111) atCo L2, 3 edges at room temperature (297 K). We clearly ob-serve an intensity difference at two white lines (L3 and L2)with magnetization direction. To investigate the magnetic be-havior of Co nanoclusters, we measured the temperature de-pendence of Co L2,3 XMCD spectra [see Fig. 7(d)]. We firstcooled the sample to 89 K by flowing liquid N2 under themagnetic field and then the data were acquired with increasingtemperature. The amplitude of the XMCD spectra, which cor-responds to the magnetization, gradually increases with de-creasing temperature and almost saturates below 176 K withinmeasurement precision. This indicates that our XMCD exper-imental system with a liquid N2 cryostat can detect the mag-netic signal of ferromagnetic nanoclusters with a diameter ofa few nm and height of a few monolayers. A higher magneticfield and lower temperature are desirable in order to performXMCD experiments for smaller magnets such as nanodots ormagnetic molecules.
As shown above, we have successfully demonstratedan in situ STM and XMCD experiment on nanoscale mag-netic materials. It is possible to use an in situ STM andXMCD experiment to measure a cluster-size- and/or cluster-height-dependent magnetization. STM can directly observesurface morphology and obtain statistics such as cluster-sizeand cluster-height distribution. Thus, it is possible to deducecluster-size- and/or cluster-height-dependent XMCD spectrathrough a simultaneous analysis of several data sets of STMtopography and the corresponding XMCD spectra.
Downloaded 19 Dec 2012 to 133.41.92.72. Redistribution subject to AIP license or copyright; see http://rsi.aip.org/about/rights_and_permissions
123903-6 Ueno et al. Rev. Sci. Instrum. 83, 123903 (2012)
V. SUMMARY
We have developed an end station for nanoscale mag-netic materials study at the soft X-ray beamline HiSORBL-14 at HSRC. The stand-alone UHV-STM system is con-nected to the end station of the beamline via damper bel-lows. It achieves sufficient spatial resolution to observe sur-face nanoscale magnetic materials. We have demonstratedan in situ STM and XMCD combination experiment on Conanoclusters on Au(111) and emphasized the importance ofreal-space observation of morphology with magnetizationmeasurement. These results would provide useful informationon the other potential end stations of the synchrotron facili-ties in the world, where the SPM is already or planned to beinstalled. As demonstrated in this report, the combination ofSPM with the synchrotron radiation experiments will acceler-ate the materials research especially in nano-science field.
ACKNOWLEDGMENTS
All the experiments were performed at the HSRC underthe approval of the Proposal Assessing Committee. This workwas in part supported by Research Fellowships of the JapanSociety for the Promotion of Science for Young Scientists(No. 21 · 2032). The authors would like to thank Dr. Mao Ye,Dr. Yitao Cui, and Dr. Osamu Morimoto for technical assis-tance with the STM experiments. We are grateful to Dr. KojiMiyamoto for helpful comments on the manuscript. All STMimages were analyzed with Gwyddion (Gwyddion 2.25, GNUGeneral Public License, http://www.gwyddion.net, 2011).
1W. B. Zeper, F. J. A. M. Greidanus, P. F. Carcia, and C. R. Fincher, J. Appl.Phys. 65, 4971 (1989).
2M. N. Baibich, J. M. Broto, A. Fert, F. Nguyen Van Dau, F. Petroff, P.Etienne, G. Creuzet, A. Friederich, and J. Chazelas, Phys. Rev. Lett. 61,2472 (1988).
3G. Binasch, P. Grünberg, F. Saurenbach, and W. Zinn, Phys. Rev. B 39,4828 (1989).
4P. Gambardella, S. Rusponi, M. Veronese, S. S. Dhesi, C. Grazioli, A.Dallmeyer, I. Cabria, R. Zeller, P. H. Deverichs, K. Kern, C. Carbone, andH. Brune, Science 300, 1130 (2003).
5G. Binnig, H. Rohrer, Ch. Gerber, and E. Weibel, Phys. Rev. Lett. 49, 57(1982).
6B. Voigtländer, G. Meyer, and N. M. Amer, Phys. Rev. B 44, 10354 (1991).
7J. de la Figuera, J. E. Prieto, C. Ocal, and R. Miranda, Phys. Rev. B 47,13043 (1993).
8J. Shen, J. Giergiel, and J. Kirschner, Phys. Rev. B 52, 8454 (1995).9S. M. Jordan, R. Schad, A. M. Keen, M. Bischoff, D. S. Schmool, and H.van Kempen, Phys. Rev. B 59, 7350 (1999).
10M. Pratzer and H. J. Elmers, Phys. Rev. Lett. 90, 077201 (2003).11R. Wiesendanger, Rev. Mod. Phys. 81, 1495 (2009).12S. Heinze, K. von Bergmann, M. Menzel, J. Brede, A. Kubetzka, R.
Wiesendanger, G. Bihlmayer, and S. Blügel, Nat. Phys. 7, 713 (2011).13C. T. Chen, F. Sette, Y. Ma, and S. Modesti, Phys. Rev. B 42, 7262 (1990).14B. T. Thole, P. Carra, F. Sette, and G. van der Laan, Phys. Rev. Lett. 68,
1943 (1992).15P. Carra, B. T. Thole, M. Altarelli, and X. Wang, Phys. Rev. Lett. 70, 694
(1993).16T. Koide, H. Miyauchi, J. Okamoto, T. Shidara, A. Fujimori, H. Fukutani,
K. Amemiya, H. Takeshita, S. Yuasa, T. Katayama, and Y. Suzuki, Phys.Rev. Lett. 87, 257201 (2001).
17P. Gambardella, A. Dallmeyer, K. Maiti, M. C. Malagoli, W. Eberhardt, K.Kern, and C. Carbone, Nature (London) 416, 301 (2002).
18H. Fujisawa, S. Shiraki, M. Furukawa, S. Ito, T. Nakamura, T. Muro, M.Nantoh, and M. Kawai, Phys. Rev. B 75, 245423 (2007).
19H. Brune and P. Gambardella, Surf. Sci. 603, 1812 (2009).20P. Gambardella, S. Stepanow, A. Dmitriev, J. Honolka, F. M. F. de Groot,
M. Lingenfelder, S. S. Gupta, D. D. Sarma, P. Bencok, S. Stanescu, S. Clair,S. Pons, N. Lin, A. P. Seitsonen, H. Brune, J. V. Barth, and K. Kern, NatureMater. 8, 189 (2009).
21V. Rose, T. Y. Chien, J. W. Freeland, D. Rosenmann, J. Hiller, and V.Metlushko, J. Appl. Phys. 111, 07E304 (2012).
22T. Matsushima, T. Okuda, T. Eguchi, M. Ono, A. Harasawa, T. Wakita, A.Kataoka, M. Hamada, A. Kamoshida, Y. Hasegawa, and T. Kinoshita, Rev.Sci. Instrum. 75, 2149 (2004).
23A. Saito, J. Maruyama, K. Manabe, K. Kitamoto, K. Takahashi, K. Takami,M. Yabashi, Y. Tanaka, D. Miwa, M. Ishii, Y. Takagi, M. Akai-Kasaya, S.Shin, T. Ishikawa, Y. Kuwahara, and M. Aono, J. Synchrotron Radiat. 13,216 (2006).
24G. Panaccione, I. Vobornik, J. Fujii, D. Krizmancic, E. Annese, L. Gio-vanelli, F. Maccherozzi, F. Salvador, A. De Luisa, D. Benedetti, A. Gruden,P. Bertoch, F. Polack, D. Cocco, G. Sostero, B. Diviacco, M. Hochstrasser,U. Maier, D. Pescia, C. H. Back, T. Greber, J. Osterwalder, M. Galaktionov,M. Sancrotti, and G. Rossi, Rev. Sci. Instrum. 80, 043105 (2009).
25M. L. Cummings, T. Y. Chien, C. Preissner, V. Madhavan, D. Diesing, M.Bode, J. W. Freeland, and V. Rose, Ultramicroscopy 112, 22 (2012).
26M. Sawada, T. Ueno, T. Tagashira, H. Namatame, and M. Taniguchi, AIPConf. Proc. 1234, 939 (2010).
27M. Sawada, K. Yaji, M. Nagira, A. Kimura, H. Namatame, and M.Taniguchi, AIP Conf. Proc. 879, 551 (2007).
28J. V. Barth, H. Brune, G. Ertl, and R. J. Behm, Phys. Rev. B 42, 9307(1990).
29R. R. Schulz and C. Rossel, Rev. Sci. Instrum. 65, 1918 (1994).30S. Padovani, I. Chado, F. Scheurer, and J. P. Bucher, Phys. Rev. B 59, 11887
(1999).
Downloaded 19 Dec 2012 to 133.41.92.72. Redistribution subject to AIP license or copyright; see http://rsi.aip.org/about/rights_and_permissions


![STM [UandiStar.org]](https://img.pdfslide.net/doc/110x75/568c339a1a28ab02358d5391/stm-uandistarorg.jpg)