Embed Size (px)
Citation preview
7/29/2019 End User at OCBC
http://slidepdf.com/reader/full/end-user-at-ocbc 1/19
End user power apportioning
Page 1 of 19
Electrical KWH consumption at Feeder No.1 on (6th – 11th) Jan. 2012
Remarks:
1- High KWH consumption about 575 KW at 3:00 pm
2- The lowest KWH consumption about 75 KW during no load at the building after office hours.
High KWH
Lowest KWH
7/29/2019 End User at OCBC
http://slidepdf.com/reader/full/end-user-at-ocbc 2/19
End user power apportioning
Page 2 of 19
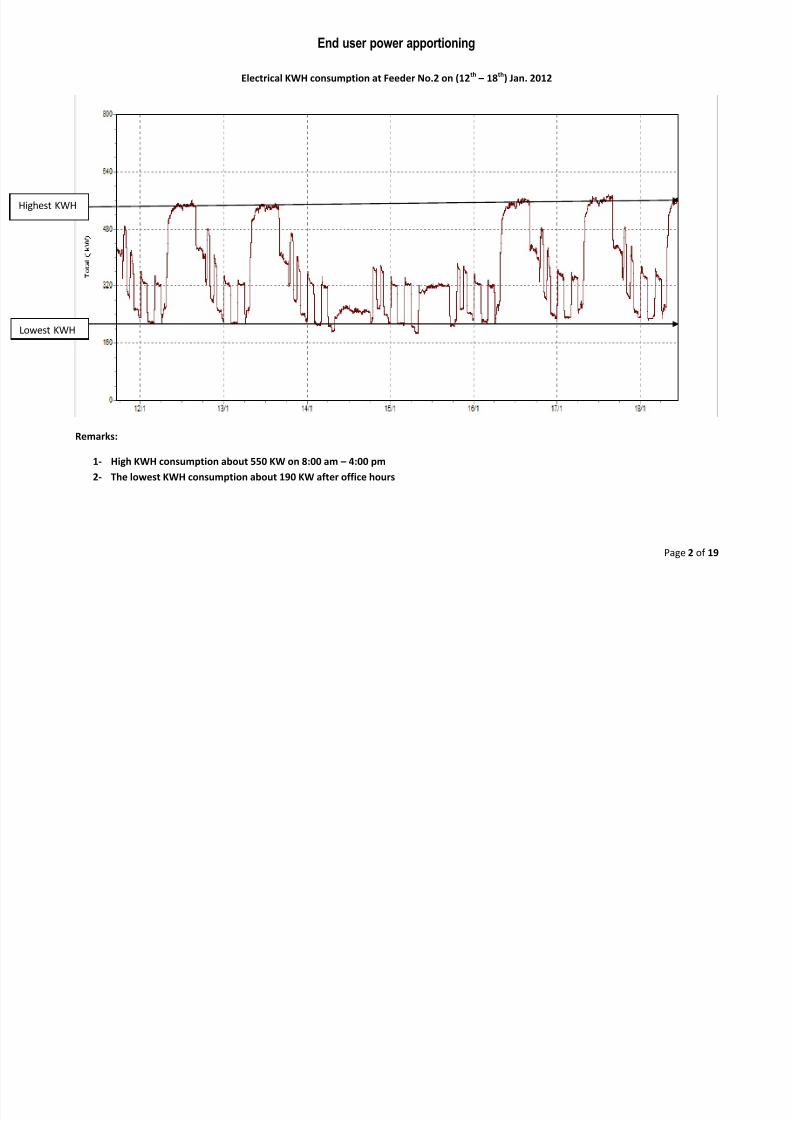
Electrical KWH consumption at Feeder No.2 on (12th – 18th) Jan. 2012
Remarks:
1- High KWH consumption about 550 KW on 8:00 am – 4:00 pm
2- The lowest KWH consumption about 190 KW after office hours
Highest KWH
Lowest KWH
7/29/2019 End User at OCBC
http://slidepdf.com/reader/full/end-user-at-ocbc 3/19
End user power apportioning
Page 3 of 19
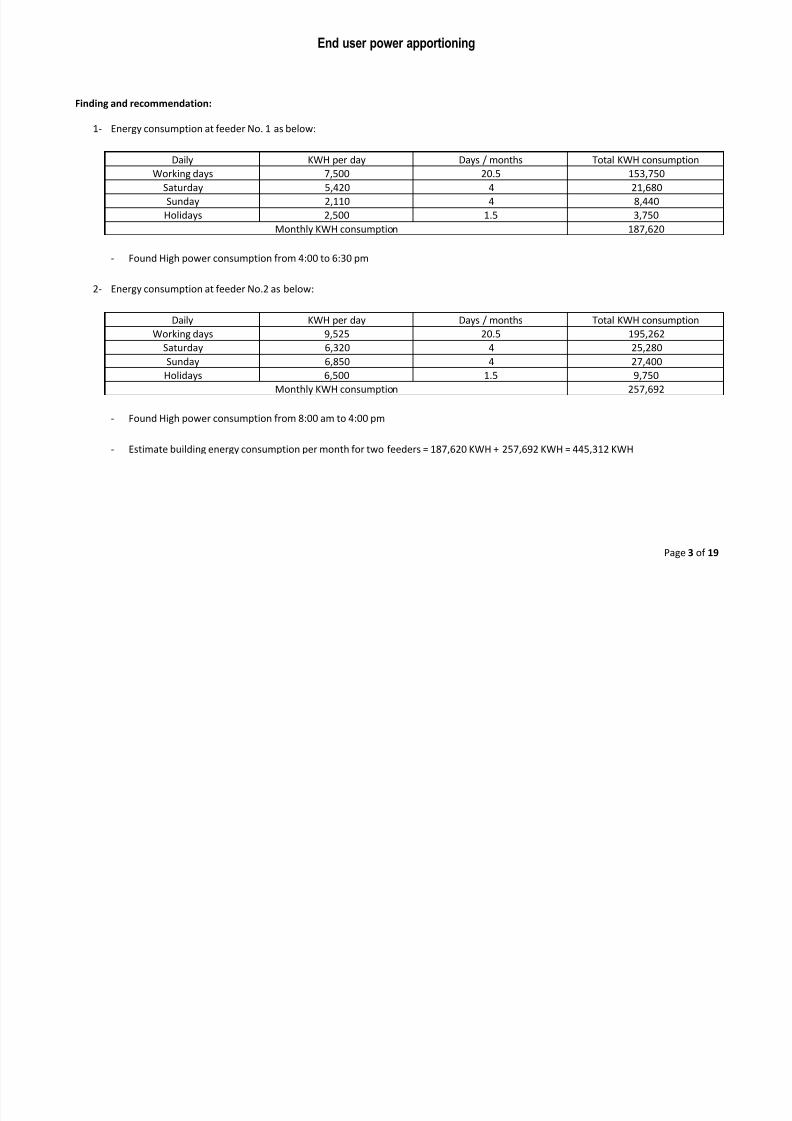
Finding and recommendation:
1- Energy consumption at feeder No. 1 as below:
Daily KWH per day Days / months Total KWH consumption
Working days 7,500 20.5 153,750
Saturday 5,420 4 21,680
Sunday 2,110 4 8,440
Holidays 2,500 1.5 3,750
Monthly KWH consumption 187,620
- Found High power consumption from 4:00 to 6:30 pm
2- Energy consumption at feeder No.2 as below:
Daily KWH per day Days / months Total KWH consumption
Working days 9,525 20.5 195,262
Saturday 6,320 4 25,280
Sunday 6,850 4 27,400
Holidays 6,500 1.5 9,750
Monthly KWH consumption 257,692
- Found High power consumption from 8:00 am to 4:00 pm
- Estimate building energy consumption per month for two feeders = 187,620 KWH + 257,692 KWH = 445,312 KWH
7/29/2019 End User at OCBC
http://slidepdf.com/reader/full/end-user-at-ocbc 4/19
End user power apportioning
Page 4 of 19
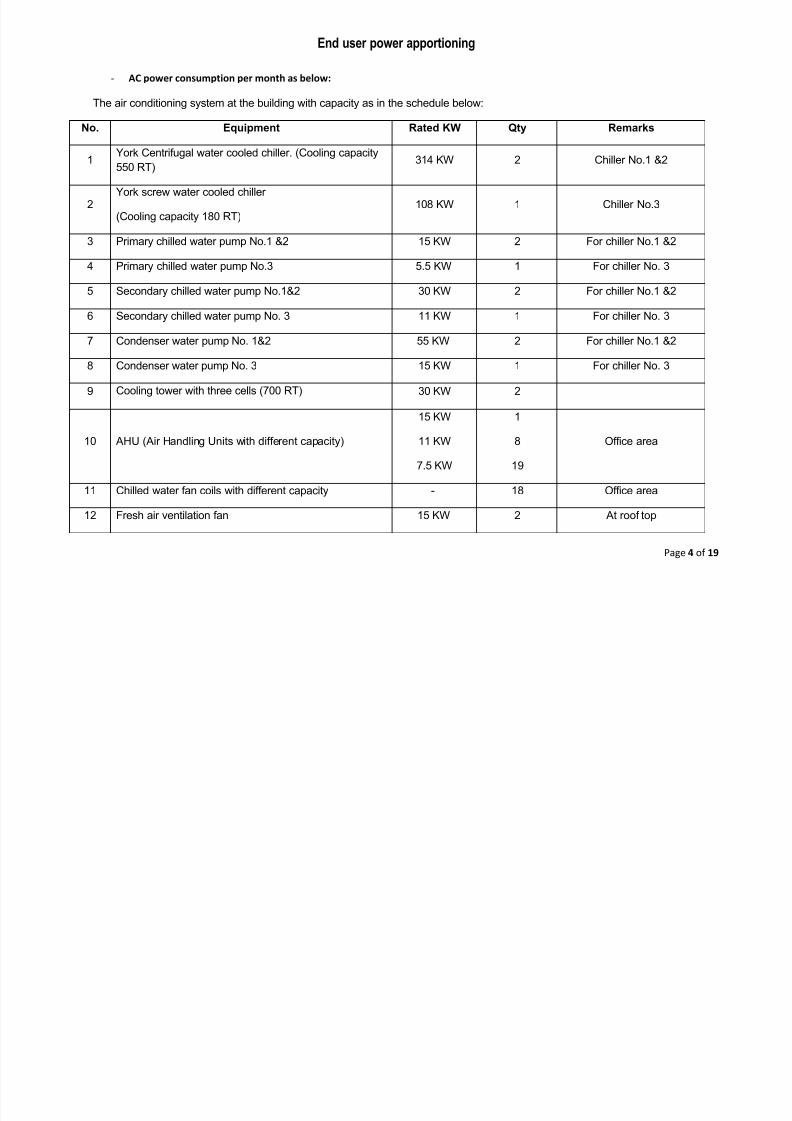
- AC power consumption per month as below:
The air conditioning system at the building with capacity as in the schedule below: No. Equipment Rated KW Qty Remarks
1 York Centrifugal water cooled chiller. (Cooling capacity
550 RT) 314 KW 2 Chiller No.1 &2
2 York screw water cooled chiller
(Cooling capacity 180 RT)108 KW 1 Chiller No.3
3 Primary chilled water pump No.1 &2 15 KW 2 For chiller No.1 &2
4 Primary chilled water pump No.3 5.5 KW 1 For chiller No. 3
5 Secondary chilled water pump No.1&2 30 KW 2 For chiller No.1 &2
6 Secondary chilled water pump No. 3 11 KW 1 For chiller No. 3
7 Condenser water pump No. 1&2 55 KW 2 For chiller No.1 &2
8 Condenser water pump No. 3 15 KW 1 For chiller No. 3
9 Cooling tower with three cells (700 RT) 30 KW 2
10 AHU (Air Handling Units with different capacity)
15 KW
11 KW
7.5 KW
1
8
19
Office area
11 Chilled water fan coils with different capacity - 18 Office area
12 Fresh air ventilation fan 15 KW 2 At roof top
7/29/2019 End User at OCBC
http://slidepdf.com/reader/full/end-user-at-ocbc 5/19
End user power apportioning
Page 5 of 19
-
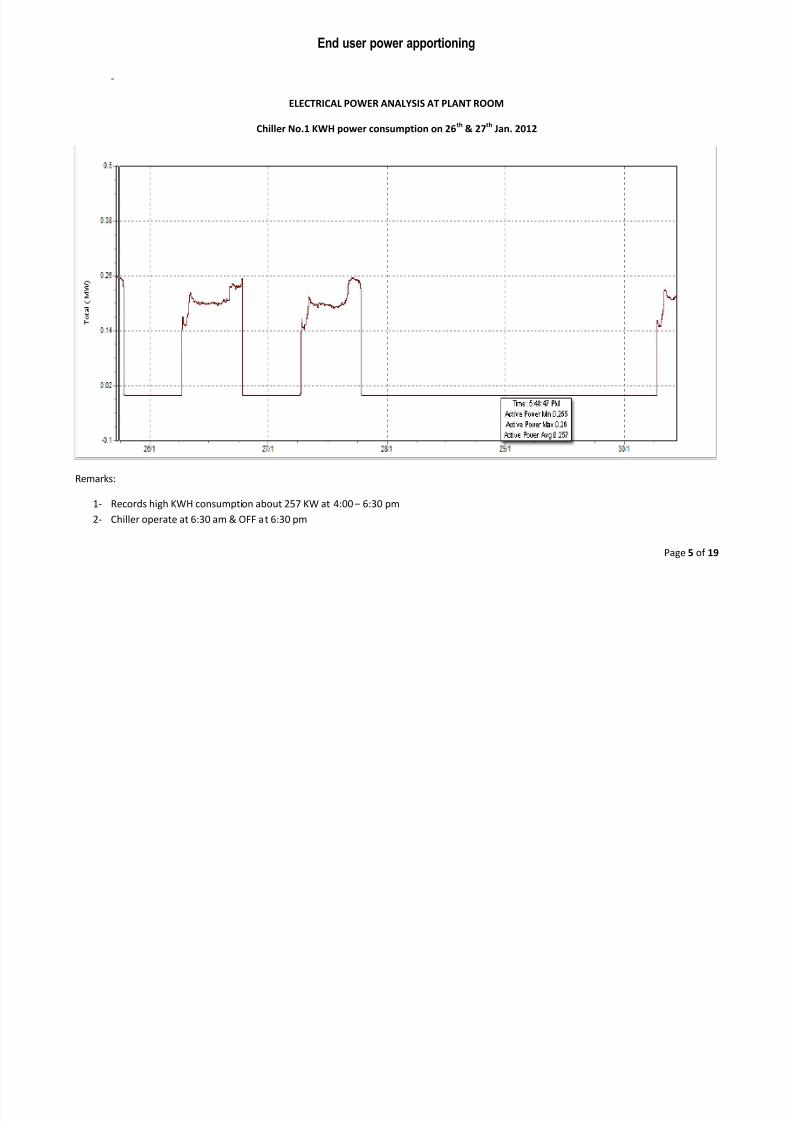
ELECTRICAL POWER ANALYSIS AT PLANT ROOM
Chiller No.1 KWH power consumption on 26th
& 27th
Jan. 2012
Remarks:
1- Records high KWH consumption about 257 KW at 4:00 – 6:30 pm
2- Chiller operate at 6:30 am & OFF at 6:30 pm
7/29/2019 End User at OCBC
http://slidepdf.com/reader/full/end-user-at-ocbc 6/19
End user power apportioning
Page 6 of 19
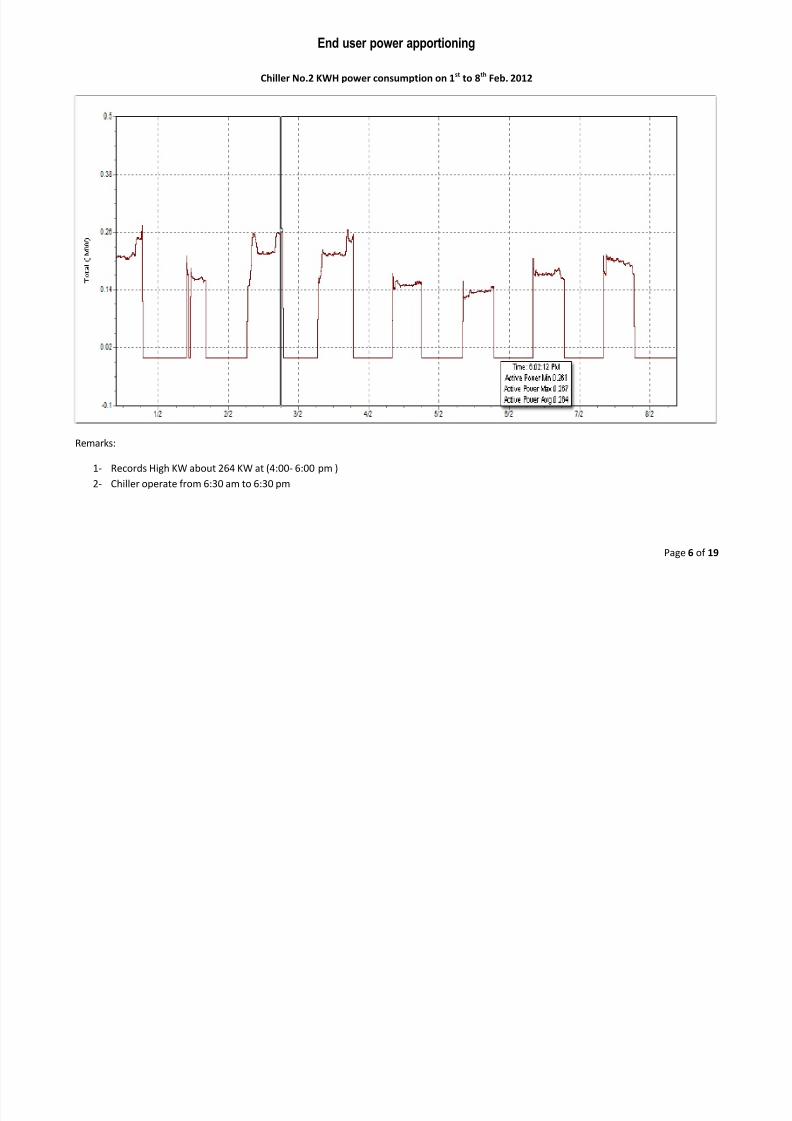
Chiller No.2 KWH power consumption on 1st to 8th Feb. 2012
Remarks:
1- Records High KW about 264 KW at (4:00- 6:00 pm )
2- Chiller operate from 6:30 am to 6:30 pm
7/29/2019 End User at OCBC
http://slidepdf.com/reader/full/end-user-at-ocbc 7/19
End user power apportioning
Page 7 of 19
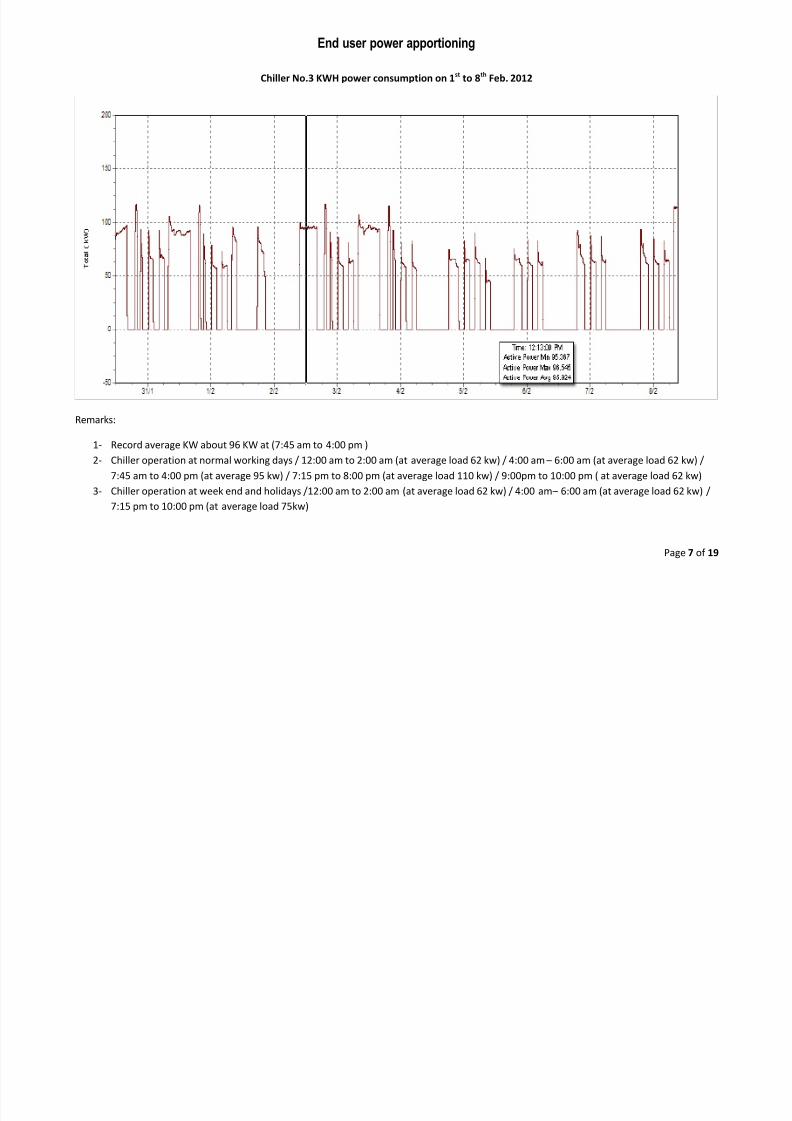
Chiller No.3 KWH power consumption on 1st to 8th Feb. 2012
Remarks:
1- Record average KW about 96 KW at (7:45 am to 4:00 pm )
2- Chiller operation at normal working days / 12:00 am to 2:00 am (at average load 62 kw) / 4:00 am – 6:00 am (at average load 62 kw) /
7:45 am to 4:00 pm (at average 95 kw) / 7:15 pm to 8:00 pm (at average load 110 kw) / 9:00pm to 10:00 pm ( at average load 62 kw)
3- Chiller operation at week end and holidays /12:00 am to 2:00 am (at average load 62 kw) / 4:00 am – 6:00 am (at average load 62 kw) /
7:15 pm to 10:00 pm (at average load 75kw)
7/29/2019 End User at OCBC
http://slidepdf.com/reader/full/end-user-at-ocbc 8/19
End user power apportioning
Page 8 of 19
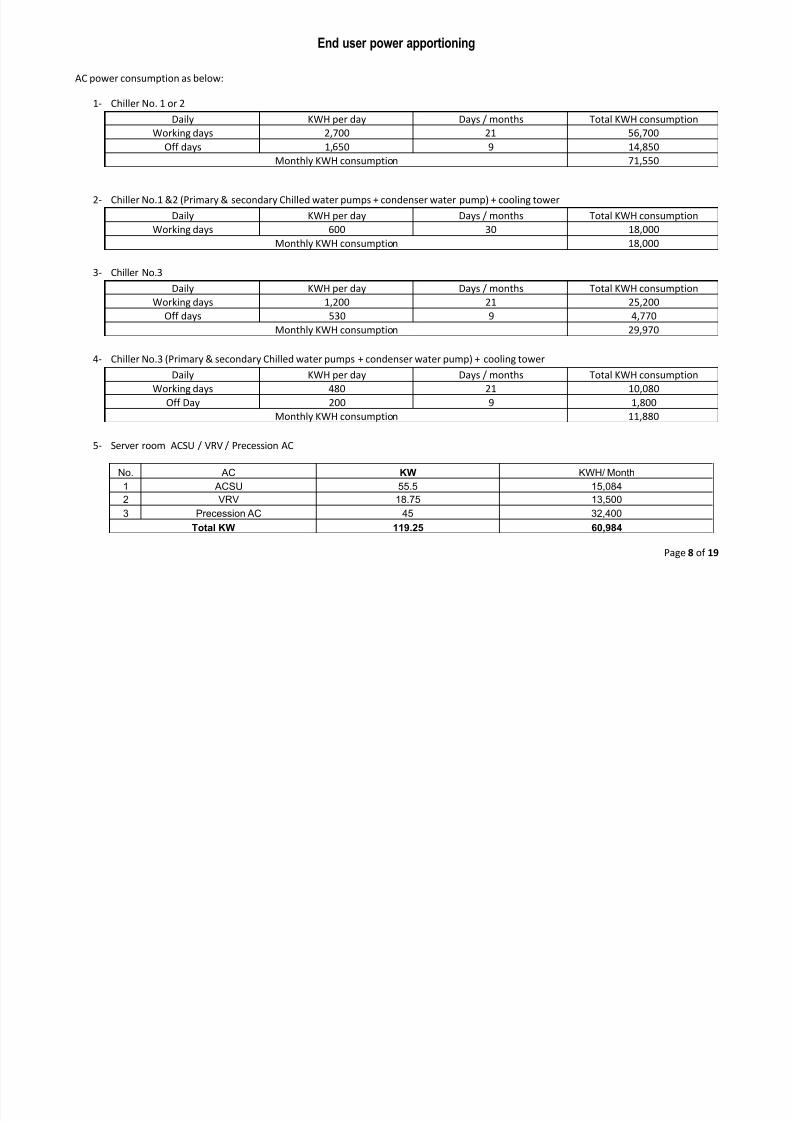
AC power consumption as below:
1- Chiller No. 1 or 2
Daily KWH per day Days / months Total KWH consumption
Working days 2,700 12 56,700
Off days 1,650 9 14,850
Monthly KWH consumption 71,550
2- Chiller No.1 &2 (Primary & secondary Chilled water pumps + condenser water pump) + cooling tower
Daily KWH per day Days / months Total KWH consumption
Working days 600 30 18,000
Monthly KWH consumption 18,000
3- Chiller No.3Daily KWH per day Days / months Total KWH consumption
Working days 1,200 21 25,200
Off days 530 9 4,770
Monthly KWH consumption 29,970
4- Chiller No.3 (Primary & secondary Chilled water pumps + condenser water pump) + cooling tower
Daily KWH per day Days / months Total KWH consumption
Working days 480 21 10,080
Off Day 200 9 1,800
Monthly KWH consumption 11,880
5- Server room ACSU / VRV / Precession AC
No. AC KW KWH/ Month
1 ACSU 55.5 15,084
2 VRV 18.75 13,500
3 Precession AC 45 32,400
Total KW 119.25 60,984
7/29/2019 End User at OCBC
http://slidepdf.com/reader/full/end-user-at-ocbc 9/19
End user power apportioning
Page 9 of 19
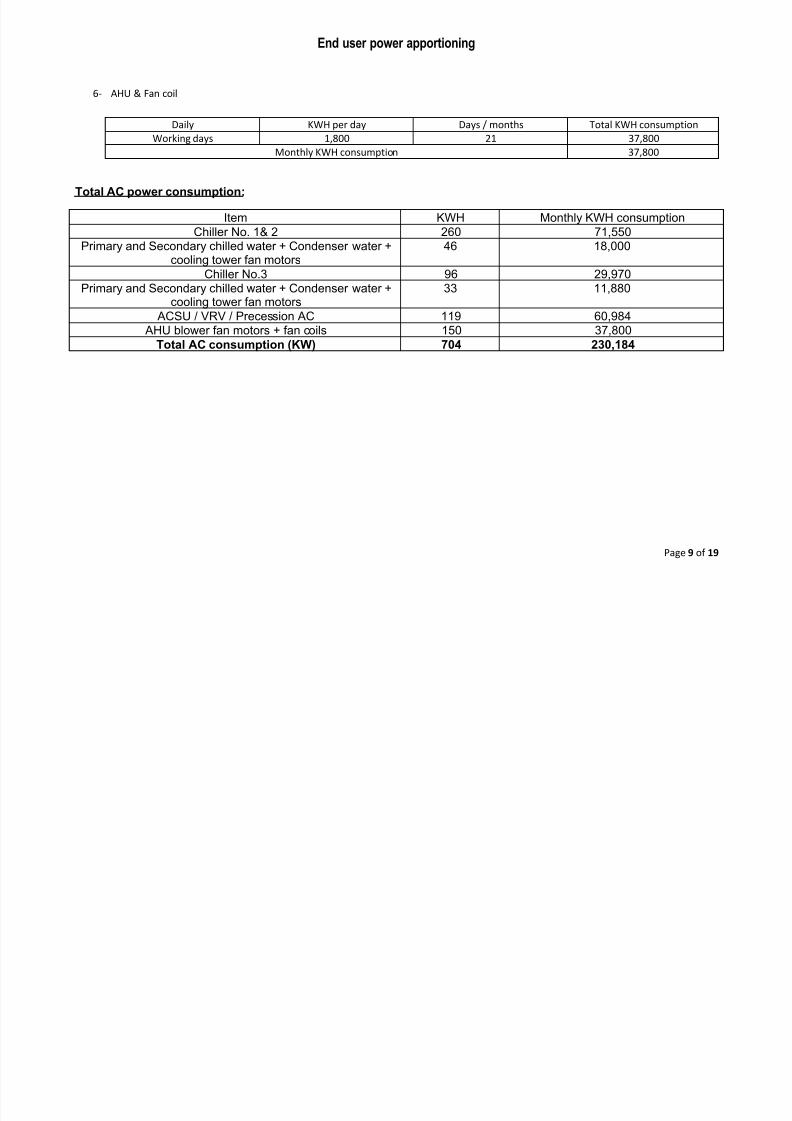
6- AHU & Fan coil
Daily KWH per day Days / months Total KWH consumption
Working days 1,800 21 37,800Monthly KWH consumption 37,800
Total AC power consumption:
Item KWH Monthly KWH consumption
Chiller No. 1& 2 260 71,550Primary and Secondary chilled water + Condenser water +
cooling tower fan motors46 18,000
Chiller No.3 96 29,970Primary and Secondary chilled water + Condenser water +
cooling tower fan motors33 11,880
ACSU / VRV / Precession AC 119 60,984 AHU blower fan motors + fan coils 150 37,800
Total AC consumption (KW) 704 230,184
7/29/2019 End User at OCBC
http://slidepdf.com/reader/full/end-user-at-ocbc 10/19
End user power apportioning
Page 10 of 19
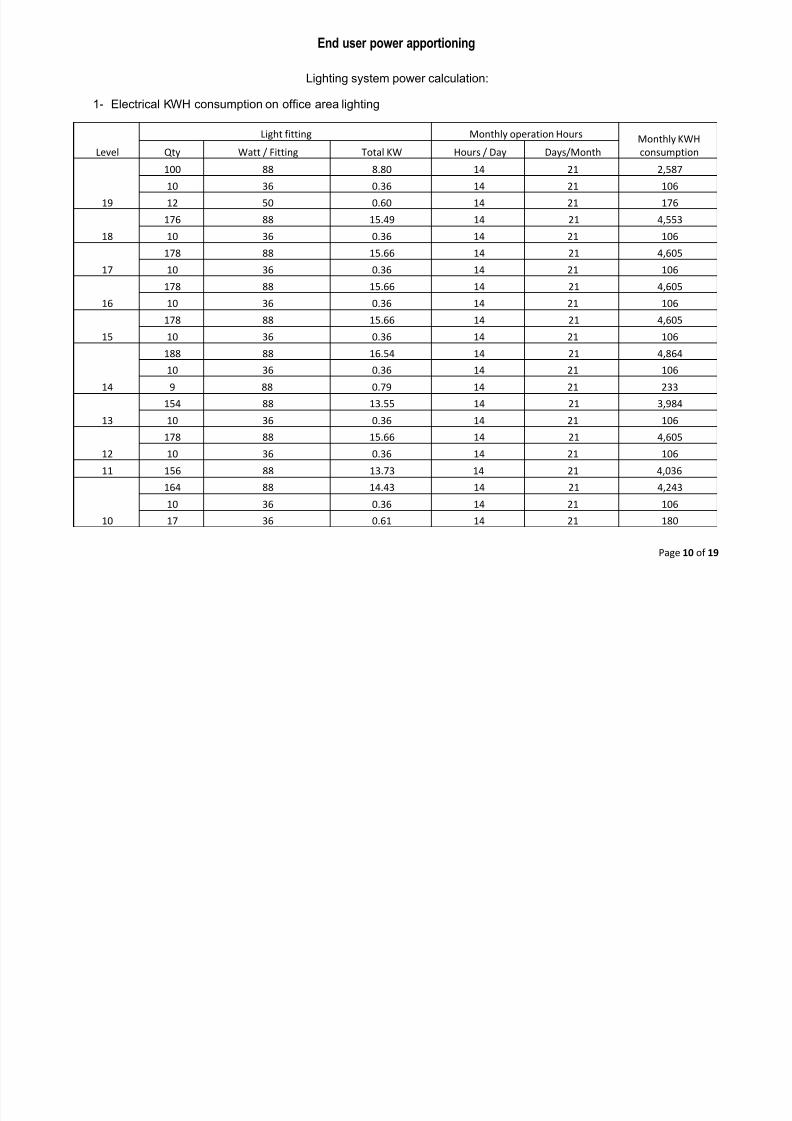
Lighting system power calculation:
1- Electrical KWH consumption on office area lighting
LevelLight fitting Monthly operation Hours Monthly KWH
consumptionQty Watt / Fitting Total KW Hours / Day Days/Month
19
100 88 8.80 14 21 2,587
10 36 0.36 14 21 106
12 50 0.60 14 21 176
18
176 88 15.49 14 21 4,553
10 36 0.36 14 21 106
17
178 88 15.66 14 21 4,605
10 36 0.36 14 21 106
16
178 88 15.66 14 21 4,605
10 36 0.36 14 21 106
15
178 88 15.66 14 21 4,605
10 36 0.36 14 21 106
14
188 88 16.54 14 21 4,864
10 36 0.36 14 21 106
9 88 0.79 14 21 233
13
154 88 13.55 14 21 3,984
10 36 0.36 14 21 106
12
178 88 15.66 14 21 4,605
10 36 0.36 14 21 106
11 156 88 13.73 14 21 4,036
10
164 88 14.43 14 21 4,243
10 36 0.36 14 21 106
17 36 0.61 14 21 180
7/29/2019 End User at OCBC
http://slidepdf.com/reader/full/end-user-at-ocbc 11/19
End user power apportioning
Page 11 of 19
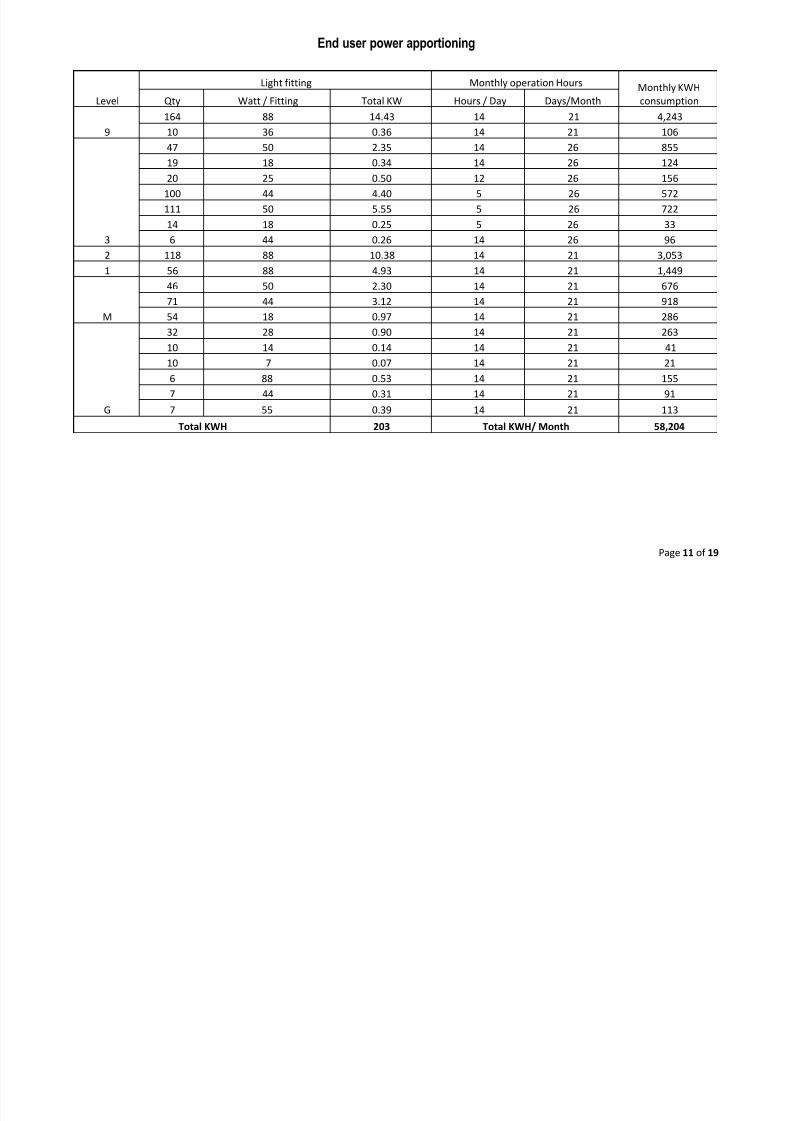
Level
Light fitting Monthly operation Hours Monthly KWH
consumptionQty Watt / Fitting Total KW Hours / Day Days/Month
9
164 88 14.43 14 21 4,243
10 36 0.36 14 21 106
3
47 50 2.35 14 26 855
19 18 0.34 14 26 124
20 25 0.50 12 26 156
100 44 4.40 5 26 572
111 50 5.55 5 26 722
14 18 0.25 5 26 33
6 44 0.26 14 26 96
2 118 88 10.38 14 21 3,053
1 56 88 4.93 14 21 1,449
M
46 50 2.30 14 21 676
71 44 3.12 14 21 918
54 18 0.97 14 21 286
G
32 28 0.90 14 21 263
10 14 0.14 14 21 41
10 7 0.07 14 21 21
6 88 0.53 14 21 155
7 44 0.31 14 21 91
7 55 0.39 14 21 113
Total KWH 203 Total KWH/ Month 58,204
7/29/2019 End User at OCBC
http://slidepdf.com/reader/full/end-user-at-ocbc 12/19
End user power apportioning
Page 12 of 19
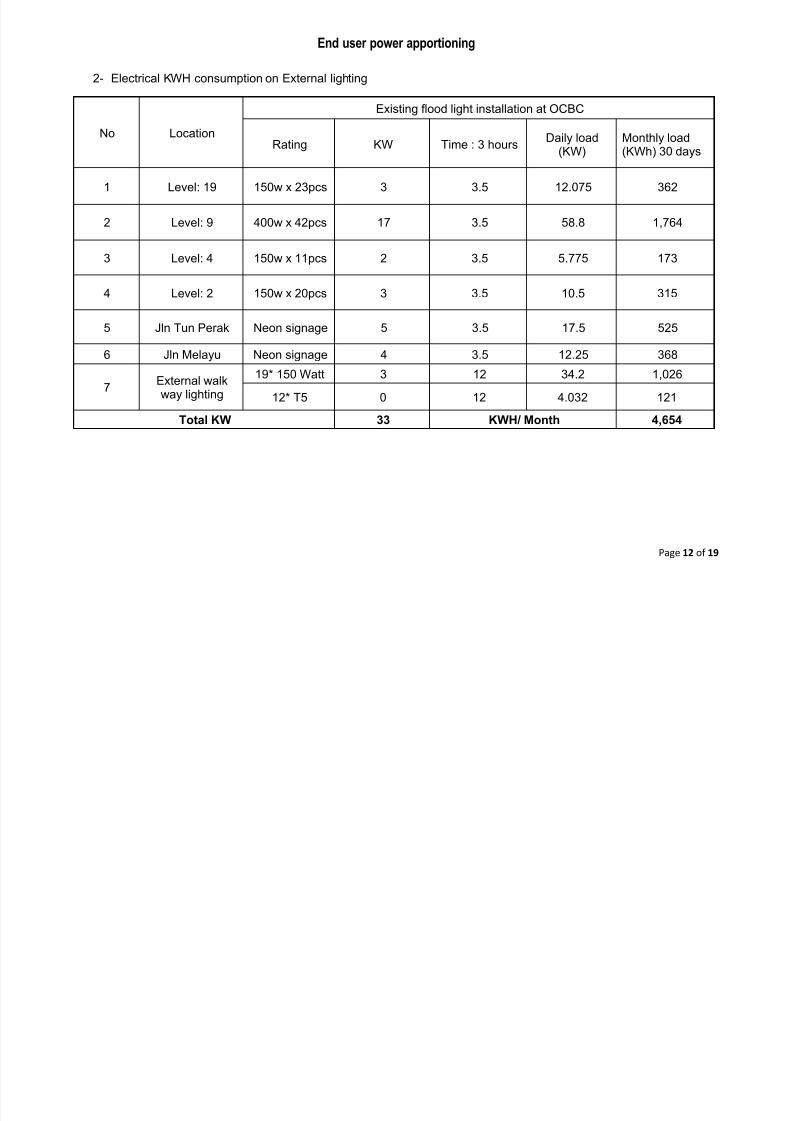
2- Electrical KWH consumption on External lighting
No Location
Existing flood light installation at OCBC
Rating KW Time : 3 hours Daily load(KW)
Monthly load(KWh) 30 days
1 Level: 19 150w x 23pcs 3 3.5 12.075 362
2 Level: 9 400w x 42pcs 17 3.5 58.8 1,764
3 Level: 4 150w x 11pcs 2 3.5 5.775 173
4 Level: 2 150w x 20pcs 3 3.5 10.5 315
5 Jln Tun Perak Neon signage 5 3.5 17.5 525
6 Jln Melayu Neon signage 4 3.5 12.25 368
7External walkway lighting
19* 150 Watt 3 12 34.2 1,026
12* T5 0 12 4.032 121
Total KW 33 KWH/ Month 4,654
7/29/2019 End User at OCBC
http://slidepdf.com/reader/full/end-user-at-ocbc 13/19
End user power apportioning
Page 13 of 19
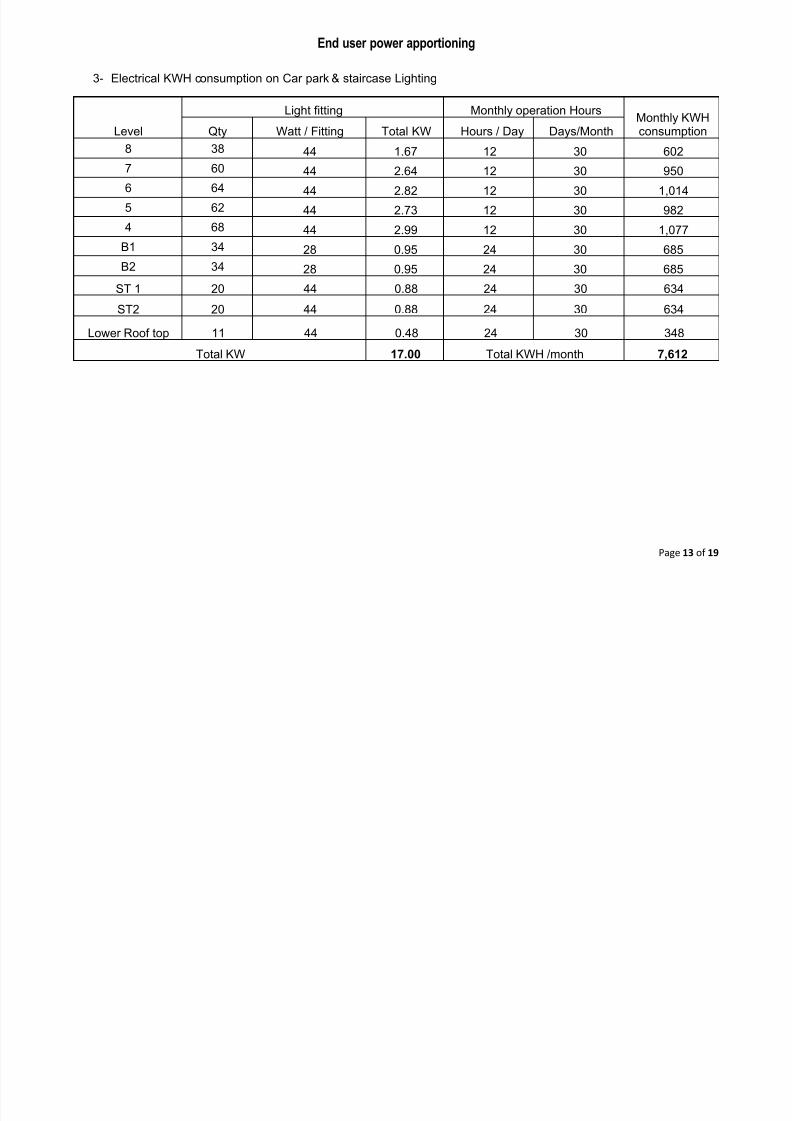
3- Electrical KWH consumption on Car park & staircase Lighting
Level
Light fitting Monthly operation HoursMonthly KWHconsumptionQty Watt / Fitting Total KW Hours / Day Days/Month
8 38 44 1.67 12 30 602
7 60 44 2.64 12 30 950
6 64 44 2.82 12 30 1,014
5 62 44 2.73 12 30 982
4 68 44 2.99 12 30 1,077
B1 34 28 0.95 24 30 685
B2 34 28 0.95 24 30 685
ST 1 20 44 0.88 24 30 634
ST2 20 44 0.88 24 30 634
Lower Roof top 11 44 0.48 24 30 348
Total KW 17.00 Total KWH /month 7,612
7/29/2019 End User at OCBC
http://slidepdf.com/reader/full/end-user-at-ocbc 14/19
End user power apportioning
Page 14 of 19
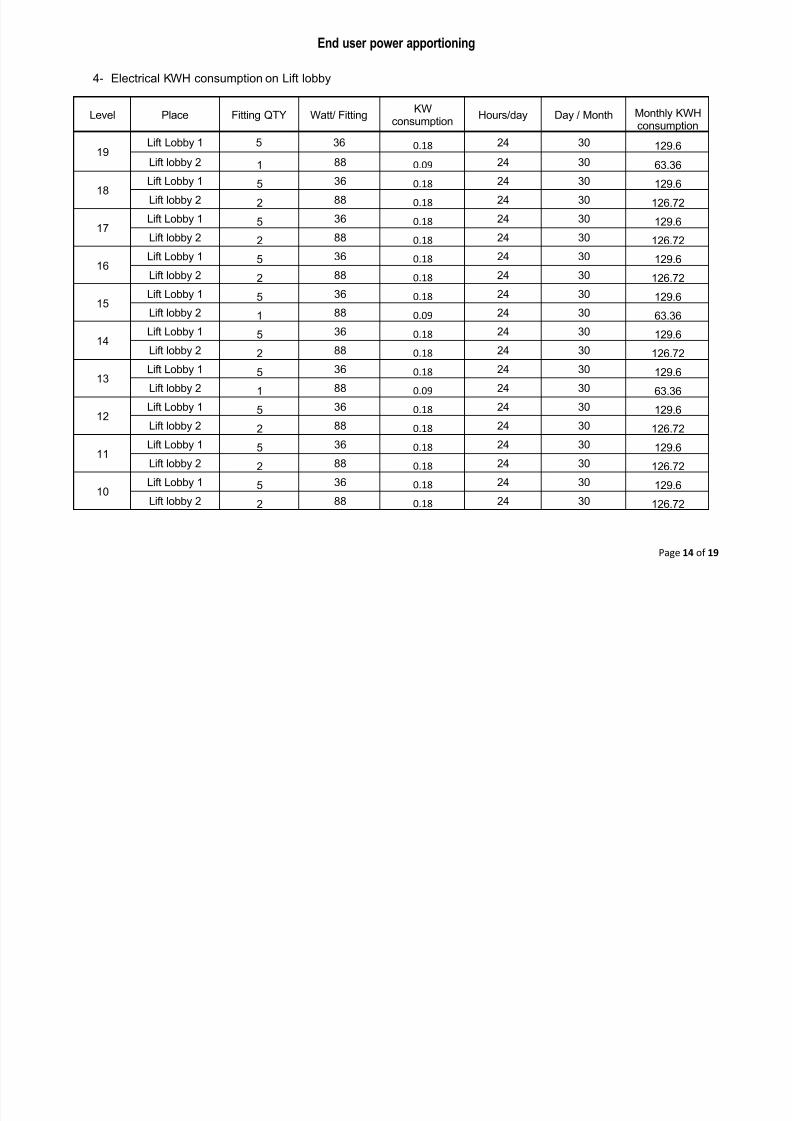
4- Electrical KWH consumption on Lift lobby
Level Place Fitting QTY Watt/ FittingKW
consumptionHours/day Day / Month Monthly KWH
consumption
19Lift Lobby 1 5 36 0.18 24 30 129.6
Lift lobby 2 1 88 0.09 24 30 63.36
18Lift Lobby 1 5 36 0.18 24 30 129.6
Lift lobby 2 2 88 0.18 24 30 126.72
17Lift Lobby 1 5 36 0.18 24 30 129.6
Lift lobby 2 2 88 0.18 24 30 126.72
16Lift Lobby 1 5 36 0.18 24 30 129.6
Lift lobby 2 2 88 0.18 24 30 126.72
15Lift Lobby 1 5 36 0.18 24 30 129.6
Lift lobby 2 1 88 0.09 24 30 63.36
14Lift Lobby 1 5 36 0.18 24 30 129.6
Lift lobby 2 2 88 0.18 24 30 126.72
13Lift Lobby 1 5 36 0.18 24 30 129.6
Lift lobby 2 1 88 0.09 24 30 63.36
12
Lift Lobby 1 5 36 0.18 24 30 129.6
Lift lobby 2 2 88 0.18 24 30 126.72
11Lift Lobby 1 5 36 0.18 24 30 129.6
Lift lobby 2 2 88 0.18 24 30 126.72
10Lift Lobby 1 5 36 0.18 24 30 129.6
Lift lobby 2 2 88 0.18 24 30 126.72
7/29/2019 End User at OCBC
http://slidepdf.com/reader/full/end-user-at-ocbc 15/19
End user power apportioning
Page 15 of 19
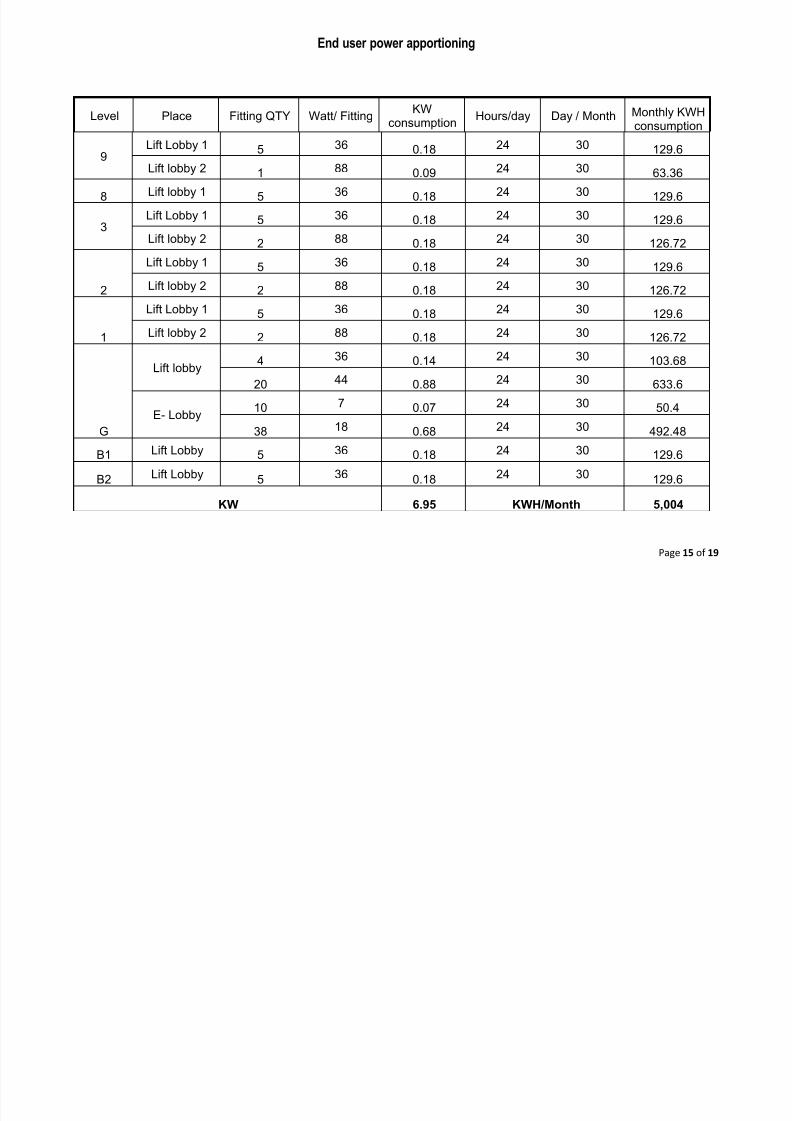
9Lift Lobby 1 5 36 0.18 24 30 129.6
Lift lobby 2 1 88 0.09 24 30 63.36
8 Lift lobby 1 5 36 0.18 24 30 129.6
3Lift Lobby 1 5 36 0.18 24 30 129.6
Lift lobby 2 2 88 0.18 24 30 126.72
2
Lift Lobby 1 5 36 0.18 24 30 129.6
Lift lobby 2 2 88 0.18 24 30 126.72
1
Lift Lobby 1 5 36 0.18 24 30 129.6
Lift lobby 2 2 88 0.18 24 30 126.72
G
Lift lobby4 36 0.14 24 30 103.68
20 44 0.88 24 30 633.6
E- Lobby10 7 0.07 24 30 50.4
38 18 0.68 24 30 492.48
B1 Lift Lobby 5 36 0.18 24 30 129.6
B2 Lift Lobby 5 36 0.18 24 30 129.6
KW 6.95 KWH/Month 5,004
Level Place Fitting QTY Watt/ FittingKW
consumptionHours/day Day / Month Monthly KWH
consumption
7/29/2019 End User at OCBC
http://slidepdf.com/reader/full/end-user-at-ocbc 16/19
End user power apportioning
Page 16 of 19
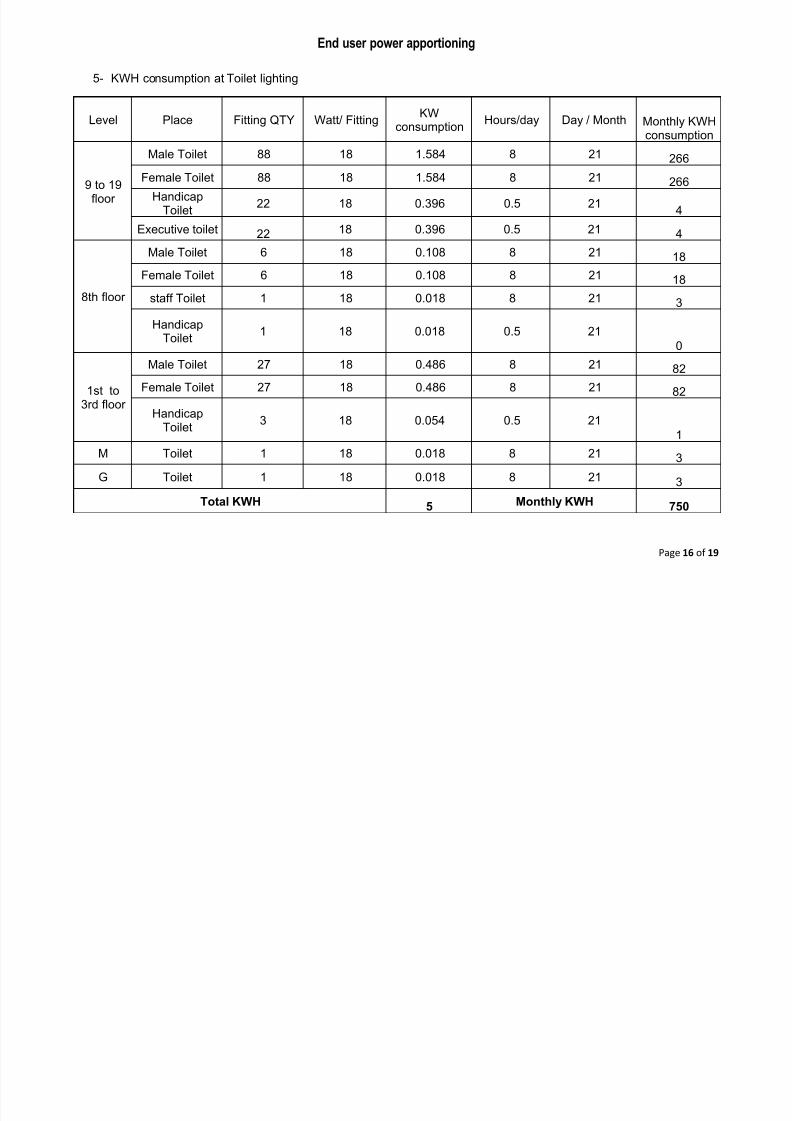
5- KWH consumption at Toilet lighting
Level Place Fitting QTY Watt/ FittingKW
consumptionHours/day Day / Month Monthly KWH
consumption
9 to 19floor
Male Toilet 88 18 1.584 8 21 266
Female Toilet 88 18 1.584 8 21 266
HandicapToilet
22 18 0.396 0.5 214
Executive toilet 22 18 0.396 0.5 21 4
8th floor
Male Toilet 6 18 0.108 8 21 18
Female Toilet 6 18 0.108 8 21 18
staff Toilet 1 18 0.018 8 21 3
HandicapToilet
1 18 0.018 0.5 21
0
1st to3rd floor
Male Toilet 27 18 0.486 8 21 82
Female Toilet 27 18 0.486 8 21 82
HandicapToilet
3 18 0.054 0.5 211
M Toilet 1 18 0.018 8 21 3
G Toilet 1 18 0.018 8 21 3
Total KWH 5 Monthly KWH 750
7/29/2019 End User at OCBC
http://slidepdf.com/reader/full/end-user-at-ocbc 17/19
End user power apportioning
Page 17 of 19
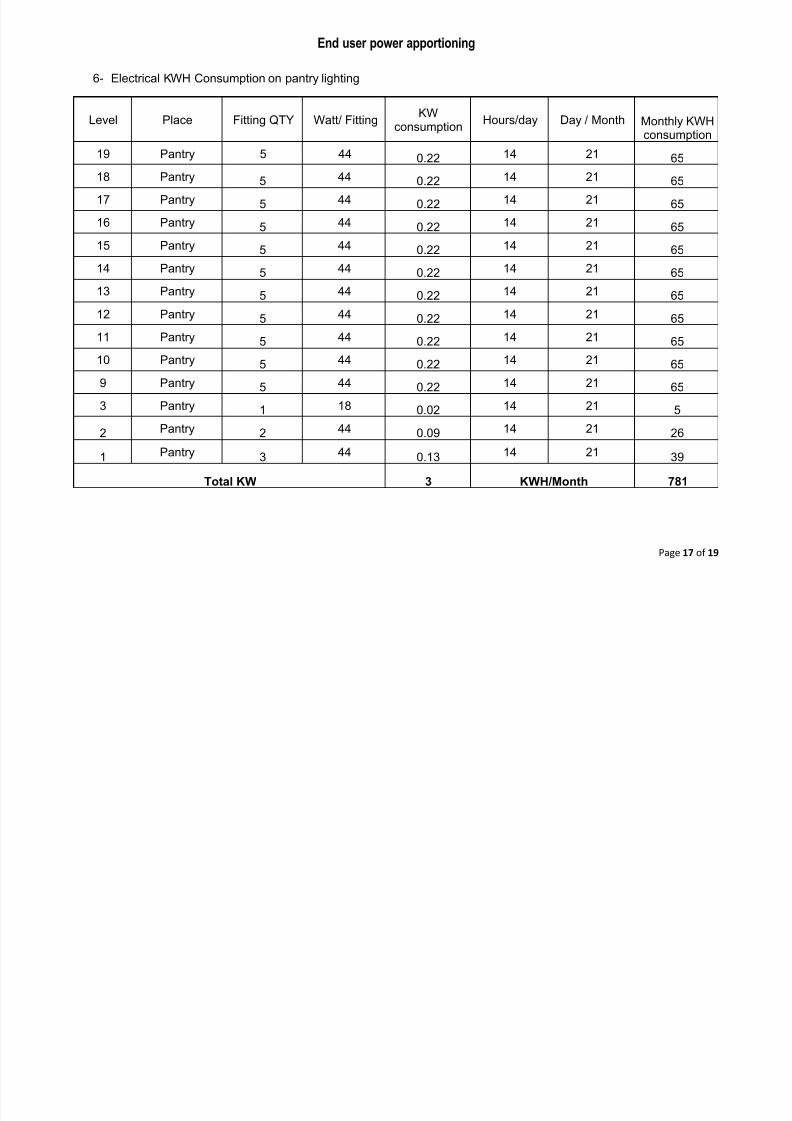
6- Electrical KWH Consumption on pantry lighting
Level Place Fitting QTY Watt/ FittingKW
consumptionHours/day Day / Month Monthly KWH
consumption19 Pantry 5 44 0.22 14 21 65
18 Pantry 5 44 0.22 14 21 65
17 Pantry 5 44 0.22 14 21 65
16 Pantry 5 44 0.22 14 21 65
15 Pantry 5 44 0.22 14 21 65
14 Pantry
5
44
0.22
14 21
6513 Pantry 5 44 0.22 14 21 65
12 Pantry 5 44 0.22 14 21 65
11 Pantry 5 44 0.22 14 21 65
10 Pantry 5 44 0.22 14 21 65
9 Pantry 5 44 0.22 14 21 65
3 Pantry 1 18 0.02 14 21 5
2 Pantry 2 44 0.09 14 21 26
1 Pantry 3 44 0.13 14 21 39
Total KW 3 KWH/Month 781
7/29/2019 End User at OCBC
http://slidepdf.com/reader/full/end-user-at-ocbc 18/19
End user power apportioning
Page 18 of 19
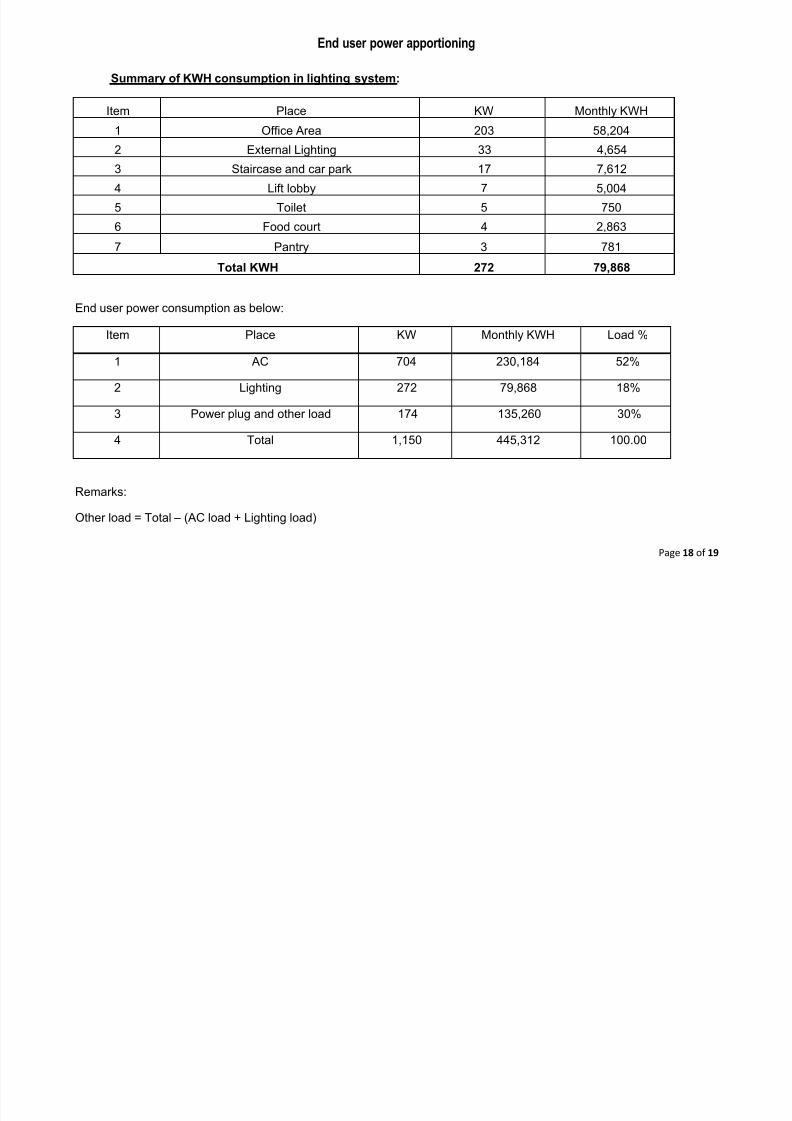
Summary of KWH consumption in lighting system:
Item Place KW Monthly KWH
1 Office Area 203 58,204
2 External Lighting 33 4,654
3 Staircase and car park 17 7,612
4 Lift lobby 7 5,004
5 Toilet 5 750
6 Food court 4 2,863
7 Pantry 3 781
Total KWH 272 79,868
End user power consumption as below:
Item Place KW Monthly KWH Load %
1 AC 704 230,184 52%
2 Lighting 272 79,868 18%
3 Power plug and other load 174 135,260 30%
4 Total 1,150 445,312 100.00
Remarks:
Other load = Total – (AC load + Lighting load)
7/29/2019 End User at OCBC
http://slidepdf.com/reader/full/end-user-at-ocbc 19/19
End user power apportioning
Page 19 of 19
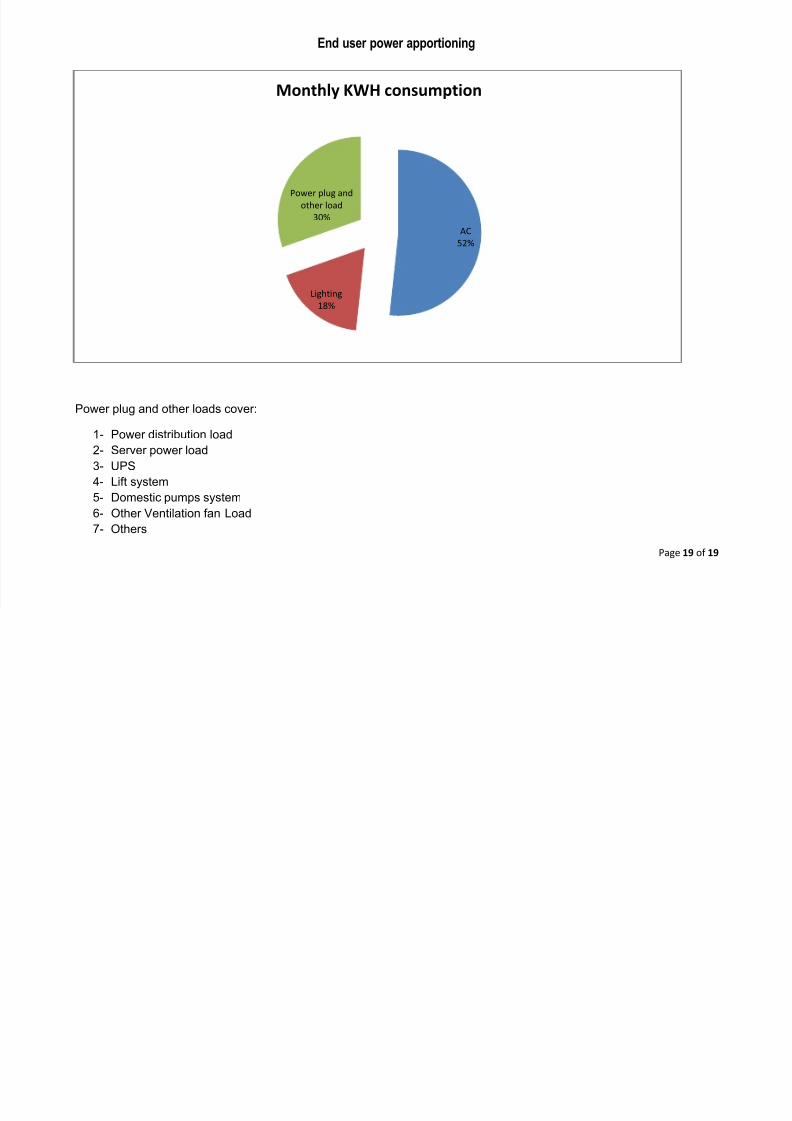
Power plug and other loads cover:
1- Power distribution load
2- Server power load
3- UPS
4- Lift system
5- Domestic pumps system
6- Other Ventilation fan Load
7- Others
AC
52%
Lighting
18%
Power plug and
other load
30%
Monthly KWH consumption