Embed Size (px)
Citation preview
1
Florian Leblanc
www.centre-cired.fr
ENGREF
19 Novembre 2014
Semaine AthensModule changement climatique
Energie, économie et climat :Les enjeux des nouveaux hydrocarbures
non-conventionnels
Points abordés Le pétrole et le gaz dans le mix énergétique mondiale
L’exploitation du pétrole
Notion de ressource – réserve
La théorie du peak oil
Liens avec le climat et la macro-économie
Les nouveaux hydrocarbures non-conventionnels
Technologie, ressource et incertitudes
Nouvelle abondance énergétique ? Le cas US
Impacts macro-économique et politiques climatiques
2
Généralités : le pétrole et le gas dans le mix énergétique mondiale
3
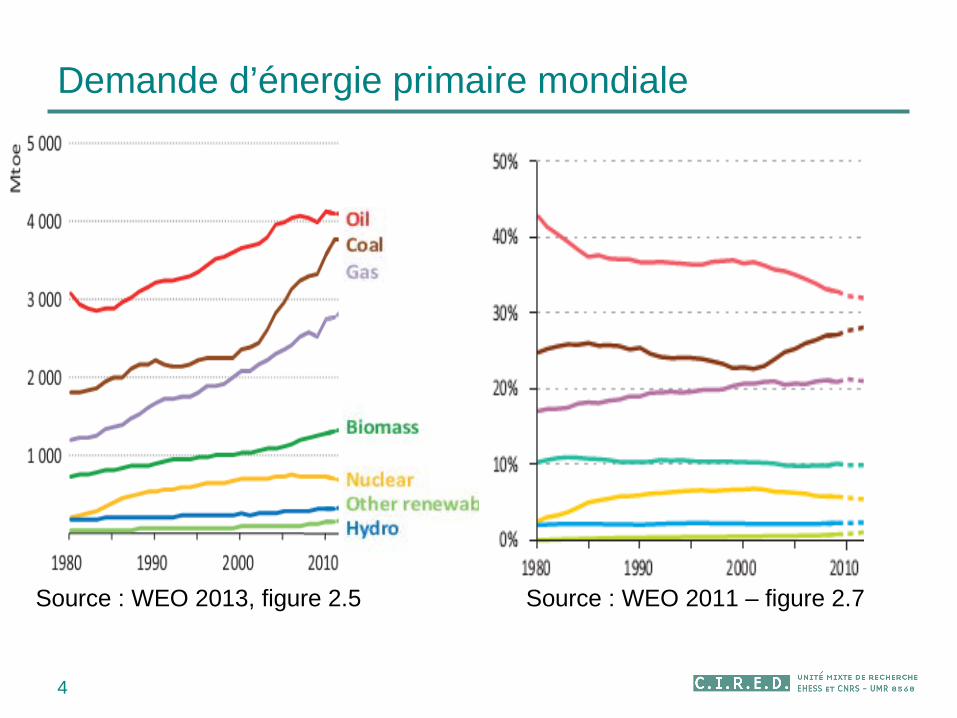
Demande d’énergie primaire mondiale
4
Source : WEO 2013, figure 2.5 Source : WEO 2011 – figure 2.7
0
2000
4000
6000
8000
10000
12000
14000
Mtoe
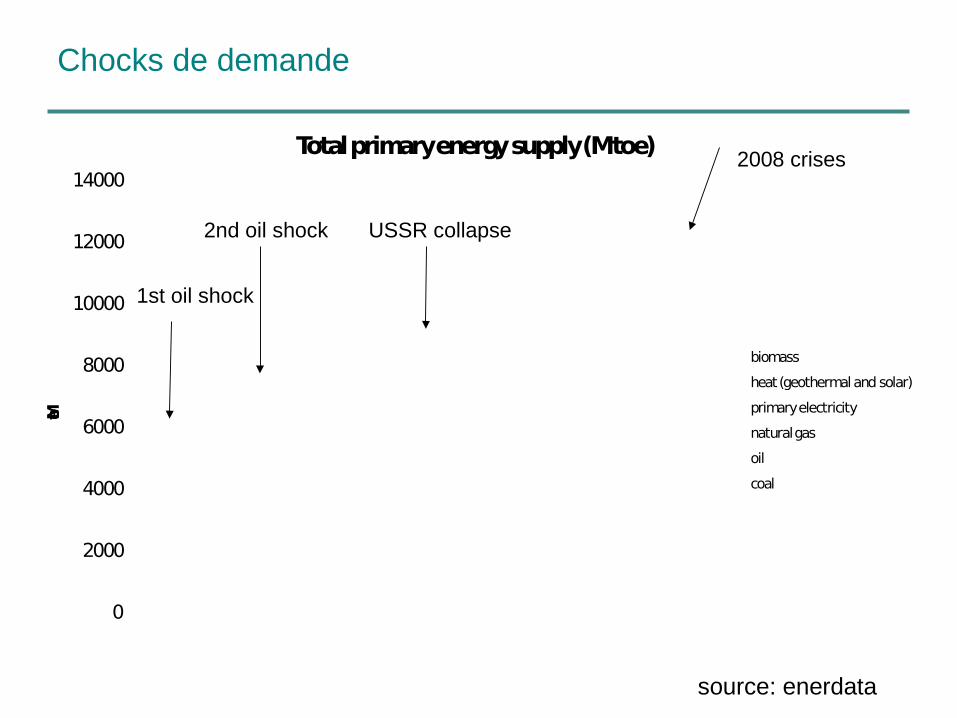
Total primary energy supply (Mtoe)
biomass
heat (geothermal and solar)
primary electricity
natural gas
oil
coal
1st oil shock
2nd oil shock USSR collapse
source: enerdata
Chocks de demande
2008 crises
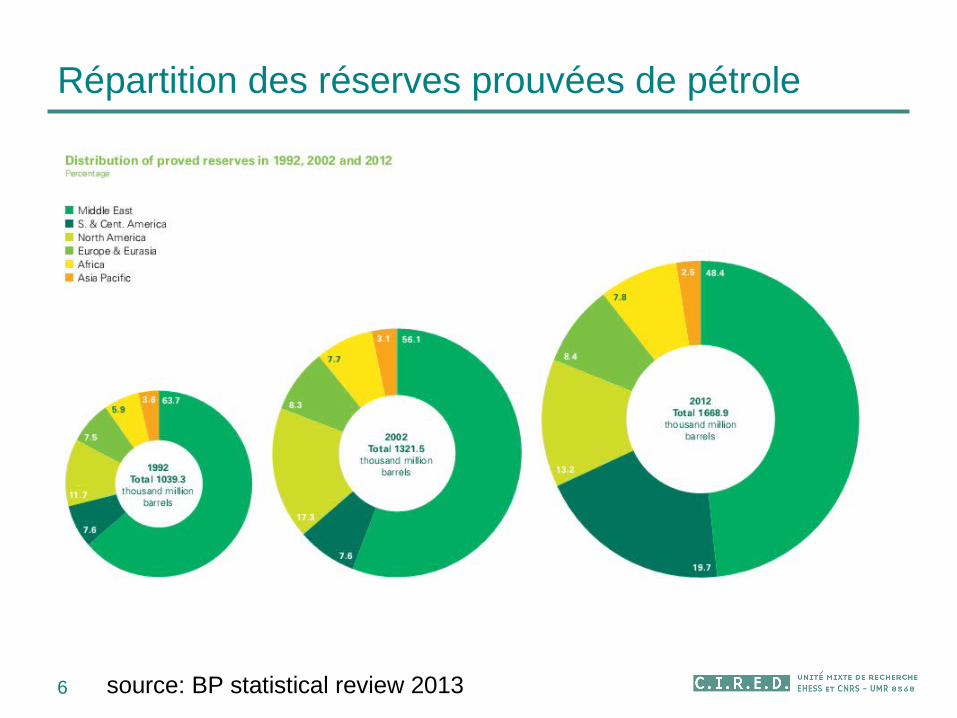
Répartition des réserves prouvées de pétrole
6 source: BP statistical review 2013
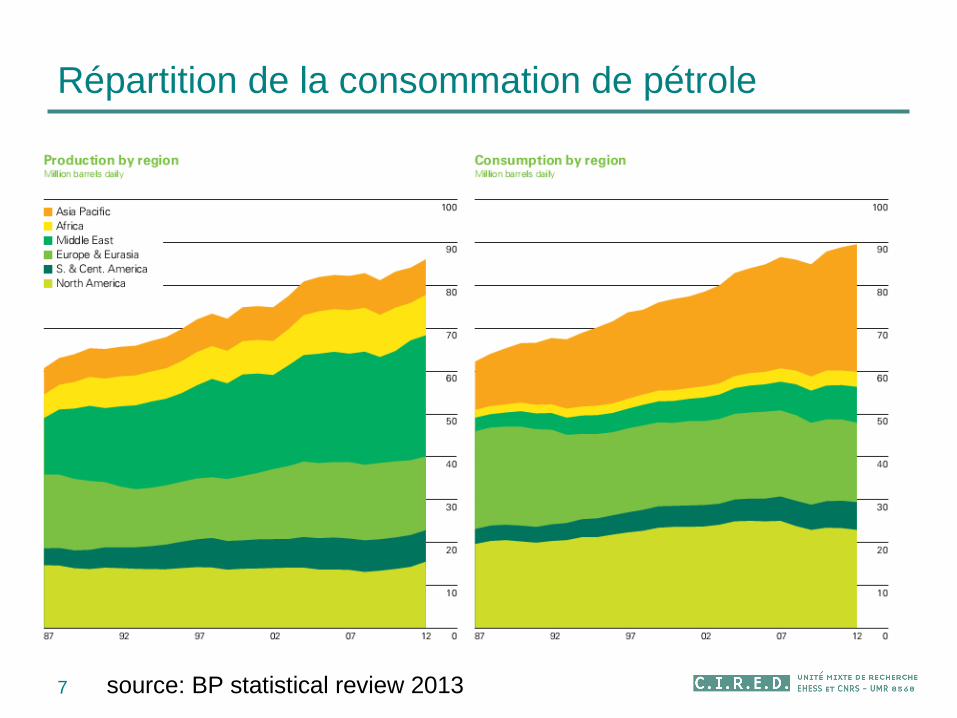
Répartition de la consommation de pétrole
7 source: BP statistical review 2013
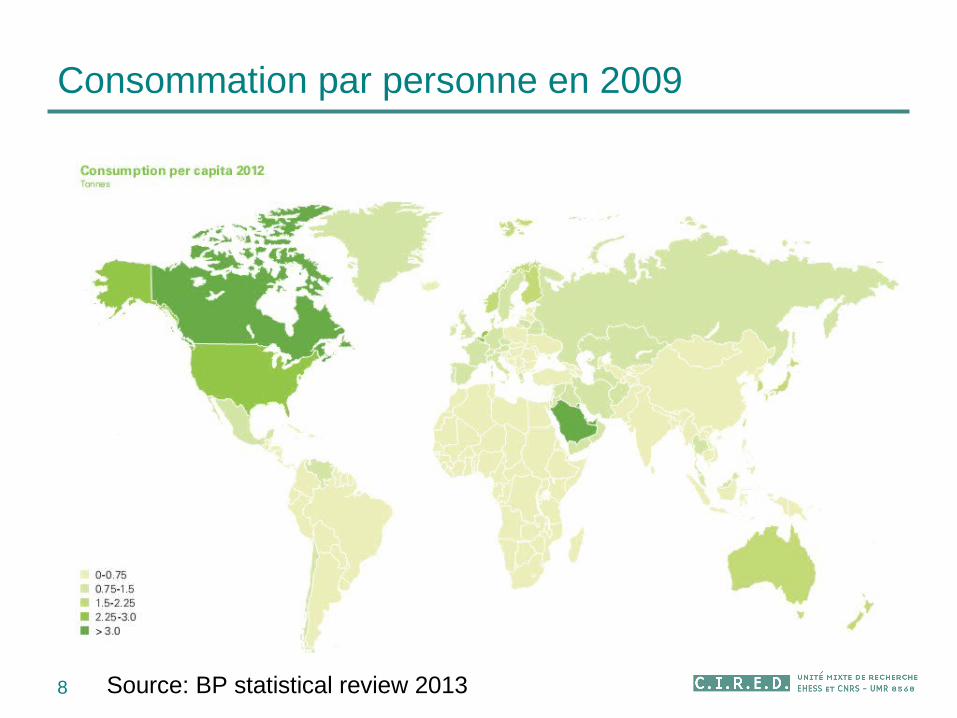
Consommation par personne en 2009
8 Source: BP statistical review 2013

9source: BP statistical review 2013
Répartition des réserves prouvées de gaz
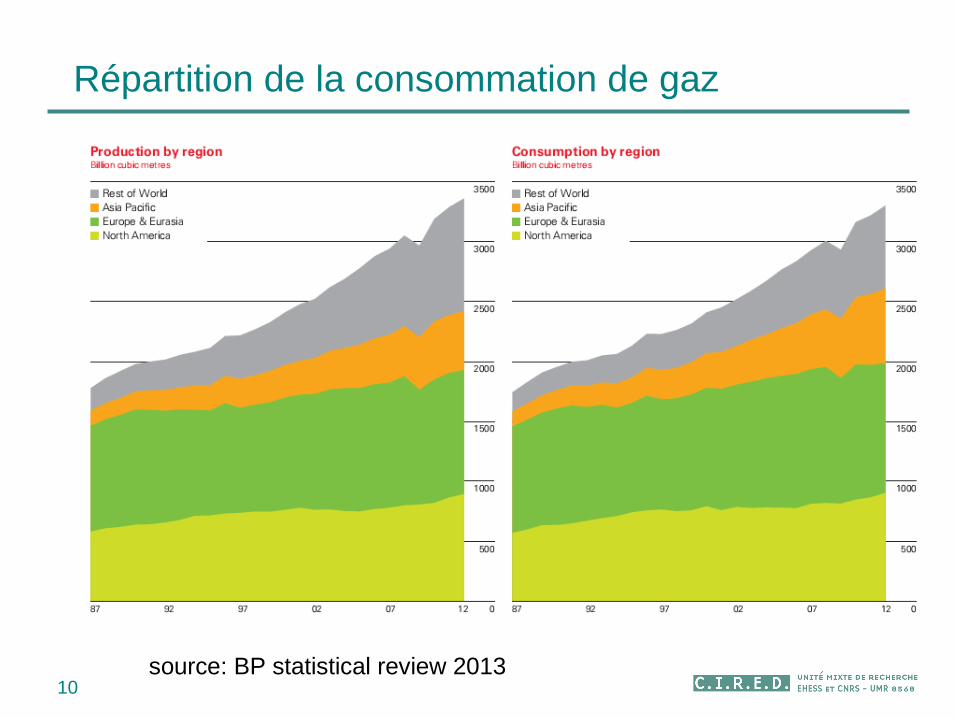
10source: BP statistical review 2013
Répartition de la consommation de gaz

11
Link between gas and oil prices
Strong substitutions but with uncertainties : long-term gas prices elasticity to oil prices :
between 0.14 (Brown and Yücel, 2008) and 0.924 (Asche et al., 2012).
12
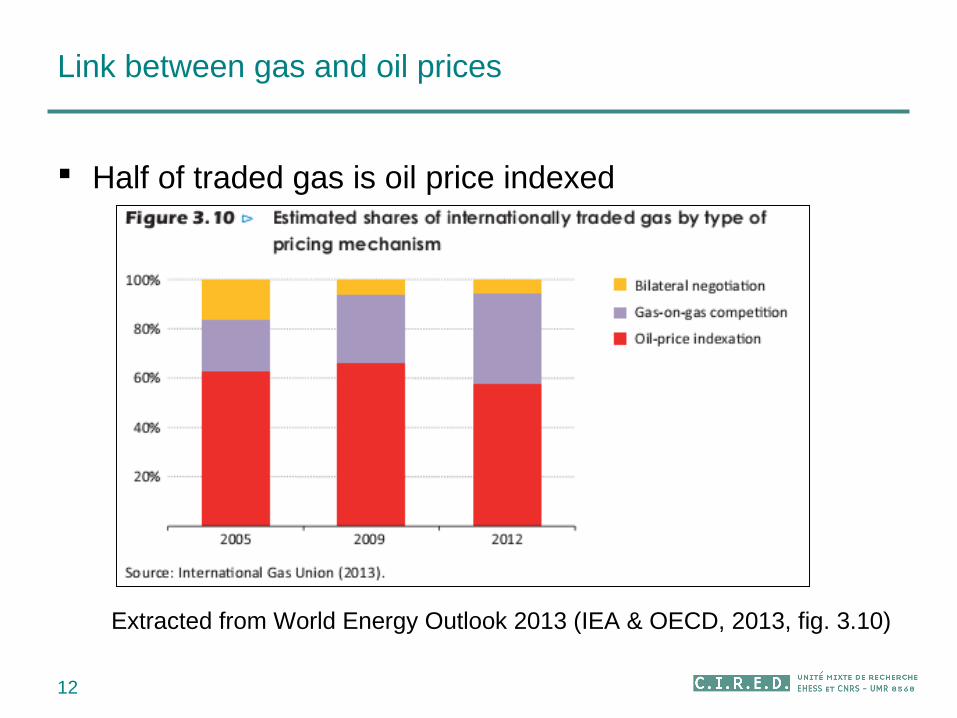
Link between gas and oil prices
Half of traded gas is oil price indexed
Extracted from World Energy Outlook 2013 (IEA & OECD, 2013, fig. 3.10)
13
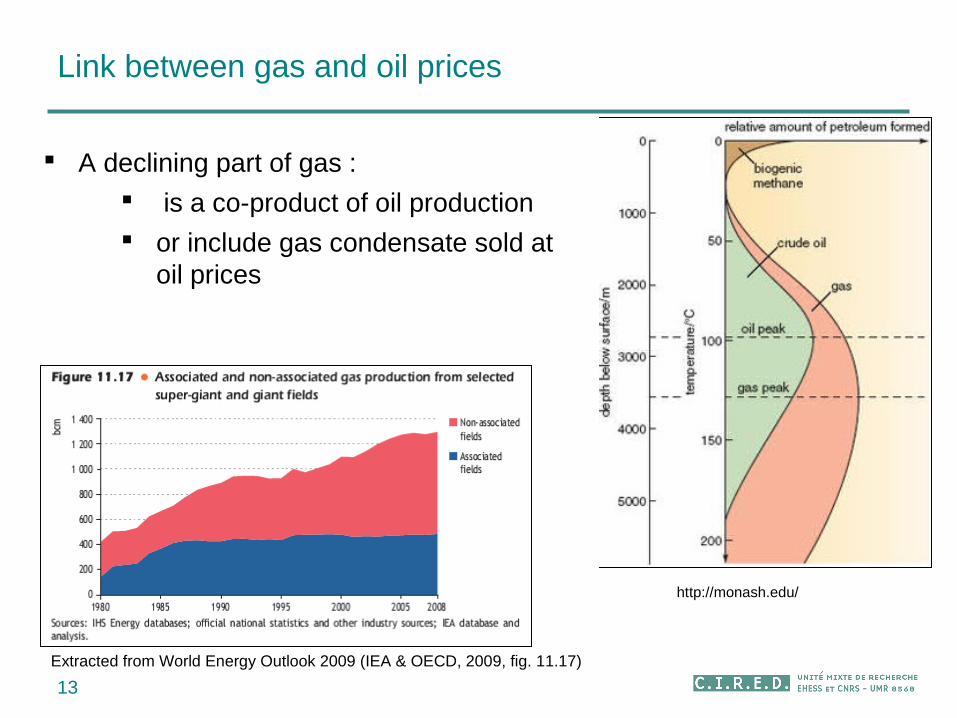
Link between gas and oil prices
A declining part of gas :
is a co-product of oil production
or include gas condensate sold at oil prices
Extracted from World Energy Outlook 2009 (IEA & OECD, 2009, fig. 11.17)
http://monash.edu/
Dynamique d’exploitation du pétrole
et politiques climatiques
14
Citations
« aucune chance pour que l’humanité s’autolimite, à mon avis … Tout ce qui pourra être extrait, transformé, brulé, le sera .. après, on verra »
(commentaire, blog the Oil Man)
15
Citations
« Les hydrocarbures sont bien trop précieux pour qu’ils ne soient pas exploités jusqu’à la dernière goutte de pétrole, au dernier mètre cube de gaz naturel et même à la dernière tonne de charbon économiquement accessibles. »
(Christian Gérondeau, ParisTechReview, 15 octobre 2010)
16
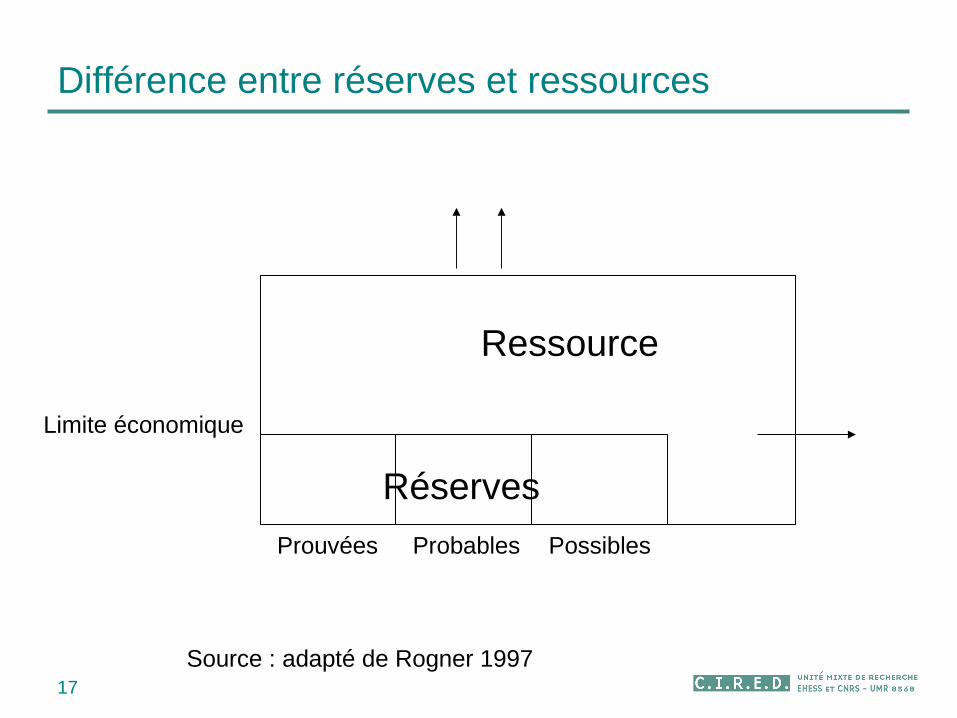
Différence entre réserves et ressources
17
Limite économique
PossiblesProbablesProuvées
Réserves
Source : adapté de Rogner 1997
Ressource
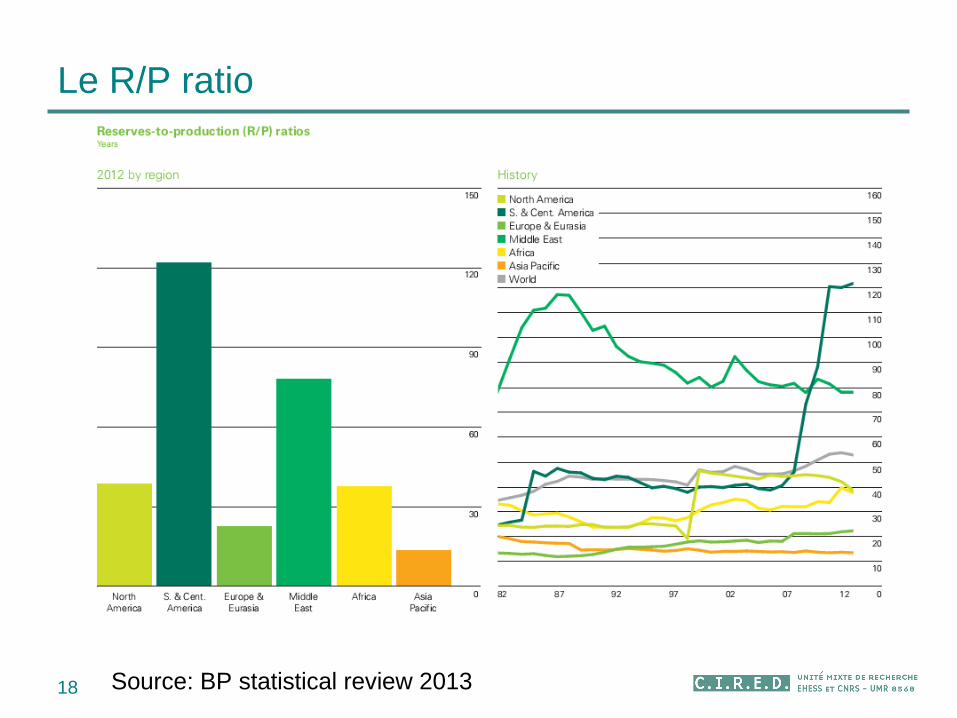
Le R/P ratio
18 Source: BP statistical review 2013
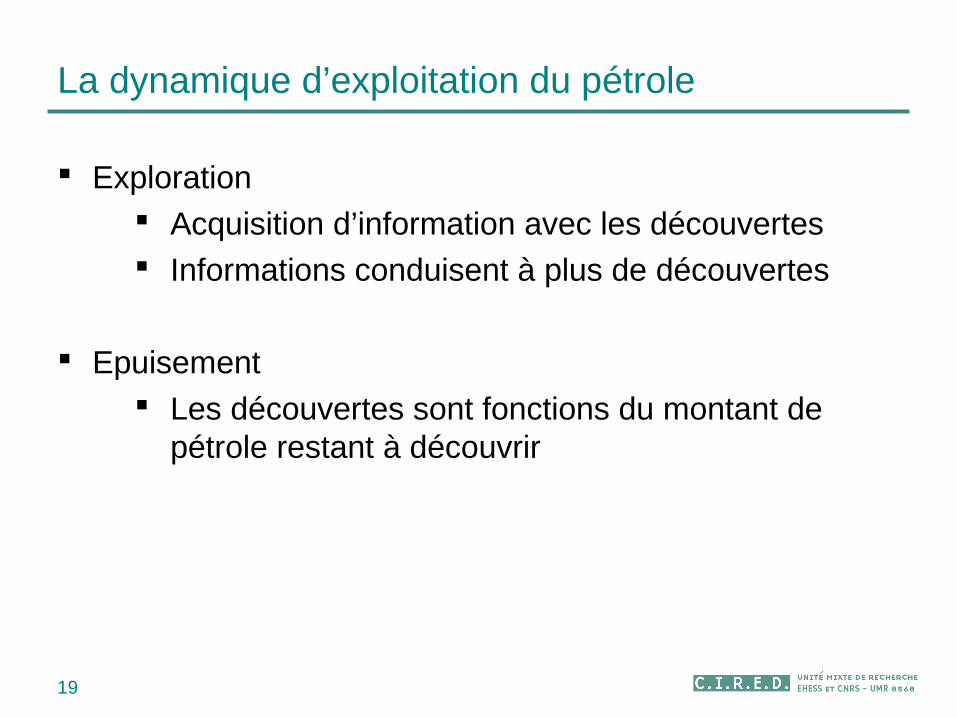
La dynamique d’exploitation du pétrole
19
Exploration Acquisition d’information avec les découvertes Informations conduisent à plus de découvertes
Epuisement Les découvertes sont fonctions du montant de
pétrole restant à découvrir
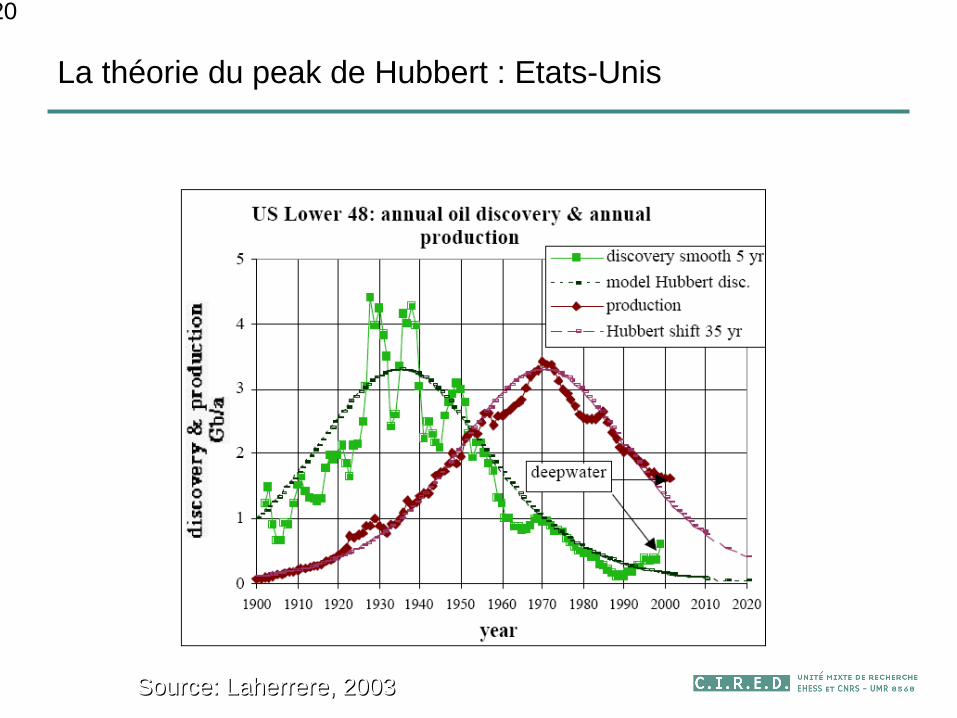
La théorie du peak de Hubbert : Etats-Unis
20
Source: Laherrere, 2003Source: Laherrere, 2003
Oil discoveries shifted 35 years and United States production (without Alaska)
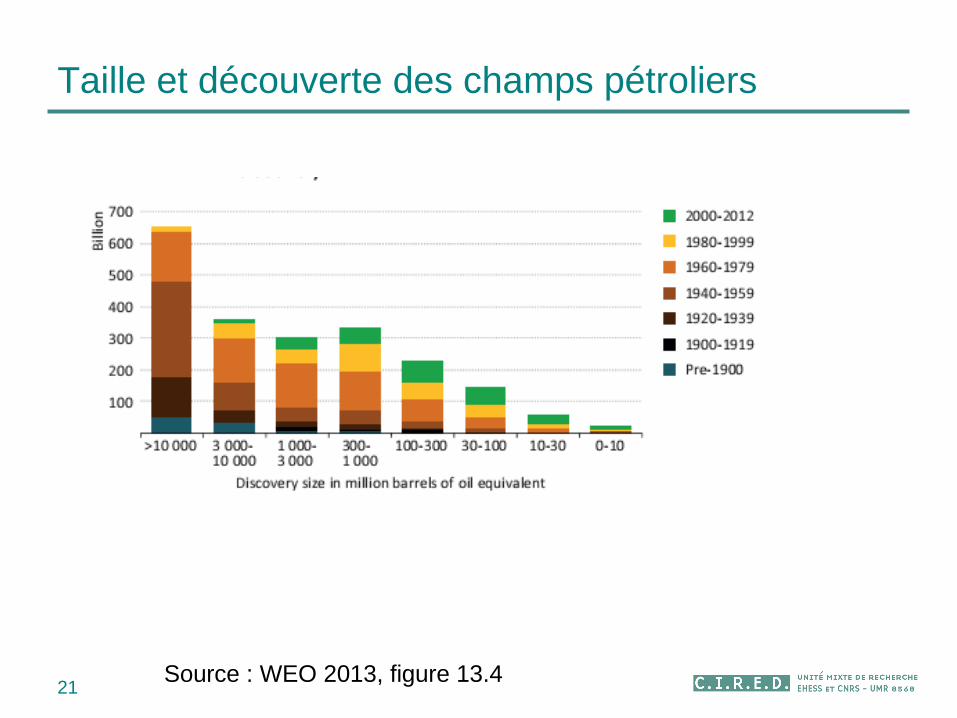
Taille et découverte des champs pétroliers
21Source : WEO 2013, figure 13.4
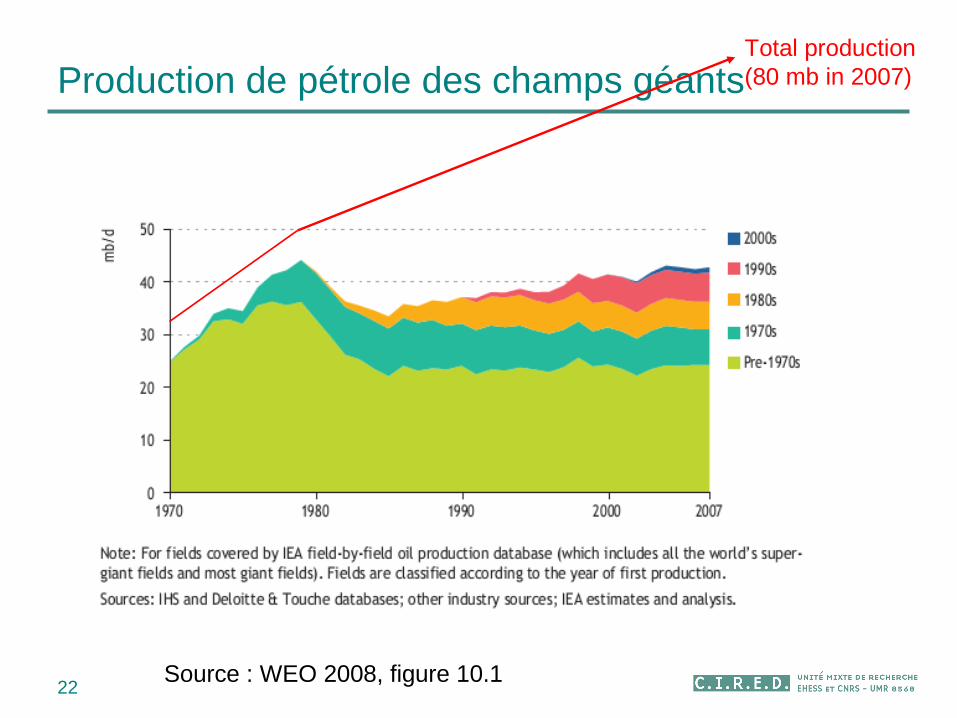
Production de pétrole des champs géants
22Source : WEO 2008, figure 10.1
Total production(80 mb in 2007)
Les courbes de Hubbert
Avantages : Prise en compte des contraintes géologiques
Inconvénients Plus difficilement extrapolable à une échelle
globale
23
Dynamique d’exploitation du pétrole
et politiques climatiques
24
Let’s test the consequences of the three hypothesis
Assessment of the macroeconomic cost of oil scarcity Impact of climate policies
All the following results are obtained with the IMACLIM-R model.
http://www.imaclim.centre-cired.fr/
25
26
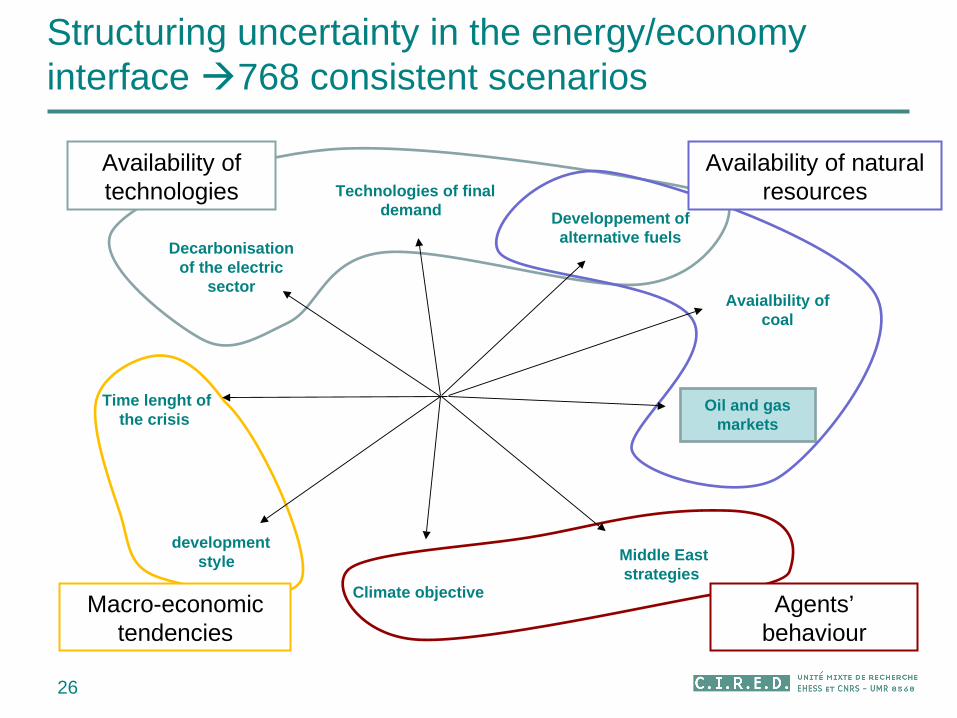
Availability of technologies
Availability of natural resources
Agents’ behaviour
Macro-economictendencies
Avaialbility of coal
Climate objective
Technologies of final demand Developpement of
alternative fuels
Oil and gas markets
developmentstyle Middle East
strategies
Time lenght of the crisis
Decarbonisation of the electric
sector
Structuring uncertainty in the energy/economy interface 768 consistent scenarios
27
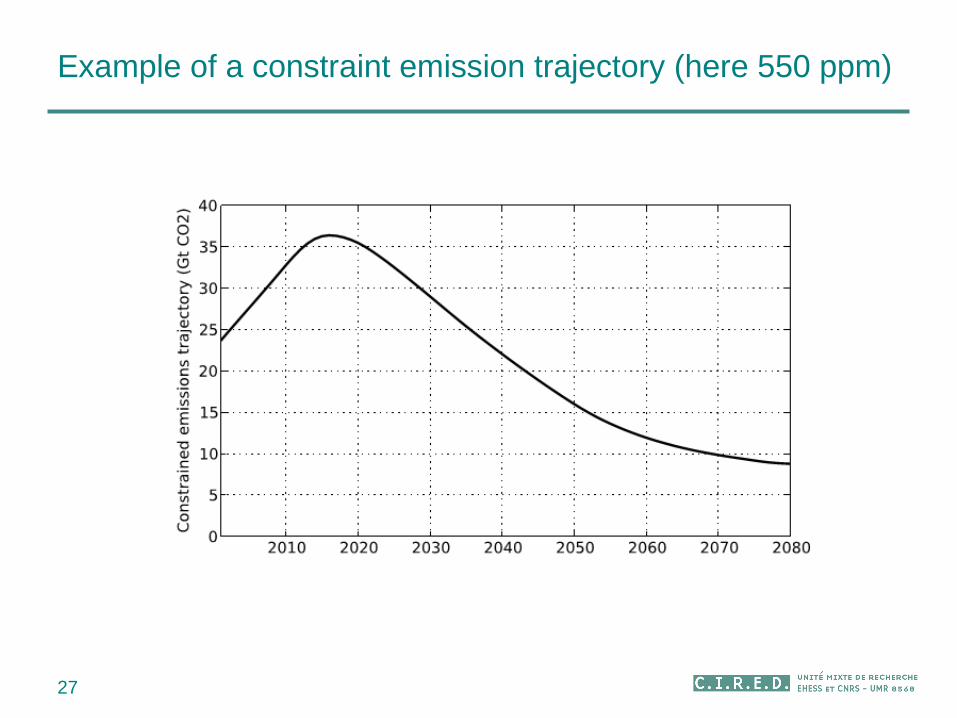
Example of a constraint emission trajectory (here 550 ppm)
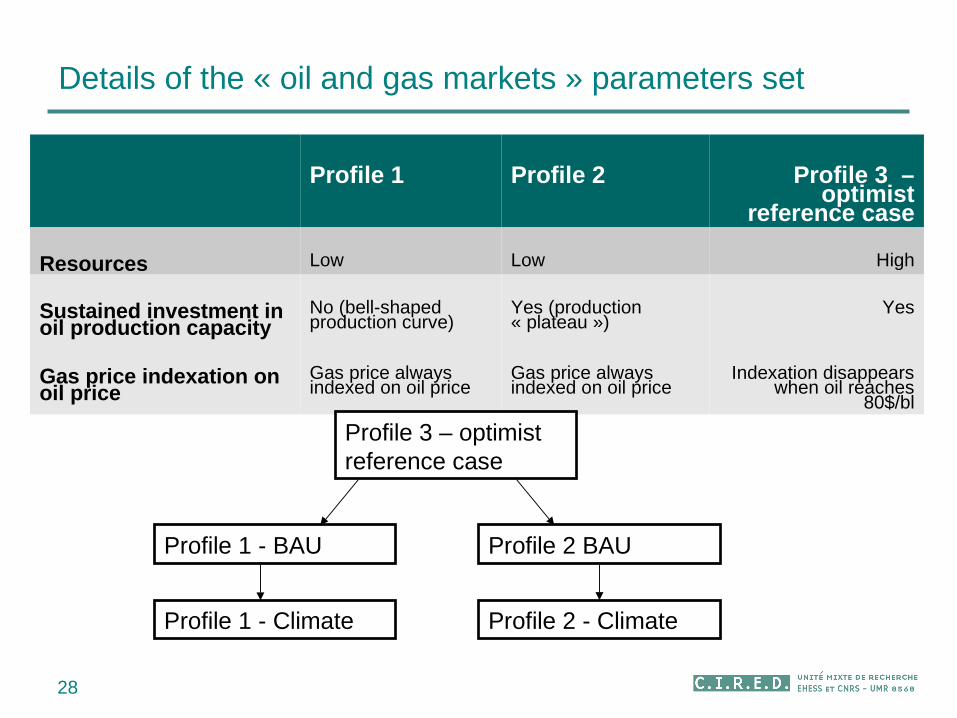
Details of the « oil and gas markets » parameters set
28
Profile 1 Profile 2 Profile 3 – optimist
reference case
Resources Low Low High
Sustained investment in oil production capacity
No (bell-shaped production curve)
Yes (production « plateau »)
Yes
Gas price indexation on oil price
Gas price always indexed on oil price
Gas price always indexed on oil price
Indexation disappears when oil reaches
80$/bl
Profile 3 – optimist reference case
Profile 1 - BAU Profile 2 BAU
Profile 1 - Climate Profile 2 - Climate
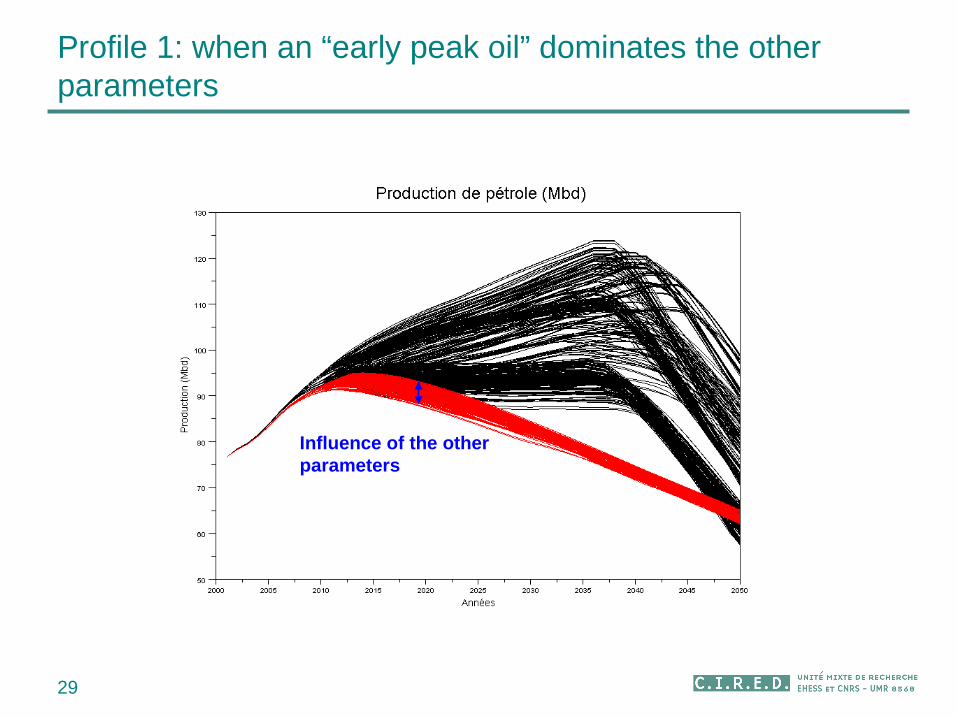
Influence of the other parameters
29
Profile 1: when an “early peak oil” dominates the other parameters
30
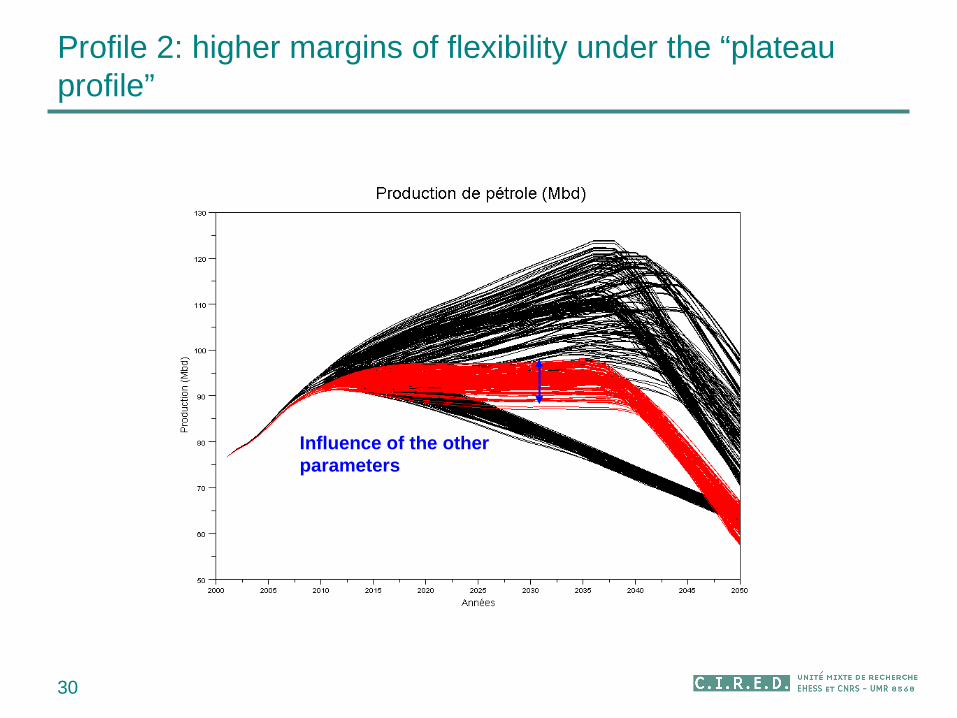
Influence of the other parameters
Profile 2: higher margins of flexibility under the “plateau profile”
31
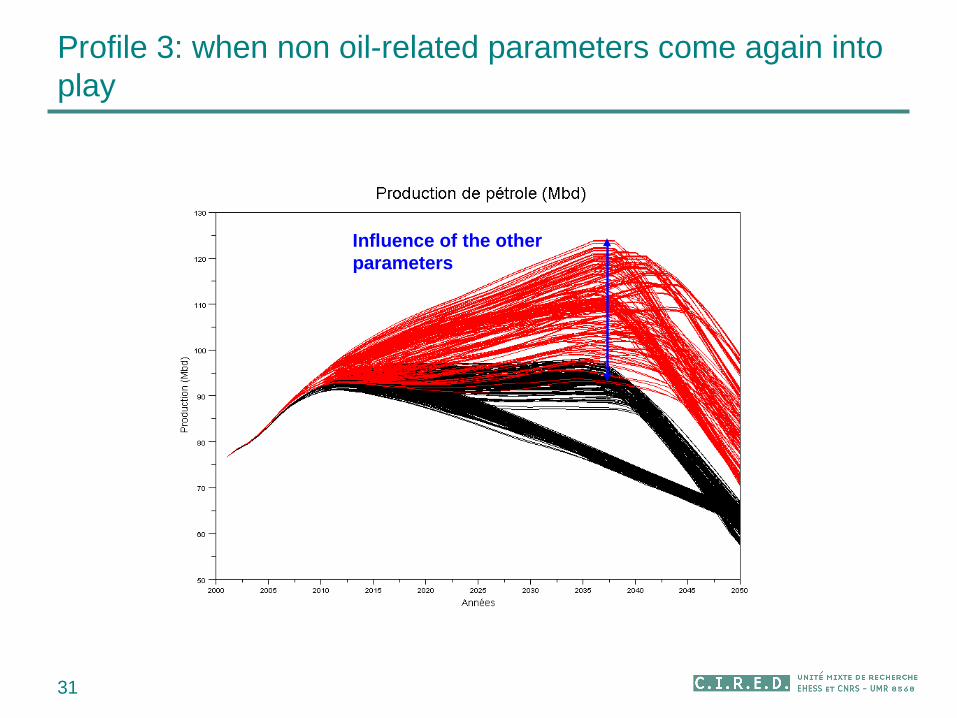
Influence of the other parameters
Profile 3: when non oil-related parameters come again into play
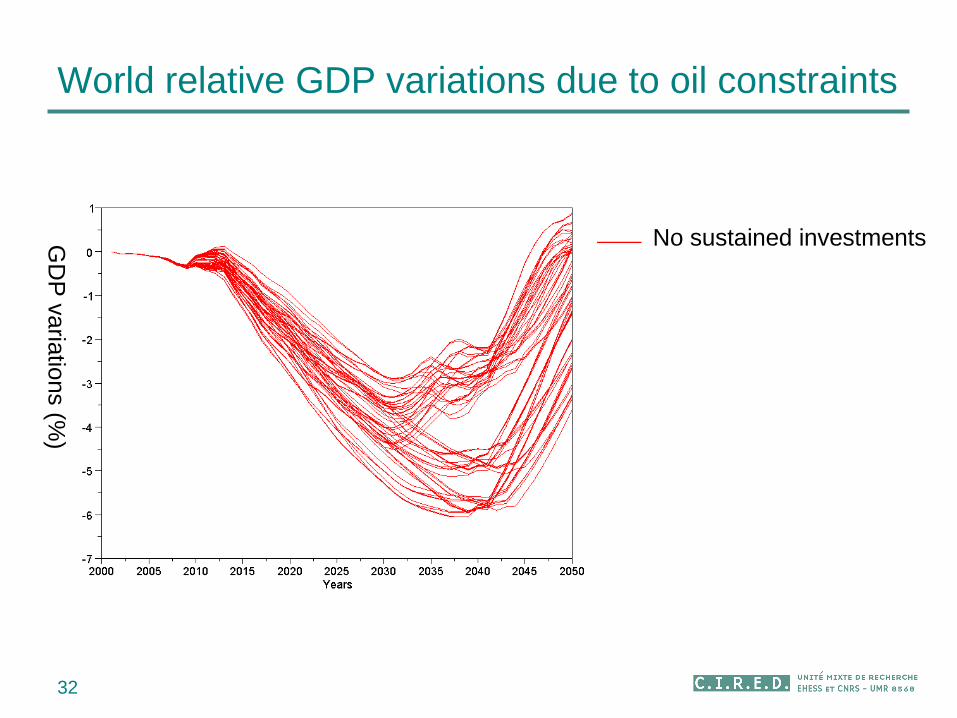
World relative GDP variations due to oil constraints
32
No sustained investmentsGD
P variations (%
)
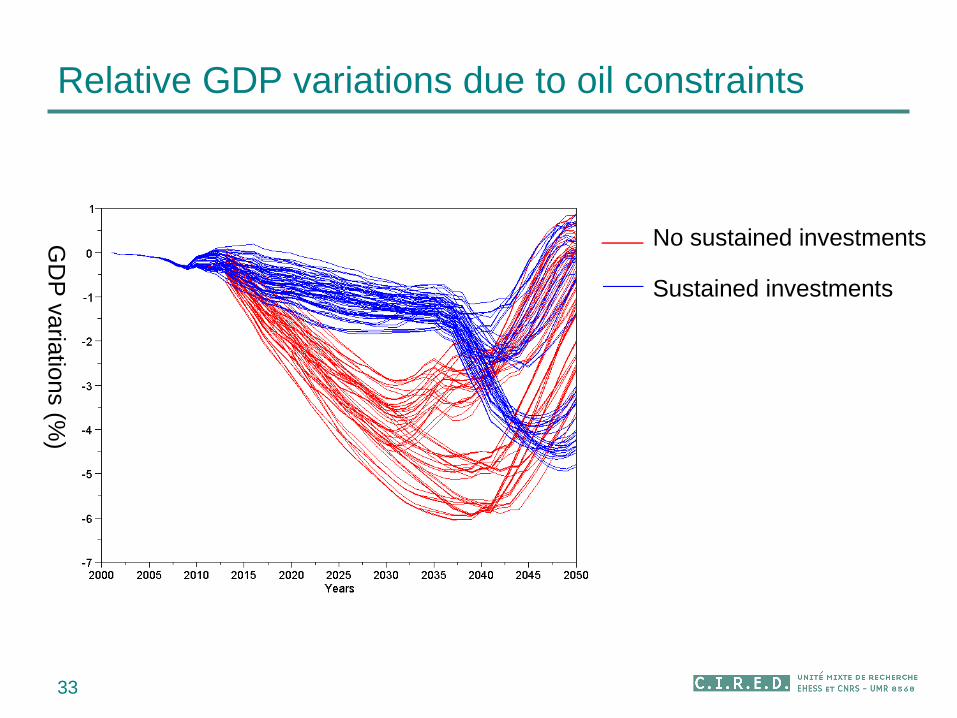
Relative GDP variations due to oil constraints
33
No sustained investmentsGD
P variations (%
)
Sustained investments
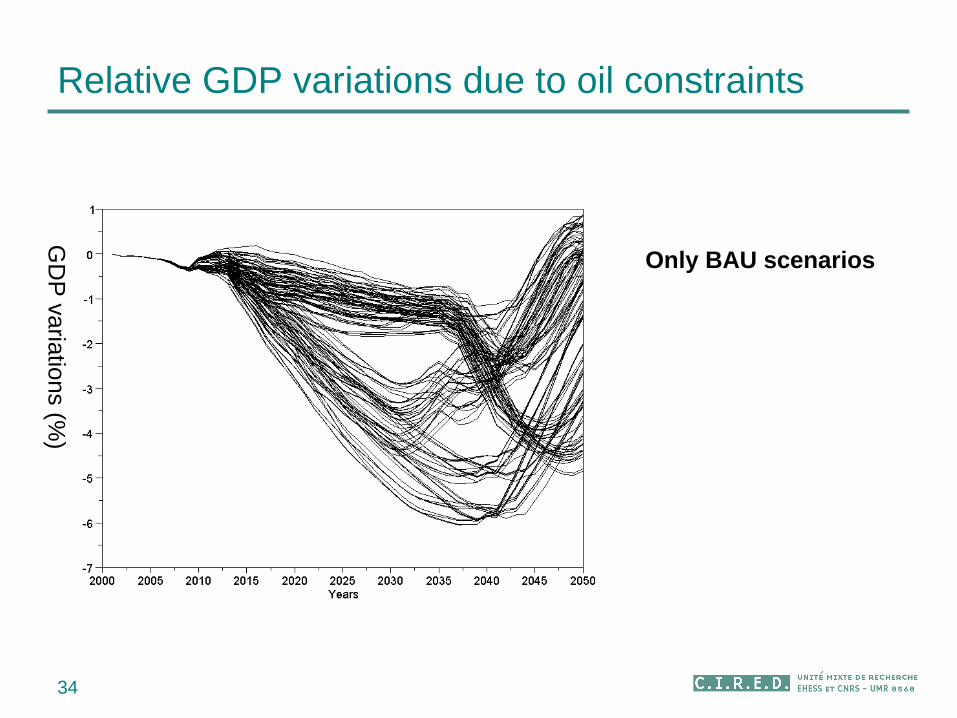
Relative GDP variations due to oil constraints
34
GD
P variations (%
)
Only BAU scenarios
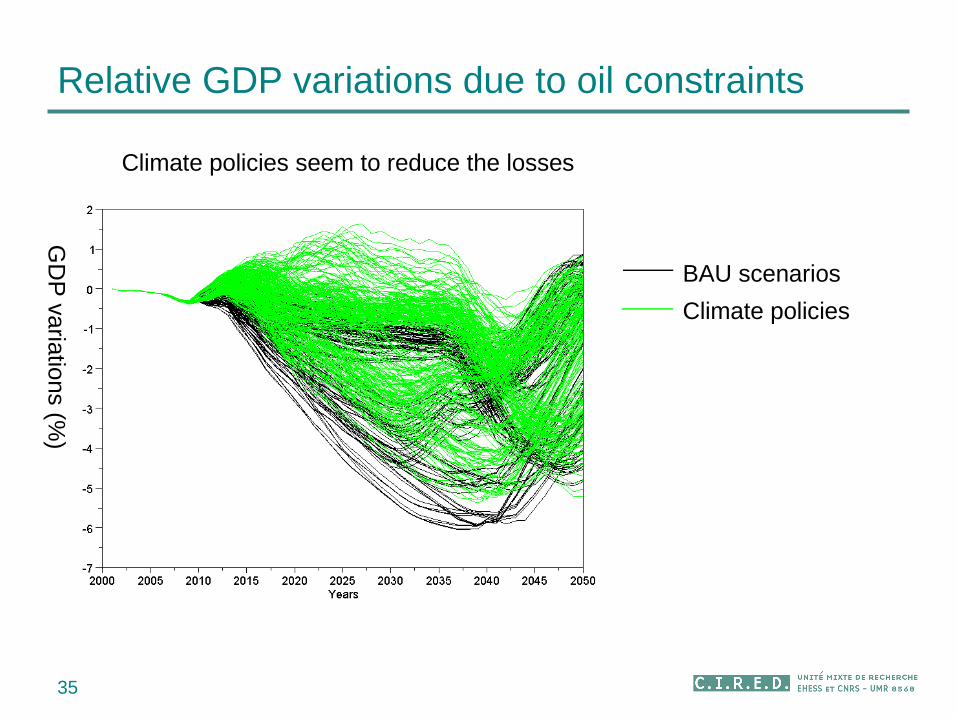
Relative GDP variations due to oil constraints
35
BAU scenarios
GD
P variations (%
)
Climate policies
Climate policies seem to reduce the losses

World GDP relative losses (2010-2050) due to oil tensions w/wo climate policies: an informative histogram
36
Black : BAU (no climate policies)
Blue : climate policies to reach a +3°K target
Mean reduction: 8 000 G$
Co-benefit of climate policies : hedge against oil tensions
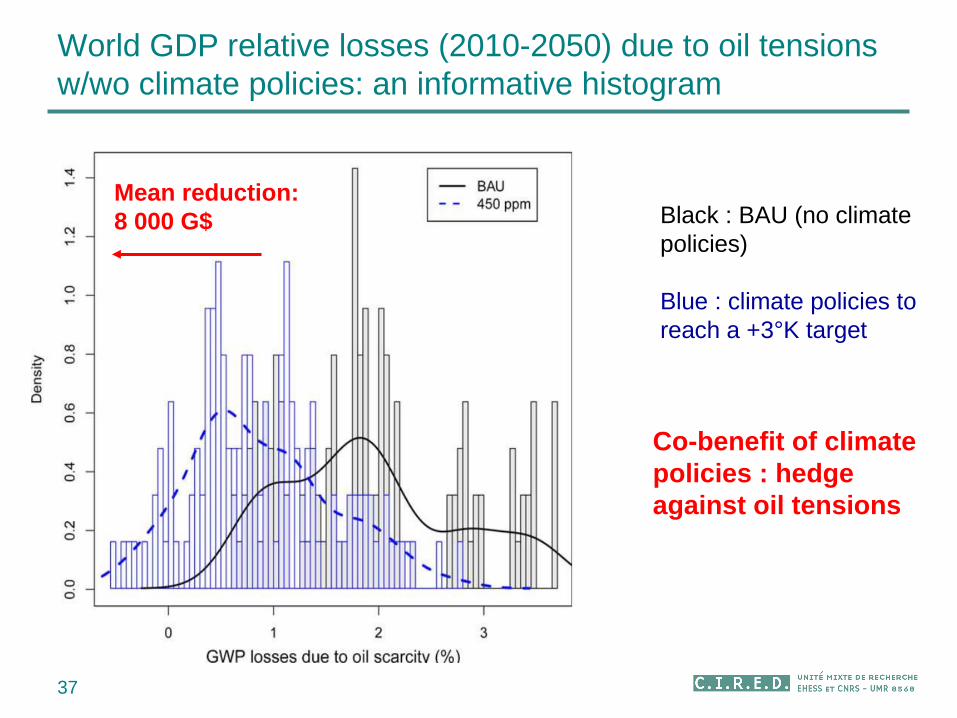
World GDP relative losses (2010-2050) due to oil tensions w/wo climate policies: an informative histogram
37
Black : BAU (no climate policies)
Blue : climate policies to reach a +3°K target
Mean reduction: 8 000 G$
Co-benefit of climate policies : hedge against oil tensions
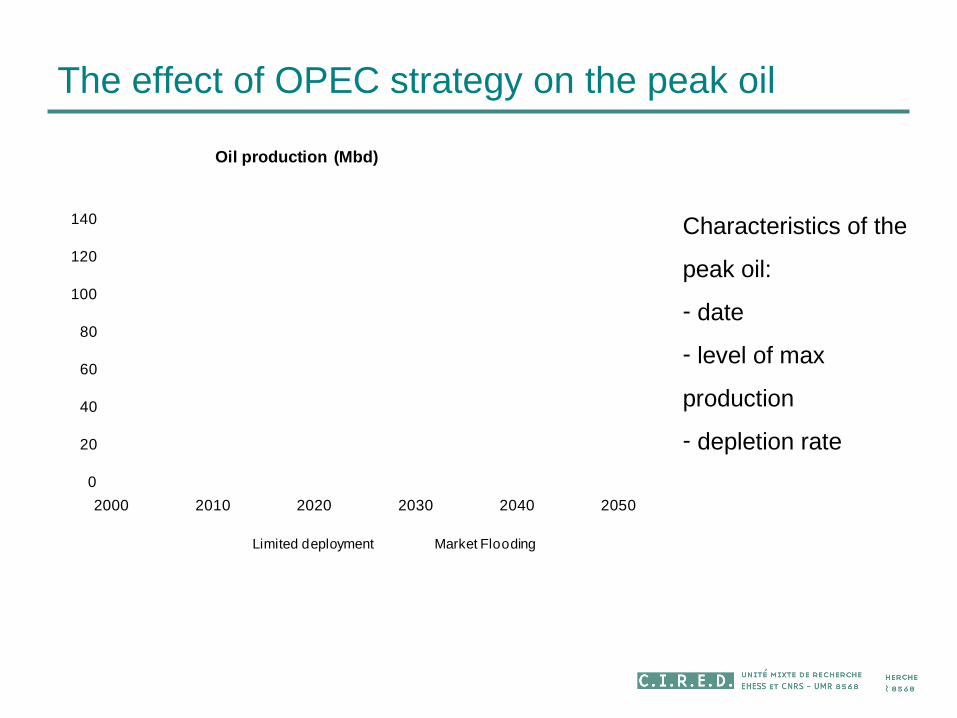
The effect of OPEC strategy on the peak oil
0
20
40
60
80
100
120
140
2000 2010 2020 2030 2040 2050
Oil production (Mbd)
Limited deployment Market Flooding
Characteristics of the
peak oil:
- date
- level of max
production
- depletion rate
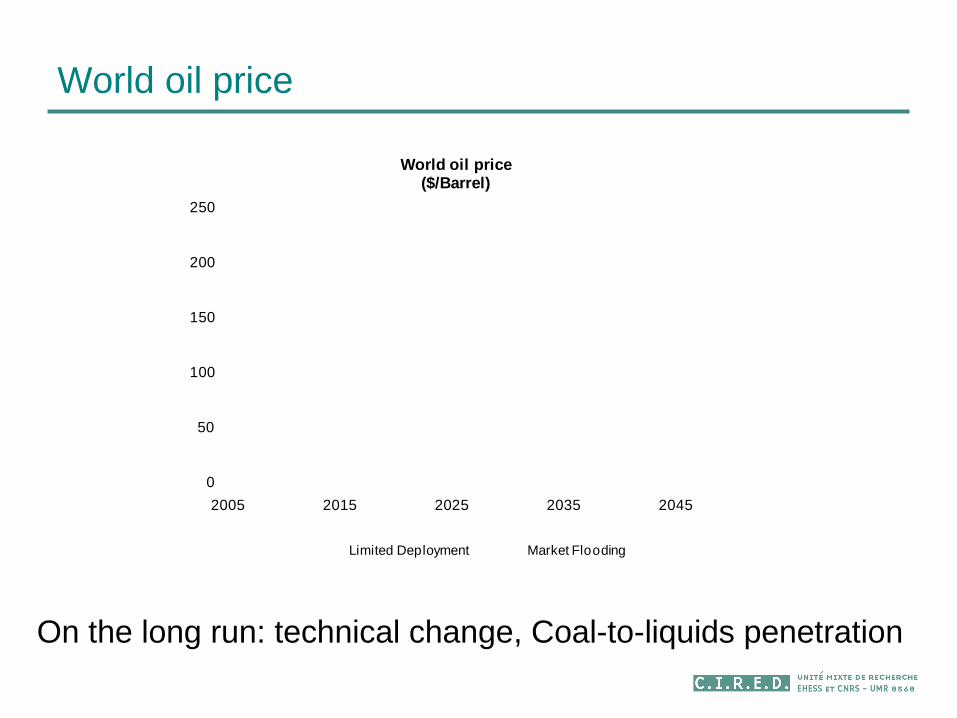
World oil price
On the long run: technical change, Coal-to-liquids penetration
0
50
100
150
200
250
2005 2015 2025 2035 2045
World oil price ($/Barrel)
Limited Deployment Market Flooding
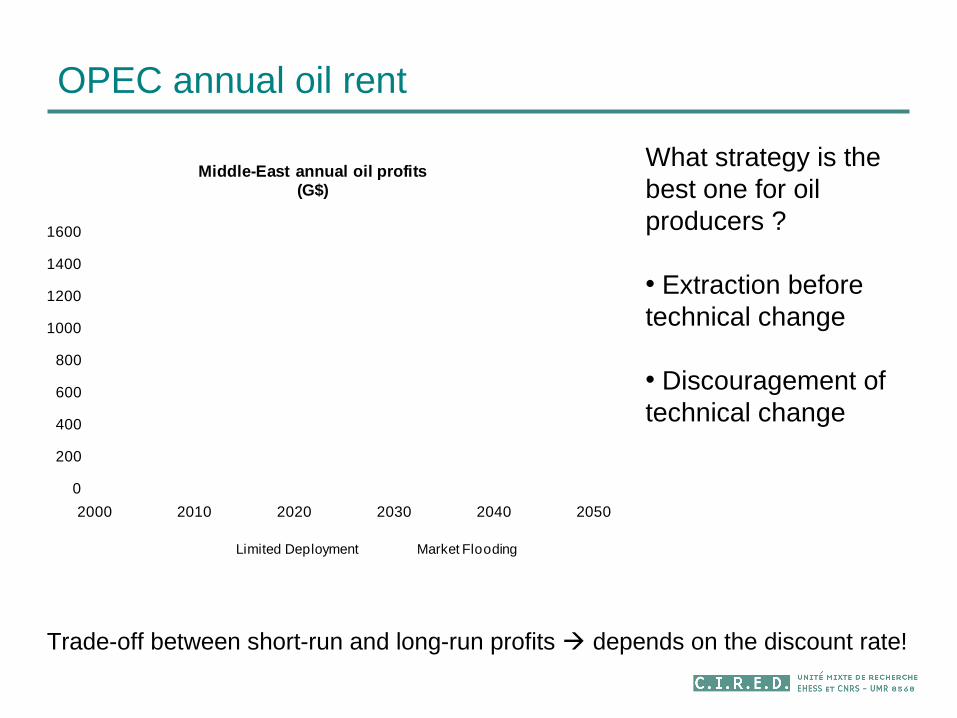
OPEC annual oil rent
Trade-off between short-run and long-run profits depends on the discount rate!
What strategy is the best one for oil producers ?
• Extraction before technical change
• Discouragement of technical change
0
200
400
600
800
1000
1200
1400
1600
2000 2010 2020 2030 2040 2050
Middle-East annual oil profits(G$)
Limited Deployment Market Flooding
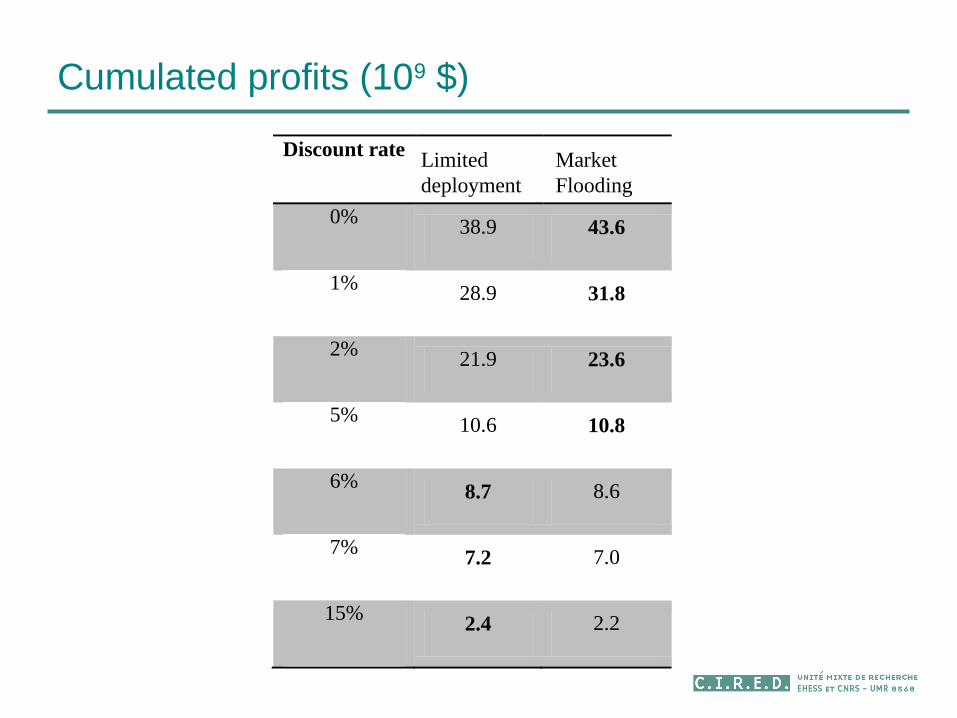
Cumulated profits (109 $)
Discount rate CS scenario CE scenario
0% 38.9 43.6
1% 28.9 31.8
2% 21.9 23.6
5% 10.6 10.8
6% 8.7 8.6
7% 7.2 7.0
15% 2.4 2.2
1
Limited deployment
Market Flooding
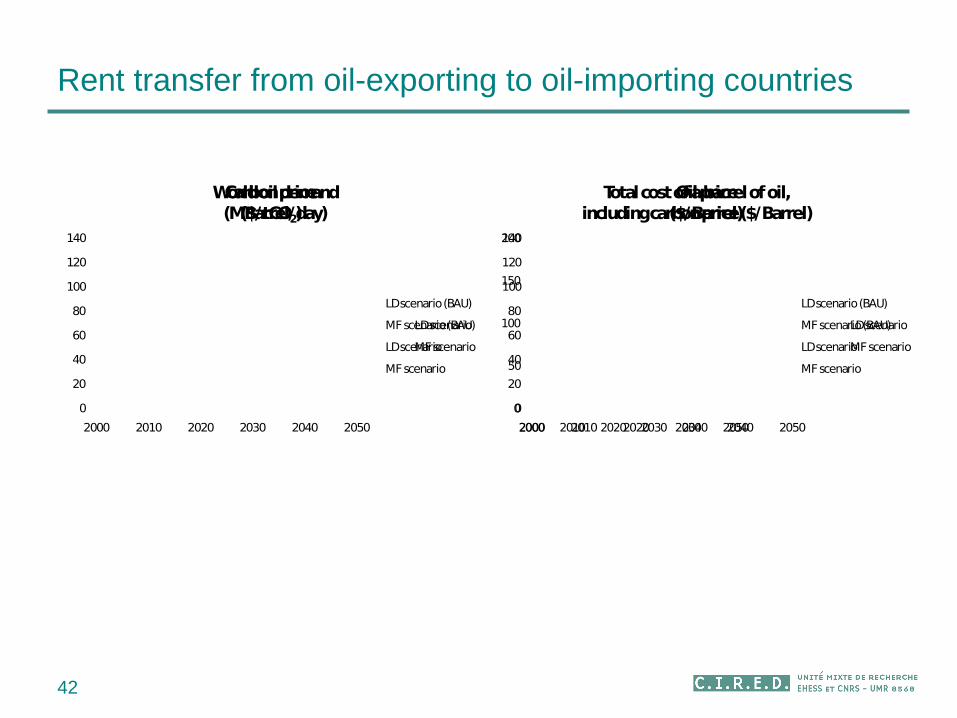
Rent transfer from oil-exporting to oil-importing countries
42
0
20
40
60
80
100
120
140
2000 2010 2020 2030 2040 2050
Carbon price($/tCO2)
LD scenario
MF scenario
0
20
40
60
80
100
120
140
2000 2010 2020 2030 2040 2050
Oil price($/Barrel)
LD scenario
MF scenario
0
50
100
150
200
2000 2010 2020 2030 2040 2050
Total cost of a barrel of oil,including carbon price ($/Barrel)
LD scenario (BAU)
MF scenario (BAU)
LD scenario
MF scenario
0
20
40
60
80
100
120
2000 2010 2020 2030 2040 2050
World oil demand(MBarrel/day)
LD scenario (BAU)
MF scenario (BAU)
LD scenario
MF scenario
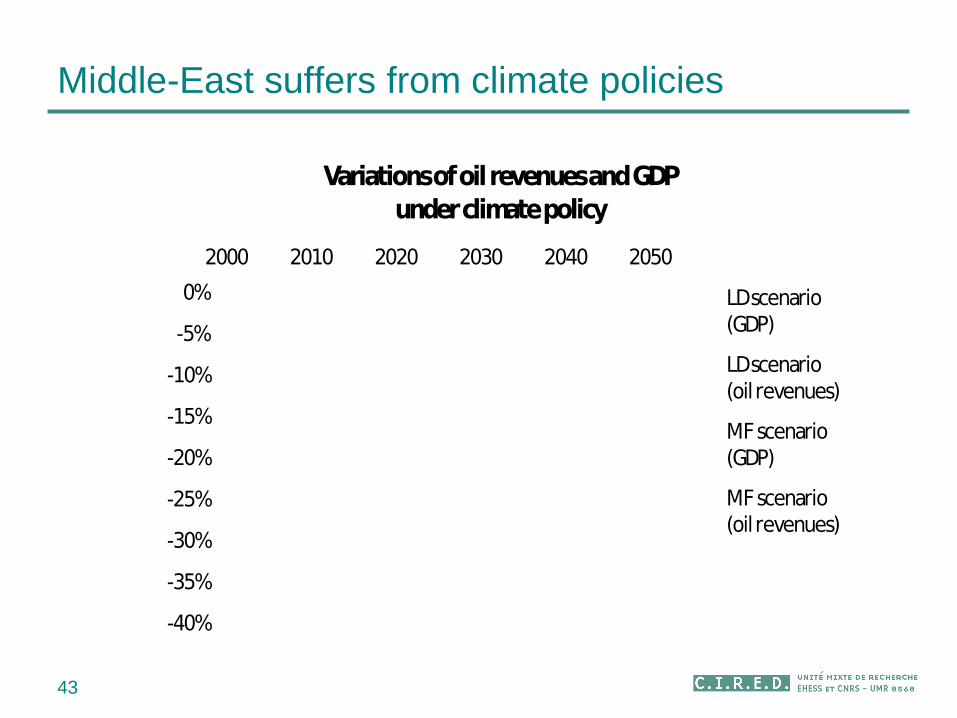
Middle-East suffers from climate policies
43
-40%
-35%
-30%
-25%
-20%
-15%
-10%
-5%
0%
2000 2010 2020 2030 2040 2050
Variations of oil revenues and GDP under climate policy
LD scenario (GDP)
LD scenario (oil revenues)
MF scenario (GDP)
MF scenario (oil revenues)
Les nouveaux hydrocarbures non-conventionnels
44
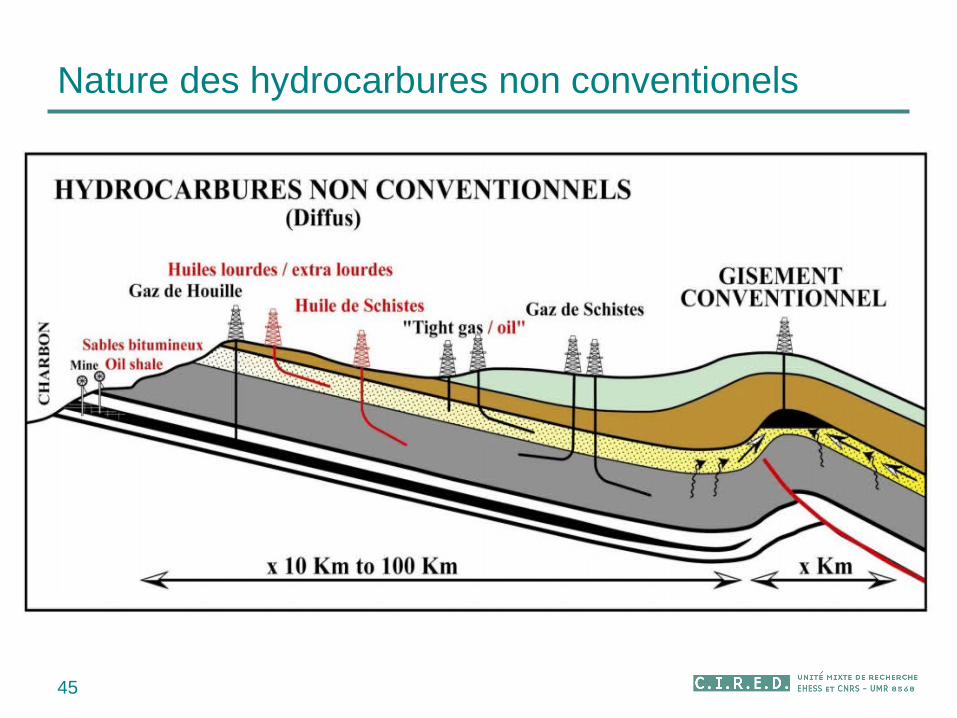
Nature des hydrocarbures non conventionels
45
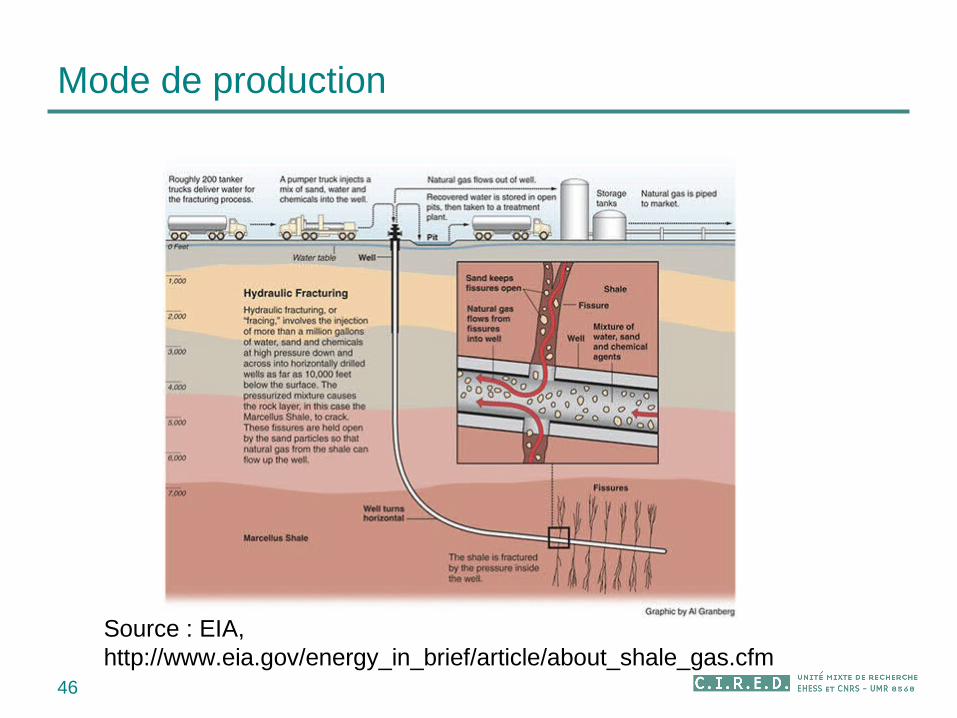
Mode de production
46
Source : EIA, http://www.eia.gov/energy_in_brief/article/about_shale_gas.cfm
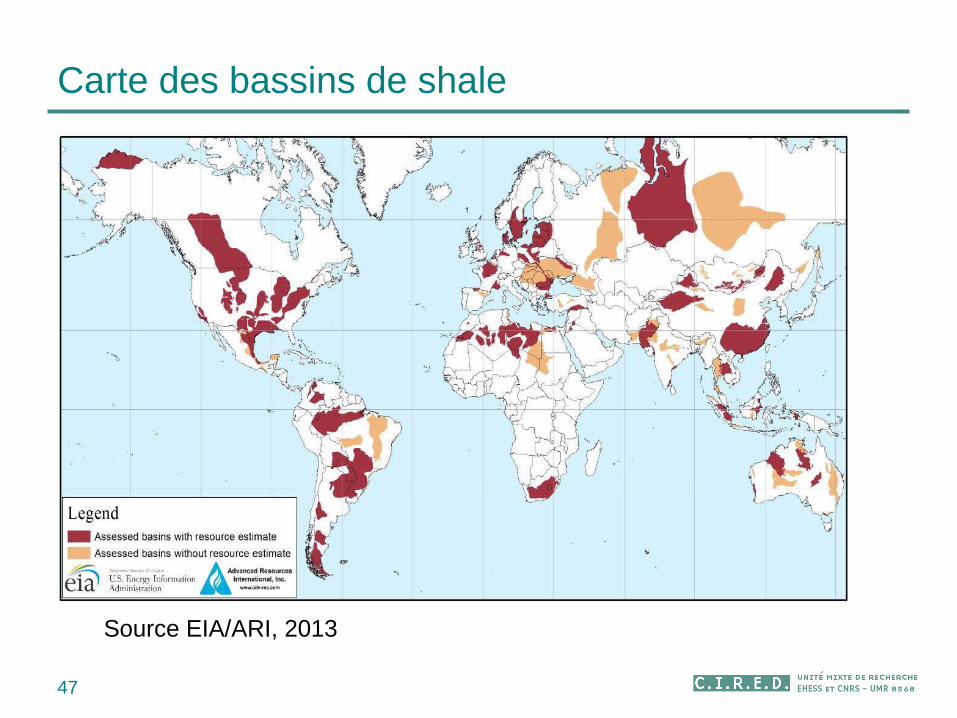
Carte des bassins de shale
47
Source EIA/ARI, 2013
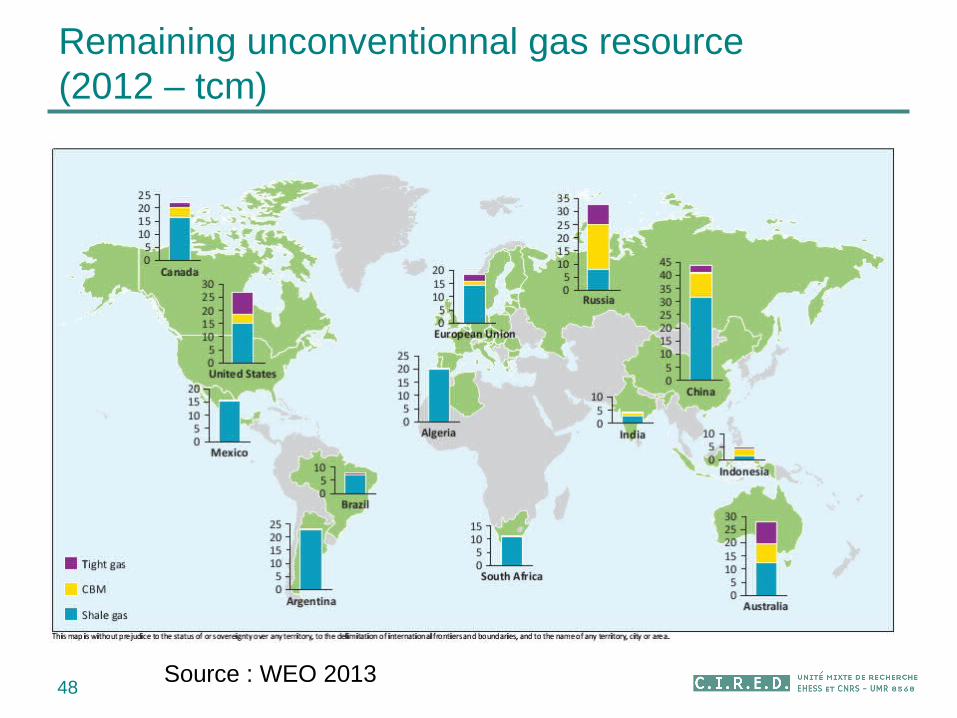
Remaining unconventionnal gas resource (2012 – tcm)
48Source : WEO 2013
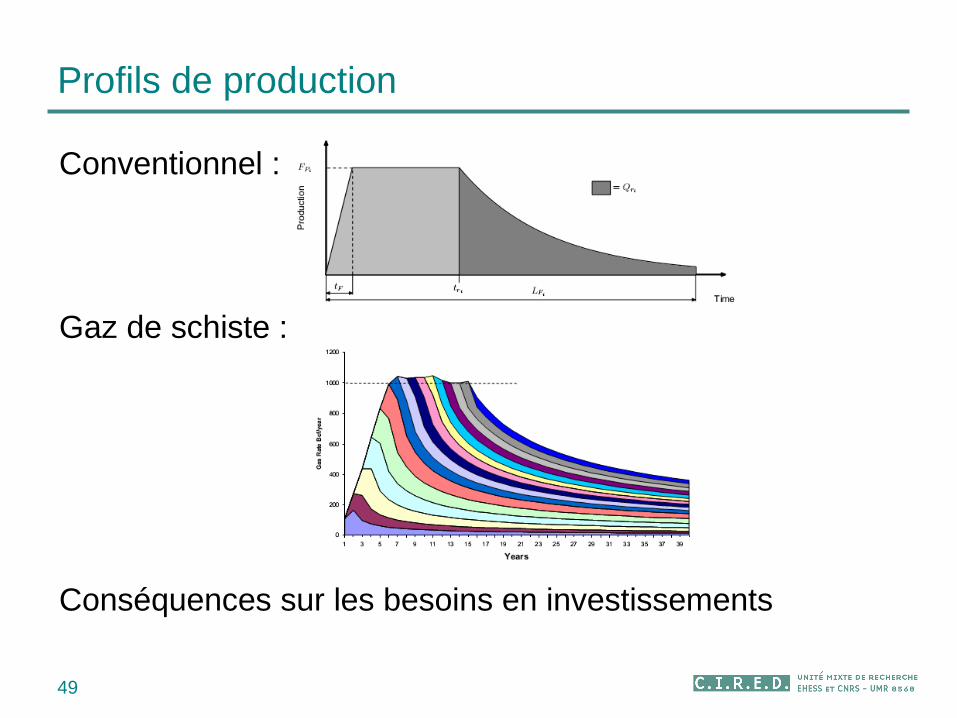
Profils de production
49
Conventionnel :
Gaz de schiste :
Conséquences sur les besoins en investissements
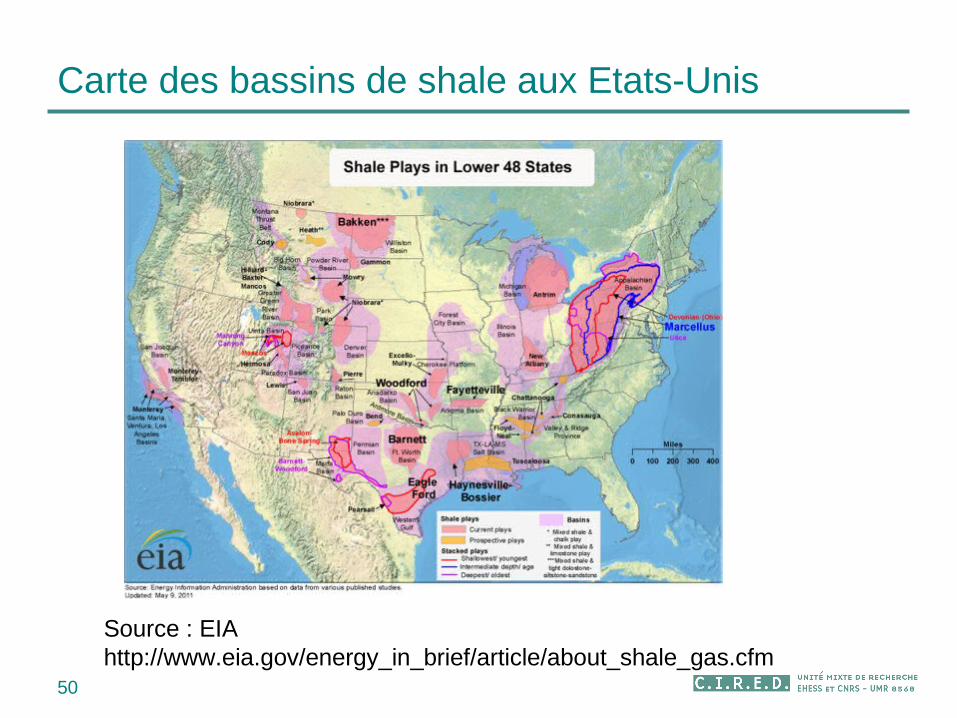
Carte des bassins de shale aux Etats-Unis
50
Source : EIA http://www.eia.gov/energy_in_brief/article/about_shale_gas.cfm
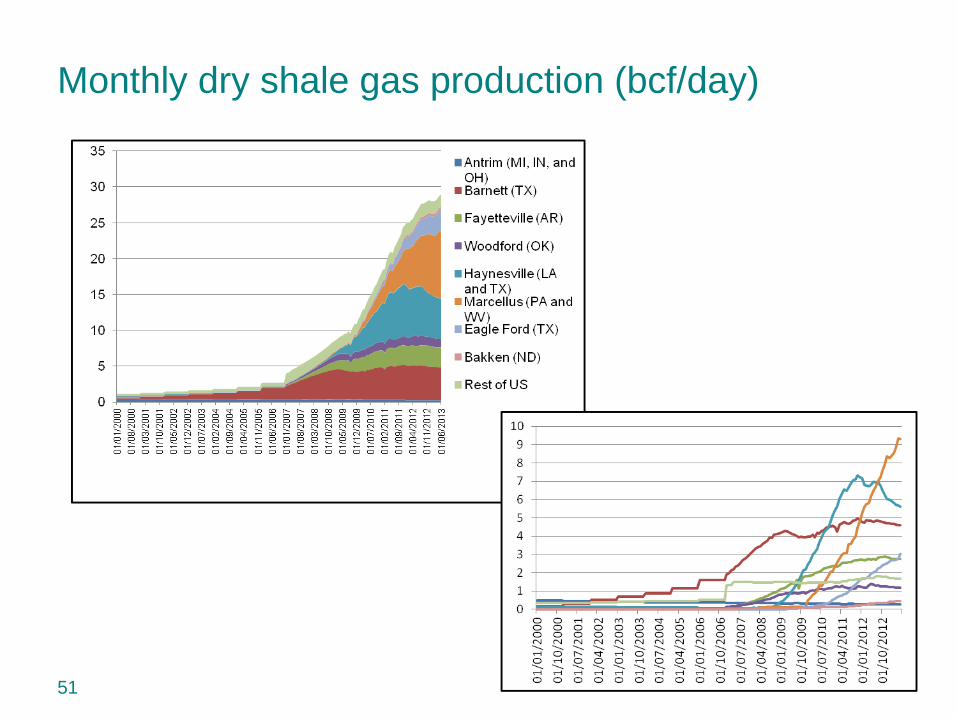
Monthly dry shale gas production (bcf/day)
51
52
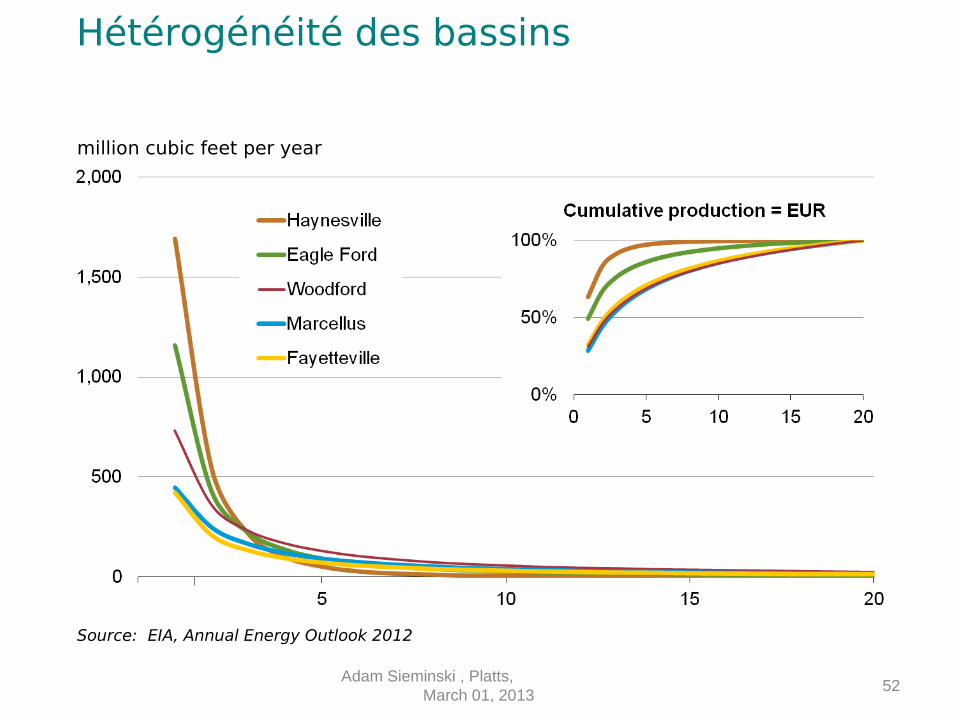
million cubic feet per year
Source: EIA, Annual Energy Outlook 2012
1
Adam Sieminski , Platts, March 01, 2013
Hétérogénéité des bassins
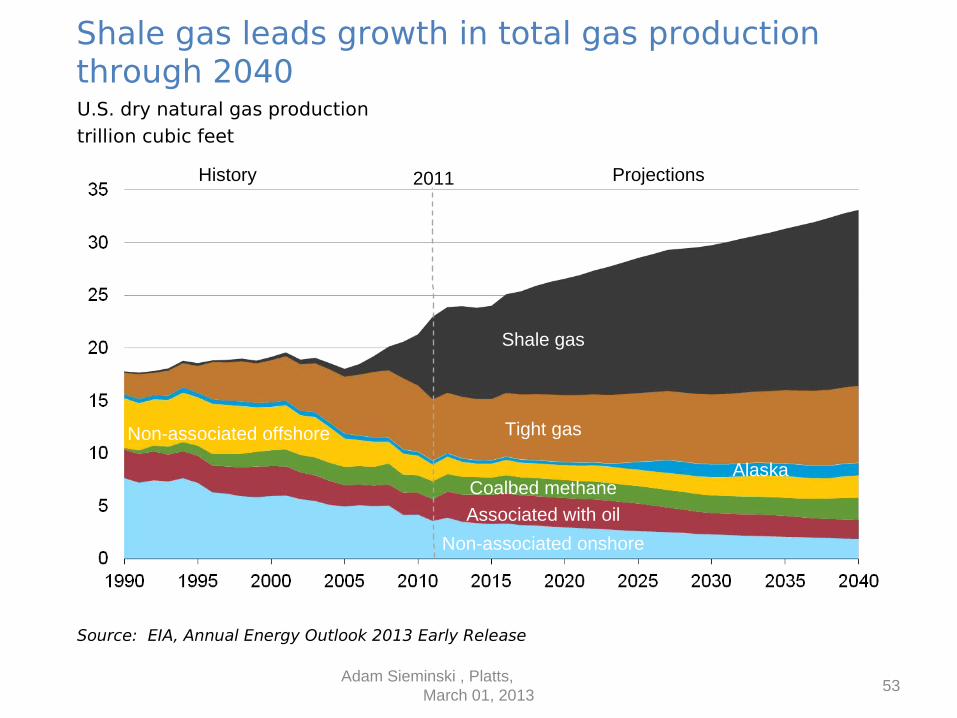
Shale gas leads growth in total gas production through 2040
53
U.S. dry natural gas productiontrillion cubic feet
Source: EIA, Annual Energy Outlook 2013 Early Release
Associated with oil
Coalbed methane
Tight gas
Shale gas
Alaska
Non-associated onshore
Non-associated offshore
ProjectionsHistory 2011
Adam Sieminski , Platts, March 01, 2013
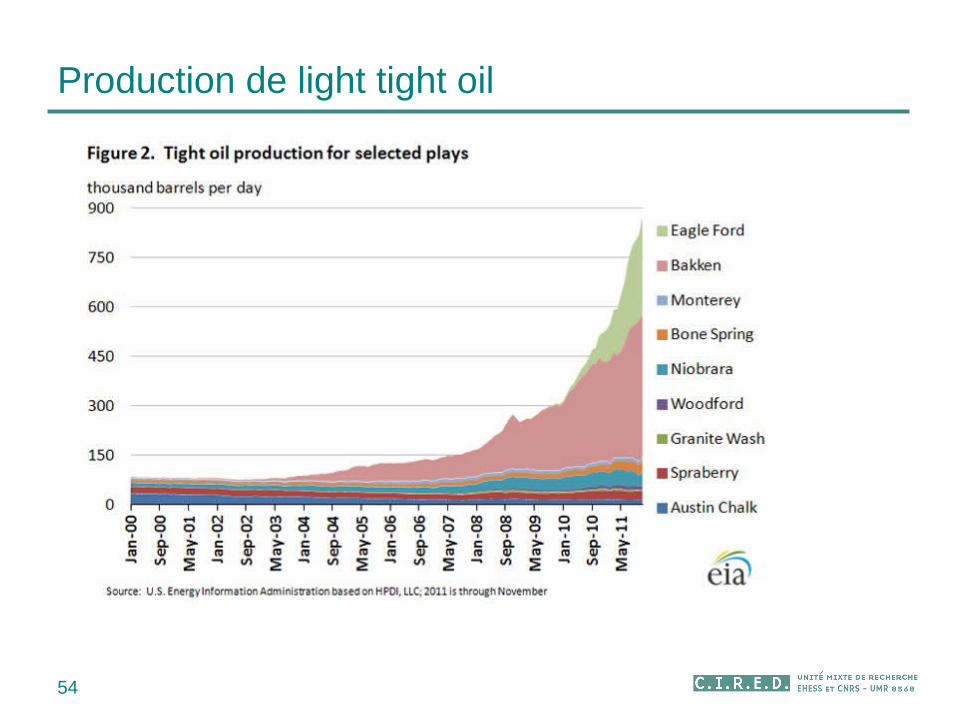
Production de light tight oil
54
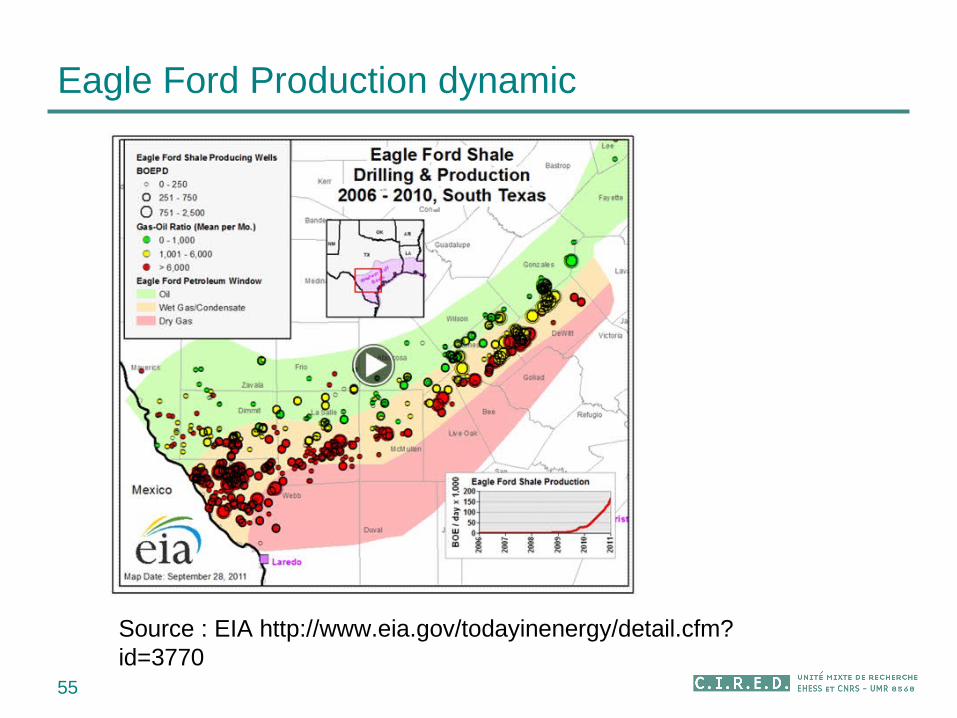
Eagle Ford Production dynamic
55
Source : EIA http://www.eia.gov/todayinenergy/detail.cfm?id=3770
56
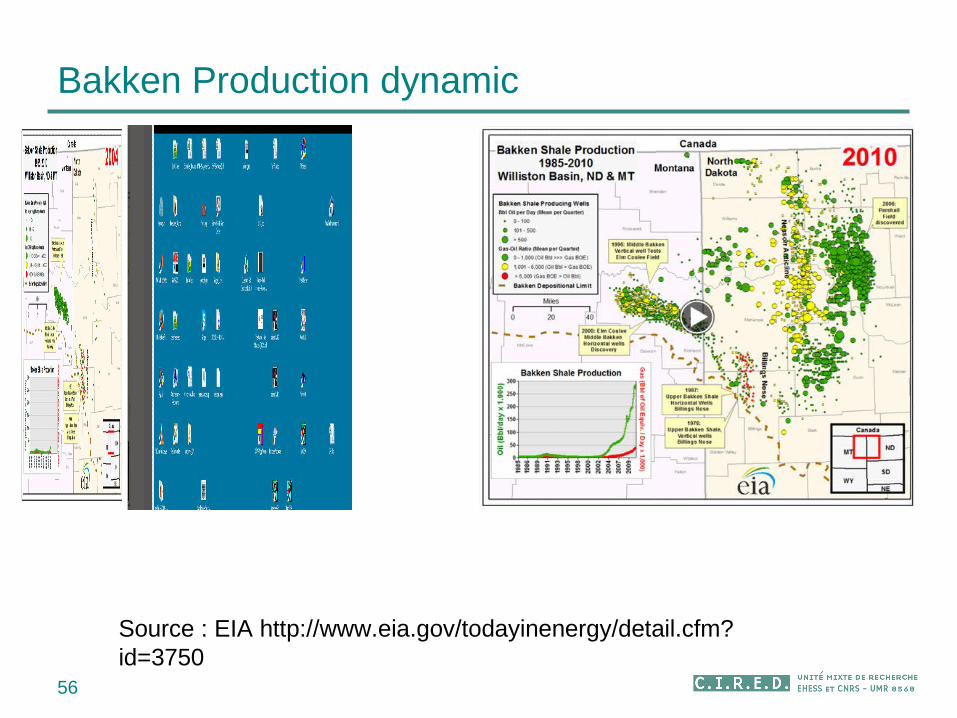
Source : EIA http://www.eia.gov/todayinenergy/detail.cfm?id=3750
Bakken Production dynamic
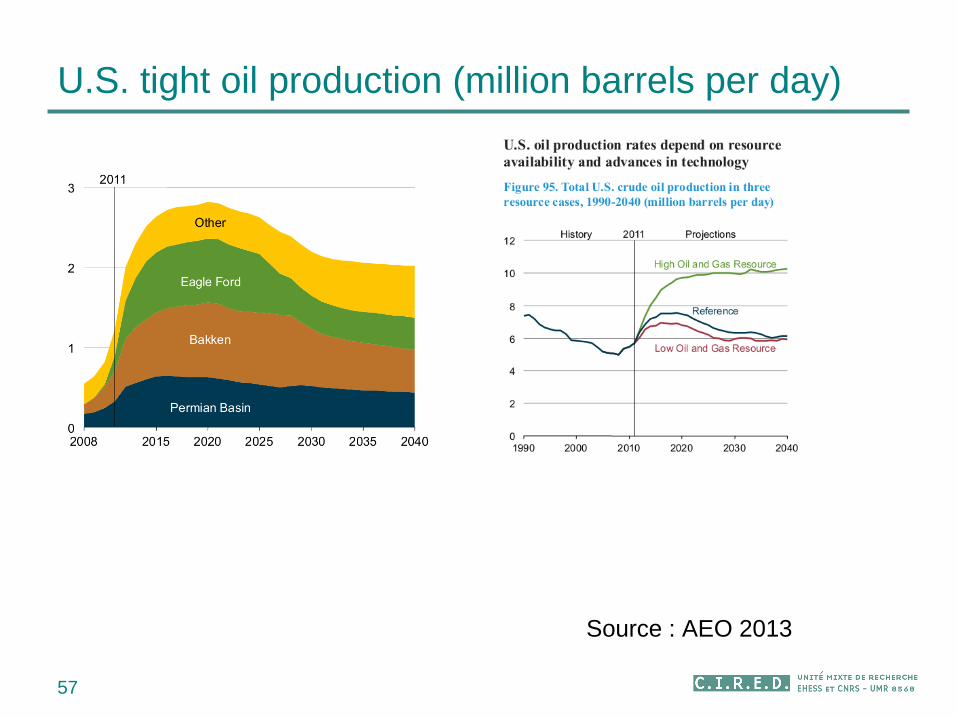
U.S. tight oil production (million barrels per day)
57
Source : AEO 2013
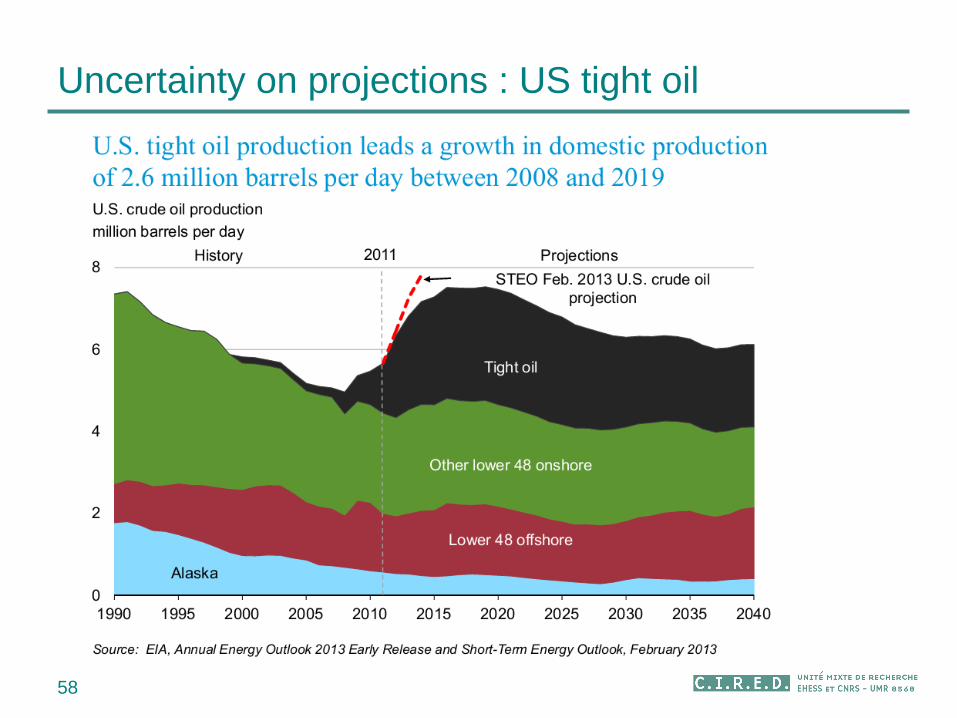
Uncertainty on projections : US tight oil
58
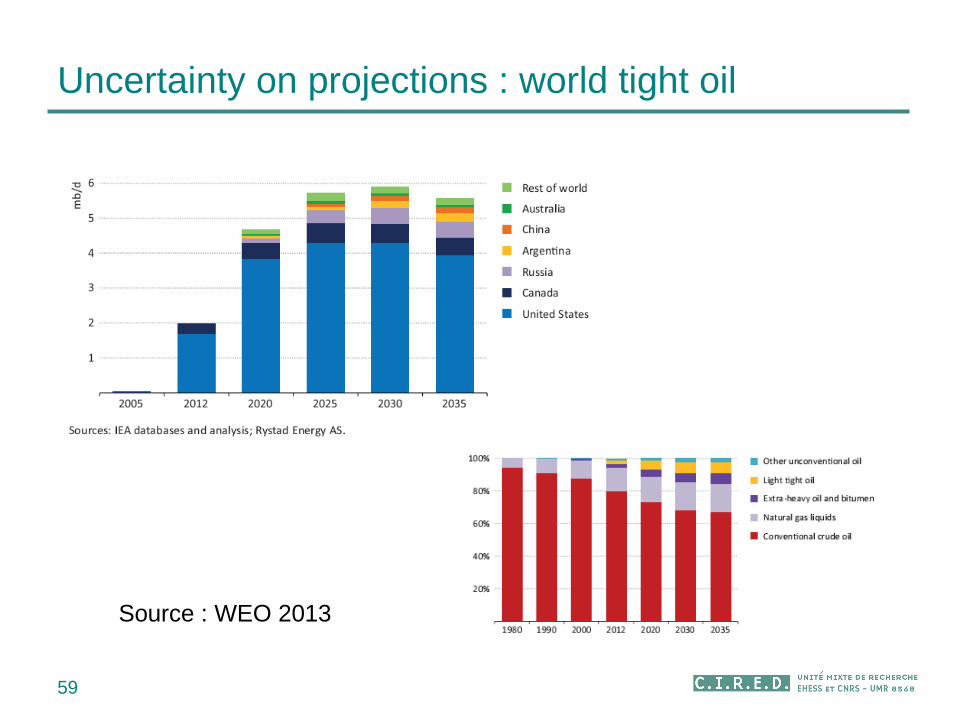
Uncertainty on projections : world tight oil
59
Source : WEO 2013
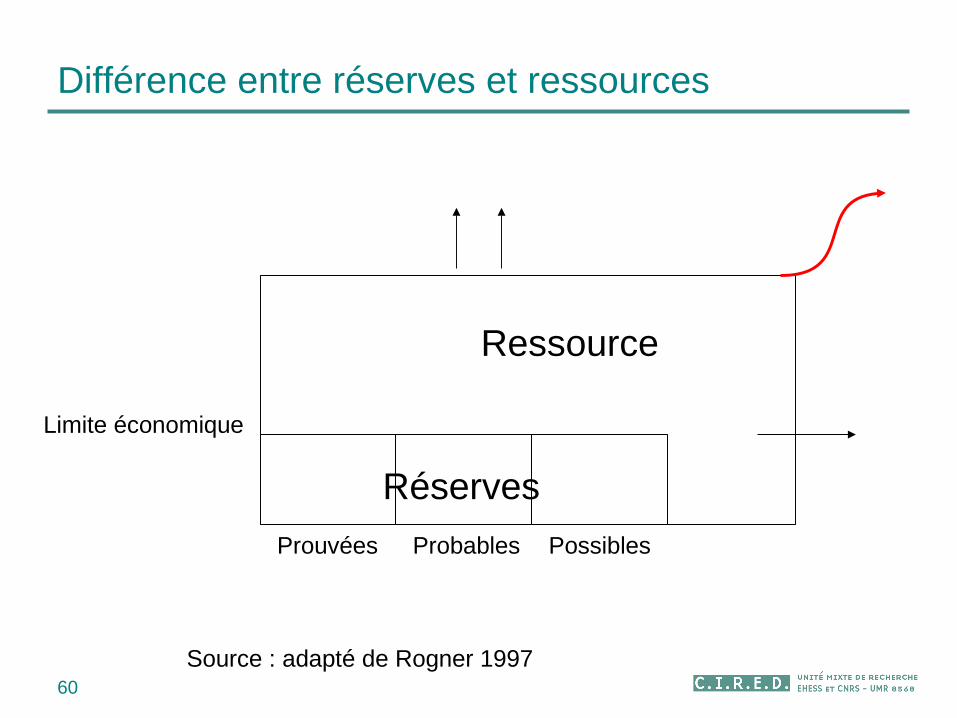
Différence entre réserves et ressources
60
Limite économique
PossiblesProbablesProuvées
Réserves
Source : adapté de Rogner 1997
Ressource
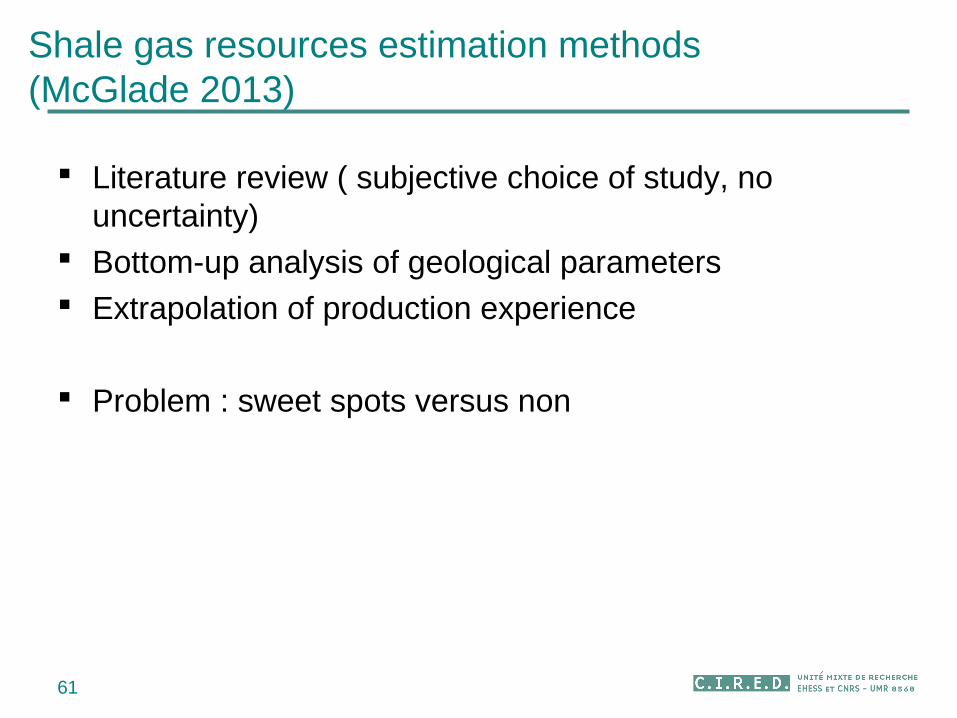
Shale gas resources estimation methods (McGlade 2013)
61
Literature review ( subjective choice of study, no uncertainty)
Bottom-up analysis of geological parameters Extrapolation of production experience
Problem : sweet spots versus non
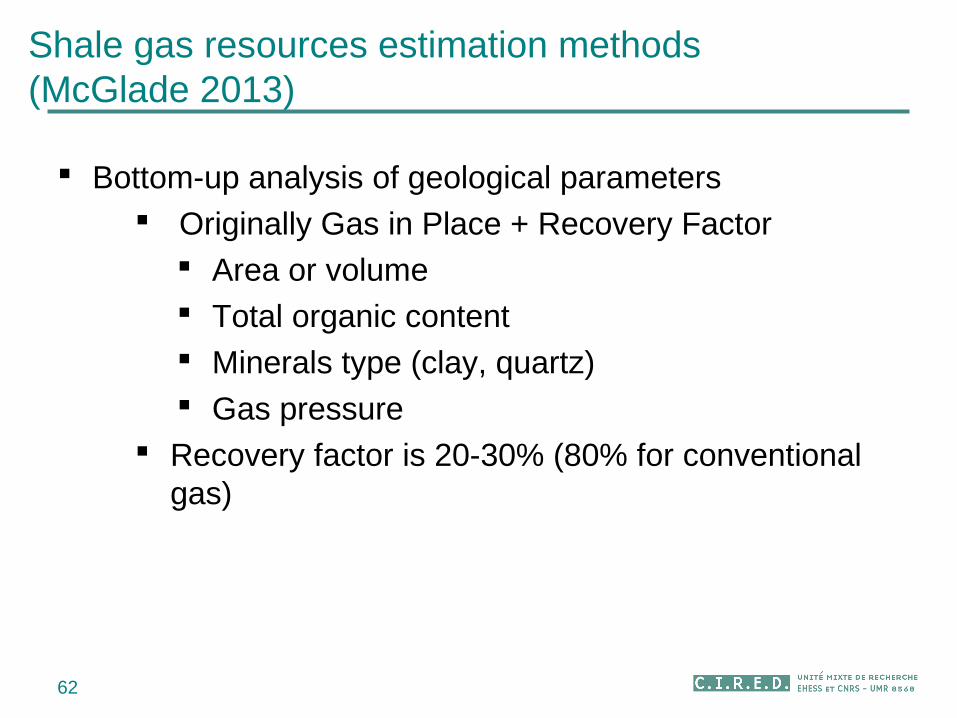
Shale gas resources estimation methods (McGlade 2013)
62
Bottom-up analysis of geological parameters Originally Gas in Place + Recovery Factor
Area or volume Total organic content Minerals type (clay, quartz) Gas pressure
Recovery factor is 20-30% (80% for conventional gas)
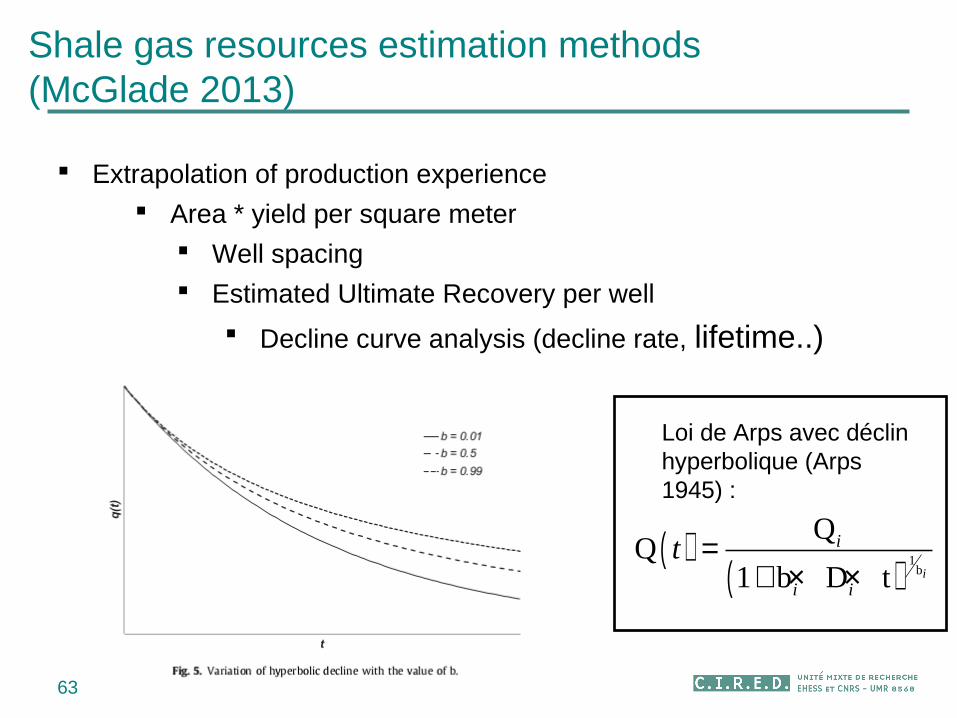
Shale gas resources estimation methods (McGlade 2013)
63
Extrapolation of production experience
Area * yield per square meter Well spacing Estimated Ultimate Recovery per well
Decline curve analysis (decline rate, lifetime..)
( )( ) 1
b
1 b D t i
i
i i
t =+ × ×
Loi de Arps avec déclin hyperbolique (Arps 1945) :

Les nouveaux hydrocarbures non-conventionnels :
nouvelle abondance ?
64
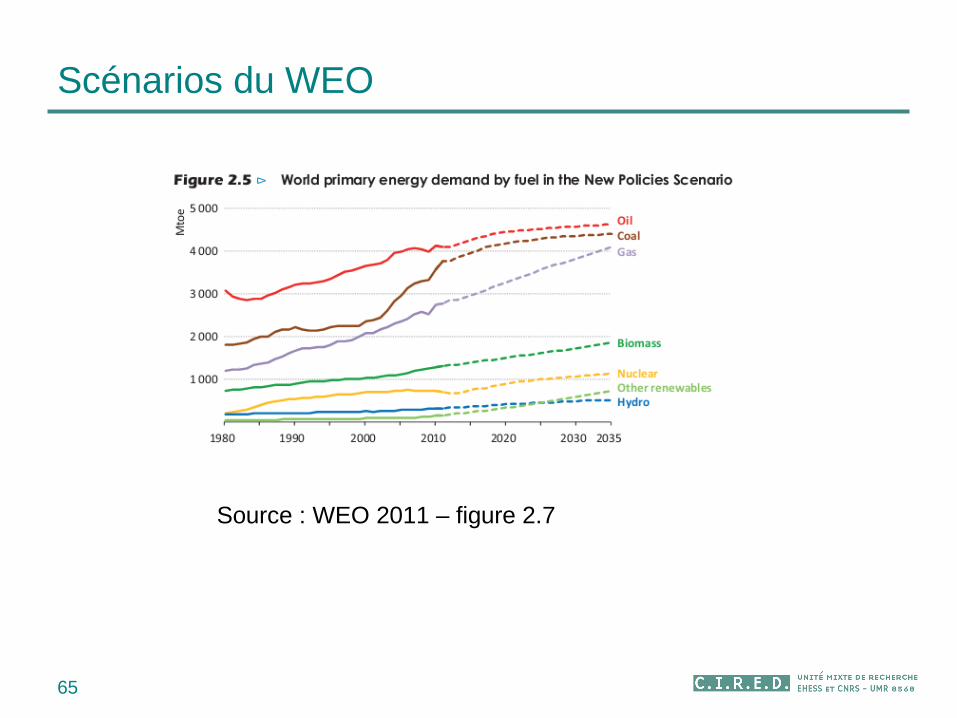
Scénarios du WEO
65
Source : WEO 2011 – figure 2.7
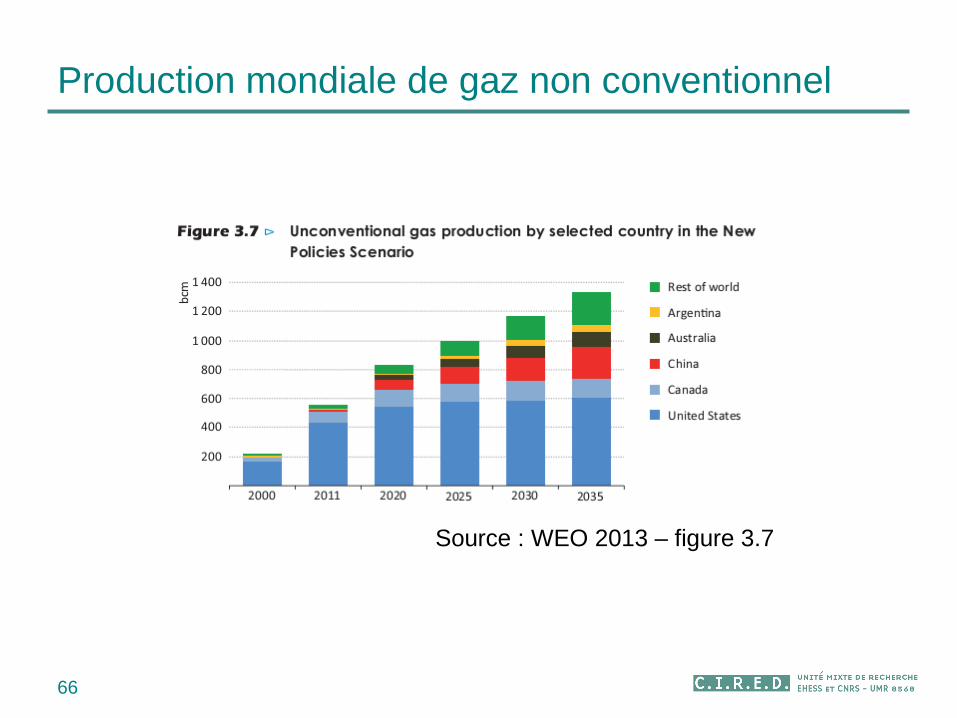
Production mondiale de gaz non conventionnel
66
Source : WEO 2013 – figure 3.7
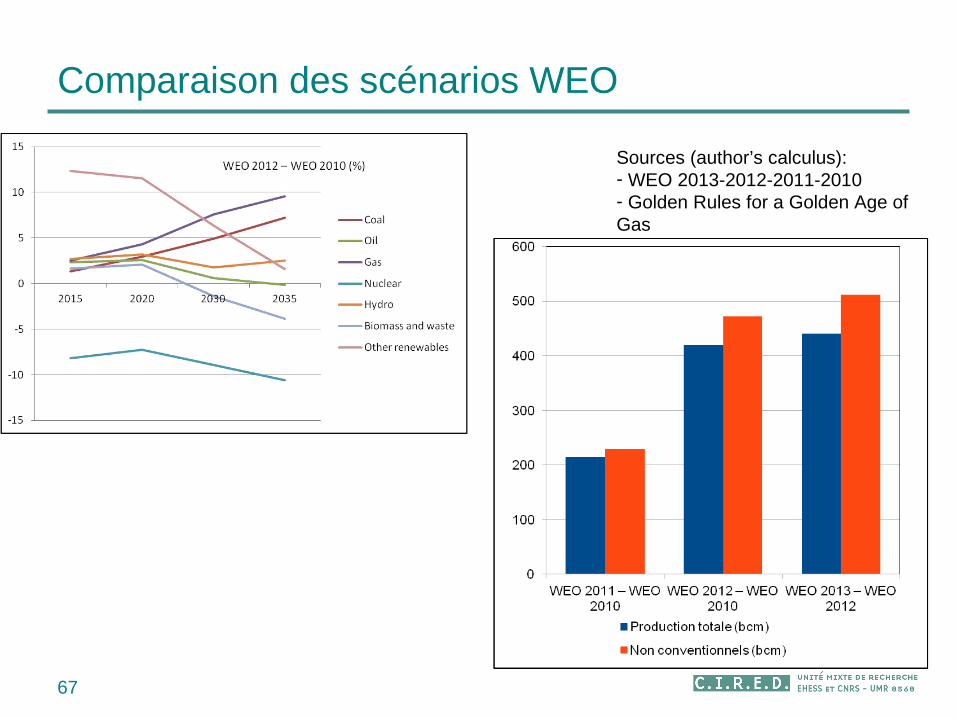
Comparaison des scénarios WEO
67
Sources (author’s calculus): - WEO 2013-2012-2011-2010- Golden Rules for a Golden Age of Gas
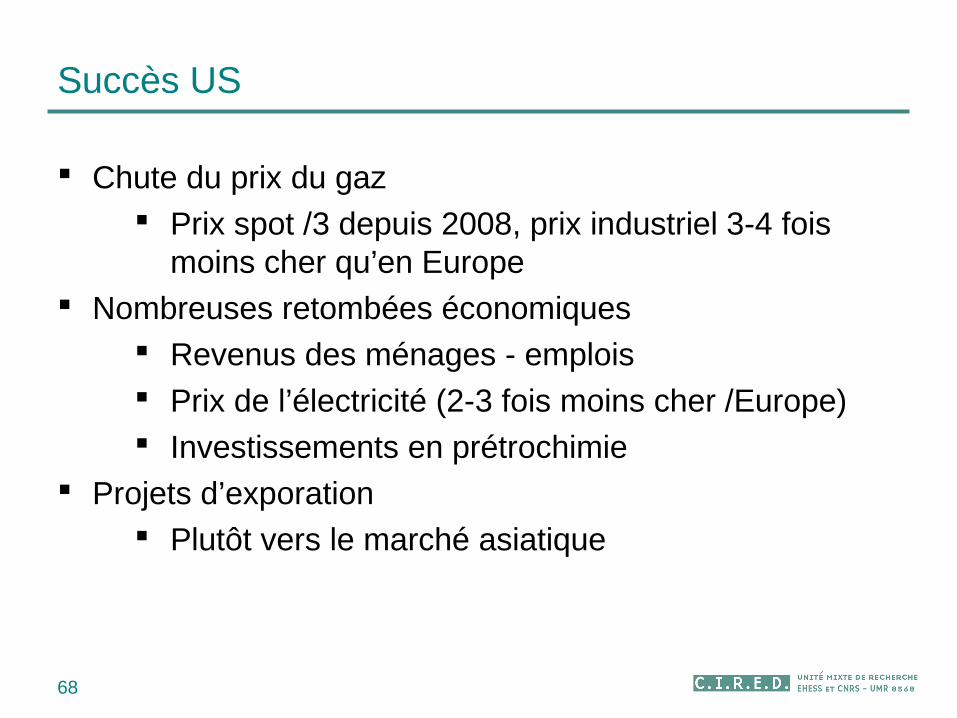
Succès US
68
Chute du prix du gaz Prix spot /3 depuis 2008, prix industriel 3-4 fois
moins cher qu’en Europe Nombreuses retombées économiques
Revenus des ménages - emplois Prix de l’électricité (2-3 fois moins cher /Europe) Investissements en prétrochimie
Projets d’exporation Plutôt vers le marché asiatique
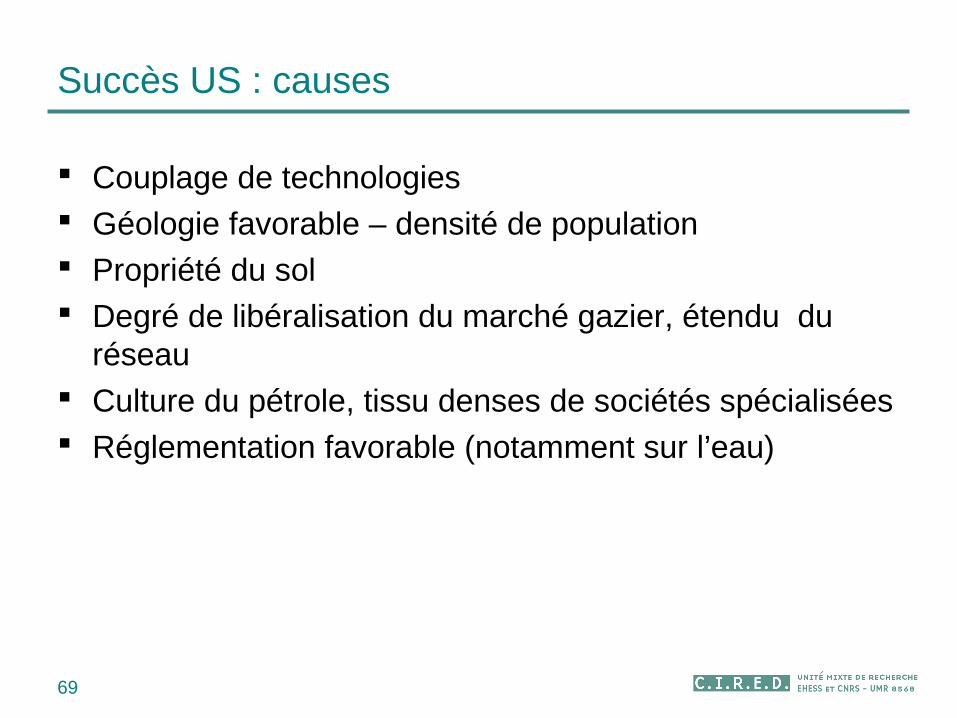
Succès US : causes
69
Couplage de technologies Géologie favorable – densité de population Propriété du sol Degré de libéralisation du marché gazier, étendu du
réseau Culture du pétrole, tissu denses de sociétés spécialisées Réglementation favorable (notamment sur l’eau)
Et dans le reste du monde ?
70
Royaume-Uni Pologne Allemagne Australie Chine ?
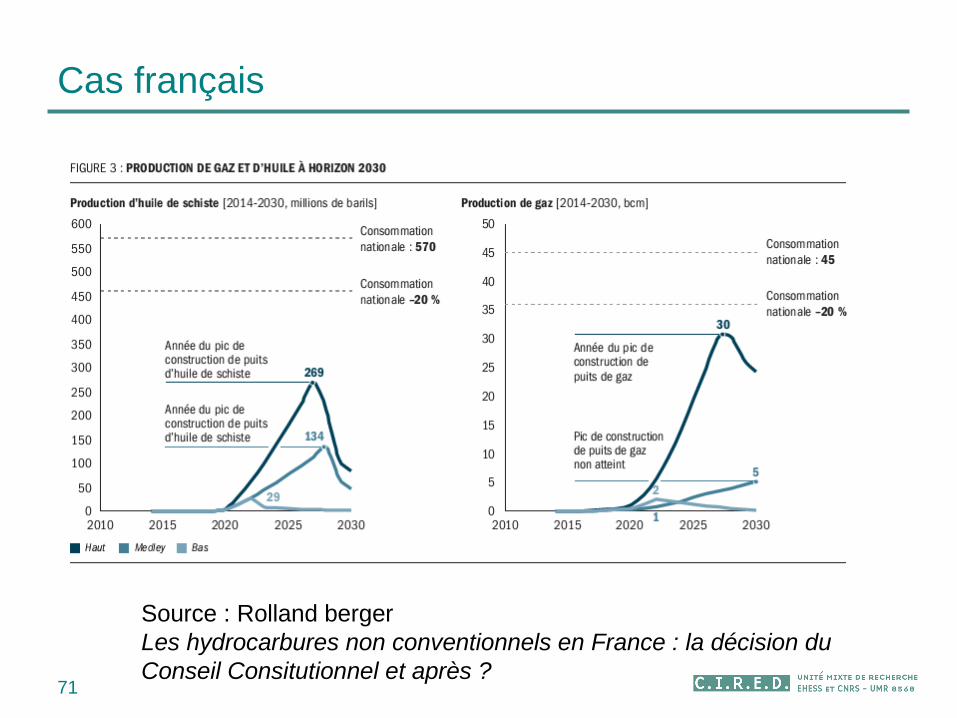
Cas français
71
Source : Rolland bergerLes hydrocarbures non conventionnels en France : la décision du Conseil Consitutionnel et après ?
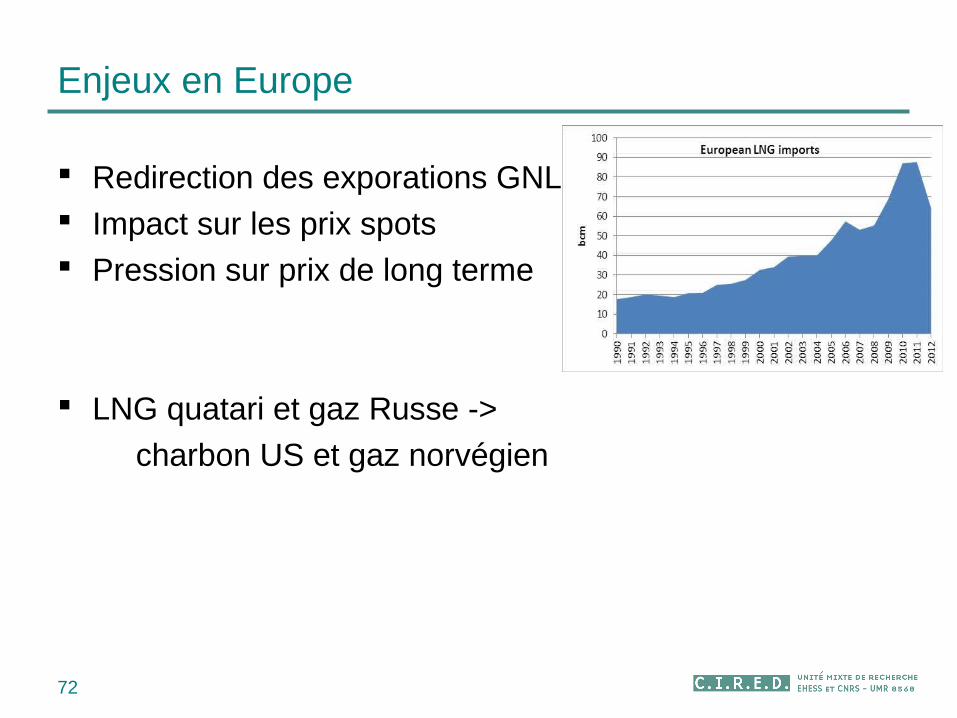
Enjeux en Europe
Redirection des exporations GNL Impact sur les prix spots Pression sur prix de long terme
LNG quatari et gaz Russe ->
charbon US et gaz norvégien
72
Les nouveaux hydrocarbures non-conventionnels :
Scénarios prospectifs et enjeux
73
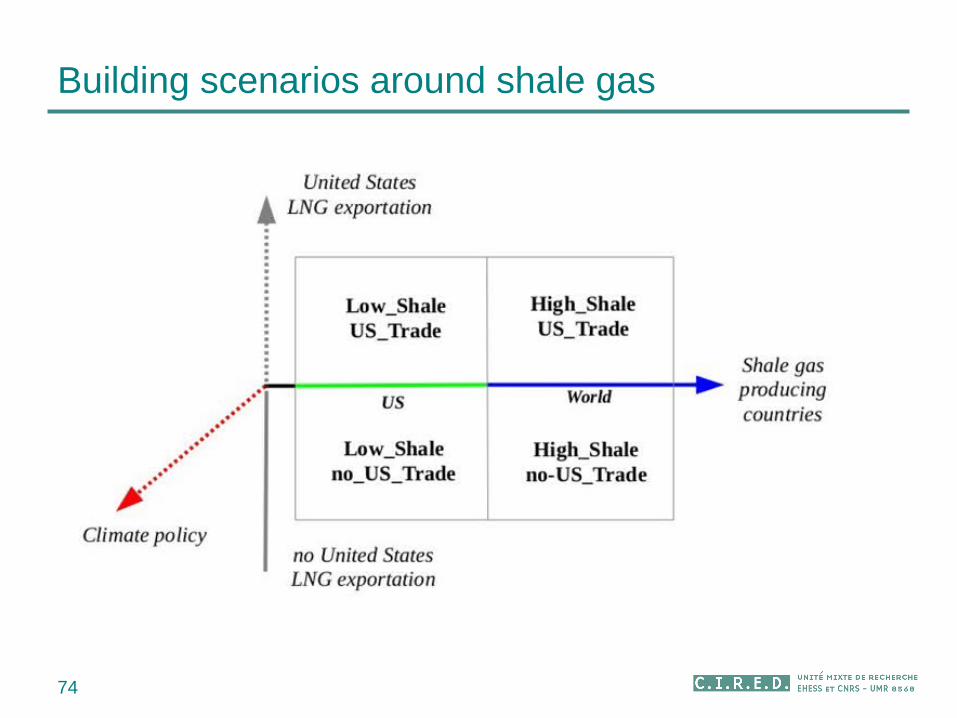
Building scenarios around shale gas
74
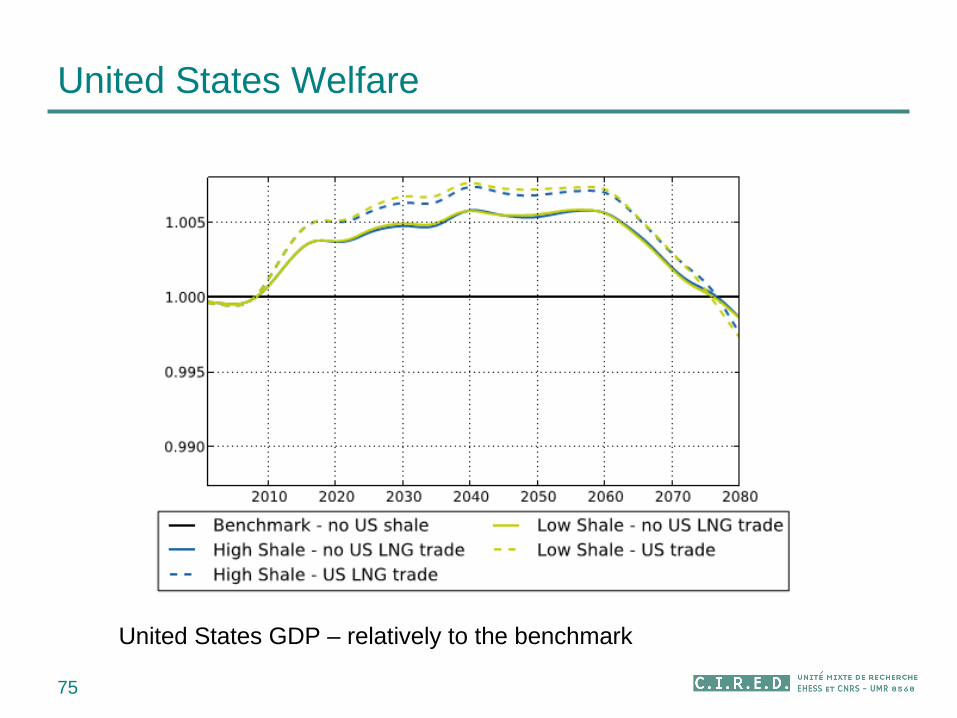
United States Welfare
75
United States GDP – relatively to the benchmark
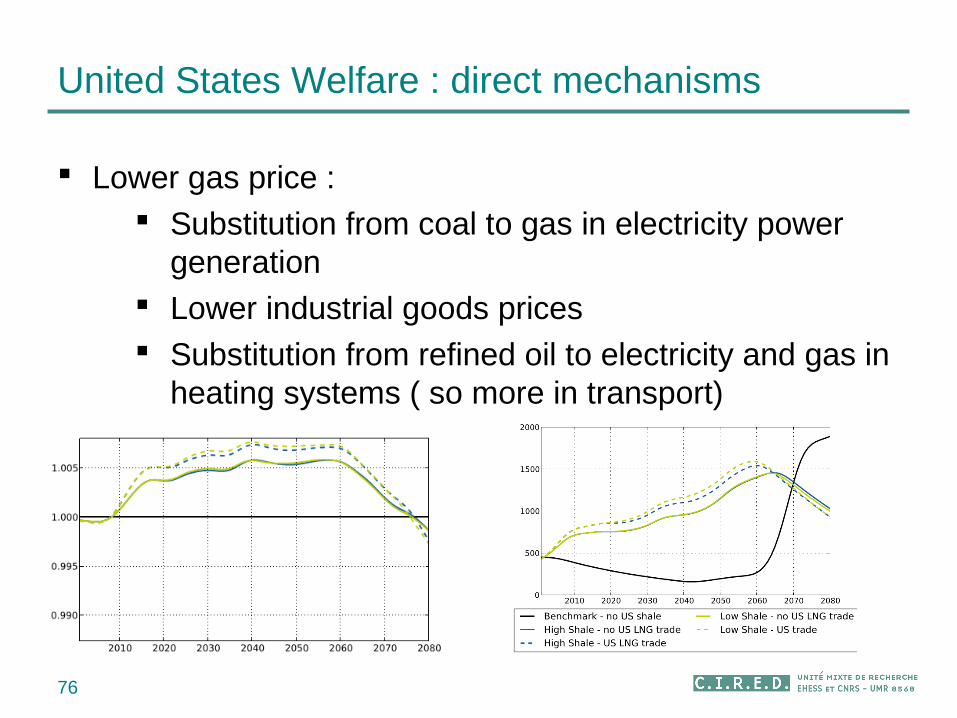
United States Welfare : direct mechanisms
76
Lower gas price : Substitution from coal to gas in electricity power
generation Lower industrial goods prices Substitution from refined oil to electricity and gas in
heating systems ( so more in transport)
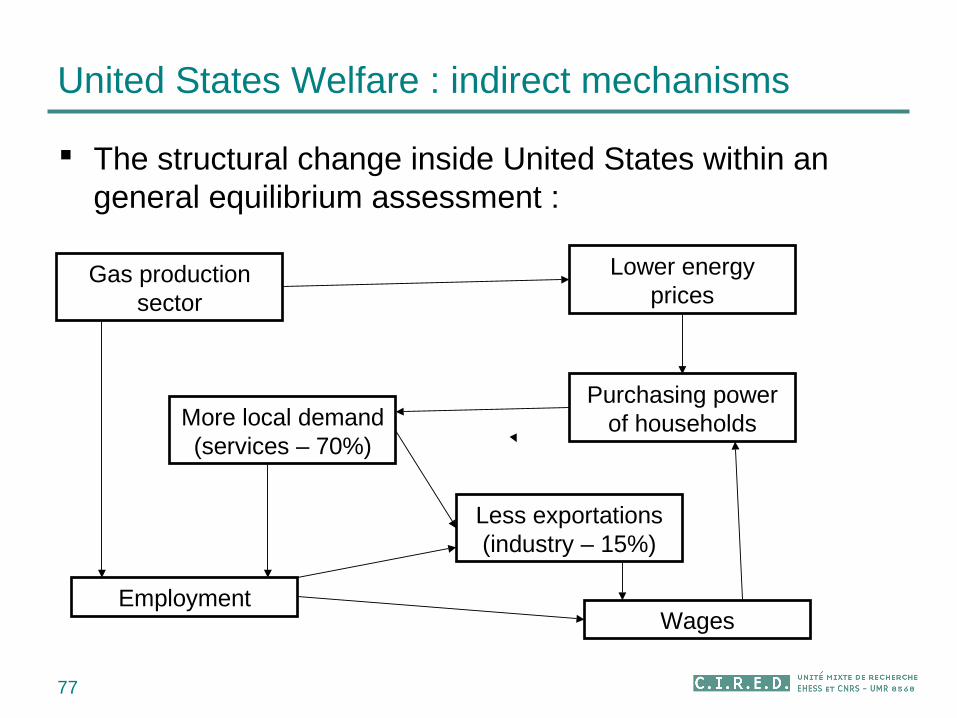
United States Welfare : indirect mechanisms
77
The structural change inside United States within an general equilibrium assessment :
Purchasing power of households
Lower energy prices
More local demand (services – 70%)
Employment
Gas production sector
Wages
Less exportations (industry – 15%)
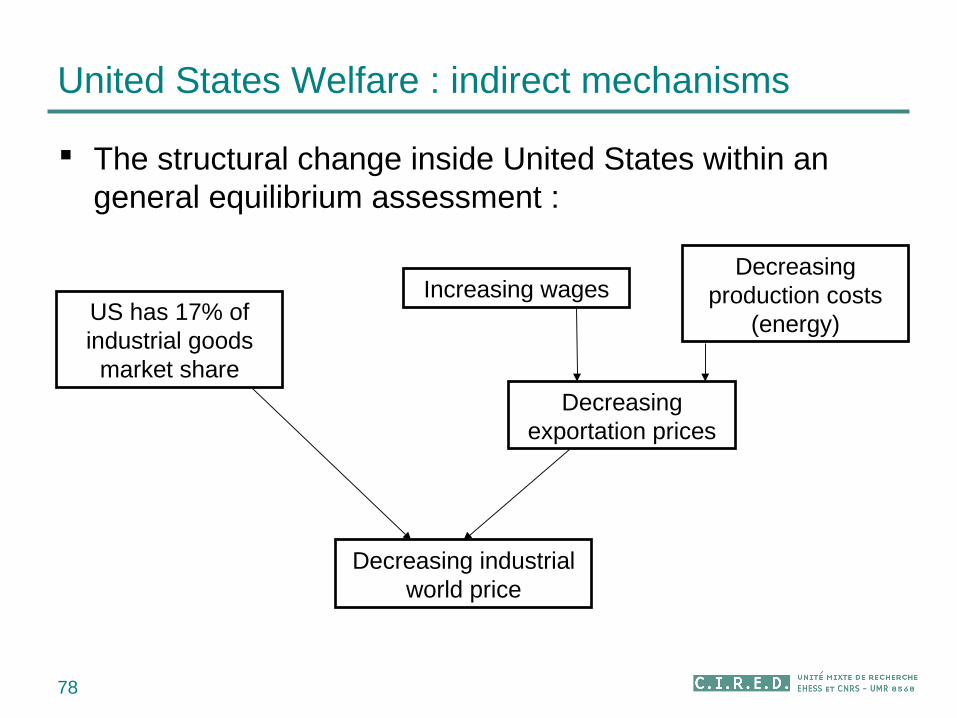
United States Welfare : indirect mechanisms
78
The structural change inside United States within an general equilibrium assessment :
US has 17% of industrial goods
market share
Increasing wagesDecreasing
production costs (energy)
Decreasing exportation prices
Decreasing industrial world price
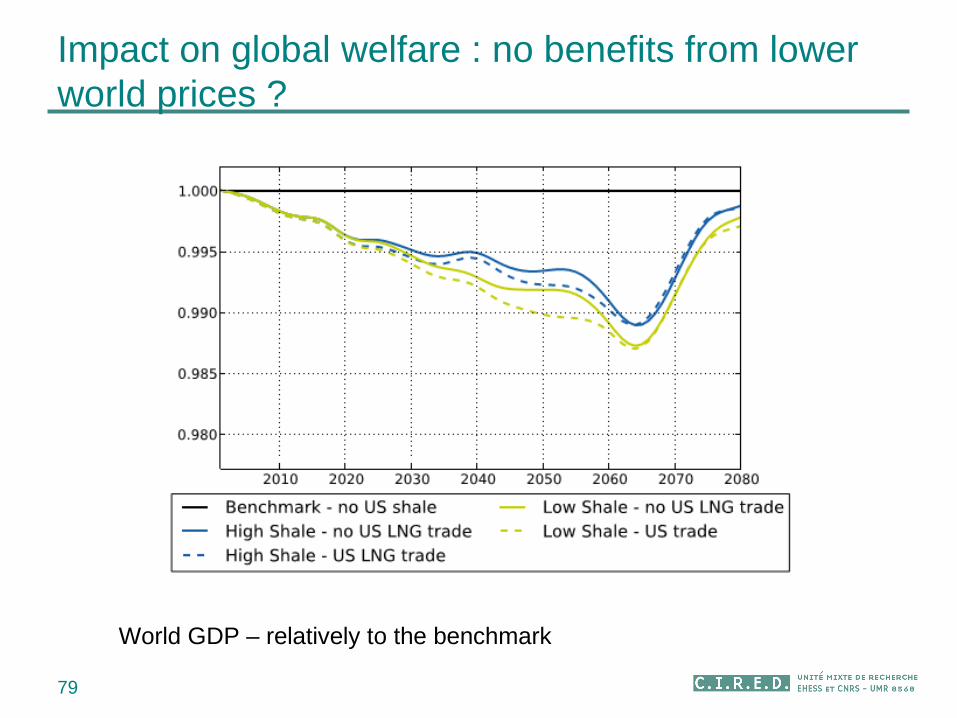
Impact on global welfare : no benefits from lower world prices ?
79
World GDP – relatively to the benchmark
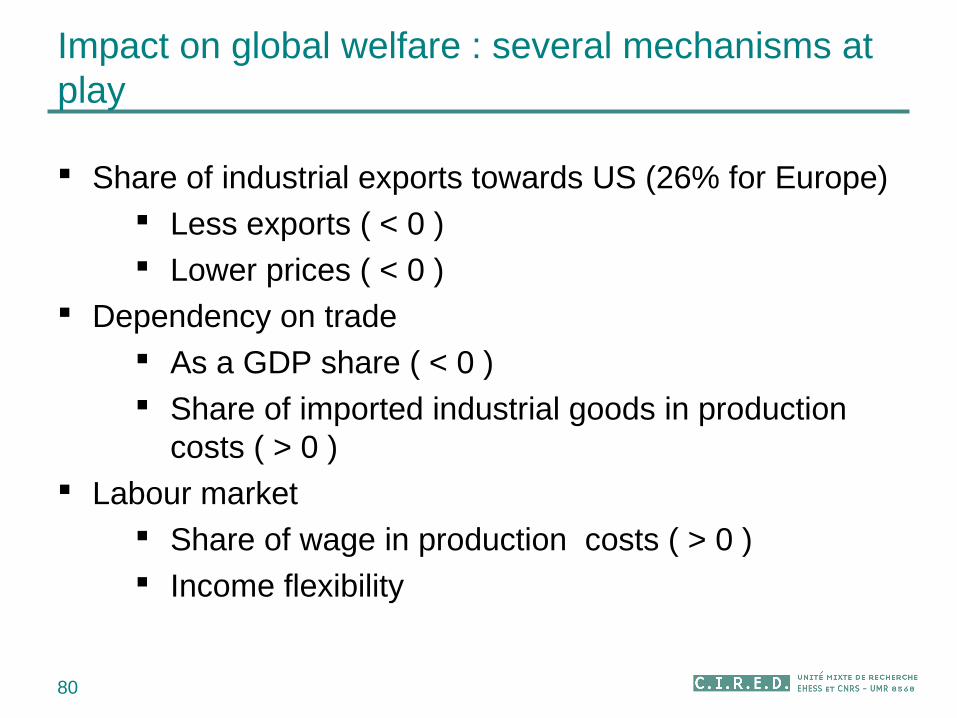
Impact on global welfare : several mechanisms at play
80
Share of industrial exports towards US (26% for Europe) Less exports ( < 0 ) Lower prices ( < 0 )
Dependency on trade As a GDP share ( < 0 ) Share of imported industrial goods in production
costs ( > 0 ) Labour market
Share of wage in production costs ( > 0 ) Income flexibility
Les nouveaux hydrocarbures non-conventionnels :
Enjeux vis-à-vis du climat
81
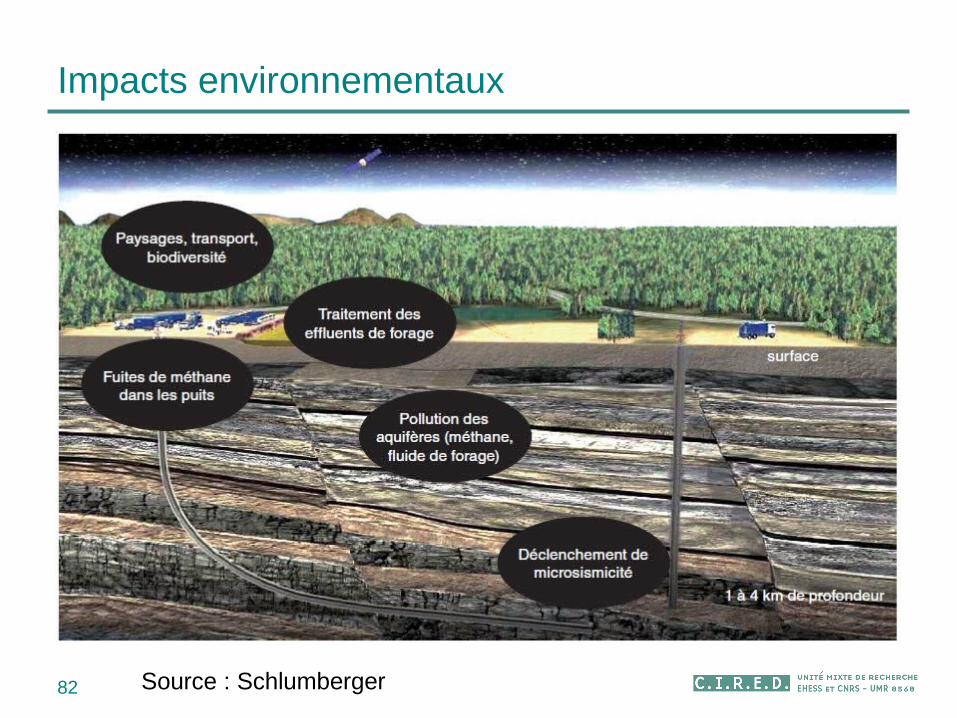
Impacts environnementaux
82 Source : Schlumberger
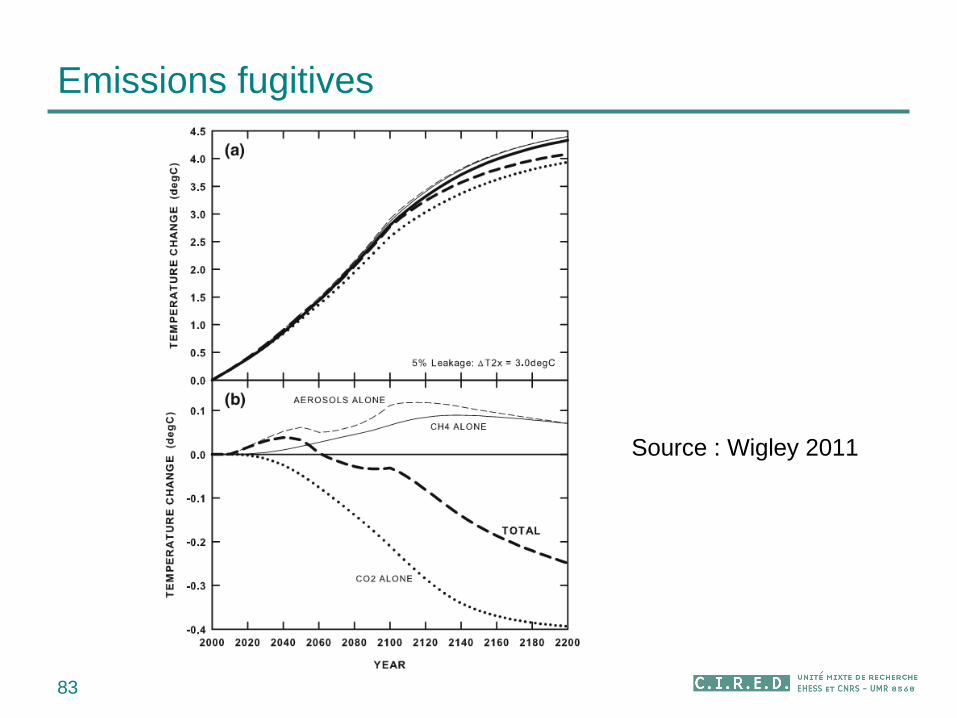
Emissions fugitives
83
Source : Wigley 2011
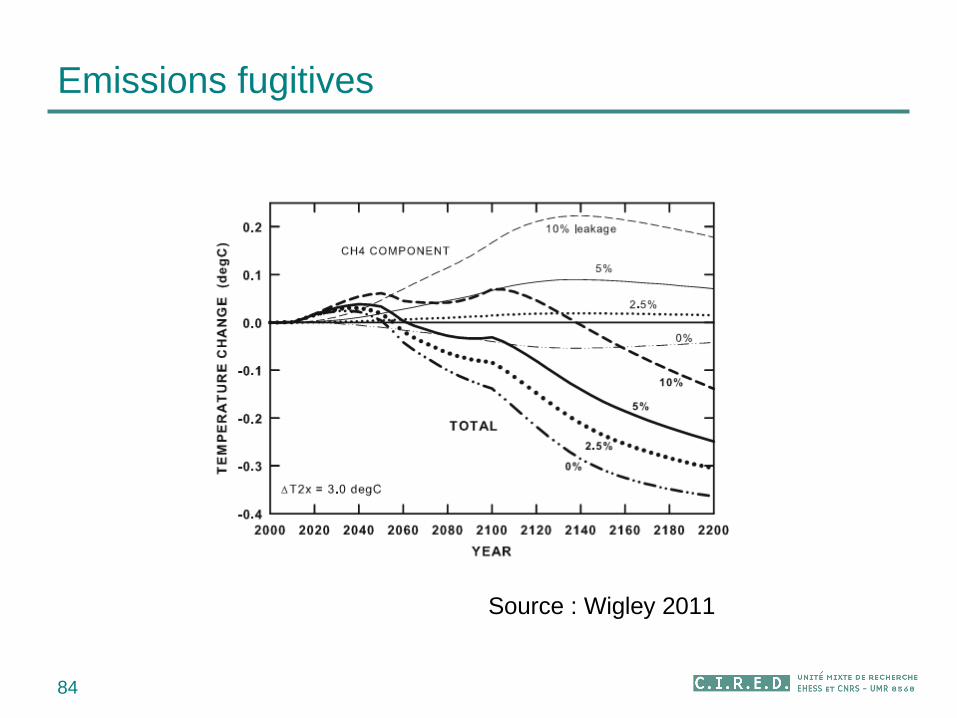
Emissions fugitives
84
Source : Wigley 2011
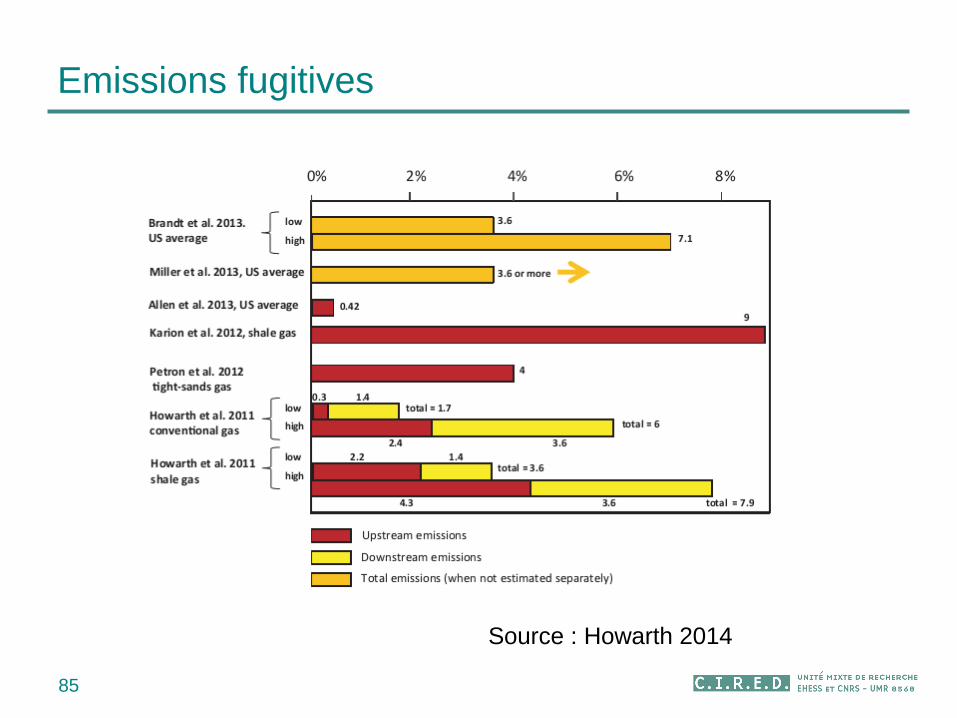
Emissions fugitives
85
Source : Howarth 2014
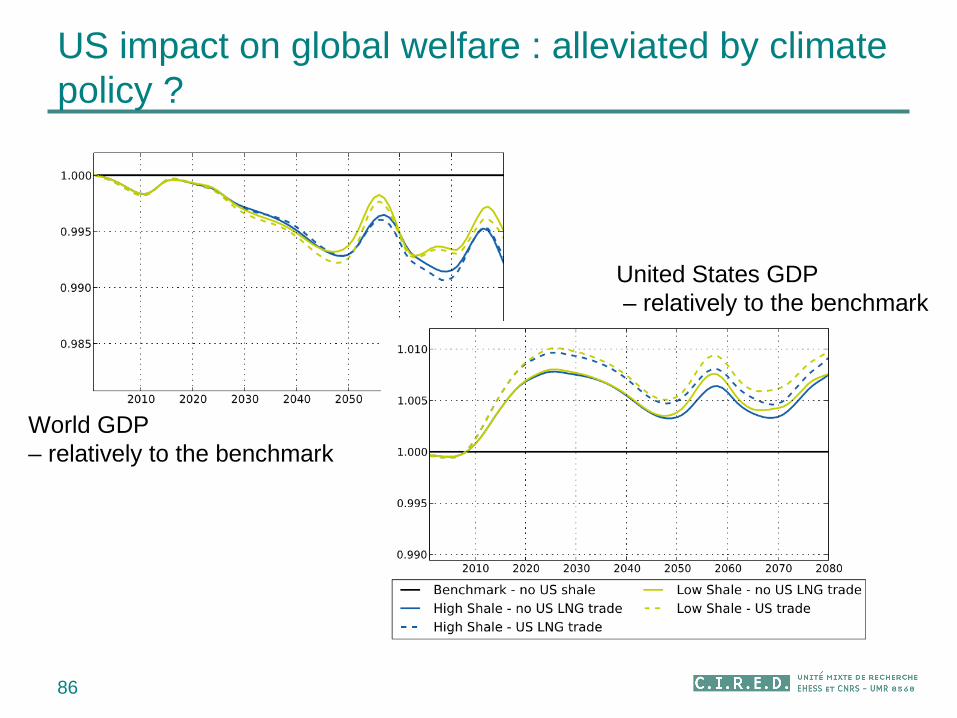
US impact on global welfare : alleviated by climate policy ?
86
United States GDP – relatively to the benchmark
World GDP – relatively to the benchmark
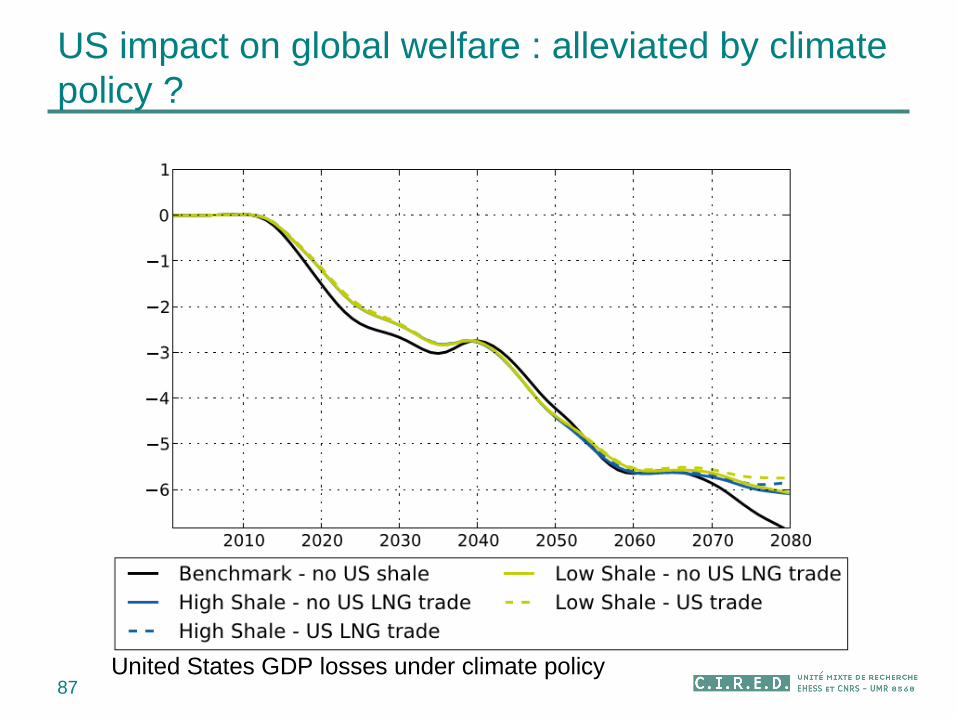
US impact on global welfare : alleviated by climate policy ?
87United States GDP losses under climate policy
US impact on global welfare : alleviated by climate policy ?
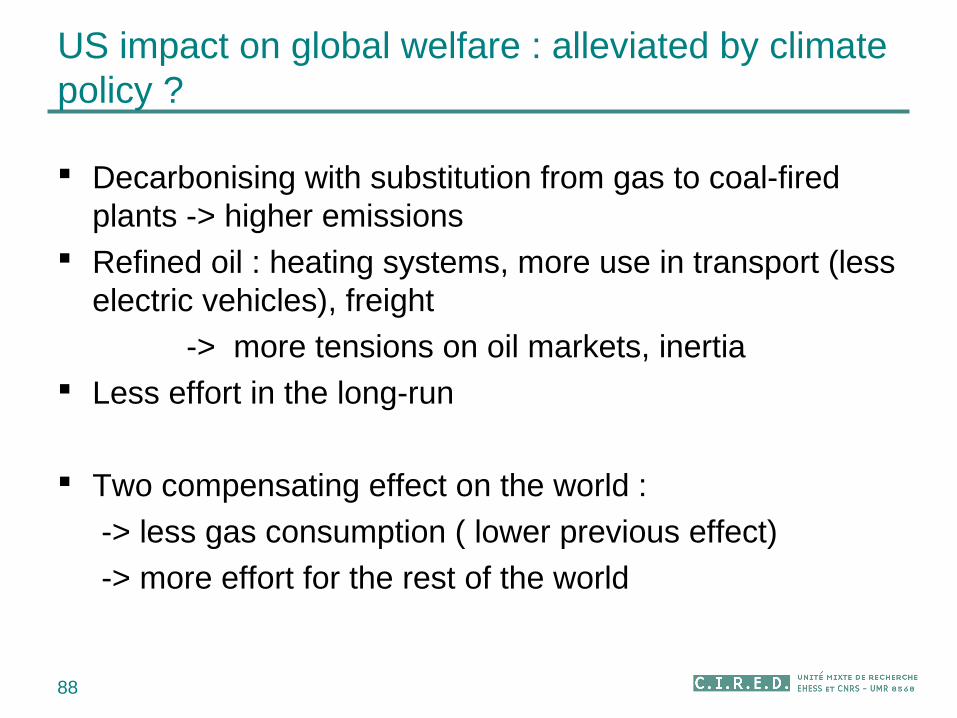
88
Decarbonising with substitution from gas to coal-fired plants -> higher emissions
Refined oil : heating systems, more use in transport (less electric vehicles), freight
-> more tensions on oil markets, inertia Less effort in the long-run
Two compensating effect on the world :
-> less gas consumption ( lower previous effect)
-> more effort for the rest of the world
Impact on oil markets
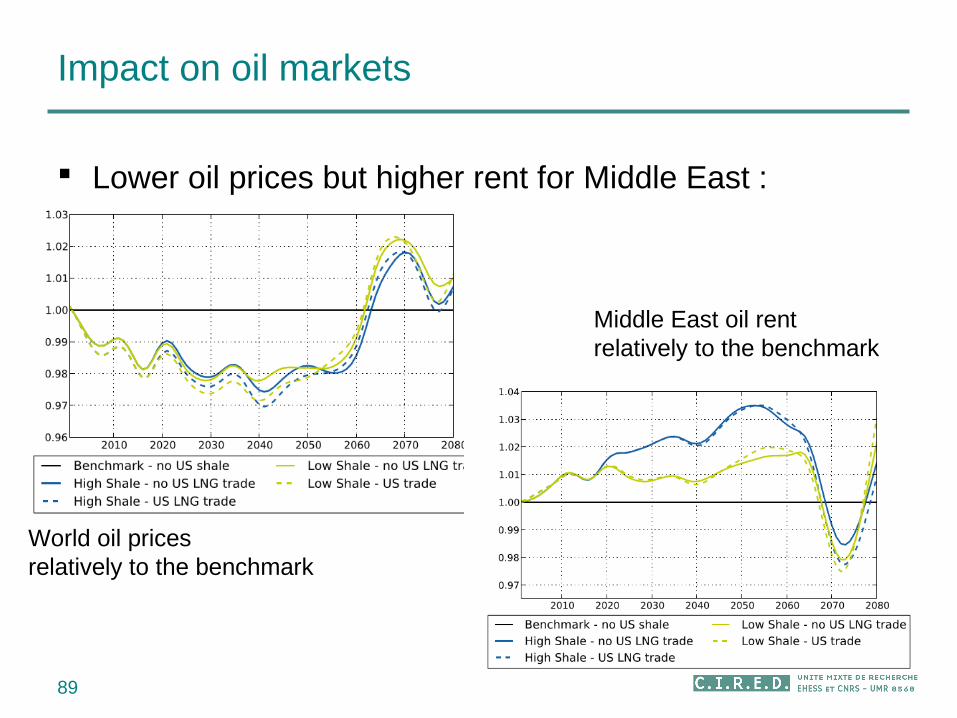
89
Lower oil prices but higher rent for Middle East :
World oil pricesrelatively to the benchmark
Middle East oil rent relatively to the benchmark
Bibliography
90
Bibliography
91
Bibliography
92

Merci pour votre attention !
93
Contact :
Présentation :
http://www.imaclim.centre-cired.fr/-> Equipe-> Christophe Cassen