Embed Size (px)
Citation preview
No 4
Energy and nutrients from horse manure
Life-cycle data inventory of horse
manure management systems in
Gävleborg, Sweden
Jay Hennessy
Ola Eriksson
© Ola Eriksson and Jay Hennessy 2015
Research Report No 4
urn:nbn:se:hig:diva-20782
Research Report / University of Gävle
Research Reports are published electronically and are available from
http://hig.se/Ext/En/University-of-Gavle/Research/Publications.html
Published by:
Gävle University Press
Energy and nutrients from horse manure
Life-cycle data inventory of horse manure
management systems in Gävleborg, Sweden
Jay Hennessy and Ola Eriksson
Faculty of Engineering and Sustainable Development
Department of Building, Energy and Environmental Engineering
Interim report 2 from the project Hästkrafter och hästnäring -
hållbara systemlösningar för biogas och biogödsel

i
Abstract
Management of horse manure is seldom subject to energy recovery. In the current project
solutions for energy recovery of horse manure, with a focus on biogas production as the
process not only recovers energy but also closes nutrient cycles, are identified and asses-
sed from an environmental point of view. The number of horses in society is increasing.
Today, according to Statistics Sweden, there are more than 360,000 horses in Sweden, of
which three-quarters are situated in urban or near-urban environments. With a dry matter
content of 40 %, this equates to a quantity of 1,360 tonnes of horse manure per annum
and corresponds to an annual biogas production of 641 GWh, which corresponds to
almost 40 % of all biogas produced in Sweden in 2013. Although there are some practical
limitations on how much of that potential can be exploited, this is still a significant
potential for increased use of renewable energy. Collecting manure and anaerobically
digesting it achieves three environmental benefits:
1. Emissions from conventional management, where the manure is piled and stored,
or spontaneously composted or decomposed, are avoided.
2. Anaerobic digestion of manure produces biogas that can be utilised to generate
electricity and/or heat or, after upgrading (purification and pressure increase), as
vehicle fuel; thereby emissions from fossil fuels are reduced.
3. Following the process, the resulting digestate can be used in agriculture, thereby
replacing chemical fertiliser and providing additional environmental benefits.
The aim of this project is to find a greater breadth of system solutions than previously,
solutions that are proven to function technically and be economically feasible. If these
systems are translated into practical reality, environmental gains are made, for example,
through reduced environmental impact such as reduced eutrophication and reduced use of
finite resources.
This report documents a data inventory made for the life-cycle assessment (LCA) of
horse manure management systems in the Gävleborg region, Sweden. The overall result
is that data are scarce for all parts of the system, from feedstock characteristics to waste
treatment methods as well as utilisation of biofertiliser. There are few plants for solid
state anaerobic digestion, at least using horse manure as substrate, and little is known
about emissions from current manure practise. Moreover, as the number and location of
horses are hard to estimate, the forthcoming systems analysis has to be made for a hypo-
thetical amount of horse manure and emissions etc. have to be expressed per ton VS.
Given these uncertainties the systems analysis will just give indicative results.
ii
Sammanfattning
Hantering av hästgödsel är sällan föremål för energiåtervinning. I det aktuella projektet
ska lösningar för energiåtervinning av hästgödsel, med fokus på biogasproduktion
eftersom processen inte bara återvinner energi utan också sluter näringsämnenas krets-
lopp, identifieras och bedömmas ur ett miljöperspektiv. Antalet hästar i samhället ökar.
Idag finns det enligt SCB mer än 360 000 hästar i Sverige, varav tre fjärdedelar återfinns i
städer eller stadsnära miljöer. Med en torrsubstanshalt på 40 %, motsvarar detta 1 360 ton
hästgödsel per år vilket motsvarar en årlig biogasproduktion om 641 GWh, vilket utgör
nästan 40 % av all biogas som producerades i Sverige under 2013. Även om det finns
vissa praktiska begränsningar för hur stor del av denna potential som kan utnyttjas så är
detta fortfarande en betydande potential för ökad användning av förnybar energi. Genom
att samla in hästgödsel och röta det uppnås tre miljömässiga fördelar:
1. Utsläpp från konventionell hantering, där gödseln läggs på hög och lagras, eller
genomgår spontan kompostering och bryts ned, undviks.
2. Rötning av gödsel producerar biogas som kan användas för (1) att generera
elektricitet och/eller värme eller (2) efter uppgradering (rening och tryckökning)
användas som fordonsbränsle. Därigenom kan utsläppen från fossila bränslen
minskas.
3. Efter processen kan den biogödseln användas i jordbruket, och därmed ersätta
konstgödsel vilket kan ge ytterligare miljöfördelar.
Syftet med detta projekt är att hitta en större bredd av systemlösningar än tidigare, lös-
ningar som visat sig fungera tekniskt och ekonomiskt genomförbara. Om dessa system
omsätts i praktisk verklighet kan miljövinster göras, till exempel genom minskad miljö-
påverkan såsom minskad övergödning och minskad användning av ändliga resurser.
Denna rapport dokumenterar en datainventering inför en avslutande livscykelanalys
(LCA) av hästgödselhanteringssystem i Gävleborgsregionen i Sverige. Det övergripande
resultatet är att data är knappa för alla delar av systemet, från råmaterialets egenskaper till
behandlingsmetoder samt utnyttjande av biogödsel. Det finns få anläggningar för torr-
rötning, åtminstone som använder hästgödsel som substrat, och lite är känt om utsläpp
från nuvarande gödselhantering. Dessutom, eftersom antalet och placeringen av hästarna
är svårt att uppskatta, så kommer den avslutande systemanalysen göras för en hypotetisk
mängd hästgödsel och utsläpp etc. måste uttryckas per ton VS. Med tanke på dessa osä-
kerheter kommer systemanalysen endast ge vägledande resultat.
iii
Preface
This is the second report out of three from a project funded jointly by Region Gävleborg
and the University of Gävle. Previous report in Swedish (Hadin et al., 2015) explains
details on the background of the project and qualitatively discusses various issues and
aspects of horse manure management and considerations relating to the different technol-
ogies available to transform the manure.
The work documented in this report has been carried out during February-June 2015.
Expertise was provided by Åsa Hadin. The report has been peer-reviewed by members of
the project reference group and finally by the assessor of the entire project. The third, and
last, report from the project (Eriksson et al., 2015) shows results from an environmental
assessment of different horse manure treatments based on data documented in this report.
The authors like to thank all people contributing to this report.
Gävle 2015-07-05
Jay Hennessy
Ola Eriksson
iv
Glossary, prefixes and chemical symbols
- In tables, ‘-‘ means the data was not specified/available
AD anaerobic digestion
C carbon
CH4 methane
CHP combined heat and power
DM dry matter; see also TS
dung fresh faeces from the animal
FM fresh matter
IVL IVL Swedish Environmental Research Institute (IVL Svenska Miljö-
institutet)
JTI Swedish Institute of Agricultural and Environmental Engineering
(Institutet för jordbruks- och miljöteknik)
KTH Royal Institute of Technology (Kungliga Tekniska högskolan)
LCA Life-cycle assessment
manure faeces, urine and bedding material collected from animal stall; fresh or
after storage
N nitrogen
N/A ‘not applicable’ (data in tables)
NMMO n-methylmorpholine oxide
N2O nitrous oxide
NH3 ammonia
NH4-N ammonium nitrogen
NOX-N oxidised nitrogen
NO3-N nitrate nitrogen
ORWARE an LCA computational model developed in Matlab
P phosphorous
SLU Swedish University of Agricultural Sciences (Sveriges lantbruks-
universitet)
SS-AD solid-state anaerobic digestion
TS total solids
VFA volatile fatty acid
VS volatile solids
v
Table of Contents
Abstract ................................................................................................................................ i
Sammanfattning .................................................................................................................. ii
Preface ................................................................................................................................ iii
Glossary, prefixes and chemical symbols .......................................................................... iv
Table of Contents ................................................................................................................ v
1 Introduction ....................................................................................................................... 1
1.1. Data sources ............................................................................................................ 1
1.2. Management systems considered ........................................................................... 1
2. The LCA method and model ........................................................................................... 4
2.1. The ORWARE model ............................................................................................... 4
2.2. Environmental impact assessment .......................................................................... 4
2.3. General assumptions for modelling.......................................................................... 5
3. Data inventory ................................................................................................................. 6
3.1. Validation .................................................................................................................. 6
3.2. Horse manure ........................................................................................................... 6
3.3. Transport .................................................................................................................. 9
4. Horse manure management systems ........................................................................... 10
4.1. Unmanaged manure – natural decomposition ....................................................... 10
4.2. Aerobic digestion – composting ............................................................................. 11
4.3. Incineration ............................................................................................................. 13
4.4. Anaerobic digestion (AD) ....................................................................................... 14
References ........................................................................................................................ 21
Appendix A ........................................................................................................................ 25
ORWARE vectors .......................................................................................................... 25

1
1 Introduction
This report details a data inventory made for the life cycle assessment (LCA) of horse
manure management systems in the Gävleborg region, Sweden. Details of the aims of the
project and the results of the initial literature study can be found in the preceding report,
Hadin et al. (2015). The horse manure management systems that have been considered,
and for which data have been gathered, are:
1. Discarded piles (unmanaged composting) which should reflect current manage-
ment practise
2. Managed composting and subsequent spreading of digestate on fields
3. Incineration with energy recovery (large scale and small scale)
4. Anaerobic digestion, both wet and solid state (single substrate and co-digestion of
multiple substrates) and subsequent spreading of digestate on fields
The LCA approach uses a number of potential scenarios that include these systems as
well as associated logistical systems such as transportation; the LCA system boundaries
are described in more detail in Eriksson et al. (2015).
The model chosen for this task is ORWARE, which is an LCA tool for evaluating envi-
ronmental impacts of waste management and has been in development since the early
1990s (Bisaillon et al., 2000). The model is described in more detail in section 2.1. LCA
tools model material flows and, as such, require input data on the composition of materi-
als and the material transformation processes involved in the waste management systems
being considered.
The first step in building an LCA model is to make a data inventory of quality data
sources. Where reliable data cannot be established it is also necessary to make assump-
tions. As an example, accurate data on the number and location of horses in the
Gävleborg region does not exist, but can be estimated from national statistics and qualita-
tive data and surveys. Such assumptions are discussed in later sections. The ORWARE
model itself includes a number of previous assumptions already documented in related
literature and will not be included in this report. Once this data is established, scenarios
may be proposed to consider the various waste management options. This process, along
with the results of the modelling, is described in Eriksson et al., 2015.
1.1. Data sources
The data was collected from peer-reviewed journal papers, technical reports, question-
naires, personal communication, and in some cases relies on pre-existing values in the
LCA model, ORWARE. These data sources are referenced further below and the result-
ant data is listed in the main text or in Appendix A.
1.2. Management systems considered
Hadin et al. (2015) discussed the various horse manure management options, both in use
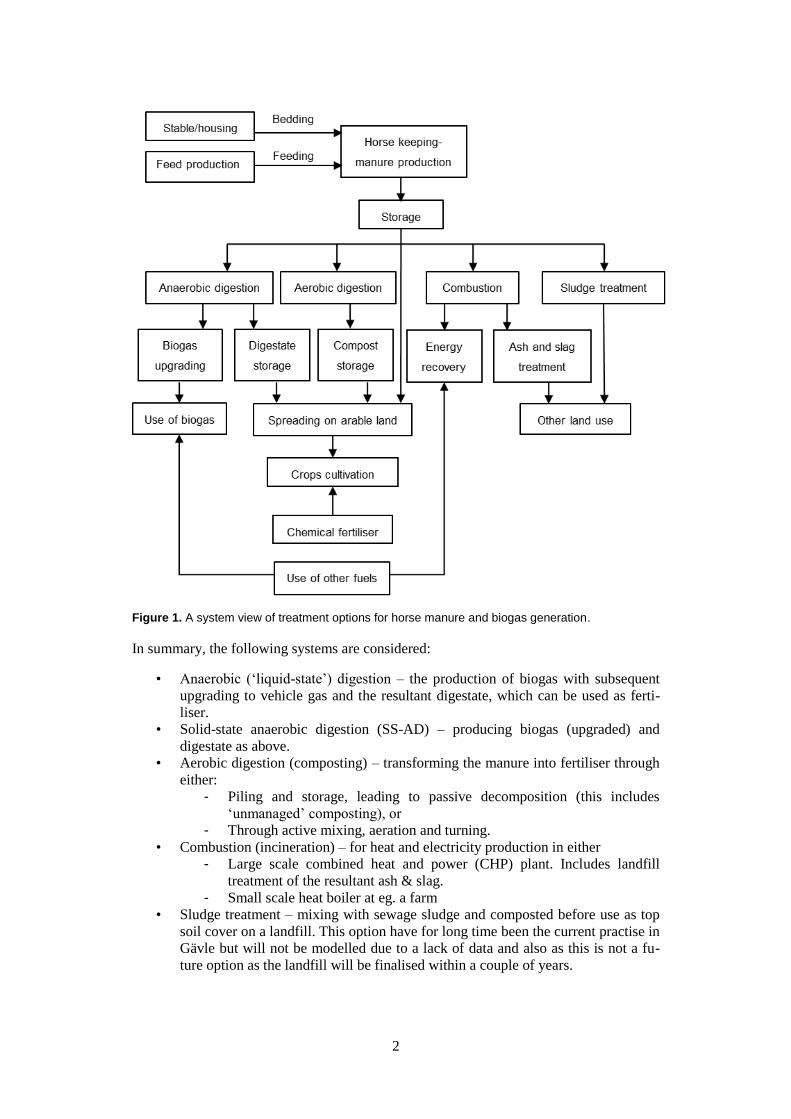
today and as potential options that could be available in the short term. In Figure 1, a
system view of possible horse manure management option/treatments is presented.
2
Figure 1. A system view of treatment options for horse manure and biogas generation.
In summary, the following systems are considered:
• Anaerobic (‘liquid-state’) digestion – the production of biogas with subsequent
upgrading to vehicle gas and the resultant digestate, which can be used as ferti-
liser.
• Solid-state anaerobic digestion (SS-AD) – producing biogas (upgraded) and
digestate as above.
• Aerobic digestion (composting) – transforming the manure into fertiliser through
either:
- Piling and storage, leading to passive decomposition (this includes
‘unmanaged’ composting), or
- Through active mixing, aeration and turning.
• Combustion (incineration) – for heat and electricity production in either
- Large scale combined heat and power (CHP) plant. Includes landfill
treatment of the resultant ash & slag.
- Small scale heat boiler at eg. a farm
• Sludge treatment – mixing with sewage sludge and composted before use as top
soil cover on a landfill. This option have for long time been the current practise in
Gävle but will not be modelled due to a lack of data and also as this is not a fu-
ture option as the landfill will be finalised within a couple of years.
3
With the exception of passive decomposition, the management systems above can not
only prevent emissions from untreated horse manure, they can also potentially offset
emissions from other energy uses, for example incineration can generate heat and elec-
tricity, and biogas can replace fossil fuels and possibly heat. Such offsetting can be con-
sidered in the LCA model, described below. Even if there are many plausible options, not
all will be investigated in this project. For biogas baseline scenarios comprise upgrading
to vehicle gas and using biogas in a CHP may be considered in sensitivity analysis. Pre-
treatment options for the management systems under study are also considered or in-
cluded in the model, along with transportation and post-treatment such as sorting facili-
ties. The model represents the current state of the systems being considered. As such,
possible future changes in the market and policy measures are not considered.
The inventory in this report covers the main processes as described above. Further work
related to the systems analysis including final definitions of system boundaries etc. is
further described in Eriksson et al. (2015).
4
2. The LCA method and model
In this chapter, the technical systems covered by the model are discussed on a general
level. A life-cycle assessment (LCA) model is used to study and compare the manage-
ment options mentioned above. The systems modelled were identified through literature
reviews, interviews with horse keepers and personal communication with technology
experts.
2.1. The ORWARE model
The model chosen for this task is ORWARE, a computational LCA model for evaluating
environmental impacts of waste management (Bisaillon et al., 2000). The ORWARE
model has been under development since the early 1990s. It started as collaboration be-
tween KTH, SLU, JTI and IVL, and has led to a vast number of research papers, theses
and major studies (detailed references are found in Eriksson et al., 2015). The model is
currently used and developed mainly by the University of Gävle, Profu, SLU and JTI.
The basis for modelling waste management in ORWARE is that the handling of different
wastes can be described at an elemental level, i.e., their composition of nutrients, carbon,
water and contaminants such as heavy metals, etc. It can handle solid and liquid organic
and inorganic waste from different sources. ORWARE is built from a number of modules
that describe a process or treatment. To describe the elements that make up waste man-
agement requires a large amount of input data. Each project must decide how much
information must be gathered for the case being studied. Once the composition of waste
is established, the waste flows through the model from the point of collection, via trans-
portation, to processing plants followed finally by consumption, new products or dis-
posal. A major part of the model used here is built on previous work in a project within
Waste refinery (Holmström et al., 2013).
2.2. Environmental impact assessment
Life-cycle assessment generally describes categories of possible (potential) impacts on
the environment as opposed to actual environmental impacts, which would require a more
site-specific assessment of the impacts of emissions. Different emissions contribute to the
different impact categories to varying degrees. Characterisation factors are therefore used
to determine the effects of different emissions on each impact category. Each emission is
multiplied by these characterisation factors so that its contribution can be summarised.
Impact categories may include the following:
Emissions that can lead to acidification (from sulphur dioxide, nitrogen oxides
and ammonia), and eutrophication (nitrogen oxides and ammonia).
Emissions including greenhouse gases, which contribute to global warming: car-
bon dioxide (CO2), methane (CH4) and nitrous oxide (N2O).
Heavy metals and toxic levels of various compounds.
Besides the emissions from the core (in this case manure management) system, offsetting
emissions from conventional production of products provided by the manure treatment
(eg. electricity, district heating, vehicle transport and nutrients) is also included. More
details on LCA methodology are presented in Eriksson et al. (2015).
5
2.3. General assumptions for modelling
The amount of manure produced by horses varies considerably (see section 3.2). In addi-
tion, due to a lack of data regarding the exact number and location of horses (cf. Hadin,
Eriksson and Jonsson, 2015), the model calculates all impacts per tonne of horse manure
treated. Thus, the model is based on the assumption that there is a fixed amount of horse
manure, for example 10 000 tonnes, which includes a number of pre-set percentages of
bedding material. The model is run using this fixed amount. In this way, it is possible to
compare the effects of different management systems (anaerobic digestion, composting,
etc.) for a given amount of manure and bedding material. Once the results have been
established it can be estimated how many horses 10 000 tonnes may represent. Also be-
cause of a lack of data, costs are not included in the model. System-specific assumptions
are discussed throughout this report.
6
3. Data inventory
Summaries of the data are included in this section. The raw data is collected in an Excel
file that is available as a separate electronic appendix to this report.
3.1. Validation
The validity of the ORWARE model and its input data has been tested in numerous prior
papers, theses and studies (cf. section 2.1). For this study, the ORWARE values for horse
manure are brought up-to-date using the latest data collected (see also section 3.2). Hav-
ing chosen values for the amounts and composition of horse manure, the outputs of the
ORWARE model are validated against results from the literature, which may include
production-scale plants (‘Plant’ data), laboratory results (‘Lab’ data) and computa-
tional/LCA models (‘Model’ data). Therefore, although some data are only used for vali-
dation of the model, it is included in this document.
3.2. Horse manure
Pure horse manure (i.e. without bedding) is referred to as ‘horse dung’ in some literature
(Mönch-Tegeder et al., 2013), meaning horse faeces (and sometimes urine). The term
‘horse dung’ will be used in this report to differentiate it from ‘horse manure’, which will
denote horse dung and urine mixed with bedding material and subsequently removed
from stalls.
A study made during 2002-2003 of horse keepers in the county of Gävleborg, who re-
sponded to a survey, showed that 81 % use wood shavings, 19 % use straw and 15 % use
peat as a bedding material (Femling, 2003). This agrees with Lundgren and Pettersson
(2009) who state that “wood shavings” (assumed to mean sawdust) are generally used in
northern Sweden, due to their accessibility and therefore lower cost.
The bedding materials that are modelled in this study are:
• Sawdust/woodchips (of similar chemical composition and hence “equal” in
model terms)
• Straw
• Peat
• Waste paper pellet (manufactured by e.g. Laxå Bruk)
-Other beddings such as hay, straw pellets, reed and different mixes of different bedding
materials are not included due to low biogas production (straw pellets) or lack of data
(hay, reed).
3.2.1. Physical properties/chemical composition
The ORWARE model uses a dataset for each material being investigated, known as a
‘vector’. Vectors are created for each of the bedding materials above and for pure horse
dung. By combining the horse dung vector with a bedding material vector, the model is
able to approximate the combination of horse dung and bedding material.
However, it should be noted that Cui, Shi and Li (2011) have demonstrated that anaerobic
digestion of bedding material in its raw form gives different results compared to anaero-
bic digestion of the same material that was used as bedding. For example, in the case of
wheat straw, the latter is more easily digested and can produce up to 56 % greater me-
7
thane yield kg-¹ volatile solids (VS). The amount of nitrogen, phosphorous and potassium
in the horse waste will depend partly on whether the horse is sedentary or exercising
(Westendorf and Krogmann, 2006). It is also unclear from the literature what amount of
urine is included, if any.
The ORWARE vectors for horse dung and bedding materials (except waste paper pellet
where a previous vector for waste paper have been applied) are included in Appendix A,
including justifications for the values used and any associated references. From the
ORWARE perspective the composition of sawdust and woodchips is the same, since both
are sourced from wood. From a horse keeping perspective however, it should be noted
that these materials have different properties, and absorb different amounts of urine. This
is not accounted for in the model.
3.2.2. Amounts of horse manure generated
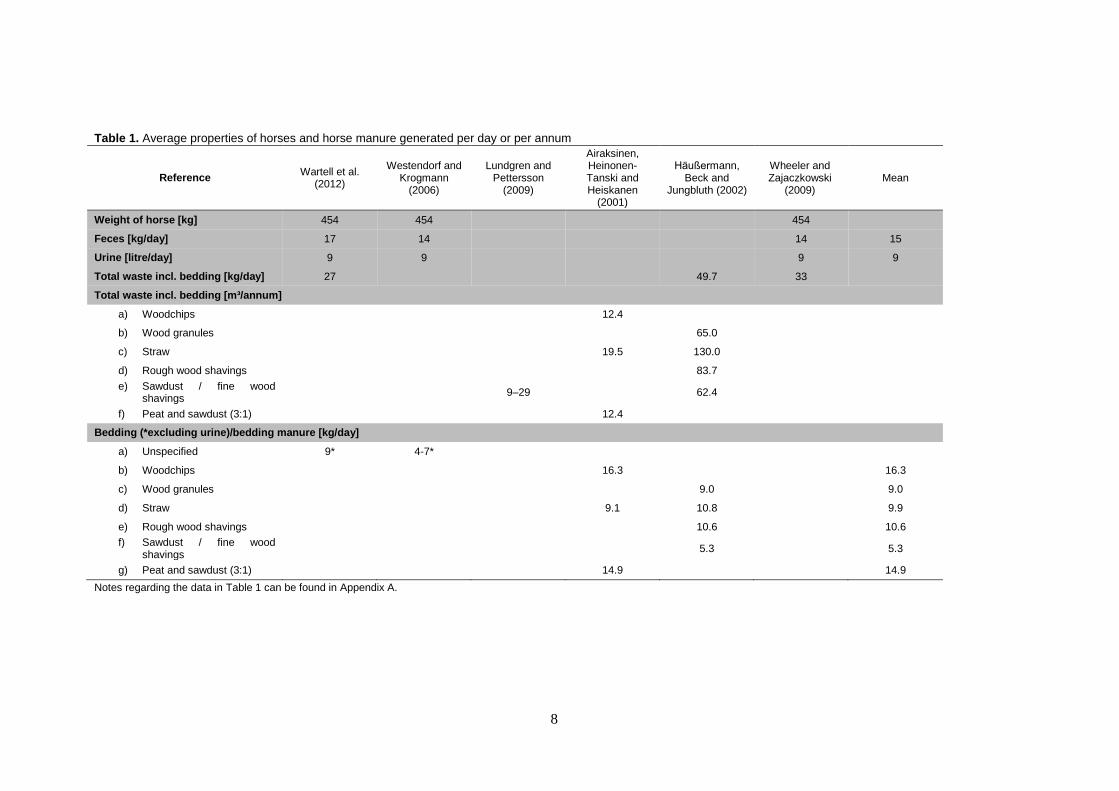
The data below (Table 1) shows that total waste per horse is in the range 9-29 m³ horse-¹
annum-¹. The Swedish statutory requirement for storage of deep litter manure is 9.9 m³
horse-¹ annum-¹ according to Swedish Board of Agriculture, where standard values in-
clude faeces and urine, bedding material, decomposition losses, cleaning water, water
spillage and precipitation. However not all manure will be collected, since horses are not
always in the stall.
The values of horse waste production that are assumed for the model, based on the
‘mean’ values in the Table 1: 15 kg faeces horse-¹ day-¹ and 9 kg urine1 horse-¹ day-¹
(Westendorf and Krogmann, 2006; Wheeler and Zajaczkowski, 2009; Wartell et al.,
2012), totalling 24 kg waste horse-¹ day-¹, equivalent to 8.7 tonnes waste horse-¹ annum-¹.
From Table 1, values for bedding material used per horse per day are: straw 9.9 kg, saw-
dust 5.3 kg, and woodchips 16.3 kg (Airaksinen, Heinonen-Tanski and Heiskanen, 2001;
Haußermann, Beck and Jungbluth, 2002), which would therefore correspond to 29 %, 18
% and 40 % of the total waste by weight, respectively2. A horse using sawdust for bed-
ding would thus3 produce approximately 10.7 tonnes annum-¹ of manure, assuming it is in
the stall all year. There is a large difference between sawdust and woodchips due to the
different absorption properties. However, no consistent data on the relationship between
type of bedding material, urine and faeces have been found, which in turn means that
sawdust and wood chips are treated equally in modelling.
Steineck et al. (2000 cited in Baky et al., 2012), agree that generated faeces and urine is
8-10 tonnes horse-¹ annum-¹, and that bedding material adds from a few tonnes up to
7 tonnes horse-¹ annum-¹, depending on the size of the horse4 (Jordbruksverket, 2006 cited
in Baky et al., 2012). However Jordbruksverket (2013) claims that the straw content of
horse manure can be up to 90 percent. Cui, Shi and Li (2011) state that bedding make up
25 % of the wet weight of manure.
1 Assuming 1 L urine equals 1 kg.
2 For example, for straw, 9.9 kg straw is 29 % of 15 kg faeces + 9 kg urine + 9.9 kg straw.
3 (24 kg waste + 5.3 kg sawdust) × 365 days = 10 695 kg.
4 They assume an average horse weighs 500 kg.
8
Table 1. Average properties of horses and horse manure generated per day or per annum
Reference Wartell et al.
(2012)
Westendorf and Krogmann
(2006)
Lundgren and Pettersson
(2009)
Airaksinen, Heinonen-Tanski and Heiskanen
(2001)
Haußermann, Beck and
Jungbluth (2002)
Wheeler and Zajaczkowski
(2009) Mean
Weight of horse [kg] 454 454 454
Feces [kg/day] 17 14 14 15
Urine [litre/day] 9 9 9 9
Total waste incl. bedding [kg/day] 27 49.7 33
Total waste incl. bedding [m³/annum]
a) Woodchips 12.4
b) Wood granules 65.0
c) Straw 19.5 130.0
d) Rough wood shavings 83.7
e) Sawdust / fine wood shavings
9–29 62.4
f) Peat and sawdust (3:1) 12.4
Bedding (*excluding urine)/bedding manure [kg/day]
a) Unspecified 9* 4-7*
b) Woodchips 16.3 16.3
c) Wood granules 9.0 9.0
d) Straw 9.1 10.8 9.9
e) Rough wood shavings 10.6 10.6
f) Sawdust / fine wood shavings
5.3 5.3
g) Peat and sawdust (3:1) 14.9 14.9
Notes regarding the data in Table 1 can be found in Appendix A.
9
The values for bedding should therefore be considered uncertain and liable to variation
depending on the horse-keeping practices and bedding materials in use. To account for
this, the systems analysis will investigate the importance of different proportions of bed-
ding in separate scenarios. This is being discussed further in Eriksson et al. (2015).
3.3. Transport
Transport modelling includes site specific data on distances between stables and treat-
ment plants and type of vehicle being used as well as data related to each vehicle type
such as energy efficiency, fuel type and related emission factors. No new data or specific
modelling of transports is made in this study. Transport distances between waste source
(stable) and waste treatment plant are set to 15, 50 or 80 km, thereby testing the im-
portance of transport distance. The distance between treatment plants are set to 15 km.
For biogas transported to a gas station and digestate and compost going to arable land, an
average distance of 50 km is used. All these figures are assumptions used in the national
study of a future biogas market (Holmström et al., 2013). Most vehicles are truck and
trailer transport. For details on fuel and emissions, see Eriksson et al. (2015).
10
4. Horse manure management systems
The sections below describe in more detail the various treatments/management systems
considered. See Table A-1 (Appendix A) for a system view of the different treatment
methods under consideration.
4.1. Unmanaged manure – natural decomposition
For the comparison of management systems, unmanaged horse manure represents the
base case. This is manure that is left in piles or dumped in nature and left to decompose
naturally. In this situation natural composting can occur, but often under sub-optimal
conditions; uncontrolled emissions of gases can be higher and contamination occurs due
to leaching of nutrients into water systems (Rodhe et al., 2015). Alternatively the manure
does not compost, due to a lack of nitrogen or water, and is leached of nutrients.
Few data were found on average emissions from unmanaged horse manure. The IPCC
(2006) estimates the methane emission factor for horse manure in cool climates5 to be
1.56 kg CH4 horse-¹ year-¹.
However, there is an overlap between emissions from unmanaged manure and those from
composting (cf. section 4.2), since unmanaged manure can still compost naturally. Rodhe
et al. (2015) measured methane emissions from a manure mix – 90 % horse manure and
bedding6 and 10 % food waste – before, during and after drum composting
7. The pre-
drum-composting manure (stored in a pile indoors) produced 72-85 % of the CO2 emis-
sions of all three stages combined, even though it was stored for only 3 days.
Their results also showed that for the manure stored prior to drum composting, methane
emissions (CH4) averaged 0.8 % of the total carbon (C) content, compared with an aver-
age 3.5 % from a literature review of cattle, prig and poultry manure (Webb et al., 2011
cited in Rodhe et al., 2015, p. 46). For a horse producing 24 kg waste day-¹ (see section
3.2), and assuming 22 % C (see Table A-2 in Appendix A), 0.8 % of C is 15.4 kg CH4
horse-¹ annum-¹.8
Rodhe et al. (2015) also provide measurements of emissions of nitrous oxide (N2O) from
the manure mix, ranging from zero to 0.23 % of total nitrogen (N), depending on the
stage of decomposition, compared with a standard IPCC value of 0.5 % (Rodhe et al.,
2015, p. 46). Ammonia (NH3) emissions were under 3 % of N content during all com-
posting stages (Rodhe et al., 2015, p. 47).
Steineck et al. (2001 cited in Rodhe et al., 2015) state that windrow composting over
about 1.5 months released ammonia emissions of 11.2 % of the total nitrogen (N) for
horse manure with straw bedding and 0.2 % of the total N from horse manure with peat as
bedding. Karlsson and Torstensson (2003) also tested emissions from windrow compost-
5 Cool climates are defined by the IPCC as those with an average annual temperature below 15 °C,
whereas the average annual temperature for the Gävleborg region is around 5 °C (SMHI, 2015), so
emissions may be lower. 6 With bedding material of 50% sawdust, 35% straw, 10% peat, and 5% straw pellets.
7 Figures taken from Rodhe et al. (2015, tables 7, 10, 24) Wiggeby study: averages of values for
food combinations 1, 2, 3 and 4 (‘compost A’ and ‘compost B’). 8 Although the 0.8 % methane emissions include emissions from the 10 % proportion of food and
the bedding material, and the indoor conditions meant there was a limited air flow.
11
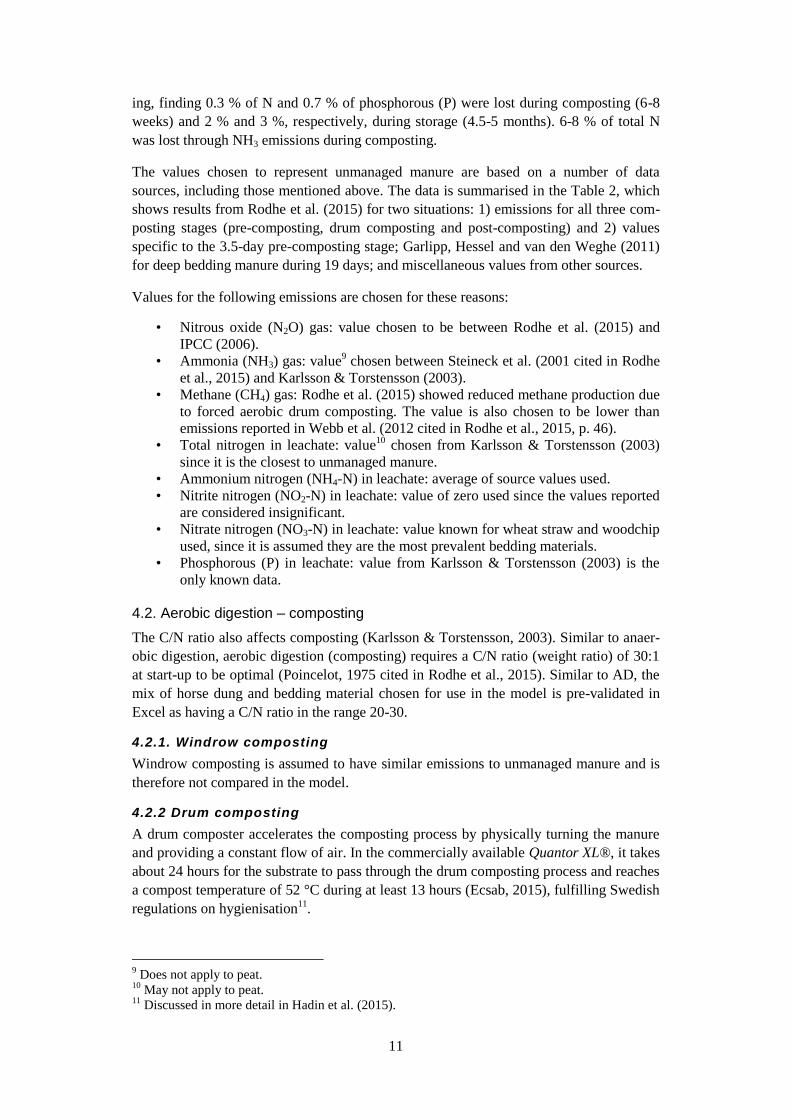
ing, finding 0.3 % of N and 0.7 % of phosphorous (P) were lost during composting (6-8
weeks) and 2 % and 3 %, respectively, during storage (4.5-5 months). 6-8 % of total N
was lost through NH3 emissions during composting.
The values chosen to represent unmanaged manure are based on a number of data
sources, including those mentioned above. The data is summarised in the Table 2, which
shows results from Rodhe et al. (2015) for two situations: 1) emissions for all three com-
posting stages (pre-composting, drum composting and post-composting) and 2) values
specific to the 3.5-day pre-composting stage; Garlipp, Hessel and van den Weghe (2011)
for deep bedding manure during 19 days; and miscellaneous values from other sources.
Values for the following emissions are chosen for these reasons:
• Nitrous oxide (N2O) gas: value chosen to be between Rodhe et al. (2015) and
IPCC (2006).
• Ammonia (NH3) gas: value9 chosen between Steineck et al. (2001 cited in Rodhe
et al., 2015) and Karlsson & Torstensson (2003).
• Methane (CH4) gas: Rodhe et al. (2015) showed reduced methane production due
to forced aerobic drum composting. The value is also chosen to be lower than
emissions reported in Webb et al. (2012 cited in Rodhe et al., 2015, p. 46).
• Total nitrogen in leachate: value10
chosen from Karlsson & Torstensson (2003)
since it is the closest to unmanaged manure.
• Ammonium nitrogen (NH4-N) in leachate: average of source values used.
• Nitrite nitrogen (NO2-N) in leachate: value of zero used since the values reported
are considered insignificant.
• Nitrate nitrogen (NO3-N) in leachate: value known for wheat straw and woodchip
used, since it is assumed they are the most prevalent bedding materials.
• Phosphorous (P) in leachate: value from Karlsson & Torstensson (2003) is the
only known data.
4.2. Aerobic digestion – composting
The C/N ratio also affects composting (Karlsson & Torstensson, 2003). Similar to anaer-
obic digestion, aerobic digestion (composting) requires a C/N ratio (weight ratio) of 30:1
at start-up to be optimal (Poincelot, 1975 cited in Rodhe et al., 2015). Similar to AD, the
mix of horse dung and bedding material chosen for use in the model is pre-validated in
Excel as having a C/N ratio in the range 20-30.
4.2.1. Windrow composting
Windrow composting is assumed to have similar emissions to unmanaged manure and is
therefore not compared in the model.
4.2.2 Drum composting
A drum composter accelerates the composting process by physically turning the manure
and providing a constant flow of air. In the commercially available Quantor XL®, it takes
about 24 hours for the substrate to pass through the drum composting process and reaches
a compost temperature of 52 °C during at least 13 hours (Ecsab, 2015), fulfilling Swedish
regulations on hygienisation11
.
9 Does not apply to peat.
10 May not apply to peat.
11 Discussed in more detail in Hadin et al. (2015).

12
Table 2. Data sources to determine unmanaged horse manure emissions
Reference Rodhe et al.
(2015)
IPCC, 2006
cited in Rodhe et al.
(2015, p. 46)
Webb et al. (2012 cited in Rodhe et al., 2015, p.
46)
Rodhe et al. (2015)
Garlipp, Hessel and van den Weghe (2011)
Steineck et al. (2001 cited in Rodhe et al.,
2015)
Karlsson &
Torstensson (2003)
Chosen value
for model
Comments
All composting stages
combined: pre-, drum- and post-compost
Emissions from
chicken, pig and cow manure
Pre-compost during 3.5 days
Deep bedding manure during 19 days
Windrow composting during
1.5 months
Windrow 6-8 weeks
plus storage 4-5.5 months
Manure mix
90 % horse manure & 10% organic food
waste
- -
90 % horse manure & 10%
organic food waste
Horse manure: 60% horse faeces, 60 L urea, 25 kg bedding
Bedding
50% sawdust, 35% straw,
10% peat, 5% straw pellets
- -
50% sawdust, 35% straw,
10% peat, 5% straw pellets
Wheat straw
Rye straw Sawdust Straw Peat
Mostly straw, some
sawdust
Air emissions
- N₂O, Nitrous oxide [% of total N] 0-0.23% 0.5% 0.01% 0.25%
- NH₃, Ammonia [% of total N] 3% 0.5% 11.2% 0.2% 6-8% 10.0%
- CH₄, methane [% of total C] 0.86% 3.5% 0.8% 2.0%
- Leachate
- Nt, total nitrogen [% of total N] 0.10% 0.06% 0.10% 0.3% 0.30%
- NH₄-N, ammonium nitrogen [% total N] 0.01175% (drum only)
0.004% 0.005% 0.004% 0.004%
- NO₂-N, nitrite nitrogen [% of total N] 0.00015% 0.00017% 0% 0%
- NO₃-N, nitrate nitrogen [% of total N] 0.033% 0.010% 0.034% 0.033%
- P, phosphorous [% of total P] 0.7% 0.7%
13
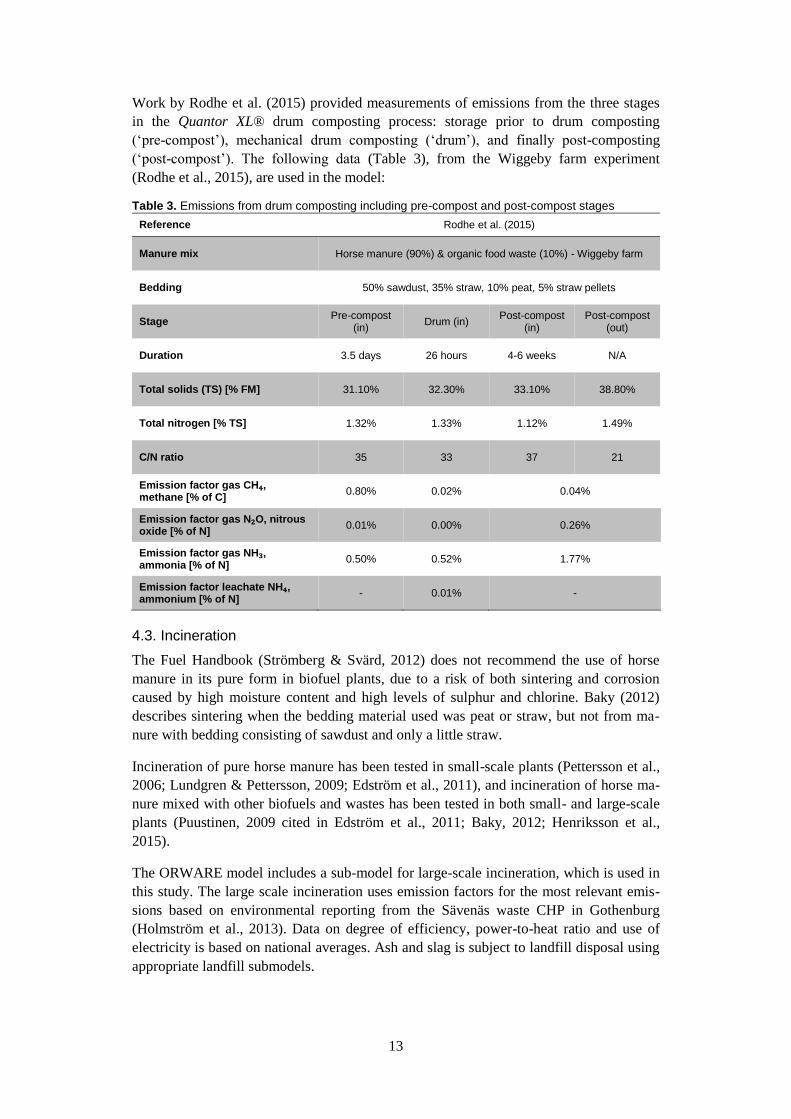
Work by Rodhe et al. (2015) provided measurements of emissions from the three stages
in the Quantor XL® drum composting process: storage prior to drum composting
(‘pre-compost’), mechanical drum composting (‘drum’), and finally post-composting
(‘post-compost’). The following data (Table 3), from the Wiggeby farm experiment
(Rodhe et al., 2015), are used in the model:
Table 3. Emissions from drum composting including pre-compost and post-compost stages
Reference Rodhe et al. (2015)
Manure mix Horse manure (90%) & organic food waste (10%) - Wiggeby farm
Bedding 50% sawdust, 35% straw, 10% peat, 5% straw pellets
Stage Pre-compost
(in) Drum (in)
Post-compost (in)
Post-compost (out)
Duration 3.5 days 26 hours 4-6 weeks N/A
Total solids (TS) [% FM] 31.10% 32.30% 33.10% 38.80%
Total nitrogen [% TS] 1.32% 1.33% 1.12% 1.49%
C/N ratio 35 33 37 21
Emission factor gas CH₄, methane [% of C]
0.80% 0.02% 0.04%
Emission factor gas N₂O, nitrous oxide [% of N]
0.01% 0.00% 0.26%
Emission factor gas NH₃, ammonia [% of N]
0.50% 0.52% 1.77%
Emission factor leachate NH₄, ammonium [% of N]
- 0.01% -
4.3. Incineration
The Fuel Handbook (Strömberg & Svärd, 2012) does not recommend the use of horse
manure in its pure form in biofuel plants, due to a risk of both sintering and corrosion
caused by high moisture content and high levels of sulphur and chlorine. Baky (2012)
describes sintering when the bedding material used was peat or straw, but not from ma-
nure with bedding consisting of sawdust and only a little straw.
Incineration of pure horse manure has been tested in small-scale plants (Pettersson et al.,
2006; Lundgren & Pettersson, 2009; Edström et al., 2011), and incineration of horse ma-
nure mixed with other biofuels and wastes has been tested in both small- and large-scale
plants (Puustinen, 2009 cited in Edström et al., 2011; Baky, 2012; Henriksson et al.,
2015).
The ORWARE model includes a sub-model for large-scale incineration, which is used in
this study. The large scale incineration uses emission factors for the most relevant emis-
sions based on environmental reporting from the Sävenäs waste CHP in Gothenburg
(Holmström et al., 2013). Data on degree of efficiency, power-to-heat ratio and use of
electricity is based on national averages. Ash and slag is subject to landfill disposal using
appropriate landfill submodels.
14
However, for small-scale incineration, data is taken from experiments by Baky (Baky et
al., 2012; Baky, 2013b). Pre-drying horse manure has been shown in tests to increase the
lower heating value (LHV) and produce a net gain in energy of 1.9 MWh/tonne of dried
manure, after deducting the energy used for drying (Baky, 2012). Therefore manure is
dried prior to combustion, decreasing water percentage from 57.4 to 9.7 %. Drying
equipment uses 0.40 MWh heat/ton wet manure for evaporating water. Due to aeration of
the manure a slight composting takes place, leading to some losses of C and N. The fur-
nace has a degree of efficiency of 80 %. All energy is released as heat and utilised (just
50 % utilisation in the report). The simplified model does not handle combustion resi-
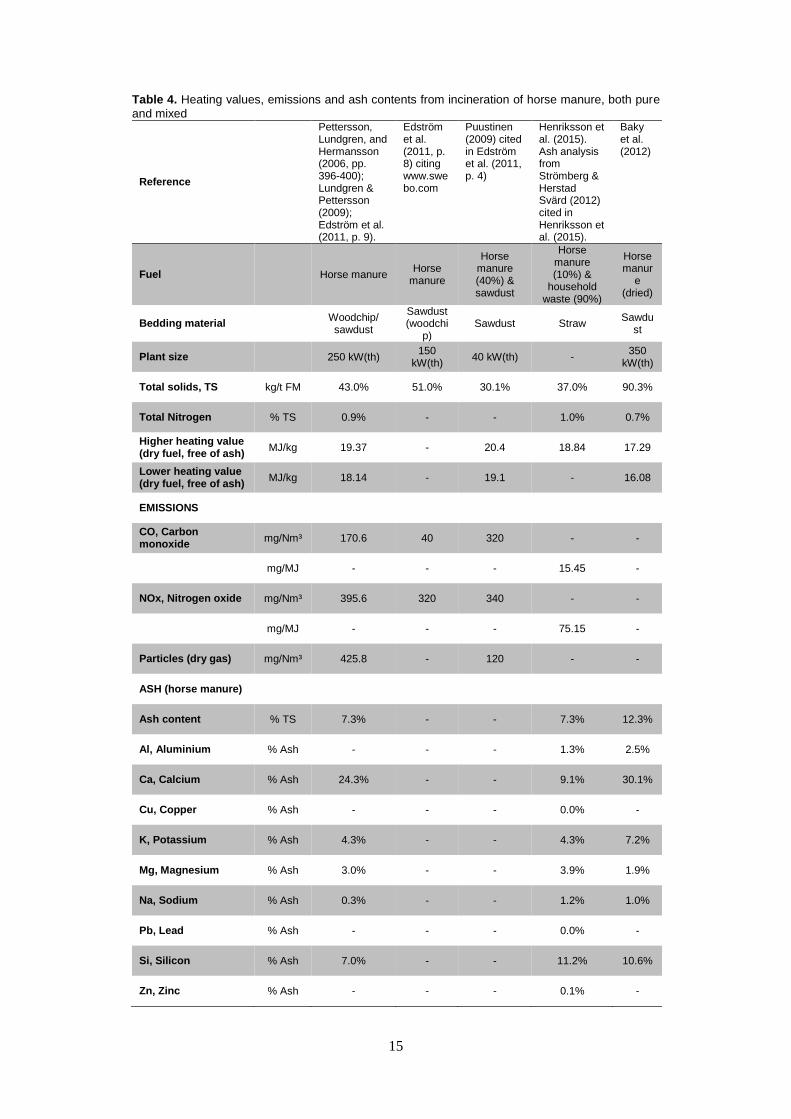
dues. For further details, please see references above. In Table 4 some data on incinera-
tion collected from literature is displayed.
4.4. Anaerobic digestion (AD)
The mono-feedstock anaerobic digestion (AD) of horse dung and of horse manure has
been tested in numerous lab-based and pilot plant trials, but so far there are no known
large-scale implementations. From these trials the results of measuring carbon, nitrogen
and nutrient content and other chemical compounds in the substrate are shown to vary
considerably due, in part, to the manure’s freshness (Mattsson, Karlsson and Nilsson,
2015) and the bedding material used (Olsson et al., 2014).
Measurements of methane production from the digestion process of horse dung (i.e. with-
out bedding material) are also very inconsistent, production is strongly influenced by
feeding intensity and feed composition (Mönch-Tegeder, 2013, p.166 citing Møller et al.,
2004 and Amon et al., 2007).
The age of the manure can also have a strong influence on methane production. Accord-
ing to Mattsson, Karlsson and Nilsson (2015), fresh horse manure produced more me-
thane when peat had been used as a bedding material, whereas for one-month-old horse
manure, straw bedding produced more methane. After two months of storage, methane
production was worse in both cases compared to fresher manure. Even a late harvest due
to weather conditions can affect straw feed quality and in turn methane production
(Mönch-Tegeder, 2014). See also section 4.4.1.
Therefore, although the model has modules for AD, it can only provide an approximate
calculation of biogas production and emissions. It is still possible to validate those values
as being within the range collected in the inventory data. This data is summarised in sec-
tion 4.4.5.
4.4.1. Storage
Garlipp, Hessel, and van den Weghe (2011) showed that deep litter horse manure, placed
in mostly anaerobic conditions, gave different results according to the bedding material,
with wheat straw producing significantly higher NH3, N2O, CO2, CH4 and H2O concen-
trations over 19 days compared to rye straw, indicating faster degradation. Both types of
straw generated significantly higher concentrations of N2O, CO2, and CH4 compared to
wood shavings over 19 days.
15
Table 4. Heating values, emissions and ash contents from incineration of horse manure, both pure
and mixed
Reference
Pettersson, Lundgren, and Hermansson (2006, pp. 396-400); Lundgren & Pettersson (2009); Edström et al. (2011, p. 9).
Edström et al. (2011, p. 8) citing www.swebo.com
Puustinen (2009) cited in Edström et al. (2011, p. 4)
Henriksson et al. (2015). Ash analysis from Strömberg & Herstad Svärd (2012) cited in Henriksson et al. (2015).
Baky et al. (2012)
Fuel Horse manure Horse
manure
Horse manure (40%) & sawdust
Horse manure (10%) &
household waste (90%)
Horse manur
e (dried)
Bedding material Woodchip/ sawdust
Sawdust (woodchi
p) Sawdust Straw
Sawdust
Plant size 250 kW(th) 150
kW(th) 40 kW(th) -
350 kW(th)
Total solids, TS kg/t FM 43.0% 51.0% 30.1% 37.0% 90.3%
Total Nitrogen % TS 0.9% - - 1.0% 0.7%
Higher heating value (dry fuel, free of ash)
MJ/kg 19.37 - 20.4 18.84 17.29
Lower heating value (dry fuel, free of ash)
MJ/kg 18.14 - 19.1 - 16.08
EMISSIONS
CO, Carbon monoxide
mg/Nm³ 170.6 40 320 - -
mg/MJ - - - 15.45 -
NOx, Nitrogen oxide mg/Nm³ 395.6 320 340 - -
mg/MJ - - - 75.15 -
Particles (dry gas) mg/Nm³ 425.8 - 120 - -
ASH (horse manure)
Ash content % TS 7.3% - - 7.3% 12.3%
Al, Aluminium % Ash - - - 1.3% 2.5%
Ca, Calcium % Ash 24.3% - - 9.1% 30.1%
Cu, Copper % Ash - - - 0.0% -
K, Potassium % Ash 4.3% - - 4.3% 7.2%
Mg, Magnesium % Ash 3.0% - - 3.9% 1.9%
Na, Sodium % Ash 0.3% - - 1.2% 1.0%
Pb, Lead % Ash - - - 0.0% -
Si, Silicon % Ash 7.0% - - 11.2% 10.6%
Zn, Zinc % Ash - - - 0.1% -
16
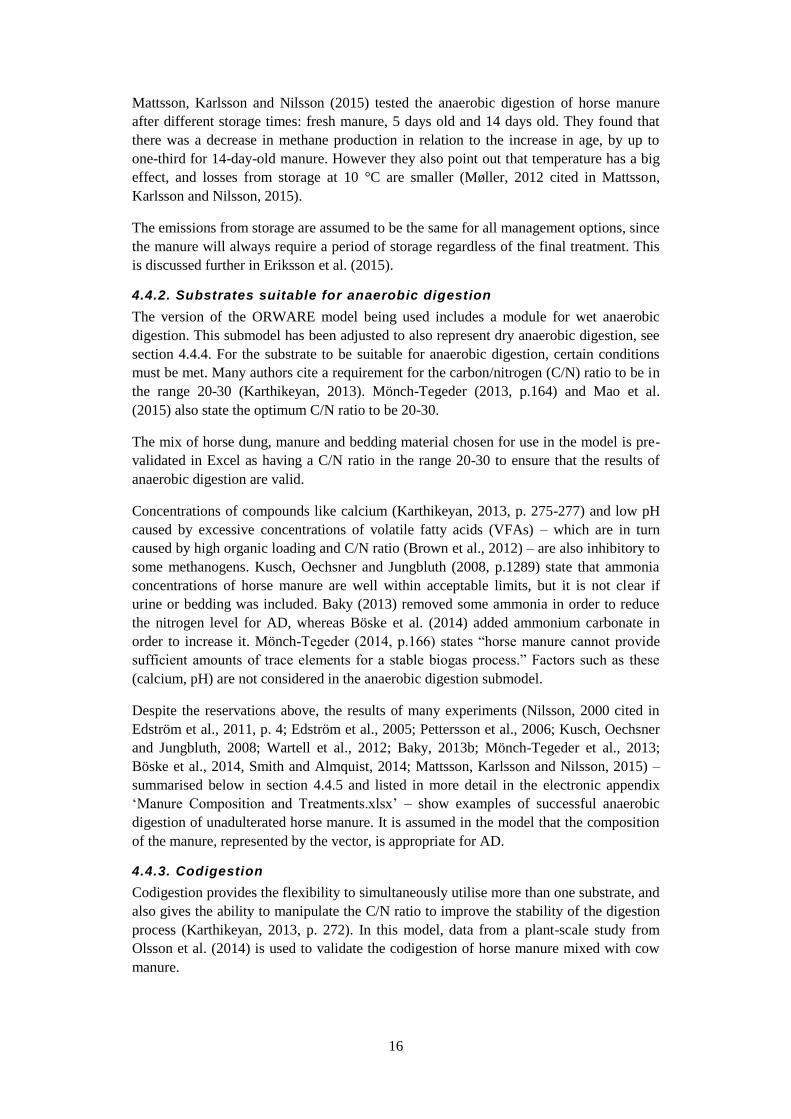
Mattsson, Karlsson and Nilsson (2015) tested the anaerobic digestion of horse manure
after different storage times: fresh manure, 5 days old and 14 days old. They found that
there was a decrease in methane production in relation to the increase in age, by up to
one-third for 14-day-old manure. However they also point out that temperature has a big
effect, and losses from storage at 10 °C are smaller (Møller, 2012 cited in Mattsson,
Karlsson and Nilsson, 2015).
The emissions from storage are assumed to be the same for all management options, since
the manure will always require a period of storage regardless of the final treatment. This
is discussed further in Eriksson et al. (2015).
4.4.2. Substrates suitable for anaerobic digestion
The version of the ORWARE model being used includes a module for wet anaerobic
digestion. This submodel has been adjusted to also represent dry anaerobic digestion, see
section 4.4.4. For the substrate to be suitable for anaerobic digestion, certain conditions
must be met. Many authors cite a requirement for the carbon/nitrogen (C/N) ratio to be in
the range 20-30 (Karthikeyan, 2013). Mönch-Tegeder (2013, p.164) and Mao et al.
(2015) also state the optimum C/N ratio to be 20-30.
The mix of horse dung, manure and bedding material chosen for use in the model is pre-
validated in Excel as having a C/N ratio in the range 20-30 to ensure that the results of
anaerobic digestion are valid.
Concentrations of compounds like calcium (Karthikeyan, 2013, p. 275-277) and low pH
caused by excessive concentrations of volatile fatty acids (VFAs) – which are in turn
caused by high organic loading and C/N ratio (Brown et al., 2012) – are also inhibitory to
some methanogens. Kusch, Oechsner and Jungbluth (2008, p.1289) state that ammonia
concentrations of horse manure are well within acceptable limits, but it is not clear if
urine or bedding was included. Baky (2013) removed some ammonia in order to reduce
the nitrogen level for AD, whereas Böske et al. (2014) added ammonium carbonate in
order to increase it. Mönch-Tegeder (2014, p.166) states “horse manure cannot provide
sufficient amounts of trace elements for a stable biogas process.” Factors such as these
(calcium, pH) are not considered in the anaerobic digestion submodel.
Despite the reservations above, the results of many experiments (Nilsson, 2000 cited in
Edström et al., 2011, p. 4; Edström et al., 2005; Pettersson et al., 2006; Kusch, Oechsner
and Jungbluth, 2008; Wartell et al., 2012; Baky, 2013b; Mönch-Tegeder et al., 2013;
Böske et al., 2014, Smith and Almquist, 2014; Mattsson, Karlsson and Nilsson, 2015) –
summarised below in section 4.4.5 and listed in more detail in the electronic appendix
‘Manure Composition and Treatments.xlsx’ – show examples of successful anaerobic
digestion of unadulterated horse manure. It is assumed in the model that the composition
of the manure, represented by the vector, is appropriate for AD.
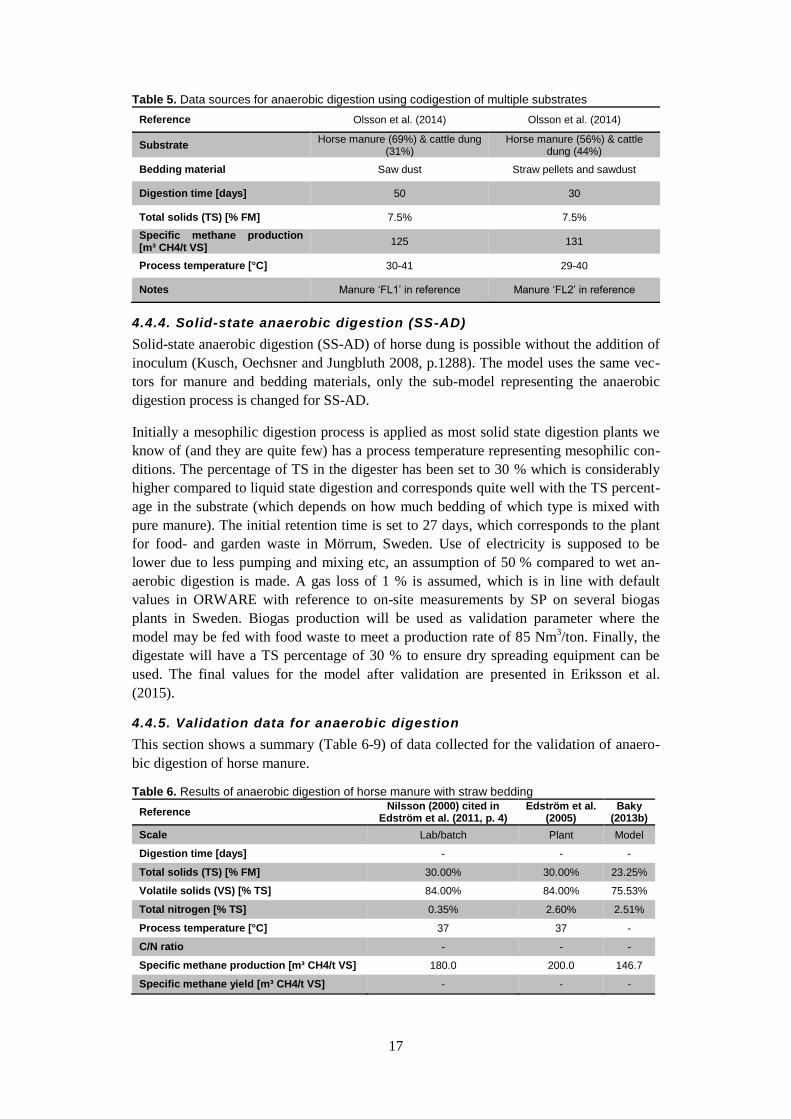
4.4.3. Codigestion
Codigestion provides the flexibility to simultaneously utilise more than one substrate, and
also gives the ability to manipulate the C/N ratio to improve the stability of the digestion
process (Karthikeyan, 2013, p. 272). In this model, data from a plant-scale study from
Olsson et al. (2014) is used to validate the codigestion of horse manure mixed with cow
manure.
17
Table 5. Data sources for anaerobic digestion using codigestion of multiple substrates
Reference Olsson et al. (2014) Olsson et al. (2014)
Substrate Horse manure (69%) & cattle dung
(31%) Horse manure (56%) & cattle
dung (44%)
Bedding material Saw dust Straw pellets and sawdust
Digestion time [days] 50 30
Total solids (TS) [% FM] 7.5% 7.5%
Specific methane production [m³ CH4/t VS]
125 131
Process temperature [°C] 30-41 29-40
Notes Manure ‘FL1’ in reference Manure ‘FL2’ in reference
4.4.4. Solid-state anaerobic digestion (SS-AD)
Solid-state anaerobic digestion (SS-AD) of horse dung is possible without the addition of
inoculum (Kusch, Oechsner and Jungbluth 2008, p.1288). The model uses the same vec-
tors for manure and bedding materials, only the sub-model representing the anaerobic
digestion process is changed for SS-AD.
Initially a mesophilic digestion process is applied as most solid state digestion plants we
know of (and they are quite few) has a process temperature representing mesophilic con-
ditions. The percentage of TS in the digester has been set to 30 % which is considerably
higher compared to liquid state digestion and corresponds quite well with the TS percent-
age in the substrate (which depends on how much bedding of which type is mixed with
pure manure). The initial retention time is set to 27 days, which corresponds to the plant
for food- and garden waste in Mörrum, Sweden. Use of electricity is supposed to be
lower due to less pumping and mixing etc, an assumption of 50 % compared to wet an-
aerobic digestion is made. A gas loss of 1 % is assumed, which is in line with default
values in ORWARE with reference to on-site measurements by SP on several biogas
plants in Sweden. Biogas production will be used as validation parameter where the
model may be fed with food waste to meet a production rate of 85 Nm3/ton. Finally, the
digestate will have a TS percentage of 30 % to ensure dry spreading equipment can be
used. The final values for the model after validation are presented in Eriksson et al.
(2015).
4.4.5. Validation data for anaerobic digestion
This section shows a summary (Table 6-9) of data collected for the validation of anaero-
bic digestion of horse manure.
Table 6. Results of anaerobic digestion of horse manure with straw bedding
Reference Nilsson (2000) cited in
Edström et al. (2011, p. 4) Edström et al.
(2005) Baky
(2013b)
Scale Lab/batch Plant Model
Digestion time [days] - - -
Total solids (TS) [% FM] 30.00% 30.00% 23.25%
Volatile solids (VS) [% TS] 84.00% 84.00% 75.53%
Total nitrogen [% TS] 0.35% 2.60% 2.51%
Process temperature [°C] 37 37 -
C/N ratio - - -
Specific methane production [m³ CH4/t VS] 180.0 200.0 146.7
Specific methane yield [m³ CH4/t VS] - - -
18
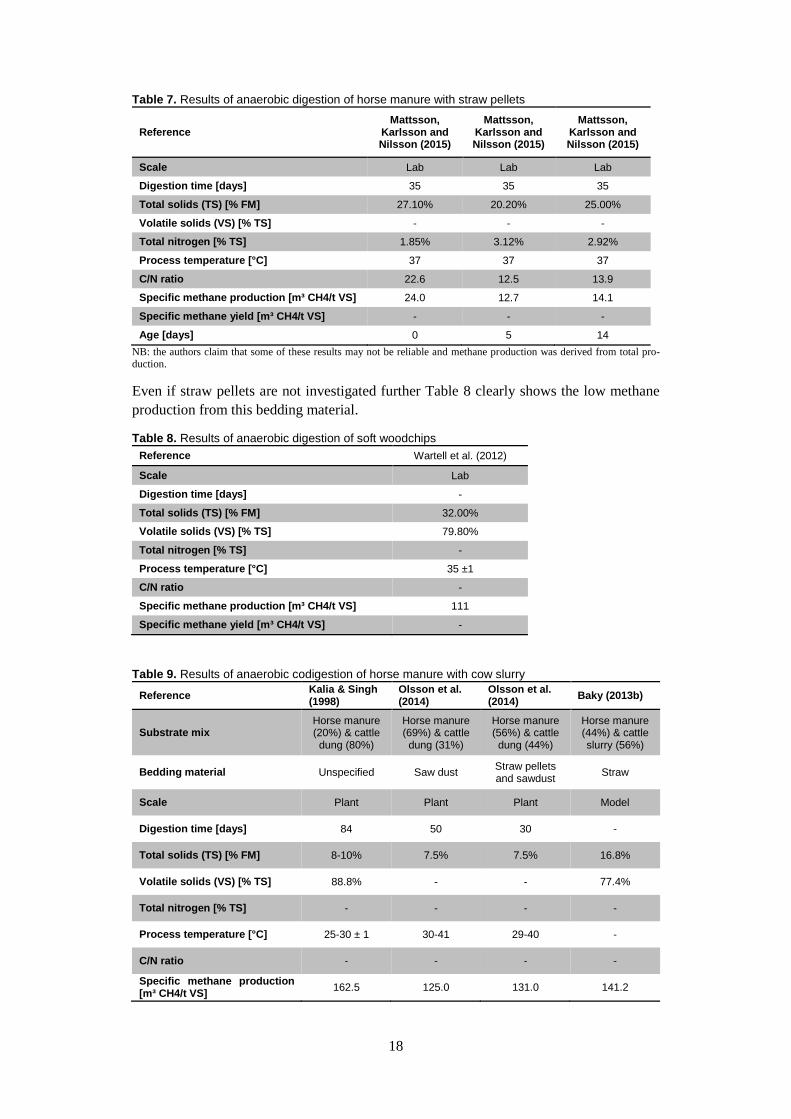
Table 7. Results of anaerobic digestion of horse manure with straw pellets
Reference Mattsson,
Karlsson and Nilsson (2015)
Mattsson, Karlsson and Nilsson (2015)
Mattsson, Karlsson and Nilsson (2015)
Scale Lab Lab Lab
Digestion time [days] 35 35 35
Total solids (TS) [% FM] 27.10% 20.20% 25.00%
Volatile solids (VS) [% TS] - - -
Total nitrogen [% TS] 1.85% 3.12% 2.92%
Process temperature [°C] 37 37 37
C/N ratio 22.6 12.5 13.9
Specific methane production [m³ CH4/t VS] 24.0 12.7 14.1
Specific methane yield [m³ CH4/t VS] - - -
Age [days] 0 5 14
NB: the authors claim that some of these results may not be reliable and methane production was derived from total pro-duction.
Even if straw pellets are not investigated further Table 8 clearly shows the low methane
production from this bedding material.
Table 8. Results of anaerobic digestion of soft woodchips
Reference Wartell et al. (2012)
Scale Lab
Digestion time [days] -
Total solids (TS) [% FM] 32.00%
Volatile solids (VS) [% TS] 79.80%
Total nitrogen [% TS] -
Process temperature [°C] 35 ±1
C/N ratio -
Specific methane production [m³ CH4/t VS] 111
Specific methane yield [m³ CH4/t VS] -
Table 9. Results of anaerobic codigestion of horse manure with cow slurry
Reference Kalia & Singh (1998)
Olsson et al. (2014)
Olsson et al. (2014)
Baky (2013b)
Substrate mix Horse manure (20%) & cattle dung (80%)
Horse manure (69%) & cattle dung (31%)
Horse manure (56%) & cattle dung (44%)
Horse manure (44%) & cattle slurry (56%)
Bedding material Unspecified Saw dust Straw pellets and sawdust
Straw
Scale Plant Plant Plant Model
Digestion time [days] 84 50 30 -
Total solids (TS) [% FM] 8-10% 7.5% 7.5% 16.8%
Volatile solids (VS) [% TS] 88.8% - - 77.4%
Total nitrogen [% TS] - - - -
Process temperature [°C] 25-30 ± 1 30-41 29-40 -
C/N ratio - - - -
Specific methane production [m³ CH4/t VS]
162.5 125.0 131.0 141.2
19
4.4.6. Pretreatment for AD
Hadin, Eriksson and Jonsson (2015) explained that hygienisation must be used in Sweden
when horse manure is collected for treatment from two or more different production loca-
tions. The model therefore assumes that hygienisation is used and this is included in the
model.
Lignocellulosic material, such as straw in horse manure, can cause low bioavailability or
low biodegradability (Carlsson et al., 2012). The results data gathering of horse manure
pretreatment methods for AD did not provide sufficient data for modelling, however they
suggest that an increase of biogas production and/or rates of generation are possible and
the potential methods are briefly discussed below. The model does, however, include a
pre-existing sub-model for steam explosion.
Potential pretreatments of horse manure for AD
The chemical treatment of lignocellulosic materials has been investigated in a number of
studies, although no studies were found that tested chemical pretreatments of purely horse
dung or horse manure. For example, treating straw from cattle and horse manure with N-
methylmorpholine oxide (NMMO) for 15 hours was shown to increase the methane yield
by 51 %, through a decrease in the structural lignin content (Aslanzadeh et al., 2011).
Teghammar (2013) also showed that NMMO pretreatment of spruce woodchips for 15
hours resulted in an increased production of 202 NmL CH4/g. Lidner et al. (2015) warn
that the high cost of chemicals and investment in equipment is an obstacle for chemical
pretreatment in full-scale plants.
In contrast to chemical and thermal methods, mechanical pretreatment has no inhibitory
or toxic byproducts formed during the disintegration process (Mönch-Tegeder et al.,
2014). There is no change to the total solids (TS), volatile solids (VS) or chemical com-
postition (Mönch-Tegeder et al., 2014, p.142). In addition, mechanical devices for de-
composition are available and easy to implement in biogas plants (Mönch-Tegeder et al.,
2014, p.139). The main disadvantage of mechanical pretreatment is the high energy con-
sumption (Bruni et al. 2010).
Chopping manure with a compost chopper was shown by Kusch, Oechsner and Jungbluth
(2008, p.1288) to increased yield, especially during the initial stages of digestion (up to
42 days), although the final methane yield was the same over long digestion times. How-
ever, no data was provided on the energy consumption of the chopping process or the net
energy saving.
Mönch-Tegeder et al. (2014), on the other hand, demonstrated that 15 seconds of me-
chanical grinding of horse manure (with straw bedding) could lead to a positive energy
balance of 12.7 kWh tonne-¹ FM, since methane yields were increased 10 % in compari-
son to untreated manure.

20
21
References
Airaksinen, S., Heinonen-Tanski, H., Heiskanen, M.-L. (2001) ‘Quality of different bedding mate-
rials and their influence on the compostability of horse manure’, Journal of Equine Veterinary
Science, 21(3), 125–130.
Aslanzadeh, S. (2014) Pretreatment of Cellulosic Waste and High-Rate Biogas Production
[online], available: http://hdl.handle.net/2320/12853.
Baky, A. (2013a) Life Cycle Inventory & Assessment Report: Combustion of Horse Manure with
Heat Utilisation, Sweden, JTI - Swedish Institute of Agricultural and Environmental Engineer-
ing.
Baky, A. (2013b) Life Cycle Inventory Report : Co-Digestion of Horse Manure and Dairy Cattle
Slurry, Sweden, JTI - Swedish Institute of Agricultural and Environmental Engineering, availa-
ble: http://www.balticmanure.eu/download/Reports/codigestion_web.pdf [Accessed 31 Mar
2015].
Baky, A., Karlsson, E., Norberg, I., Tersmeden, M., Yngvesson, J. (2012) Förbränning Av Förtor-
kad Häst Gödsel På Gårdsnivå, JTI - Swedish Institute of Agricultural and Environmental
Engineering.
Bisaillon, M., Haraldsson, M., Sundberg, J., Eriksson, O.N. (2000) Systemstudie Avfall Borås (A
Systems Study of the Future Waste Management System in Borås) (In Swedish with English
Summary), SP Sveriges Tekniska Forskningsinstitut.
Brown, D., Shi, J., Li, Y. (2012) ‘Comparison of solid-state to liquid anaerobic digestion of ligno-
cellulosic feedstocks for biogas production’, Bioresource Technology, 124, 379–386, available:
http://dx.doi.org/10.1016/j.biortech.2012.08.051.
Bruni, E., Jensen, A.P., Angelidaki, I. (2010) ‘Comparative study of mechanical, hydrothermal,
chemical and enzymatic treatments of digested biofibers to improve biogas production’, Biore-
source Technology, 101(22), 8713–8717, available:
http://dx.doi.org/10.1016/j.biortech.2010.06.108.
Boske, J., Wirth, B., Garlipp, F., Mumme, J., Van den Weghe, H. (2014) ‘Anaerobic digestion of
horse dung mixed with different bedding materials in an upflow solid-state (UASS) reactor at
mesophilic conditions’, Bioresource Technology, 158, 111–118.
Carlsson, M., Lagerkvist, A., Morgan-Sagastume, F. (2012) ‘The effects of substrate pre-treatment
on anaerobic digestion systems: A review’, Waste Management, 32(9), 1634–1650, available:
http://dx.doi.org/10.1016/j.wasman.2012.04.016.
Cesaro, A., Belgiorno, V. (2014) ‘Pretreatment methods to improve anaerobic biodegradability of
organic municipal solid waste fractions’, Chemical Engineering Journal, 240, 24–37, available:
http://dx.doi.org/10.1016/j.cej.2013.11.055.
Cui, Z., Shi, J., Li, Y. (2011) ‘Solid-state anaerobic digestion of spent wheat straw from horse
stall’, Bioresource Technology, 102(20), 9432–9437, available:
http://dx.doi.org/10.1016/j.biortech.2011.07.062.
Ecsab (2015) Approved Drum Composting System for Manure, Sludge, Biowaste [online], availa-
ble: http://www.ecsab.com/en_index.htm [Accessed 30 Jun 2015].
Edström, M., Nordberg, Å., Ringmar, A. (2005) Utvärdering Av Gårdsbaserad Biogasanläggning
På Hagavik. JTI-Rapport Kretslopp & Avfall 31, JTI - Swedish Institute of Agricultural and
Environmental Engineering.
Edström, B.M., Schüßler, I., Luostarinen, S., Edström, M. (2011) Combustion of Manure: Manure
as Fuel in a Heating Plant, available:
http://www.balticmanure.eu/en/knowledge_forum/reports/project_results/manure_energy/com-
bustion_of_manure_manure_as_fuel_in_a_heating_plant.htm [Accessed 20 Feb 2015].
22
Eriksson, O., Hadin, Å., Hennessy, J., Jonsson, D. (2015) Hästkrafter och hästnäring – hållbara
systemlösningar för biogas och biogödsel - Explorativ systemanalys med datormodellen
ORWARE, FoU-rapport 43, University of Gävle
Eskilsson, J. (2013) Gödsel Och Miljö 2014, Jordbruksverket, Jönköping.
Femling, M. (2003). Hästen i Gävleborg. Förstudierapport 2003: 4. Lantbruks- och veterinären-
heten. Länsstyrelsen Gävleborg
Garlipp, F., Hessel, E.F., van den Weghe, H.F. a. (2011) ‘Characteristics of Gas Generation (NH3,
CH4, N2O, CO2, H2O) From Horse Manure Added to Different Bedding Materials Used in Deep
Litter Bedding Systems’, Journal of Equine Veterinary Science, 31(7), 383–395, available:
http://dx.doi.org/10.1016/j.jevs.2011.01.007.
Government of Saskatchewan (2008) Straw Rations – Wintering Cows [online], available:
http://www.agriculture.gov.sk.ca/Default.aspx?DN=5b2ed401-5fd2-483e-bce1-92c8d1687ba4.
Hadin, Å., Eriksson, O., Jonsson, D. (2015) Energi och växtnäring från hästgödsel – Förbehand-
ling, rötning och biogödselavsättning, FoU-rapport 42, University of Gävle
Henriksson, G., Johansson, I., Hedenstedt, A., Johansson, I. (2015) Benchmarking Av Gödselsam-
rötning Med Avloppsslam Mot Förbränning Av Häst- Och Djurparksgödsel, SP Sveriges Tek-
niska Forskningsinstitut, Borås.
Hermansson, R. Lundgren, J., Pettersson, E., Lindgren, A., Forsberg, M., Jansson, M (Unknown).
Miljövänlig eldning av hästspillning, AB Swebo Flis.
Holmström, D., Bisaillon, M., Eriksson, O., Hellström, H., Nilsson, K. (2013) Framtida mark-
naden för biogas från avfall (The future market for biogas from waste), project report WR 46,
WASTE REFINERY, SP Sveriges Tekniska Forskningsinstitut, ISSN 1654-4706 (In Swedish)
Häußermann, A., Beck, J., Jungbluth, T. (2002) ‘Litter in horse keeping’, Landtechnik, 57(1), 50–
51, available: https://www.landtechnik-
online.eu/ojs2.4.5/index.php/landtechnik/article/viewFile/2002-1-050-051/2759 [Accessed 8
Jun 2015].
Intergovernmental Panel on Climate Change (IPCC) (2006) 2006 IPCC Guidelines for National
Greenhouse Gas Inventories.
Jordbruksverket (2013) Hästgödsel – En Naturlig Resurs, Jordbruksverket, available:
http://www2.jordbruksverket.se/webdav/files/SJV/trycksaker/Pdf_jo/jo13_5.pdf.
Kalia, A.K., Singh, S.P. (1998) ‘Horse dung as a partial substitute for cattle dung for operating
family-size biogas plants in a hilly region’, Bioresource Technology, 64, 63–66.
Karlsson, S., Rodhe, L. (2002) Översyn Av Statistiska Centralbyråns Beräkning Av Ammoniakav-
gången I Jordbruket – Emissionsfaktorer För Ammoniak Vid Lagring Och Spridning Av Stall-
gödsel, JTI - Swedish Institute of Agricultural and Environmental Engineering.
Karlsson, S., Torstensson, G. (2003) Strängkompostering Av Hästgödsel, JTI - Swedish Institute of
Agricultural and Environmental Engineering.
Karthikeyan, O.P., Visvanathan, C. (2013) ‘Bio-energy recovery from high-solid organic sub-
strates by dry anaerobic bio-conversion processes: A review’, Reviews in Environmental
Science and Biotechnology, 12, 257–284.
Kusch, S., Oechsner, H., Jungbluth, T. (2008) ‘Biogas production with horse dung in solid-phase
digestion systems’, Bioresource Technology, 99, 1280–1292.
Lindner, J., Zielonka, S., Oechsner, H., Lemmer, A. (2015) ‘Effects of mechanical treatment of
digestate after anaerobic digestion on the degree of degradation’, Bioresource Technology, 178,
194–200, available: http://linkinghub.elsevier.com/retrieve/pii/S0960852414013765.
Lundgren, J., Pettersson, E. (2009) ‘Combustion of horse manure for heat production’,
Bioresource Technology, 100(12), 3121–3126, available:
http://dx.doi.org/10.1016/j.biortech.2009.01.050.
23
Mattsson, M., Karlsson, N., Nilsson, S.B. (2015) Biogas Från Hästgödsel I Halland, Högskolan i
Halmstad.
Moreno-Caselles, J., Moral, R., Perez-Murcia, M., Perez-Espinosa, A., Rufete, B. (2002) ‘Nutrient
Value of Animal Manures in Front of Environmental Hazards’, Communications in Soil Science
and Plant Analysis, 33(15-18), 3023–3032, available:
http://www.tandfonline.com/doi/abs/10.1081/CSS-120014499.
Møller, H.B. 2012. Nye foderstrategier giver mere biogas. FiB nr 42. December 2012
http://www.bioprocess.dk/PDF/FiB 42-2012.03.pdf
Mönch-Tegeder, M., Lemmer, A., Oechsner, H., Jungbluth, T. (2013) ‘Investigation of the me-
thane potential of horse manure’, Agricultural Engineering International: CIGR Journal, 15(2),
161–172.
Mönch-Tegeder, M., Lemmer, A., Jungbluth, T., Oechsner, H. (2014) ‘Effects of full-scale sub-
strate pretreatment with a cross-flow grinder on biogas production’, CIGR Journal, 16(3), 138–
147, available: http://www.cigrjournal.org/index.php/Ejounral/article/view/2927.
Mönch-Tegeder, M., Lemmer, A., Oechsner, H. (2014) ‘Enhancement of methane production with
horse manure supplement and pretreatment in a full-scale biogas process’, Energy, 73, 523–530,
available: http://linkinghub.elsevier.com/retrieve/pii/S0360544214007506.
Nilsson, B. (1994) Kolets Sammansättning Och Energiinnehåll I Växt- Och Avfallsmaterial, avai-
lable: http://www.vaxteko.nu/html/sll/slu/ex_arb_vaxtnaringslara/EVN089/EVN089.HTM.
NIST (US National Institute of Standards and Technology) (2015a) Material Details. RM 8493 -
Monterey Pine Whole Biomass Feedstock [online], available: https://www-
s.nist.gov/srmors/view_detail.cfm?srm=8493 [Accessed 30 Jun 2015].
NIST (US National Institute of Standards and Technology) (2015b) Material Details. RM 8494 -
Wheat Straw Whole Biomass Feedstock [online], available: https://www-
s.nist.gov/srmors/view_detail.cfm?srm=8494 [Accessed 30 Jun 2015].
Olsson, H., Andersson, J., Rogstrand, G., Persson, P., Andersson, L., Bobeck, S., Assarsson, A.,
Benjaminsson, A., Jansson, A., Alexandersson, L., Thorell, K. (2014) Samrötning Av Hästgöd-
sel Med Nötflytgödsel - Fullskaleförsök Vid Naturbruksgymnasiet Sötåsen. Rapport 51,
Kretslopp Och Avfall, JTI - Swedish Institute of Agricultural and Environmental Engineering,
available:
http://www.jti.se/index.php?page=publikationsinfo&publicationid=1034&returnto=146
[Accessed 12 Feb 2015].
Pettersson, E., Lundgren, J., Hermansson, R. (2006) ‘Co-combustion of wood-shavings and horse
manure in a small scale heating plant’, in World Bioenergy 2006, Swedish Bioenergy Associa-
tion (SVEBIO): Stockholm, 396–400, available:
https://www.etde.org/etdeweb/servlets/purl/20812170-k7Afgh/20812170.PDF.
Preston, R.L. (2010) What’s The Feed Composition Value of That Cattle Feed? Beef Magazine
[online], available: http://beefmagazine.com/nutrition/feed-composition-tables/feed-
composition-value-cattle--0301 [Accessed 25 Jun 2015].
Puustinen, H., Kajolinna, T., Pellikka, T., Kouki, J. & Vuorio, K. 2009. Characterisation of air-
borne emissions from combustion of horse manure. Research report VTT-R-01295-09, VTT,
Finland. 18 p. (in Finnish)
Rodhe, L., Niklasson, F., Oostra, H., Gervind, P., Ascue, J. (2015) Kontrollerad Kompostering
Med Liten Klimatpåverkan - Emissioner Och Värmeåtervinning, available:
http://www.jti.se/index.php?page=publikationsinfo&publicationid=1081&returnto=96
[Accessed 19 May 2015].
Smith, D.B., Almquist, C.B. (2014) ‘The anaerobic co-digestion of fruit and vegetable waste and
horse manure mixtures in a bench-scale, two- phase anaerobic digestion system’,
Environmental Technology, 35(7), 859–867, available:
http://www.tandfonline.com/doi/abs/10.1080/09593330.2013.854398.
24
Steineck, S., Svensson, L., Tersmeden, M., Åkerhielm, H. & Karlsson, J. (2001). ‘Miljoanpassad
hantering av hastgodsel.’ JTI-Rapport 280. Lantbruk & Industri. JTI-Institutet för jordbruks-
och miljöteknik.
Stanton, T.L. (2014) Feed Composition for Cattle and Sheep [online], available:
http://www.ext.colostate.edu/pubs/livestk/01615.html [Accessed 25 Jun 2015].
Strömberg, B., Herstad Svärd, S. (2012) Bränslehandboken 2012, Värmeforsk.
Swedish Meteorological and Hydrological Institute (SMHI) (2015) Normal Årsmedeltemperatur
[online], available: http://www.smhi.se/klimatdata/meteorologi/temperatur/normal-
arsmedeltemperatur-1.3973 [Accessed 21 May 2015].
Teghammar, A. (2013) Biogas Production from Lignocelluloses. Pretreatment, Substrate Char-
acterization, Co-Digestion, and Economic Evaluation, available:
http://bada.hb.se/bitstream/2320/12317/1/phd thesis teghammar.pdf.
US National Institute of Standards and Technology (NIST) (2015a) Material Details. RM 8494 -
Wheat Straw Whole Biomass Feedstock [online], available: https://www-
s.nist.gov/srmors/view_detail.cfm?srm=8494 [Accessed 30 Jun 2015].
US National Institute of Standards and Technology (NIST) (2015b) Material Details. RM 8493 -
Monterey Pine Whole Biomass Feedstock [online], available: https://www-
s.nist.gov/srmors/view_detail.cfm?srm=8493 [Accessed 30 Jun 2015].
Wartell, B. a., Krumins, V., Alt, J., Kang, K., Schwab, B.J., Fennell, D.E. (2012) ‘Methane pro-
duction from horse manure and stall waste with softwood bedding’, Bioresource Technology,
112, 42–50, available: http://dx.doi.org/10.1016/j.biortech.2012.02.012.
Watts, K.A. (2005) ‘A review of unlikely sources of excess carbohydrate in equine diets’, Journal
of Equine Veterinary Science, 25(8), 338–344, available: http://www.safergrass.org/pdf/JEVS8-
05.pdf.
Webb, J., Sommer, S., Kupper, T., Groenestein, K., Hutchings, N., Eurich-Menden, B., Rodhe, L.,
Misselbrook, T., Amon, B. (2012) ‘Emissions of Ammonia, Nitrous Oxide and Methane During
the Management of Solid Manures’, in Lichtfouse, E., ed., Agroecology and Strategies for Cli-
mate Change SE - 4, Sustainable Agriculture Reviews, Springer Netherlands, 67–107, availa-
ble: http://dx.doi.org/10.1007/978-94-007-1905-7_4.
Wennerberg, P., Dahlander, C. (2013) Hästgödsel Som En Resurs. En Förstudie Om Olika Hante-
ringskedjor För Hästgödsel., available:
http://www.hastforetagarnagoteborg.se/Hästgödselsomresurs_Tecnofarm_maj13.pdf [Accessed
27 Mar 2015].
Westendorf, M., Krogmann, U. (2006) Horse Manure Management: Bedding Use [online],
available: http://esc.rutgers.edu/fact_sheet/horse-manure-management-bedding-use/ [Accessed
8 Jun 2015].
Wheeler, E., Zajaczkowski, J.S. (2009) ‘Horse Stable Manure Management’, Horse Facilities 3,
available: http://extension.psu.edu/publications/ub035/view.
25
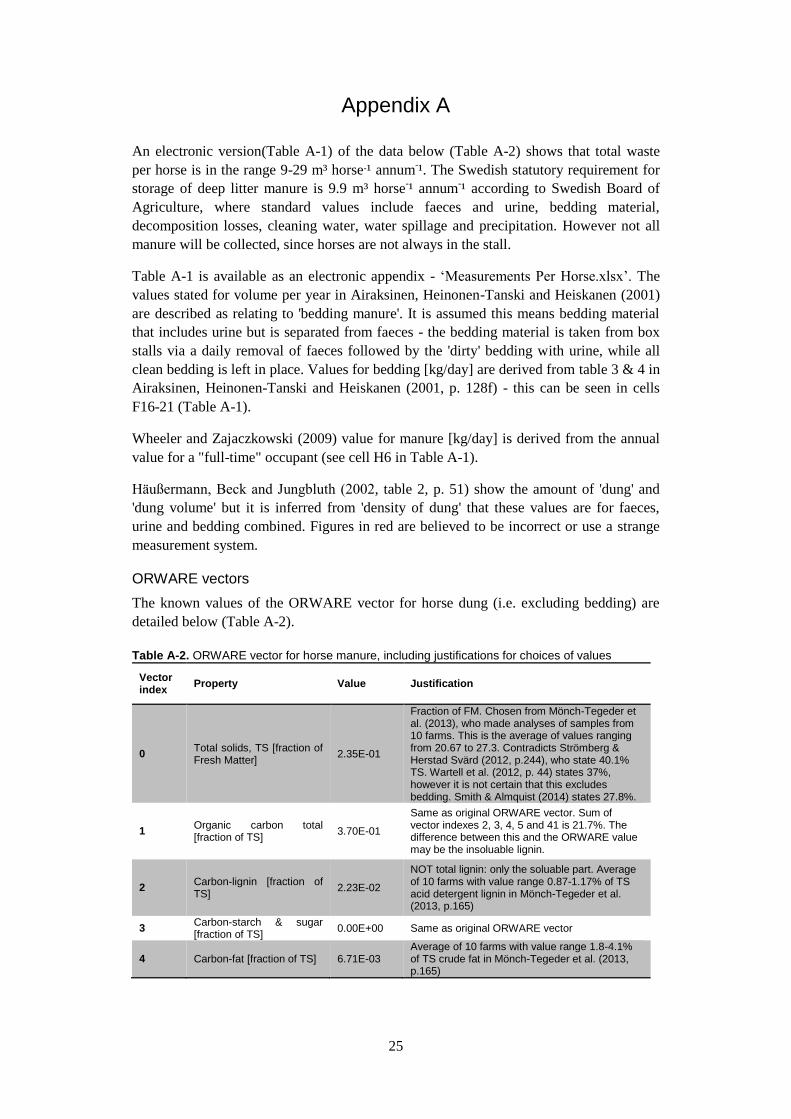
Appendix A
An electronic version(Table A-1) of the data below (Table A-2) shows that total waste
per horse is in the range 9-29 m³ horse-¹ annum-¹. The Swedish statutory requirement for
storage of deep litter manure is 9.9 m³ horse-¹ annum
-¹ according to Swedish Board of
Agriculture, where standard values include faeces and urine, bedding material,
decomposition losses, cleaning water, water spillage and precipitation. However not all
manure will be collected, since horses are not always in the stall.
Table A-1 is available as an electronic appendix - ‘Measurements Per Horse.xlsx’. The
values stated for volume per year in Airaksinen, Heinonen-Tanski and Heiskanen (2001)
are described as relating to 'bedding manure'. It is assumed this means bedding material
that includes urine but is separated from faeces - the bedding material is taken from box
stalls via a daily removal of faeces followed by the 'dirty' bedding with urine, while all
clean bedding is left in place. Values for bedding [kg/day] are derived from table 3 & 4 in
Airaksinen, Heinonen-Tanski and Heiskanen (2001, p. 128f) - this can be seen in cells
F16-21 (Table A-1).
Wheeler and Zajaczkowski (2009) value for manure [kg/day] is derived from the annual
value for a "full-time" occupant (see cell H6 in Table A-1).
Haußermann, Beck and Jungbluth (2002, table 2, p. 51) show the amount of 'dung' and
'dung volume' but it is inferred from 'density of dung' that these values are for faeces,
urine and bedding combined. Figures in red are believed to be incorrect or use a strange
measurement system.
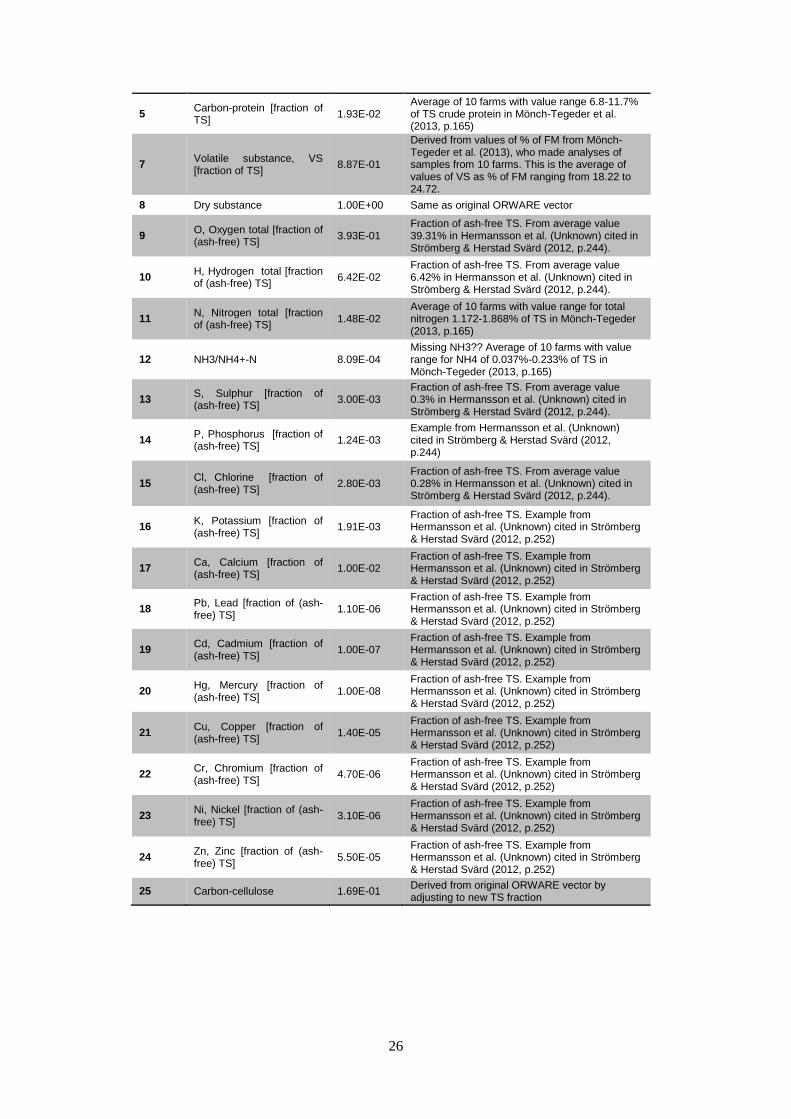
ORWARE vectors
The known values of the ORWARE vector for horse dung (i.e. excluding bedding) are
detailed below (Table A-2).
Table A-2. ORWARE vector for horse manure, including justifications for choices of values
Vector index
Property Value Justification
0 Total solids, TS [fraction of Fresh Matter]
2.35E-01
Fraction of FM. Chosen from Mönch-Tegeder et al. (2013), who made analyses of samples from 10 farms. This is the average of values ranging from 20.67 to 27.3. Contradicts Strömberg & Herstad Svärd (2012, p.244), who state 40.1% TS. Wartell et al. (2012, p. 44) states 37%, however it is not certain that this excludes bedding. Smith & Almquist (2014) states 27.8%.
1 Organic carbon total [fraction of TS]
3.70E-01
Same as original ORWARE vector. Sum of vector indexes 2, 3, 4, 5 and 41 is 21.7%. The difference between this and the ORWARE value may be the insoluable lignin.
2 Carbon-lignin [fraction of TS]
2.23E-02
NOT total lignin: only the soluable part. Average of 10 farms with value range 0.87-1.17% of TS acid detergent lignin in Mönch-Tegeder et al. (2013, p.165)
3 Carbon-starch & sugar [fraction of TS]
0.00E+00 Same as original ORWARE vector
4 Carbon-fat [fraction of TS] 6.71E-03 Average of 10 farms with value range 1.8-4.1% of TS crude fat in Mönch-Tegeder et al. (2013, p.165)
26
5 Carbon-protein [fraction of TS]
1.93E-02 Average of 10 farms with value range 6.8-11.7% of TS crude protein in Mönch-Tegeder et al. (2013, p.165)
7 Volatile substance, VS [fraction of TS]
8.87E-01
Derived from values of % of FM from Mönch-Tegeder et al. (2013), who made analyses of samples from 10 farms. This is the average of values of VS as % of FM ranging from 18.22 to 24.72.
8 Dry substance 1.00E+00 Same as original ORWARE vector
9 O, Oxygen total [fraction of (ash-free) TS]
3.93E-01 Fraction of ash-free TS. From average value 39.31% in Hermansson et al. (Unknown) cited in Strömberg & Herstad Svärd (2012, p.244).
10 H, Hydrogen total [fraction of (ash-free) TS]
6.42E-02 Fraction of ash-free TS. From average value 6.42% in Hermansson et al. (Unknown) cited in Strömberg & Herstad Svärd (2012, p.244).
11 N, Nitrogen total [fraction of (ash-free) TS]
1.48E-02 Average of 10 farms with value range for total nitrogen 1.172-1.868% of TS in Mönch-Tegeder (2013, p.165)
12 NH3/NH4+-N 8.09E-04 Missing NH3?? Average of 10 farms with value range for NH4 of 0.037%-0.233% of TS in Mönch-Tegeder (2013, p.165)
13 S, Sulphur [fraction of (ash-free) TS]
3.00E-03 Fraction of ash-free TS. From average value 0.3% in Hermansson et al. (Unknown) cited in Strömberg & Herstad Svärd (2012, p.244).
14 P, Phosphorus [fraction of (ash-free) TS]
1.24E-03 Example from Hermansson et al. (Unknown) cited in Strömberg & Herstad Svärd (2012, p.244)
15 Cl, Chlorine [fraction of (ash-free) TS]
2.80E-03 Fraction of ash-free TS. From average value 0.28% in Hermansson et al. (Unknown) cited in Strömberg & Herstad Svärd (2012, p.244).
16 K, Potassium [fraction of (ash-free) TS]
1.91E-03 Fraction of ash-free TS. Example from Hermansson et al. (Unknown) cited in Strömberg & Herstad Svärd (2012, p.252)
17 Ca, Calcium [fraction of (ash-free) TS]
1.00E-02 Fraction of ash-free TS. Example from Hermansson et al. (Unknown) cited in Strömberg & Herstad Svärd (2012, p.252)
18 Pb, Lead [fraction of (ash-free) TS]
1.10E-06 Fraction of ash-free TS. Example from Hermansson et al. (Unknown) cited in Strömberg & Herstad Svärd (2012, p.252)
19 Cd, Cadmium [fraction of (ash-free) TS]
1.00E-07 Fraction of ash-free TS. Example from Hermansson et al. (Unknown) cited in Strömberg & Herstad Svärd (2012, p.252)
20 Hg, Mercury [fraction of (ash-free) TS]
1.00E-08 Fraction of ash-free TS. Example from Hermansson et al. (Unknown) cited in Strömberg & Herstad Svärd (2012, p.252)
21 Cu, Copper [fraction of (ash-free) TS]
1.40E-05 Fraction of ash-free TS. Example from Hermansson et al. (Unknown) cited in Strömberg & Herstad Svärd (2012, p.252)
22 Cr, Chromium [fraction of (ash-free) TS]
4.70E-06 Fraction of ash-free TS. Example from Hermansson et al. (Unknown) cited in Strömberg & Herstad Svärd (2012, p.252)
23 Ni, Nickel [fraction of (ash-free) TS]
3.10E-06 Fraction of ash-free TS. Example from Hermansson et al. (Unknown) cited in Strömberg & Herstad Svärd (2012, p.252)
24 Zn, Zinc [fraction of (ash-free) TS]
5.50E-05 Fraction of ash-free TS. Example from Hermansson et al. (Unknown) cited in Strömberg & Herstad Svärd (2012, p.252)
25 Carbon-cellulose 1.69E-01 Derived from original ORWARE vector by adjusting to new TS fraction
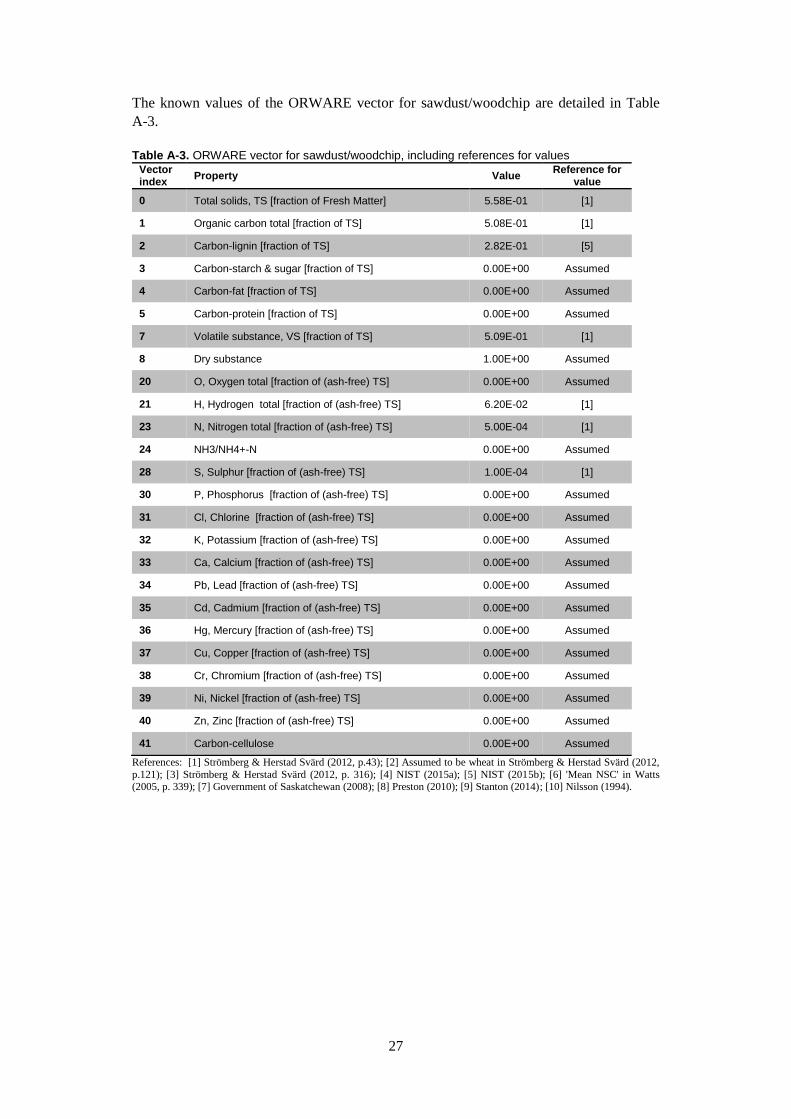
27
The known values of the ORWARE vector for sawdust/woodchip are detailed in Table
A-3.
Table A-3. ORWARE vector for sawdust/woodchip, including references for values
Vector index
Property Value Reference for
value
0 Total solids, TS [fraction of Fresh Matter] 5.58E-01 [1]
1 Organic carbon total [fraction of TS] 5.08E-01 [1]
2 Carbon-lignin [fraction of TS] 2.82E-01 [5]
3 Carbon-starch & sugar [fraction of TS] 0.00E+00 Assumed
4 Carbon-fat [fraction of TS] 0.00E+00 Assumed
5 Carbon-protein [fraction of TS] 0.00E+00 Assumed
7 Volatile substance, VS [fraction of TS] 5.09E-01 [1]
8 Dry substance 1.00E+00 Assumed
20 O, Oxygen total [fraction of (ash-free) TS] 0.00E+00 Assumed
21 H, Hydrogen total [fraction of (ash-free) TS] 6.20E-02 [1]
23 N, Nitrogen total [fraction of (ash-free) TS] 5.00E-04 [1]
24 NH3/NH4+-N 0.00E+00 Assumed
28 S, Sulphur [fraction of (ash-free) TS] 1.00E-04 [1]
30 P, Phosphorus [fraction of (ash-free) TS] 0.00E+00 Assumed
31 Cl, Chlorine [fraction of (ash-free) TS] 0.00E+00 Assumed
32 K, Potassium [fraction of (ash-free) TS] 0.00E+00 Assumed
33 Ca, Calcium [fraction of (ash-free) TS] 0.00E+00 Assumed
34 Pb, Lead [fraction of (ash-free) TS] 0.00E+00 Assumed
35 Cd, Cadmium [fraction of (ash-free) TS] 0.00E+00 Assumed
36 Hg, Mercury [fraction of (ash-free) TS] 0.00E+00 Assumed
37 Cu, Copper [fraction of (ash-free) TS] 0.00E+00 Assumed
38 Cr, Chromium [fraction of (ash-free) TS] 0.00E+00 Assumed
39 Ni, Nickel [fraction of (ash-free) TS] 0.00E+00 Assumed
40 Zn, Zinc [fraction of (ash-free) TS] 0.00E+00 Assumed
41 Carbon-cellulose 0.00E+00 Assumed
References: [1] Strömberg & Herstad Svärd (2012, p.43); [2] Assumed to be wheat in Strömberg & Herstad Svärd (2012,
p.121); [3] Strömberg & Herstad Svärd (2012, p. 316); [4] NIST (2015a); [5] NIST (2015b); [6] 'Mean NSC' in Watts (2005, p. 339); [7] Government of Saskatchewan (2008); [8] Preston (2010); [9] Stanton (2014); [10] Nilsson (1994).
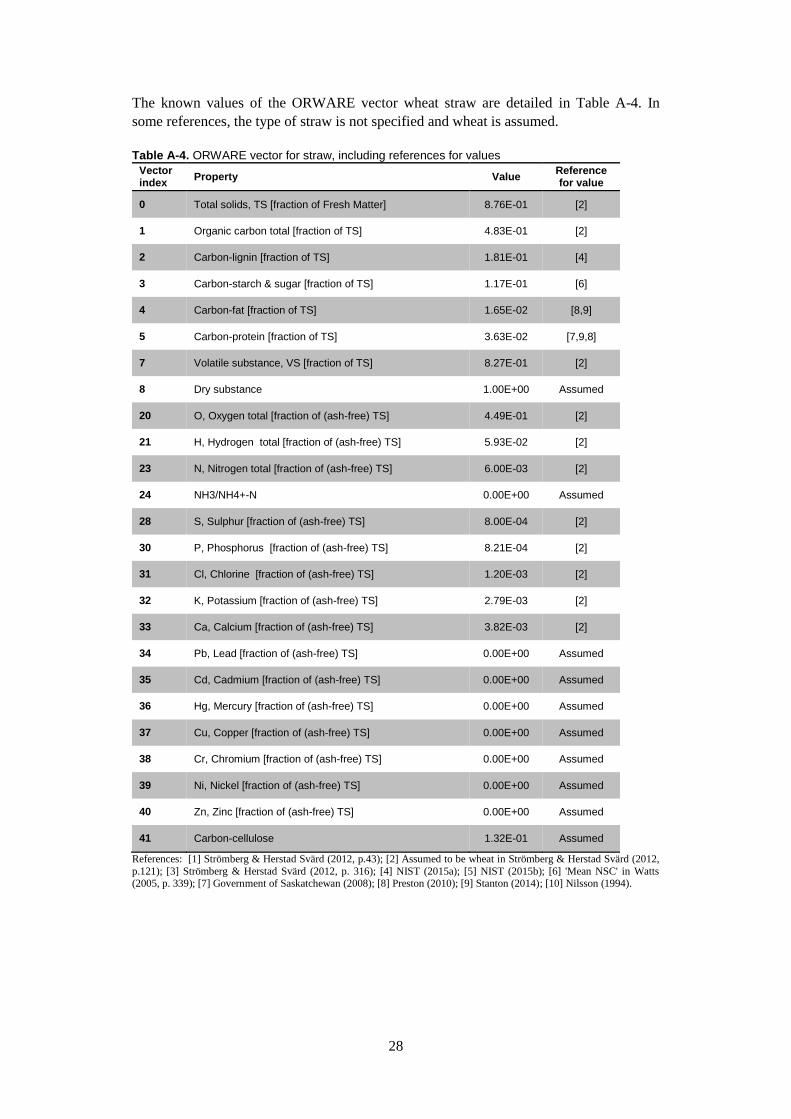
28
The known values of the ORWARE vector wheat straw are detailed in Table A-4. In
some references, the type of straw is not specified and wheat is assumed.
Table A-4. ORWARE vector for straw, including references for values
Vector index
Property Value Reference for value
0 Total solids, TS [fraction of Fresh Matter] 8.76E-01 [2]
1 Organic carbon total [fraction of TS] 4.83E-01 [2]
2 Carbon-lignin [fraction of TS] 1.81E-01 [4]
3 Carbon-starch & sugar [fraction of TS] 1.17E-01 [6]
4 Carbon-fat [fraction of TS] 1.65E-02 [8,9]
5 Carbon-protein [fraction of TS] 3.63E-02 [7,9,8]
7 Volatile substance, VS [fraction of TS] 8.27E-01 [2]
8 Dry substance 1.00E+00 Assumed
20 O, Oxygen total [fraction of (ash-free) TS] 4.49E-01 [2]
21 H, Hydrogen total [fraction of (ash-free) TS] 5.93E-02 [2]
23 N, Nitrogen total [fraction of (ash-free) TS] 6.00E-03 [2]
24 NH3/NH4+-N 0.00E+00 Assumed
28 S, Sulphur [fraction of (ash-free) TS] 8.00E-04 [2]
30 P, Phosphorus [fraction of (ash-free) TS] 8.21E-04 [2]
31 Cl, Chlorine [fraction of (ash-free) TS] 1.20E-03 [2]
32 K, Potassium [fraction of (ash-free) TS] 2.79E-03 [2]
33 Ca, Calcium [fraction of (ash-free) TS] 3.82E-03 [2]
34 Pb, Lead [fraction of (ash-free) TS] 0.00E+00 Assumed
35 Cd, Cadmium [fraction of (ash-free) TS] 0.00E+00 Assumed
36 Hg, Mercury [fraction of (ash-free) TS] 0.00E+00 Assumed
37 Cu, Copper [fraction of (ash-free) TS] 0.00E+00 Assumed
38 Cr, Chromium [fraction of (ash-free) TS] 0.00E+00 Assumed
39 Ni, Nickel [fraction of (ash-free) TS] 0.00E+00 Assumed
40 Zn, Zinc [fraction of (ash-free) TS] 0.00E+00 Assumed
41 Carbon-cellulose 1.32E-01 Assumed
References: [1] Strömberg & Herstad Svärd (2012, p.43); [2] Assumed to be wheat in Strömberg & Herstad Svärd (2012,
p.121); [3] Strömberg & Herstad Svärd (2012, p. 316); [4] NIST (2015a); [5] NIST (2015b); [6] 'Mean NSC' in Watts (2005, p. 339); [7] Government of Saskatchewan (2008); [8] Preston (2010); [9] Stanton (2014); [10] Nilsson (1994).

29
The known values of the ORWARE vector for surface-layer peat are detailed in Table A-
5. In some references, the level of the peat is not specified and it is assumed to be the
surface layer.
Table A-5. ORWARE vector for surface-layer peat, including references for values
Vector index
Property Value Reference for value
0 Total solids, TS [fraction of Fresh Matter] 5.18E-01 [3]
1 Organic carbon total [fraction of TS] 5.68E-01 [3]
2 Carbon-lignin [fraction of TS] 3.09E-01 [10]
3 Carbon-starch & sugar [fraction of TS] 0.00E+00 Assumed
4 Carbon-fat [fraction of TS] 0.00E+00 Assumed
5 Carbon-protein [fraction of TS] 0.00E+00 Assumed
7 Volatile substance, VS [fraction of TS] 7.22E-01 [3]
8 Dry substance 1.00E+00 Assumed
20 O, Oxygen total [fraction of (ash-free) TS] 3.56E-01 [3]
21 H, Hydrogen total [fraction of (ash-free) TS] 5.80E-02 [3]
23 N, Nitrogen total [fraction of (ash-free) TS] 2.20E-02 [3]
24 NH3/NH4+-N 0.00E+00 Assumed
28 S, Sulphur [fraction of (ash-free) TS] 2.90E-03 [3]
30 P, Phosphorus [fraction of (ash-free) TS] 5.07E-04 [3]
31 Cl, Chlorine [fraction of (ash-free) TS] 5.00E-04 [3]
32 K, Potassium [fraction of (ash-free) TS] 3.64E-04 [3]
33 Ca, Calcium [fraction of (ash-free) TS] 6.70E-03 [3]
34 Pb, Lead [fraction of (ash-free) TS] 5.88E-06 [3]
35 Cd, Cadmium [fraction of (ash-free) TS] 1.86E-07 [3]
36 Hg, Mercury [fraction of (ash-free) TS] 6.36E-08 [3]
37 Cu, Copper [fraction of (ash-free) TS] 2.20E-05 [3]
38 Cr, Chromium [fraction of (ash-free) TS] 3.76E-06 [3]
39 Ni, Nickel [fraction of (ash-free) TS] 5.67E-06 [3]
40 Zn, Zinc [fraction of (ash-free) TS] 1.30E-05 [3]
41 Carbon-cellulose 3.22E-01 [10]
References: [1] Strömberg & Herstad Svärd (2012, p.43); [2] Assumed to be wheat in Strömberg & Herstad Svärd (2012, p.121); [3] Strömberg & Herstad Svärd (2012, p. 316); [4] NIST (2015a); [5] NIST (2015b); [6] 'Mean NSC' in Watts
(2005, p. 339); [7] Government of Saskatchewan (2008); [8] Preston (2010); [9] Stanton (2014); [10] Nilsson (1994).


Previous Research Reports:
1. Work Values among Swedish Male and Female Students. Katarina Wijk.
Department of Occupational and Public Health Sciences 2011.
2. The Doll, the Globe and the Boomerang - Chemical Risks in the Future,
Introduced by a Chinese Doll Coming to Sweden. Ernst Hollander. Department of
Business and Economic Studies 2011.
3. Divergences in descriptions of the internal work environment management,
between employees and the management, a case study. Katarina Wijk and Per
Lindberg. Departement of Occupational and Public Health Sciences 2013.
4. Energy and nutrients from horse manure - Life-cycle data inventory of horse
manure management systems in Gävleborg, Sweden. Jay Hennessy and Ola
Eriksson. Department of Engineering and Sustainable Development 2015.
Published by:
Gävle University Press University of Gävle
Postal address: SE-801 76 Gävle, Sweden
Visiting address: Kungsbäcksvägen 47
Telephone: +46 26 64 85 00
www.hig.se