Embed Size (px)
Citation preview
ORIGINAL RESEARCH
Energy audit experiences in foundries
M. Noro • R. M. Lazzarin
Received: 3 July 2014 / Accepted: 29 October 2014 / Published online: 18 November 2014
� The Author(s) 2014. This article is published with open access at Springerlink.com
Abstract Steel industry presents one of the highest
energy demand of all the industrial sector. Foundries have
a really relevant role both in economical terms and as
regards the energy demand. The cost of energy represents
several percentage points of the overall costs of a foundry.
The electricity demand is very high, particularly for the
induction melting furnaces. A large amount of thermal
energy is obtained both from natural gas combustion and
from the coal needed for the process of formation of cast
iron in cupolas. Moreover, the plant services must be
considered: one very energy consumer is compressed air
production. Every factory is different from another so that
the proposal of actions of energy savings or thermal
recovers requires a detailed study of each plant considering
the lay out and analysing the single processes with related
energy needs and thermal levels. The co-operation of the
University of Padua with the Centro Produttivita Veneto
allowed to plan a series of energy audits in some foundries
located in Vicenza province. The experiences of the first
facilities surveys and audits recommendations demon-
strated both potential advantage of energy savings and the
related difficulties, often due to the high investment costs.
Anyhow the joint work of auditing between the university
experts and the foundry technicians produced a better
awareness on the critical points of the plant and a higher
rationality level in the evaluation of investments for the
renewable of the machinery. Here, the method of per-
forming the energy audits is described together with the
very first results in terms of proposals for energy savings
evaluated technically and economically.
Keywords Energy audit � Foundry � Thermal insulation �Cupolas � Induction furnace
List of symbols
E Energy (J, kWh)
h Specific enthalpy (kJ kg-1)
m Mass flow rate (kg s-1)
p Pressure (MPa)
P Power (kW)
T Temperature (K, �C)V Volumetric flow rate (m3 h-1)
Subscript
1 Cast iron melting temperature
2 Ceiling factory temperature
A, B, C, D, E States of the flue gas
F, G States of the steam
Loss Losses
Steam Steam
Steam turbine Steam turbine
Introduction
Energy management and related energy savings in industry
sector are well known issues as various legislative acts and
standards have been adopted in recent years in Italy (Direc-
tive 2006/32/EC on energy end-use efficiency and energy
services adopted in Italy by D. Lgs. n. 115/08; Directive
Published in the Special Issue ‘‘8th AIGE Conference (Italian
Association for Energy Management)’’.
M. Noro (&) � R. M. Lazzarin
Department of Management and Engineering, University
of Padua, Stradella S. Nicola, 3, 36100 Vicenza, Italy
e-mail: [email protected]
R. M. Lazzarin
e-mail: [email protected]
123
Int J Energy Environ Eng (2016) 7:409–423
DOI 10.1007/s40095-014-0152-y
2012/27/CE on energy efficiency, not yet adopted in Italy).
Energy audit is the main tool that 2012/27/CE Directive
foresees to obtain a suitable knowledge of the energy con-
sumption profile of a factory; the final goal is to identify
energy saving opportunities and to quantify them also from
the economic point of view. A set of national and interna-
tional standards have been recently released in order to:
– regulate how an energy management system has to be
implemented (UNI EN ISO 50001, substituting the
previous UNI CEI EN 16001);
– regulate how an energy audit has to be done (UNI CEI
TR 11428; UNI CEI EN 16247-1);
– certificate the energy manager experts (UNI CEI
11339);
– certificate the energy service companies (UNI CEI
11352).
Notwithstanding during the last decade the use of energy
in industry has been decreasing while civil uses has been
increasing, it still remains one of the most important in
Italy (23.6 % of the final uses in 2012) together with civil
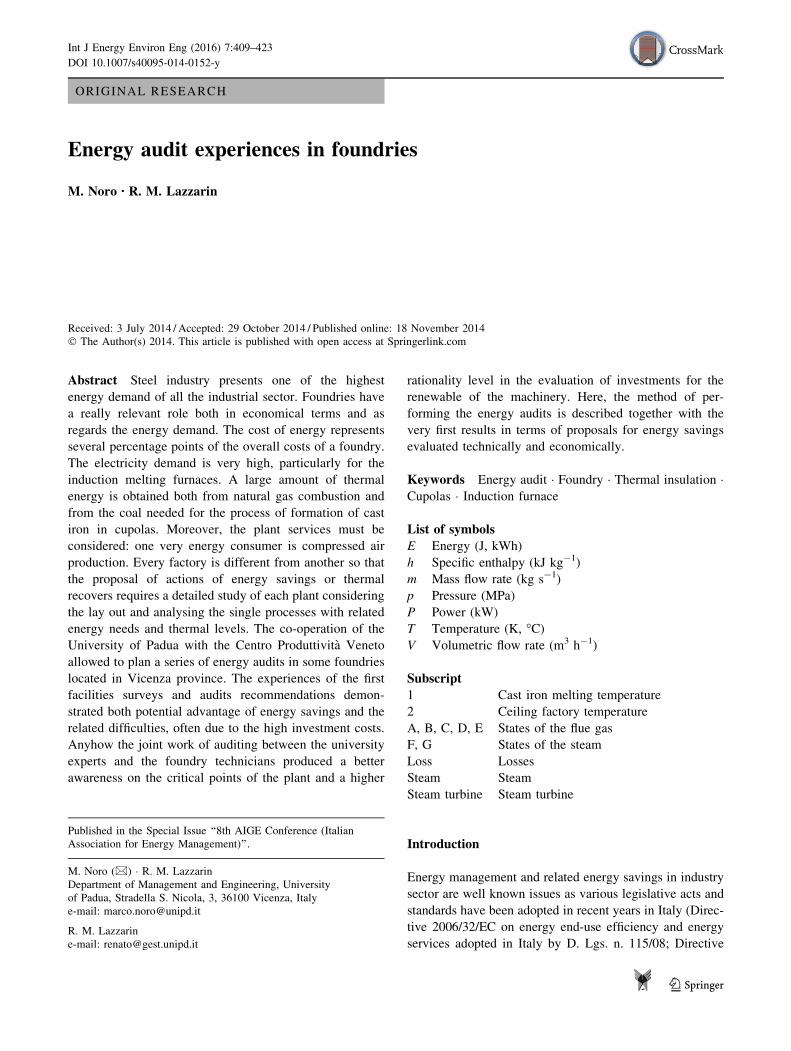
uses (36.7 %) and transports (30.2 %) (Fig. 1). In 2011,
nearly one quarter of the total industry consumption has
been consumed by metallurgic sector (23.9 %), followed
by non-metallurgic mineral (19.2 %), chemical and petro-
chemical (13.3 %) and mechanics (12.2 %). During the
period 1992–2011, two different phases may be identified:
a quite slow increase till 2003 with a peak of 41 Mtoe
(?17.9 % with respect to 1992) followed by a fast drop
(increased by the financial and economic crisis during the
last years) [1]. In this second period, energy consumption
of industry sector has decreased by more than a quarter
with respect to 2003, with the greatest decreases by non-
metallurgic minerals (-31.5 %) and chemical and petro-
chemical (-30.2 %). Metallurgic sector instead has sub-
stantially maintained quite constant its consumption (about
eight Mtoe) [1].
In particular, foundry sector in Italy recorded an
impressive decrease in net casting production from the
beginning of the financial crisis: from 2.73 Mt in 2007 to
1.96 Mt in 2012, with -33 % for cast iron and -22 % for
iron [2]. Concentrating on cast iron production, Italy is the
ninth on a global scenario with 1.04 Mt in 2012 (China and
India are, respectively, the first and the second cast iron
producers in the world with 30.5 and 7.95 Mt in 2011).
Table 1 reports the main data about Italian cast iron
foundry sector for the last years.
Disaggregated data concerning energy consumption and
energy bill of foundries in Italy are not easy to find. One
reference is the Energy Italian Foundry Association (As-
sofond Energia) that grouped together 81 foundries in 2013
supplying electrical energy and natural gas. In 2013,
Fig. 1 Final uses of energy in
Italy during the last 15 years [1]
Table 1 Main data on cast iron foundry in Italy [2]
2008 2011 2012 2012
versus
2011
Foundries (n.) 163 154 152 -2
Personnel (n.) 12,250 11,140 10,895 -245
Personnel per factory (n.) 75 72 73 ?1
Turnover (G€) 3.2 2.4 2.2 -8.0 %
Net production (Mt) 1.562 1.161 1.043 -10.2 %
Average yearly net
production per factory
(t year-1)
9,586 7,541 6,893 -9.0 %
410 Int J Energy Environ Eng (2016) 7:409–423
123
electrical energy supplied to Italian foundries was 553
GWh with a mean cost of 15 c€ kWh-1 for plant connected
to the medium voltage grid (typically 20 kV) (consider that
meanly only 6.5 c€ is the energy quota while the great part
of the cost of the kWh is due to different charges—trans-
port, distribution and other charges like renewable energies
incentives, nuclear plant decommissioning, etc.). Natural
gas supplied by Assofond Energia was 13.2 MSm3 in 2013
with a mean cost of 35 c€ Sm-3 (in this case the cost of
energy is about 80 %) [3].
Some studies were previously made concerning energy
in the foundry sector. Some authors presented trends in
activity, primary energy and carbon dioxide emissions of
the Mexican iron and steel industry, comparing it with
five of the largest iron and steel world producers [4].
Some others made similar analysis for the Chinese [5],
US [6] and Taiwanese [7] iron and steel industry. Thol-
lander concentrated in Swedish iron foundry, studying the
effect of rising electricity prices and quantifying an
energy efficiency potential for a medium-sized Swedish
iron foundry resulting from a thorough industrial energy
audit [8]; other studies of the same Author [9, 10] pro-
vided an insight into barriers to energy efficiency in
European foundries, considering several firm’s character-
istic (size, technologies adopted, country), and studied
energy management practices and the driving forces for
improved energy efficiency in the European foundry
industry. The same Author again presented the use of
methods for optimisation of dynamic industrial energy
systems, studying how they can provide energy-intensive
small and medium-sized enterprises like cast iron found-
ries with additional information when strategic invest-
ments are going to be made [11].
This paper reports on the energy performance of cast
iron foundries together with some proposals for energy
savings. It is based on the very first results of the co-
operation between the University of Padua and the Centro
Produttivita Veneto in performing a series of energy audits
in some foundries located in the Vicenza province (North
Italy). Environmental and safety aspects, that are very
important too, are not in the main scope of this work.
Energy audit process
Energy management in energy-intensive industries such as
foundries is a very important and actual topic. New stan-
dards were developed to help the organizations to imple-
ment an effective energy management system, the most
widely applied is ISO 50001:2011—Energy Management
System. To correctly implement an energy management
system, the first step is to conduct an energy audit that is a
survey that examines the ways energy is currently used in
the facility, also identifying some alternatives for reducing
energy costs. Recently, new standards have been developed
in this subject (the UNI CEI EN 16247—Energy audits set
and, in Italy, the UNI CEI TR 11428—Diagnosi energeti-
che). The philosophy behind those standards is common: to
pass from a ‘‘passive’’ vision (where the cost of energy is
unavoidable and uncontrollable) to an ‘‘active’’ vision
(where the cost of energy not only is under control, but
moreover it is planned and can give an added value).
Concerning the last point, in Italy an Energy Efficiency
Certificates system is operating since 2004: every energy
saving intervention in industries or organizations produces
the certificates (each is worth 1 toe) that can be sold in a
dedicated market (at a variable economic value, actually it
is nearly 110 EUR) to the parties bound to energy effi-
ciency interventions (typically electricity and natural gas
distributors).
Following the suggestions of the cited standards, the
energy audits in the foundries visited by the authors were
implemented by the following actions:
– analysis of the energy consumptions and costs, by
analysing the energy bills of the last 12–24 months for
each energy vector of the foundry (electricity, natural
gas, coke, etc.);
– survey on some general data of the industry, such as the
geographical location/number of degree days/weather
data of the facility and its location, the facility layout,
the type and operating hours of the production and
services plants, the equipment list (technical character-
istics and models of both process-related and general
energy-consuming equipment such as heater, boiler,
chillers, air compressors, etc.);
– analysis of the energy consumed by the equipment.
This is one of the crucial phases of the energy audit:
each equipment has to be imputed by the energy
consumed monthly and annually, differentiating
between ‘‘process uses’’ (melting, moulding, etc.)
and ‘‘plant services uses’’ (heating, compressed air,
lighting, etc.). This stage can be performed by
calculation (on the basis of power nominal data of
the equipment, operating hours and work load factors)
and/or by measuring data (using power/energy meters
and/or a data logger systems to monitor the energy
consumptions or energy-related parameters during a
significant interval). Such activity needs some tools to
be implemented such as walk-through tours, audit
interviews, gathering detailed data (on the manufac-
turing process, the electrical supply system, the steam
boiler and distribution system, the electrical motors,
the heating, ventilation and air conditioning system,
the lighting system, the air compressors and the
compressed air distribution system, the building
Int J Energy Environ Eng (2016) 7:409–423 411
123
envelope and windows characteristics) and measure-
ment instruments (wattmeter, thermometer, voltmeter,
combustion analyzer, etc.);
– realizing an energy balance of the foundry, where
energy fluxes are divided by inputs and outputs;
– calculating some key performance indicators that relate
the different kinds of energy consumptions to some
significant indicator. For the audited foundries, the
gross and net cast iron production indicators were
considered. The key performance indicators are the
basis on which the foundry can, for example, attribute
energy consumption to the different departments,
monitor own performance during the months and the
years, monitor own performance with respect to
benchmarks;
– after calculating the key performance indicators, the
audit should produce some energy saving recommen-
dation ordered by the economic advantage of the
investment. This is an important output of the energy
audit, where the economic investment in each energy
saving opportunity is evaluated by the net present
worth and the payback time, giving a sort of list of
priority interventions;
– the final step should be the continuous monitoring of
the effects of the energy saving interventions realized
on energy consumptions and performance indicators.
This is important in order to understand which
measures have been effective and which goals have
been reached and which not.
The work is still in progress; the very first results of
some of the stages above described are here reported.
Cast iron production process and energy use
Cast iron is an iron-carbon alloy, containing usually
between 2.4 and 4 % carbon. The minimum carbon content
is 1.8 %. Silicon, manganese, sulphur and phosphorus are
also present in various amounts. The production process
can be divided into the following major activities:
– melting and metal treatment;
– preparation of moulds and cores;
– casting of the molten metal into the moulds, cooling for
solidification and removing the casting from the
moulds;
– finishing of the raw casting.
Each of these activities consumes energy (and materials
obviously); ‘‘horizontal’’ activities (services) require
energy as well: compressed air (as energy vector), water
pumping, lighting, heating and cooling of buildings (offices
and manufacturing departments), materials handling.
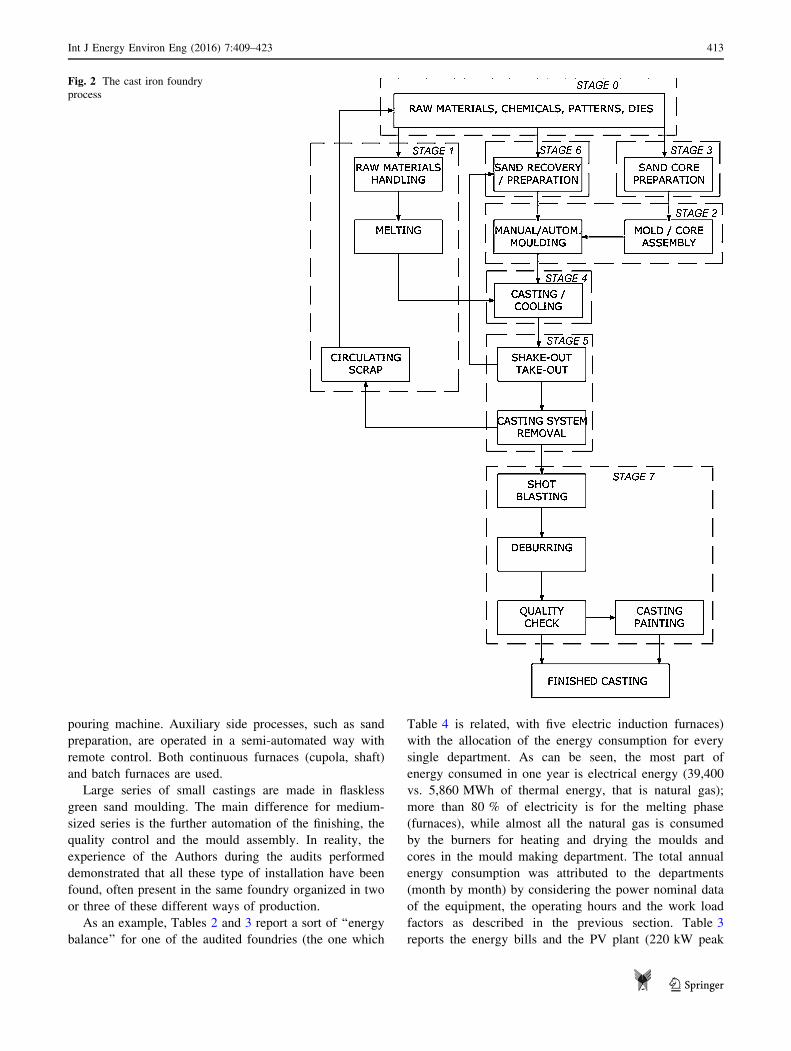
Figure 2 depicts the basic cast iron foundry process.
Foundry scrap (selected scrap according to a certain
chemical composition) or ingots are loaded (by a bridge
crane with a magnet) in the existing liquid in the furnace to
obtain the desired composition. The greatest part of energy
consumption is due to the melting and metal treatment
process, so to the furnaces. The main types in cast iron
foundries are the cupola and the induction furnace: litera-
ture data report that for the former the percentage of fur-
nace consumption on total foundry consumption is about
50 %, for the latter it can be up to 70 % [12, 13].
After loading the furnace, melting is obtained at about
1,450–1,500 �C (depending of the type of cast iron). Dur-
ing this phase, slag is removed from the hot metal with the
help of a slag overflow notch; tapping can be automatic or
manual from the melting pot into the ladles. Then cast iron
is poured: the pour can be automatic or manual from the
ladles to the moulds. On the moulding side, a basic dis-
tinction is made between permanent and lost moulds.
Foundries casting in permanent moulds buy these metal
moulds (dies) externally, but typically operate an in-house
mould repair and maintenance shop. Foundries casting in
lost moulds, often buy wooden, metal or plastic patterns
(for their mould design) and operate an in-house pattern
maintenance and repair shop. Moulds, cores and lost
models are generally produced as part of the foundry
process, starting from sand, alloying elements and other
additives to give to this mixture the opportune moulding,
cohesion and mechanical resistance. Successively, moulds
and cores are assembled together than they are ready to the
previous cited casting phase.
After the cooling phase of the castings, the shake-out
and take-out stage allows to get the casting separated by the
moulding box and the sand. In this phase, the circulating
scrap and the sand are recovered to be re-used in the pro-
duction process. Finally, the finishing phase includes the
shot blasting (necessary to eliminate the remaining sand),
the deburring (can be automatic or manual) and, eventu-
ally, the painting.
It is worth to stress that foundries utilise mechanisation
and automation depending on the need for reproductivity
and on the series sizes. The most flexible installation is
typically the jobbing foundry. This produces a variety of
products in small numbers (say\100). In general, this type
of foundry applies manual moulding techniques with resin-
bonded sand moulds. The melting furnace works batch
wise to allow an easy change of alloy.
For medium-sized series (\1,000 parts), mechanised
moulding and casting lines are used. Lost mould foundries
utilise mould making machines. This implies the use of
green sand, which allows fast mould making. The size of
the mould making machine limits the maximum size of the
castings. Casting can be performed manually or using a
412 Int J Energy Environ Eng (2016) 7:409–423
123
pouring machine. Auxiliary side processes, such as sand
preparation, are operated in a semi-automated way with
remote control. Both continuous furnaces (cupola, shaft)
and batch furnaces are used.
Large series of small castings are made in flaskless
green sand moulding. The main difference for medium-
sized series is the further automation of the finishing, the
quality control and the mould assembly. In reality, the
experience of the Authors during the audits performed
demonstrated that all these type of installation have been
found, often present in the same foundry organized in two
or three of these different ways of production.
As an example, Tables 2 and 3 report a sort of ‘‘energy
balance’’ for one of the audited foundries (the one which
Table 4 is related, with five electric induction furnaces)
with the allocation of the energy consumption for every
single department. As can be seen, the most part of
energy consumed in one year is electrical energy (39,400
vs. 5,860 MWh of thermal energy, that is natural gas);
more than 80 % of electricity is for the melting phase
(furnaces), while almost all the natural gas is consumed
by the burners for heating and drying the moulds and
cores in the mould making department. The total annual
energy consumption was attributed to the departments
(month by month) by considering the power nominal data
of the equipment, the operating hours and the work load
factors as described in the previous section. Table 3
reports the energy bills and the PV plant (220 kW peak
Fig. 2 The cast iron foundry
process
Int J Energy Environ Eng (2016) 7:409–423 413
123
power of poly-crystalline silicon) production, to close the
energy balance.
In the next sections, the most important ‘‘energy con-
sumers’’ in iron casting foundries are analyzed and possible
energy saving interventions are proposed based also on the
energy audits done by the Authors.
Furnaces
Cupolas
For small–medium foundries (handling less than 2,000 t
per month of good casting), cold blast cupolas (which uses
the blast at atmospheric pressure and at normal environ-
mental temperature) are common. In order to reduce the
CO emission and increase the energy efficiency, the con-
version of cold blast furnaces to hot blast furnaces may be
considered (this is economically justified only for bigger
plants operating continuously). In hot blast cupolas, the
combustion air (the ‘‘blast’’) is preheated typically by a
recuperative heat exchanger. This involves the transfer of
the residual heat of the flue gases (that can be at
900–1,000 �C) to the combustion air by means of post-
combustion of exhausts (collected at the top of the furnace,
mixed with sufficient air and then burned in a unit) and the
following heat exchange in a recuperator. Typically, the
blast air is heated at temperatures of 500–600 �C. Abovethese temperatures, problems arise with the sintering of
furnace dust on the surface of the recuperator. The effect of
Table 2 Yearly energy use per department and for type of utilisation for one of the audited foundries (year 2013)
Electrical Thermal
Machinery Compressed air system Lighting Total
kWh % kWh % kWh % kWh % kWh %
Sand mould 99,105 0.3 8,850 1.0 40,416 12.6 148,372 0.4
Mould making 3,363,515 8.8 513,305 58.0 184,651 57.5 4,061,471 10.3 5,187,644 88.5
Sand core making 101,128 0.3 44,250 5.0 39,334 12.2 184,712 0.5 124,822 2.1
Furnaces/laboratories 647,219 1.7 88,501 10.0 735,720 1.9 63,765 1.1
Furnaces 31,054,836 81.3 31,054,836 78.8
Robotized deburring 76,857 0.2 35,400 4.0 112,257 0.3
M/G blast 582,497 1.5 44,250 5.0 626,747 1.6 31,959 0.5
Manual deburring 202,256 0.5 88,501 10.0 290,757 0.7 95,648 1.6
Automatized blast 333,722 0.9 44,250 5.0 377,973 1.0
Painting 182,030 0.5 8,850 1.0 11,063 3.4 201,943 0.5 208,036 3.5
Logistics/changing room/canteen 101,128 0.3 101,128 0.3 135,996 2.3
Maintenance 303,384 0.8 8,850 1.0 28,579 8.9 340,812 0.9
Offices building 20,226 0.1 17,311 5.4 37,537 0.1 15,972 0.3
Aux (pumps, chillers, cooling tower) 1,126,565 2.9 1,126,565 2.9
Total 38,194,468 100 885,008 100 321,353 100 39,400,829 100 5,863,842 100
Table 4 Example of values for the variable of Fig. 3
VA (m3 h-1) TA (�C) VB (m3 h-1) TB (�C) Efficiency
recuperator
55,000 950 110,000 950 50 %
TE (�C) TC (�C) TG (�C) pG (MPa) hG(kJ kg-1)
20 485 400 2.9 3,224
TF (�C) pF (MPa) hF (kJ kg-1) Eff. HRSG msteam
(kg s-1)
50 0.012 2,387 80 % 1.24
Eff. cycle TD (�C) Psteam turbine
(kW)
27.8 % 137 1,040
Table 3 Yearly energy consumption of electrical energy and natural
gas, electrical energy production from the PV plant and cast iron
production for the same foundry of Table 2 (year 2013)
Energy bills Electrical energy 39,199,096 kWh
5,844,022 €
Natural Gas 618,112 Sm3
228,787 €
Electrical PV production 187,040 kWh
Cast iron production (gross) 34,853 t
Cast iron production (net) 24,542 t
414 Int J Energy Environ Eng (2016) 7:409–423
123
air preheating on thermal efficiency can be in the order of
5 % (the coke quality may affect the overall blast effi-
ciency) [14, 15].
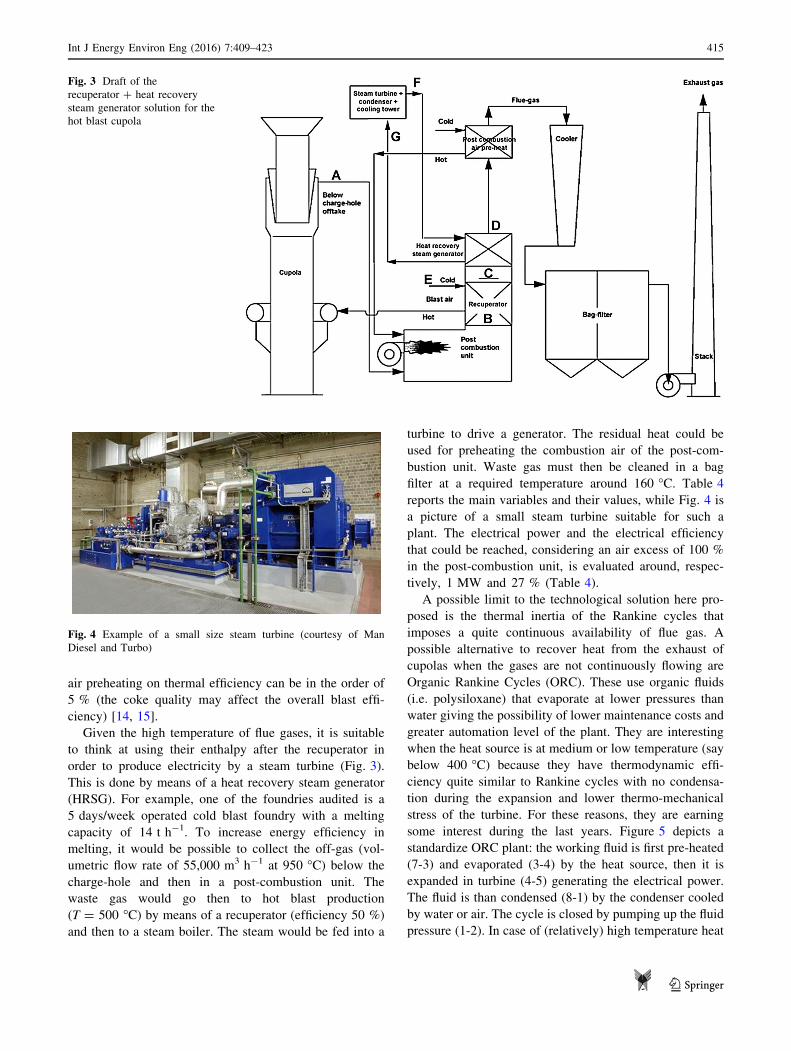
Given the high temperature of flue gases, it is suitable
to think at using their enthalpy after the recuperator in
order to produce electricity by a steam turbine (Fig. 3).
This is done by means of a heat recovery steam generator
(HRSG). For example, one of the foundries audited is a
5 days/week operated cold blast foundry with a melting
capacity of 14 t h-1. To increase energy efficiency in
melting, it would be possible to collect the off-gas (vol-
umetric flow rate of 55,000 m3 h-1 at 950 �C) below the
charge-hole and then in a post-combustion unit. The
waste gas would go then to hot blast production
(T = 500 �C) by means of a recuperator (efficiency 50 %)
and then to a steam boiler. The steam would be fed into a
turbine to drive a generator. The residual heat could be
used for preheating the combustion air of the post-com-
bustion unit. Waste gas must then be cleaned in a bag
filter at a required temperature around 160 �C. Table 4
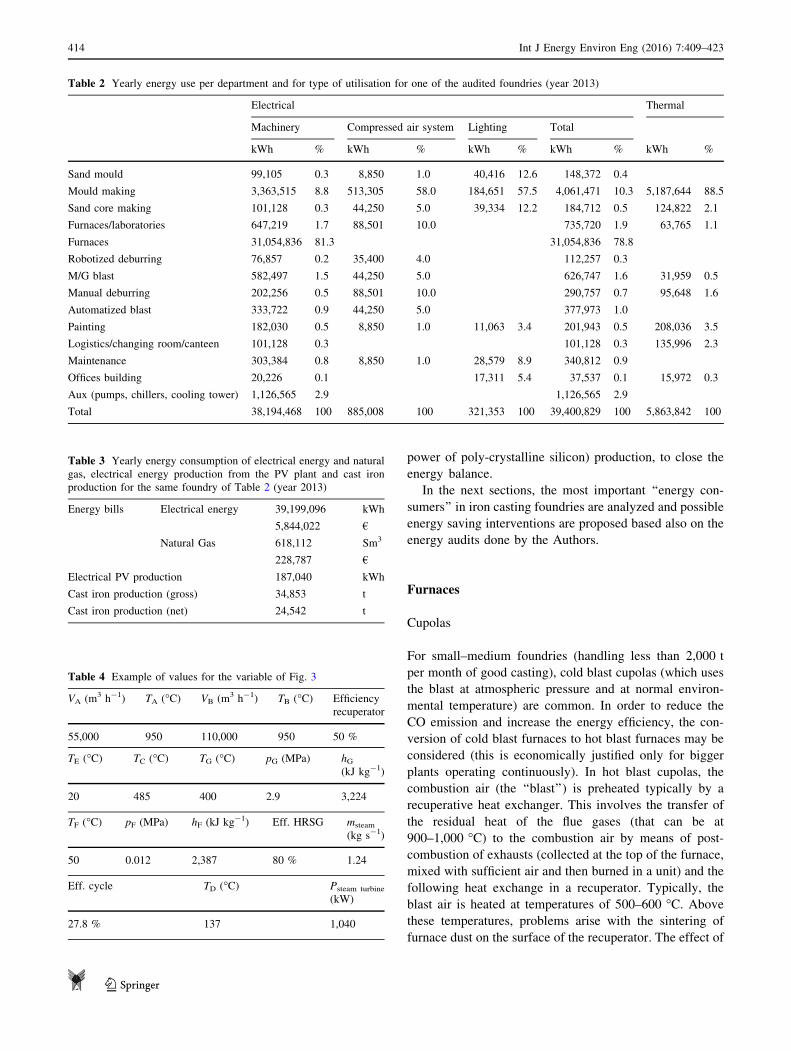
reports the main variables and their values, while Fig. 4 is
a picture of a small steam turbine suitable for such a
plant. The electrical power and the electrical efficiency
that could be reached, considering an air excess of 100 %
in the post-combustion unit, is evaluated around, respec-
tively, 1 MW and 27 % (Table 4).
A possible limit to the technological solution here pro-
posed is the thermal inertia of the Rankine cycles that
imposes a quite continuous availability of flue gas. A
possible alternative to recover heat from the exhaust of
cupolas when the gases are not continuously flowing are
Organic Rankine Cycles (ORC). These use organic fluids
(i.e. polysiloxane) that evaporate at lower pressures than
water giving the possibility of lower maintenance costs and
greater automation level of the plant. They are interesting
when the heat source is at medium or low temperature (say
below 400 �C) because they have thermodynamic effi-
ciency quite similar to Rankine cycles with no condensa-
tion during the expansion and lower thermo-mechanical
stress of the turbine. For these reasons, they are earning
some interest during the last years. Figure 5 depicts a
standardize ORC plant: the working fluid is first pre-heated
(7-3) and evaporated (3-4) by the heat source, then it is
expanded in turbine (4-5) generating the electrical power.
The fluid is than condensed (8-1) by the condenser cooled
by water or air. The cycle is closed by pumping up the fluid
pressure (1-2). In case of (relatively) high temperature heat
Fig. 4 Example of a small size steam turbine (courtesy of Man
Diesel and Turbo)
Fig. 3 Draft of the
recuperator ? heat recovery
steam generator solution for the
hot blast cupola
Int J Energy Environ Eng (2016) 7:409–423 415
123
sources, it is advantageous to add a regenerator to further
pre-heat the fluid (2-7) using the enthalpy out of the turbine
(5-8).
Obviously, a recuperator heat exchanger can be pro-
vided to produce hot water for process uses, heating or
cooling. As an example, the product depicted in Fig. 6 is
able to produce 256 kW of thermal power (22 m3 h-1 of
hot water at 94 �C) by means of 10,000 m3 h-1 of hot flue
gases at 300 �C, with an efficiency of 80 %. It can be easily
installed directly on the chimney so on the roof of the
factory.
Other ways to save energy in cupolas and other type of
combustion furnaces used in foundries (like crucible and
rotary furnaces) can be:
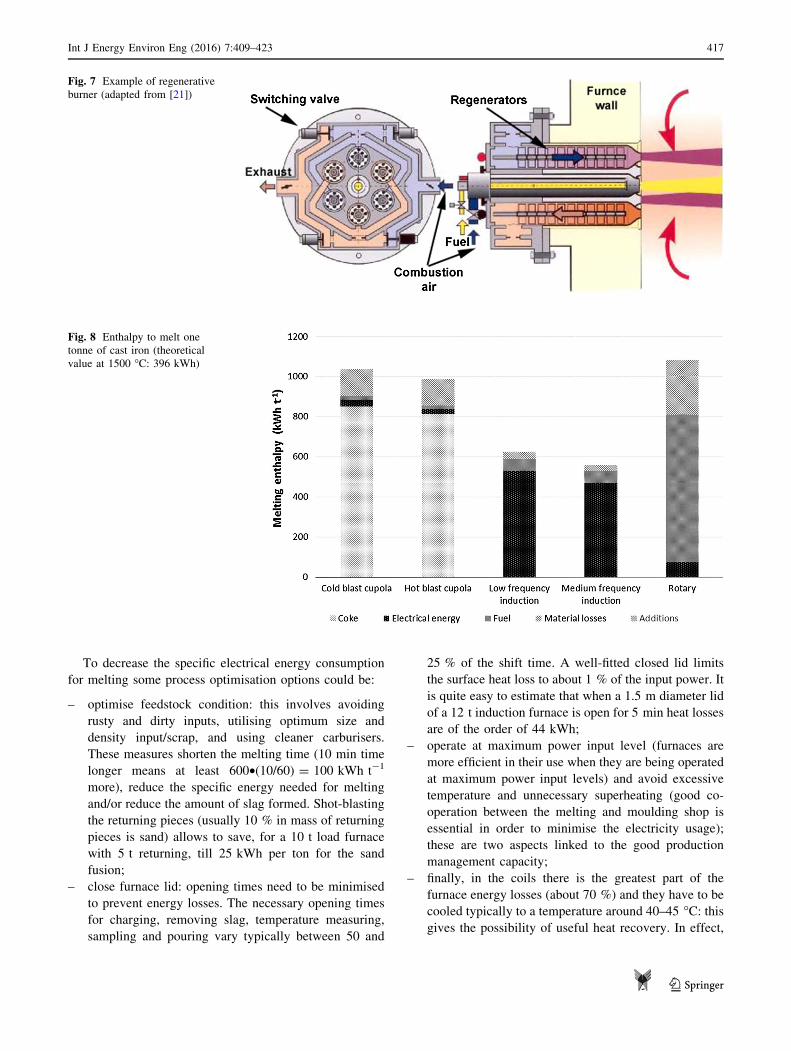
– regenerative burners: natural gas burners are commonly
present in cupolas for the initial phases of the charges
combustion; they are the main burner in crucible and
rotary furnaces. One way to pre-heat the combustion air
is by means of regenerative burners arranged in pairs.
They work in cyclic fashion: while one burner fires, the
exhaust gases flow through the other where their heat
content is passed through a porous bed of ceramic
material around the burner and then stored. Next, the
firing is reversed. Cold combustion air then passes
through this material and becomes preheated, say to
600 �C (Fig. 7). In tested installations, a 17–20 %
increase in efficiency followed. The payback was less
than one year [12];
– pre-heating of the scraps: the heat from the furnace off-
gases can be used for the purpose, or natural gas is
used. This decreases energy input to the furnace, thus
the melting is faster and the melting capacity increases.
Electric induction furnaces
The coreless induction furnace is a batch-melting furnace
containing a water-cooled copper coil; the inside is inter-
nally refractory lined, the outside is insulated and enclosed
in a steel shell, the top is often open for charging and
deslagging operations. A first way to increase energy effi-
ciency is to substitute mains frequency (50 Hz) furnaces
with medium frequency (up to 250 Hz) ones. The latters
have a higher power density (up to 1,000 kW t-1) than the
formers (300 kW t-1). This allows the use of a smaller
crucible (up to a factor of three smaller) which results in a
smaller total heat loss. The thermal efficiency of medium
frequency furnaces is 10 % higher than for the mains fre-
quency types [14].
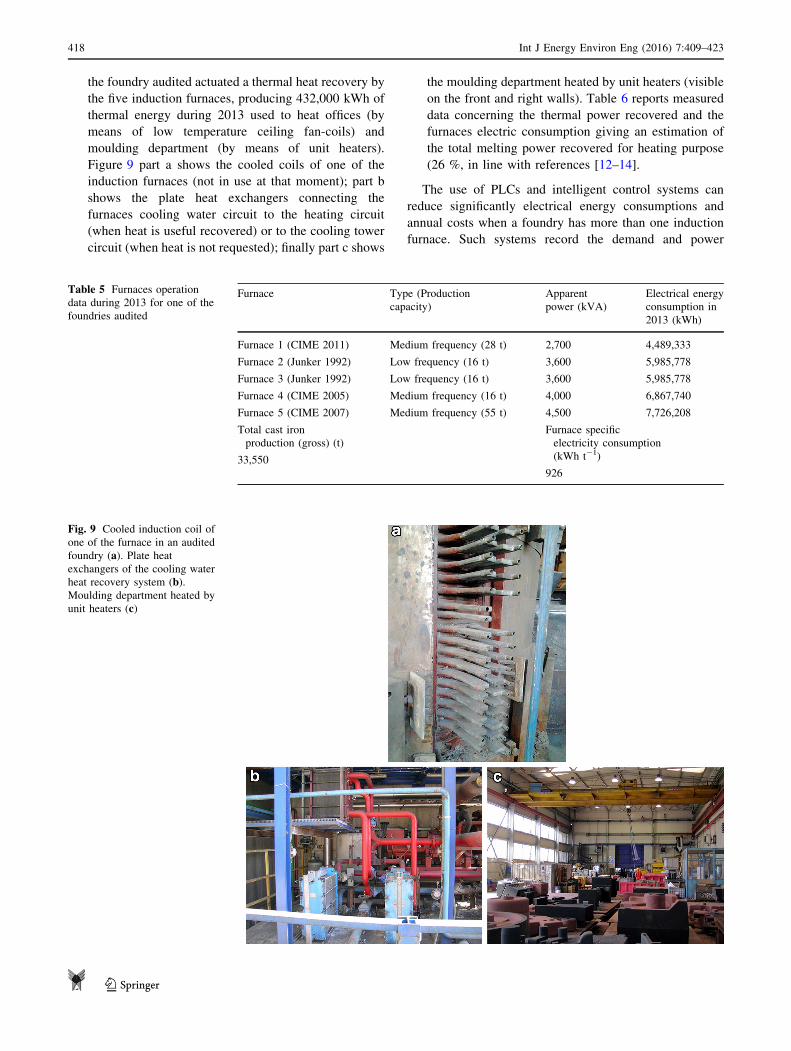
A typical coreless furnace can melt a ton of iron and
raise the temperature of the liquid metal to 1,500 �C using
less than 600 kWh of electricity (Fig. 8). However, in
practice, only a few foundries can achieve this level of
specific consumption on a week-by-week basis. Prevailing
circumstances in many foundries can restrict the scope for
good energy management. As an example, one of the
audited foundries by the Authors has five induction fur-
naces: Table 5 reports the main characteristics and energy
performances as an example.
Fig. 6 Example of heat recovery system for hot flue gases installable
directly on the chimney (courtesy of Comex Group)
Fig. 5 Schematic view and
thermodynamic cycle of an
ORC (courtesy of Turboden)
416 Int J Energy Environ Eng (2016) 7:409–423
123
To decrease the specific electrical energy consumption
for melting some process optimisation options could be:
– optimise feedstock condition: this involves avoiding
rusty and dirty inputs, utilising optimum size and
density input/scrap, and using cleaner carburisers.
These measures shorten the melting time (10 min time
longer means at least 600•(10/60) = 100 kWh t-1
more), reduce the specific energy needed for melting
and/or reduce the amount of slag formed. Shot-blasting
the returning pieces (usually 10 % in mass of returning
pieces is sand) allows to save, for a 10 t load furnace
with 5 t returning, till 25 kWh per ton for the sand
fusion;
– close furnace lid: opening times need to be minimised
to prevent energy losses. The necessary opening times
for charging, removing slag, temperature measuring,
sampling and pouring vary typically between 50 and
25 % of the shift time. A well-fitted closed lid limits
the surface heat loss to about 1 % of the input power. It
is quite easy to estimate that when a 1.5 m diameter lid
of a 12 t induction furnace is open for 5 min heat losses
are of the order of 44 kWh;
– operate at maximum power input level (furnaces are
more efficient in their use when they are being operated
at maximum power input levels) and avoid excessive
temperature and unnecessary superheating (good co-
operation between the melting and moulding shop is
essential in order to minimise the electricity usage);
these are two aspects linked to the good production
management capacity;
– finally, in the coils there is the greatest part of the
furnace energy losses (about 70 %) and they have to be
cooled typically to a temperature around 40–45 �C: thisgives the possibility of useful heat recovery. In effect,
Fig. 7 Example of regenerative
burner (adapted from [21])
Fig. 8 Enthalpy to melt one
tonne of cast iron (theoretical
value at 1500 �C: 396 kWh)
Int J Energy Environ Eng (2016) 7:409–423 417
123
the foundry audited actuated a thermal heat recovery by
the five induction furnaces, producing 432,000 kWh of
thermal energy during 2013 used to heat offices (by
means of low temperature ceiling fan-coils) and
moulding department (by means of unit heaters).
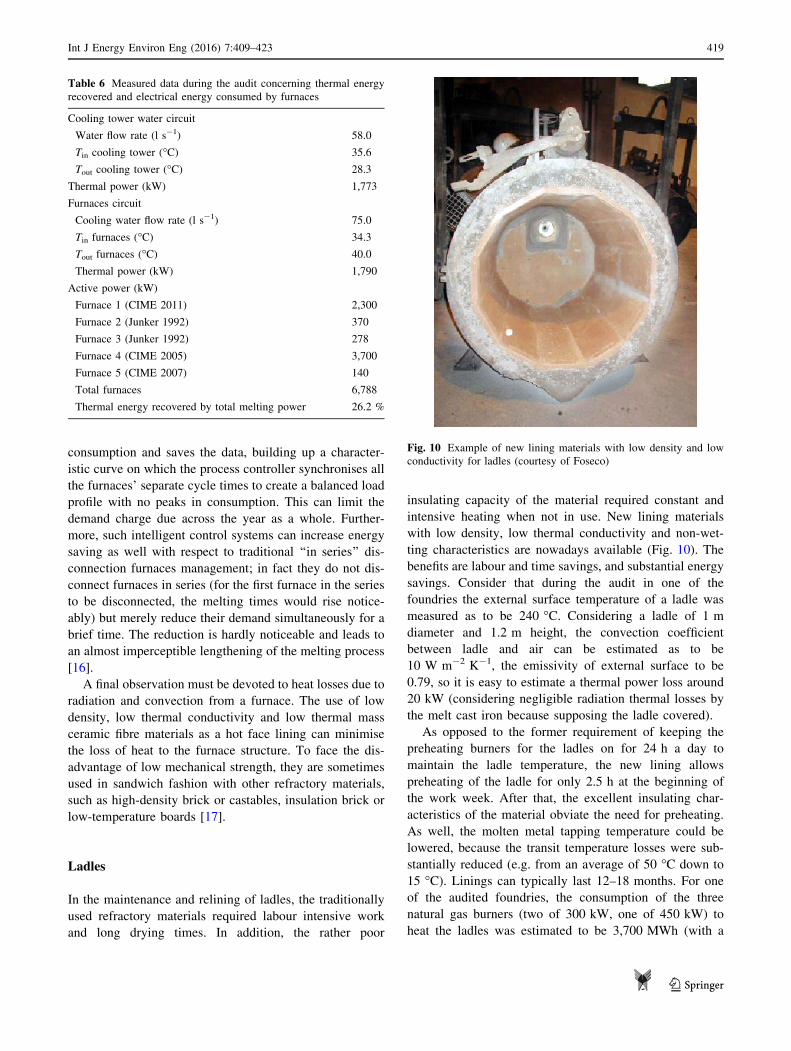
Figure 9 part a shows the cooled coils of one of the
induction furnaces (not in use at that moment); part b
shows the plate heat exchangers connecting the
furnaces cooling water circuit to the heating circuit
(when heat is useful recovered) or to the cooling tower
circuit (when heat is not requested); finally part c shows
the moulding department heated by unit heaters (visible
on the front and right walls). Table 6 reports measured
data concerning the thermal power recovered and the
furnaces electric consumption giving an estimation of
the total melting power recovered for heating purpose
(26 %, in line with references [12–14].
The use of PLCs and intelligent control systems can
reduce significantly electrical energy consumptions and
annual costs when a foundry has more than one induction
furnace. Such systems record the demand and power
Table 5 Furnaces operation
data during 2013 for one of the
foundries audited
Furnace Type (Production
capacity)
Apparent
power (kVA)
Electrical energy
consumption in
2013 (kWh)
Furnace 1 (CIME 2011) Medium frequency (28 t) 2,700 4,489,333
Furnace 2 (Junker 1992) Low frequency (16 t) 3,600 5,985,778
Furnace 3 (Junker 1992) Low frequency (16 t) 3,600 5,985,778
Furnace 4 (CIME 2005) Medium frequency (16 t) 4,000 6,867,740
Furnace 5 (CIME 2007) Medium frequency (55 t) 4,500 7,726,208
Total cast iron
production (gross) (t)
33,550
Furnace specific
electricity consumption
(kWh t-1)
926
Fig. 9 Cooled induction coil of
one of the furnace in an audited
foundry (a). Plate heat
exchangers of the cooling water
heat recovery system (b).Moulding department heated by
unit heaters (c)
418 Int J Energy Environ Eng (2016) 7:409–423
123
consumption and saves the data, building up a character-
istic curve on which the process controller synchronises all
the furnaces’ separate cycle times to create a balanced load
profile with no peaks in consumption. This can limit the
demand charge due across the year as a whole. Further-
more, such intelligent control systems can increase energy
saving as well with respect to traditional ‘‘in series’’ dis-
connection furnaces management; in fact they do not dis-
connect furnaces in series (for the first furnace in the series
to be disconnected, the melting times would rise notice-
ably) but merely reduce their demand simultaneously for a
brief time. The reduction is hardly noticeable and leads to
an almost imperceptible lengthening of the melting process
[16].
A final observation must be devoted to heat losses due to
radiation and convection from a furnace. The use of low
density, low thermal conductivity and low thermal mass
ceramic fibre materials as a hot face lining can minimise
the loss of heat to the furnace structure. To face the dis-
advantage of low mechanical strength, they are sometimes
used in sandwich fashion with other refractory materials,
such as high-density brick or castables, insulation brick or
low-temperature boards [17].
Ladles
In the maintenance and relining of ladles, the traditionally
used refractory materials required labour intensive work
and long drying times. In addition, the rather poor
insulating capacity of the material required constant and
intensive heating when not in use. New lining materials
with low density, low thermal conductivity and non-wet-
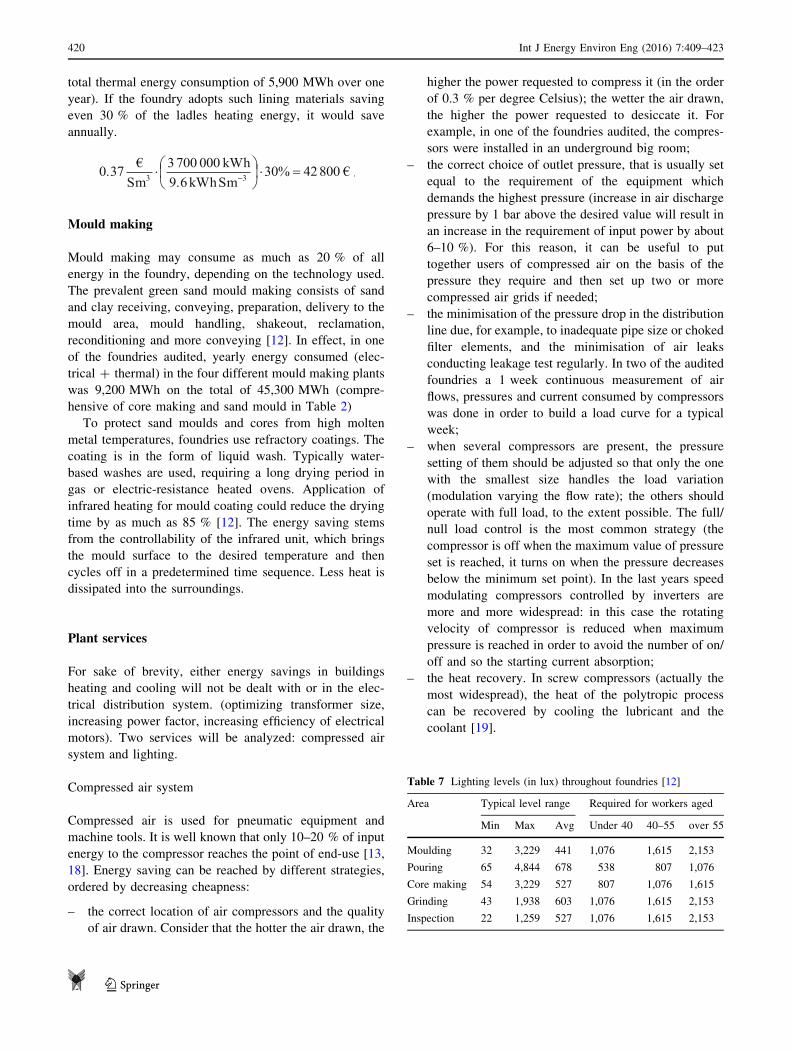
ting characteristics are nowadays available (Fig. 10). The
benefits are labour and time savings, and substantial energy
savings. Consider that during the audit in one of the
foundries the external surface temperature of a ladle was
measured as to be 240 �C. Considering a ladle of 1 m
diameter and 1.2 m height, the convection coefficient
between ladle and air can be estimated as to be
10 W m-2 K-1, the emissivity of external surface to be
0.79, so it is easy to estimate a thermal power loss around
20 kW (considering negligible radiation thermal losses by
the melt cast iron because supposing the ladle covered).
As opposed to the former requirement of keeping the
preheating burners for the ladles on for 24 h a day to
maintain the ladle temperature, the new lining allows
preheating of the ladle for only 2.5 h at the beginning of
the work week. After that, the excellent insulating char-
acteristics of the material obviate the need for preheating.
As well, the molten metal tapping temperature could be
lowered, because the transit temperature losses were sub-
stantially reduced (e.g. from an average of 50 �C down to
15 �C). Linings can typically last 12–18 months. For one
of the audited foundries, the consumption of the three
natural gas burners (two of 300 kW, one of 450 kW) to
heat the ladles was estimated to be 3,700 MWh (with a
Table 6 Measured data during the audit concerning thermal energy
recovered and electrical energy consumed by furnaces
Cooling tower water circuit
Water flow rate (l s-1) 58.0
Tin cooling tower (�C) 35.6
Tout cooling tower (�C) 28.3
Thermal power (kW) 1,773
Furnaces circuit
Cooling water flow rate (l s-1) 75.0
Tin furnaces (�C) 34.3
Tout furnaces (�C) 40.0
Thermal power (kW) 1,790
Active power (kW)
Furnace 1 (CIME 2011) 2,300
Furnace 2 (Junker 1992) 370
Furnace 3 (Junker 1992) 278
Furnace 4 (CIME 2005) 3,700
Furnace 5 (CIME 2007) 140
Total furnaces 6,788
Thermal energy recovered by total melting power 26.2 %
Fig. 10 Example of new lining materials with low density and low
conductivity for ladles (courtesy of Foseco)
Int J Energy Environ Eng (2016) 7:409–423 419
123
total thermal energy consumption of 5,900 MWh over one
year). If the foundry adopts such lining materials saving
even 30 % of the ladles heating energy, it would save
annually.
Mould making
Mould making may consume as much as 20 % of all
energy in the foundry, depending on the technology used.
The prevalent green sand mould making consists of sand
and clay receiving, conveying, preparation, delivery to the
mould area, mould handling, shakeout, reclamation,
reconditioning and more conveying [12]. In effect, in one
of the foundries audited, yearly energy consumed (elec-
trical ? thermal) in the four different mould making plants
was 9,200 MWh on the total of 45,300 MWh (compre-
hensive of core making and sand mould in Table 2)
To protect sand moulds and cores from high molten
metal temperatures, foundries use refractory coatings. The
coating is in the form of liquid wash. Typically water-
based washes are used, requiring a long drying period in
gas or electric-resistance heated ovens. Application of
infrared heating for mould coating could reduce the drying
time by as much as 85 % [12]. The energy saving stems
from the controllability of the infrared unit, which brings
the mould surface to the desired temperature and then
cycles off in a predetermined time sequence. Less heat is
dissipated into the surroundings.
Plant services
For sake of brevity, either energy savings in buildings
heating and cooling will not be dealt with or in the elec-
trical distribution system. (optimizing transformer size,
increasing power factor, increasing efficiency of electrical
motors). Two services will be analyzed: compressed air
system and lighting.
Compressed air system
Compressed air is used for pneumatic equipment and
machine tools. It is well known that only 10–20 % of input
energy to the compressor reaches the point of end-use [13,
18]. Energy saving can be reached by different strategies,
ordered by decreasing cheapness:
– the correct location of air compressors and the quality
of air drawn. Consider that the hotter the air drawn, the
higher the power requested to compress it (in the order
of 0.3 % per degree Celsius); the wetter the air drawn,
the higher the power requested to desiccate it. For
example, in one of the foundries audited, the compres-
sors were installed in an underground big room;
– the correct choice of outlet pressure, that is usually set
equal to the requirement of the equipment which
demands the highest pressure (increase in air discharge
pressure by 1 bar above the desired value will result in
an increase in the requirement of input power by about
6–10 %). For this reason, it can be useful to put
together users of compressed air on the basis of the
pressure they require and then set up two or more
compressed air grids if needed;
– the minimisation of the pressure drop in the distribution
line due, for example, to inadequate pipe size or choked
filter elements, and the minimisation of air leaks
conducting leakage test regularly. In two of the audited
foundries a 1 week continuous measurement of air
flows, pressures and current consumed by compressors
was done in order to build a load curve for a typical
week;
– when several compressors are present, the pressure
setting of them should be adjusted so that only the one
with the smallest size handles the load variation
(modulation varying the flow rate); the others should
operate with full load, to the extent possible. The full/
null load control is the most common strategy (the
compressor is off when the maximum value of pressure
set is reached, it turns on when the pressure decreases
below the minimum set point). In the last years speed
modulating compressors controlled by inverters are
more and more widespread: in this case the rotating
velocity of compressor is reduced when maximum
pressure is reached in order to avoid the number of on/
off and so the starting current absorption;
– the heat recovery. In screw compressors (actually the
most widespread), the heat of the polytropic process
can be recovered by cooling the lubricant and the
coolant [19].
Table 7 Lighting levels (in lux) throughout foundries [12]
Area Typical level range Required for workers aged
Min Max Avg Under 40 40–55 over 55
Moulding 32 3,229 441 1,076 1,615 2,153
Pouring 65 4,844 678 538 807 1,076
Core making 54 3,229 527 807 1,076 1,615
Grinding 43 1,938 603 1,076 1,615 2,153
Inspection 22 1,259 527 1,076 1,615 2,153
420 Int J Energy Environ Eng (2016) 7:409–423
123
Lighting
Any action aimed at increasing lighting energy efficiency
should not diminish the requirements of adequate lighting
of the workplaces (Table 7). In one of the audited found-
ries, the substitution of 400 W metal halide lamps with
300 W LED lamps implied an increased illuminance: from
80 to 250 lx on the plan 0.8 m height from the ground.
Two main strategies are possible, adoptable in series.
Light bulbs replacement
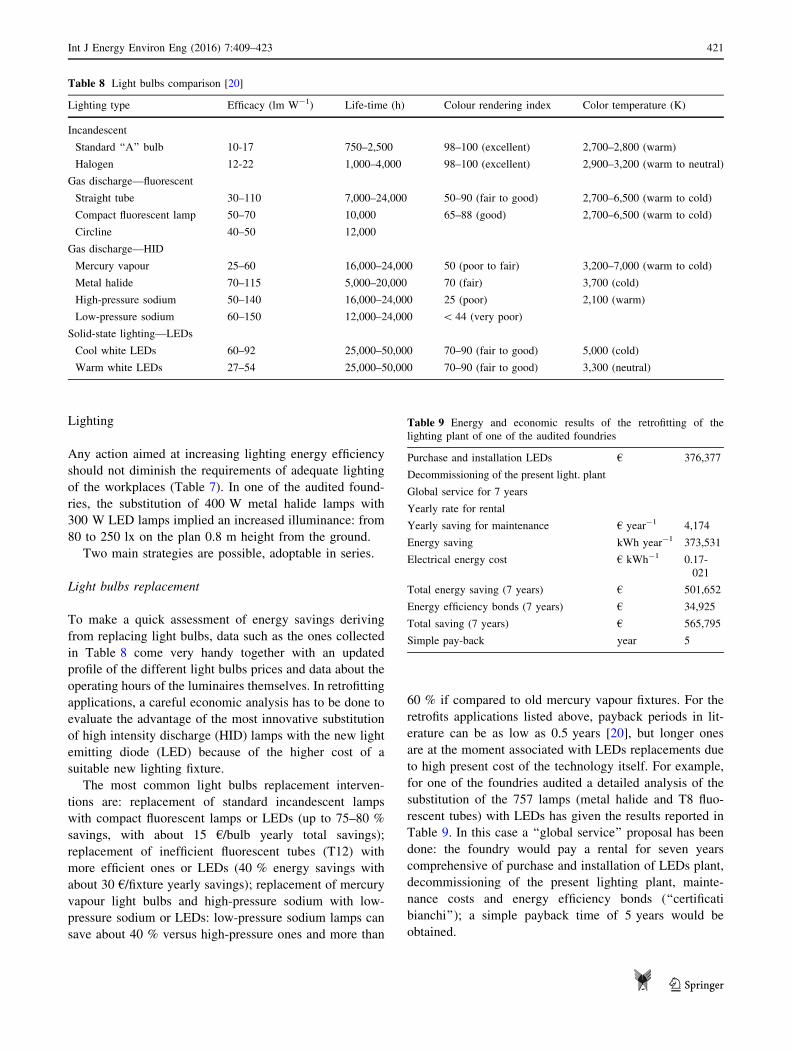
To make a quick assessment of energy savings deriving
from replacing light bulbs, data such as the ones collected
in Table 8 come very handy together with an updated
profile of the different light bulbs prices and data about the
operating hours of the luminaires themselves. In retrofitting
applications, a careful economic analysis has to be done to
evaluate the advantage of the most innovative substitution
of high intensity discharge (HID) lamps with the new light
emitting diode (LED) because of the higher cost of a
suitable new lighting fixture.
The most common light bulbs replacement interven-
tions are: replacement of standard incandescent lamps
with compact fluorescent lamps or LEDs (up to 75–80 %
savings, with about 15 €/bulb yearly total savings);
replacement of inefficient fluorescent tubes (T12) with
more efficient ones or LEDs (40 % energy savings with
about 30 €/fixture yearly savings); replacement of mercury
vapour light bulbs and high-pressure sodium with low-
pressure sodium or LEDs: low-pressure sodium lamps can
save about 40 % versus high-pressure ones and more than
60 % if compared to old mercury vapour fixtures. For the
retrofits applications listed above, payback periods in lit-
erature can be as low as 0.5 years [20], but longer ones
are at the moment associated with LEDs replacements due
to high present cost of the technology itself. For example,
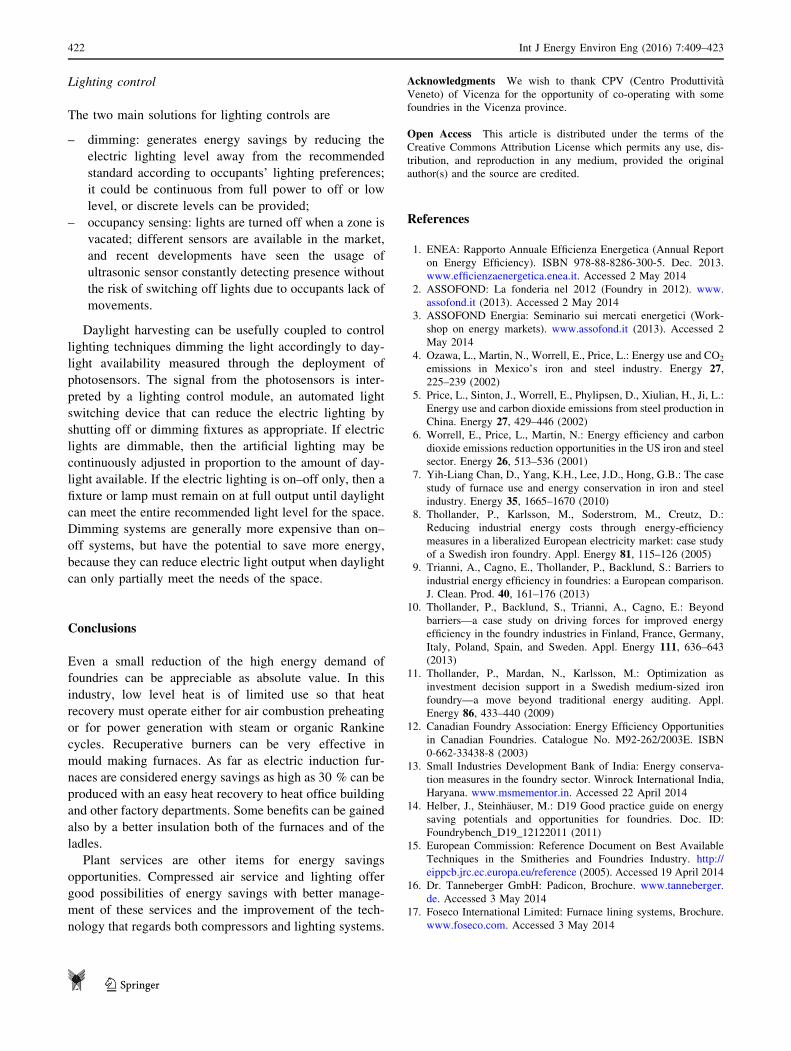
for one of the foundries audited a detailed analysis of the
substitution of the 757 lamps (metal halide and T8 fluo-
rescent tubes) with LEDs has given the results reported in
Table 9. In this case a ‘‘global service’’ proposal has been
done: the foundry would pay a rental for seven years
comprehensive of purchase and installation of LEDs plant,
decommissioning of the present lighting plant, mainte-
nance costs and energy efficiency bonds (‘‘certificati
bianchi’’); a simple payback time of 5 years would be
obtained.
Table 8 Light bulbs comparison [20]
Lighting type Efficacy (lm W-1) Life-time (h) Colour rendering index Color temperature (K)
Incandescent
Standard ‘‘A’’ bulb 10-17 750–2,500 98–100 (excellent) 2,700–2,800 (warm)
Halogen 12-22 1,000–4,000 98–100 (excellent) 2,900–3,200 (warm to neutral)
Gas discharge—fluorescent
Straight tube 30–110 7,000–24,000 50–90 (fair to good) 2,700–6,500 (warm to cold)
Compact fluorescent lamp 50–70 10,000 65–88 (good) 2,700–6,500 (warm to cold)
Circline 40–50 12,000
Gas discharge—HID
Mercury vapour 25–60 16,000–24,000 50 (poor to fair) 3,200–7,000 (warm to cold)
Metal halide 70–115 5,000–20,000 70 (fair) 3,700 (cold)
High-pressure sodium 50–140 16,000–24,000 25 (poor) 2,100 (warm)
Low-pressure sodium 60–150 12,000–24,000 \ 44 (very poor)
Solid-state lighting—LEDs
Cool white LEDs 60–92 25,000–50,000 70–90 (fair to good) 5,000 (cold)
Warm white LEDs 27–54 25,000–50,000 70–90 (fair to good) 3,300 (neutral)
Table 9 Energy and economic results of the retrofitting of the
lighting plant of one of the audited foundries
Purchase and installation LEDs
Decommissioning of the present light. plant
Global service for 7 years
Yearly rate for rental
€ 376,377
Yearly saving for maintenance € year-1 4,174
Energy saving kWh year-1 373,531
Electrical energy cost € kWh-1 0.17-
021
Total energy saving (7 years) € 501,652
Energy efficiency bonds (7 years) € 34,925
Total saving (7 years) € 565,795
Simple pay-back year 5
Int J Energy Environ Eng (2016) 7:409–423 421
123
Lighting control
The two main solutions for lighting controls are
– dimming: generates energy savings by reducing the
electric lighting level away from the recommended
standard according to occupants’ lighting preferences;
it could be continuous from full power to off or low
level, or discrete levels can be provided;
– occupancy sensing: lights are turned off when a zone is
vacated; different sensors are available in the market,
and recent developments have seen the usage of
ultrasonic sensor constantly detecting presence without
the risk of switching off lights due to occupants lack of
movements.
Daylight harvesting can be usefully coupled to control
lighting techniques dimming the light accordingly to day-
light availability measured through the deployment of
photosensors. The signal from the photosensors is inter-
preted by a lighting control module, an automated light
switching device that can reduce the electric lighting by
shutting off or dimming fixtures as appropriate. If electric
lights are dimmable, then the artificial lighting may be
continuously adjusted in proportion to the amount of day-
light available. If the electric lighting is on–off only, then a
fixture or lamp must remain on at full output until daylight
can meet the entire recommended light level for the space.
Dimming systems are generally more expensive than on–
off systems, but have the potential to save more energy,
because they can reduce electric light output when daylight
can only partially meet the needs of the space.
Conclusions
Even a small reduction of the high energy demand of
foundries can be appreciable as absolute value. In this
industry, low level heat is of limited use so that heat
recovery must operate either for air combustion preheating
or for power generation with steam or organic Rankine
cycles. Recuperative burners can be very effective in
mould making furnaces. As far as electric induction fur-
naces are considered energy savings as high as 30 % can be
produced with an easy heat recovery to heat office building
and other factory departments. Some benefits can be gained
also by a better insulation both of the furnaces and of the
ladles.
Plant services are other items for energy savings
opportunities. Compressed air service and lighting offer
good possibilities of energy savings with better manage-
ment of these services and the improvement of the tech-
nology that regards both compressors and lighting systems.
Acknowledgments We wish to thank CPV (Centro Produttivita
Veneto) of Vicenza for the opportunity of co-operating with some
foundries in the Vicenza province.
Open Access This article is distributed under the terms of the
Creative Commons Attribution License which permits any use, dis-
tribution, and reproduction in any medium, provided the original
author(s) and the source are credited.
References
1. ENEA: Rapporto Annuale Efficienza Energetica (Annual Report
on Energy Efficiency). ISBN 978-88-8286-300-5. Dec. 2013.
www.efficienzaenergetica.enea.it. Accessed 2 May 2014
2. ASSOFOND: La fonderia nel 2012 (Foundry in 2012). www.
assofond.it (2013). Accessed 2 May 2014
3. ASSOFOND Energia: Seminario sui mercati energetici (Work-
shop on energy markets). www.assofond.it (2013). Accessed 2
May 2014
4. Ozawa, L., Martin, N., Worrell, E., Price, L.: Energy use and CO2
emissions in Mexico’s iron and steel industry. Energy 27,225–239 (2002)
5. Price, L., Sinton, J., Worrell, E., Phylipsen, D., Xiulian, H., Ji, L.:
Energy use and carbon dioxide emissions from steel production in
China. Energy 27, 429–446 (2002)
6. Worrell, E., Price, L., Martin, N.: Energy efficiency and carbon
dioxide emissions reduction opportunities in the US iron and steel
sector. Energy 26, 513–536 (2001)
7. Yih-Liang Chan, D., Yang, K.H., Lee, J.D., Hong, G.B.: The case
study of furnace use and energy conservation in iron and steel
industry. Energy 35, 1665–1670 (2010)
8. Thollander, P., Karlsson, M., Soderstrom, M., Creutz, D.:
Reducing industrial energy costs through energy-efficiency
measures in a liberalized European electricity market: case study
of a Swedish iron foundry. Appl. Energy 81, 115–126 (2005)
9. Trianni, A., Cagno, E., Thollander, P., Backlund, S.: Barriers to
industrial energy efficiency in foundries: a European comparison.
J. Clean. Prod. 40, 161–176 (2013)
10. Thollander, P., Backlund, S., Trianni, A., Cagno, E.: Beyond
barriers—a case study on driving forces for improved energy
efficiency in the foundry industries in Finland, France, Germany,
Italy, Poland, Spain, and Sweden. Appl. Energy 111, 636–643(2013)
11. Thollander, P., Mardan, N., Karlsson, M.: Optimization as
investment decision support in a Swedish medium-sized iron
foundry—a move beyond traditional energy auditing. Appl.
Energy 86, 433–440 (2009)
12. Canadian Foundry Association: Energy Efficiency Opportunities
in Canadian Foundries. Catalogue No. M92-262/2003E. ISBN
0-662-33438-8 (2003)
13. Small Industries Development Bank of India: Energy conserva-
tion measures in the foundry sector. Winrock International India,
Haryana. www.msmementor.in. Accessed 22 April 2014
14. Helber, J., Steinhauser, M.: D19 Good practice guide on energy
saving potentials and opportunities for foundries. Doc. ID:
Foundrybench_D19_12122011 (2011)
15. European Commission: Reference Document on Best Available
Techniques in the Smitheries and Foundries Industry. http://
eippcb.jrc.ec.europa.eu/reference (2005). Accessed 19 April 2014
16. Dr. Tanneberger GmbH: Padicon, Brochure. www.tanneberger.
de. Accessed 3 May 2014
17. Foseco International Limited: Furnace lining systems, Brochure.
www.foseco.com. Accessed 3 May 2014
422 Int J Energy Environ Eng (2016) 7:409–423
123

18. Anglani, N., Mura, P.: Opportunita di ottimizzazione dei consumi
nella produzione, distribuzione, utilizzo dell’aria compressa nei
settori industriali piu sensibili (Optimisation of energy con-
sumption in production, distribution, use of compressed air in
most sensible industrial sectors). Report RdS 2010/222, ENEA.
(2010)
19. Noro, M., Viero, L.: Possibilita di recupero energetico negli
impianti di climatizzazione industriale (Energy saving opportu-
nities in industrial air conditioning plants). Proc. Conf. AiCARR
‘‘Riduzione dei fabbisogni, recupero di efficienza e fonti
rinnovabili per il risparmio energetico nel settore industriale’’
(‘‘Energy needs reduction, efficiency recovery and renewables for
energy saving in industry’’), pp. 81–129. ISBN 978-88-95620-37-
4. Padua (2010)
20. Moret, S.: Energy efficiency in lighting: daylight harvesting
optimization and wireless sensor networks. Degree thesis, Uni-
versity of Padua. Padua (2012)
21. Wunning, J.G.: Flox�—flameless combustion. Thermoprocess
Symposium (2003)
Int J Energy Environ Eng (2016) 7:409–423 423
123