Embed Size (px)
Citation preview
m
s
Energy Content of U.S. Fast-FoodRestaurant Offerings
14-Year Trends
Katherine W. Bauer, PhD, MS, Mary O. Hearst, PhD, MPH, Alicia A. Earnest, BA,Simone A. French, PhD, J. Michael Oakes, PhD, Lisa J. Harnack, DrPH, RD
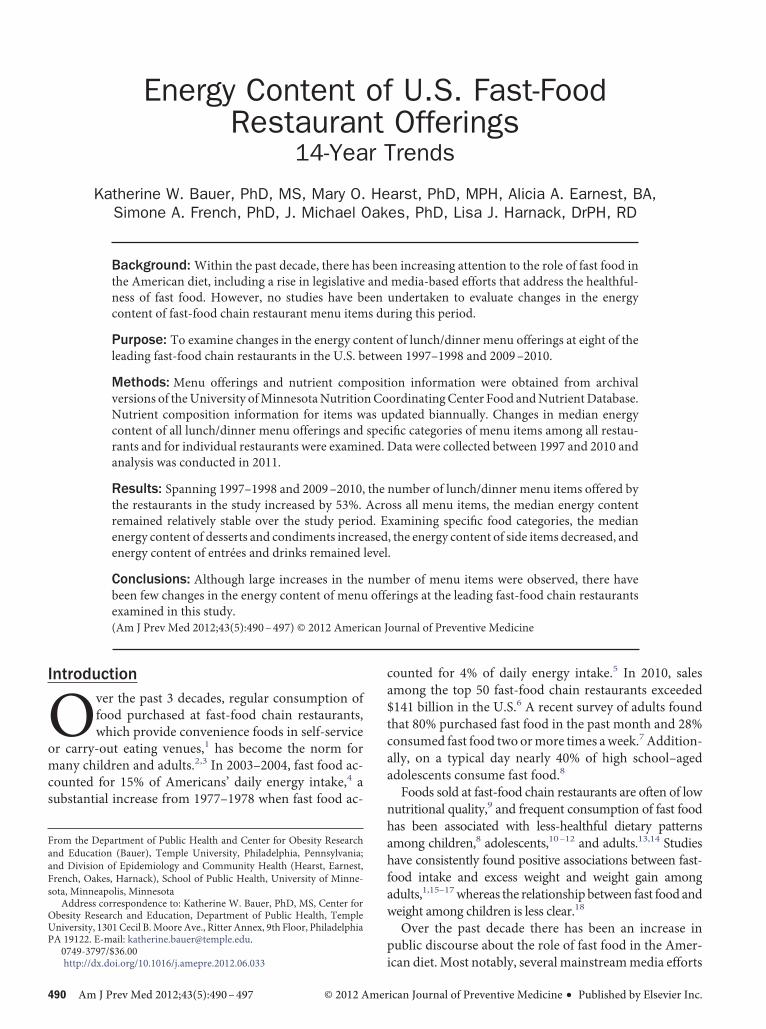
Background: Within the past decade, there has been increasing attention to the role of fast food inthe American diet, including a rise in legislative and media-based efforts that address the healthful-ness of fast food. However, no studies have been undertaken to evaluate changes in the energycontent of fast-food chain restaurant menu items during this period.
Purpose: To examine changes in the energy content of lunch/dinner menu offerings at eight of theleading fast-food chain restaurants in the U.S. between 1997–1998 and 2009–2010.
Methods: Menu offerings and nutrient composition information were obtained from archivalversions of theUniversity ofMinnesotaNutritionCoordinatingCenter Food andNutrientDatabase.Nutrient composition information for items was updated biannually. Changes in median energycontent of all lunch/dinner menu offerings and specifıc categories of menu items among all restau-rants and for individual restaurants were examined. Data were collected between 1997 and 2010 andanalysis was conducted in 2011.
Results: Spanning 1997–1998 and 2009–2010, the number of lunch/dinner menu items offered bythe restaurants in the study increased by 53%. Across all menu items, the median energy contentremained relatively stable over the study period. Examining specifıc food categories, the medianenergy content of desserts and condiments increased, the energy content of side items decreased, andenergy content of entrées and drinks remained level.
Conclusions: Although large increases in the number of menu items were observed, there havebeen few changes in the energy content of menu offerings at the leading fast-food chain restaurantsexamined in this study.(Am J Prev Med 2012;43(5):490–497) © 2012 American Journal of Preventive Medicine
ha
Introduction
Over the past 3 decades, regular consumption offood purchased at fast-food chain restaurants,which provide convenience foods in self-service
or carry-out eating venues,1 has become the norm forany children and adults.2,3 In 2003–2004, fast food ac-
counted for 15% of Americans’ daily energy intake,4 aubstantial increase from 1977–1978 when fast food ac-
From the Department of Public Health and Center for Obesity Researchand Education (Bauer), Temple University, Philadelphia, Pennsylvania;and Division of Epidemiology and Community Health (Hearst, Earnest,French, Oakes, Harnack), School of Public Health, University of Minne-sota, Minneapolis, Minnesota
Address correspondence to: Katherine W. Bauer, PhD, MS, Center forObesity Research and Education, Department of Public Health, TempleUniversity, 1301 Cecil B.Moore Ave., Ritter Annex, 9th Floor, PhiladelphiaPA 19122. E-mail: [email protected].
0749-3797/$36.00http://dx.doi.org/10.1016/j.amepre.2012.06.033
490 Am J Prev Med 2012;43(5):490–497 © 2012 Amer
counted for 4% of daily energy intake.5 In 2010, salesamong the top 50 fast-food chain restaurants exceeded$141 billion in the U.S.6 A recent survey of adults foundthat 80% purchased fast food in the past month and 28%consumed fast food two ormore times aweek.7 Addition-ally, on a typical day nearly 40% of high school–agedadolescents consume fast food.8
Foods sold at fast-food chain restaurants are often of lownutritional quality,9 and frequent consumption of fast foodas been associated with less-healthful dietary patternsmong children,8 adolescents,10–12 and adults.13,14 Studieshave consistently found positive associations between fast-food intake and excess weight and weight gain amongadults,1,15–17whereas the relationshipbetween fast food andweight among children is less clear.18
Over the past decade there has been an increase inpublic discourse about the role of fast food in the Amer-
ican diet.Most notably, several mainstreammedia effortsican Journal of Preventive Medicine • Published by Elsevier Inc.
ifpt
ttades
uht“
tmp
tmqtsrt
Bauer et al / Am J Prev Med 2012;43(5):490–497 491
N
detailing the poor nutritional quality of fast food and themethods of food production used by fast-food chain res-taurants have been released, including the book Fast FoodNation: The Dark Side of the All-American Meal by EricSchlosser19 and the movie Super Size Me.20 Manymunic-palities have also developed policy initiatives related toast food. These initiatives include laws requiring theoint-of-purchase publishing of nutritional data on res-aurant menus.21,22 Signed into law inMarch of 2010, thePatient Protection and Affordable Care Act of 2010 pre-empts local menu-labeling initiatives and mandates thatnationwide by 2012 restaurants and food vendors withmore than 20 locations post calorie information for thefood they sell.23
Scientifıc evidence is mixed regarding the effectivenessof efforts such as menu labeling in changing consumerbehavior.24–27 However, it has been suggested that analternative mechanism through which legislation andmedia attention may lead to lower-calo-rie intake by consumers is via changes inthe nutritional quality of fast food by theindustry itself.24,28 Fast-food chain res-aurants may be motivated to decreasehe energy content of their offerings tovoid further legislative requirements,emonstrate a commitment to consum-rs’ health, or attract new calorie-con-cious consumers.In recent years, specifıc restaurants, industry self-reg-latory programs, and leading restaurant associationsave announced several health-conscious changes to res-aurants’ offerings. These changes include elimination ofsuper size” portions,29 the addition of healthier entréeand side items,30 andmodifıcations to the default optionsin children’s meals.31 Despite these changes, a recentevaluation by Kraak et al.32 observed that specifıcally inhe area of children’s meals, limited progress has beenade by the fast-food industry in the expansion andromotion of healthier options.While some fast-food chain restaurants have commit-
ed to improvements to the health profıle of theirenus,29–31 to our knowledge, there have not been anyuantitative examinations of changes in the energy con-ent of fast food over time. This type of research haspecifıcally been called for in order to understand howestaurants may be responding to legislation to improvehe caloric and nutrient composition of their food.24,25
In light of this knowledge gap, this paper aims to ad-dress the following research questions: (1)Has the energycontent ofmenu offerings at eight of the leading fast-foodchain restaurants changed in the past 14 years? and(2) Are there differences between specifıc fast-food res-
Srela
CommePopkthis i
taurant chains in the pattern of change in energy content
ovember 2012
of the menu items during the past 14 years? The answersto these questions can help objectively evaluate whetherleading fast-food restaurants have modifıed the calorieprofıle of their menu offerings during a time period inwhich public scrutiny and legislative efforts related to thisindustry surged.
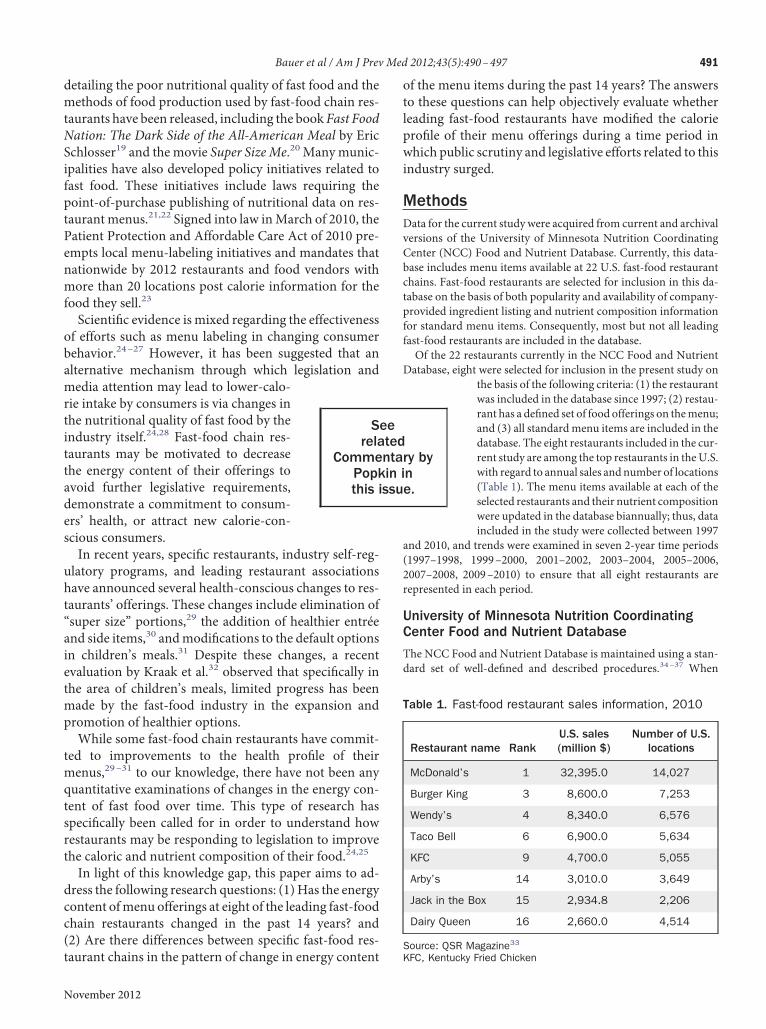
MethodsData for the current study were acquired from current and archivalversions of the University of Minnesota Nutrition CoordinatingCenter (NCC) Food and Nutrient Database. Currently, this data-base includes menu items available at 22 U.S. fast-food restaurantchains. Fast-food restaurants are selected for inclusion in this da-tabase on the basis of both popularity and availability of company-provided ingredient listing and nutrient composition informationfor standard menu items. Consequently, most but not all leadingfast-food restaurants are included in the database.Of the 22 restaurants currently in the NCC Food and Nutrient
Database, eight were selected for inclusion in the present study onthe basis of the following criteria: (1) the restaurantwas included in the database since 1997; (2) restau-rant has a defıned set of food offerings on themenu;and (3) all standardmenu items are included in thedatabase. The eight restaurants included in the cur-rent study are among the top restaurants in theU.S.with regard to annual sales andnumber of locations(Table 1). The menu items available at each of theselected restaurants and their nutrient compositionwere updated in the database biannually; thus, dataincluded in the study were collected between 1997
and 2010, and trends were examined in seven 2-year time periods(1997–1998, 1999–2000, 2001–2002, 2003–2004, 2005–2006,2007–2008, 2009–2010) to ensure that all eight restaurants arerepresented in each period.
University of Minnesota Nutrition CoordinatingCenter Food and Nutrient Database
The NCC Food and Nutrient Database is maintained using a stan-dard set of well-defıned and described procedures.34–37 When
ry byne.
Table 1. Fast-food restaurant sales information, 2010
Restaurant name RankU.S. sales(million $)
Number of U.S.locations
McDonald’s 1 32,395.0 14,027
Burger King 3 8,600.0 7,253
Wendy’s 4 8,340.0 6,576
Taco Bell 6 6,900.0 5,634
KFC 9 4,700.0 5,055
Arby’s 14 3,010.0 3,649
Jack in the Box 15 2,934.8 2,206
Dairy Queen 16 2,660.0 4,514
Source: QSR Magazine33
eetedntain issu
KFC, Kentucky Fried Chicken
smior
492 Bauer et al / Am J Prev Med 2012;43(5):490–497
updating nutrient information for a restaurant, all foods and bev-erages on the restaurant’s menus are obtained from the restaurantcorporation. Ingredient and nutrient composition information isalso sought from the corporation for all items. The ingredientinformation provided is generally a listing of ingredients in de-scending order of content in the menu item.Most restaurants provide information for only a limited set of
nutrients (e.g., kilocalories [kcal], macronutrients, saturated fat,sodium, and some vitamins and minerals) for their food items.Thus, NCC database nutritionists create formulations (recipes)for menu items using an NCC-developed program38 that esti-mates, via a linear optimization algorithm, the amount of eachingredient needed to produce a product with a nutrient profıleclose to that specifıed by the restaurant corporation for theproduct. From this recipe, the composition data for nutrientsbeyond those provided by the restaurant corporation arecalculated.As a general rule, all portion sizes available for food items on
restaurantmenus are included in the database (e.g., small,medium,and large french fries) are included in the database. Exceptions tothis rule include chicken nuggets and strips, which are included inthe database in the unit of “piece” or “each” rather than by ordersize. With respect to foods that may be ordered with various top-ping options, separate entries are generally included in the databasefor the food and each topping. For example, salads and dressingchoices are included as separate items in the database. One restau-rant offered a salad bar during some years included in the study.Items offered at the salad bar only were excluded because of theinability to accurately identify the energy content of meals com-posed from the salad bar.
Creation of Data Set for Trends Analysis
For the present analysis, a data set was created that included alllunch/dinner menu items available at the eight restaurants duringeach time point. Each available serving size of a food was includedas a unique menu item. Therefore, changes in portion size overtime and the accompanying changes in energy content of the itemwould be detected.In order to evaluate changes in the energy content of specifıc
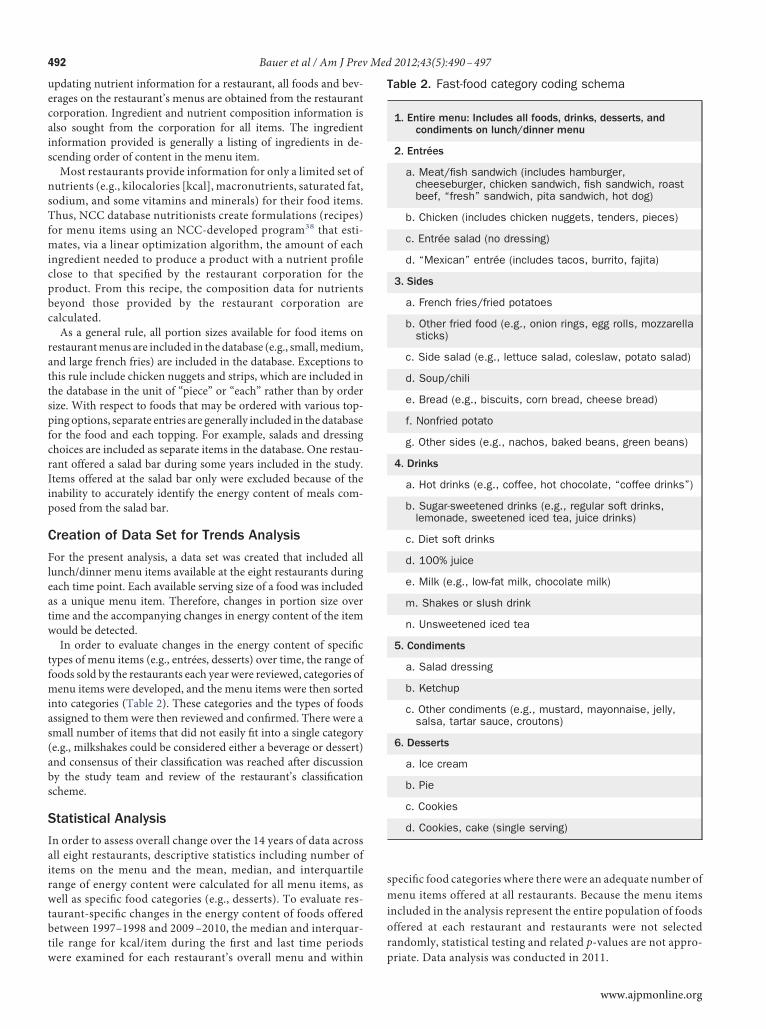
types of menu items (e.g., entrées, desserts) over time, the range offoods sold by the restaurants each year were reviewed, categories ofmenu items were developed, and the menu items were then sortedinto categories (Table 2). These categories and the types of foodsassigned to them were then reviewed and confırmed. There were asmall number of items that did not easily fıt into a single category(e.g., milkshakes could be considered either a beverage or dessert)and consensus of their classifıcation was reached after discussionby the study team and review of the restaurant’s classifıcationscheme.
Statistical Analysis
In order to assess overall change over the 14 years of data acrossall eight restaurants, descriptive statistics including number ofitems on the menu and the mean, median, and interquartilerange of energy content were calculated for all menu items, aswell as specifıc food categories (e.g., desserts). To evaluate res-taurant-specifıc changes in the energy content of foods offeredbetween 1997–1998 and 2009–2010, the median and interquar-tile range for kcal/item during the fırst and last time periods
were examined for each restaurant’s overall menu and within ppecifıc food categories where there were an adequate number ofenu items offered at all restaurants. Because the menu items
ncluded in the analysis represent the entire population of foodsffered at each restaurant and restaurants were not selectedandomly, statistical testing and related p-values are not appro-
Table 2. Fast-food category coding schema
1. Entire menu: Includes all foods, drinks, desserts, andcondiments on lunch/dinner menu
2. Entrées
a. Meat/fish sandwich (includes hamburger,cheeseburger, chicken sandwich, fish sandwich, roastbeef, “fresh” sandwich, pita sandwich, hot dog)
b. Chicken (includes chicken nuggets, tenders, pieces)
c. Entrée salad (no dressing)
d. “Mexican” entrée (includes tacos, burrito, fajita)
3. Sides
a. French fries/fried potatoes
b. Other fried food (e.g., onion rings, egg rolls, mozzarellasticks)
c. Side salad (e.g., lettuce salad, coleslaw, potato salad)
d. Soup/chili
e. Bread (e.g., biscuits, corn bread, cheese bread)
f. Nonfried potato
g. Other sides (e.g., nachos, baked beans, green beans)
4. Drinks
a. Hot drinks (e.g., coffee, hot chocolate, “coffee drinks”)
b. Sugar-sweetened drinks (e.g., regular soft drinks,lemonade, sweetened iced tea, juice drinks)
c. Diet soft drinks
d. 100% juice
e. Milk (e.g., low-fat milk, chocolate milk)
m. Shakes or slush drink
n. Unsweetened iced tea
5. Condiments
a. Salad dressing
b. Ketchup
c. Other condiments (e.g., mustard, mayonnaise, jelly,salsa, tartar sauce, croutons)
6. Desserts
a. Ice cream
b. Pie
c. Cookies
d. Cookies, cake (single serving)
riate. Data analysis was conducted in 2011.
www.ajpmonline.org
Bauer et al / Am J Prev Med 2012;43(5):490–497 493
N
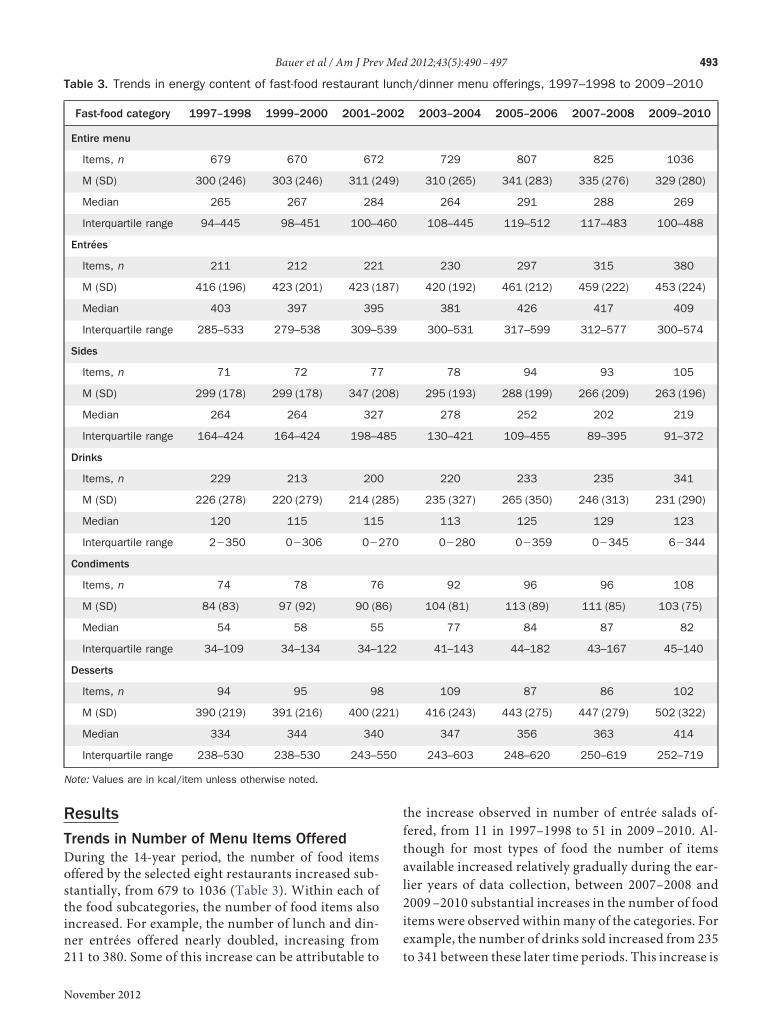
ResultsTrends in Number of Menu Items OfferedDuring the 14-year period, the number of food itemsoffered by the selected eight restaurants increased sub-stantially, from 679 to 1036 (Table 3). Within each ofthe food subcategories, the number of food items alsoincreased. For example, the number of lunch and din-ner entrées offered nearly doubled, increasing from
Table 3. Trends in energy content of fast-food restaurant
Fast-food category 1997–1998 1999–2000 2001–2
Entire menu
Items, n 679 670 672
M (SD) 300 (246) 303 (246) 311 (2
Median 265 267 284
Interquartile range 94–445 98–451 100–4
Entrées
Items, n 211 212 221
M (SD) 416 (196) 423 (201) 423 (1
Median 403 397 395
Interquartile range 285–533 279–538 309–5
Sides
Items, n 71 72 77
M (SD) 299 (178) 299 (178) 347 (2
Median 264 264 327
Interquartile range 164–424 164–424 198–4
Drinks
Items, n 229 213 200
M (SD) 226 (278) 220 (279) 214 (2
Median 120 115 115
Interquartile range 2�350 0�306 0�2
Condiments
Items, n 74 78 76
M (SD) 84 (83) 97 (92) 90 (8
Median 54 58 55
Interquartile range 34–109 34–134 34–1
Desserts
Items, n 94 95 98
M (SD) 390 (219) 391 (216) 400 (2
Median 334 344 340
Interquartile range 238–530 238–530 243–5
Note: Values are in kcal/item unless otherwise noted.
211 to 380. Some of this increase can be attributable to
ovember 2012
the increase observed in number of entrée salads of-fered, from 11 in 1997–1998 to 51 in 2009–2010. Al-though for most types of food the number of itemsavailable increased relatively gradually during the ear-lier years of data collection, between 2007–2008 and2009–2010 substantial increases in the number of fooditems were observed within many of the categories. Forexample, the number of drinks sold increased from 235
h/dinner menu offerings, 1997–1998 to 2009–2010
2003–2004 2005–2006 2007–2008 2009–2010
729 807 825 1036
310 (265) 341 (283) 335 (276) 329 (280)
264 291 288 269
108–445 119–512 117–483 100–488
230 297 315 380
420 (192) 461 (212) 459 (222) 453 (224)
381 426 417 409
300–531 317–599 312–577 300–574
78 94 93 105
295 (193) 288 (199) 266 (209) 263 (196)
278 252 202 219
130–421 109–455 89–395 91–372
220 233 235 341
235 (327) 265 (350) 246 (313) 231 (290)
113 125 129 123
0�280 0�359 0�345 6�344
92 96 96 108
104 (81) 113 (89) 111 (85) 103 (75)
77 84 87 82
41–143 44–182 43–167 45–140
109 87 86 102
416 (243) 443 (275) 447 (279) 502 (322)
347 356 363 414
243–603 248–620 250–619 252–719
lunc
002
49)
60
87)
39
08)
85
85)
70
6)
22
21)
50
to 341 between these later time periods. This increase is
ble
4.
Res
taur
ant-s
peci
ficm
edia
nen
ergy
cont
ent
ofm
enu
offe
rings
in1
99
7–1
99
8an
d2
00
9–2
01
0
Med
ian
kcal
/ite
m(in
terq
uart
ilera
nge)
Entir
em
enu
Entr
ées
Sid
eite
ms
Drink
s
Res
taur
ant
nam
e1
99
7–1
99
82
00
9–2
01
01
99
7–1
99
82
00
9–2
01
01
99
7–1
99
82
00
9–2
01
01
99
7–1
99
82
00
9–2
01
0
cDon
ald’
s2
17
(88
–44
4)
25
9(1
17
–41
8)
45
8(2
66
–57
5)
39
4(2
68
–50
7)
43
0(1
99
–51
5)
205
(33–3
72)
131
(69–3
66)
159
(79–4
32)
urge
rK
ing
26
3(3
2–4
87
)2
42
(72
–47
8)
56
5(4
03
–72
2)
45
8(3
65
–76
5)
38
9(2
54
–58
4)
263
(108–4
16)
127
(3–3
28)
145
(7–4
27)
endy
’s2
30
(92
–39
5)
26
3(9
1–4
68
)3
89
(31
1–4
51
)3
81
(27
4–5
47
)3
23
(20
4–4
88
)297
(234–4
51)
92
(0–1
23)
127
(9–3
90)
aco
Bel
l3
03
(17
7–3
94
)3
27
(18
4–4
52
)3
62
(28
5–4
25
)3
63
(31
9–5
32
)2
74
(17
7–4
97
)300
(171–4
28)
52
(2–1
53)
79
(4–1
48)
entu
cky
Frie
dC
hick
en1
64
(89
–25
0)
16
6(8
1–3
05
)2
04
(14
6–3
75
)3
05
(19
8–4
11
)1
73
(14
1–2
26
)91
(78–1
75)
51
(2–1
19)
59
(4–1
52)
rby’
s2
60
(69
–45
9)
24
0(7
9–2
60
)5
07
(36
0–6
20
)5
01
(35
0–6
15
)1
96
(12
6–2
33
)267
(128–4
60)
123
(2–3
57)
79
(5–1
93)
ckin
the
Box
26
9(4
6–5
66
)2
92
(91
–54
0)
51
9(3
28
–64
3)
47
8(3
34
–66
0)
39
5(1
30
–59
4)
324
(82–4
27)
150
(2–7
25)
152
(9–3
62)
airy
Que
en3
56
(22
2–5
53
)4
46
(18
3–7
16
)4
26
(30
2–5
50
)5
63
(36
7–6
79
)3
38
(31
0–4
22
)298
(186–3
50)
261
(34–5
77)
158
(7–5
28)
494 Bauer et al / Am J Prev Med 2012;43(5):490–497
attributable both to the addition of new types of drinksto the menus, such as sugar-sweetened teas, the num-ber of which increased from 0 to 35 across the studyperiod, and the addition of new portion sizes for exist-ing drink types.
Trends in Energy Content of Menu ItemsAcross the entire menu and within the entrée and drinkscategories, the median energy content of food items re-mained relatively stable during the study period. Mean-while, among the condiments and desserts categories, themean andmedian energy content of food items graduallyincreased. For example, the median kilocalories per des-sert item increased from 334 kcal/item in 1997–1998 to414 kcal/item in 2009–2010.Examining the interquartile ranges, the upper end of
the interquartile range for the entire menu, entrées, con-diments, and desserts increased during the time periodexamined, whereas the lower end remained relativelystable. For example, in 1997–1998, the interquartile rangefor dessert itemswas between 238 and 530 kcal/item. Thisrange shifted to span from 252 to 719 kcal/item in 2009–2010, an increase of 189 kcal/item at the 75th percentile.Among side items, there was a slight increase in themedian kcal/item in 2001–2002; however, starting in2003–2004 and continuing through 2009–2010 decreaseswere observed in themean andmedian energy content ofside items, with an accompanying downward shift in theinterquartile range.
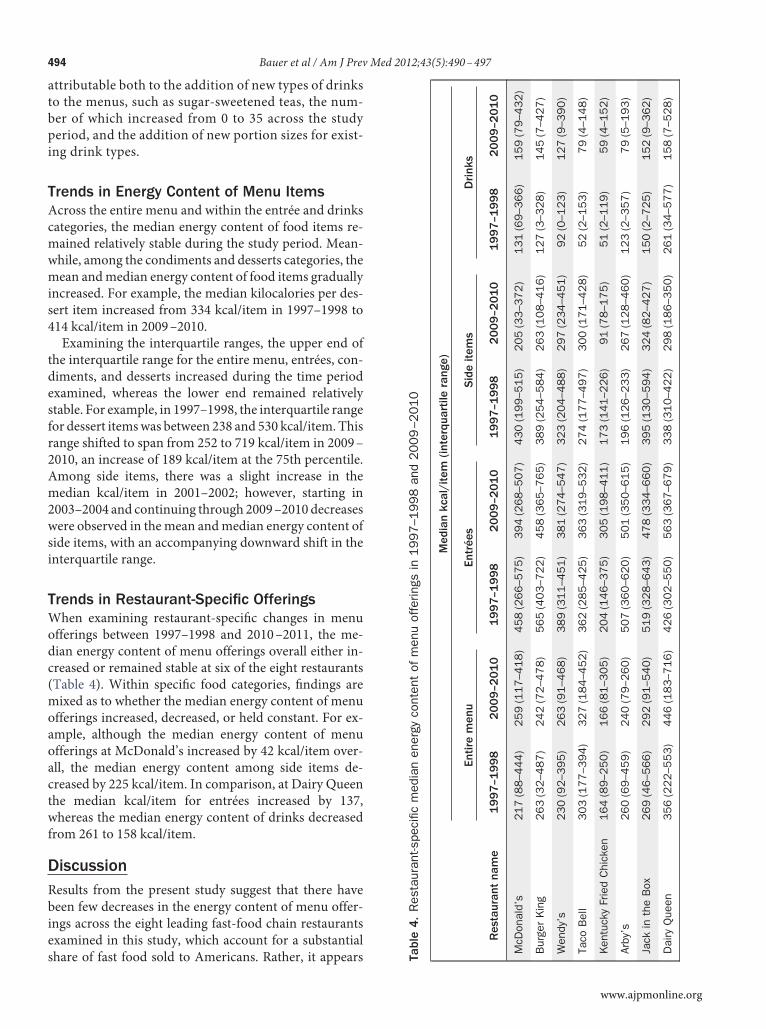
Trends in Restaurant-Specific OfferingsWhen examining restaurant-specifıc changes in menuofferings between 1997–1998 and 2010–2011, the me-dian energy content of menu offerings overall either in-creased or remained stable at six of the eight restaurants(Table 4). Within specifıc food categories, fındings aremixed as to whether the median energy content of menuofferings increased, decreased, or held constant. For ex-ample, although the median energy content of menuofferings at McDonald’s increased by 42 kcal/item over-all, the median energy content among side items de-creased by 225 kcal/item. In comparison, at Dairy Queenthe median kcal/item for entrées increased by 137,whereas the median energy content of drinks decreasedfrom 261 to 158 kcal/item.
DiscussionResults from the present study suggest that there havebeen few decreases in the energy content of menu offer-ings across the eight leading fast-food chain restaurantsexamined in this study, which account for a substantial
share of fast food sold to Americans. Rather, it appears TaM B W T K A Ja D
www.ajpmonline.org
ctios
essmsstdpeipsno
rop
Bauer et al / Am J Prev Med 2012;43(5):490–497 495
N
that the median energy content of restaurant menus hasbeen stable for menus overall, entrées, and drinks, in-creasing for condiments and desserts, and decreasing forside items. Additionally, for the overall menu and forseveral of the food categories, the upper end of the inter-quartile range increased, suggesting the addition ofhigher-calorie items either via increased portion sizes orvia new types of food being added to the menu. Whenlooking at restaurants individually, for the majority, me-dian energy content of overall menu offerings remainedstable or increased, whereas among specifıc food catego-ries, fındings were largelymixed, with both decreases andincreases inmedian calories observed across food catego-ries within restaurants.One of the most salient fındings of the current study
was a 53% increase in the total number of foods sold overthe 14 years examined. This may be a positive change inthat restaurants are meeting customers’ demand for newproducts; however, there is evidence to suggest that in-creasing the number of menu choices may increase thenumber of itemspurchased by consumers. Several studieshave demonstrated that when individuals are presentedwith greater numbers or variety of food items, they willconsume greater volumes.39–41
However, this research has been primarily conductedby presenting subjects with actual food (e.g., a buffetmeal) rather than a menu. Other studies have suggestedthat when presented with more than an optimal numberof choices, individuals tend to become stressed and re-duce the number of items they select.42 Because of theseonflicting potential outcomes, further research is neededo understand how the increases in number of menutems, as well as the inclusion of additional informationn menus such as kilocalories per item, may alter con-umers’ choices.Although little change was observed in the median
nergy content of fast-food offerings as a whole, amongide items, a median decrease of 45 kcal/item over thetudy yearswas observed. This decrease in energy contentay be attributable to an increase in the number of sidealads (from 6 to 12); decrease in median kilocalories foride salads (from 87 to 39); and some restaurants limitinghe portion sizes of french fries.29,43 This change in me-ian energy content observed among side items has theotential to have a positive impact on population-levelnergy intake because of the frequency with which sidetems are purchased. For example, “combomeals,” whichackage together entrées, side items, and drinks, repre-ent approximately one third of the fast-food orders, andearly 12% of all fast-food purchases are side itemsnly.44
Modest decreases in the energy content of some types
of menu items via either changes in types of foods sold orovember 2012
decreases in portion sizes may reflect an effort by theindustry to meet the needs of health-conscious consum-ers. Efforts such as themodifıcation of types and portionssizes of side itemsmay also be used to alter public percep-tion of the restaurants and/or invoke a “health halo,”which leads consumers to believe that consuming foodfrom the restaurant is a healthful decision.45 Similarly,esearch suggests that the mere inclusion of healthfulptions on restaurant menus may prompt individuals tourchase higher-calorie food choices.46 Therefore, al-
though some consumers may benefıt from efforts by thefast-food industry to limit the energy content of a selectnumber of foods, evidence suggests that including a smallnumber of lower-calorie options while maintaining orincreasing the energy content of other foodsmay contrib-ute to increased caloric consumption.Use of the NCC Food and Nutrient Database for res-
taurant menu information is both a strength and limita-tion of the present study. Use of the database is a strengthbecause historical information about themenu items wasavailable, and their nutrient composition could be readilyascertained from a database in which consistent and rig-orous maintenance and update procedures are applied.Shortcomings relate to relying on a food and nutrientdatabase developed for the purpose of evaluating foodand nutrient intake of individuals as opposed to evaluat-ing the nutritional quality of foods in themarketplace. Asa result of this focus, some menu items, such as chickennuggets, were included in the analysis data set as individ-ual items as opposed to the order sizes available at restau-rants. This shortcoming may have contributed to a smallunderestimation of the energy content of the menu, aswell as limit the ability to identify changes in energycontent thatmay have occurred because of changing por-tion sizes of these items.Other limitations of relying on the NCC Food and
Nutrient Database are that the trends are reflective ofrestaurant offerings and do not provide any sales infor-mation in order to better understandwhat foods consum-ers are choosing, and that the restaurant chains includedin the analysis were not selected in a random manner.Consequently, the representativeness of the sample andgeneralizability of study fındings are limited. However,the way in which the data were analyzed and interpretedtakes this limitation into account, with fındings consid-ered to be representative of only those restaurant chainsincluded in the analysis.
ConclusionDespite increasing pressure and legislation directed to-ward the fast-food industry to improve the healthfulnessof their menus, as well as statements by the fast-food
industry that indicate they are increasingly providing
1
1
1
1
1
1
1
1
1
1
22
2
2
2
2
2
2
496 Bauer et al / Am J Prev Med 2012;43(5):490–497
healthful food to consumers, overall the energy content offast-food menu offerings has not decreased over the past14 years at the leading fast-food chain restaurants exam-ined in the current study. Although changes within somefood categories and at some specifıc restaurants seem tobe occurring, these changes may be offset by increases inthe energy content of other items and increases in thetotal number of menu items offered, which may promptincreased purchasing by consumers. Substantial shifts inthe healthfulness of food offered by fast-food chain res-taurants may prove diffıcult to implement because ofbeliefs by the industry that there is not a large demand formore such food and that offering new or modifıed op-tions may result in a loss of profıt.47
Consumersmay benefıt by being aware of the relativelylimited changes in the energy content of fast-food offer-ings despite efforts by the industry to promote more-healthful choices. As results from the current study canserve as a baseline againstwhich to benchmark changes infast-food offerings after implementation of the nationalmenu-labeling mandate, future analyses can providegreater understanding of whether initiatives that primar-ily aim to inform consumers can also change industrypractices.
This study was funded by a grant from the Robert Wood John-son Foundation Healthy Eating Research program (RWJF-68383), which provided support for conduct of the study, in-cluding data management, analysis, and interpretation. KWBwas supported by a postdoctoral fellowship at the University ofMinnesota (Grant No. T32DK083250) from the National Insti-tute of Diabetes and Digestive and Kidney Diseases.No fınancial disclosures were reported by the authors of this
paper.
References1. Pereira MA, Kartashov AI, Ebbeling CB, et al. Fast-food habits, weight
gain, and insulin resistance (the CARDIA study): 15-year prospectiveanalysis. Lancet 2005;365(9453):36–42.
2. Briefel RR, Johnson CL. Secular trends in dietary intake in the U.S.Annu Rev Nutr 2004;24:401–31.
3. Nielsen SJ, Siega-Riz AM, Popkin BM. Trends in food locations andsources among adolescents and young adults. Prev Med 2002;35(2):107–13.
4. Economic Research Service, U.S. Department of Agriculture. Dietquality and food consumption: food and nutrient intake tables. 2011.www.ers.usda.gov/briefıng/DietQuality/data/foodandnutrient/index.htm-food.
5. Guthrie JF, LinBH, FrazaoE. Role of food prepared away fromhome inthe American diet, 1977–78 versus 1994–96: changes and conse-quences. J Nutr Educ Behav 2002;34(3):140–50.
6. Oches S. The 2011 QSR 50. QSR. 2011. www.qsrmagazine.com/
reports/2011-qsr-50. 27. Anderson B, Rafferty AP, Lyon-Callo S, Fussman C, Imes G. Fast-foodconsumption and obesity among Michigan adults. Prev Chronic Dis2011;8(4):A71.
8. Bowman SA, Gortmaker SL, Ebbeling CB, Pereira MA, Ludwig DS.Effects of fast-food consumption on energy intake and diet qualityamong children in a national household survey. Pediatrics 2004;113(1Pt 1):112–8.
9. Harris JL, Schwartz MB, Brownell KD. Fast food FACTS: evaluatingfast food nutrition and marketing to youth. Rudd Center for FoodPolicy and Obesity, 2010.
0. Sebastian RS, Wilkinson Enns C, Goldman JD. U.S.adolescents andMyPyramid: associations between fast-food consumption and lowerlikelihood of meeting recommendations. J Am Diet Assoc 2009;109(2):226–35.
1. Wiecha JL, Finkelstein D, Troped PJ, Fragala M, Peterson KE. Schoolvending machine use and fast-food restaurant use are associated withsugar-sweetened beverage intake in youth. J Am Diet Assoc2006;106(10):1624–30.
2. Ebbeling CB, Sinclair KB, Pereira MA, Garcia-Lago E, Feldman HA,Ludwig DS. Compensation for energy intake from fast food amongoverweight and lean adolescents. JAMA 2004;291(23):2828–33.
3. Crawford D, Ball K, Mishra G, Salmon J, Timperio A. Which food-related behaviours are associated with healthier intakes of fruits andvegetables among women? Public Health Nutr 2007;10(3):256–65.
4. Bowman SA, Vinyard BT. Fast food consumption of U.S. adults: im-pact on energy and nutrient intakes and overweight status. J Am CollNutr 2004;23(2):163–8.
5. French SA, Harnack L, Jeffery RW. Fast food restaurant use amongwomen in the Pound of Prevention study: dietary, behavioral anddemographic correlates. Int J Obes Relat Metab Disord 2000;24(10):1353–9.
6. Jeffery RW, French SA. Epidemic obesity in the U.S.: are fast foods andtelevision viewing contributing? Am J Public Health 1998;88(2):277–80.
7. French SA, Jeffery RW, Forster JL, McGovern PG, Kelder SH, BaxterJE. Predictors of weight change over two years among a population ofworking adults: the Healthy Worker Project. Int J Obes Relat MetabDisord 1994;18(3):145–54.
8. Rosenheck R. Fast food consumption and increased caloric intake: asystematic review of a trajectory towards weight gain and obesity risk.Obes Rev 2008;9(6):535–47.
9. Schlosser E. Fast food nation: The dark side of the all-American meal.New York: Houghton Mifflin, 2001.
0. Spurlock M. Super Size Me. May 21, 2004.1. Notice of Intention to Repeal and Reenact Sec. 81.50 of the New York
City Health Code. New York: New York City Department of Healthand Mental Hygiene, 2007.
2. An act to add Section 114094 to the Health and Safety Code, relating tofood facilities. California Senate Bill 1420; 2008.
3. U.S. House of Representatives. The Patient Protection and AffordableCare Act. Washington DC, 2010.
4. Dumanovsky T, Huang CY, Nonas CA, Matte TD, Bassett MT, SilverLD. Changes in energy content of lunchtime purchases from fast foodrestaurants after introduction of calorie labelling: cross sectional cus-tomer surveys. Br Med J 2011;343:d4464.
5. Elbel B, Kersh R, Brescoll VL, Dixon LB. Calorie labeling and foodchoices: a fırst look at the effects on low-income people in New YorkCity. Health Aff 2009;28(6):w1110–w1121.
6. Harnack LJ, French SA, Oakes JM, Story MT, Jeffery RW, Rydell SA.Effects of calorie labeling and value size pricing on fast food mealchoices: results from an experimental trial. Int J Behav Nutr Phys Act2008;5:63.
7. Finkelstein EA, Strombotne KL, Chan NL, Krieger J. Mandatory menulabeling in one fast-food chain inKingCounty,Washington. Am J PrevMed 2011;40(2):122–7.
8. Jebb SA. Calorie labelling on the high street. BMJ 2011;343:d4502.
www.ajpmonline.org
Bauer et al / Am J Prev Med 2012;43(5):490–497 497
N
29. McDonald’s to drop super-size meals. Quick Service Restaurant Mag-azine.
30. Mariani S. Fast-food restaurants’ trend to increase healthy alternatives:a work in progress. MEDILL Reports, Chicago, 2011.
31. McDonald’s® announces commitments to offer improved nutritionchoices. 2011. www.aboutmcdonalds.com/mcd/media_center/recent_news/corporate/commitments_to_offer_improved_nutrition_choices.html.
32. Kraak VI, Story M, Wartella EA, Ginter J. Industry progress to marketa healthful diet to American children and adolescents. Am J Prev Med2011;41(3):322–33.
33. QSR Magazine, Top 50, published August 2011, www.qsrmagazine.com
34. Schakel S. Maintaining a nutrient database in a changing marketplace:keeping pace with changing food products—a research perspective. JFood Compost Anal 2001;14:315–22.
35. SchakelS,BuzzardI,GebhardtS.Procedures forestimatingnutrientvalues forfood compositiondatabases. J FoodCompostAnal 1997;10:102–14.
36. Schakel SF, SievertYA,Buzzard IM.Sourcesofdata fordevelopingandmain-taining anutrient database. JAmDietAssoc 1988;88(10):1268–71.
37. Sievert YA, Schakel SF, Buzzard IM. Maintenance of a nutrient data-base for clinical trials. Control Clin Trials 1989;10(4):416–25.
38. Westrich B, Buzzard I, Gatewood L, McGovern P. Accuracy and effı-ciency of estimating nutrient values in commercial food products using
mathematiovember 2012
39. Miller DL, Bell EA, Pelkman CL, Peters JC, Rolls BJ. Effects of dietaryfat, nutrition labels, and repeated consumption on sensory-specifıcsatiety. Physiol Behav 2000;71(1–2):153–8.
40. Rolls BJ. Sensory-specifıc satiety. Nutr Rev 1986;44(3):93–101.41. Chandon P, Wansink B. When are stockpiled products consumed
faster? A convenience–salience framework of postpurchase consump-tion incidence and quantity. J Mark Res 2002;39(3):321–35.
42. Scheibehenne B, Greifeneder R, Todd PM. Can there ever be too manyoptions? a meta-analytic review of choice overload. J Consum Res2010;37(3):409–25.
43. Young LR, Nestle M. Portion sizes and obesity: responses of fast-foodcompanies. J Public Health Policy 2007;28(2):238–48.
44. Dumanovsky T, Nonas CA, Huang CY, Silver LD, Bassett MT. Whatpeople buy from fast-food restaurants: caloric content and menu itemselection, New York City 2007. Obesity 2009;17(7):1369–74.
45. Chandon P, Wansink B. The biasing health halos of fast-food restau-rant health claims: lower calorie estimates and higher side-dish con-sumption intentions. J Consum Res 2007;34(3):301–14.
46. Wilcox K, Vallen B, Block L, FitzsimonsGJ. Vicarious goal fullfıllment:when the mere presence of a healthy option leads to an ironicallyindulgent decision. J Consum Res 2009;36:380–93.
47. Glanz K, Resnicow K, Seymour J, et al. How major restaurant chainsplan theirmenus: the role of profıt, demand, andhealth.Am JPrevMed
cal optimization. J Food Compost Anal 1994;77:223–39. 2007;32(5):383–8.
Did you know?You can track the impact of an article with citationalerts that let you know when the article has been
cited by another Elsevier-published journal.Visit www.ajpmonline.org today!