Embed Size (px)
Citation preview
Building Engineering
Ofgem June 2011
Energy Demand Research Project: Final Analysis
Appendix C: Review of the Literature
on Interventions used in EDRP

Prepared by: Gary Raw and David Ross ...................Checked by: David Ross Regional Directors Regional Director Approved by: Andrew Cripps Regional Director Energy Demand Research Project: Final Analysis
Rev No Comments Checked by Approved by Date
2.2 Final version David Ross Andrew Cripps 21/06/11
AECOM House, 63-77 Victoria Street, St Albans, Hertfordshire, AL1 3ER Telephone: 01727 535000 Website: http://www.aecom.com Job No 60163857 Date Created June 2011 This document has been prepared by AECOM Limited for the sole use of our client (the ―Client‖) and in accordance with generally accepted consultancy principles, the budget for fees and the terms of reference agreed between AECOM Limited and the Client. Any information provided by third parties and referred to herein has not been checked or verified by AECOM Limited, unless otherwise expressly stated in the document. No third party may rely upon this document without the prior and express written agreement of AECOM Limited.
AECOM Appendix C: Review of the Literature on Interventions used in EDRP 1
Capabilities on project:
Building Engineering
The author is grateful to Sarah Darby (Environmental Change Institute, University of Oxford) for access to an earlier review for EDRP, her assistance in locating some of the less accessible literature and comments on a draft of this review.
Contents of this appendix
Page
1. Introduction 2
2. Energy efficiency advice 4
3. Historic feedback 8
4. Benchmarking 17
5. Customer engagement using targets 20
6. Smart meters 22
7. Real-time display (RTD) devices 23
8. Heating controller integrated with RTD 38
9. Time of use tariff/incentive 39
10. Incentive to reduce consumption 43
11. Overview of web-based interventions 45
12. Interventions not used in EDRP 48
13. Conclusions 50
References 63
Annex C1. The Means-Motive-Opportunity framework 69
Appendix C: Review of the Literature on Interventions used in EDRP
AECOM Appendix C: Review of the Literature on Interventions used in EDRP 2
Capabilities on project:
Building Engineering
C1 INTRODUCTION
This appendix sets the context for viewing the EDRP findings on behaviour change (and consequent change in energy use) in the context of the wider literature on interventions to change energy-related behaviour in homes. The review has two main aims, supporting the main body of the report to:
assist in the challenge and interpretation of the EDRP findings;
use the EDRP findings, in combination with the rest of the literature, to offer the most robust possible advice on the roll-out of smart meters and associated actions designed to reduce energy consumption.
This exercise includes identifying both the key findings and the elements of research design and context that have been seen as important in those findings. The main body of the report (Section 8) uses this material to comment on the comparability of EDRP findings with literature findings and the overall conclusion from both sets of Evidence.
The EDRP trials employed a range of interventions that have been tested in other studies too, in a variety of forms, with different experimental approaches and with varying degrees of success. In homes without smart meters, EDRP used the following types of intervention – individually and/or in combination.
Energy efficiency advice.
Additional bill data (on paper or web-based), such as comparison of energy consumption with earlier periods.
RTD1 (clip-on, electricity-only device).
Incentive to reduce consumption.
Benchmarking the customer‘s consumption against a peer group of comparable households.
Customer engagement (some kind of commitment to reduce consumption).
The installation of smart meters or advanced prepayment meters was used as an intervention in its own right and in combination with one or more of the following.
Energy efficiency advice.
Accurate bills and no calls by meter readers.
Additional bill data (on paper or TV- or web-based), sometimes including time of use information.
Monthly bills.
RTD (mains powered, showing electricity and gas consumption).
Heating controller integrated with RTD.
Usage reduction alert (from RTD, if consumption exceeds a pre-set target).
Time of use tariff/incentive.
Incentive to reduce consumption.
Customer engagement.
Other studies have also tested interventions that were not part of EDRP, such as regulation, labelling, accreditation, subsidies, loans, grants, education, appeals, taxation and energy price structure. These are not reviewed in detail but it is important not to lose sight of them in the context of a complete package of options to maximise the energy-saving benefits of the smart meter roll-out.
1 Real-time display. Also referred to in various other ways in EDRP and in the literature in general (e.g. in-home display,
AECOM Appendix C: Review of the Literature on Interventions used in EDRP 3
Capabilities on project:
Building Engineering
The science of behaviour change crosses boundaries of psychology, sociology, ergonomics and economics; it also interlinks with engineering and product design. For this reason, there have been multiple models of behaviour and behaviour change, each with different emphasis and often using similar terms with different meaning, or different terms with similar meaning – see Darnton (2008) for an overview of models. The present review simplifies the theoretical framework to allow easy comparison of the roles of different types of intervention, while acknowledging that any use of theory to develop policy or programmes should test decisions using an understanding of the detail of the theory and its limitations.
The framework used is based on the means, motive and opportunity for change (Raw et al 2010).
The means is the technology (a characteristic of the building fabric or services) or behaviour that will lead to reduced energy use and/or carbon dioxide (CO2) emissions. This includes the person making the change having knowledge
2 about current consumption and the technology or behaviour that would reduce consumption.
The motive is the reason why households will want to make the change.
The opportunity is the resource (e.g. time, space or money) to make the change.
In other words, for householders to reduce energy demand, they must know what to do, have a reason for doing it and have the resources to do it.
Money appears twice in the framework – as both motive and an essential element in opportunity. But other motives are also important – both those that relate to environmental impact and those that do not (e.g. social influences or achieving a personal sense of control over energy use). Annex C1 explains the framework in more detail.
The following sections in this report are structured according to the EDRP trials and a perspective on how the different interventions might build on each other. This is guided particularly by the main purpose of the report, i.e. to contextualise the EDRP findings. In this sense, it is neither comprehensive nor balanced in the relative attention given to each type of intervention but it does seek to draw relevant and reliable conclusions on the topics covered, within the adopted structure. Neither is it a systematic review but it seeks to cover the available literature up to 2010, focusing on the newer material where the passage of time (and changes in context) might render earlier work less relevant. Other recent reviews (e.g. EPRI 2009, Ehrhardt-Martinez et al 2010) can be consulted for a wider perspective on the literature but neither was intended to interpret the findings in the context of the UK in general or the EDRP findings in particular.
The review starts with the basic intervention of providing advice to householders on energy efficiency. It then moves on to provision of feedback through enhanced information on past consumption (―historic feedback‖), benchmarking that consumption against comparable households and setting demand reduction targets. The central sections discuss feedback using smart meters and/or real-time display (RTD) devices, including the specific EDRP intervention of providing a heating controller integrated with the RTD. The review ends with the use of incentives – either to shift consumption away from the peak demand period or to reduce overall consumption, an overview of web-based interventions and a brief comment on interventions not used in EDRP. The final section draws together the main conclusions.
2 Knowledge includes both knowledge of facts and practical ‗tacit‘ knowledge that is often not transmitted in a codified/written
form but gained through demonstration and experience, e.g. the operation of heating controls, knowing how best to ventilate a building without undue heat loss or knowing how to power down IT equipment. Such knowledge might alternatively be seen as an aspect of opportunity but the main point is to be aware of its potential importance.
AECOM Appendix C: Review of the Literature on Interventions used in EDRP 4
Capabilities on project:
Building Engineering
C2 ENERGY EFFICIENCY ADVICE
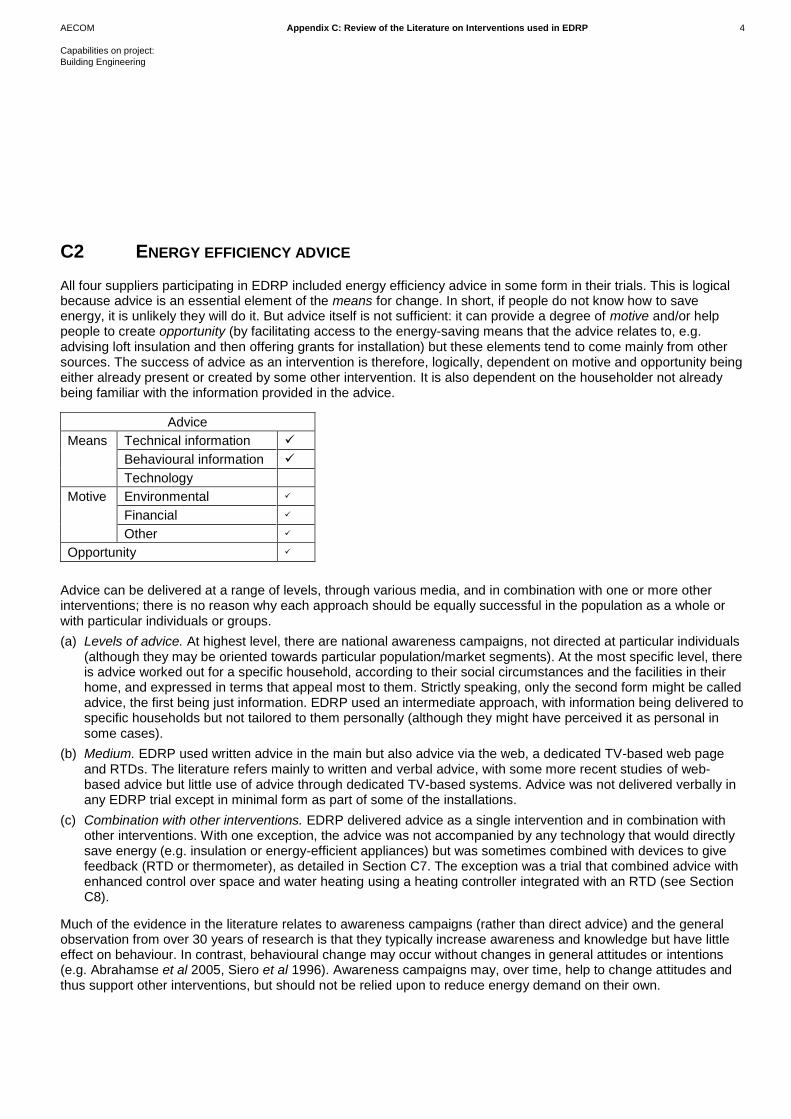
All four suppliers participating in EDRP included energy efficiency advice in some form in their trials. This is logical because advice is an essential element of the means for change. In short, if people do not know how to save energy, it is unlikely they will do it. But advice itself is not sufficient: it can provide a degree of motive and/or help people to create opportunity (by facilitating access to the energy-saving means that the advice relates to, e.g. advising loft insulation and then offering grants for installation) but these elements tend to come mainly from other sources. The success of advice as an intervention is therefore, logically, dependent on motive and opportunity being either already present or created by some other intervention. It is also dependent on the householder not already being familiar with the information provided in the advice.
Advice
Means Technical information
Behavioural information
Technology
Motive Environmental
Financial
Other
Opportunity
Advice can be delivered at a range of levels, through various media, and in combination with one or more other interventions; there is no reason why each approach should be equally successful in the population as a whole or with particular individuals or groups.
(a) Levels of advice. At highest level, there are national awareness campaigns, not directed at particular individuals (although they may be oriented towards particular population/market segments). At the most specific level, there is advice worked out for a specific household, according to their social circumstances and the facilities in their home, and expressed in terms that appeal most to them. Strictly speaking, only the second form might be called advice, the first being just information. EDRP used an intermediate approach, with information being delivered to specific households but not tailored to them personally (although they might have perceived it as personal in some cases).
(b) Medium. EDRP used written advice in the main but also advice via the web, a dedicated TV-based web page and RTDs. The literature refers mainly to written and verbal advice, with some more recent studies of web-based advice but little use of advice through dedicated TV-based systems. Advice was not delivered verbally in any EDRP trial except in minimal form as part of some of the installations.
(c) Combination with other interventions. EDRP delivered advice as a single intervention and in combination with other interventions. With one exception, the advice was not accompanied by any technology that would directly save energy (e.g. insulation or energy-efficient appliances) but was sometimes combined with devices to give feedback (RTD or thermometer), as detailed in Section C7. The exception was a trial that combined advice with enhanced control over space and water heating using a heating controller integrated with an RTD (see Section C8).
Much of the evidence in the literature relates to awareness campaigns (rather than direct advice) and the general observation from over 30 years of research is that they typically increase awareness and knowledge but have little effect on behaviour. In contrast, behavioural change may occur without changes in general attitudes or intentions (e.g. Abrahamse et al 2005, Siero et al 1996). Awareness campaigns may, over time, help to change attitudes and thus support other interventions, but should not be relied upon to reduce energy demand on their own.
AECOM Appendix C: Review of the Literature on Interventions used in EDRP 5
Capabilities on project:
Building Engineering
The exception to this appears to be where the campaign coincides with circumstances that provide motivation to save energy. For example, the Irish Government‘s ―Power of One‖ campaign used a variety of media – TV/radio advertising, posters, the internet, cinemas and the press – in addition to working with suppliers to deliver leaflets with bills (Diffney et al 2008). While there was evidence of increased interest and awareness, this did not result in changed behaviour (all self-reported). One of the associated customer information campaigns by an energy supplier was more successful (electricity demand reduced by about 7%, together with lower demand fluctuation over the year). However, this occurred at a time of heightened risk of power cuts following an increase in energy demand.
This combination of advice and circumstances becomes more obvious when particular circumstances result in appeals to reduce consumption. This could arise, for example, from extended periods of cold weather or interruptions to electricity or fuel supply. This can make consumers more open to energy efficiency messages. For example, in San Diego, appeals that followed the California ―price shock‖ and blackouts of 2000 reduced electricity consumption by 7% over a six-month period (Reiss et al 2008). This was in a period when unit prices were capped, following a price peak. In contrast, an appeal by US President Carter had no effect on those who heard the appeal, in the context of a potential gas shortage (Luyben 1982). The effect is clearly not fully reliable and actual current experience of a problem may have a greater effect than a perceived future threat. What is not clear is whether – at household level – this is reflected in a difference between prepayment (for finite quantities of gas or electricity) and credit payment (for whatever amount of fuel is needed).
There is similarly little evidence that energy demand is reduced by household-level generic advice (i.e. information delivered to households but not tailored to the particular household) on its own (e.g. Abrahamse et al 2005). This may be because the evidence base is very limited, few studies having delivered such advice without supplementary interventions. The strongest effects were seen in an early UK study (Gaskell et al 1982): in an eight-week trial in 40 households, there were savings of 8% in electricity consumption and 5% in gas consumption (relative to a control group but with no reported tests of statistical significance). During a 12-week follow-up period, gas savings disappeared but electricity savings increased to 22%. Unsurprisingly, the greatest savings were made by high consumers with a low initial level of knowledge about energy use or savings, i.e. those who should benefit most from advice. This was an intensive campaign with researchers personally taking householders through the written advice, weekly visits to read meters and check if there were any problems, and interviews by researchers. Also, this study was conducted at a time when energy conservation was a relatively novel topic and the energy crisis of the 1970s was fresh in memory, hence it is difficult to apply the findings to the present time.
A study of eight mainly residential buildings in Sweden (SEAB 1993, cited by Henryson et al 2000) found 3-5% savings in electricity but as part of a larger local demand reduction programme. In an intensive study (Wood & Newborough 2003) specifically of electricity use for cooking, 12 subjects saved 3% relative to controls but this study had significant flaws in the design and analysis.
3 Statistical significance is not reported in either study. Other studies
with less intensive interventions found no significant effects of written advice alone on either electricity or gas consumption, e.g. Hutton et al (1986) in Canada and Midden et al (1983) in the Netherlands.
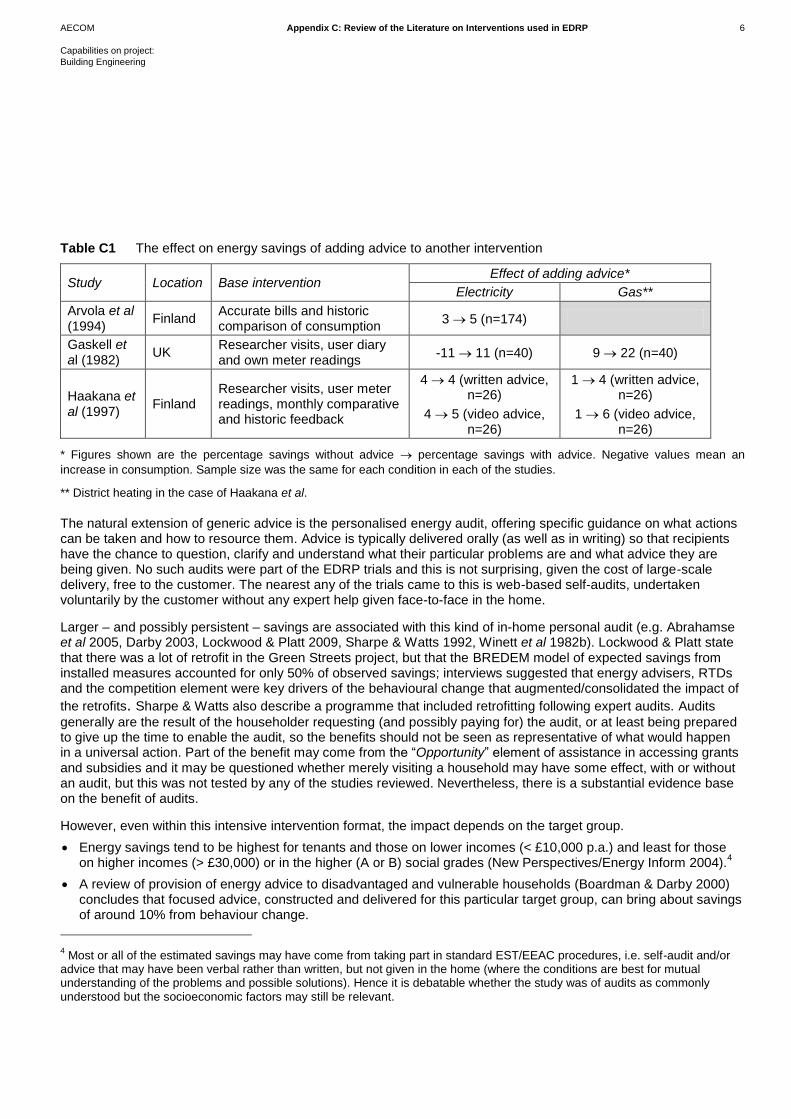
Starting from a different perspective, we can ask whether adding advice to other interventions results in additional energy savings. Results from three studies that tested this directly are shown in Table C1 (none of these differences was tested for statistical significance). Again the evidence is thin but there is most often an added benefit of advice where some kind of feedback is also provided. However, the fact that participants actively opted in to these studies makes then unrepresentative of unsolicited provision of advice in the general population.
3 Only the main cooker was monitored so demand could have shifted to other cooking appliances. The highest and lowest
savings were excluded from the analysis, along with days the cooker was not used at all, so any redistribution of cooking across days would confound the outcome.
AECOM Appendix C: Review of the Literature on Interventions used in EDRP 6
Capabilities on project:
Building Engineering
Table C1 The effect on energy savings of adding advice to another intervention
Study Location Base intervention Effect of adding advice*
Electricity Gas**
Arvola et al (1994)
Finland Accurate bills and historic comparison of consumption
3 5 (n=174)
Gaskell et al (1982)
UK Researcher visits, user diary and own meter readings
-11 11 (n=40) 9 22 (n=40)
Haakana et al (1997)
Finland Researcher visits, user meter readings, monthly comparative and historic feedback
4 4 (written advice, n=26)
4 5 (video advice, n=26)
1 4 (written advice, n=26)
1 6 (video advice, n=26)
* Figures shown are the percentage savings without advice percentage savings with advice. Negative values mean an
increase in consumption. Sample size was the same for each condition in each of the studies.
** District heating in the case of Haakana et al.
The natural extension of generic advice is the personalised energy audit, offering specific guidance on what actions can be taken and how to resource them. Advice is typically delivered orally (as well as in writing) so that recipients have the chance to question, clarify and understand what their particular problems are and what advice they are being given. No such audits were part of the EDRP trials and this is not surprising, given the cost of large-scale delivery, free to the customer. The nearest any of the trials came to this is web-based self-audits, undertaken voluntarily by the customer without any expert help given face-to-face in the home.
Larger – and possibly persistent – savings are associated with this kind of in-home personal audit (e.g. Abrahamse et al 2005, Darby 2003, Lockwood & Platt 2009, Sharpe & Watts 1992, Winett et al 1982b). Lockwood & Platt state that there was a lot of retrofit in the Green Streets project, but that the BREDEM model of expected savings from installed measures accounted for only 50% of observed savings; interviews suggested that energy advisers, RTDs and the competition element were key drivers of the behavioural change that augmented/consolidated the impact of
the retrofits. Sharpe & Watts also describe a programme that included retrofitting following expert audits. Audits
generally are the result of the householder requesting (and possibly paying for) the audit, or at least being prepared to give up the time to enable the audit, so the benefits should not be seen as representative of what would happen in a universal action. Part of the benefit may come from the ―Opportunity‖ element of assistance in accessing grants and subsidies and it may be questioned whether merely visiting a household may have some effect, with or without an audit, but this was not tested by any of the studies reviewed. Nevertheless, there is a substantial evidence base on the benefit of audits.
However, even within this intensive intervention format, the impact depends on the target group.
Energy savings tend to be highest for tenants and those on lower incomes (< £10,000 p.a.) and least for those on higher incomes (> £30,000) or in the higher (A or B) social grades (New Perspectives/Energy Inform 2004).
4
A review of provision of energy advice to disadvantaged and vulnerable households (Boardman & Darby 2000) concludes that focused advice, constructed and delivered for this particular target group, can bring about savings of around 10% from behaviour change.
4 Most or all of the estimated savings may have come from taking part in standard EST/EEAC procedures, i.e. self-audit and/or
advice that may have been verbal rather than written, but not given in the home (where the conditions are best for mutual understanding of the problems and possible solutions). Hence it is debatable whether the study was of audits as commonly understood but the socioeconomic factors may still be relevant.
AECOM Appendix C: Review of the Literature on Interventions used in EDRP 7
Capabilities on project:
Building Engineering
Smith et al (2004) identify the ‗ideal target group‘ as households that do not include someone employed full-time (e.g. retired people) or children, or that have not changed energy supplier. The reason given is that these groups are less engaged in energy efficiency or conservation.
It is not clear whether these differences arise from relative ease of access to information sources, trust of (or the ability to interpret) generally available generic advice, investment constraints or some other factors, but there is a clear demographic factor in effective intervention.
The medium of delivery of advice is also important and some imagination may be needed: simply conveying the facts may not be sufficient. On the simplest level, New Perspectives/Energy Inform (2004) surveyed householders who had received advice on behalf of the EST and concluded that verbal advice was typically more effective than written advice. One early study (Winett et al 1985) used cable TV to deliver advice, in the form of ―modelling‖ of conservation actions by actors, in combination with a cartoon-based advice booklet. There were initial electricity savings of 10% compared with a control group. Although the effect was not evidenced a year after the trial, this is not surprising as no attempt was made to sustain the participants‘ interest. Völlink & Meertens (1999) combined advice through text TV with weekly feedback and a self-set savings target (5, 10 or 15%) for people living in energy-efficient homes. Although the study was small (48 households in total), savings over a period of 5 months were significant, relative to a control group, at 23% for gas and 15% for electricity. It is not possible to say which of the interventions was responsible for the effect.
5
In principle, the effectiveness of an awareness campaign or direct delivery of advice should depend on the extent to which the campaign originator is trusted (trusted to be reliable as to the facts, competent to deliver, honest in expression and transparent in motive). Hence, even the best designed campaign could fail if the target audience does not trust the source. This makes it problematic to judge the effectiveness of a campaign merely from a description of its content and methods. While generalisations about Government and/or energy suppliers not being trusted can inform interpretation of research findings, they are not definitive. Nevertheless, the challenge for supplier is certainly twofold – to convince customers that their advice can be trusted and to motivate customers to read and apply it.
In summary, the limited evidence (little of it from the UK) suggests that advice may be necessary (unless the recipients are being told something they already know) but is rarely sufficient on its own to bring about reductions in energy demand. Isolated generic advice has little effect but, when used as a supplement to other interventions, it can increase energy savings by perhaps 5%. Although again the evidence is thin, delivering advice by means more imaginative than leaflets and booklets may achieve higher savings – for example, using it in conjunction with home energy audits. Face-to-face in-home audits and advice emerge as the most effective interventions but were beyond the remit of EDRP.
5 The report could not be obtained and this account relies on Abrahamse et al (2005).
AECOM Appendix C: Review of the Literature on Interventions used in EDRP 8
Capabilities on project:
Building Engineering
C3 HISTORIC FEEDBACK
While advice plays a key role in helping people to understand how to reduce energy use, another important ingredient is feedback, i.e. for consumers to know how much energy they have been using (and, ideally, when and how they have been using it). This section discusses historic feedback, i.e. improving access to past consumption data (where the past could be yesterday or last year). There are many permutations of how such feedback may be provided – Fischer (2008) notes that it may vary in frequency, duration, immediacy, content (kWh, cost, CO2, etc.), breakdown (by time, space and appliance), medium (and details of the medium, such as aesthetics and simplicity of access or use), comparisons (historic or normative), and combination with other instruments.
Benchmarking a customer‘s consumption against a sample of ―peer group‖ comparable homes is considered separately (Section C4) although it is a form of historic feedback, because the dynamics of how it operates are distinct.
Real-time feedback is discussed later (Sections C7 and C8). The distinction is important because, although there is a general finding (in all countries studied) that households take a positive view of feedback, it matters how detailed it is and how closely linked to specific actions, in time and in level of disaggregation (Darby 2006). Logically, aggregated feedback (e.g. quarterly or annual consumption) is more relevant to one-off changes that have a persistent impact, such as installing insulation or upgrading a heating system. More fine-grain, real-time feedback is more relevant to routine behaviour and purchases of equipment used intermittently (e.g. washing machines, televisions). By extension, while these are not absolute distinctions, aggregated feedback may be more relevant to the fuel used for heating (most often gas) and real-time feedback to electricity.
The standard quarterly billing procedure (often including estimates of consumption) or monthly identical payments (based on estimated annual consumption) do not give high grade feedback. The experience has been compared with buying from a supermarket without knowing the cost of each item and then receiving a quarterly bill showing the total cost (Kempton & Layne 1994).
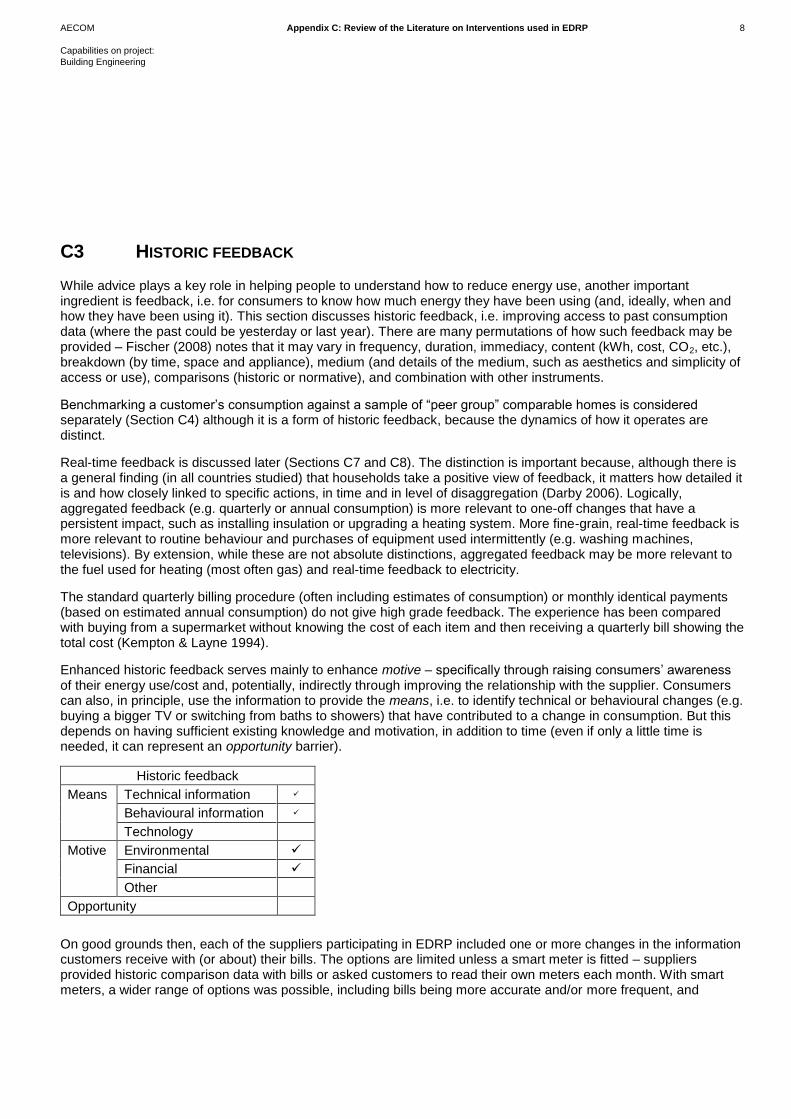
Enhanced historic feedback serves mainly to enhance motive – specifically through raising consumers‘ awareness of their energy use/cost and, potentially, indirectly through improving the relationship with the supplier. Consumers can also, in principle, use the information to provide the means, i.e. to identify technical or behavioural changes (e.g. buying a bigger TV or switching from baths to showers) that have contributed to a change in consumption. But this depends on having sufficient existing knowledge and motivation, in addition to time (even if only a little time is needed, it can represent an opportunity barrier).
Historic feedback
Means Technical information
Behavioural information
Technology
Motive Environmental
Financial
Other
Opportunity
On good grounds then, each of the suppliers participating in EDRP included one or more changes in the information customers receive with (or about) their bills. The options are limited unless a smart meter is fitted – suppliers provided historic comparison data with bills or asked customers to read their own meters each month. With smart meters, a wider range of options was possible, including bills being more accurate and/or more frequent, and

AECOM Appendix C: Review of the Literature on Interventions used in EDRP 9
Capabilities on project:
Building Engineering
providing more detailed breakdown of consumption across the day or the year. Accurate bills (without the need for a meter reader to call), and the increased awareness of actual usage they could create, might be considered a standard benefit of having a smart meter but this was not implemented in all the EDRP smart meter trials. The extra bill-related information was delivered variously on paper, via the web or through the customer‘s TV.
Few past studies have quantified the effect of enhanced billing in isolation.
Wilhite & Ling (1995) conducted a 3-year study of 1286 households in Norway, comparing three experimental groups. Group 1 received six bills per year, based on actual meter readings. Groups 2 and 3 also received text and a graphic showing temperature-corrected consumption in each period compared with the previous year. Group 3 in addition received energy advice. A control group had no change in billing, retaining quarterly bills, three of which were estimates from one meter reading each year. Across all three groups, there were persistent savings averaging 10% above the control group savings (results are not reported separately for each group).
In Finland, Arvola et al (1994) conducted a study of 696 households over 30 months, comparing three experimental groups with a control group having no change in billing (10 bills per year, nine of which were estimates based on a single meter reading each year). Group 1 received 10 bills per year, based on actual meter readings; an advice line was available but no unsolicited advice was given. Groups 2 and 3 also received a comparison with same the period the previous year (weather-adjusted) and a statement of percentage off-peak energy use (at same time as the bill but in separate envelope). Group 3 in addition received written advice on saving energy and shifting consumption. Statistically significant savings in the three groups were 2, 3 and 5% respectively, compared with controls.
Based on a user survey in New Jersey, Kempton & Layne (1994) provide some insight into some limitations on the potential for using bills to convey additional information to customers.
On receipt, bills are ―processed‖ as an invoice to be paid, so other information is likely to be ignored.
Only 40% of respondents mentioned paying attention to a usage comparison table and the kWh used.
38% said they always read bill inserts, 59% said they sometimes did.
Only ―a few‖ used bill information to evaluate attempts to save energy.
Written energy advice on bills tends to be generic, therefore mostly irrelevant to most people.
Hence, a bill can contain more information than most users want, making it less likely that critical energy-relevant information will be noticed.
The paucity of direct studies of billing changes is logical from the perspective that billing in itself does not provide a complete means-motive-opportunity package but it is difficult to determine what a ―normal‖ impact would be for the purpose of comparison with EDRP. Fortunately, a range of other studies provide evidence on different aspects of what could, in theory, be achieved with enhanced billing. These studies fall into four main groups – studies of:
households given historic feedback on consumption as part of normal business but not with the bill;
households given web-based access to historic feedback on consumption;
households given historic feedback on consumption for research purposes;
households reading their own meters.
Households given historic feedback on consumption as part of normal business but not with the bill
In the above studies, the billing-related information is provided by the energy supplier; this is as would be expected because other parties would generally not have access to the necessary information or have a reason or financial incentive for sending it to householders. There are, however, exceptions where a ―home energy report‖, which uses billing data, is provided separately by an organisation that works for, but is separate from, the energy supplier.
AECOM Appendix C: Review of the Literature on Interventions used in EDRP 10
Capabilities on project:
Building Engineering
The best known example of this is OPower/Positive Energy6 (in the USA) which sends reports to consumers
(through their energy supplier), showing consumption compared with 100 selected neighbours and the five lowest consumers of those neighbours.
7 The reports also offer brief advice, based on specific characteristics of the
consumption data, e.g. disproportionately high summer usage. The programme is funded by a $10 charge per customer per year.
8 OPower reports independently evaluated savings of around 2% compared with controls (Allcott
2009, Ayres et al 2009, Summit Blue 2009). In California, where the programme has been running longest, savings are holding up over 30 months, with the greatest impact in summer (when consumption is highest). Participation rates are high, with around 85% of customers showing some sort of response to the reports. OPower also claims increased participation in energy efficiency programmes, as well as direct response to the reports.
The positive response to this scheme may be attributed to any combination of independence from energy suppliers (hence possibly greater trust of the information provided – but only if customers know that the report has been independently generated), rising energy prices or other socioeconomic changes, and particular characteristics of the feedback (including benchmarking – see Section C4). It also has to be recognised that the large sample sizes (~80,000) made it statistically possible to detect modest percentage changes. A smaller study (Elliott et al 2006) showed no overall effect of providing additional information, using the usual parametric statistics, although a marginally significant impact was seen when nonparametric statistics were used (the latter being less affected by large variance in energy savings). This study is described in more detail in Section C9.
Households given web-based access to historic feedback on consumption
An alternative to households being sent predetermined information is to give them access to a range of information online. Some of the more advanced websites provide access to real-time data and/or benchmarking comparisons with similar households; these are considered in later sections. Of the remainder, the literature is difficult to evaluate because interventions generally combine feedback with other forms of intervention. Initiatives reported by Ersson & Pyrko (2009a,b) make the point very well. In most cases, users of web-based feedback had increased consumption relative to those who had access to the site but did not use it. The authors attribute this to customers with concerns about rising bills being referred to the website, i.e. rising bills caused use of the site, not the other way round. This is plausible though difficult to prove. Against this background, the 13% savings shown by users living in houses (as opposed to flats) in one scheme (Ersson & Pyrko 2009b) may appear impressive but, in reality, it is simply difficult to interpret, given that flat-dwellers‘ consumption increased by 18%.
The schemes described by Ersson & Pyrko (2009a,c) also offered customers a breakdown in consumption by time of day. This might prompt them to identify the reasons for peak usage, and possibly eliminate waste during that period, but would logically offer no financial incentive to shift load. Customers using these schemes showed increases in consumption or minimal reductions.
In contrast, Danish customer‐owned energy cooperative SEAS-NVE reports average savings of 17% from its ―Family Challenge‖ scheme (Darby, in preparation). The web site ‗Min meter‘ provided feedback to customers on their consumption but also advice, incentives, competitions, a lottery for customers who supply their own meter readings, a newsletter, and other interaction with the cooperative.
The findings from a scheme in Chicago (Isaacson et al 2006, Star et al 2006) are also positive but ambiguous. This was a real-time pricing scheme, aimed mainly at shifting consumption from peak hours and days, so the reported financial savings of 20% cannot be translated directly to energy savings. The only energy savings reported were
6 www.opower.com/Results/Overview.aspx
7 Other schemes, such as Efficiency 2.0 and Google PowerMeter, are at an earlier stage of development in this area.
8 This is approved by State utility regulators, who also require proof of effectiveness – this is why good evidence has been
published in relation to this scheme.
AECOM Appendix C: Review of the Literature on Interventions used in EDRP 11
Capabilities on project:
Building Engineering
3-4% for a hot summer with air conditioning being a major factor in demand. Customers opted into the scheme so they can be assumed to have had some motivation to change – probably principally financial motivation – and an expectation that the scheme would benefit them (which would not necessarily be true for the population as a whole).
Benders et al (2006) used billing data to provide a self-selected experimental group with web-based feedback on consumption and (temperature-corrected) savings achieved against a reduction target, together with advice based on the appliances the household possessed. The experimental group achieved 4.3%
9 greater savings in domestic
and transport energy, over a period of five months, than a control group that had a reduced version of the web tool (no advice, target or feedback on savings).
The huge range of outcomes reflects the different web site characteristics, customer populations, climates and ways in which customers interacted with the sites. While it does seem likely that many customers achieved energy savings as a result of these interventions, it is impossible to deduce what the essential ―active ingredients‖ are or what the optimum web-based feedback would look like. This is taken up further in Section C11, pulling together the findings on web-based interventions.
Households given historic feedback for research purposes
Studies are not considered here if customers made their own meter readings. Such studies are reviewed in the next subsection; leaving them aside, there is a good number of studies to draw upon although generally with small samples of households that opted in and are therefore not fully representative.
The billing frequency interventions in EDRP used monthly billing so the literature should be divided approximately around this period. Most studies used daily or weekly feedback and sustained the intervention over a relatively short period (one week to three months). Findings from these studies are summarised in Tables C2 and C3. A simple mean across trials, weighted by sample size, gives an average electricity saving of 9.7% for daily feedback and 6.6% for weekly feedback (the one study of gas consumption showed 18% savings relative to controls). These figures are very rough estimates of effect, not taking into account the quality or relevance of the studies, but they do represent an overall positive effect of frequent feedback over a short period. Ehrhardt-Martinez et al (2010) derive slightly higher figures by a different approach, estimating an average effect of 11% across all studies of daily or weekly feedback. Their estimate drops to 8.4% for more recent studies and 8.7% for larger studies but rises to 16.5% for studies lasting more than 6 months; the key may be to maintain feedback for long enough to establish new habits or prompt permanent changes such as insulation or new heating systems.
The practicality of daily or weekly feedback – at national scale – may be questioned but alternative media (e.g. RTDs or the web) provide an opportunity to deliver feedback in a more cost-effective fashion. For example, Völlink & Meertens (1999) combined advice through text TV with weekly feedback and a self-set savings target (5, 10 or 15%) for people living in energy-efficient homes. Although the study was small (48 households in total), savings over a period of 5 months were significant, relative to a control group, at 23% for gas and 15% for electricity. It is not possible to say which of the interventions was responsible for the effect.
10
9 Originally reported as 8.7% but revised downwards in personal communication from Florian Schindler to Sarah Darby
(5.10.2007).
10 The report could not be obtained and this account relies on Abrahamse et al (2005).
AECOM Appendix C: Review of the Literature on Interventions used in EDRP 12
Capabilities on project:
Building Engineering
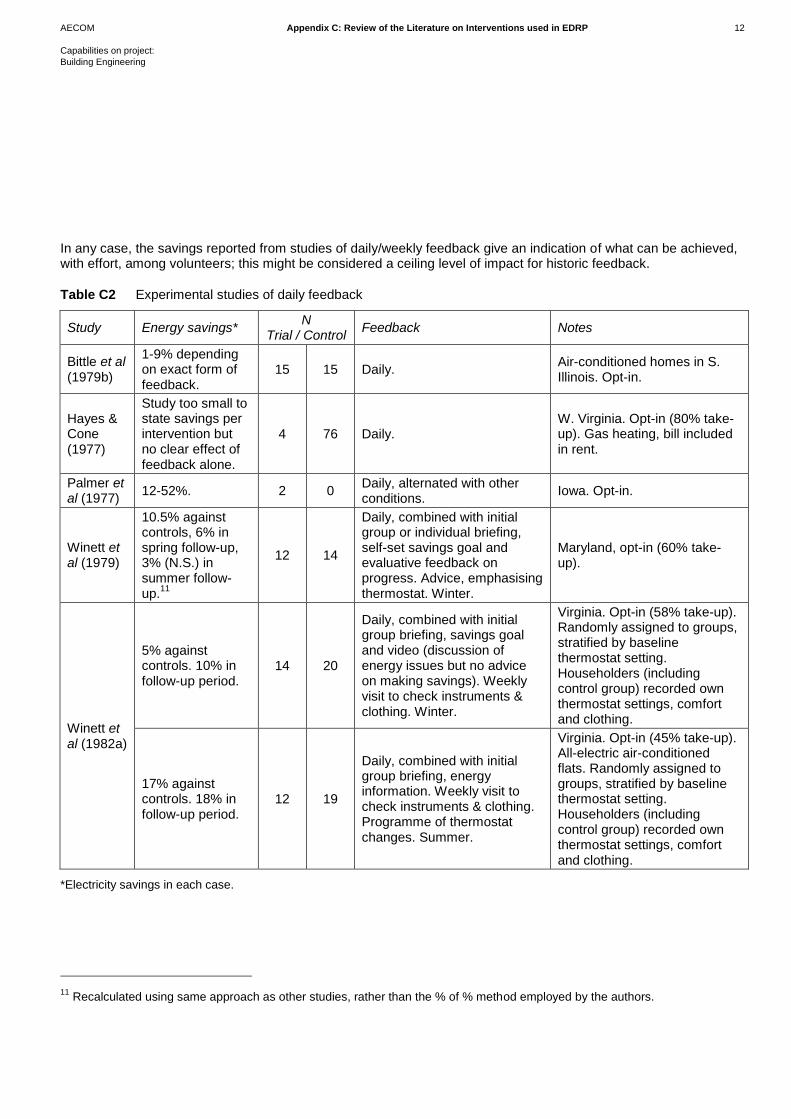
In any case, the savings reported from studies of daily/weekly feedback give an indication of what can be achieved, with effort, among volunteers; this might be considered a ceiling level of impact for historic feedback.
Table C2 Experimental studies of daily feedback
Study Energy savings* N
Trial / Control Feedback Notes
Bittle et al (1979b)
1-9% depending on exact form of feedback.
15 15 Daily. Air-conditioned homes in S. Illinois. Opt-in.
Hayes & Cone (1977)
Study too small to state savings per intervention but no clear effect of feedback alone.
4 76 Daily. W. Virginia. Opt-in (80% take-up). Gas heating, bill included in rent.
Palmer et al (1977)
12-52%. 2 0 Daily, alternated with other conditions.
Iowa. Opt-in.
Winett et al (1979)
10.5% against controls, 6% in spring follow-up, 3% (N.S.) in summer follow-up.
11
12 14
Daily, combined with initial group or individual briefing, self-set savings goal and evaluative feedback on progress. Advice, emphasising thermostat. Winter.
Maryland, opt-in (60% take-up).
Winett et al (1982a)
5% against controls. 10% in follow-up period.
14 20
Daily, combined with initial group briefing, savings goal and video (discussion of energy issues but no advice on making savings). Weekly visit to check instruments & clothing. Winter.
Virginia. Opt-in (58% take-up). Randomly assigned to groups, stratified by baseline thermostat setting. Householders (including control group) recorded own thermostat settings, comfort and clothing.
17% against controls. 18% in follow-up period.
12 19
Daily, combined with initial group briefing, energy information. Weekly visit to check instruments & clothing. Programme of thermostat changes. Summer.
Virginia. Opt-in (45% take-up). All-electric air-conditioned flats. Randomly assigned to groups, stratified by baseline thermostat setting. Householders (including control group) recorded own thermostat settings, comfort and clothing.
*Electricity savings in each case.
11 Recalculated using same approach as other studies, rather than the % of % method employed by the authors.

AECOM Appendix C: Review of the Literature on Interventions used in EDRP 13
Capabilities on project:
Building Engineering
Table C3 Experimental studies of feedback between daily and weekly
Study Energy savings N
Trial / Control Feedback Notes
Bittle et al (1979a)
18% for high consumers given feedback as cumulative kWh but 8% for other feedback and null/opposite effect for medium/low consumers.
18-27
3-10 Daily except Sunday, various forms of feedback.
Illinois. Air-conditioned homes. Opt-in but random allocation to groups. Split into high, medium and low consumption groups, using baseline data.
Midden et al (1983)*
Electricity: 13% against controls, 11% against group given general information only.
17 13 Weekly. Netherlands. Opt-in. Gas heating, hot water & cooking. Gas: 7% Against controls, 18%
against group given general information only.
16 13 Weekly.
Seligman et al
(1978)
7.4% against control and baseline.
15 14 Weekdays.
New Jersey. Opt-in. Summer, when 70% of electricity use is for air conditioning.
Feedback effect of 10.3% savings combined with difficult goal, -0.8% with easy goal.
20 20
Difficult (20%) or easy (2%) goal for savings. Half of each group had feedback three days per week.
*This was the only comparison of gas savings – all other studies are of electricity savings.
Studies of less frequent feedback are fewer.
Brandon & Lewis (1999) investigated the effect of various forms of monthly feedback in UK homes (13-22 per group, compared with a control group of 13 homes). This was a nine-month study of total (electricity plus gas) energy use. Participants opted in and the take-up rate was only 20%. Five groups had written feedback on kWh used, combined with either (a) comparison with other households in the project with similar dwelling and occupancy, (b) weather-corrected comparison with previous year, (c) statement of cost of energy, (d) a context of environmental problems or (e) advice on saving energy. Savings ranged from -5 to 13% relative to the control group but none was significantly different to the control group. A sixth group was provided with a PC programmed for user input of data, graphical comparison of current and previous year, a questionnaire on energy saving, and a directory of information and advice. This intensive intervention brought about statistically significant savings of 12% relative to controls but it is impossible to apportion the influence of users providing data (which might have included reading their own meters).
In the USA, Harrigan & Gregory (1995) and Gregory & Harrigan (1997) report on the Niagara Mohawk programme which provided a service to low income households in gas-heated houses. They compared savings in gas consumption over a year between households offered assistance with insulation, with and without provision of energy ―training‖ and thermostats. The training included letters with the bill, showing change in consumption. The group receiving training reduced consumption by 10% more than the group without (with relative savings sustained at 7% after three years). Across the two groups, those who accepted the insulation saved 5% more than those who did not, so this cannot account for the whole effect of training but the training itself included more than just feedback.
In the Netherlands, Van Houwelingen & van Raaij (1989) compared reductions in gas consumption under a range of interventions. The study had pretrial, trial and follow-up periods, each of one year. Participants opted in but the take-
AECOM Appendix C: Review of the Literature on Interventions used in EDRP 14
Capabilities on project:
Building Engineering
up rate was high (78%). One group (n=55) had monthly feedback about gas use, plus advice on energy saving and a target for savings. Consumption was significantly reduced by 7.5% against controls (n=55) and 4.6% against a group (n=55) receiving the advice and target only. The latter group may offer a better comparison because the control group was composed of households that had not agreed to the target. Savings relative to control declined to 0.3% over the year but were sustained at 3.4% against the advice plus target group.
In Germany, Dünnhoff & Duscha (2008) provided households with a bill supplement on a single occasion with normative comparison and energy advice. A sample of 4,500 was split between three experimental groups and a control group, some households receiving ―personal consultancy‖. None of the experimental groups reduced electricity consumption by more than the control group.
12
In a rare study of a fuel other than electricity or gas, Seaver & Patterson (1976) provided 35 Pennsylvania fuel oil customers with a single statement of their consumption in gallons per degree day (current winter so far, previous winter, % difference and cost impact). Subsequent savings were 8.6% better than a control group of 42 homes but this was not statistically significant. A further 45 customers received the statement and, if they had used less than last winter, a congratulatory stick-on decal. This was awarded to only 34 of the group but overall the relative savings rose to 13%, which was statistically significant.
These few studies of feedback at less than weekly intervals most closely resemble the EDRP billing trials but they have inconsistent findings. Although generally showing positive effects (savings up to 13%), zero or negative effects were also seen. The Dutch study (Van Houwelingen & van Raaij 1989) probably represents the best evidence, monthly feedback enhancing the effects of advice and targets by 4.6%, sustained at 3.4% over the following year. The use of savings targets in this study is likely to have magnified the effect of feedback (see Section C5) so the effect is consistent with the 2-3% savings typical of feedback in the form of enhanced billing or in parallel with billing (as reviewed above).
Households reading their own meters
Households may be asked to read their own meters, either to provide readings to their energy supplier or for the purposes of a research project. This is a particular kind of feedback, used in one EDRP trial.
In the former category, the most positive reported impact was in the SEAS-NVE ―Family Challenge‖ scheme described earlier, with average savings of 17%. Not all households read their own meters and there were many other interventions too, so it is uncertain how much can be attributed to meter readings. Henryson et al (2000) cite three other schemes in Denmark and Sweden that reported savings of between 2 and 12% for customers reading their meters and receiving historical feedback on consumption and energy advice (a weighted average of 4.9%, based on over 3,000 households). In contrast, Garay & Lindholm (1995) found no significant effect of meter reading followed by monthly feedback and Ersson & Pyrko (2009b) found wildly varying positive and negative effects of accessing a web site that processed data based on customers‘ own meter readings.
The research by Gaskell et al (1982) provides direct evidence of the impact of customers reading their own meters (in addition to keeping a diary of consumption and activities). These activities, added to a base intervention of advice and visits by the experimenters, increased savings for electricity from 8% (with base interventions only) to 11% (with additional self-reading and diary) and for gas from 5% to 22%. In the post-trial period, savings increased for electricity from 22% to 24% and for gas from -5% to 24%. The study of gas consumption by van Houwelingen & van Raaij (1989) found the same direction of effect although of lesser magnitude. Adding meter reading to advice and an energy saving target, savings shifted from 4% to 5% (-4% to -1% in the post-trial monitoring).
12 The report could not be obtained and this account relies on Fischer (2008).

AECOM Appendix C: Review of the Literature on Interventions used in EDRP 15
Capabilities on project:
Building Engineering
In Switzerland, Mosler & Gutscher (2004) combined daily or weekly self-reading with energy advice and, in two of their four experimental groups, a savings goal. During a four-week treatment period, electricity savings were in the range 5.4-6.1% greater than in the control group except in the case of weekly readings with a savings goal, where savings were 3.7% less than the control group. In a post-treatment follow-up period, savings for households reading meters daily, relative to the control group, were 10.6% and 14.2% respectively for groups with and without a savings goal. With weekly reading, the figures were 14.4% and 5.8%. This appears to show a benefit of daily reading where there is a target but the reverse where there is not. This makes sense if daily readings make it easier to track performance against target. However, the total sample was only 48, so all the differences were non-significant.
13
Other experiments included customers reading their own meters but without such direct comparison of conditions with and without self-reading.
Meter readings combined with historic feedback have produced electricity savings relative to control groups of 4% (Haakana et al 1997) and 2.9% (Mack & Hallmann 2004). The latter study (in Germany) had only 19 trial homes and 10 controls and the process for meter reading is not clear but feedback was weekly over a 10-month trial.
14 Haakana et al also report savings for gas of 1%.
Adding energy advice into this mix has produced electricity savings of 4-5% (Haakana et al 1997), 7% (Nielsen 1993) and 8% (Wilhite 1997). Savings for gas were 4-6% (Haakana et al 1997).
Combining customer meter readings with advice (without feedback) produced electricity savings relative to control groups of 3% (UC Partners 2009), 11% (West Lothian 1994-2000)
15 and 4.5%
16 (Winett et al 1979). Gas
savings were 2-14% (UC Partners 2009).
The EcoTeam project (Staats & Harland 1995, Staats et al 2004) included self-reading and comparative data in intensive group-based savings efforts by motivated individuals who received detailed guidance. Savings achieved were 5-7% for electricity and 20-23% for gas (against baseline only – no comparison with a control group).
While it is difficult to draw definitive conclusions from these comparisons, the savings are generally more positive consistent than for studies without customer meter readings. The potential savings are perhaps up to 5% for electricity and more for gas. The difference between electricity and gas is consistent with the different levels of feedback granularity that are relevant to each, as noted at the start of this section. It is not unreasonable to say that reading one‘s own meter is an active engagement with energy use that could both focus the mind of the customer and produce useful feedback, even if the reading is not used for billing purposes.
Conclusion on historic feedback
Enhanced billing has the potential to reduce energy consumption but its effectiveness will depend on the details of the enhancement, the match to what customers want and understand, and the extent to which they are motivated to
13 The report could not be obtained and this account relies on Fischer (2008).
14 The report could not be obtained and this account relies on Fischer (2008).
15 Monitoring covered over 1,000 customers and the savings were for behavioural change only, prior to installation of insulation.
Motivation was almost entirely financial: these were low-income households who contacted the service because of difficulty in paying their energy bills. Advisers reported that a large part of the savings came from better understanding of controls. The effectiveness of the programme depended to a great extent on the combination of trained advisers, in-home face-to-face advice and follow-up with feedback (Darby 2003).
16 Recalculated using same approach as other studies, rather than the % of % method employed by the authors. In addition to
self-reading and recording of daily consumption, the intervention included a 10% reduction target, a briefing meeting or home briefing, advice (emphasising use of the heating thermostat) and a daily statement of weather-corrected expected energy use. Savings were less than with daily feedback provided by the researcher.

AECOM Appendix C: Review of the Literature on Interventions used in EDRP 16
Capabilities on project:
Building Engineering
absorb and use the new information. The review by Ehrhardt-Martinez et al (2010) identifies enhanced billing as the least effective form of feedback (at around 5.5% energy savings). This conclusion is from a North American context but allowed for independent effects of when the research was done (pre- or post-1995), the size and duration of the study and where in the world it was carried out. Based on the breakdown of evidence reviewed in this section, that estimate seems optimistic in relation to routine monthly billing, 2-3% being more likely. The alternative of encouraging householders to read their own meters and keep track of consumption may well be more effective.
Ehrhardt-Martinez et al (2010) also point out that enhanced billing is cheap to implement and can be deployed on an opt-out basis rather than opt-in, and could therefore be the most cost-effective type of feedback intervention. However, the distinction needs to be made between active opt-out (e.g. where someone declines the offer of enhanced billing) and passive opt-out (e.g. where additional billing information is received but not read).
One clear characteristic of the effect of historic feedback is its variability. This variability is not surprising, given the wide range of forms and contexts of feedback. There are also some fundamental uncertainties about how it might be expected to act. The general assumption has been that feedback will allow a consumer to make better informed choices and, critically, that the consumer will choose to use less energy. As Matsukawa (2004) has pointed out, this is not necessarily the case: consumers may decide that the energy costs are so low that it is not worth the effort to reduce consumption, and may even see that the cost is much lower than s/he previously thought, and it is therefore OK to use more energy. In any sample of households, it is possible that all three outcomes will occur in different households.
Add to this the fact that people are not accustomed to getting historic comparison data and may be unsure what to do with it, and the uncertainty increases. Furthermore, there are likely to be people who already know energy costs a lot and therefore perceive enhanced billing information as ―rubbing it in‖ rather than being helpful.
Nevertheless, the overall effect is generally positive and there may also be indirect benefits of enhanced billing. For example, Garay & Lindholm (1995) found no clear impact on electricity or district heating usage from monthly, accurate bills with historic and comparative feedback. But interviews showed that the new bill improved householders' sense of control over their energy costs, with almost all interviewees expressing satisfaction. This has its echo in the appeal of accurate bills (or dislike of estimated bills). Improved relations with the energy supplier might itself be a facilitator for other interventions.

AECOM Appendix C: Review of the Literature on Interventions used in EDRP 17
Capabilities on project:
Building Engineering
C4 Benchmarking (comparative or normative feedback)
Benchmarking takes historic feedback a stage further, showing customers how their consumption compares with other households that are in some way comparable. While typically associated with historic feedback, it could in principle be incorporated into real-time feedback.
Such comparative feedback may provoke competition, social comparison or peer pressure. In doing so, it shifts the mechanism of action towards more socially based motive but leaves some scope for environmental and financial motive. Only one of the EDRP trials used benchmarking and not in isolation from other interventions.
Benchmarking
Means Technical information
Behavioural information
Technology
Motive Environmental
Financial
Other
Opportunity
Implementation of benchmarking faces three substantial issues – finding a suitable comparison group, the response of households that are already below the benchmark values and people‘s own perception of how they respond to normative information.
A comparison group would ideally need to be households of the same composition, in a similar financial position, in a similar dwelling in a similar climate – this difficult to achieve (especially with the limited information available to energy suppliers). Furthermore, this fact is sufficiently obvious that customers may be suspicious about the validity of their comparison group (Roberts et al 2004). Households studied by Midden et al (1983) found the comparison more acceptable for electricity than for gas, the latter depending too much on the amount of time spent at home and the characteristics of the home. It is unclear to what extent this problem might be overcome by better explanation of the basis of the benchmark values.
Perhaps more importantly, households that are already below the benchmark values may find no reason to reduce consumption and might even increase consumption (Fischer 2008). Brandon & Lewis (1999) report that feedback with benchmarks (compared with other study participants) on cost and environmental impact led high and medium consumers to save energy (3.7% and 2.5% respectively) and low consumers to increase energy use (by 10.7%). In another study, over 70% of respondents said that they would take conservation action if they were shown to be over the 80th percentile of their comparison group (Iyer et al 1998).
This effect needs to be distinguished from the more generally known ―regression to the mean‖ whereby those who start at a high level of consumption are more likely to reduce and vice versa (e.g. Bittle et al 1979a). The specific effect of benchmarking is perhaps best evidenced by success in eliminating it. Negative impact may be overcome by use of simple normative messages or even minor changes in presentation such as the inclusion of ―smiley‖ icons with low users‘ bills (Schultz et al 2007). For example, a CHARM project that allows for smart meter consumption data to be shared with a Facebook group suggested the use of normative messages to limit this effect.
17
17 http://business.kingston.ac.uk/research/research-groups/smart-communities-project
& http://news.bbc.co.uk/1/hi/sci/tech/8062327.stm

AECOM Appendix C: Review of the Literature on Interventions used in EDRP 18
Capabilities on project:
Building Engineering
The more subtle issue is that people tend to place normative information low on their list of what they believe influences their behaviour and yet it can be high on the list of what actually influences their behaviour. This is a general principle, not specific to energy saving, but Nolan et al (2008) demonstrated it in a survey and simple experiment on household energy conservation in California. In the survey, respondents rated other people‘s behaviour as the least important out of four influences on their behaviour (the other being protecting the environment, benefiting society and saving money). However, beliefs about other people‘s behaviour were the most highly correlated with reported conservation behaviour. An experiment then delivered messages based on one of these four influences to different households, together with information on specific conservation behaviours (there was also an information-only control group). After controlling for baseline, the group with a message based on behaviour norms consumed less than other groups, which did not differ from each other. Hence, normative messages need to overcome people‘s belief that they are not influenced by them, which could lead to a tendency to ignore them.
If these problems are well evidenced, there is less evidence on what works, since benchmarking tends to be combined with other interventions in a way that makes it difficult to isolate the effects. OPower included benchmark data in feedback; the overall electricity savings effect was around 2% (Allcott 2009, Ayres et al 2009, Summit Blue 2009)
18 but there is no useful comparison group to indicate whether the benchmark data represented a significant
element of the intervention. Similarly, Henryson et al (2000) cite two programmes in Sweden that included benchmark data with feedback, but also meter readings by householders. Electricity savings were not significant in one case and only 2% in the other. Ueno et al (2005) included comparative data in a study using as interactive display on the user‘s PC. Savings (compared with controls) were 13% for electricity and 9% for gas but the sample size was very small (10) and the display also offered consumption (yesterday, past 10 days and comparison with past consumption) and room temperature and, for electricity, usage by specific appliances.
In a variant of benchmarking, the EcoTeam project (Staats & Harland 1995, Staats et al 2004) included comparative data with intensive group-based savings efforts by motivated individuals who read their own meters and received detailed guidance. Savings achieved were 5-7% for electricity and 20-23% for gas (against baseline only – no comparison with a control group).
PA Consulting (2010) reported on a one-year trial of the ―GroundedPower‖ monitoring system in Massachusetts.
The 91 participants received information and training, then web‐based access to real‐time and monthly information on 'use and demand', and savings, in kWh, $ and CO2. They also saw comparison of consumption with a "cohort customer group" and had opportunities to learn about and sign up for energy-saving activities. Participants were selected to have high initial consumption. Two control groups consisted of 207 rejected study volunteers (with lower consumption) and drop-outs from the study, and 400 blind controls with higher consumption. The two control groups made similar small electricity savings over the trial period and collectively 9.7% less than the trial group (9.3% excluding households that had been involved in another programme with the same supply company). Given the intensive combination of interventions, it is impossible to say which one or combination was responsible for the observed savings.
Two other web-based interventions included benchmarking – Energikollen19
and Karbo & Larsen (2005) but neither study has yet reported savings among site users.
This leaves two studies that directly evaluated the effects of benchmarking. Brandon & Lewis (1999) were able to compare energy savings with and without benchmarking but sample sizes were very small and there were no significant savings overall in either group. Midden et al (1983) gave households information and advice followed by
18 These studies were described in Section C3.
19 http://www.logica.com/we-are-logica/media-centre/news/2008/v%C3%A4xj%C3%B6-energi-and-logica-launch-energy-saving-
web-service-for-consumers/

AECOM Appendix C: Review of the Literature on Interventions used in EDRP 19
Capabilities on project:
Building Engineering
weekly written feedback (numbers & graphs) with usage in kWh, percentage increase or reduction on baseline, monthly financial consequences of increase or reduction, and graphs of consumption to date. This achieved savings of 13% for electricity and 7% for gas but adding comparative data (percentage difference from similar households) in another experimental group left electricity savings unchanged and gas savings reversed to excess consumption of 6%.
The inconsistency in findings is in keeping with the general inconsistency of historic feedback interventions. In addition, there may be interactions with the political/environmental positions of the sample groups. Costa & Kahn (2010) analysed the impact of information provided (by OPower) with bills by a California energy utility. Customers received monthly home energy reports, including energy saving advice and their own electricity consumption relative to neighbours‘ consumption. Costa & Kahn collected additional data on political party registration and environmental interest, at household and community level. A regression analysis produced some striking results:
Democratic households that pay for electricity from renewable sources, donate to environmental groups, and live in a liberal neighbourhood reduce consumption by 3% in response to the energy reports;
Democratic households that are also high users reduce consumption by 6%;
Republican households that do not pay for electricity from renewable sources or donate to environmental groups increase consumption by 1%.
While it is uncertain how large the sample was or how well matched the peer group was, there is a warning here that the characteristics of the sample group need to be considered in benchmarking studies.
An extension of benchmarking is to engage direct peer pressure/support directly, as in the EcoTeam project reported in Section C3. The literature in this area is extensive for other topics (particularly in relation to health issues such as obesity and smoking) but with little formal evidence for energy efficiency. Neither was peer pressure used in the EDRP household-level trials but it would almost certainly be relevant to the community trials. There is potential in the use of social networking sites to share consumption data, as in the CHARM project noted above, but this approach is in its early development.
AECOM Appendix C: Review of the Literature on Interventions used in EDRP 20
Capabilities on project:
Building Engineering
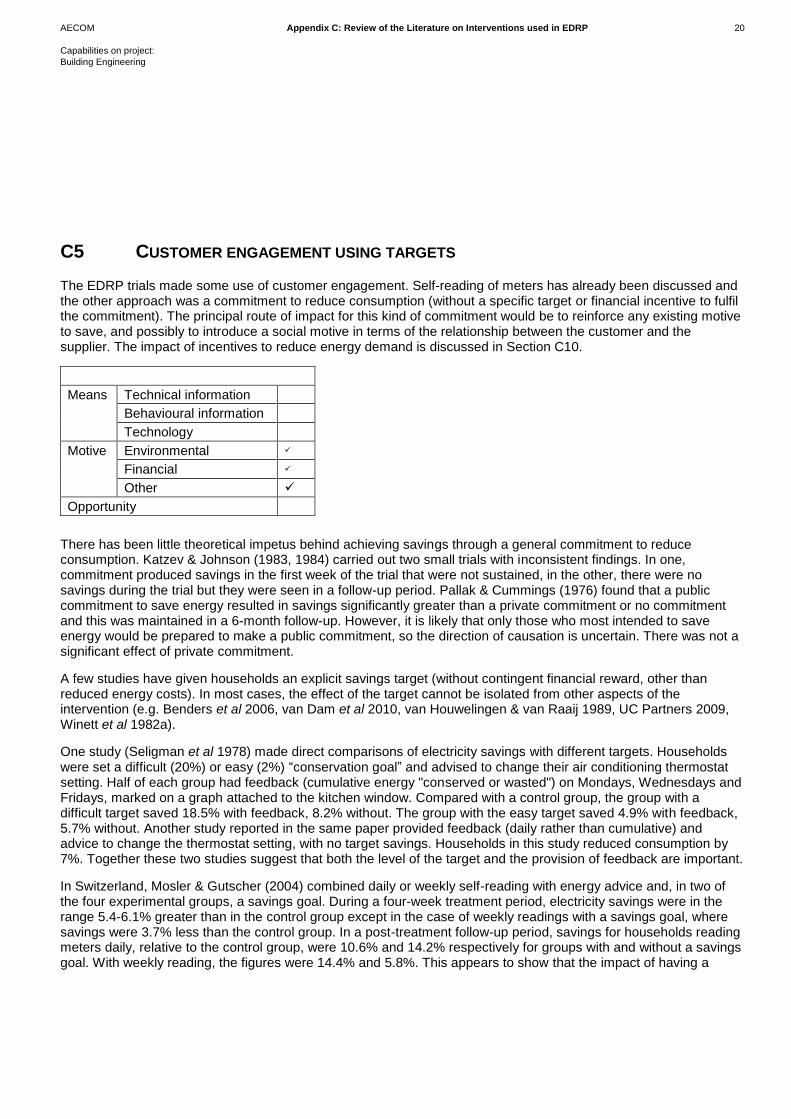
C5 CUSTOMER ENGAGEMENT USING TARGETS
The EDRP trials made some use of customer engagement. Self-reading of meters has already been discussed and the other approach was a commitment to reduce consumption (without a specific target or financial incentive to fulfil the commitment). The principal route of impact for this kind of commitment would be to reinforce any existing motive to save, and possibly to introduce a social motive in terms of the relationship between the customer and the supplier. The impact of incentives to reduce energy demand is discussed in Section C10.
Means Technical information
Behavioural information
Technology
Motive Environmental
Financial
Other
Opportunity
There has been little theoretical impetus behind achieving savings through a general commitment to reduce consumption. Katzev & Johnson (1983, 1984) carried out two small trials with inconsistent findings. In one, commitment produced savings in the first week of the trial that were not sustained, in the other, there were no savings during the trial but they were seen in a follow-up period. Pallak & Cummings (1976) found that a public commitment to save energy resulted in savings significantly greater than a private commitment or no commitment and this was maintained in a 6-month follow-up. However, it is likely that only those who most intended to save energy would be prepared to make a public commitment, so the direction of causation is uncertain. There was not a significant effect of private commitment.
A few studies have given households an explicit savings target (without contingent financial reward, other than reduced energy costs). In most cases, the effect of the target cannot be isolated from other aspects of the intervention (e.g. Benders et al 2006, van Dam et al 2010, van Houwelingen & van Raaij 1989, UC Partners 2009, Winett et al 1982a).
One study (Seligman et al 1978) made direct comparisons of electricity savings with different targets. Households were set a difficult (20%) or easy (2%) ―conservation goal‖ and advised to change their air conditioning thermostat setting. Half of each group had feedback (cumulative energy "conserved or wasted") on Mondays, Wednesdays and Fridays, marked on a graph attached to the kitchen window. Compared with a control group, the group with a difficult target saved 18.5% with feedback, 8.2% without. The group with the easy target saved 4.9% with feedback, 5.7% without. Another study reported in the same paper provided feedback (daily rather than cumulative) and advice to change the thermostat setting, with no target savings. Households in this study reduced consumption by 7%. Together these two studies suggest that both the level of the target and the provision of feedback are important.
In Switzerland, Mosler & Gutscher (2004) combined daily or weekly self-reading with energy advice and, in two of the four experimental groups, a savings goal. During a four-week treatment period, electricity savings were in the range 5.4-6.1% greater than in the control group except in the case of weekly readings with a savings goal, where savings were 3.7% less than the control group. In a post-treatment follow-up period, savings for households reading meters daily, relative to the control group, were 10.6% and 14.2% respectively for groups with and without a savings goal. With weekly reading, the figures were 14.4% and 5.8%. This appears to show that the impact of having a

AECOM Appendix C: Review of the Literature on Interventions used in EDRP 21
Capabilities on project:
Building Engineering
target depends on the frequency of feedback. However, the total sample was only 48, so all the differences were non-significant.
20
A goal of a 5% reduction in energy use (combined with tailored advice and feedback on savings) brought about a change in self-reported behaviour, calculated to be equivalent to 8.3% energy savings (electricity and gas combined) although actual consumption was not measured (Abrahamse et al 2007). There was no additional effect of a group savings goal of 5% and feedback on group performance but there were critical weaknesses in the implementation of the group goal so this finding should not be regarded as definitive.
The target-setting approach is being explored in the CHARM using social networking sites to increase the impact of smart meters: a game called ―lost joules‖ that allows participants to bet on their energy use reductions.21 In similar fashion, Rubino de Oliveira et al (2010) describe the development of a social network ―life simulation game‖ to support energy savings.
20 The report could not be obtained and this account relies on Fischer (2008).
21 http://business.kingston.ac.uk/research/research-groups/smart-communities-project &
http://news.bbc.co.uk/1/hi/sci/tech/8062327.stm

AECOM Appendix C: Review of the Literature on Interventions used in EDRP 22
Capabilities on project:
Building Engineering
C6 SMART METERS
Merely having a smart meter installed is a minimal reason to expect any change in consumption (see also Darby 2010).The main point is that the meter allows a range of other interventions, such as:
accurate bills without visits by meter readers;
more frequent billing;
real-time feedback (of gas consumption, not just electricity);
time of day breakdown of consumption, with or without variable tariffs;
other incentives to reduce demand.
These are covered elsewhere in this review. The question here is whether the experience of getting a smart meter can itself influence energy use. If the experience is simply being told a replacement meter has been installed, somewhere out of sight, the consequences should be small. But this is not necessarily the total experience. In the course of the exercise, customers might experience:
being told they are among the first to get the latest technology;
renewed positive interaction with the supplier;
reassurance that the meter accommodation is now safer;
a friendly or unfriendly installer;
positive or negative attention from friends and neighbours;
informal energy advice from the installer.
If the smart meter is easier to read than the meter it replaces, householders may read it more often, which could itself have a positive impact on energy (especially gas) demand (see Section C3). There may be merit in encouraging this as part of smart meter installation; it would be perhaps the least ―high tech‖ application of smart meters but potentially one of the more effective in relation energy demand reduction.
Any of these factors might have some effect on householders‘ knowledge of means and/or their motive to save.
Smart meter
Means Technical information
Behavioural information
Technology
Motive Environmental
Financial
Other
Opportunity
The EDRP trials did not set out to test installation effects but they arise through different approaches to recruitment and installation. The installation procedure, for example, ranged from trying to minimise any impression that the work was anything other than ―business as usual‖ or promoting minimal interaction between installer and householder, to training installers to demonstrate the installed technology to householders. These may not be trivial factors but there is, as yet, insufficient evidence in the literature to evaluate them; EDRP may itself give us the first leads.

AECOM Appendix C: Review of the Literature on Interventions used in EDRP 23
Capabilities on project:
Building Engineering
C7 REAL-TIME DISPLAY (RTD) DEVICES
RTDs go a stage beyond historic feedback by showing the current rate of energy consumption, generally with the option of expressing this in kW, cost or CO2 emissions. They often have other functions such as displaying historic consumption for various periods, temperature displays, alarms and simple visual signals to indicate high consumption rates. RTDs range from battery-powered devices that clip on to the live cable of an electricity meter (smart or not) to relatively sophisticated mains-powered devices, showing both electricity and gas consumption by using the signal from smart meters. The latter type is also capable of greater accuracy. The EDRP trials represent
all these options, alone or in various combinations with other interventions. Most of the published trials involve ‗clip‐on‘ displays, used without smart meters but there are also examples of studies using main-powered meters or real-time feedback via the web. One implication of this is that most studies have been of electricity consumption, not gas.
As noted in Section C3, RDTs are most relevant to routine behaviour and purchases of equipment used intermittently (e.g. washing machines, televisions). Householders can check the power consumption or cost of using an item, at a point in time or over a short period, and make informed decisions such as whether to turn something off or down, or replace it. Consumers might see, for example, the jump in power when a kettle or cooker is switched on, and the actual relative demand of household appliances – in use and on standby – which can be very different from what they had assumed or been led to believe. Consumers can also use RTDs to confirm the benefit of changes they have made.
In this way, RTDs can support:
means (by identifying what changes could be made) but only if the consumer understands how to do this, and has the knowledge to act upon observations;
motive (by showing how much energy is being used) but only if the consumer already has sufficient motivation to want to check energy use (and possibly also by engaging other motives such as using or showing off new technology);
opportunity (because they save householders time relative to taking a series of meter readings and calculating differences).
22
Real-time displays
Means Technical information
Behavioural information
Technology
Motive Environmental
Financial
Other
Opportunity
Thus, RTDs offer all three elements of change but incompletely in each case and, logically, depending on the extent to which households actually refer to them, particularly when they are first installed and there is most to learn. Generally, financial motivation is likely to be the strongest element. As noted in Section C3, in any sample of
22 It could be argued that this is theoretical because householders generally do not use their meters in this way. The alternative
view is that the opportunity benefit accrues from the time required to make checks being shortened to the point where more householders do it at all. So, although householders then take more time for checking, this is because it is now seen as better value use of time.
AECOM Appendix C: Review of the Literature on Interventions used in EDRP 24
Capabilities on project:
Building Engineering
households, the response to feedback may be choosing to use less energy but some consumers may decide that the energy costs are so low that it is not worth the effort, and other may even see that the cost is much lower than s/he previously thought, and it is therefore OK to use more energy.
Interest in acquiring and using an RTD varies between consumers. For example, a survey of 1041 American electricity customers found that 73% of high consumers were interested in acquiring one, but only 50% of low consumers, and home owners were more interested than tenants (Wheelock 2009). Most experiments and trials
with displays have tended to focus on family homes that are owner‐occupied. Many used relatively small samples and almost all were, to some extent, ‗opt‐in‘ trials or experiments.
Opting in to trials is likely to have some impact on the trial outcome. It is often assumed that people who opt in will be more ―enthusiastic‖ about saving energy and will therefore reduce consumption more as a result of the additional feedback. There is a counter-argument that enthusiasts will have already done much of what the RTD indicates they should do, hence they have less capacity to reduce consumption further. Therefore, the question of the experimental impact of opting in becomes an empirical one. Either way, it may be that the optimum target is people who have not yet taken much interest in conserving energy but who could be motivated in the process of providing an RTD and informed how to use the device to fulfil their newfound motivation.
This review begins with the simple trials that compared households provided with an RTD with a control group that did not have real-time feedback. It moves on to more complex trials that combined an RTD with other interventions and then web sites that provided real-time feedback. Some evidence from studies of student accommodation is then used to provide further insight. Two related types of real-time feedback are then considered – usage alarms and thermometers. Finally, evidence is reviewed from user response to RTDs (as distinct from changes in energy consumption).
Simple trials
Trials that simply compared installation of an RTD with a control group have produced widely varying findings – all for electricity consumption – see Table C4. The Table has been ordered by climate, with the generally cooler climates at the top of the table and warmer ones at the bottom.
The first and most obvious point is that all these studies were conducted in North America. The only relevant UK study (Wood & Newborough 2003) had only 10 households in the trial group (9 controls) and provided feedback only on electricity used for the main cooker. The limitations of this study were noted earlier.
It can be observed that there are three ―special cases‖ – two with prepayment meters (and little published detail of the research) and one with real-time display via a PC giving breakdown by end use. Savings were high in these studies (15-20%, 13% and 13%) and it is difficult to say whether the special circumstances were responsible. Taking these cases out of the picture, the highest savings (12% and 18.1%) were seen in the most extreme climates, which arguably have least relevance to the UK. If only homes with non-electric space and water heating are considered, the 18.1% is reduced to 8.8%.
23 The remaining studies found savings of 0-6.5% and the range was similar for the
four studies with sample sizes of over 100 (0-5.1% excluding homes with electric space or water heating). British Columbia and Oregon probably come closest to the UK climate; the two studies conducted there (savings of 0 and 2.7%) represent a very limited evidence base but do not suggest that large savings should be expected from RTDs in isolation in the UK.
23 Only 10% of UK households rely mostly on electricity for heating (Utley & Shorrock 2008) whereas 45% of the Ontario
households had electric water heating, and about 15% had both electric space and water heating.

AECOM Appendix C: Review of the Literature on Interventions used in EDRP 25
Capabilities on project:
Building Engineering
Table C4 Studies of the simple impact of RTDs on electricity consumption
Study / Location N (trial/control
group) [Opt-in rate] Device % savings24
Mountain (2007) / Newfoundland & Labrador
58/10 [~58%] PowerCost Monitor (PCM)25
18.126
Mountain (2006) / Ontario 382/42 [98%] PCM 6.527
Rossini (2009) / Ontario 30,000/- [~25%] PCM28
5.229
*
Rossini (2009), Hydro One (2008) / Ontario 8130
/75 [13%] PCM31
6.7
Quesnelle (2004) / Ontario 2,500/12,000 [?%] Prepayment smart meter with RTD
32
15-20
Dobson & Griffin (1992) / Ontario 25/75 [100%] Via PC33
1334
Siems (2009) / Massachusetts 243/- [5%] PCM35
1.936
*
Mountain (2007) / British Columbia 43/17 [~43%] PCM 2.737
Sipe & Castor (2009) / Oregon 365/? [?%] PCM38
0
Allen & Janda (2006) / Ohio 10/50 [17%] Energy Detective (TED)39
0 (winter)
McClelland & Cook (1979) / North Carolina 25/76 [100%] Fitch40
12
King (2007), Pruitt (2005) / Arizona 2,600/- [?%] Prepayment meter with RTD41
12.842
*
24 Compared with control group and baseline except * against baseline only and against control only.
25 Clip-on RTD showing kWh, $ and CO2, per hour - current, total and predicted. Also outdoor temperature. Resolution 100 W,
information updated every 30 seconds. 26
19.8% if electric space heating; 22.5% if electric water heating but not space heating; 8.8% if neither. 27
8.2% if non-electric space heating (16.7% if also electric water heating, 5.1% if not); air conditioning made no difference. Rossini (2009) adds, for homes with electric space heating, 1.2% in colder areas, 3.4% in warmer areas. 28
Offered to all customers at cost of $10 for packing and postage. Many technical problems reported. 29
6.7% if still used RTD after 2 years; 4.5% if only used for a period; 1.5% if requested one but never used it. 30
Including 12 farm customers. 31
The report is unclear but it is assumed, following Faruqui et al (2010) that this group received no other intervention. 32
The customer can plug the unit into any electrical outlet to display the cost of energy use in $ and c per hour. 33
Showing cost on hourly, daily, monthly and annual basis; also breaks down by end-use. 34
In winter, all homes with electric space & water heating. 35
Self-installed (installation rate 76%). Many technical problems reported. 36
2.9% after a year for all those still using their RTD. 37
9.3% in winter. 3.4% if electric space heating but not water heating; 2.1% for those with electric water heating but not space heating. 2.3% if neither. 38
Purchased at discount ($30) and self-installed, or installed as part of an audit service. 39
Portable mains RTD. Instantaneous and historic consumption in kWh and $, daily & monthly peak, with usage alarm. No graphics. Resolution 10 W, information updated every second. Fitted by electrician and explained to householder. 40
Shows electricity use in cents per hour. 41
Prepayment meter with display showing real-time kWh and cost/hour, along with cost today and yesterday, current and previous month, and remaining credit. Reminders to customers if they need to buy more credit using their smart cards. 42
Summer 13.8, winter 11.1.

AECOM Appendix C: Review of the Literature on Interventions used in EDRP 26
Capabilities on project:
Building Engineering
This is less optimistic than the range of 5-15% given by Darby (2006) or the estimates by Ehrhardt-Martinez et al (2010) of 6.9% for simple real-time feedback or 14% for ―real-time plus‖ (e.g. feedback disaggregated by appliance). It is, however, more specifically focused on the EDRP context. The following sections explore the potential impact of RTDs in combination with other interventions.
Percentage take-up is not an obvious explanation for the variation in savings noted above – if anything, there is a positive correlation between opt-in rate and percentage savings. However, the studies offer some other evidence on the effect of active or passive opting in.
In northern Ontario (Rossini 2009), customers who acquired an RTD but never used it still saved 1.5% compared to the control group – that is, their initial interest and motivation were associated with slightly reduced consumption. The 29% who were still using their display after the two years of the trial saved 6.7% compared with controls, while the largest group (56%) who used it for between one and 24 months saved 4.5% on average. This demonstrates what has been found in some other trials: that savings are related to the extent to which a display is used, and also that persistent habits can be formed during relatively short exposures to useful feedback.
Seville (2009) also cites a study in which households with RTDs made average energy savings of approximately 10% while very interested owners saved as much as 13% and those who took little interest still reduced their energy use by more than 2%. Further details of the study were not provided.
Matsukawa (2004) reports on the short-term impact of providing a random sample of Japanese households with an almost real-time display (hourly data). Controlling for a number of household, demographic and economic variables, the effect was statistically significant savings of 6-10%
43; this does not appear to take into account
baseline consumption in the trial and control groups but the effect increased with the number of days on which the display was used.
RTD in combination with written advice
As noted above, RTDs do not tell people what to do with their feedback, hence information and advice might be expected to enhance the impact of RTDs.
Hutton et al (1986) deployed the Energy Cost Indicator (ECI) – showing current, next hour, rolling day, yesterday and this month costs – in 280 homes in California, Quebec and British Columbia. The deployment was combined with provision of extensive written advice. Electricity savings (of 4.1%) were significant only for all-electric homes in the coldest region (Quebec), where energy knowledge was also highest. Gas savings were significant at 5% in British Columbia (if an outlier was excluded) and in California for income quartile Q3 (middle class, educated). A comparison group of 263 homes (75 using gas in addition to electricity) had the advice only and did not make significant savings in either gas or electricity relative to 259 control homes. None of the effects was persistent.
Trials in the UK have been smaller and less well controlled. These studies do not represent evidence that advice plus RTD has a greater effect than an RTD alone. In fact, if anything, the opposite is true: the impact of RTDs may come mainly from self-teaching via experimentation with the aid of feedback.
Places for People (2007) report a comparison of 20 English households given Electrisave clip-on RTDs and advice with 20 controls. Although 14% electricity savings were reported, it is not clear if these savings were against the control group. Also, the households actively opted in and lived in well insulated social housing and, for unclear reasons, the highest and lowest users in each group were excluded from the analysis.
Wood & Newborough (2003) report 6% savings against controls from a combination of advice with an RTD, compared with 15% for the RTD alone and 3% for advice alone. The study had only 9 households in the trial
43 Based on reported figures of 0.3% savings per per day of use, use on 7-10 days per month and 3 months trial.

AECOM Appendix C: Review of the Literature on Interventions used in EDRP 27
Capabilities on project:
Building Engineering
group (9 controls) and provided feedback only on electricity used for the main cooker. The limitations of this study were noted earlier.
Other combinations including RTDs
Other studies provide a direct evaluation of the effect of adding an RTD to other interventions of various kinds.
Northern Ireland Electricity (NIE 2005, 2006, Boyd (2008) provides some evidence of the benefits of a prepayment ―Keypad meter‖ that has an RTD function (showing kWh and cost, current and historic) and also allows time-varying tariffs. It is not entirely clear from reports but at least some trials involved provision of information or advice to customers. In one trial 27 customers with prepayment electricity meters were given a Keypad meter. These customers saved 1% against baseline and 4% against the background national increase in consumption. A follow-up study with 324 customers found similar overall savings – 1% against baseline and 5% more than a control group with standard meters. Other analyses found 10-11% peak time savings (against baseline). This level of savings is worthwhile but the sketchy reporting makes it difficult to draw clear conclusions about how the savings were achieved.
Kidd & Williams (2008) compared 10 households provided with clip-on ―Efergy‖ RTDs (installed and demonstrated by the researchers) with 10 control households. Historic feedback was available to the households but reported not to have been used. Each control household was taking weekly meter readings; trial households had their meters read four times over the trial, which lasted only a month (in early spring). The trial participants and some of the controls were residents in a village aiming to become the first carbon-neutral village in Wales, hence there may have been an element of community-level action influencing the trial group more than the control group. Also, the groups differed in their occupancy patterns and heating fuel (in particular, two of the trial group – but none of the control group – had electric heating). The trial group reduced electricity consumption by 9% during the trial, compared with an increase of 5% in the control group but, in light of the significant problems with the study design and sampling, these figures should be viewed very cautiously.
In a study for SenterNovem, UC Partners (2009) interviewed 18 volunteer Dutch households, provided them with energy advice and asked them to make weekly meter readings for three months in winter. These households reduced their electricity usage by 3% and gas by 2% (statistical significance was not tested but the difference is unlikely to have been significant with such a small sample). A further 18 households received the same intervention but also volunteered to set themselves a target for energy savings and accept a new design of RTD on trial (the ―PowerPlayer‖, a touch-screen RTD showing current, highest, lowest, monthly and yearly electricity and gas consumption and cost, plus conservation target and savings). This group reduced electricity usage by 4% and gas by 13%.
44 This suggests that gas consumption was reduced by 11% relative to the first group (and this was
statistically significant). However (a) either the savings target or the RTD (or the combination, as discussed earlier) might have been responsible, (b) the PowerPlayer group had higher baseline gas consumption, suggesting bias in volunteering for the trial and greater potential for savings and (c) the study sample was unrepresentative, having a mean age of 57.
Van Dam et al (2010) report electricity savings in 54 Dutch households using an RTD over a four-month trial period (Jun-Nov) and 11 months later. The RTD showed current power consumption, daily consumption (corrected for weekly pattern) and comparison with a target. The intervention also included self-reading of meters, online advice and a personal savings target, and there was no control group so the effect of the RTD cannot be assessed in
44 The reductions were 9% for electricity and 14% for gas after exclusion of two outliers not considered to be valid because the
―participants were, for various personal reasons, unable or unwilling to save energy during the test period‖. This exclusion is dubious because (a) the reasons are not clear, (b) such reasons would occur in a general deployment of RTDs and (c) it is not clear whether the other group was also screened for such outliers or either group was screened for special cases of households making extreme and unsustainable efforts to save energy, or more often than usual absent from the home.
AECOM Appendix C: Review of the Literature on Interventions used in EDRP 28
Capabilities on project:
Building Engineering
isolation. However, the sample was broken down into groups defined by their use of the device. One group (n=28) opted to hand in their RTDs after four months, in return for a €25 voucher. Those who kept the RTD were divided into those who reported using it daily (n=14) and those who did not (n=12). Savings were 3.9%, 16.7% and 6.3% in the first period for the three groups respectively, dropping to -1.0%, 7.8% and 1.7% in the follow-up.
Also in the Netherlands, van Houwelingen & van Raaij (1989) compared gas consumption with and without an RTD, under otherwise comparable interventions. Participants opted in but the take-up rate was 78%. Fifty renting households received energy advice and a savings target of 10% below baseline, and then self-monitored their gas consumption. Over a year, they saved 4.9% more gas than a control group of 55 households, compared with a full year baseline. Another group of 50 additionally received an RTD called the ―Indicator‖ showing daily gas use along with the weather-corrected target figure. The RTD also had a signal light to show when the heating was on. This group saved 12.1% (7.2% better). In neither group did the savings persist into the post-trial period.
Of these four studies, the last is the strongest but the Dutch studies together provide evidence that energy savings can be increased by adding an RTD to advice and an intervention that engages the household (self-monitoring of consumption and/or a savings target).
Outside the European temperate region, an opt-in pilot study by San Diego Gas & Electric (Deremer 2007) evaluated the impact of installing RTDs in 100 homes, along with advice, telephone calls and emails to reduce consumption during peak periods. Details are incomplete but it appears that the households were already on a time of use tariff. The sample all had high consumption, moderate to high air conditioning usage, pool pumps and electric water heating. Provisional savings against baseline were 13%.
Sexton et al (1987) report the effect of adding an RTD to the introduction of a time of use (TOU) tariff in California. Over a 10-month trial period, 51 households had the RTD and were compared with 412 that had only the TOU tariff. Households with the RTD tended to consume more electricity overall, possibly because feedback indicated how cheap it was during off-peak period, encouraging over-compensation for peak time savings.
In addition to the simple RTD trial in Ontario, as noted above, Hydro One (2008) included a group of 177 customers (69 residential, 12 farms) who moved to a time of use tariff package (including two compact fluorescent lights, a timer, energy saving advice, access to a website showing customer‘s daily consumption profiles, updated on a weekly basis, monthly feedback and $50 at end of programme). Over the May-September trial period, these customers reduced electricity consumption by 3.3%, compared with 6.7% savings for those receiving an RTD. A third group of 153 (142 residential, 9 farm & 2 small general service customers), receiving both interventions, saved 7.6% (making the incremental effect of the RTD 4.3%).
In Florida, Parker et al (2008) gave Energy Detective RTDs to 17 self-selected households, along with a partial audit (the exact process is unclear but seems to have involved a breakdown of electricity use by end use, but no advice on what to do). Data from 2 million customers provided a weather correction factor but not a complete control. During a year of using the device, electricity consumption was reduced by 7.4% but this figure is almost certainly inflated by the research method.
An Australian study (Weatherall 2009) claims savings of 15% for electricity and 18% for gas (against baseline, over a 12-month period) in a study mainly focused on water conservation at a time of severe drought. However, it is difficult to attribute these savings to the RTD (ecoMeter) because of the lack of a control group, biased sample (some were employees of the utility undertaking the study) and multiple interventions (community meeting, information pack on the programme, website, training in use of the RTD, "support" from the utility, tailored seasonal tips and prizes for reducing consumption). The Australian ―Home Energy Efficiency Trial‖ (Country Energy 2006) reported 8% median savings from a critical peak pricing (CPP) programme with RTDs but this level of savings might be attributed at least partly to the CPP (see Section C9).

AECOM Appendix C: Review of the Literature on Interventions used in EDRP 29
Capabilities on project:
Building Engineering
Web-based real-time feedback
In Sweden, Ersson & Pyrko (2009c) studied the effects of a supplier web service that provided both real-time and hourly consumption feedback. Users of the service had unchanged consumption, as did non-users over the same period.
45 It may be noted that two comparable schemes (Ersson & Pyrko 2009a,b) that provided only historic
feedback found large increases in consumption but little should be concluded from this, given the difficulties interpreting the other two studies (as noted in Section C3).
As noted in Section C4, PA Consulting (2010) reported 9.3% savings in a trial that included web-based real-time feedback, in addition to information and training, web‐based access to monthly information on 'use and demand', and savings, in kWh, $ and CO2, comparison of consumption with a "cohort customer group" and opportunities to learn about and sign up for energy-saving activities. Given the intensive combination of interventions, it is impossible to say which one or combination was responsible for the observed savings.
Studies of students
Student housing represents a different context to housing in general, not simply because of the different demographic but because energy is generally a fixed charge, facilities tend to be shared and any trial tends to take the form of a community trial, whether intended or not. Nevertheless, some insights can be gained from experiments that have been conducted in this context – to inform the wider roll-out of smart meters and to provide specific evidence for roll-out in university premises.
The ecoMeter, used in several EDRP trials, includes display of electricity and gas consumption in real time and also for the previous 24 hours, week or month. A ‗traffic lights‘ display shows whether current electricity demand is high, medium, or low.
46 There is little published research as yet into the use of the ecoMeter but Black et al (2009)
employed it in a study of student residences in Australia. The ecoMeter47
was deployed in 18 student ―cottages‖ (eight students per cottage) and energy consumption monitored for 7 weeks in the first phase of the study. Electricity savings were ~14% overall, against 14 control cottages, but differed between type of cottage: 24% (p<0.01) in one type and only 4% in the other, where there were more electrical appliances. Over the same period, a separate group of 15 cottages (all of the first type) received a social marketing intervention consisting of a set of posters on different energy savings topics, shower timers, night lights (to reduce the need to switch on full lighting when coming and going at night) and weekly feedback reports. This group made savings of 17% (p<0.01).
In the second phase of the study (8 weeks), the social marketing was shifted towards heating and cooling use, and the posters consolidated into a single poster, fixed to the inside of toilet doors. Savings then increased to 28%. The social marketing was also extended to the group with ecoMeters, resulting in savings of 26% and 14% in the two groups – a marked increase in the cottages with extra electrical appliances.
In the third phase, (11 weeks), feedback on control cottages added to weekly report and the group with ecoMeters received a room thermometer. Savings in the social marketing group dropped a little to 24% and in the ecoMeter group the two types of cottage achieved more similar savings of 22% and 17%.
45 Nominally there were 400 users (i.e. those given access to the service) but only 73 were confirmed as users in a survey.
Confirmed non-users were 58, so total users numbered between 73 (18%) and 342 (86%), with a survey-based estimate of 55.7%. There was also a control group of 100 customers. It is not clear whether ―users‖ and ―non-users‖ were only those who responded to the survey or a larger number, based on website monitoring.
46 The traffic lights can also be used to indicate the current unit cost of electricity if the customer is on a time-of-use tariff but this
facility was not used in EDRP.
47 The report suggests that real-time feedback was displayed only for electricity.

AECOM Appendix C: Review of the Literature on Interventions used in EDRP 30
Capabilities on project:
Building Engineering
Savings may be summarised as follows.
Group Phase 1 Phase 2 Phase 3
Social marketing 17% 28% 24%
ecoMeter 24%
ecoMeter, extra electrical appliances 4%
ecoMeter + social marketing 26% 22%
ecoMeter + social marketing, extra electrical appliances 14% 17%
Overall, electricity savings can be said to have been achieved through the ecoMeter but, where electricity usage was greater, further support was needed to achieve savings. There is also a message about the form of advice and a warning that providing comparative data does not always help.
The picture for gas consumption is different. In the first phase, both groups increased consumption relative to controls (by 95%) in the ecoMeter group in cottages with extra electrical appliances; this may be attributed to problems with the smart meters feeding data to the researchers. In the second and third phases, savings were as follows.
Group Phase 2 Phase 3
Social marketing 3% 22%
ecoMeter + social marketing 13% 19%
ecoMeter + social marketing, extra electrical appliances 18% 34%
The ecoMeter appears to have been beneficial in both cottage types in Phase 2 but only in one type in Phase 3. This is consistent with the earlier observation that combining an RTD with other interventions appears to be more effective for gas than for electricity consumption. The comparative feedback delivered in Phase 3 may be responsible for the increased savings; alternatively, the students may simply have become more practiced at reducing gas demand. There is also the consideration that a single alteration of heating controls may have a substantial and long-lasting effect.
In Ohio, Petersen et al (2007) set up a two-week electricity-saving competition in 16 college residences with non-electric heating. One group (1612 students) received advice and feedback – weekly meter readings in the middle and at the end of the competition (expressed as kWh and emissions of CO2 and oxides of sulphur and nitrogen). A second group (202 students) received ―high-resolution‖ web-based feedback (it is not clear whether this was real-time or previous day). Savings, compared with a three-week baseline period, were very high at 31% and 55% for the two groups, respectively. This suggests that the precision of feedback was important. It is also interesting to note that the competition prize was a party that only 10% of the winning students attended: the competition appears to have been more important than the prize.
Alarms
One EDRP trial used the audible alarm function of an RTD This intervention applied a standard feature of the device but fixed the alarm threshold so that the household could not adjust it. The RTD checked daily electricity usage at 18:00 each day against usage on the same day of the previous year. The alarm threshold was set at 6% below the previous year‘s usage, the aim being to encourage the customer to reduce electricity consumption.
There are no directly comparable trials in the literature but some findings that are relevant, providing support generally for the use of ‗ambient‘ signals to customers. Notably, the RTD used by Allen & Janda (2006) – the TED –
AECOM Appendix C: Review of the Literature on Interventions used in EDRP 31
Capabilities on project:
Building Engineering
had a usage alarm but none of the participants used it. This might be because the alarm was not of interest; alternatively, the TED has been considered over-complex and difficult to understand, which could result in some features being not discovered or not used.
Several studies have used a visible indicator of high usage (in relation to a baseline or target), similar to the ecoMeter ―traffic lights‖, and observed that trial participants found this useful as a signal to take action (Black et al 2009, UC Partners 2009). The Energy Orb (Martinez & Geltz 2005; CNT Energy 2008) is aimed at households on variable tariffs (in parts of the USA) – it changes colour according to the current price band and can flash in advance of a period of ‗critical peak‘ pricing (see Section C9). In contrast to audible alarm, it appears to have the benefits of signalling specific opportunities to save money (by bringing forward or delaying energy-intensive activities) while being continuously noticeable yet aesthetically accepted.
Seligman et al (1978) used a visible signal for a different purpose (to indicate that the air conditioning could be turned off) and it may be that this more specific meaning of the signal is more helpful: the group with the signal reduced electricity consumption by 16% whereas the group without it achieved only 7% savings. In similar vein, van Houwelingen & van Raaij (1989) used an RTD signal light simply to show when the heating was on; the RTD increased savings by 7.2% but there is no evidence that this specific function of the RTD was responsible for the savings.
Thermometers
One EDRP trial provided participants with an alternative feedback device, i.e. a room thermometer. Although this was not done in a way that allows any independent impact of the thermometer to be determined, it is interesting because it is simple but unusual in the literature. Only Black et al (2009) did specifically this, in a student population (see above) and – again – in a way that makes it impossible to determine any independent effect. Gas consumption was reduced but comparative data were provided at the same time as the thermometer and this reduced consumption by a similar or greater amount in a group that did not receive thermometers.
Some RTDs used in EDRP included a temperature display so these trials might be deemed to have provided a thermometer, although users would need to switch screens to access this facility. The PowerCost Monitor also includes a temperature display but most studies of RTDs have used this device (see Table C4) so it is difficult to discern how important it is in terms of energy saving.
Participants in the studies by Ueno et al (2005) and Winett et al (1982a) also had access to indoor temperature data, but not in a way that allows evaluation of independent effects.
In short, a thermometer may be a simple and effective feedback device but there is insufficient evidence to say whether it actually has any effect.
Evidence from householder responses
The direct evidence about the impact of RTDs on energy consumption is supplemented by analysis of responses given by householders in surveys (using interviews or self-completion questionnaires) and focus groups. Some of the evidence comes from the studies already reviewed but other research produced only survey evidence. Yet other studies have used a qualitative approach to explore the ideal design of RTDs. Householder responses can help to explain why an intervention did or did not succeed in reducing energy consumption (e.g. whether the RTD was understood and used). Such evidence can also identify where an intervention has had an effect that was too late in the trial period to have an impact on energy consumption, or not likely to affect consumption during the season when the trial was conducted (e.g. installation of insulation in summer or towards the end of a trial).

AECOM Appendix C: Review of the Literature on Interventions used in EDRP 32
Capabilities on project:
Building Engineering
While all this is true in principle, there are two difficulties in practice.
People are imperfect ―instruments‖ – we have excellent flexibility in collecting data, retrospectively reorganising and recalling data we never expected to have to recall, and can be interrogated interactively to refine our ―output‖. On the negative side, we suffer from poor calibration, data corruption and multiple data downloading problems. The consequence is that the answers we give to apparently simple questions are heavily context-dependent and sometimes difficult to interpret in a scientific way, especially where the question calls for evaluation or for anticipation of future actions, as distinct from mere recall. Therefore, the overview below focuses on reports of actual past behaviour and specific current preferences (passing over the almost universal finding that most people who have experienced using an RTD offer positive general feedback).
The behavioural responses to RTDs that are possible and sensible will depend heavily on the local climate and dwelling design and facilities. The clearest example of this is that householder responses that involve either air conditioning or managing months of sub-zero outdoor temperatures are of little relevance to the UK. The review below therefore has a geographic bias towards the temperate regions. It is also true that older studies, even those in the UK, may be of little relevance because Building Regulations, appliances and consumer understanding are all developing rapidly. This limitation is of little practical consequence because RTDs are themselves a relatively recent arrival but anyone reading this review when it is five years old should probably skip this section.
Intervention studies that collected survey data
Of the RTD trials in the UK, only Kidd & Williams (2008) report associated survey data. Although the study sample was small (10 households) and highly self-selected, the survey findings are worth reviewing. Even if they cannot be taken as representative of the UK population, they identify a number of issues that need to be considered in interpreting RTD intervention studies.
Along with a large average reduction in electricity consumption (14%), the authors report that the RTD ―had a dramatic effect on people‘s understanding and awareness of the electricity they use in their everyday lives and activities. Seeing the readings jump up and down as appliances were switched on or off had the biggest effect on people‘s thinking and stimulated conscious changes in the ways they used [lights and appliances]. It also encouraged them to turn devices off when not in use‖. The authors also point out a risk arising from this effect: that the visual impact of brief use of high wattage appliances may distract from the potentially large consumption due to extended use of lower wattage appliances. This risk is made greater because the feedback is not appliance-specific.
Beyond the initial impact of ―seeing‖ consumption for the first time, some participants then went on to think about their consumption, discuss it and explain it to their children.
In a further stage of user application, specific uses of electricity could be identified and the related behaviour modified. This included a quite comprehensive range of appliances.
One specific strategy was to use the RTD to check whether everything was switched off at night.
However, none of the participants used the RTD to track their overall usage over the four-week trial period and only two used the facility to make week-on-week comparisons.
The RTD was said to have most impact among those who used it most and where discretionary energy usage was high and there was strong motivation for environmental or cost reasons.
Two out of the 10 households did not use the RTD at all – in one case because they had not understood how to use it and in the other case because they were too busy.
The final point is particularly worrying in a sample that was highly self-selected and interested in having the RTD. In studies from outside the UK, there is also evidence of this. Boice (2009) tested five different types of RTD in 95
AECOM Appendix C: Review of the Literature on Interventions used in EDRP 33
Capabilities on project:
Building Engineering
Nevada households, over six months. While there was generally high participant satisfaction with the displays, a significant proportion were “not served well” by mere distribution and installation of devices, without further customer support. After six months experience, 12% of respondents did not know how to use the device. Even in the Ontario trial, where energy demand was successfully reduced (Rossini 2009), 11% of participants did not install the RTD and a further 4% did not use it, having installed it.
Hence the first barrier to RTDs being effective is to have them actually installed and used, which makes the installation process critical to their success. But it is not just about assuring installation. Sipe & Castor (2009) installed RTDs in one group but left the installation to the householder in the other. At the start of the study, 98% of RTDs were installed and in use in both groups. Nevertheless, after six months, only 66% were still in use in the self-installation group, 64% in the other group.
UC Partners (2009) tested the SenterNovem ‗PowerPlayer‘ RTD, which has some of the characteristics of the Anderson & White (2009) ideal display (see below), including an analogue ‗speedometer‘ to show real-time electricity consumption. It covers gas as well as electricity usage, gives historic as well as real-time feedback, and allows the householder to compare progress each day against a self‐set target. The device was said to be easy for participants to understand and, as in the Kidd & Williams (2008) study, prompted discussion in the household and parents used it to explain energy consumption to their children. Users found that the PowerPlayer ―functioned as a coach‖, motivating them to apply known conservation strategies by showing the effect. This is supported by van Houwelingen & van Raaij (1989) who report that the main use of the RTD they tested was to monitor the effects of efforts to reduce consumption. The important implication is that the RTD can be more effective in maintaining conservation behaviour than initiating it.
Participants in the UC Partners study preferred to use power rather than the cost units, because costs did not coincide with those on the bill and because energy was ‗out of the influence zone‘ of their supplier, while prices were not. Current power was thought most useful, to ‗test‘ individual appliances, followed by the annual target indicator (especially in single-person households), monthly historic figure and minimum/maximum figures. The authors conclude that the RTD gave ―direct insight [into energy use], with no maths needed, instantly. It confronts people with the fact that energy is being consumed, and shows what appliances/behaviours are responsible‖. A range of actual changes in behaviour were reported but without any overall change in reported environmental motivation. Although the RTD was consulted less often as time went on, this was because it had done its job of identifying the energy consumption of specific appliances; the benefit of having consulted it was more persistent. The report also states that the PowerPlayer was less useful for people with low environmental motivation. A control group, matched for other interventions and motivation to conserve energy, made smaller reductions in energy use and found the process ‗unrewarding‘.
Another useful insight is that participants thought they were less likely to use the same display facilities if they were provided via a PC because of the extra time and trouble in accessing the display, and the reliance on a good internet connection. Weatherall (2009) also reports that participants preferred their RTD to the website that also provided (unspecified) information.
As noted earlier, van Dam et al (2010) report electricity savings in 54 Dutch households trialling an RTD over a four-month period (Jun-Nov) and 11 months later. The survey data were critical in showing that the magnitude of savings depended on the persistence and intensity of households‘ use of the device: whether they kept it after the initial four-month trial and whether they had a habit of checking it daily (as also seen in Nevada by Boice 2009). The surveys also showed that the most common use of the RTD was to check it before going to bed, other uses being to check it before going out or while using a particular appliance or space. The authors suggest that such routines could be built into the instructions for using RTDs. The RTD was most often placed in the living room, followed by the kitchen. The most common actions were turning off lights and appliances and installing energy-efficient lights.
AECOM Appendix C: Review of the Literature on Interventions used in EDRP 34
Capabilities on project:
Building Engineering
Trials without consumption data
Hargreaves et al (2010) report on semi-structured interviews with 15 ‗early adopter‘ householders trialling three models of Green Energy Options (GEO) RTDs in the UK. The users‘ motivations for acquiring an RTD varied, and their expectations of the device varied accordingly. Those who were motivated primarily by saving money expressed disappointment that they were not saving more money and frustration that rising unit prices meant energy savings were not fully translated into money savings. Householders with more environmental motivation were the only ones who reported their domestic energy-saving behaviour spilling over into other areas, such as transport. A third group, motivated primarily by acquiring information, were frustrated with simple RTDs and wanted interactive displays with multiple options for presenting information. The final group, with a focus on the technology itself as a ‗new gadget‘, were most concerned about the aesthetics of the device. The implication of this is that there is not a single way of getting households to use an RTD or to focus that use on energy savings. The match between the way the device is presented to potential users, and the main motivation of the target group, may be a critical factor in the success of interventions. Taking this a step further, it may be critical for installers to have a small set of options for how to present the device to different households.
The same study provides insight into interaction with RTDs.
For most households, cost has a more immediate meaning than kWh or CO2 but this depends on someone knowing and being able to programme in their unit costs.
The dominant way of using the devices was reactive – seeing a high reading and turning appliances down or off in response. This implies that households had a nominal baseline level of consumption that was acceptable or normal. In fewer cases, households planned daily routines and purchases in response to the feedback, sometimes extending into strategic lifestyle choices. Least common was to extend energy savings from domestic into other energy use contexts or to seek to influence friends and family.
A balance needs to be struck between two modes of presentation that will fail to motivate change: cost savings that look trivial – pennies per day – and unrealistically huge savings based on projections from an appliance such as a kettle being used for a few minutes to what it would cost to run for a whole day.
Indications of consumption against a target level can be helpful if someone is trying to reduce consumption but can be a source of stress if money is very tight – a constant reminder of money being spent.
Two of the models allowed appliance-specific monitoring, the third required users to experiment by turning appliances on and off. Either way, this was a key value of the RTDs, allowing relative consumption to be established, especially in the initial period of using the RTD.
RTDs need to fit the aesthetics and use of the home. A design that relied on a netbook for the display scored less well in this regard.
The usual design of RTDs may be gender-biased, appealing more to men.
Household members will not all agree about using the RTD or how to respond to the feedback.
The study also emphasised that the opportunities for change are not limitless (and this applies generally – not only to RTDs): householders express four general ‗stopping points‘.
Certain appliances are seen as simply necessary – some that are common (e.g. kettles, washing machines), some specific but unarguable (e.g. medically related), others that are non-negotiable to the particular household but would have little importance to most others (e.g. fish tanks).
Similarly, there are certain activities or daily patterns of life that people see as a normal aspect of life and comfort, which they should not have to change.
Household energy use is normally social and negotiated (for example, over thermostat settings), not a purely individual matter.

AECOM Appendix C: Review of the Literature on Interventions used in EDRP 35
Capabilities on project:
Building Engineering
External support may be needed but unavailable (or difficult to access), for example to inform purchase choices or to establish norms in relation to comparable households, or to obtain planning permission for more substantial installations.
Preferred design
The design of the displays was also explored in the focus groups held by Anderson & White (2009). Like Kidd & Williams, they found that the impact of actually using an RTD was greater than simply being told about energy use. Like Hargreaves et al, they observed how householders developed a sense of a normal baseline and responses to feedback, ranging from the immediate reactive to the more strategic. A range of family dynamics in energy decisions was also clear.
The focus groups employed a ―user-centred design‖ approach in which 38 householders formed five demographically defined focus groups. Each group first developed its ideal design of RTD, then tried out one of seven existing models of RTD for a week before coming together again to agree final designs. The following design principles were agreed.
Changing values are poorly served by numeric displays. Although participants valued the accuracy of numbers,
they also recognised that a changing rate is better expressed as an analogue indicator.
Keep it simple. In all five focus groups, moves to add features or functionality were always countered by the many participants who wanted to prioritise simplicity.
A rate explained is complex; a rate experienced is intuitive. In their first design exercise, participants struggled with the concept of a rate, especially a rate of spend, and how to communicate it but their experience of using the displays rate dispelled these problems. The meaning of a rate of spend is quickly grasped in practice – participants drew analogies with a speedometer.
Everyone understands money. Watts, kilowatts and especially kilowatt-hours will are not universally understood or accepted as units of energy consumption. Money offers a straightforward alternative for both rate of consumption and historic consumption.
Interactivity is lost on those who are scared of losing what they have gained. Interactivity may be important for those who are keen to maximise the value of their displays but there will always be individuals who do not want to interact with the display for fear of losing the screen that they understand. Careful specification of the default mode of a display is therefore critical.
Mobility is valued, but for a limited period. Many participants valued being able to move around their homes with their displays when they first used them, working out the impact of different appliances. After this initial period, most were happy to leave the display in a prominent position in their home.
Different users have similar needs. Although there were many differences between and within the focus groups, these differences did not lead to fundamentally different solutions. Different people do want different things from their displays but there is a core of information a functionality desired by everyone. The study did not, however, explore the specific needs of people with visual or dexterity impairment.
The core specification associated with these principles was that the RTD should be mains powered but have an internal battery to enable mobility in the home, and the default display should include:
a clear analogue indicator of current rate of consumption;
current rate of consumption as a rate of spend in £ per day (numeric);
cumulative daily spend in £ (numeric).

AECOM Appendix C: Review of the Literature on Interventions used in EDRP 36
Capabilities on project:
Building Engineering
In addition, the display should offer access to the following options through interaction (by pressing a single button):
spend in the last seven days (day by day), and the last complete week, month and quarter (the periods matching the utility‘s billing periods);
switching units from money to power, i.e. from £ per day and £ to kilowatts and kilowatt-hours.
A clear decision was not reached on target-setting: it might be considered as part of the core specification but more evidence is needed of its value over a longer period of use, taking into account the cost of increased complexity.
Research using a similar method in Finland (Karjalainen 2011) reached overlapping conclusions, in spite of the obvious differences in climate and dwelling characteristics. The three features most valued by participants included presentation of costs (rather than power), over a period of time, and historic comparison. The third items was appliance-specific breakdown; this was not an option on any of the existing RTD designs considered by Anderson & White (2009) but was included in four of the eight prototypes reviewed by Karjalainen. Ehrhardt-Martinez et al (2010) also emphasise the value of such functionality. Anderson & White did, nevertheless, find that appliance-specific checking was a key behaviour and one that the participants would have liked to have been easier. On the coast of Massachusetts, trial participants saw a real-time feedback graph as the most interesting aspect of the RTD tested by PA Consulting (2010).
Going to another climatic extreme, households trialling RTDs in Nevada (Boice 2009) expressed a desire for devices that display costs (both whole-house and appliance-specific, current cost before historic comparison) and are cheap, simple to install and use, and require no maintenance.
It is, of course, possible that the design people say they would want is not the design that would bring about the greatest reduction in energy consumption. Nevertheless, it is a reasonable place to start and it is likely that opting for a radically different design would entail a need for greater investment in explaining the device and motivating people to use it.
Overview
In short, RTDs show promising results in the short to medium term, perhaps more so with already motivated customers but sometimes with householders who previously showed little interest. However, the displays can also cause frustration in people who cannot use the information to improve their situation, and they can cause conflict in the household, for example when one member wants to make changes in thermostat settings or appliance usage and another does not. There are challenges to widen the motivation to understand energy use, use RTDs as part of
wider programmes (e.g. community initiatives or retrofits), and maintain interest, e.g. through time‐varying tariffs.
The literature also gives some indication of who responds most positively to feedback. The extensive review of North American trials by Ehrhardt-Martinez et al (2010) makes the following key points.
Most of the energy savings from feedback programmes arise from simple changes in routine behaviours, rather than investments.
Investment is more likely in higher income households and when moving into a new home.
Those who do invest tend to save most energy.
Higher levels of saving are associated with:
higher levels of education;
higher levels of income;
larger homes and households;
strong environmental values;

AECOM Appendix C: Review of the Literature on Interventions used in EDRP 37
Capabilities on project:
Building Engineering
younger people.
These conclusions are generally unsurprising and can easily be accounted for by a combination of the potential for saving (e.g. in larger homes), environmental awareness and motivation, and the resources to take action (both intellectual and financial).
Conclusion on RTDs
The impact of RTDs on energy demand is highly variable, depending on the design of the RTD itself, who is using it and how often. The evidence suggests that the uncertainty of impact can be reduced, and the positive impact increased, by combining provision of an RTD with other interventions – including energy efficiency advice but also something else. The ―something else‖ needs to engage the household with using the RTD, for example through a savings target, a time-varying tariff or some other reason to self-monitor consumption.
This conclusion depends heavily on research outside the UK, little of it being even from temperate climates so expected percentage savings in the UK are difficult to estimate. However, a base level effect of RTDs alone could be less than 3% electricity savings whereas supplementary interventions that increase engagement could double or triple the benefit. Far fewer studies have tested effects on gas consumption – they have generally show a benefit; while it is not feasible to quantify it, savings tend to be of a similar order to those for electricity.
It has been argued that targeting an RTD intervention on the households best equipped to use it (in terms of motivation and understanding) could multiply the benefit per household, although the total benefit would necessarily be reduced and a wider range of households could benefit if given some additional support. In any case, careful attention to RTD clarity and reliability remains important.
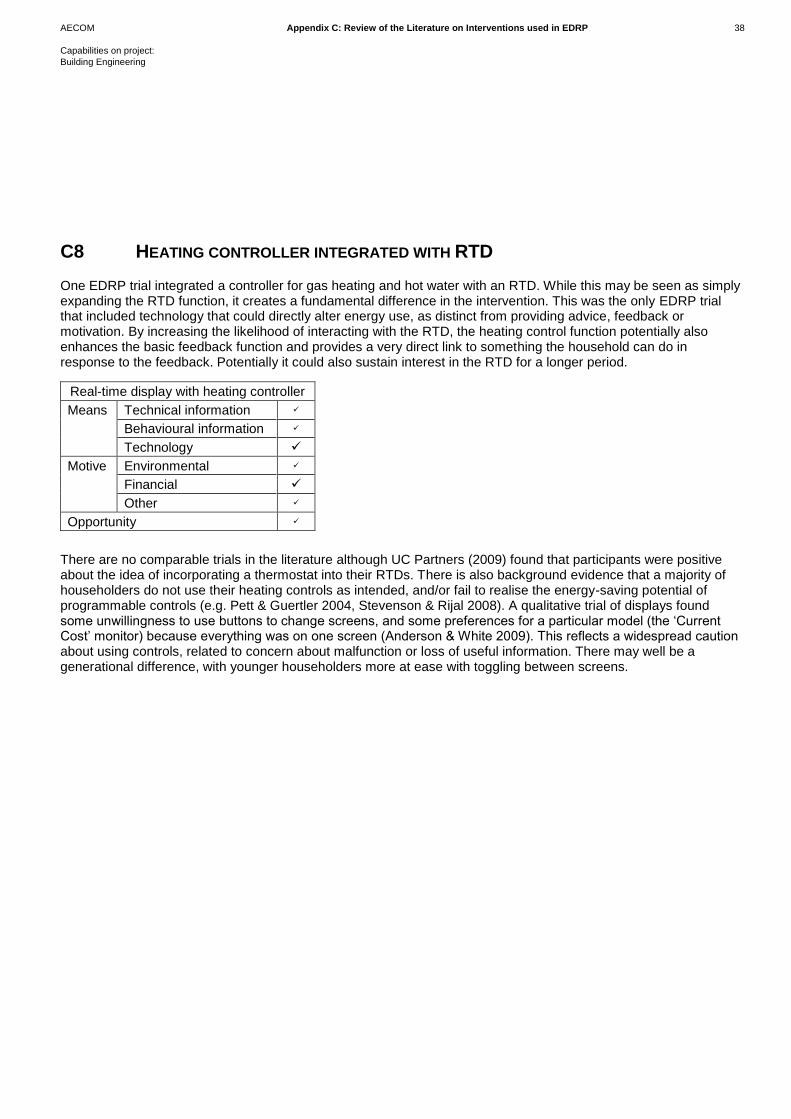
AECOM Appendix C: Review of the Literature on Interventions used in EDRP 38
Capabilities on project:
Building Engineering
C8 HEATING CONTROLLER INTEGRATED WITH RTD
One EDRP trial integrated a controller for gas heating and hot water with an RTD. While this may be seen as simply expanding the RTD function, it creates a fundamental difference in the intervention. This was the only EDRP trial that included technology that could directly alter energy use, as distinct from providing advice, feedback or motivation. By increasing the likelihood of interacting with the RTD, the heating control function potentially also enhances the basic feedback function and provides a very direct link to something the household can do in response to the feedback. Potentially it could also sustain interest in the RTD for a longer period.
Real-time display with heating controller
Means Technical information
Behavioural information
Technology
Motive Environmental
Financial
Other
Opportunity
There are no comparable trials in the literature although UC Partners (2009) found that participants were positive about the idea of incorporating a thermostat into their RTDs. There is also background evidence that a majority of householders do not use their heating controls as intended, and/or fail to realise the energy-saving potential of programmable controls (e.g. Pett & Guertler 2004, Stevenson & Rijal 2008). A qualitative trial of displays found some unwillingness to use buttons to change screens, and some preferences for a particular model (the ‗Current Cost‘ monitor) because everything was on one screen (Anderson & White 2009). This reflects a widespread caution about using controls, related to concern about malfunction or loss of useful information. There may well be a generational difference, with younger householders more at ease with toggling between screens.
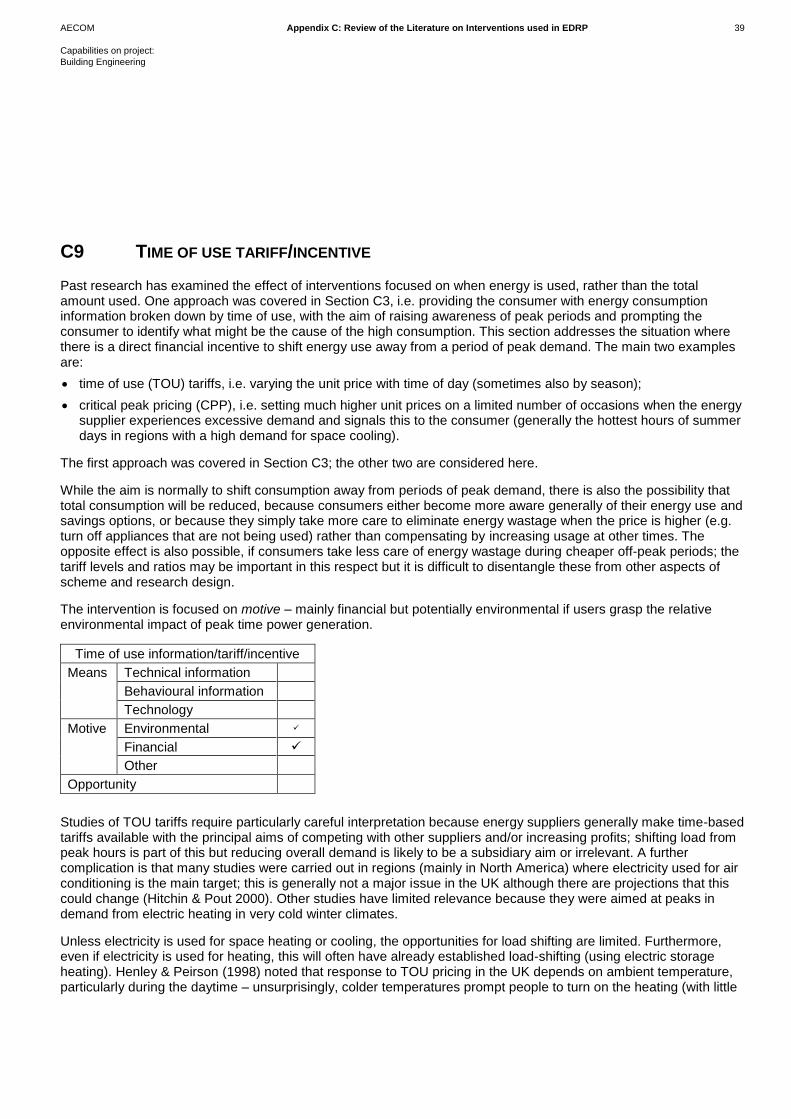
AECOM Appendix C: Review of the Literature on Interventions used in EDRP 39
Capabilities on project:
Building Engineering
C9 TIME OF USE TARIFF/INCENTIVE
Past research has examined the effect of interventions focused on when energy is used, rather than the total amount used. One approach was covered in Section C3, i.e. providing the consumer with energy consumption information broken down by time of use, with the aim of raising awareness of peak periods and prompting the consumer to identify what might be the cause of the high consumption. This section addresses the situation where there is a direct financial incentive to shift energy use away from a period of peak demand. The main two examples are:
time of use (TOU) tariffs, i.e. varying the unit price with time of day (sometimes also by season);
critical peak pricing (CPP), i.e. setting much higher unit prices on a limited number of occasions when the energy supplier experiences excessive demand and signals this to the consumer (generally the hottest hours of summer days in regions with a high demand for space cooling).
The first approach was covered in Section C3; the other two are considered here.
While the aim is normally to shift consumption away from periods of peak demand, there is also the possibility that total consumption will be reduced, because consumers either become more aware generally of their energy use and savings options, or because they simply take more care to eliminate energy wastage when the price is higher (e.g. turn off appliances that are not being used) rather than compensating by increasing usage at other times. The opposite effect is also possible, if consumers take less care of energy wastage during cheaper off-peak periods; the tariff levels and ratios may be important in this respect but it is difficult to disentangle these from other aspects of scheme and research design.
The intervention is focused on motive – mainly financial but potentially environmental if users grasp the relative environmental impact of peak time power generation.
Time of use information/tariff/incentive
Means Technical information
Behavioural information
Technology
Motive Environmental
Financial
Other
Opportunity
Studies of TOU tariffs require particularly careful interpretation because energy suppliers generally make time-based tariffs available with the principal aims of competing with other suppliers and/or increasing profits; shifting load from peak hours is part of this but reducing overall demand is likely to be a subsidiary aim or irrelevant. A further complication is that many studies were carried out in regions (mainly in North America) where electricity used for air conditioning is the main target; this is generally not a major issue in the UK although there are projections that this could change (Hitchin & Pout 2000). Other studies have limited relevance because they were aimed at peaks in demand from electric heating in very cold winter climates.
Unless electricity is used for space heating or cooling, the opportunities for load shifting are limited. Furthermore, even if electricity is used for heating, this will often have already established load-shifting (using electric storage heating). Henley & Peirson (1998) noted that response to TOU pricing in the UK depends on ambient temperature, particularly during the daytime – unsurprisingly, colder temperatures prompt people to turn on the heating (with little
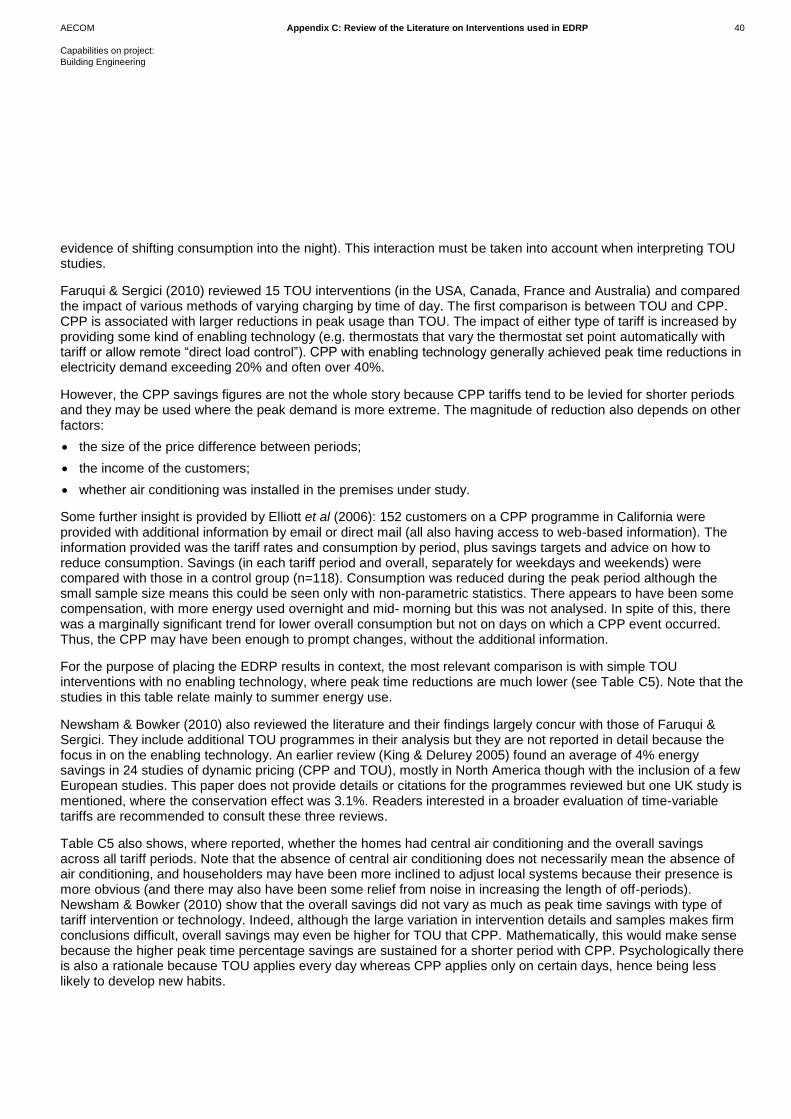
AECOM Appendix C: Review of the Literature on Interventions used in EDRP 40
Capabilities on project:
Building Engineering
evidence of shifting consumption into the night). This interaction must be taken into account when interpreting TOU studies.
Faruqui & Sergici (2010) reviewed 15 TOU interventions (in the USA, Canada, France and Australia) and compared the impact of various methods of varying charging by time of day. The first comparison is between TOU and CPP. CPP is associated with larger reductions in peak usage than TOU. The impact of either type of tariff is increased by providing some kind of enabling technology (e.g. thermostats that vary the thermostat set point automatically with tariff or allow remote ―direct load control‖). CPP with enabling technology generally achieved peak time reductions in electricity demand exceeding 20% and often over 40%.
However, the CPP savings figures are not the whole story because CPP tariffs tend to be levied for shorter periods and they may be used where the peak demand is more extreme. The magnitude of reduction also depends on other factors:
the size of the price difference between periods;
the income of the customers;
whether air conditioning was installed in the premises under study.
Some further insight is provided by Elliott et al (2006): 152 customers on a CPP programme in California were provided with additional information by email or direct mail (all also having access to web-based information). The information provided was the tariff rates and consumption by period, plus savings targets and advice on how to reduce consumption. Savings (in each tariff period and overall, separately for weekdays and weekends) were compared with those in a control group (n=118). Consumption was reduced during the peak period although the small sample size means this could be seen only with non-parametric statistics. There appears to have been some compensation, with more energy used overnight and mid- morning but this was not analysed. In spite of this, there was a marginally significant trend for lower overall consumption but not on days on which a CPP event occurred. Thus, the CPP may have been enough to prompt changes, without the additional information.
For the purpose of placing the EDRP results in context, the most relevant comparison is with simple TOU interventions with no enabling technology, where peak time reductions are much lower (see Table C5). Note that the studies in this table relate mainly to summer energy use.
Newsham & Bowker (2010) also reviewed the literature and their findings largely concur with those of Faruqui & Sergici. They include additional TOU programmes in their analysis but they are not reported in detail because the focus in on the enabling technology. An earlier review (King & Delurey 2005) found an average of 4% energy savings in 24 studies of dynamic pricing (CPP and TOU), mostly in North America though with the inclusion of a few European studies. This paper does not provide details or citations for the programmes reviewed but one UK study is mentioned, where the conservation effect was 3.1%. Readers interested in a broader evaluation of time-variable tariffs are recommended to consult these three reviews.
Table C5 also shows, where reported, whether the homes had central air conditioning and the overall savings across all tariff periods. Note that the absence of central air conditioning does not necessarily mean the absence of air conditioning, and householders may have been more inclined to adjust local systems because their presence is more obvious (and there may also have been some relief from noise in increasing the length of off-periods). Newsham & Bowker (2010) show that the overall savings did not vary as much as peak time savings with type of tariff intervention or technology. Indeed, although the large variation in intervention details and samples makes firm conclusions difficult, overall savings may even be higher for TOU that CPP. Mathematically, this would make sense because the higher peak time percentage savings are sustained for a shorter period with CPP. Psychologically there is also a rationale because TOU applies every day whereas CPP applies only on certain days, hence being less likely to develop new habits.
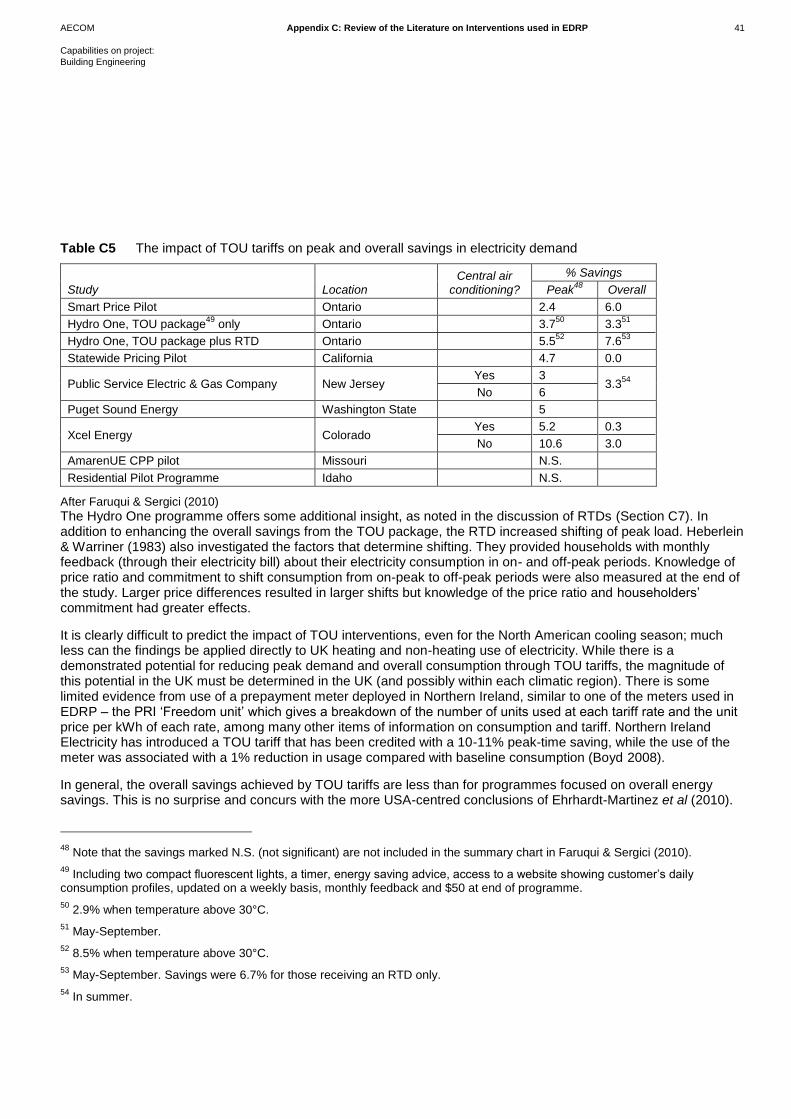
AECOM Appendix C: Review of the Literature on Interventions used in EDRP 41
Capabilities on project:
Building Engineering
Table C5 The impact of TOU tariffs on peak and overall savings in electricity demand
Study Location Central air
conditioning?
% Savings
Peak48
Overall
Smart Price Pilot Ontario 2.4 6.0
Hydro One, TOU package49
only Ontario 3.750
3.351
Hydro One, TOU package plus RTD Ontario 5.552
7.653
Statewide Pricing Pilot California 4.7 0.0
Public Service Electric & Gas Company New Jersey Yes 3
3.354
No 6
Puget Sound Energy Washington State 5
Xcel Energy Colorado Yes 5.2 0.3
No 10.6 3.0
AmarenUE CPP pilot Missouri N.S.
Residential Pilot Programme Idaho N.S.
After Faruqui & Sergici (2010)
The Hydro One programme offers some additional insight, as noted in the discussion of RTDs (Section C7). In addition to enhancing the overall savings from the TOU package, the RTD increased shifting of peak load. Heberlein & Warriner (1983) also investigated the factors that determine shifting. They provided households with monthly feedback (through their electricity bill) about their electricity consumption in on- and off-peak periods. Knowledge of price ratio and commitment to shift consumption from on-peak to off-peak periods were also measured at the end of the study. Larger price differences resulted in larger shifts but knowledge of the price ratio and householders‘ commitment had greater effects.
It is clearly difficult to predict the impact of TOU interventions, even for the North American cooling season; much less can the findings be applied directly to UK heating and non-heating use of electricity. While there is a demonstrated potential for reducing peak demand and overall consumption through TOU tariffs, the magnitude of this potential in the UK must be determined in the UK (and possibly within each climatic region). There is some limited evidence from use of a prepayment meter deployed in Northern Ireland, similar to one of the meters used in EDRP – the PRI ‗Freedom unit‘ which gives a breakdown of the number of units used at each tariff rate and the unit price per kWh of each rate, among many other items of information on consumption and tariff. Northern Ireland Electricity has introduced a TOU tariff that has been credited with a 10-11% peak-time saving, while the use of the meter was associated with a 1% reduction in usage compared with baseline consumption (Boyd 2008).
In general, the overall savings achieved by TOU tariffs are less than for programmes focused on overall energy savings. This is no surprise and concurs with the more USA-centred conclusions of Ehrhardt-Martinez et al (2010).
48 Note that the savings marked N.S. (not significant) are not included in the summary chart in Faruqui & Sergici (2010).
49 Including two compact fluorescent lights, a timer, energy saving advice, access to a website showing customer‘s daily
consumption profiles, updated on a weekly basis, monthly feedback and $50 at end of programme.
50 2.9% when temperature above 30°C.
51 May-September.
52 8.5% when temperature above 30°C.
53 May-September. Savings were 6.7% for those receiving an RTD only.
54 In summer.
AECOM Appendix C: Review of the Literature on Interventions used in EDRP 42
Capabilities on project:
Building Engineering
The implication is that the aim of an intervention – demand reduction or load shifting – needs to be clear and guided firmly by the local or national priorities.
Peters et al (2009) conducted a further two‐year trial of TOU pricing in 286 California households, more focused on understanding householders‘ response to TOU tariffs. This was an opt-in trial (take-up rate ~1%) and the participants were motivated principally by the prospect of cutting costs. They found minimal change in response to price signals, although over half of the householders interviewed said that they had made great efforts to respond. The qualitative research gives some clues as to why price signals were so ineffective. Neither the new tariff nor the additional interventions of information and RTDs seem to have added much new information or motivation. The researchers also found relatively low willingness to make any substantial load reduction; for example, nearly half the
sample were not willing to change from tumble dryers to line‐drying. There was also evidence of the tariff structure being over-complicated and of some perceived loss of comfort and family tensions, caused by attempts to shift usage or conserve. The authors concluded that:
future rates should be designed to make sense to customers (rather than economic theory), recognise the efforts that householders make to shift load and minimise household disruption;
bills should show effects of load‐shifting on cost;
major end‐uses should be targeted for programmes, not minor ones that take effort and have relatively little impact.
The above studies examine the impact of TOU interventions. There is also evidence on customers‘ willingness to take up TOU tariffs and this is instructive in considering possible biases in research samples. Unless there is a safeguard in the tariff against the total bill rising, a TOU tariff has the effect of the customer taking a risk. A cost-benefit analysis of the implementation of smart meters in Australia (over a period of 20 years) concluded that a bill saving of 10% or more is required to achieve a general shift to a TOU tariff, although savings of 5-10% will sway a significant majority of customers (and a minority will shift for 0-5% savings).55 This inertia is not unique to TOU tariffs – following deregulation of energy supply in the UK, a majority of customers accepted a substantial price differential between their current supplier and a potential new supplier before changing supplier (Giuletti et al 2003).
55 Respond Study on Smart Metering in Australia (2009).
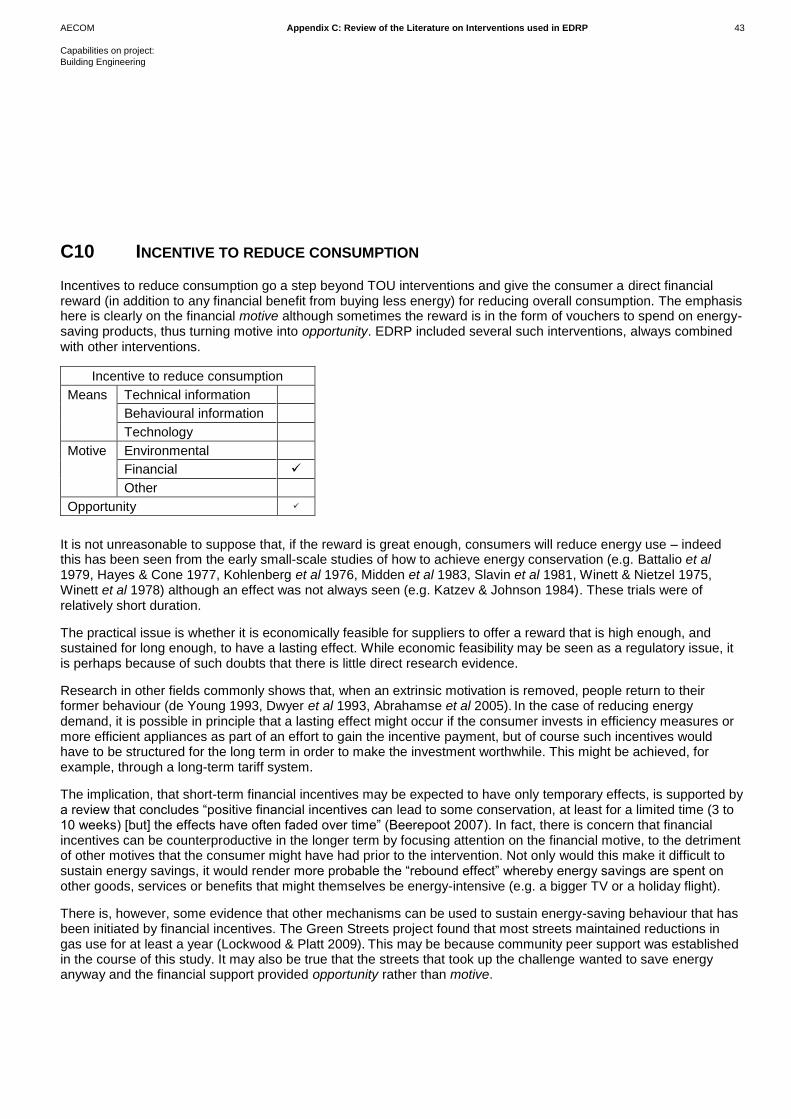
AECOM Appendix C: Review of the Literature on Interventions used in EDRP 43
Capabilities on project:
Building Engineering
C10 INCENTIVE TO REDUCE CONSUMPTION
Incentives to reduce consumption go a step beyond TOU interventions and give the consumer a direct financial reward (in addition to any financial benefit from buying less energy) for reducing overall consumption. The emphasis here is clearly on the financial motive although sometimes the reward is in the form of vouchers to spend on energy-saving products, thus turning motive into opportunity. EDRP included several such interventions, always combined with other interventions.
Incentive to reduce consumption
Means Technical information
Behavioural information
Technology
Motive Environmental
Financial
Other
Opportunity
It is not unreasonable to suppose that, if the reward is great enough, consumers will reduce energy use – indeed this has been seen from the early small-scale studies of how to achieve energy conservation (e.g. Battalio et al 1979, Hayes & Cone 1977, Kohlenberg et al 1976, Midden et al 1983, Slavin et al 1981, Winett & Nietzel 1975, Winett et al 1978) although an effect was not always seen (e.g. Katzev & Johnson 1984). These trials were of relatively short duration.
The practical issue is whether it is economically feasible for suppliers to offer a reward that is high enough, and sustained for long enough, to have a lasting effect. While economic feasibility may be seen as a regulatory issue, it is perhaps because of such doubts that there is little direct research evidence.
Research in other fields commonly shows that, when an extrinsic motivation is removed, people return to their former behaviour (de Young 1993, Dwyer et al 1993, Abrahamse et al 2005). In the case of reducing energy demand, it is possible in principle that a lasting effect might occur if the consumer invests in efficiency measures or more efficient appliances as part of an effort to gain the incentive payment, but of course such incentives would have to be structured for the long term in order to make the investment worthwhile. This might be achieved, for example, through a long-term tariff system.
The implication, that short-term financial incentives may be expected to have only temporary effects, is supported by a review that concludes ―positive financial incentives can lead to some conservation, at least for a limited time (3 to 10 weeks) [but] the effects have often faded over time‖ (Beerepoot 2007). In fact, there is concern that financial incentives can be counterproductive in the longer term by focusing attention on the financial motive, to the detriment of other motives that the consumer might have had prior to the intervention. Not only would this make it difficult to sustain energy savings, it would render more probable the ―rebound effect‖ whereby energy savings are spent on other goods, services or benefits that might themselves be energy-intensive (e.g. a bigger TV or a holiday flight).
There is, however, some evidence that other mechanisms can be used to sustain energy-saving behaviour that has been initiated by financial incentives. The Green Streets project found that most streets maintained reductions in gas use for at least a year (Lockwood & Platt 2009). This may be because community peer support was established in the course of this study. It may also be true that the streets that took up the challenge wanted to save energy anyway and the financial support provided opportunity rather than motive.

AECOM Appendix C: Review of the Literature on Interventions used in EDRP 44
Capabilities on project:
Building Engineering
Rewards for reducing consumption are necessarily linked to a target for reducing consumption, even if the target is a minimal change and easy to achieve. Hence the financial incentive effect is confounded with a possible target-setting effect: people can be motivated by succeeding in a challenge without any extrinsic reward (see Section C5).
A possibility that has not been explored in research is that smart meters (and associated feedback) could make consumers more aware of energy prices and hence more responsive to price changes or offers, making financial incentives (or the negative equivalent – price rises) more effective in reducing demand.
AECOM Appendix C: Review of the Literature on Interventions used in EDRP 45
Capabilities on project:
Building Engineering
C11 OVERVIEW OF WEB-BASED INTERVENTIONS
The web is not an intervention as such but is a rapidly developing medium for delivery of a range of types of intervention. Therefore, it is worth taking an overview of its potential.
Most supplier websites provide information on energy efficiency so it is difficult to evaluate the impact of that by making any comparisons. Karbo & Larsen (2005) report on a website that provided advice partly tailored to the household. It was estimated that users would achieve savings of around 10% if the advice was followed in full. This relates to a highly self-selected group of customers who were presumably more interested in potential savings than those who did not follow through this advice option; it is an open question whether they are also predisposed to take action, but the exercise does offer some quantitative evidence on the potential for supplying advice via the web.
Section C3 reviewed attempts to provide online historic consumption feedback, generally combining feedback with other services. The reported impact has been highly variable, partly because the reporting rarely follows a normal scientific pattern but also because the online services vary greatly. Ersson & Pyrko (2009a,b) were unable to show any overall benefit of the Swedish web sites they reviewed (in fact they had to explain some negative effects). In contrast, a more comprehensive online service from Danish energy cooperative SEAS-NVE reports average savings of 17% from an online service which, in addition to feedback, provides advice, incentives, competitions, a lottery for customers who supply their own meter readings, a newsletter, and other interaction with the cooperative. Between these two extremes, a study in the Netherlands (Benders et al 2006) reports savings of 4.3% (for combined in domestic and transport energy) by a self-selected experimental group with web-based feedback on consumption and savings achieved against a target, together with tailored advice (compared with a control group that had a reduced version of the web tool with no advice, target or feedback on savings).
Web-based feedback in support of a real-time pricing scheme in Chicago (Isaacson et al 2006, Star et al 2006) resulted in energy savings of 3-4% in a hot summer, with air conditioning being a major factor in demand. Similarly, Elliott et al (2006) report an overall reduction in consumption when a critical peak pricing (CPP) scheme was supported by a website providing tariff rates and consumption by period, plus savings targets and advice on how to reduce consumption. This is a clue to where web services might be most effective – where a more complex energy management demand benefits from additional information. Section C7 identified three reports of web services combined with use of an RTD – in each case, the website was part of a wider package of measures so its independent effect is difficult to discern, but there were substantial energy savings in each case. In one case (Weatherall 2009), the website appears to have been a small part of a broad package of measures but the other two again involved time-varying tariffs, either time of use (Hydro One 2008) or CPP (Country Energy 2006).
Fewer studies have reported on the provision of real-time feedback via the web but these are also reviewed in Section C7. In Sweden, Ersson & Pyrko (2009c) report that users of such a service had unchanged consumption, as did non-users over the same period. In contrast, two schemes (Ersson & Pyrko 2009a,b) that provided only historic feedback found large increases in consumption but little should be concluded from this, given the difficulties interpreting the other two studies (as noted in Section C3). PA Consulting (2010) reported 9.3% savings in a trial that included web-based real-time feedback, in addition to information and training, monthly feedback on use and savings, comparison of consumption with a "cohort customer group" and opportunities to learn about and sign up for energy-saving activities. Given the intensive combination of interventions, it is impossible to say which one or combination was responsible for the observed savings.
The huge range of outcomes reflects the general variation in outcomes – regardless of the medium used for interventions – in addition to the different web site characteristics, customer populations, climates and ways in which customers interacted with the sites. While it does seem likely that many customers achieved energy savings as a result of web-based interventions, it is impossible to deduce what the essential ―active ingredients‖ are or what the
AECOM Appendix C: Review of the Literature on Interventions used in EDRP 46
Capabilities on project:
Building Engineering
optimum web-based feedback would look like. Neither is it possible to say that the web worked better than other delivery media for the same type of intervention.
The most direct comparison of written and web-based feedback comes from an electricity-saving competition for students Petersen et al (2007) – see Section C7. One group received ―high-resolution‖ web-based feedback (it is not clear whether this was real-time or previous day); energy savings by this group far exceeded those of a group that were provided with weekly meter readings. While the precision of feedback was probably more important than the medium, the precision would not have been feasible without using the web. This is perhaps the key point – not that the web has greater impact for a given intervention but rather that it creates new possibilities.
The important differences between paper-based and web-based information are probably that the latter is (a) a more active process for consumers than passively receiving printed material, (b) more able to provide tailored information and advice to the individual user, to support response to feedback and (c) more easily and immediately linked to options for action to reduce consumption and the resources for carrying out those actions. Creating the optimum web site for achieving energy savings will almost certainly mean combining various types of intervention – feedback, targeted advice, incentives, etc. The combinations have not been studied systematically but rather the sites have been designed on the basis of predicting the optimum combination – not purely for energy savings but for other customer and supplier benefits.
Certainly the web offers opportunities to bring together means, motive and opportunity in a way that would be hugely more resource-intensive through other media. In effect, this is what central organisations such as EST (in the UK) and co2online
56 (in Germany) seek to do. While the value of the overall operation may be assessed, it is difficult to
attribute any success to a particular aspect of the online function. Co2online, for example, has implemented several campaigns for households and communities, working with a wide range of commercial, government and NGO partners. Its services include online 'energy advisers' on 12 topics, an interactive 'energy savings account' with personalised monthly email feedback, and heating surveys. More generally, given the general limited use of most energy supplier websites, more use might be made of sites operated by other organisations (but possibly still offered by the supplier as a service to customers). The best-known UK example is probably the Google PowerMeter.
For web-based interventions – perhaps more than for other media – the right question might not be whether they work, but rather for whom they work. The most promising uses of the utility-based websites seem to be with particular subsets of the population and/or specific, focused programmes. Some people would not use web-based service at all, some would make limited use (e.g. to check consumption, but with no intention of reducing it) while others would make effective use of good websites to reduce consumption. Concern about data privacy is likely to be a consideration for some customers; for others, this will seem insignificant in relation to the information that they already exchange online. Alternatively, it may be that most people would use a web-based service but only at certain times, such as when moving to a new home or when there is a sharp rise in energy prices.
In considering targeted use of web sites, it is also important to pitch information at an appropriate level: making the sites simple and attractive for newcomers, offering an overview of basic information but with easy access to detail and tools for people who are actively researching (and seeking to reduce) their usage.
Participants in the study by UC Partners (2009) said they were less likely to use the display facilities of their RTD if they were provided via a PC because of the extra time and trouble in accessing the display, and the reliance on a good internet connection. Weatherall (2009) also reports that participants preferred their RTD to the website provided to customers. Therefore, the combination of web-based with other interventions could also be critical, e.g. using online data as a complement to RTDs rather than as a substitute. This possibility is enhanced with some
56 A non-profit limited liability company, part-funded by the German Federal Ministry for the Environment.
http://www.co2online.de/marginal-navigation/international.html

AECOM Appendix C: Review of the Literature on Interventions used in EDRP 47
Capabilities on project:
Building Engineering
displays, where users can download data from their display to a personal web page. The RTD is then used for immediate information, while the web-page can be used to supply graphics, a long view of consumption patterns, and the opportunity for detailed questioning of the data.
The range of ways to access web‐based energy information and tools is also developing rapidly, with applications now available via mobile phones, personal organisers, etc. An increasing proportion of the UK population engages routinely with some form of online material. In this context, there is a case for active research into the various web-based services on offer, to achieve a more robust assessment of their impact and how to optimise them for achieving energy savings and supporting the introduction of smart meters.
AECOM Appendix C: Review of the Literature on Interventions used in EDRP 48
Capabilities on project:
Building Engineering
C12 INTERVENTIONS NOT USED IN EDRP
In assessing the impact of the EDRP interventions, it is important to keep in mind that EDRP did not happen in a social, political, technical or commercial vacuum, and neither will the roll-out of smart meters. Other interventions have happened and will happen – as a deliberate attempt to reduce energy demand or coincidentally for reasons such as rising wholesale energy prices or the emergence of new technology. In particular, EDRP did not directly provide either the means to reduce energy demand (with one exception – the heating controller) or the opportunity (front-end time and money to make changes).
There is also, for some consumers at least, a gap in trust of suppliers: suppliers may be perceived – in the more cynical view – as those who charge too much, get bills wrong and are only interested in profit. The natural corollary of this is that suppliers should not be trusted to know what to do, to know how to do it, or to do it with the right motives. It simply does not make sense to many people that energy suppliers should want customers to use less energy. While there may be factual and rational rejoinders to all these points, support from parties seen as more independent, expert or ―friendly‖ can only aid the effectiveness of supplier-led interventions. Stern et al (1986) cite a study that used three forms of letter for an energy saving scheme - one on the company‘s letterhead with no mention of co-operation with the County Council, a second that went on company letterhead mentioning the County‘s role; and a third on County letterhead and signed by the chair of the County Board of Commissioners. Requests for energy audits came from 6%, 11% and 26% of recipients respectively.
This section briefly describes how interventions not already discussed might fill these gaps and make the interventions used in EDRP more effective. Conversely, some of these interventions may not be effective (or cost-effective) in themselves but their value may be increased by supporting the effectiveness of supplier-led measures.
Regulation
Both individual products and whole buildings are regulated and the regulations are constantly developing. This is intended to have a direct effect on the regulated premises or products but can also support other interventions. For example, consumers can become familiar with high standards and new technology (e.g. in friends‘ homes) and more ready to trust it and understand how to use it (Downing et al 2003).
Regulation can also support new products
going to market by creating mass demand to meet mandatory applications and thus reduce cost and increase their local availability for other applications (Beerepoot & Beerepoot 2007). Inclusion of a product or installation in regulations, or mention in an EPC report can also validate what energy suppliers say to customers.
Labelling and accreditation
Product labelling and accreditation of suppliers and installers is a step short of regulation but can also assist consumers in making decisions and identifying the products they want, in addition to validating the message from energy suppliers: the supplier provides the information, the label supplies the trust. This can be a surprisingly powerful factor. Installer accreditation, for example, has been calculated to have an implicit value of £400 for loft insulation and £580 for cavity wall insulation (Foresight 2008).
Subsidies, loans and grants
Subsidy by the energy suppliers or through public funding is now commonplace – CERT/CESP being perhaps the most relevant. These should not be seen as separate from information and feedback interventions but part of a whole package. The obvious effect of subsidies is that, if interventions such as advice, information and feedback create a motive to change, the means and opportunity may be readily available. Subsidies can also have a more subtle effect of ―validating‖ the means if consumers are doubtful as to whether it works.

AECOM Appendix C: Review of the Literature on Interventions used in EDRP 49
Capabilities on project:
Building Engineering
Education in school
Education has a key role to play – not just in explaining the science of climate change but in making the next generation better able and willing to reduce energy demand. It can have an immediate effect through children influencing their parents. In the ‗Energy Matters‘57 programme, parents rated their children (and advice from the school programme) as almost twice as influential as other sources of information on energy saving; 76% of parents changed their behaviour as a result of their children‘s involvement and 54% installed energy-saving measures (CSE 2003). Again, aligning educational messages and supplier activities may be mutually beneficial.
Other financial mechanisms
A multitude of financial levers have been tried, or at least mooted, each with some potential to bolster the effects of actions that suppliers can take. They include simple increases in the cost of energy, e.g. through a negotiated market ―price for carbon‖ (Reiss et al 2008, Woods 2008), and more complex mechanisms such as:
rising block prices (increasing the unit cost as a customer‘s consumption increases);
tax on energy or energy-inefficient products or homes;
tax credits (local or national) for investment in energy efficiency;
feebates (effectively a tax on energy or emissions combined with a supplementary rebate or fee, depending on how a product, dwelling or household‘s performance compares with a benchmark).
It is not the place of this report to support or oppose any such measures – merely to point out that there would be an interaction with the efforts of suppliers through interventions such as those used in EDRP.
57 The Energy Matters programme raises awareness of the importance of energy conservation in teachers, pupils and parents.
Pupils, supported by their parents and guardians, carry out home energy surveys, then analyse the data to take home recommendations for energy efficiency improvements.
AECOM Appendix C: Review of the Literature on Interventions used in EDRP 50
Capabilities on project:
Building Engineering
C13 CONCLUSIONS
C13.1 Introduction
This review sets the scene for viewing the EDRP findings on behaviour change (and consequent change in energy use) in the context of the wider literature on interventions to change energy-related behaviour in homes. The conclusions drawn here focus on that purpose and they therefore relate to the kinds of interventions used in EDRP, and to the situation in the UK.
58 This section does not cite the evidence directly – readers should refer to the
preceding sections to view the details of the evidence.
The conclusions should not be taken as applying generally to all contexts throughout the world. This focus is problematic insofar as much of the evidence comes from outside the UK and it has been necessary to make extrapolations and assumptions in order to draw conclusions about the UK. Other recent reviews (e.g. EPRI 2009, Ehrhardt-Martinez et al 2010) can be consulted for a wider perspective on the literature but neither was intended to interpret the findings in the context of the UK in general or the EDRP findings in particular.
The framework used is based on the means, motive and opportunity for change (Raw et al 2010).
The means is the technology (a characteristic of the building fabric or services) or behaviour that will lead to reduced energy use and/or carbon dioxide (CO2) emissions. This includes the person making the change having knowledge about current consumption and the technology or behaviour that would reduce consumption.
The motive is the reason why households will want to make the change.
The opportunity is the resource (e.g. time, space or money) to make the change.
In other words, for householders to reduce energy demand, they must know what to do, have a reason for doing it and have the resources to do it. Annex C1 explains the framework in more detail.
Table C6 shows the main contributions of each type of intervention. It is clear that no intervention offers the full package and that combinations therefore need to be designed that will complement each other. This is evidenced in specific cases in the following sections but the table allows other possibilities to be identified, particularly where supplementary interventions need to be identified to support a main intervention.
A literature review is subject to revision as new work is published – this is always true but particularly relevant to the current review, where a conclusion may depend on one or two key findings. In this situation, one contrary new finding can change the picture dramatically, which one would not expect to happen where a conclusion is supported by a large number of existing findings.
58 Other studies have also tested interventions that were not part of EDRP, such as regulation, labelling, accreditation, subsidies,
loans, grants, education, appeals, taxation and energy price structure. These are not reviewed in detail but it is important not to lose sight of them in the context of a complete package of options to maximise the energy-saving benefits of the smart meter roll-out.
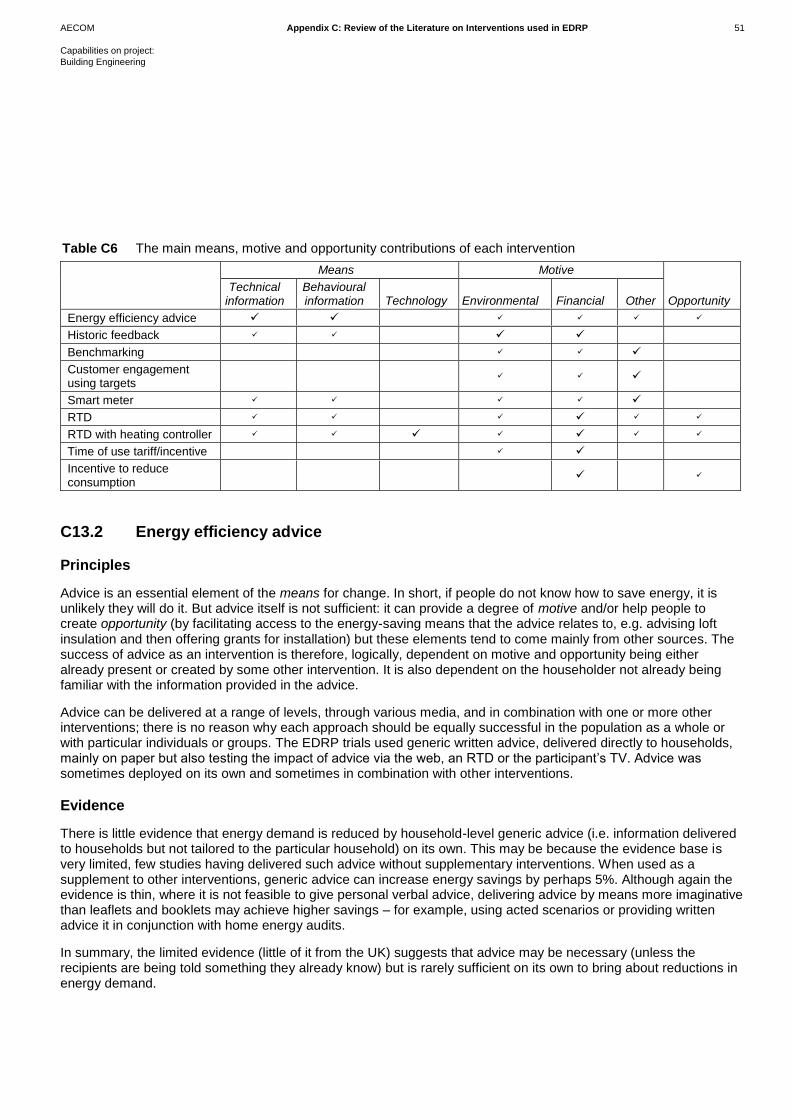
AECOM Appendix C: Review of the Literature on Interventions used in EDRP 51
Capabilities on project:
Building Engineering
Table C6 The main means, motive and opportunity contributions of each intervention
Means Motive
Opportunity Technical
information Behavioural information Technology Environmental Financial Other
Energy efficiency advice
Historic feedback
Benchmarking
Customer engagement using targets
Smart meter
RTD
RTD with heating controller
Time of use tariff/incentive
Incentive to reduce consumption
C13.2 Energy efficiency advice
Principles
Advice is an essential element of the means for change. In short, if people do not know how to save energy, it is unlikely they will do it. But advice itself is not sufficient: it can provide a degree of motive and/or help people to create opportunity (by facilitating access to the energy-saving means that the advice relates to, e.g. advising loft insulation and then offering grants for installation) but these elements tend to come mainly from other sources. The success of advice as an intervention is therefore, logically, dependent on motive and opportunity being either already present or created by some other intervention. It is also dependent on the householder not already being familiar with the information provided in the advice.
Advice can be delivered at a range of levels, through various media, and in combination with one or more other interventions; there is no reason why each approach should be equally successful in the population as a whole or with particular individuals or groups. The EDRP trials used generic written advice, delivered directly to households, mainly on paper but also testing the impact of advice via the web, an RTD or the participant‘s TV. Advice was sometimes deployed on its own and sometimes in combination with other interventions.
Evidence
There is little evidence that energy demand is reduced by household-level generic advice (i.e. information delivered to households but not tailored to the particular household) on its own. This may be because the evidence base is very limited, few studies having delivered such advice without supplementary interventions. When used as a supplement to other interventions, generic advice can increase energy savings by perhaps 5%. Although again the evidence is thin, where it is not feasible to give personal verbal advice, delivering advice by means more imaginative than leaflets and booklets may achieve higher savings – for example, using acted scenarios or providing written advice it in conjunction with home energy audits.
In summary, the limited evidence (little of it from the UK) suggests that advice may be necessary (unless the recipients are being told something they already know) but is rarely sufficient on its own to bring about reductions in energy demand.
AECOM Appendix C: Review of the Literature on Interventions used in EDRP 52
Capabilities on project:
Building Engineering
In principle, the effectiveness of advice should depend on the extent to which the originator is trusted (trusted to be reliable as to the facts, competent to deliver, honest in expression and transparent in motive). Hence, even the best designed advice could fail if the target audience does not trust the source. This makes it problematic to judge effectiveness merely from a description of its content and medium. While generalisations about Government and/or energy suppliers not being trusted can inform interpretation of research findings, they are not definitive. Nevertheless, the challenge for suppliers is certainly twofold – to convince customers that their advice can be trusted and to motivate customers to read and apply it.
C13.3 Historic feedback
Principles
While advice plays a key role in helping people to understand how to reduce energy use, another important ingredient is feedback, i.e. for consumers to know how much energy they have been using (and, ideally, when and how they have been using it). Historic feedback means access to past consumption data (where the past could be yesterday or last year). There are many permutations of how such feedback may be provided – it may vary in frequency, duration, immediacy, content (kWh, cost, CO2, etc.), breakdown (by time, space and appliance), medium (and details of the medium, such as aesthetics and simplicity of access or use), comparisons (historic or normative), and combination with other instruments. The standard quarterly billing procedure (often including estimates of consumption) or monthly identical payments (based on estimated annual consumption) do not give high grade feedback.
Benchmarking a customer‘s consumption against a sample of ―peer group‖ comparable homes is considered separately below although it is a form of historic feedback, because the dynamics of how it operates are distinct.
Real-time feedback is also discussed later. The distinction is important because, although there is a general finding that households take a positive view of feedback, it matters how detailed it is and how closely linked to specific actions, in time and in level of disaggregation. Logically, aggregated feedback (e.g. quarterly or annual consumption) is more relevant to one-off changes that have a persistent impact, such as installing insulation or upgrading a heating system. More fine-grain, real-time feedback is more relevant to routine behaviour and purchases of equipment used intermittently (e.g. washing machines, televisions). By extension, aggregated feedback may be more relevant to the fuel used for heating (most often gas) and real-time feedback to electricity.
EDRP tested several modifications to the information customers receive with (or about) their bills. Where a smart meter was not fitted, suppliers provided historic comparison data with bills or asked customers to read their own meters each month. With smart meters, a wider range of options was possible, including bills being more accurate and/or more frequent, and providing more detailed breakdown of consumption across the day or the year. The extra bill-related information was delivered variously on paper, via the web or through the customer‘s TV.
Such feedback serves mainly to enhance motive – specifically through raising consumers‘ awareness of their energy use and, potentially, indirectly through improving the relationship with the supplier. Consumers can also, in principle, use the information to provide the means, i.e. to identify technical or behavioural changes (e.g. buying a bigger TV or switching from baths to showers) that have contributed to a change in consumption. But this depends on having sufficient existing knowledge and motivation, in addition to time (even if only a little time is needed, it can represent an opportunity barrier).
The general assumption has been that feedback will allow a consumer to make better informed choices and, critically, that the consumer will choose to use less energy. However, consumers may instead decide that the energy costs are so low that it is not worth the effort to reduce consumption, and may even see that the cost is much lower than s/he previously thought, and it is therefore OK to use more energy. In any sample of households, it is
AECOM Appendix C: Review of the Literature on Interventions used in EDRP 53
Capabilities on project:
Building Engineering
possible that all three outcomes will occur in different households. Add to this the fact that people are not accustomed to getting historic comparison data and may be unsure what to do with it, and the uncertainty of impact increases. Furthermore, there are likely to be people who already think energy costs too much and therefore perceive enhanced billing information as ―rubbing it in‖ rather than being helpful.
Evidence
One clear characteristic of the effect of historic feedback is its variability. This variability is not surprising, given the wide range of forms and contexts of feedback.
Few past studies have quantified the effect of enhanced billing in isolation. This is logical from the perspective that billing in itself does not provide a complete means-motive-opportunity package. Furthermore, the evidence comes mainly from cold climates. Hence it is difficult to determine what a ―normal‖ impact would be for the purpose of comparison with EDRP. Fortunately, a range of other studies provide evidence on different aspects of what could, in theory, be achieved with enhanced billing. These studies fall into four main groups – studies of:
households given historic feedback on consumption as part of normal business but not with the bill;
households given web-based access to historic feedback on consumption;
households given historic feedback on consumption for research purposes;
households reading their own meters.
Taking the evidence as a whole, enhanced billing has the potential to reduce energy consumption but its effectiveness will depend on the details of the enhancement, the match to what customers want and understand, and the extent to which they are motivated to absorb and use the new information. The savings achievable from enhanced routine billing (at intervals of a month or more) appear to vary with national context: internationally, savings have been estimated at 5.5% energy savings but this seems optimistic in relation to routine monthly billing in the UK, 2-3% being more likely.
More frequent feedback (e.g. weekly) may achieve greater savings, particularly if householders are focusing for a limited period on making energy savings. While this may be impractical through the billing system, it could become feasible with wider use of smart meters and households having online access to their consumption data.
The alternative of encouraging householders to read their own meters and keep track of consumption may well be more effective. It is difficult to draw definitive conclusions from the literature because various combinations of interventions are involved, in various countries. However, the savings are generally more consistent than for studies without customer meter readings. The potential savings are perhaps up to 5% for electricity and more for gas. The difference between electricity and gas is consistent with the different levels of feedback granularity that are relevant to each, as noted above. It is not unreasonable to say that reading one‘s own meter is an active engagement with energy use that could both focus the mind of the customer and produce useful feedback, even if the reading is not used for billing purposes.
There may also be indirect benefits of enhanced billing. It can improve householders' sense of control over their energy costs, potentially leading to improved relations with energy suppliers, which might itself be a facilitator for other interventions.
Enhanced billing is relatively cheap to implement and can be deployed on an opt-out basis rather than opt-in, and could therefore be the most cost-effective type of feedback intervention. However, the distinction needs to be made between active opt-out (e.g. where someone declines the offer of enhanced billing) and passive opt-out (e.g. where additional billing information is received but not read). There are significant barriers to be overcome in delivering information with bills in such a way that customers notice, read, understand and apply the information. Attempts to

AECOM Appendix C: Review of the Literature on Interventions used in EDRP 54
Capabilities on project:
Building Engineering
deliver the information by other means have focused on the web but these have not yet been developed to point at which energy conservation benefits can be demonstrated.
C13.4 Benchmarking (comparative or normative feedback)
Principles
Benchmarking takes historic feedback a stage further, showing customers how their consumption compares with other households that are in some way comparable. While typically associated with historic feedback, it could in principle be incorporated into real-time feedback.
Such comparative feedback may provoke competition, social comparison or peer pressure. In doing so, it shifts the mechanism of action towards more socially based motive but leaves some scope for environmental and financial motive. Only one of the EDRP trials used benchmarking and not in isolation from other interventions.
Implementation of benchmarking faces three substantial issues.
A comparison group would ideally need to be households of the same composition, in a similar financial position, in a similar dwelling in a similar climate – this difficult to achieve (especially with the limited information available to energy suppliers). Furthermore, this fact is sufficiently obvious that customers may be suspicious about the validity of their comparison group (perhaps more so for gas because it depends too much on the amount of time spent at home and the characteristics of the home).
Households that are already below the benchmark values may find no reason to reduce consumption and might even increase consumption. This effect is perhaps best evidenced by success in eliminating it – there is evidence that negative impact may be overcome by use of simple normative messages or even minor changes in presentation such as the inclusion of ―smiley‖ icons with low users‘ bills.
The more subtle issue is that people tend to place normative information low on their list of what they believe influences their behaviour and yet it can be high on the list of what actually influences their behaviour. Hence, normative messages need to overcome people‘s belief that they are not influenced by them, which could lead to a tendency to ignore them.
Evidence
If these problems are well evidenced, there is less evidence on what works, since benchmarking tends to be combined with other interventions in a way that makes it difficult to isolate the effects. Both positive and negative effects, and no effect, have been observed and the evidence does not allow an estimate of likely savings to be calculated. In particular, there may be substantial differences in impact, depending on the household‘s political and environmental views.
Benchmarking might be more safely targeted by using groups that have something in common, e.g. because they have volunteered to join an online energy comparison group or local network.
C13.5 Customer engagement using targets
Principles
The EDRP trials included some testing of a commitment to reduce consumption (without a specific target or financial incentive to fulfil the commitment). The principal route of impact for this kind of commitment would be to reinforce any existing motive to save, and possibly to introduce a social motive in terms of the relationship between the customer and the supplier. The impact of financial incentives to save is discussed separately later.
AECOM Appendix C: Review of the Literature on Interventions used in EDRP 55
Capabilities on project:
Building Engineering
Evidence
There has been little theoretical impetus behind achieving savings through a general commitment to reduce consumption and, consequently, no clear evidence on what effect it is likely to have.
A few studies have given households an explicit savings target (without contingent financial reward, other than reduced energy costs). In most cases, the effect of the target cannot be isolated from other aspects of the intervention. In short-term trials, there is tentative evidence of a benefit of realistic but stretching targets, combined with frequent feedback but there is insufficient evidence to quantify such an effect.
Similarly to benchmarking, commitments and target-setting might be most effective within groups that have something in common, e.g. because they have volunteered to join an online energy comparison group or local network.
C13.6 Smart meters
Principles
Merely having a smart meter installed is a minimal reason to expect any change in consumption. The main point is that the meter allows a range of other interventions, as described elsewhere in this review. The question here is whether the experience of getting a smart meter can itself influence energy use. If the experience is simply being told that a replacement meter has been installed, somewhere out of sight, the consequences should be small. But this is not necessarily the total experience. In the course of the exercise, customers might experience:
being told they are among the first to get the latest technology;
renewed positive interaction with the supplier;
reassurance that the meter accommodation is now safer;
a friendly or unfriendly installer;
positive or negative attention from friends and neighbours;
informal energy advice from the installer.
If the smart meter is easier to read than the meter it replaces, householders may read it more often, which could itself have a positive impact on energy demand (especially for gas, since one-time adjustments to heating or hot water boilers or controls, or new insulation, can have long-lasting effects). There may be merit in encouraging this as part of smart meter installation; it would be perhaps the least ―high tech‖ application of smart meters but potentially one of the more effective in relation energy demand reduction.
Any of these factors might have some effect on householders‘ knowledge of means and/or their motive to save.
The EDRP trials did not set out to test installation effects but they arise through different approaches to recruitment and installation. The installation procedure, for example, ranged from trying to minimise any impression that the work was anything other than ―business as usual‖ or promoting minimal interaction between installer and householder, to training installers to demonstrate the installed technology to householders.
Evidence
There is, as yet, insufficient evidence in the literature to evaluate them the impact of the above factors; EDRP may itself give us the first leads.
AECOM Appendix C: Review of the Literature on Interventions used in EDRP 56
Capabilities on project:
Building Engineering
C13.7 Real-time display (RTD) devices
Principles
RTDs go a stage beyond historic feedback by showing the current rate of energy consumption, generally with the option of expressing this in kW, cost or CO2 emissions. They often have other functions such as displaying historic consumption for various periods, temperature displays, alarms and simple visual signals to indicate high consumption rates. RTDs range from battery-powered devices that clip on to the live cable of an electricity meter (smart or not) to relatively sophisticated mains-powered devices, showing both electricity and gas consumption by using the signal from smart meters. The latter type is also capable of greater accuracy. The EDRP trials represent all these options, alone or in various combinations with other interventions.
As noted earlier, RDTs are probably most relevant to routine behaviour and purchases of equipment used intermittently (e.g. washing machines, televisions). Householders can check the power consumption or cost of using an item, at a point in time or over a short period, and make informed decisions such as whether to turn something off or down, or replace it. Consumers might see, for example, the jump in power when a kettle or cooker is switched on, and the actual relative demand of household appliances – in use and on standby – which can be very different from what they had assumed or been led to believe. Consumers can also use RTDs to confirm the benefit of changes they have made.
In this way, RTDs can support:
means (by identifying what changes could be made) but only if the consumer understands how to do this, and has the knowledge to act upon observations;
motive (by showing how much energy is being used) but only if the consumer already has sufficient motivation to want to check energy use (and possibly also by engaging other motives such as using or showing off new technology);
opportunity (because they save householders time relative to taking a series of meter readings and calculating differences).
59
Thus, RTDs offer all three elements of change but incompletely in each case and, logically, depending on the extent to which households actually refer to them, particularly when they are first installed and there is most to learn. Generally, financial motivation is likely to be the strongest element.
As noted earlier, in any sample of households, the response to feedback may be choosing to use less energy but some consumers may decide that the energy costs are so low that it is not worth the effort, and other may even see that the cost is much lower than s/he previously thought, and it is therefore OK to use more energy.
Evidence
This review has drawn on extensive evidence from simple trials that compared households provided with an RTD with a control group that did not have real-time feedback, more complex trials that combined an RTD with other interventions and web sites that provided real-time feedback. Some evidence from studies of student accommodation is also used and two related types of real-time feedback are considered – usage alarms and thermometers. The evidence is based on both quantified energy savings and studies of user response to RTDs.
59 It could be argued that this is theoretical because householders generally do not use their meters in this way. The alternative
view is that the opportunity benefit accrues from the time required to make checks being shortened to the point where more householders do it at all. So, although householders then take more time for checking, this is because it is now seen as better value use of time.

AECOM Appendix C: Review of the Literature on Interventions used in EDRP 57
Capabilities on project:
Building Engineering
Energy demand
Most of the published research involves ‗clip‐on‘ RTDs, used without smart meters. One implication of this is that most studies have been of electricity consumption only, not gas. There are also some examples of studies using main-powered meters or real-time feedback via the web
Most of the research tends to focus on family homes that are owner‐occupied. Many used relatively small samples
and almost all were, to some extent, ‗opt‐in‘ trials or experiments. Opting in is likely to have some impact on the trial outcome. It is often assumed that people who opt in will be more ―enthusiastic‖ about saving energy and will therefore reduce consumption more as a result of the additional feedback. There is a counter-argument that enthusiasts will have already done much of what the RTD indicates they should do, hence they have less capacity to reduce consumption further. Therefore, the question of the experimental impact of opting in becomes an empirical one; while the evidence is not definitive, there does not appear to be a strong overall influence of the take-up rate in opt-in trials. Either way, it may be that the optimum target is people who have not yet taken much interest in conserving energy but who could be motivated in the process of providing an RTD and informed how to use the device to fulfil their newfound motivation.
The impact of RTDs on energy demand is highly variable, depending on the design of the RTD itself, who is using it and how often. The evidence suggests that the uncertainty of impact can be reduced, and the positive impact increased, by combining provision of an RTD with other interventions – including energy efficiency advice but also something else. The ―something else‖ needs to engage the household with using the RTD, for example through a savings target, a time-varying tariff or some other reason to self-monitor consumption.
This conclusion depends heavily on research outside the UK, little of it being even from temperate climates, so expected percentage savings in the UK are difficult to estimate. However, a base level effect of RTDs alone could be less than 3% electricity savings whereas supplementary interventions that increase engagement could double or triple the benefit. Far fewer studies have tested effects on gas consumption but they have generally shown a benefit; while it is not feasible to quantify it, savings tend to be of a similar order to those for electricity.
One caveat is that a small trial in California found a negative effect of providing an RTD to homes on a time of use tariff. This may be because feedback indicated how cheap electricity was during off-peak period, encouraging over-compensation for peak time savings.
There is little published evidence on the use of audible alarms or visible signals in tandem with RTDs. The limited evidence (generally qualitative) indicates that audible alarms tend not to be used but visible signals with clear meaning may be viewed positively and used as part of an energy-saving strategy. Examples in the literature are visual signals of high current usage (in relation to a baseline or target, similar to the ecoMeter ―traffic lights‖), the current price band (for households on variable tariffs), or to indicate that the heating was on or that the air conditioning could be turned off.
A thermometer may be a simple and effective feedback device but there is insufficient evidence to say whether it actually has any effect on energy demand.
Evidence on the provision of online real-time feedback is limited and, as yet, inconclusive.
It has been argued that targeting an RTD intervention on the households best equipped to use it (in terms of motivation and understanding) could multiply the benefit per targeted household, although the total benefit would necessarily be reduced and a wider range of households could benefit if given some additional support. In any case, careful attention to RTD clarity and reliability remains important.

AECOM Appendix C: Review of the Literature on Interventions used in EDRP 58
Capabilities on project:
Building Engineering
RTD design and use
The literature provides useful insight into how RTDs are used, including the display features that people find most useful. This insight could be incorporated into future RTD design and guidance. The following points can be made about how RTDs are used.
The first barrier to RTDs being effective is to have them actually installed, maintained in working order (e.g. by replacing batteries) and used, which makes the installation process and user guides critical to their success. But it is not just about assuring installation.
Most of the energy savings from feedback programmes arise from simple changes in routine behaviours, rather than investments.
A key use of RTDs is to identify specific uses of electricity so that related behaviour can be modified. For this reason, the option of appliance-specific monitoring is attractive.
Users can experience a strong impact of seeing readings jump up and down as appliances are switched on or off. An RTD‘s effectiveness may depend on users getting to this point. Guidance needs to manage the associated risk that the visual impact of brief use of high wattage appliances may distract from the potentially large consumption due to extended use of lower wattage appliances.
The impact of RTDs is extended where participants go on to discuss the issues raised with their children.
Being able to move around the home with an RTD is most useful when it is first acquired, working out the impact of different appliances. After this initial period, there is less concern about poertability and the display tends to be left in a prominent position in the home.
People will not reduce consumption for a particular application simply because the RTD shows that consumption is high: they have certain non-negotiable uses of energy.
A specific strategy is using an RTD to check whether everything is switched off at night. This application may have the most persistent benefit, after all appliances have been checked and usage monitored over a period.
While RTDs can be used to identify opportunities for savings, the more powerful use may be in confirming that actions to reduce energy demand have been successful: the RTD may be more effective in maintaining conservation behaviour than initiating it.
External support may be needed but unavailable (or difficult to access), for example to inform purchase choices or to establish norms in relation to comparable households, or to obtain planning permission for more substantial installations.
The RTD and its instructions need to be kept simple; while more sophisticated devices may be imagined, it is more important that users have easy access to the aspects of the display they find most useful and are most likely to use (and they can easily return to those aspects if they get lost in trying to access other information). The following points can also be noted.
Cost information tends to be the preferred display information, and the most easily understood, but tracking energy use over time – as costs change – probably needs users to refer to kW and kWh, even if they do not fully understand these units.
Both current and cumulative consumption figures have their different purposes.
Few people value display of CO2 emissions and, for any given household, they are of limited additional relevance because they are directly dependent on the energy used.
Indications of consumption against a target level can be helpful if someone is trying to reduce consumption but can be a source of stress if money is tight – a constant reminder of money being spent.
Although accurate numbers are important, a rapidly changing rate is better expressed as an analogue indicator.

AECOM Appendix C: Review of the Literature on Interventions used in EDRP 59
Capabilities on project:
Building Engineering
But different market sectors have different preferences for RTD design and display features, giving priority variously to saving money, environmental benefit, acquiring and manipulating data and the ‗new gadget‘ itself with technological and aesthetic appeal. Taking this a step further, it may be critical for installers to have a small set of options for how to present a device to different households. The literature also gives some indication of who responds most positively to feedback:
investment is more likely in higher income households and when moving into a new home;
those who do invest tend to save most energy;
higher savings are associated with higher levels of education; higher levels of income; larger homes and households; strong environmental values; and younger people.
In short, RTDs show promising results in the short to medium term, perhaps more so with already motivated customers but sometimes with householders who previously showed little interest. However, the displays can also cause frustration in people who cannot use the information to improve their situation, and they can cause conflict in the household, for example when one member wants to make changes in thermostat settings or appliance usage and another does not. There are challenges ahead to widen the motivation to understand energy use, to use RTDs
as part of wider programmes (e.g. community initiatives or retrofits), and to maintain interest, e.g. through time‐varying tariffs.
C13.8 Heating controller integrated with RTD
Principles
One EDRP trial integrated a controller for gas heating and hot water with an RTD. While this may be seen as simply expanding the RTD function, it creates a fundamental difference in the intervention. This was the only EDRP trial that included technology that could directly alter energy use, as distinct from providing advice, feedback or motivation. By increasing the likelihood of interacting with the RTD, the heating control function potentially also enhances the basic feedback function and provides a very direct link to something the household can do in response to the feedback. Potentially it could also sustain interest in the RTD for a longer period.
Evidence
There are no comparable trials in the literature although participants in one study were positive about the idea of incorporating a thermostat into their RTDs. There is also background evidence that a majority of householders do not use their heating controls as intended, and/or fail to realise the energy-saving potential of programmable controls. A qualitative trial of displays found some unwillingness to use buttons to change screens, and some preferences for a particular model because everything was on one screen. This reflects a widespread caution about using controls, related to concern about malfunction or loss of useful information. There may be a generational difference, with younger householders more at ease with toggling between screens.
C13.9 Time of use tariff/incentive
Principles
Research has examined the effect of various interventions focused on when energy is used, providing a direct financial incentive to shift energy use away from a period of peak demand. The main two examples are:
time of use (TOU) tariffs, i.e. varying the unit price with time of day (sometimes also by season);
AECOM Appendix C: Review of the Literature on Interventions used in EDRP 60
Capabilities on project:
Building Engineering
critical peak pricing (CPP), i.e. setting much higher unit prices on a limited number of occasions when the energy supplier experiences excessive demand and signals this to the consumer (generally the hottest hours of summer days in regions with a high demand for space cooling).
While the aim is normally to shift consumption away from periods of peak demand, there is also the possibility that total consumption will be reduced, because consumers either become more aware generally of their energy use and savings options, or because they simply take more care to eliminate energy wastage when the price is higher (e.g. turn off appliances that are not being used) rather than compensating by increasing usage at other times. The opposite effect is also possible, if consumers take less care of energy wastage during cheaper off-peak periods; the tariff levels and ratios may be important in this respect but it is difficult to disentangle these from other aspects of tariff scheme and research design.
The intervention is focused on motive – mainly financial but potentially environmental if users grasp the relative environmental impact of peak time power generation.
Evidence
Most studies have been carried out in regions (mainly in North America) where electricity used for air conditioning is the main target; this is generally not a major issue in the UK at present. Other studies have limited relevance because they were aimed at peaks in demand from electric heating in very cold winter climates.
Unless electricity is used for space heating or cooling, the opportunities for load shifting are limited. Furthermore, even if electricity is used for heating, this will often have already established load-shifting (using electric storage heating). Response to TOU pricing in the UK depends on ambient temperature, particularly during the daytime – unsurprisingly, colder temperatures prompt people to turn on the heating (with little evidence of shifting consumption into the night). This interaction must be taken into account when interpreting TOU studies.
CPP is associated with larger reductions in peak usage than TOU tariffs but TOU is more relevant to the current purpose. The impact of either type of tariff is increased by providing some kind of enabling technology (e.g. thermostats that vary the thermostat set point automatically with tariff or allow remote ―direct load control‖). Again, this is less relevant than simple TOU tariffs in the context of EDRP.
Studies of summer energy use in North America have shown peak time savings of between 2.4% and 10.6%, and overall savings from small negative values up to 6% but typically around 3%. One UK study found an overall conservation effect of 3.1%. Another reported a 1% reduction in usage compared with baseline consumption but with no control group comparison.
Overall savings do not vary as much as peak time savings with type of tariff intervention or technology. Indeed, although the large variation in intervention details and samples makes firm conclusions difficult, overall savings may even be higher for TOU that CPP. Mathematically, this would make sense because the higher peak time percentage savings are sustained for a shorter period with CPP. Psychologically there is also a rationale because TOU applies every day whereas CPP applies only on certain days, hence being less likely to prompt development of new habits.
It is clearly difficult to predict the impact of TOU interventions, even for the North American cooling season; much less can the findings be applied directly to UK heating and non-heating use of electricity. While there is a demonstrated potential for reducing peak demand and overall consumption through TOU tariffs, the magnitude of this potential in the UK must be determined in the UK (and possibly within each climatic region).
In general, the overall savings achieved by TOU tariffs are less than for programmes focused on overall energy savings. This is no surprise and the implication is that the aim of an intervention – demand reduction or load shifting – needs to be clear.
AECOM Appendix C: Review of the Literature on Interventions used in EDRP 61
Capabilities on project:
Building Engineering
C13.10 Incentive to reduce consumption
Principles
Incentives to reduce consumption go a step beyond TOU interventions and give the consumer a direct financial reward (in addition to any financial benefit from buying less energy) for reducing overall consumption. The emphasis here is clearly on the financial motive although sometimes the reward is in the form of vouchers to spend on energy-saving products, thus turning motive into opportunity. EDRP included several such interventions, always combined with other interventions.
Evidence
It is not unreasonable to suppose that, if the reward is great enough, consumers will reduce energy use – indeed this has been seen from the early small-scale studies of how to achieve energy conservation, which were of relatively short duration. The practical issue is whether it is economically feasible for suppliers to offer a reward that is high enough, and sustained for long enough, to have a lasting effect. It is perhaps because of such doubts that there is little direct research evidence.
Research in other fields commonly shows that, when an extrinsic motivation is removed, people return to their former behaviour. In the case of reducing energy demand, it is possible in principle that a lasting effect might occur if the consumer invests in efficiency measures or more efficient appliances as part of an effort to gain the incentive payment, but of course such incentives would have to be structured for the long term in order to make the investment worthwhile.
The implication, that short-term financial incentives may be expected to have only temporary effects, is supported by the limited evidence but there is also concern that financial incentives can be counterproductive in the longer term by focusing attention on the financial motive, to the detriment of other motives that the consumer might have had prior to the intervention. Not only would this make it difficult to sustain energy savings, it would render more probable the ―rebound effect‖ whereby energy savings are spent on other goods, services or benefits that might themselves be energy-intensive (e.g. a bigger TV or a holiday flight).
There is, however, some evidence that other mechanisms can be used to sustain energy-saving behaviour that has been initiated by financial incentives, specifically community peer support. It may also be safer to target households that already motivated to save energy but lack the resources to invest in their goal, i.e. to use financial support to provide opportunity rather than motive.
Rewards for reducing consumption are necessarily linked to a target for reducing consumption, even if the target is a minimal change and easy to achieve. Hence the financial incentive effect is confounded with a possible target-setting effect: people can be motivated by succeeding in a challenge without any extrinsic reward.
A possibility that has not been explored in research is that smart meters (and associated feedback) could make consumers more aware of energy prices and hence more responsive to price changes or offers, making financial incentives (or the negative equivalent – price rises) more effective in reducing demand.
C13.11 Overview of web-based interventions
The web is not an intervention as such but is a rapidly developing medium for delivery of a range of types of intervention. Therefore, it is worth taking an overview of its potential.

AECOM Appendix C: Review of the Literature on Interventions used in EDRP 62
Capabilities on project:
Building Engineering
The important differences between paper-based and web-based information are probably that the latter is (a) a more active process for consumers than passively receiving printed material, (b) more able to provide tailored information and advice to the individual user, to support response to feedback and (c) more easily and immediately linked to options for action to reduce consumption and the resources for carrying out those actions. Certainly the web offers opportunities to bring together means, motive and opportunity in a way that would be hugely more resource-intensive through other media. The key point is not that the web has greater impact for a given intervention (and there is insufficient evidence on whether this is true) but rather that it creates new possibilities.
Creating the optimum web site for achieving energy savings will almost certainly mean combining various types of intervention – feedback, targeted advice, incentives, etc. The combinations have not been studied systematically but rather the existing sites have been designed on the basis of predicting the optimum combination – not purely for energy savings but for other customer and supplier benefits. The reported impact has been highly variable, partly because the reporting rarely follows a normal scientific pattern but also because the online services vary greatly.
The huge range of outcomes reflects the general variation in outcomes – regardless of the medium used for interventions – in addition to the different web site characteristics, customer populations, climates and ways in which customers interacted with the sites. While it does seem likely that many customers achieve energy savings as a result of web-based interventions, it is impossible to deduce what the essential ―active ingredients‖ are or what the optimum web-based feedback would look like.
The right question might not be whether web-based interventions work, but rather for whom do they work? The most promising uses of the utility-based websites seem to be with particular subsets of the population and/or specific, focused programmes. Some people would not use web-based service at all, some would make limited use (e.g. to check consumption, but with no intention of reducing it) while others would make effective use of good websites to reduce consumption. Concern about data privacy is likely to be a consideration for some customers; for others, this will seem insignificant in relation to the information that they already exchange online. Alternatively, it may be that most people would use a web-based service but only at certain times (e.g. when moving to a new home or when there is a sharp rise in energy prices) or in certain contexts (e.g. where a more complex energy management demand, such as complex tariffs, benefits from additional information).
In considering targeted use of web sites, it is also important to pitch information at an appropriate level: making the sites simple and attractive for newcomers, offering an overview of basic information but with easy access to detail and tools for people who are actively researching (and seeking to reduce) their usage.
The relationship between RTDs and web-based feedback also needs to be considered. User feedback suggests that the web is not a good substitute for RTDs in relation to their prime function of real-time feedback: using a PC for this takes extra time and trouble and relies on a good internet connection. RTDs are also more portable and more convenient to leave in rooms such as kitchens and utility rooms. This implies that online data should be seen as a complement to RTDs rather than as a substitute, especially if users can download data from their display to a personal web page. The RTD is then used for immediate information, while the web-page can be used to supply graphics, a long view of consumption patterns, and the opportunity for detailed exploration of the data.
The range of ways to access web‐based energy information and tools is developing rapidly, with applications now available via mobile phones, personal organisers, etc. An increasing proportion of the UK population engages routinely with some form of online material. In this context, there is a case for active research into the various web-based services on offer, to achieve a more robust assessment of their impact and how to optimise them for achieving energy savings and supporting the introduction of smart meters.
AECOM Appendix C: Review of the Literature on Interventions used in EDRP 63
Capabilities on project:
Building Engineering
REFERENCES
Abrahamse W, Steg L, Vlek C & Rothengatter T (2005) A
review of intervention studies aimed at household energy conservation. J. Environmental Psychology 25, 273-291.
Abrahamse et al (2007) The effect of tailored information, goal setting, and tailored feedback. J. Environmental Psychology 27, 265-276.
Allcott H (2009) Social norms and energy conservation. Report to OPower. http://www.opower.com/Results/IndependentVerification.aspx
Allen D & Janda K (2006) The effects of household characteristics and energy use consciousness on the effectiveness of real-time energy use feedback: a pilot study. Proceedings of ACEEE
60, 7-1 to 7-12.
Anderson W & White V (2009) Exploring the functionality of real-time home energy displays. Report to the Energy Saving Trust. Centre for Sustainable Energy, Bristol.
Arvola A, Uutela A & Anttila U (1994) Billing feedback as a means of encouraging conservation of electricity in households: a field experiment in Helsinki. Energy and the consumer, Finnish Ministry of Trade and Industry.
Ayres I, Raseman S & Shih A (2009) Evidence from two large field experiments that peer comparison feedback can reduce residential energy usage. Report to OPower. http://www.opower.com/Results/IndependentVerification.aspx
Battalio RC, Kagel JH, Winkler RC & Winett RA (1979)
Residential electricity demand: an experimental study. The Review of Economics and Statistics 61(2), 180-189.
Beerepoot M (2007) Public energy performance policy and the effect on diffusion of solar thermal systems in buildings: a Dutch experience. Renewable Energy, 32 (11) 1882-1897.
Beerepoot M & Beerepoot N (2007) Government regulation as an impetus for innovation: evidence from energy performance regulation in the Dutch residential building sector. Energy Policy, 35 (10) 4812-4825.
Benders RMJ, Kok R, Moll HC, Wiersma G & Noorman HC (2006) New approaches for household energy conservation. In search of personal household energy budgets and energy reduction options. Energy Policy 34 (18), 3612-3622.
Bittle RG, Valesano RM & Thaler GM (1979a) The effects of daily feedback on residential electricity usage as a function of usage level and type of feedback information. J. Environmental Systems 9 (3), 275-289.
Bittle RG, Valesano RM & Thaler GM (1979b) The effects of daily cost feedback on residential electricity consumption. Behaviour Modification 3 (2), 187-202.
60 American Council for an Energy-Efficient Economy.
Black R, Davidson P & Retra K (2009) Facilitating energy saving behaviours among university student residents. Report no. 53, Institute for land, water and society, Charles Sturt University, Victoria, Australia.
Boardman B & Darby S (2000) Effective advice: energy efficiency and the disadvantaged. A report for the Electricity Association Fuel Poverty Task Force. Environmental Change Institute, University of Oxford.
Boice C (2009) Home energy display market test. Demand side plan technical appendix, Book 4 of 9. Application of Nevada Power Company d/b/a NV Energy seeking acceptance of its Triennial Integrated Resource Plan covering the period 2010-2029, including authority to proceed with the permitting and construction of the ON Line transmission project. Before the Public Utilities Commission of Nevada.
Bordass W (2008). Carbon Buzz launch.
http://www.carbonbuzz.org/latest.jsp
Boyd J (2008) Managing residential electricity demand:
learning from experience in the UK and Ontario. Presentation
to UKERC seminar, May 21-23.
www.ukerc.ac.uk/Downloads/PDF/Meeting%20Place/Events/
2008/05UKcanadademandred/Boyd,%20Jenny.pdf
Brandon G & Lewis A (1999) Reducing household energy consumption: a qualitative and quantitative field study. J. Environmental Psychology 19, 75-85.
CNT Energy (2008) Demonstrating PriceLight Technology to
improve household energy efficiency in Central and Southern Illinois. Final report to the Illinois Clean Energy Community Foundation, CNT Energy at the Center for Neighbourhood Technology.
Costa DL & Kahn ME (2010) Energy conservation ―nudges‖ and environmentalist ideology: evidence from a randomized residential electricity field experiment. http://www.voxeu.org/index.php?q=node/5064
Country Energy (2006) AMI benefits analysis / Home Energy Efficiency Trial period 2 survey results. Bayard Group Response to Ofgem consultation.
CSE (2003) Energy education hitting home. A summary of
the evaluation report into the impact of the Energy Matters
programme.
http://www.cse.org.uk/downloads/file/pub1025.pdf
Darby S (2003) Making sense of energy advice.
Proceedings, ECEEE summer study. Paper 6, 157.
Darby S (2006) The effectiveness of feedback on energy consumption. Environmental Change Institute, University of Oxford.

AECOM Appendix C: Review of the Literature on Interventions used in EDRP 64
Capabilities on project:
Building Engineering
Darby S (2010) Smart metering: what potential for householder engagement? Building Research & Information 38 (5), 442-457.
Darnton A (2008) An overview of behaviour change models and their uses. Government Social Research. http://www.civilservice.gov.uk/Assets/Behaviour_change_reference_report_tcm6-9697.pdf
Deremer K (2007) Advice Letter 1938-E, Revisions to Demand Response Programs. October 31. http://www.sdge.com/tm2/pdf/1938-E.pdf and http://www.sdge.com/aboutus/longterm/longtermDemandResponse.shtml
De Young R (1993) Changing behaviour and making it stick: the conceptualisation and management of conservation behaviour. Environment & behaviour 25 (4), 485-505.
Diffney et al (2008) What power has the Power of One? Effects of an advertising campaign to boost energy efficiency. Working paper 280, Economic & Social Research Institute.
Dobson & Griffin (1992) Conservation effect of immediate electricity cost feedback on residential consumption behaviour. Proceedings of ACEEE, 10.33-10.35
Downing TE, Butterfield RE, Edmonds B, Knox JW, Moss S, Piper BS & Weatherhead EK (2003) Climate Change and Demand for Water. Stockholm Environment Institute.
Dünnhoff E & Duscha M (2008) Effiziente Beratungsbausteine zur Minderung des Stromverbrauchs in privaten Haushalten. Endbrericht. [Efficient consulting modules to reduce electricity consumption in private households. Final Report. Institut für Energie- und Umweltforschung, Heidelberg.
Dwyer WO, Leeming FC, Cobern MK, Porter BE & Jackson JM (1993) Critical review of behavioural interventions to preserve the environment: research since 1980. Environment & behaviour 25 (3) 275-321.
Ehrhardt-Martinez K, Donnelly KA & Laitner JA (2010)
Advanced metering initiatives and residential feedback programs: a meta-review for household electricity-saving opportunities. ACEEE Report E105.
Elliott J, Martinez M, Mitchell-Jackson J & Williamson C (2006) The california bill analysis pilot: using web-based bill analysis as a tool to reduce on-peak demand. Proceedings of ACEEE Summer Study on Energy Efficiency in Buildings, Panel 2, 94–105.
EPRI (2009) Residential electricity use feedback: a research synthesis and economic framework. Electric Power Research Institute, Palo Alt.
Ersson E & Pyrko J (2009a) El-info via digitala kanaler. Fallstudie 1 ‖Min elförbrukning‖ hos Skånska Energi. (Information via digital channels. Case study 1 ‖My electricity use‖ at Skanska Energy). Lund University, Energy Sciences,
ITRN LUTMDN/TMHP--09/3039--SE. English summary at http://www.ees.energy.lth.se/fileadmin/ees/Publikationer/2009/Elforsk-09-90-Syntes.pdf
Ersson E & Pyrko J (2009b) El-info via digitala kanaler. Potential att förändra elanvändning i bostäder, Fallstudie 2: "Dina Sidor" hos Öresundskraft, Energivetenskaper, Lunds Universitet - LTH, ISRN LUTMDN/TMHP-- 09/3042—SE. English summary at http://www.ees.energy.lth.se/fileadmin/ees/Publikationer/2009/Elforsk-09-90-Syntes.pdf
Ersson E & Pyrko J (2009c) El-info via digitala kanaler Potential att förändra elanvändning i bostäder. Fallstudie 3. ‖EnergiDialog-Privat‖ hos E.ON Sverige ABCase study with E.ON. http://www.ees.energy.lth.se/fileadmin/ees/Publikationer/2009/Rap09-3044-Pyrko-EOn.pdf English summary at http://www.ees.energy.lth.se/fileadmin/ees/Publikationer/2009/Elforsk-09-90-Syntes.pdf
Faruqui A & Sergici S (2010) Household response to
dynamic pricing of electricity: a survey of 15 experiments. J. Regulatory Economics, 83 (2), 193-225.
Fischer C (2008) Feedback on household electricity consumption: a tool for saving energy? Energy Efficiency 1 (1), 79-104. http://www.springerlink.com/content/276m42024x61wh1h/
Foresight (2008) Powering our lives: sustainable energy management and the built environment. Foresight Report, DIUS.
Garay J & Lindholm P (1995) Statistics on the energy bill:
better control for the customer. 7th
International Energy Program Evaluation Conference, Chicago.
Gaskell G, Ellis P & Pike R (1982) The energy literate consumer: the effects of consumption feedback and information on beliefs, knowledge and behaviour. Dept of Social Psychology, LSE, London.
Giuletti M, Price CW & Waterson (2003) Consumer choice and industrial policy: a study of UK energy markets. CSEM Working Paper Series / The Economic Journal, 115, 949–968.
Gregory J & Harrigan M (1997) Do savings from energy education persist? Presentation to the DA/DSM Europe ‘97 Conference, Amsterdam.
Haakana M, Sillanpää L & Talsi M (1997) The effect of
feedback and focused advice on household energy consumption. Proceedings of ECEEE, Panel 4, ID 38 - p1.
Hargreaves T, Nye M & Burgess J (2010) Making energy visible: a qualitative field study of how householders interact with feedback from smart energy monitors. Energy Policy 38, 6111-6118.

AECOM Appendix C: Review of the Literature on Interventions used in EDRP 65
Capabilities on project:
Building Engineering
Harrigan M & Gregory J (1995) Do savings from energy education persist? Applied Energy Research/Alliance to Save Energy.
Hayes SC & Cone JD (1977) Reducing residential electrical energy use: payments, information and feedback. J. Applied Behavior Analysis 10, 425-435.
Heberlein TA, & Warriner GK (1983) The influence of price and attitude on shifting residential electricity consumption from on- to off-peak periods. J. Economic Psychology 4, 107-130.
Henley A & Peirson J (1998) Residential energy demand and the interaction of price and temperature: British experimental evidence. Energy Economics 20 (2), 157-171.
Henryson J, Hakånsson T & Pyrko J (2000) Energy efficiency
in buildings through information – Swedish perspective. Energy Policy 28 (3), 169-180.
Hitchin ER & Pout CH (2000). Local cooling, global warming?
UK carbon emissions from air-conditioning in the next two
decades. CIBSE Conference, Dublin.
http://www.cibse.org/pdfs/Carbon%20emissions%20air%20c
on.pdf
Hutton RB, Mauser GA, Filiatrault P & Ahtola OT (1986)
Effects of cost-related feedback on consumer knowledge and
consumption behaviour: a field experimental approach. J.
Consumer Research 13, 327-336.
Hydro One Networks (2008) Hydro One Networks Inc. time-
of-use pricing pilot project results. Toronto, Ontario.
www.oeb.gov.on.ca/documents/cases/EB-2004-
0205/smartpricepilot/TOU_Pilot_Report_HydroOne_2008051
3.pdf.
Isaacson M, Kotewa L, Star A & Ozog M (2006) Changing
how people think about energy. Proceedings of ACEEE summer study.
Iyer M, Kempton W and Payne C (1998) Comparison groups as a tool for evaluating energy efficiency programs: an analysis of Energy Star billing comparison groups. Proceedings of ACEEE.
Karbo P & Larsen TF (2005) Use of online measurement
data for electricity savings in Denmark. Proceedings of ECEEE summer study, paper 1,180, 161-164.
Karjalainen S (2011) Consumer preferences for feedback on household electricity consumption. Energy & Buildings 43, 458-467.
Katzev R & Johnson T (1983) A social psychological analysis of residential electricity consumption: the impact of minimal justification techniques. J. Economic Psychology 3, 267-284.
Katzev R & Johnson T (1984) Comparing the effects of monetary incentives and the foot-in-the-door technique on
residential energy conservation. J. Applied Social Psychology 14, 12-27.
Kempton W & Layne LL (1994) The consumer‘s energy analysis environment. Energy Policy 22(10), 857-866.
Kidd A & Williams P (2008) The Talybont trial: exploring the psychology of smart meters. http://www.prospectory.co.uk/id5.htm
King C & Delurey D (2005) Twins, siblings or cousins? Analyzing the conservation effects of demand response programs. Public Utilities Fortnightly, March, 54-61.
King J (2007) M-power: a better way to keep customers in power. Energy Pulse, January 19
th.
http://www.energypulse.net/centers/article/article_display.cfm?a_id=1406
Kohlenberg R, Phillips T, Proctor W (1976) A behavioural analysis of peaking in residential electrical-energy consumers. J. Applied Behavior Analysis 9, 13-18.
Lockwood M & Platt R (2009) Green Streets. Final report to
British Gas. Institute for Public Policy Research, London. http://www.ippr.org/uploadedFiles/research/projects/Climate_Change/green_streets_final.pdf
Luyben PD (1982) Prompting thermostat setting behaviour: public response to a presidential appeal for conservation. Environment & Behavior 14(1), 113-128.
McClelland L & Cook SW (1979) Energy conservation
effects of continuous in-home feedback in all-electric homes. J. Environmental Systems 9 (2), 169-173.
Mack B & Hallmann S (2004) Strom sparen in Lummerlund – eine Interventionsstudie in einer Passiv- und Niedrigenergie-haussiedlung. [Conserving energy in a passive and low energy house residential area.] Umweltpsychologie 8 (1), 12-29.
Martinez MS & Geltz CR (2005) Utilizing a pre-attentive technology for modifying customer energy usage. Proceedings of ECEEE. (Paper presented but not published.)
Matsukawa I (2004) The effects of information on residential demand for electricity. The Energy Journal, 25 (1), 1-18.
Midden CJH, Meter JF, Weenig MH & Zieverink HJA (1983) Using feedback reinforcement and information to reduce energy consumption in households: a field-experiment. J. Economic Psychology 3, 65-86.
Mosler H-J & Gutscher H (2004) Diffusion von Energiesparverhalten durch Kombination von instruierter Selbstverbreitung mit Interventionsinstrumenten. [Promoting energy-conserving behaviour by combining instructed self-diffusion with intervention instruments] Umweltpsychologie 8 (1), 50-65.
Mountain DC (2006) The impact of real-time feedback on residential electricity consumption: the Hydro One pilot. Mountain Economic Consulting & Associates Inc., Ontario.

AECOM Appendix C: Review of the Literature on Interventions used in EDRP 66
Capabilities on project:
Building Engineering
Mountain DC (2007) Real-time feedback and residential electricity consumption: British Columbia and Newfoundland and Labrador pilots. Mountain Economic Consulting & Associates Inc., Ontario.
Newsham GR & Bowker BG (2010) The effect of utility time-
varying pricing and load control strategies on residential summer peak electricity use: a review. Energy Policy 38 (7), 3289-3296. (Also NRC Report at www.nrc-cnrc.gc.ca/obj/irc/doc/pubs/nrcc52707.pdf).
New Perspectives / Energy Inform (2004) Savings from behavioural changes following energy advice: report on a survey. Report to the Energy Efficiency Partnership for Homes / Energy Saving Trust.
Nielsen L (1993) How to get the birds in the bush into your hand: results from a Danish research project on electricity savings. Energy Policy, November, 1133-1144.
Nolan JM, Schultz PW, Cialdini RB, Goldstein NJ & Griskevicius V (2008) Normative social influence is underdetected. Personality and Social Psychology Bulletin 34(7), 913-923.
Northern Ireland Electricity (2005) Presentation to Northern Ireland Authority for Energy Regulation.
Northern Ireland Electricity (2006) Report on customer savings with a Keypad Meter. Pers. Comm. to Sarah Darby.
OXERA (2006) Policies for energy efficiency in the UK
household sector. A report for DEFRA. OXERA, Oxford.
PA Consulting (2010) Residential smart energy monitoring
pilot final report. Prepared for Cape Light Compact by PA consulting group, Madison, WI. http://tomharrisonjr.com/wp-content/uploads/2010/08/CLCSmartEnergyMonitoringPilotFinalReport3-31-2010.pdf
Pallak MS & Cummings N (1976) Commitment and voluntary energy conservation. Personality & Social Psychology Bulletin 2(1), 27–31.
Palmer MH, Lloyd ME, Lloyd KE (1977) An experimental analysis of electricity conservation procedures. J. Applied Behavior Analysis 10, 665-671.
Parker DS, Hoak D & Cummings J (2008) Pilot evaluation of energy savings from residential energy demand feedback devices. Florida Solar Energy Center Report FSEC-CR-1742-08 to the UD Department of Energy.
Pett J & Guertler P (2004) User behaviour in energy efficient homes. A report for EST and the Housing Corporation. Association for the Conservation of Energy, London.
Peters JS, Moezzi M, Lutzenhiser S, Woods J, Dethman L & Kunkle R (2009) Powerchoice residential customer response to TOU rates. Research into Action, for California Energy Commission, report CEC-5000-2009-XXX.
Petersen JE, Shunturov V, Janda K, Platt G & Weinberger K (2007) Dormitory residents reduce electricity consumption
when exposed to real-time visual feedback and incentives. International J. Sustainability in Higher Education 8 (1), 16-33.
Places for People (2007). Smart energy trial helps customers
save £80 a year.
www.placesforpeople.co.uk/resources/pressoffice/news.aspx
?id=1329&r=0&t=0
www.placesforpeople.co.uk/goldaward/documents/Electrisav
e%20smart%20meters%20Fact%20Sheets.pdf
Pruitt B (2005) SRP M-Power … A Better Way to Keep Customers in Power & Save Energy, Too. www.swenergy.org/workshops/2005/PRESENTATION%20-%20Pruitt%20SRP%20MPower.pdf
Quesnelle K (2006) Pay-as-you-go-power, treating electricity
as a commodity. Woodstock Hydro, Ontario. January 20. www.regie-energie.qc.ca/audiences/3519-03/PreuveINTERV3519/GRAME-1-Doc3-DocInformation_21janv04.pdf.
Raw G, Varnham J & Schooling J (2010) Focus on
behaviour change – reducing energy demand in homes. Department for Communities and Local Government. www.communities.gov.uk/publications/planningandbuilding/energybehaviourchange
Reiss PC & White MW (2008) What changes energy consumption? Prices and public pressures. RAND J. Economics 39 (3), 636-663.
Respond (2009) Study on Smart Metering in Australia.
Roberts S & Humphries H & Hylden V (2004) Consumer preferences for improving energy consumption feedback. A report to Ofgem. Centre for Sustainable Energy, Bristol.
Rossini G (2009) Hydro One: In-home real time display. Customer feedback from a 30,000 unit deployment. Presentation to 2nd annual conference on home energy displays, Orlando, Florida, April 2
nd.
Rubino de Oliveira LC, Mitchell V & Badni K (2010) Using social network games to reduce energy consumption. 5th International Conference on Persuasive Technology ‗Design for Change'. Copenhagen, Denmark, pp1-8. https://dspace.lboro.ac.uk/dspace-jspui/handle/2134/7652
Schultz PW, Nolan JM, Cialdini RB, Goldstein NJ & Griskevicius V (2007). The constructive, destructive and
reconstructive power of social norms. Psychological Science 18 (5), 429-434.
Seaver WB & Patterson AH (1976) Decreasing fuel oil consumption through feedback and social commendation. J. Applied Behavior Analysis 9, 147-152.
Seligman C, Darley JM & Becker LJ (1978) Behavioural approaches to residential energy conservation. Energy & Buildings 1, 325-337.

AECOM Appendix C: Review of the Literature on Interventions used in EDRP 67
Capabilities on project:
Building Engineering
Seville C (2009) Green Buildings Advisor blog. http://www.greenbuildingadvisor.com/blogs/dept/green-building-curmudgeon/nudging-us-toward-efficient-future
Sexton RJ, Brown Johnson N & Konakayama A (1987) Consumer response to continuous-display electricity-use monitors in a time-of-use pricing experiment. J. Consumer Research 14, 55-62.
Sharpe VJ & Watts DR (1992) Beyond traditional approaches to marketing energy conservation: the Espanola experience. Proceedings of American Council for an Energy-Efficient Economy.
Siems A (2009) Evaluation of the Massachusetts PowerCost Monitor Pilot Program. Presentation to the ACEEE Symposium on Market Transformation, Washington DC, 31
st
March.
Siero et al (1996) Changing organizational energy consumption behaviour through comparative feedback. J. Environmental Psychology.
Sipe B & Castor S (2009) The net impact of home energy feedback devices. Energy Program Evaluation Conference, Portland OR, 341-351. http://energytrust.org/library/reports/Home_Energy_Monitors.pdf
Slavin RE, Wodarski JS & Blackburn BL (1981) A group contingency for electricity conservation in master-metered apartments. L. Applied Behavior Analysis 14, 357-363.
Smith et al (2004) [Smith W & Pett J (2005)?] Energy
efficiency refurbishment programmes help, but are the end-users doing their bit? European Council for an Energy-Efficient Economy, Paper 5,010, 957-968.
Staats HJ & Harland P (1995) The EcoTeam program in the Netherlands. Study 4: longitudinal study on the effects of the EcoTeam Program on environmental behavior and its psychological backgrounds. E&MR-95/57. Centre for Energy and Environmental Research, Faculty of Social and Behavioural Sciences, Leiden University.
Staats H, Harland P & Wilke HAM (2004) Effecting durable change: a team approach to improve environmental behaviour in the household. Environment & Behaviour 36 (3), 341-367.
Star A, Isaacson M, Kotewa L & Ozog M (2006) Real-time pricing is the real deal: an analysis of the energy impacts of residential real-time pricing. Proceedings of the ACEEE 2006 Summer Study Session in Buildings, 5:316-327.
Stern PC, Aronson E, Darley JM, Hill DH, Hirst E, Kempton W & Wilbanks TJ (1986) The effectiveness of incentives for residential energy conservation. Evaluation Review 10 (2) 147-176.
Stevenson F & Rijal H (2008) The Sigma Home: towards an authentic evaluation of a prototype building. Proceedings,
25th conference on passive and low energy architecture, Dublin.
Summit Blue (2009) Impact evaluation of Opower SMUD pilot study. Report to OPower. http://www.opower.com/Results/IndependentVerification.aspx
UC Partners & Technical University of Eindhoven (2009)
PowerPlayer pilot 2008-2009. Final report to SenterNovem, Nuon and Home Automation Europe. UCPartners, Keizersgracht 125-127, 1015 CJ Amsterdam, Netherlands.
Ueno T, Inada R, Saeki O & Tsuji K (2005) Effectiveness of displaying energy consumption data in residential houses. Analysis on how the residents respond. Proceedings of ECEEE, paper 6.100, 1289-1299.
Utley JI & Shorrock LD (2008) Domestic Energy Fact File 2008. BRE, for the Department of Energy & Climate Change.
van Dam SS, Bakker CA & van Hal JDM (2010) Home
energy monitors: impact over the medium-term. Building Research & Information 38 (5), 458-469.
van Houwelingen JH & van Raaij WF (1989) The effect of goal-setting and daily electronic feedback on in-home energy use. J. Consumer Research 16, 98-105.
Völlink T & Meertens RM (1999) De effectiviteit van elektronische feedback over het energie- en waterverbruik door middel van teletekst bij huishaudens. (The effectiveness of electronic feedback on household energy and water use by means of text TV.) In Meertens RM, Vermunt R, de Wit JBF & Ybema JF (Eds.): Sociale psychologie en haar toepassingen, pp 79-91. ASPO, Delft: Eburon.
Weatherall B (2009) Final report of the eco-pioneer pilot
program. Appendix to: http://www.europeanenergyreview.eu/data/docs/Viewpoints/LandisGyr_energy_efficiency_report.pdf
West Lothian Energy Advice Programme (1994-2000). Project Annual Reports.
Wheelock C (2009) Home energy management: consumer preferences and attitudes. Giga Omni Media, May.
Wilhite H (1997) Experiences with the implementation of an informative energy bill in Norway. Ressurskonsult Report 750, Oslo.
Wilhite H & Ling R (1995) Measured energy savings from a more informative energy bill. Energy & buildings 22, 145-155.
Winett RA, Hatcher JW, Fort TR, Leckliter IN, Love SQ, Riley
AW & Fishback JA (1982a) The effects of videotape
modelling and daily feedback on residential electricity
conservation, home temperature and humidity, perceived
comfort and clothing worn: summer and winter. J. Applied
Behaviour Analysis 15, 381-402.
Winett RA, Kagel JH, Battalio RC & Winkler RC (1978) Effects of monetary rebates, feedback, and information on

AECOM Appendix C: Review of the Literature on Interventions used in EDRP 68
Capabilities on project:
Building Engineering
residential electricity conservation. J. Applied Psychology 63(1), 73–80.
Winett RA, Leckliter IN, Chinn DE, Stahl B & Love SQ (1985)
Effects of television modelling on residential electricity
conservation. J. Applied Behaviour Analysis 18, 33-44.
Winett RA, Love SQ & Kidd C (1982b) Effectiveness of an
energy specialist and extension agents in promoting summer
energy conservation by home visits. J. Environmental
Systems 12 (1).
Winett RA, Neale MS, & Grier HC (1979) Effects of self-monitoring and feedback on residential electricity consumption. J. Applied Behavior Analysis 12, 173-184.
Winett RA & Nietzel M (1975) Behavioral ecology: contingency management of consumer energy use. American J. Community Psychology 3, 123-133.
Wood G & Newborough M (2003) Dynamic energy-consumption indicators for domestic appliances: environment, behaviour and design. Energy & Buildings, 35, 821-841.
Woods J (2008) What people do when they say they are conserving electricity. Energy Policy 36 (6), 1945-1956.
69
THE MEANS-MOTIVE-OPPORTUNITY FRAMEWORK ANNEX C1
Introduction
The framework is an outline theoretical structure based on establishing the means, motives and opportunities that are needed to instigate changes to behaviour.
The means is the technology or behaviour that will lead to reduced energy use or CO2 emissions.
The motive is the reason why households will want to make the change.
The opportunity is the resource (e.g. time, space or money) to make the change.
These three, while distinct, are not independent: strong motive (at individual or society level) can lead to the creation, acceptance or discovery of means and opportunity; reliable means can increase (or allow recognition of) motive and make clear the opportunity; and opportunity can allow people to realise motive and create means.
Nevertheless, in promoting behaviour change, the three should always be clearly distinguished: not doing so will increase the risk of having an incomplete approach and, therefore, failure. For example, there is sometimes an implicit assumption that subsidising an energy-efficient upgrade in itself provides a motive. Unless the subsidy means that the purchaser is making a net saving over an alternative choice, the subsidy is not a motive – only an opportunity. There must also be some underlying reason why the purchaser wants to make the change.
The means, motive and opportunity need to be, in combination, sufficient to overcome whatever barriers exist – whether the barriers arise from finance, time, restrictive legal or contractual frameworks, personal inertia (e.g. habits, routines or established lifestyle choices), personal image or ignorance.
This report has generally been set in the context of influencing individuals and households but they do not act in isolation – action will partly be defined by social context: communities and how they work together. A community is more than a collection of individuals and it has great potential in terms of:
means (some of which are illogical or impractical at the level of an individual household, e.g. district heating or small-scale renewable power generation);
motive (where changing social norms and developing mutual support for change can be powerful influences);
opportunity (through economies of scale and community-level grants).
Means
The means is the technology (some characteristic of the fabric or services of a building) or behaviour that will lead to reduced energy use. The main point is that, if the aim is to change behaviour, there needs to be clarity over exactly what householders are expected to do. In addition, they need sufficient information to make informed choices, based on knowledge of the options available to them, particularly where significant investments of money or time are required. The availability of reliable advisors, suppliers and installers is also an important aspect of the means: if potential users do not know that the means exists, that it works, and how to apply it, why should they change?
The means, as defined here, is the change itself but it is also true that good technology can itself encourage change. For example, controlling the heating will be promoted by clear, intuitive control systems that are simple to use and retain time and temperature settings when switched off.
In addition to information specifically about the means, householders often benefit from direct feedback to identify where excessive energy is being used and to monitor whether attempts to reduce consumption are being successful. This approach recognises that energy is an ‗invisible commodity‘ – people do not generally buy energy
70
for its own sake, but rather they seek some outcome (e.g. keeping warm or toasting bread) and energy is simply the means to achieve the goal.
The common ‗feedback mechanism‘ of the quarterly utility bill, often estimated, is too blunt an instrument for this purpose. Therefore, ongoing improvements (e.g. smart meters, real-time displays and billing that provides historic or peer group comparisons) are to be welcomed; they make the energy more visible and therefore more likely to influence behaviour on a continuous basis, not just when the bill arrives. This report does not treat feedback as energy-saving in its own right but rather as a key facilitator.
It is also clear that mere facts are not always persuasive and personal familiarity with (and confidence in) the technology in question is important. This can be achieved, for example, through local ‗champions‘, demonstration projects, placement of products in popular materials or furnishing stores, or regulatory changes for new homes.
Without effective demonstration, unnecessary barriers to behaviour change can arise, for example, because earlier versions of a technology were known to be unsatisfactory (e.g. older solar thermal water heating systems and compact fluorescent lights) or because critical failures are given undue publicity (e.g. water tank bursts following inappropriate loft insulation).
Although risks (e.g. from poor choice or implementation of technology) are generally specific to each behaviour, some generic risks are noted here. Whole-house solutions can be particularly effective but, where this is not feasible, there is value in at least phasing the elements appropriately. Sequencing work can be critical to managing effectiveness, cost and the risk of unwelcome side effects. Depending on the circumstances in each case, this might mean, for example:
doing disruptive measures together (e.g. putting up scaffolding or lifting floorboards only once);
making sure that later interventions do not undo some of the benefits of earlier ones (e.g. losing insulation from wall cavities when windows are replaced later);
ensuring that combinations of changes will work effectively together;
carrying out the most cost-effective measures first, so that the energy savings help to release the finance for other measures;
identifying logical groups of measures, such as a new boiler plus heating controls plus a hot water storage vessel that is ready to be used with solar thermal water heating.
Apart from the direct risks, failure of improvement measures can result in demotivation and a reluctance to make further changes. It is, therefore, important to identify and manage risks so that householders can make changes with confidence.
Motive
The motive is the reason why households will want to make the change. Motivational approaches traditionally split along lines of carrot and stick, and energy use in buildings is no different. The sticks include mandatory requirements – either legal (such as those in the Building Regulations) or industry-based (e.g. those imposed by professional bodies or lender/landlord organisations) – or financial (some kind of tax or levy on energy use or energy-using appliances). These can alternatively be viewed as carrots – save energy, save money. Sometimes the requirement is to provide information (e.g. the predicted energy usage and/or CO2 emissions according to some standardised model), which can then also take on a carrot role because of the positive image created by obtaining a good rating.
While these are essential elements of a strategy for reducing energy use by changing behaviour, the focus here is on situations where users have a choice. This is particularly relevant in considering existing buildings, where there is

71
generally a lesser degree of mandatory control. Climate change and CO2 may be the motives for this report but, for many households, they are not sufficient motive for change, and sometimes not a motive at all (or even demotivating as a subject for discussion). This may change over time but, at present, additional motives need to be found. The following motives could apply to some householders and some behaviours.
(a) Save the planet.
Reduce CO2 emissions to avoid dangerous climate change.
Reduce global pollution and depletion of natural resources.
(b) Save the country.
Achieve security of energy supply and national self-sufficiency.
Avoid environmental degradation in other countries leading to wars and mass movement of people – some to the UK.
(c) Save my household.
Avoid loss of land, severe weather, floods and property becoming uninsurable and losing value.
Maintain local security of energy supply.
(d) Save (or make) money.
Save money on fuel bills.
Make money by selling electricity.
Increase property value.
Spend money on something else, e.g. heating or non-energy needs.
(e) Avoid waste.
Reduce energy wastage.
Reduce wastage of other resources.
(f) Wellbeing.
Be comfortable and healthy.
Increase productivity – in employment or domestic work.
Get safer appliances, building fabric or lifestyle.
Enhance security (or perceived security).
(g) Improve aesthetics.
Improve the look (or feel) of my home or something within it.
(h) Feel good about yourself.
Doing something for the wider good.
Taking pride in the neighbourhood, city or country.
Developing a technical competence.
Teaching the next generation.
Fulfilling a desire for self-sufficiency or personal control.

72
Becoming more in tune with nature.
Gaining social acceptance or avoiding social rejection.
Promoting a positive image of the person, household or organisation.
Association with role models.
(i) Make my life easier.
Reduce the burden of an activity or task.
Climate change may not be the household‘s principal motive, and other motives can also be valid, but ideally the household‘s decision process should create sufficient interest in climate change to avoid the ‗rebound‘ effect whereby money saved on energy costs is spent on more carbon-intensive activities (e.g. air travel). In considering behaviour change to reduce energy demand and CO2 emissions, it is also important minimise negative consequences of behaviour change on other greenhouse gases emissions (e.g. of methane), other types of environmental impact (e.g. local air pollution or loss of land to small-scale renewable power plant) and other impacts altogether (e.g. financial or health impacts). The various motives should not, in any case, be used in a manipulative fashion: the aim should be to understand people and present options in a way that is in tune with their aims and values.
The motives are described in more detail below.
(a) Save the planet
For some people, it is sufficient that we need to reduce CO2 emissions in order to avoid further dangerous climate change. Others either do not believe that climate change is a risk (globally or to them personally), do not think they can make a difference in a global context or see it as somebody else‘s responsibility.
Hence, it is essential to keep up research and publicity on global warming and its likely consequences – the more widely these are understood and accepted, the easier it will be to change behaviour. A risk is that thinking flips to the opposite extreme: the situation is already a disaster and we are without hope so ―eat, drink and be merry, for tomorrow we die‖. There is a balance to be struck in the message. Similarly, in disseminating the message that technological solutions are being developed, there is a risk of sending a message that, therefore, we all just need to wait for the scientists and engineers to sort it out.
Pollution and depletion of natural resources are also real issues but not high in everyone‘s concerns. Some people have a greater understanding of (and concern for) pollution than climate change; in such cases, it has been suggested that it may be more helpful to talk about ―carbon pollution‖ than CO2 emissions. Householders, even if they are motivated directly by CO2 savings, may not find CO2 statistics meaningful unless they are put in a relevant context (e.g. average daily use per person, or an equivalent number of cups of water boiled).
(b) Save the country
Logically, saving the planet does include saving the country but there is an additional element that can be a source of motivation at national level: security of energy supply. The crisis in January 2009, when Russia cut off gas supplies to Ukraine and other parts of eastern Europe, showed this quite starkly. A country that can be self-sufficient in its energy supply is a more secure country.
Another issue at national level is that environmental degradation in other countries may lead to wars and mass movement of people – both UN Convention refugees and ‗environmental refugees‘ – some of them to the UK.
61 The
61 UNHCR (2009) Climate change, natural disasters and human displacement: a UNHCR perspective.
73
key themes here are conflict and competition: major climate change can severely curtail the resources available to groups of people, who then compete for land or other resources held by others. Realistic scenarios for the 21
st
century involve people movements measured in hundreds of millions, so everyone is affected.
(c) Save my household
There is some tendency to think that it would be nice for the UK to be a bit warmer and only countries that are already hot need to worry. Presenting the full facts points to a wide spectrum of risks to individuals in the UK: loss of land, severe weather, floods, and property becoming uninsurable and losing value.
Combining this with the issue of energy security, there may increasingly be concern in some quarters over supply to particular premises (as distinct from the country as a whole). Power shortages or wind damage to power lines, for example, may motivate investment in personal or local power generation.
(d) Save (or make) money
Reducing energy use generally involves saving money (or making money by selling locally generated electricity to the grid). Some energy-efficiency interventions will also enhance the value of the home at point of sale or letting. Some people do not easily connect with the motive of saving money but are motivated by having money to spend on other things, so the way information is phrased can be critical.
While money is an important (and widely used) motivator, net financial benefit is not perfectly correlated with net environmental benefit and so some care needs to be taken in any blanket financial incentives. For example, the financial incentives may appear small to some users (or to all users, but with potentially large benefit at national level); alternatively, actions with substantial energy benefit may have high initial costs and long payback periods.
Another risk is that those who invest in reducing energy use do not see their energy bills reduced because suppliers increase unit costs to compensate for reduced volume of sales. There needs to be a coherence of strategy so that it is clear whether costs are being used as a carrot or a stick, and there is a fair sharing of the benefits of investment.
One approach to using the financial motive is various forms of energy labelling, which can enhance the value of buildings that get a good rating. While this is a popular and generally positive approach, the advertised energy efficiency is rarely achieved in practice because of some combination of incomplete modelling, failure to build as designed (through error or by intention) and failure to operate as intended. The latter is of particular relevance in this paper: there is concern that regulation and energy labelling encourages ever more complex design, which building occupants are not capable of managing in practice (Bordass 2008).
(e) Avoid waste
Avoiding waste is an element of the first four motives but there is also – for some households at least – an inherent dislike of waste, regardless of whether any money is saved or the prospects for long-term availability of a commodity. This motive may be particularly significant for more affluent households where saving money, as such, is less critical.
Waste avoidance may also be a barrier if old, inefficient technology is retained when there would be a net energy benefit from replacing it. For example, when considering replacement of an inefficient boiler, households may feel that it still works and it is therefore a waste to replace it. This might be overcome by providing clear, convincing information about the resources saved by fitting a new boiler, and highlighting benefits in terms of reduced maintenance costs, improved rental or house price, etc. More generally, life cycle costing needs to be more widely applied.
www.unhcr.org/cgi-bin/texis/vtx/search?page=search&docid=4901e81a4&query=convention%20on%20refugees

74
(f) Wellbeing: be comfortable, healthy, safe and productive
Certain energy-saving measures also make the indoor environment more comfortable and/or healthy – either directly (e.g. insulation making a home warmer, double glazing making the indoor environment quieter and more secure, or heat-recovery ventilation improving indoor air quality and reducing problems with damp, mould and mites) or indirectly by making more resources available for heating or unrelated needs such as food.
Being healthy and comfortable should also increase productivity although the relationship is not simple or direct. This applies mainly where the home is a workplace (for paid, voluntary or domestic work) but there may also be knock-on effects on work outside the home if consequences for health persist outside the home.
As with the financial incentive, becoming more comfortable or healthy does not correlate perfectly with reducing energy use, indeed there can be a weak or even negative relationship. A particular example of this is the widespread finding of ‗comfort taking‘, i.e. that upgrading homes may achieve only a fraction of the anticipated reduction in energy consumption because the occupants take the benefit in higher winter temperatures rather than reduced bills.
There is sometimes good reason for comfort taking (i.e. it was uncomfortably cold before the upgrade) and sometimes it is a result of inadequate heating controls (or explanation of how to use the controls) or simply a desire to have the luxury of moving around the house in a constant high temperature and light clothing (‗trophy warmth‘). In extreme cases, energy consumption may actually increase because heating is seen as better value for money when it keeps the home warm, more of the home can be kept warm or more time is spent in the home.
This has particularly sensitive implications for where to target building upgrades: a focus on upgrading the homes of low-income households makes sense in social terms but not necessarily in energy terms. The group with the largest potential energy benefit from building upgrades may be those in poorly insulated buildings with inefficient heating systems who are, nevertheless, wealthy enough to be keeping warm. The two aims of improving health/comfort and reducing energy demand are both important but they may push policy in different directions; this needs to be acknowledged and policy aims clearly set out, especially in relation to energy price rises and their effects on different income groups.
In similar vein, there may be circumstances in which safety may be the consideration that draws someone into behaviour that reduces energy use. This can range from replacing an old boiler because of fears of carbon monoxide poisoning to turning off appliances when they are not in use to reduce the risk of electrical fires. The fear might or might not be well founded and proportionate; from an energy perspective, the issue is whether it provides the opportunity for a positive change in behaviour.
It is particularly important to consider the very young and very old, and others who for health reasons may have different environmental quality requirements, and whose environment may be controlled by carers.
(g) Improve aesthetics
Beyond the functional benefits of some energy efficiency measures, aesthetics can be a factor: whether the home or some part of it looks (or feels) attractive can make or break attempts to instigate change. For example, ‗looking modern‘ is important to many people.
While some other motives can relate to slow or small benefits, an aesthetic improvement can be immediate and (to the householder) very important.
Together with wellbeing, aesthetic quality represents a general theme of enjoying the living environment. It can also contribute to the next motive.

75
(h) Feel good about yourself
A positive self image (for individuals or the household as a whole) can result from changes in behaviour that reduce energy use and, for some people, this can be the most important motive.
This does not necessarily imply selfishness – it stems from the importance of the social context of actions, and can be altruistic and derive from a feeling of doing something for the wider good (related particularly to the ―Save the planet‖ and ―Save the country‖ motives). More broadly, it can relate to the individual or derive from taking pride in the neighbourhood, city or country.
The motive can be seen as a mixture of self esteem and ‗kudos‘, alongside conforming with social norms and aspirations, for example through:
developing a technical competence;
teaching skills and responsibility to the next generation (where people interact children in some capacity);
fulfilling a desire for self-sufficiency;
becoming more in tune with nature (alongside, for example, actions such as selecting seasonal food and maximising walking);
gaining social acceptance or avoiding social rejection (generally or within a particular social group);
association with role models (sports stars, entertainers, intellectual leaders, even political leaders).
(i) Make my life easier
If a technology or behaviour can make someone‘s life easier, it has an inherent attraction. This is different from the behaviour itself being easy to undertake. So, for example, switching off a light is easy but a ‗kill switch‘ makes it easier to turn off the lights; turning down a thermostat is easy but simple, effective heating controls make life easier by reducing the need to make constant changes all over the house.
This motive may be particularly relevant to changing habits, where offering an alternative, easier habitual behaviour may be effective.
Opportunity
The opportunity is the resource (e.g. time, space or money) to make the change. The focus is often on money (especially capital investment) but it is also important that householders have time and space to make the change. They will also want to minimise lack of time and space (often called ‗hassle factor‘) and loss of time and space (generally perceived as ‗disruption‘).
Money may be the household‘s own or a landlord‘s, or come in the form of direct subsidy, tax relief, loan or discount. A virtuous circle is created where savings on energy expenditure pay for a capital cost but this in itself is not always sufficient, even if the capital cost is mitigated – perhaps because of the other key element of opportunity, time.
Time includes the time to work out what is worth doing (e.g. in economic or environmental terms) or to manage a purchase and installation (even if this means just being at home during installation). In some cases, there are also ‗transactional‘ barriers such as planning approval. And time can also mean money. This barrier can be reduced by making it easier to take and implement decisions: the means and opportunity need to be pointed out in a simple and convincing way.

76
Space includes both having the space to make the change (e.g. to install a heat pump) and more complex considerations of preferences for use of space (e.g. open plan vs rooms with doors that can be closed, having an office at home, or using the loft for storage).
Opportunity is also likely to depend on creating aligned or complementing motivation among different parties. The classic situation, for example, is the landlord who is responsible for the building and the tenant who would benefit from improvements (in comfort and/or fuel bills); common opportunity is the key to unlocking resources here.
A specific case of this need for common action can be called ‗permission‘. This can mean, for example, people knowing that it is OK to match their dress to the thermal conditions or to turn off TVs and computer monitors that have been left on by others. But there is a more subtle aspect to this too, in giving people the social context in which they can change behaviour without appearing mad, broke or mean.
Opportunity also depends on a political and social context that cannot entirely be predicted: relevant considerations are the availability of grants or other financial incentives (now and in the future) and the mix of generation of power and heat (e.g. fossil fuel vs renewable vs nuclear, and central vs community generation). These will influence payback times and energy/CO2 savings and therefore people‘s thinking on if and when to act. Also, if someone invests in an energy saving measure, then fuel prices go up, it may not be clear to them that they have made cost savings on their bills; hence further investment may become less likely.
The amount of time that people spend in the home may also shift their perception of values. So, for example, if someone starts spending more time in the home (e.g. after having a bay or retiring), comfort in the home may acquire a higher value.
Therefore, investment behaviour is complex and not fully predictable from payback period or net present value. However, there are several ways of helping householders to realise the opportunity, other than the obvious of making sure they are aware of any available grants, loans or other financial assistance.
Some changes would generally be most cost-effective if installed on a street or neighbourhood scale (‗economies of scale‘) and/or where multiple installations are combined (‗economies of scope‘). For example, points at which renovation and refurbishment are taking place provide an opportunity to engage and inform householders about a broader range of opportunities, and for the householder to combine measures in a way that reduces costs.
Identifying such occasions may depend on intermediaries who are in the home to carry out the work (e.g. builders, plumbers, carpenters, decorators, electricians – or meter installers). If they are to have influence, they need to have the right knowledge (hence training) and to be trusted as reliable and not just out to make more money. Trust can be increased by providing them with information from an independent authoritative source.
Other intermediaries can also play this role, for example family, friends and neighbours. For some behaviours, there is also the potential to learn in another context (e.g. switching off lights at work).
The role of intermediaries is not just about information dissemination; they can, for example:
understand the motives of the particular household and be advocates for change;
analyse the context and identify options (e.g. fabric, services provision, energy supply);
assess likely performance of each option (e.g. technical potential, technical risk, aesthetics) and of any combination of options;
seek appropriate solutions with respect to cost and benefit.