Embed Size (px)
Citation preview

© Wilmsmeier, 2017
Energy efficiency and
sustainability in ports
Gordon WilmsmeierKühne Professorial Chair in Logistics
Facultad de Administración | Universidad de los AndesBogotá | Colombia
Thomas SpenglerHochschule Bremen, Germany
IMSF meeting
Geneva, Suiza
May, 2017

© Wilmsmeier, 2017
What is a sustainable port?

© Wilmsmeier, 2017© Wilmsmeier, 2017
Energy consumption and efficiency in logistics chains
? + ? = ?

© Wilmsmeier, 2017
port productivity and efficiency in LAC
(2001/2002)
port productivity in changing economic
environments (2011)
energyconsumption
in terminals (2012) –phase 1
energyconsumptionin terminals
(2014) –phase 2
sustainability and performance – online tool
(2017)

© Wilmsmeier, 2017
© Wilmsmeier, 2017
Common themes and principles
of responsible businesses and international organizations
• Sustainability includes three dimensions: economic, social and environmental.
• Sustainability is not a phase or a fashion - it is a necessity.
• It is equivalent to being competitive in the long term.
• Sustainability must be measurable (benchmark).
• It requires proactive approaches.
• Sustainability can only be reached when public and private sector co-operate.
• Sustainability means that organizations need to reach beyond their organizational boundaries (co-ordination, we cannot do it alone).

© Wilmsmeier, 2017
why should sustainability be discussed in the context of ports?
sustainability of ports
increasing energy costs
infrastructure investment
carbon footprint
efficiency and competitiveness
investment into energy
infrastructure
social costs (accidents, security)
long term economic efficiency
human capital and resource management

© Wilmsmeier, 2017
© Wilmsmeier, 2017
To reach efficient, sustainable and coordinated port performance
the practitioner and governments need:
• Measurable outcomes;
• Commitment from the boardroom to the shop-floor;
• Effective and predictable public administration and policies;
• Collaboration;
• CSR (corporate social responsibility).

© Wilmsmeier, 2017© Wilmsmeier, 2017
A wider set of measures of performance is necessary?
financial aspects considering
revenue from ships cargo, labour costs, capital equipment
costs
asset performance, measuring capacity
utilization of infrastructure
operational aspects
energy
water
emissions social

© Wilmsmeier, 2017© Wilmsmeier, 2017
New data and measures are not simple
LNG diesel
LPG electricity
energy
blue water green water
grey water virtual water
water
CO2 NOx
black carbon SOx
emissions

© Wilmsmeier, 2017
© Wilmsmeier, 2017
Relevant certifications
• ISO 14001: this is a group of management system standards which are applied to
improve the environmental performance in organizations.
• Green Ports: a certification that shows balancing between environmental protection
and economic demand.
• Ecoports: This is integration between two concepts: effective environmental and
port management.
• ISO 50001 - Energy management standards target to use energy efficiently through
the development of an energy management system (EnMS).
• CEN 16258
• GHG Protocol (adopted by ISO 14064-1)
• ISO 14046 –Water footprint

© Wilmsmeier, 2017
energy consumers inside a container terminal
Energy ConsumerEnergy Source
Diesel Petrol Gas Electricity
Ship-to-shore cranes ● ●
Mobile cranes ● ●
Rail-mounted gantry cranes ● ●
Rubber-tyred gantry cranes ● ●
Reachstackers ● ●
Straddle carriers ● ●
Tractor-trailer units and lorries ● ● ●
Generators ● ●
Consumption by buildings ●
Lighting ●
Consumption by reefer containers ●
Other port vehicles ● ● ● ●

© Wilmsmeier, 2017
© Wilmsmeier, 2017
container terminals are multi product operations
• differentiation necessary between:
– container types (i.e. dry, reefer)
– transhipment and impo/expo cargo
– full and empty
Thus, different products have different requirements and performance

© Wilmsmeier, 2017
© Wilmsmeier, 2017
Boxes or TEU?

© Wilmsmeier, 2017
© Wilmsmeier, 2017
TEU factors
Terminal with less than 100.000 boxes Terminal with more than 100.000 boxes
Source: Wilmsmeier and Spengler 2016
© Wilmsmeier, 2017
© Wilmsmeier, 2017
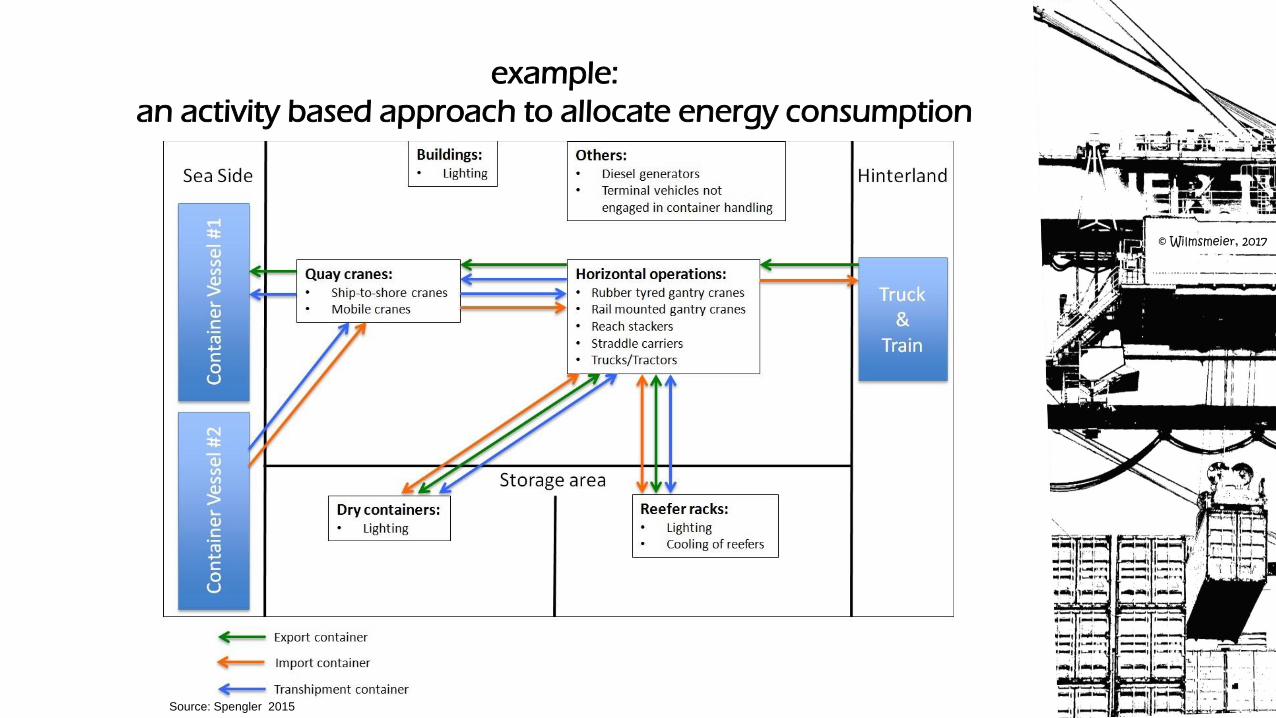
example:
an activity based approach to allocate energy consumption
Source: Spengler 2015

© Wilmsmeier, 2017© Wilmsmeier, 2017
The formula
TC = (QCC+HOC+CRC+BC+LC+OC+GEN) + UC
where: UC = Undefined consumption
TC = Total energy consumption from all sources
QCC = Energy consumption from all sources within the
process cluster of quay cranes
HOC = Energy consumption from all sources within the
process cluster of horizontal operations
CRC = Energy consumption from all sources within the
process cluster of reefer cooling
BC = Energy consumption from all sources within the process
cluster of buildings
LC =Energy consumption from all sources within the process
cluster of lighting
OC =Energy consumption from all sources within the process
cluster of others
GEN = Energy consumption from all sources within the
process cluster of generators

© Wilmsmeier, 2017© Wilmsmeier, 2017
RESULTS
© Wilmsmeier, 2017
© Wilmsmeier, 2017
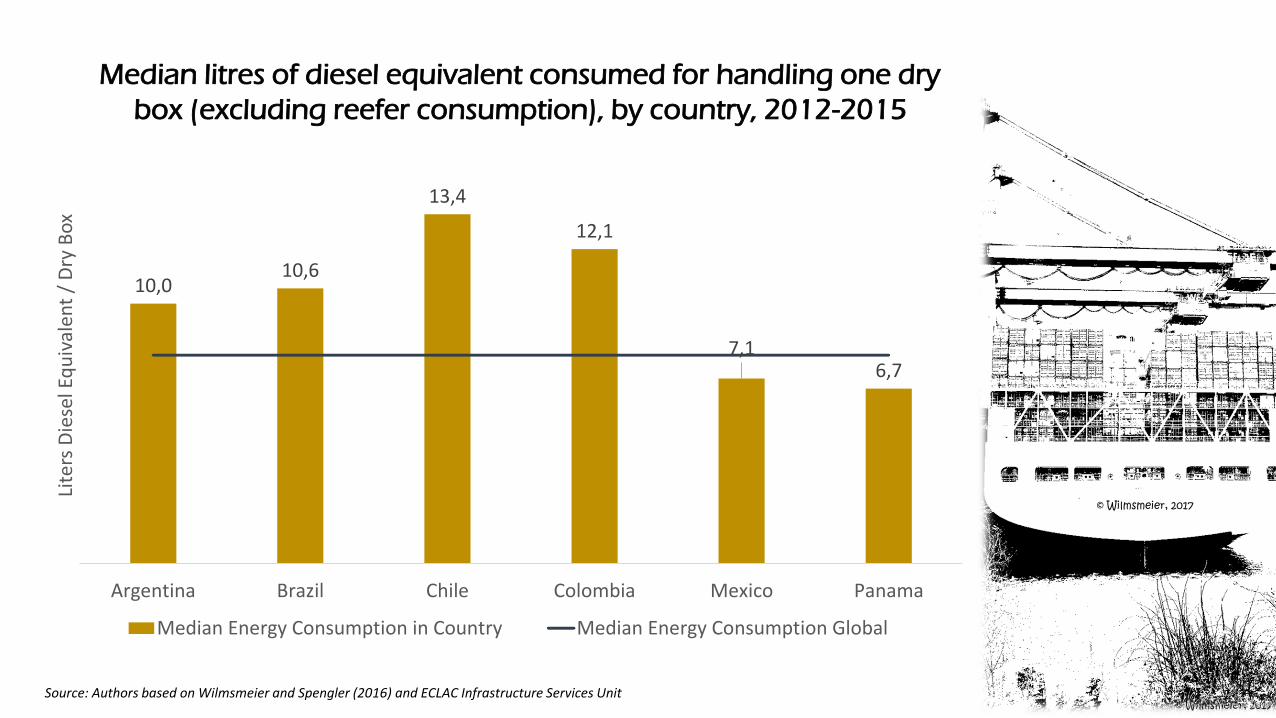
Median litres of diesel equivalent consumed for handling one dry
box (excluding reefer consumption), by country, 2012-2015
Source: Authors based on Wilmsmeier and Spengler (2016) and ECLAC Infrastructure Services Unit
10,010,6
13,4
12,1
7,16,7
Argentina Brazil Chile Colombia Mexico Panama
Lite
rs D
iese
l Eq
uiv
alen
t /
Dry
Bo
x
Median Energy Consumption in Country Median Energy Consumption Global

© Wilmsmeier, 2017
Median litres of diesel equivalent consumed per activity cluster
(excluding reefer cooling), 2012-2015
Source: Authors based on Wilmsmeier and Spengler (2016) and ECLAC Infrastructure Services UnitNote: The calculations are based on data for 31 terminals in 16 countries
0
1
2
3
4
5
6
7
8
9
10
2012 2013 2014 2015
Lit
res
die
sel e
qu
ival
ent
Quay Crane Horizontal Lighting Buildings Undefined and Other

© Wilmsmeier, 2017
© Wilmsmeier, 2017
Median litres of diesel equivalent consumed for handling one dry box
(excluding reefer consumption), by type and size of terminal, years 2012-
2015
Source: Authors based on Wilmsmeier and Spengler (2016) and ECLAC Infrastructure Services UnitNote: The calculations are based on data for 25 terminals in 8 countries
0
5
10
15
20
25
30
35
Transshipment Hybrid Import / Export under 100,000 between 100,000and 500,000
over 500,000
Litr
es D
iese
l Eq
uiv
alen
t /
Dry
Bo
x

© Wilmsmeier, 2017
© Wilmsmeier, 2017
Example of the relationship between the share of transhipment
cargo and RTG moves in Terminal B, 2010-2016
Source: Authors based on Wilmsmeier and Spengler (2016) and ECLAC Infrastructure Services Unit
0
10
20
30
40
50
60
0
0,5
1
1,5
2
2,5
2010 2011 2012 2013 2014 2015 2016
per
cen
tage
nu
mb
er o
f m
ove
s
Percentage Transshipment RTG move per Box

© Wilmsmeier, 2017
Productivity and energy consumption by crane type, 2012-2015
Source: Authors based on Wilmsmeier and Spengler (2016) and ECLAC Infrastructure Services Unit

© Wilmsmeier, 2017
© Wilmsmeier, 2017
Evolution of energy costs and emissions per RTG move
in reference Terminal A
100% 90%
49%41% 38% 35%
10%
51%59% 62% 65%
-15%
-42%-50%
-60%-67%
-2%
-41%-52% -52% -52%
2011 2012 2013 2014 2015 2016
percentage Diesel RTG Moves percentage E-RTG moves
operating costs change per RTG move emission change per RTG move
Source: Authors based on Wilmsmeier and Spengler (2016) and ECLAC Infrastructure Services Unit

© Wilmsmeier, 2017© Wilmsmeier, 2017
COUNTRY SPECIFIC ANALYSIS

© Wilmsmeier, 2017
Example: new collaborations - Chile
Source: http://www.cepal.org/sites/default/files/events/files/boletin_ee-puertos-chile-cepal-mtt.pdf

© Wilmsmeier, 2017
Transferred TEU
3,8 million
Electricity consumption
106 GWh
Diesel consumption
17 million litres
Energy expenses
26,2 million USD
Emissions
56,4 million kg CO2 or 24 kg CO2 / box
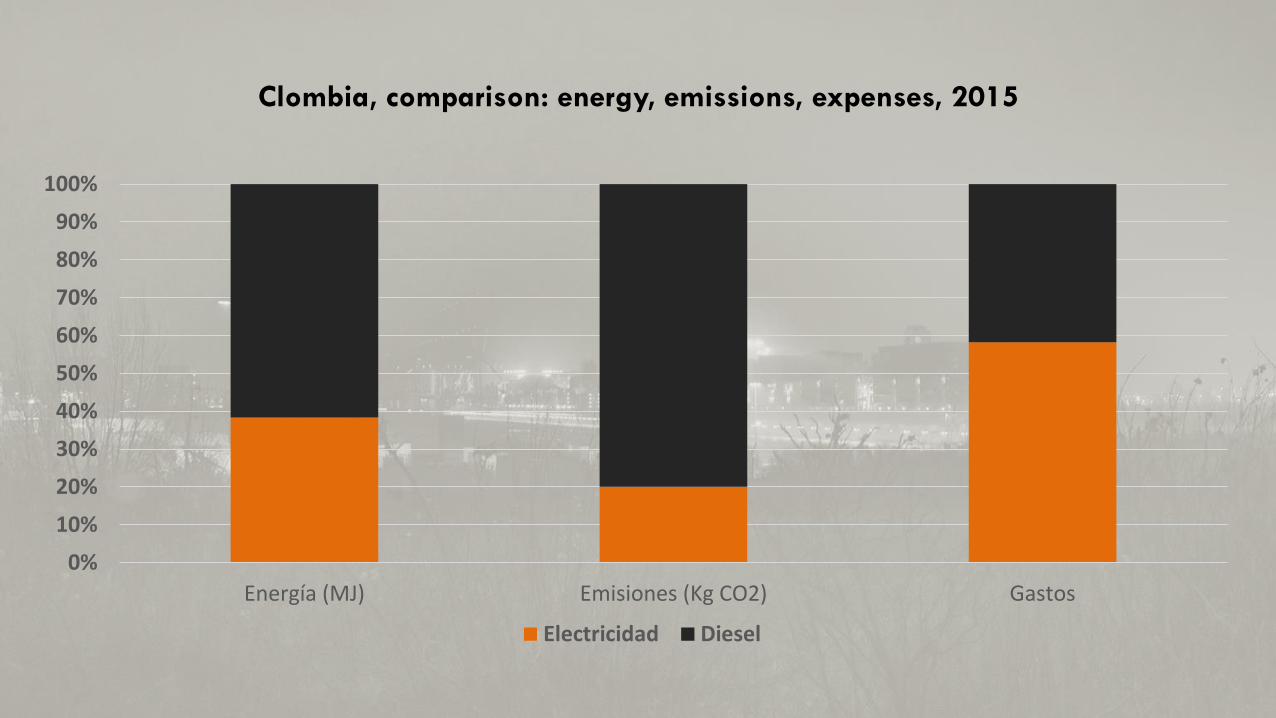
Energy consumption in container terminals in Colombia 2015
2014 2015
11,53 10,37
liters diesel equivalent per dry box
© Wilmsmeier, 2017
0%
10%
20%
30%
40%
50%
60%
70%
80%
90%
100%
Energía (MJ) Emisiones (Kg CO2) Gastos
Electricidad Diesel
Clombia, comparison: energy, emissions, expenses, 2015

© Wilmsmeier, 2017
new tools
Visit: https://spm-terminals.com

© Wilmsmeier, 2017
New tools

© Wilmsmeier, 2017© Wilmsmeier, 2017
THE REEFER CASE

© Wilmsmeier, 2017
© Wilmsmeier, 2017
Average energy consumption per storage day per full reefer
container by country
0
10
20
30
40
50
60
70
80
90
100
Argentina Colombia Mexico Chile Brazil
kW
h
Source: The Authors based Wilmsmeier and Spengler (2016)

© Wilmsmeier, 2017
© Wilmsmeier, 2017
differentiating products effects on emissions
• reefer containers account for 10 to 20% of total box movements in Chile
• reefer cooling represents 60% of the electricity consumption in the terminals.
• dwell times are crucial factor in energy consumption
• the effect on emissions estimation
• Example:
– Terminal A, in Chile, calculated emissions (without scope 3) to be 27.57 kg
CO2e per box (TPS, 2013) in 2013.
– Applying the differentiation of container types
based on the activity based approach:
– CO2 emissions:
• per standard container are 19.32 kg
• reefer container 66.18 kg CO2

© Wilmsmeier, 2017© Wilmsmeier, 2017
PERIDIOCITY

© Wilmsmeier, 2017
© Wilmsmeier, 2017
Periodicity of energy demand
TIME EXAMPLE/DRIVER
ANNUAL SEASONALITY Harvesting season of fruit (e.g. apples in Chile)
MONTH Vessel calling pattern
WEEK Berth occupancy
DAY Work shifts, delivery of reefer cargo

© Wilmsmeier, 2017
correlation between reefer activity and electricity consumption, percentage change
(base month January = 100), year 2014
Terminal C Terminal D
0
50
100
150
200
reefer containerelectricity consumption (kwh)diesel (litres)
0
50
100
150
200
reefer containerelectricity consumption (kWh)diesel (litres)

© Wilmsmeier, 2017
© Wilmsmeier, 2017
Next steps for moving ahead
• strengthen concerted effort of public and private sector
• further develop and use tools to gather new data
– Water
– Energy
– Emissions, and
– Social indicators
• Further evaluation of the effects of:
– Technological change
– Operational differences
– Energy generation and security issues
• Tool development for
– Bulk,
– Roro
– Passenger terminals
• collaborate towards a new standard of information
• can we walk the talk of a sustainable future?

© Wilmsmeier, 2017
questions?
Gordon WilmsmeierKühne Professorial Chair in Logistics
Facultad de Administración | Universidad de los AndesBogotá| Colombia
Thomas SpenglerHochschule Bremen, Germany