Embed Size (px)
Citation preview

This is an Accepted Manuscript, which has been through the Royal Society of Chemistry peer review process and has been accepted for publication.
Accepted Manuscripts are published online shortly after acceptance, before technical editing, formatting and proof reading. Using this free service, authors can make their results available to the community, in citable form, before we publish the edited article. We will replace this Accepted Manuscript with the edited and formatted Advance Article as soon as it is available.
You can find more information about Accepted Manuscripts in the Information for Authors.
Please note that technical editing may introduce minor changes to the text and/or graphics, which may alter content. The journal’s standard Terms & Conditions and the Ethical guidelines still apply. In no event shall the Royal Society of Chemistry be held responsible for any errors or omissions in this Accepted Manuscript or any consequences arising from the use of any information it contains.
Accepted Manuscript
Energy &Environmental Science
www.rsc.org/ees
View Article OnlineView Journal
This article can be cited before page numbers have been issued, to do this please use: Z. Kang, J. Mo, G.
Yang, D. A. Cullen, S. T. Retterer, T. J. Toops, J. B. Green Jr, M. M. Mench and F. Zhang, Energy Environ.
Sci., 2016, DOI: 10.1039/C6EE02368A.
1
Investigation of thin/well-tunable liquid/gas diffusion layers exhibiting
superior multifunctional performance in low-temperature electrolytic water
splitting
Zhenye Kang1, Jingke Mo1, Gaoqiang Yang1, Scott T. Retterer2, David A. Cullen2, Todd
J. Toops2, Johney B. Green Jr2# , Matthew M. Mench3, Feng-Yuan Zhang1*
1Department of Mechanical, Aerospace & Biomedical Engineering, UT Space Institute,
University of Tennessee, Knoxville
2Oak Ridge National Lab†
3Department of Mechanical, Aerospace & Biomedical Engineering, University of
Tennessee, Knoxville
# Present affiliation:
National Renewable Energy Laboratory
* Corresponding author. Tel: +1 (931) 393-7428; Email: [email protected] † This manuscript has been authored by UT-Battelle, LLC under Contract No. DE-AC05-00OR22725 with the U.S.
Department of Energy. The United States Government retains and the publisher, by accepting the article for
publication, acknowledges that the United States Government retains a non-exclusive, paid-up, irrevocable, world-
wide license to publish or reproduce the published form of this manuscript, or allow others to do so, for United
States Government purposes. The Department of Energy will provide public access to these results of federally
sponsored research in accordance with the DOE Public Access Plan (http://energy.gov/downloads/doe-public-
access-plan).
Page 1 of 31 Energy & Environmental Science
Ene
rgy
&E
nvir
onm
enta
lSci
ence
Acc
epte
dM
anus
crip
t
Publ
ishe
d on
11
Oct
ober
201
6. D
ownl
oade
d by
Uni
vers
ity o
f T
enne
ssee
at K
noxv
ille
on 1
1/10
/201
6 16
:47:
21.
View Article OnlineDOI: 10.1039/C6EE02368A
2
Abstract
Liquid/gas diffusion layers (LGDLs), which are located between the catalyst layer (CL) and
bipolar plate (BP), play an important role in enhancing the performance of water splitting in proton
exchange membrane electrolyzer cells (PEMECs). They are expected to transport electrons, heat,
and reactants/products simultaneously with minimum voltage, current, thermal, interfacial, and
fluidic losses. In this study, the thin titanium-based LGDLs with straight-through pores and well-
defined pore morphologies are comprehensively investigated for the first time. The novel LGDL
with a 400 µm pore size and 0.7 porosity achieved a best-ever performance of 1.66 V at 2 A/cm2
and 80 oC, as compared to the published literature. The thin/well-tunable titanium based LGDLs
remarkably reduce ohmic and activation losses, and it was found that porosity has a more
significant impact on performance than pore size. In addition, an appropriate equivalent electrical
circuit model has been established to quantify the effects of pore morphologies. The rapid
electrochemical reaction phenomena at the center of the PEMEC are observed by coupling with
high-speed and micro-scale visualization systems. The observed reactions contribute reasonable
and pioneering data that elucidate the effects of porosity and pore size on the PEMEC performance.
This study can be a new guide for future research and development towards high-efficiency and
low-cost hydrogen energy.
Key words: liquid/gas diffusion layers, porosity effects, pore size control, water splitting, proton
exchange membrane electrolyzer cells, hydrogen production
Broader context
Hydrogen is a ‘zero’ emission energy carrier which could be an important part of environmentally
friendly solutions to the global energy crisis via combustion or transformation into electricity
through fuel cells without producing any greenhouse gases and pollutants. Proton exchange
Page 2 of 31Energy & Environmental Science
Ene
rgy
&E
nvir
onm
enta
lSci
ence
Acc
epte
dM
anus
crip
t
Publ
ishe
d on
11
Oct
ober
201
6. D
ownl
oade
d by
Uni
vers
ity o
f T
enne
ssee
at K
noxv
ille
on 1
1/10
/201
6 16
:47:
21.
View Article OnlineDOI: 10.1039/C6EE02368A

3
membrane (PEM) water splitting is one of the most practical and high-efficiency methods to
produce pure hydrogen from renewable sources like wind and solar energy. The wide
commercialization of PEM electrolyzer cells is still hindered by their performance and durability.
Successful development of a thin titanium liquid/gas diffusion layer (LGDL) will reduce the cost,
thickness, and weight of the LGDL itself and the system as a whole. This investigation
demonstrates the ability to produce LGDLs with precise control of pore size, shape, distribution,
and therefore overall porosity and permeability, which can aid in developing modeling routine or
validating simulations. More importantly, thin titanium based LGDLs will lead to a manufacturing
solution to couple the LGDL with the metallic bipolar plates, since they can be easily integrated
together by top-down and bottom-up manufacturing process. Thus, one metallic part could
function simultaneously as flow field, bipolar plate, current distributor/collector, and LGDL.
Page 3 of 31 Energy & Environmental Science
Ene
rgy
&E
nvir
onm
enta
lSci
ence
Acc
epte
dM
anus
crip
t
Publ
ishe
d on
11
Oct
ober
201
6. D
ownl
oade
d by
Uni
vers
ity o
f T
enne
ssee
at K
noxv
ille
on 1
1/10
/201
6 16
:47:
21.
View Article OnlineDOI: 10.1039/C6EE02368A
4
Nomenclature
BP = Bipolar Plate
CCM = Catalyst-Coated Membrane
CD = Current Distributor
CL = Catalyst Layer
CPE = Constant Phase Element
DI = De-ionized
EDS = Energy Dispersive X-Ray Spectroscopy
EEC = Equivalent Electrical Circuit
EIS = Electrochemical Impedance Spectroscopy
F = Fluorine
HAADF = High Angle Annular Dark Field
Ir = Iridium
LGDL = Liquid/Gas Diffusion Layer
MG = Modular Galvanodynamic
ML = Microporous Layers
MPD = Mean Pore Diameter
MPL = Micro Porous Layer
PEM = Proton Exchange Membrane
PEMEC = Proton Exchange Membrane Electrolyzer Cell
PEMFC = Proton Exchange Membrane Fuel Cell
Pt = Platinum
Ru = Ruthenium
SE = Secondary Electron
SEM = Scanning Electron Microscopy
SOEC = Solid Oxide Electrolyzer Cell
STEM = Scanning Transmission Electron Microscopy
Ti = Titanium
TPB = Triple Phase Boundary
Page 4 of 31Energy & Environmental Science
Ene
rgy
&E
nvir
onm
enta
lSci
ence
Acc
epte
dM
anus
crip
t
Publ
ishe
d on
11
Oct
ober
201
6. D
ownl
oade
d by
Uni
vers
ity o
f T
enne
ssee
at K
noxv
ille
on 1
1/10
/201
6 16
:47:
21.
View Article OnlineDOI: 10.1039/C6EE02368A
5
Introduction
Renewable energy sources, including solar, wind, hydro, biomass and geothermal power, produce
clean electricity in sustainable ways. However, most of these renewable sources are variable and
often produce electricity intermittently (e.g., only during daylight or when windy), which present
major challenges to delivering consistent power to operate today’s electrical grid. In addition, the
current electrical grid has very limited ability to digest the fluctuation from renewable energy
sources. Thereby, a sustainable, high-efficiency, and robust electrochemical energy
storage/conversion or a hybrid system to accommodate daily or even hourly changes becomes
more critical.1-9 An advanced proton exchange membrane electrolyzer cell (PEMEC), which is a
reverse PEM fuel cell (PEMFC), has been considered as a very attractive energy storage method
for producing hydrogen/oxygen from water splitting when coupled with renewable energy sources.
PEMECs have several advantages, such as distinguished efficiency, compact design, large
capacity, quick startup, and low maintenance activities, and effectively connect renewable
electricity supply and multiscale energy demands including stationary, transportation, and portable
applications.10-16 When renewable energy resources are available, hydrogen/oxygen will be
produced and stored with a PEMEC. Later, hydrogen/oxygen can be converted back to water and
electricity with a PEM fuel cell (PEMFC), whether the renewable source is available or not.
Additionally, surplus electricity in electric grids during off-peak periods can also be stored via the
electrolyzer. This entire portfolio will make hybrid energy systems able to provide renewable and
reliable energy at different scales whenever and wherever needed.17-22
A PEM electrolyzer cell mainly consists of a catalyst-coated membrane sandwiched by anode and
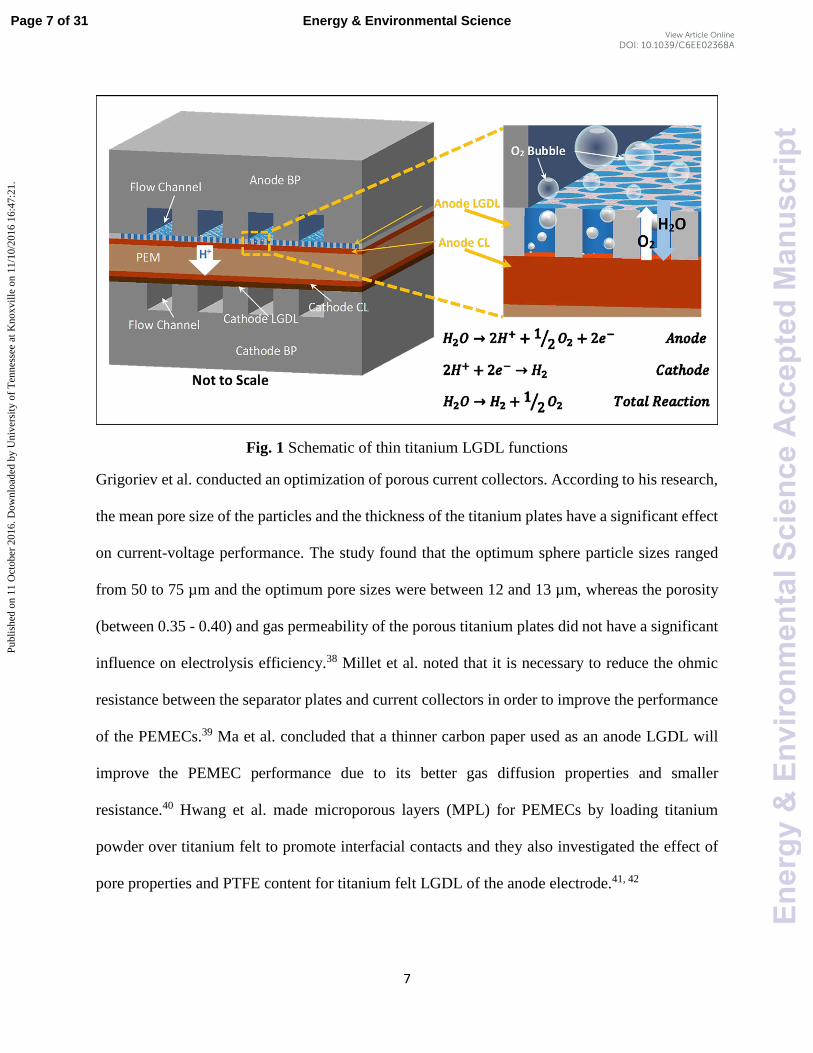
cathode electrodes, as shown in Fig. 1. Each electrode includes a catalyst layer (CL), a liquid/gas
diffusion layer (LGDL), and a bipolar plate (BP), which also acts as the current distributor (CD)
Page 5 of 31 Energy & Environmental Science
Ene
rgy
&E
nvir
onm
enta
lSci
ence
Acc
epte
dM
anus
crip
t
Publ
ishe
d on
11
Oct
ober
201
6. D
ownl
oade
d by
Uni
vers
ity o
f T
enne
ssee
at K
noxv
ille
on 1
1/10
/201
6 16
:47:
21.
View Article OnlineDOI: 10.1039/C6EE02368A
6
and the flow field. After electricity is applied, water is split into molecular oxygen, protons, and
electrons at the anode side, as shown in Fig. 1. Di-oxygen, as one product on the anode CLs, is
ideally transported from the CL through the LGDL back to the flow field to avoid blocking the
LGDL, which can hinder the reaction. Electrons, which are also generated at anode CLs, pass
through the LGDL, anode BP, and external circuit, and then back to the cathode side. Meanwhile,
protons pass through the membrane to the cathode and react with electrons which come from the
external circuit to form di-hydrogen. H2/O2 will be produced and stored continuously as long as
water and electricity are supplied. Thus, not only should the water be supplied continuously, but
also the oxygen and hydrogen should be effectively removed through the LGDLs. This is
especially important at high current density, where mass transport is a dominant limiting factor of
PEMEC performance.23-25
The anode resides in a harsh environment, which is highly corrosive due to the high overpotential
and humidity. Carbon materials (like carbon paper or carbon cloth), which are typically used in
PEMFCs, are unsuitable on this side of the PEMECs due to the high potential of the oxygen
electrode.14, 26-32 Ideal anode LGDLs should have good conductivity, high corrosion resistance,
good two-phase transport capability and mechanical strength. Metallic LGDLs and bipolar plates,
including titanium, have attracted more interest in both PEMECs and PEMFCs due to their high
conductivity, rapid production, and low cost.33-37
Page 6 of 31Energy & Environmental Science
Ene
rgy
&E
nvir
onm
enta
lSci
ence
Acc
epte
dM
anus
crip
t
Publ
ishe
d on
11
Oct
ober
201
6. D
ownl
oade
d by
Uni
vers
ity o
f T
enne
ssee
at K
noxv
ille
on 1
1/10
/201
6 16
:47:
21.
View Article OnlineDOI: 10.1039/C6EE02368A
7
Fig. 1 Schematic of thin titanium LGDL functions
Grigoriev et al. conducted an optimization of porous current collectors. According to his research,
the mean pore size of the particles and the thickness of the titanium plates have a significant effect
on current-voltage performance. The study found that the optimum sphere particle sizes ranged
from 50 to 75 µm and the optimum pore sizes were between 12 and 13 µm, whereas the porosity
(between 0.35 - 0.40) and gas permeability of the porous titanium plates did not have a significant
influence on electrolysis efficiency.38 Millet et al. noted that it is necessary to reduce the ohmic
resistance between the separator plates and current collectors in order to improve the performance
of the PEMECs.39 Ma et al. concluded that a thinner carbon paper used as an anode LGDL will
improve the PEMEC performance due to its better gas diffusion properties and smaller
resistance.40 Hwang et al. made microporous layers (MPL) for PEMECs by loading titanium
powder over titanium felt to promote interfacial contacts and they also investigated the effect of
pore properties and PTFE content for titanium felt LGDL of the anode electrode.41, 42
Page 7 of 31 Energy & Environmental Science
Ene
rgy
&E
nvir
onm
enta
lSci
ence
Acc
epte
dM
anus
crip
t
Publ
ishe
d on
11
Oct
ober
201
6. D
ownl
oade
d by
Uni
vers
ity o
f T
enne
ssee
at K
noxv
ille
on 1
1/10
/201
6 16
:47:
21.
View Article OnlineDOI: 10.1039/C6EE02368A
8
The main efforts in the previous studies, so far, have focused on investigating conventional
titanium LGDLs, including felts, woven meshes, or foams.43-45 The thickness of these LGDLs were
larger than 200 µm with significantly longer electrically conductive path lengths and higher fluidic
resistances. In addition, their fiber/foam-based pore morphologies result in not only nonuniform
interfacial contacts, but random pore sizes and distributions. These random, nonuniform and
complicated structures in conventional titanium LGDLs make it impossible to control the
liquid/gas/electron/thermal distribution precisely. Therefore, novel LGDLs with tunable and
controlled pore morphologies are strongly desired.
In this study, by taking advantage of advanced micro/nano-manufacturing, a new thin, planar
titanium LGDL with straight-through pores and well-tunable pore morphologies is developed. The
well-controllable pore size and porosity help to explicitly examine the effects of the pore
morphology, and to characterize the two-phase transport through the LGDL. The effects of well-
defined pore parameters on the PEMEC performance are comprehensively investigated. Both the
electro-potential performance and electrochemical impedance are evaluated with the novel LGDLs,
and significant improvements have been achieved. Electrochemical impedance spectroscopy (EIS)
is further analyzed by equivalent electrical circuit fitting, which helps to identify the effect of each
loss in the PEMEC. In addition, the LGDL thickness is reduced from greater than hundreds
micrometers of conventional LGDLs to only 25 microns, which remarkably reduces the transport
and ohmic resistances. More importantly, the development of thin/well-tunable LGDLs with
straight pores permits direct visualizations of the electrochemical reactions, which facilitate better
understanding of effects of the LGDL pore size and porosity. The visualization results reveal that
the oxygen bubble only nucleates at the rim of the pores, and an appropriate assumption is
proposed to analyze and explain the effects of the pore size and porosity.
Page 8 of 31Energy & Environmental Science
Ene
rgy
&E
nvir
onm
enta
lSci
ence
Acc
epte
dM
anus
crip
t
Publ
ishe
d on
11
Oct
ober
201
6. D
ownl
oade
d by
Uni
vers
ity o
f T
enne
ssee
at K
noxv
ille
on 1
1/10
/201
6 16
:47:
21.
View Article OnlineDOI: 10.1039/C6EE02368A
9
Experimental Details
2.1 Nano-manufacturing of titanium thin/well-tunable LGDLs
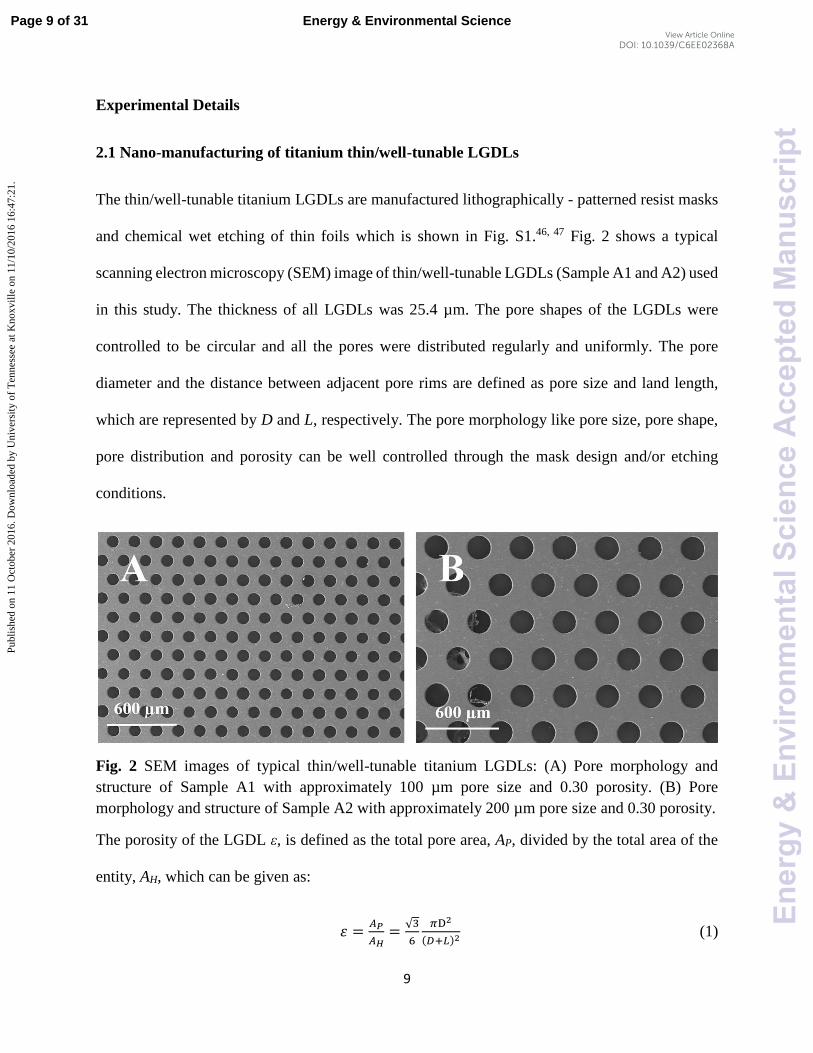
The thin/well-tunable titanium LGDLs are manufactured lithographically - patterned resist masks
and chemical wet etching of thin foils which is shown in Fig. S1.46, 47 Fig. 2 shows a typical
scanning electron microscopy (SEM) image of thin/well-tunable LGDLs (Sample A1 and A2) used
in this study. The thickness of all LGDLs was 25.4 µm. The pore shapes of the LGDLs were
controlled to be circular and all the pores were distributed regularly and uniformly. The pore
diameter and the distance between adjacent pore rims are defined as pore size and land length,
which are represented by D and L, respectively. The pore morphology like pore size, pore shape,
pore distribution and porosity can be well controlled through the mask design and/or etching
conditions.
Fig. 2 SEM images of typical thin/well-tunable titanium LGDLs: (A) Pore morphology and
structure of Sample A1 with approximately 100 µm pore size and 0.30 porosity. (B) Pore
morphology and structure of Sample A2 with approximately 200 µm pore size and 0.30 porosity.
The porosity of the LGDL ε, is defined as the total pore area, AP, divided by the total area of the
entity, AH, which can be given as:
휀 =𝐴𝑃
𝐴𝐻=
√3
6
𝜋D2
(𝐷+𝐿)2 (1)
Page 9 of 31 Energy & Environmental Science
Ene
rgy
&E
nvir
onm
enta
lSci
ence
Acc
epte
dM
anus
crip
t
Publ
ishe
d on
11
Oct
ober
201
6. D
ownl
oade
d by
Uni
vers
ity o
f T
enne
ssee
at K
noxv
ille
on 1
1/10
/201
6 16
:47:
21.
View Article OnlineDOI: 10.1039/C6EE02368A
10
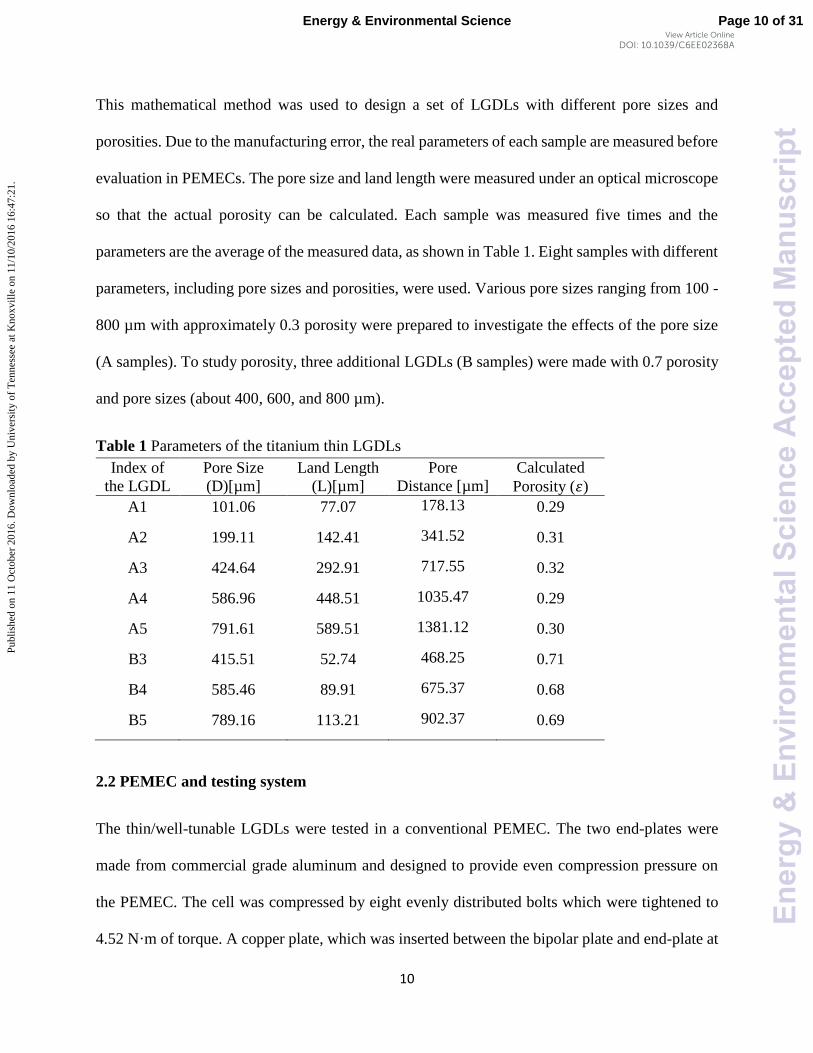
This mathematical method was used to design a set of LGDLs with different pore sizes and
porosities. Due to the manufacturing error, the real parameters of each sample are measured before
evaluation in PEMECs. The pore size and land length were measured under an optical microscope
so that the actual porosity can be calculated. Each sample was measured five times and the
parameters are the average of the measured data, as shown in Table 1. Eight samples with different
parameters, including pore sizes and porosities, were used. Various pore sizes ranging from 100 -
800 µm with approximately 0.3 porosity were prepared to investigate the effects of the pore size
(A samples). To study porosity, three additional LGDLs (B samples) were made with 0.7 porosity
and pore sizes (about 400, 600, and 800 µm).
Table 1 Parameters of the titanium thin LGDLs
Index of
the LGDL
Pore Size
(D)[µm]
Land Length
(L)[µm]
Pore
Distance [µm]
Calculated
Porosity (휀)
A1 101.06 77.07 178.13 0.29
A2 199.11 142.41 341.52 0.31
A3 424.64 292.91 717.55 0.32
A4 586.96 448.51 1035.47 0.29
A5 791.61 589.51 1381.12 0.30
B3 415.51 52.74 468.25 0.71
B4 585.46 89.91 675.37 0.68
B5 789.16 113.21 902.37 0.69
2.2 PEMEC and testing system
The thin/well-tunable LGDLs were tested in a conventional PEMEC. The two end-plates were
made from commercial grade aluminum and designed to provide even compression pressure on
the PEMEC. The cell was compressed by eight evenly distributed bolts which were tightened to
4.52 N·m of torque. A copper plate, which was inserted between the bipolar plate and end-plate at
Page 10 of 31Energy & Environmental Science
Ene
rgy
&E
nvir
onm
enta
lSci
ence
Acc
epte
dM
anus
crip
t
Publ
ishe
d on
11
Oct
ober
201
6. D
ownl
oade
d by
Uni
vers
ity o
f T
enne
ssee
at K
noxv
ille
on 1
1/10
/201
6 16
:47:
21.
View Article OnlineDOI: 10.1039/C6EE02368A
11
both the anode and cathode, was used to apply current to the PEMEC. The bipolar plates were
made of graphite and fabricated with a parallel flow field which was intended to introduce the
reactants and products in and out of the PEMEC. Titanium thin film with 25 µm thickness and
carbon paper (Toray 090 with 280 µm thickness and porosity of 0.78) were used as anode and
cathode LGDLs, respectively. The catalyst-coated membrane (CCM) (Electrolyzer CCM from
FuelCellsEtc, EZ-CCM) was comprised of a Nafion 115 membrane, a perfluorosulfonic polymer
with a thickness of 125 µm, an anode catalyst layer with an IrRuOx catalyst loading of 3.0 mg/cm2,
and a cathode layer with a platinum black (PtB) catalyst loading of 3.0 mg/cm2 with a 5 cm2
working area. Table 2 shows the detailed characteristics and experimental conditions.
The PEMEC was attached to an electrolyzer control system with current range up to 100 A and
voltage range up to 5 V. The hardware was connected to EC-Lab, an electrochemical analysis
software from Bio-Logic, which was used to evaluate performance and perform electrochemical
impedance spectroscopy (EIS). For controlling the flow, a system of tubing was connected to the
PEMEC. While the cathode tubing was merely intended to safely exhaust hydrogen gas that
formed during electrolysis, a diaphragm liquid pump from KNF Neuberger was used to supply de-
ionized (DI) water at a constant volumetric flow rate of 20 ml/min to the anode. The water bath
(General Purpose Water Baths of Model WB10 from PolyScience) was used to pre-heat the DI
water to designed temperatures. Two heaters used to heat the PEMEC were inserted into the end-
plates at both anode and cathode and two thermocouples used to measure the temperature were
inserted into the bipolar plates at both anode and cathode. Both of the heaters and thermocouples
were connected to a temperature control system (Multi-Zone controller from OMEGA).
For performance evaluation, an increasing current density was applied to the PEMEC and the
current was stepped up from a current density of 0.2 A/cm2 to 2.0 A/cm2 with a step of 10 mA/s.
Page 11 of 31 Energy & Environmental Science
Ene
rgy
&E
nvir
onm
enta
lSci
ence
Acc
epte
dM
anus
crip
t
Publ
ishe
d on
11
Oct
ober
201
6. D
ownl
oade
d by
Uni
vers
ity o
f T
enne
ssee
at K
noxv
ille
on 1
1/10
/201
6 16
:47:
21.
View Article OnlineDOI: 10.1039/C6EE02368A
12
Galvanostatic electrochemical impedance spectroscopy (GEIS) was used to measure the
impedance of the PEMEC at different operating conditions. In this method, the current is
controlled as opposed to the potential. The test station was equipped with an operating current
range of -100 A to +100 A and a voltage range of 0 V to 5 V. The current precision was 100 fA.
The scanning frequency was varied from 15 kHz to 10 mHz, and recorded 20 points of data per
decade. For analyzing impedance data, a Nyquist plot is normally used.
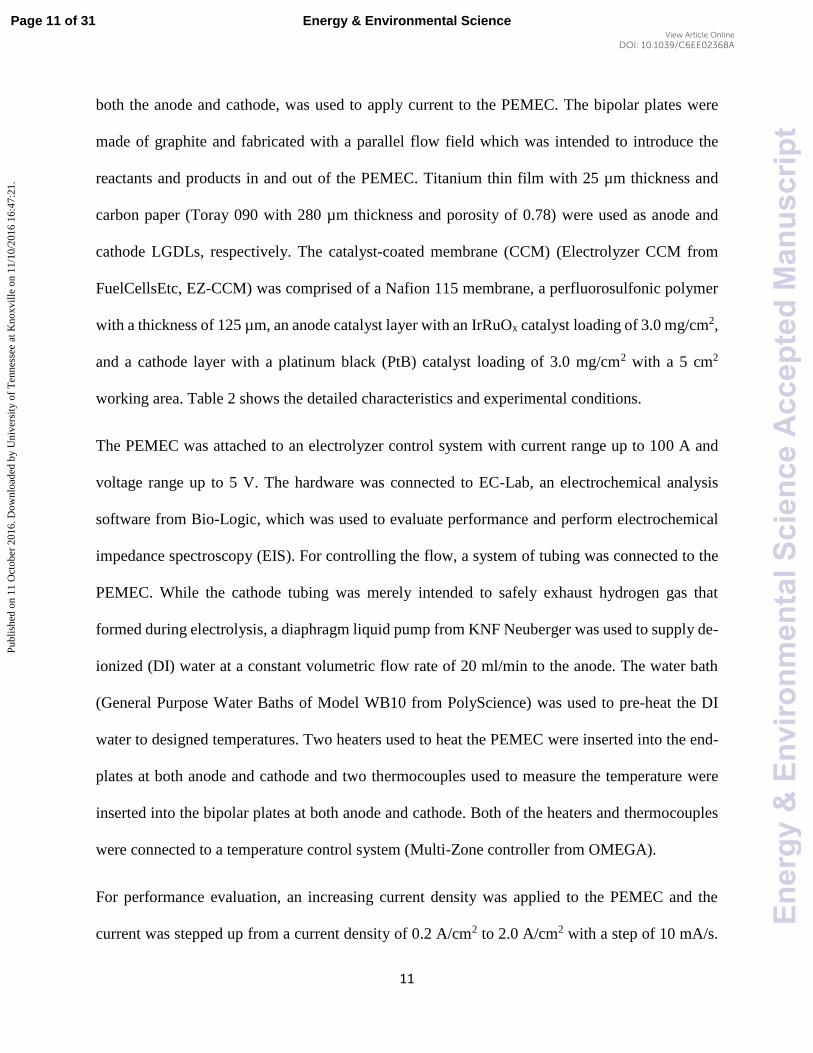
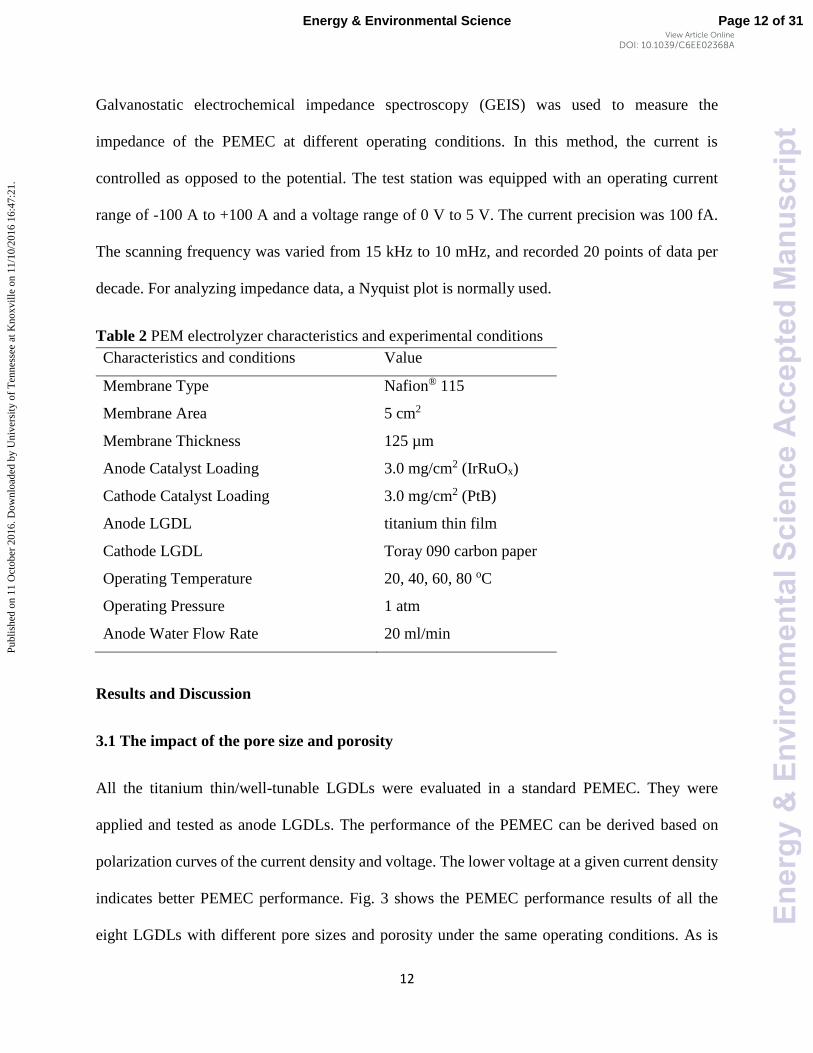
Table 2 PEM electrolyzer characteristics and experimental conditions
Characteristics and conditions Value
Membrane Type Nafion® 115
Membrane Area 5 cm2
Membrane Thickness 125 µm
Anode Catalyst Loading 3.0 mg/cm2 (IrRuOx)
Cathode Catalyst Loading 3.0 mg/cm2 (PtB)
Anode LGDL titanium thin film
Cathode LGDL Toray 090 carbon paper
Operating Temperature 20, 40, 60, 80 oC
Operating Pressure 1 atm
Anode Water Flow Rate 20 ml/min
Results and Discussion
3.1 The impact of the pore size and porosity
All the titanium thin/well-tunable LGDLs were evaluated in a standard PEMEC. They were
applied and tested as anode LGDLs. The performance of the PEMEC can be derived based on
polarization curves of the current density and voltage. The lower voltage at a given current density
indicates better PEMEC performance. Fig. 3 shows the PEMEC performance results of all the
eight LGDLs with different pore sizes and porosity under the same operating conditions. As is
Page 12 of 31Energy & Environmental Science
Ene
rgy
&E
nvir
onm
enta
lSci
ence
Acc
epte
dM
anus
crip
t
Publ
ishe
d on
11
Oct
ober
201
6. D
ownl
oade
d by
Uni
vers
ity o
f T
enne
ssee
at K
noxv
ille
on 1
1/10
/201
6 16
:47:
21.
View Article OnlineDOI: 10.1039/C6EE02368A
13
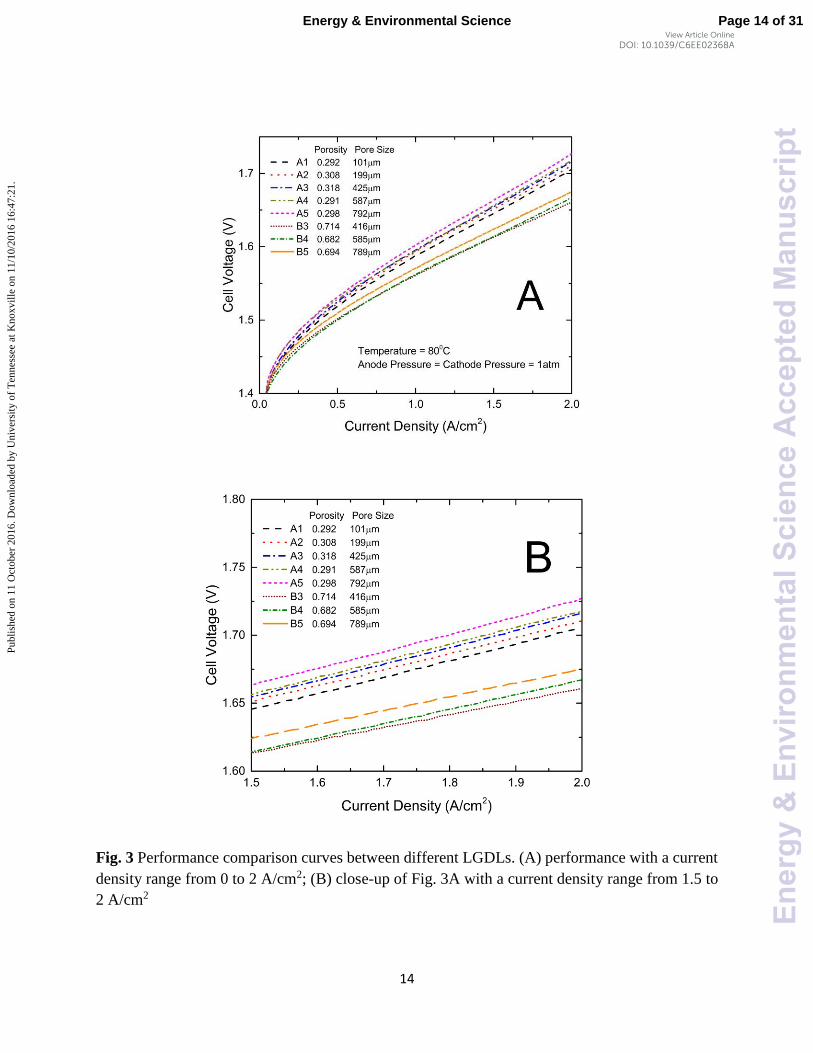
shown in Fig. 3, increasing the pore size from 101 µm to 791 µm (A1 to A5 with the same porosity
of about 0.3), the PEMEC performance decreases. The LGDL with a pore size of 791 µm (A5)
results in the worst performance among these five LGDLs. For instance, at a fixed current density
of 2 A/cm2, the required cell voltage increased from 1.705 V for the LGDL A1 to 1.726 V for A5,
although this is still much better than conventional LGDLs.38, 41, 43, 45, 48-52 The three LGDLs with
a larger porosity of about 0.7 and smaller pore distances (B3, B4, and B5), show further improved
performance over LGDLs with similar pore sizes but lower porosity/larger pore distance (A3, A4,
and A5), and the voltages required at a current density of 2 A/cm2 are just 1.661 V, 1.667 V, 1.675
V, respectively. With a lower porosity of about 0.3 and larger pore distances, the performance with
LGDLs of A3, A4 and A5 were in the range of 1.713 - 1.726 V at 2 A/cm2. It was noted that
porosity had a greater impact on performance than pore size.
Page 13 of 31 Energy & Environmental Science
Ene
rgy
&E
nvir
onm
enta
lSci
ence
Acc
epte
dM
anus
crip
t
Publ
ishe
d on
11
Oct
ober
201
6. D
ownl
oade
d by
Uni
vers
ity o
f T
enne
ssee
at K
noxv
ille
on 1
1/10
/201
6 16
:47:
21.
View Article OnlineDOI: 10.1039/C6EE02368A
14
Fig. 3 Performance comparison curves between different LGDLs. (A) performance with a current
density range from 0 to 2 A/cm2; (B) close-up of Fig. 3A with a current density range from 1.5 to
2 A/cm2
Page 14 of 31Energy & Environmental Science
Ene
rgy
&E
nvir
onm
enta
lSci
ence
Acc
epte
dM
anus
crip
t
Publ
ishe
d on
11
Oct
ober
201
6. D
ownl
oade
d by
Uni
vers
ity o
f T
enne
ssee
at K
noxv
ille
on 1
1/10
/201
6 16
:47:
21.
View Article OnlineDOI: 10.1039/C6EE02368A
15
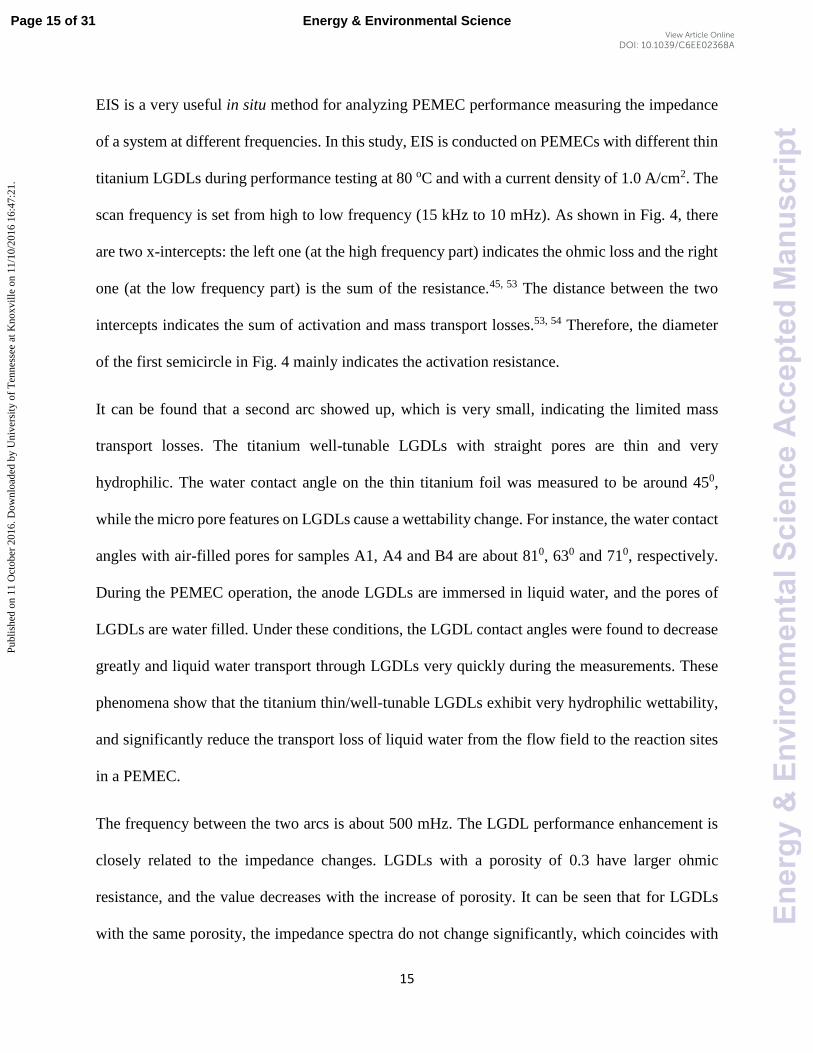
EIS is a very useful in situ method for analyzing PEMEC performance measuring the impedance
of a system at different frequencies. In this study, EIS is conducted on PEMECs with different thin
titanium LGDLs during performance testing at 80 oC and with a current density of 1.0 A/cm2. The
scan frequency is set from high to low frequency (15 kHz to 10 mHz). As shown in Fig. 4, there
are two x-intercepts: the left one (at the high frequency part) indicates the ohmic loss and the right
one (at the low frequency part) is the sum of the resistance.45, 53 The distance between the two
intercepts indicates the sum of activation and mass transport losses.53, 54 Therefore, the diameter
of the first semicircle in Fig. 4 mainly indicates the activation resistance.
It can be found that a second arc showed up, which is very small, indicating the limited mass
transport losses. The titanium well-tunable LGDLs with straight pores are thin and very
hydrophilic. The water contact angle on the thin titanium foil was measured to be around 450,
while the micro pore features on LGDLs cause a wettability change. For instance, the water contact
angles with air-filled pores for samples A1, A4 and B4 are about 810, 630 and 710, respectively.
During the PEMEC operation, the anode LGDLs are immersed in liquid water, and the pores of
LGDLs are water filled. Under these conditions, the LGDL contact angles were found to decrease
greatly and liquid water transport through LGDLs very quickly during the measurements. These
phenomena show that the titanium thin/well-tunable LGDLs exhibit very hydrophilic wettability,
and significantly reduce the transport loss of liquid water from the flow field to the reaction sites
in a PEMEC.
The frequency between the two arcs is about 500 mHz. The LGDL performance enhancement is
closely related to the impedance changes. LGDLs with a porosity of 0.3 have larger ohmic
resistance, and the value decreases with the increase of porosity. It can be seen that for LGDLs
with the same porosity, the impedance spectra do not change significantly, which coincides with
Page 15 of 31 Energy & Environmental Science
Ene
rgy
&E
nvir
onm
enta
lSci
ence
Acc
epte
dM
anus
crip
t
Publ
ishe
d on
11
Oct
ober
201
6. D
ownl
oade
d by
Uni
vers
ity o
f T
enne
ssee
at K
noxv
ille
on 1
1/10
/201
6 16
:47:
21.
View Article OnlineDOI: 10.1039/C6EE02368A
16
the result of the polarization curves. The ohmic loss decreases significantly from around 0.08
ohm*cm2 for the LGDL with a porosity of 0.3 to less than 0.07 ohm*cm2 for one with a porosity
of 0.7. It is also obvious that the 0.7 porosity LGDLs show smaller first and second arcs, which
indicates that the activation and mass transfer losses decrease with increasing porosity. The sum
of activation and mass transfer losses are reduced from about 0.046 ohm*cm2 for 0.3 porosity
LGDLs to 0.039 ohm*cm2 for 0.7 porosity LGDLs. The total losses from EIS decreased by 14%
when increasing porosity from 0.3 to 0.7. The detailed quantitative analysis of the EIS will be
discussed.
Fig. 4 EIS comparison curves between different LGDLs
3.2 Temperature Impact
Page 16 of 31Energy & Environmental Science
Ene
rgy
&E
nvir
onm
enta
lSci
ence
Acc
epte
dM
anus
crip
t
Publ
ishe
d on
11
Oct
ober
201
6. D
ownl
oade
d by
Uni
vers
ity o
f T
enne
ssee
at K
noxv
ille
on 1
1/10
/201
6 16
:47:
21.
View Article OnlineDOI: 10.1039/C6EE02368A
17
The open circuit voltage, membrane conductive and activation of a PEMEC have a close relation
with temperature.25 In order to get a full understanding of this effect on the thin titanium LGDL,
the PEMEC performance and EIS were evaluated at different temperatures. It can be expected that
the PEMEC operating temperature has a significant effect on the PEMEC performance. In this
study, PEMEC operating temperature was varied from 20 oC to 80 oC.
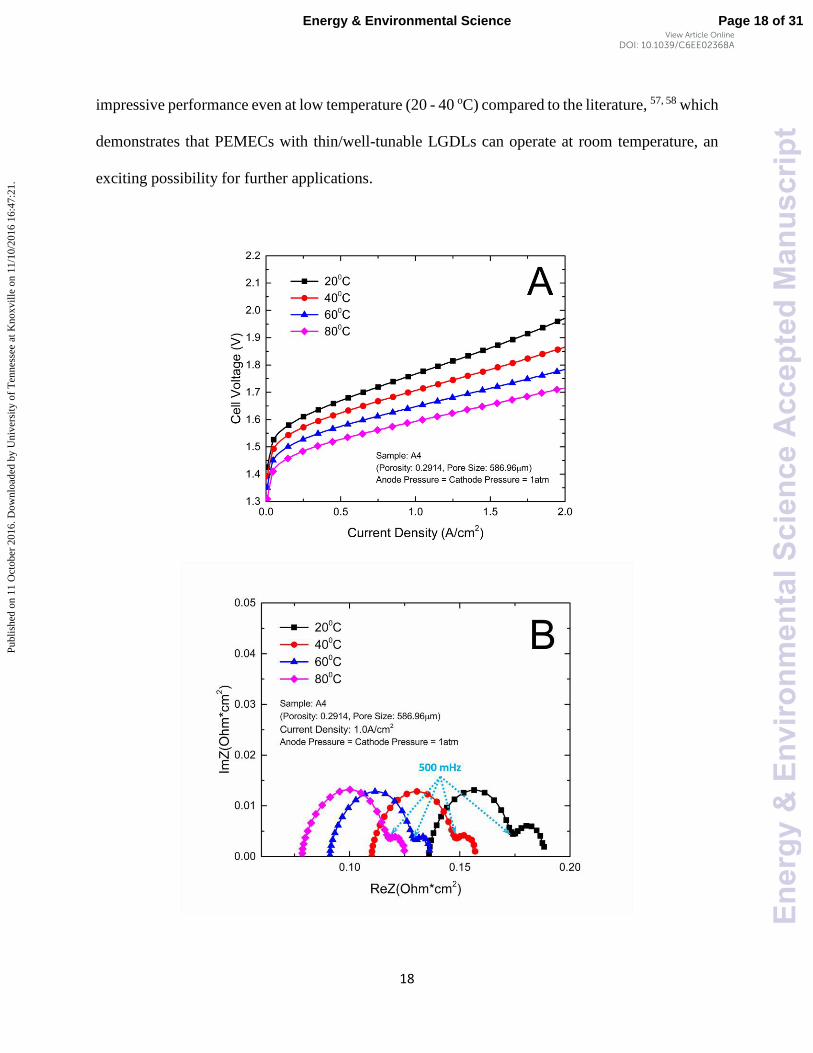
Fig. 5 illustrates the effect of operating temperature on the PEMEC performance and EIS. As
shown in Fig. 5(A), increasing the operating temperature results in a steady improvement in
PEMEC performance. At a current density of 2.0 A/cm2, the cell voltage of PEMEC assembled
with LGDL A4 is reduced from 1.971 V at 20 oC to 1.715 V at 80 oC. Fig. 5(B) shows that the
ohmic loss decreases significantly with the increase of PEMEC operating temperature.23-25 The
ohmic loss of the PEMEC consists of the resistances of each component, including PEM, CLs,
LGDLs, bipolar plates (BP), and interfacial resistances between components. With the increase of
the temperature, the proton conductivity of the PEM and CLs will increase gradually, leading to
decreased ohmic losses.55 The interfacial contacts between components will improve at higher
temperature, which will also reduce the ohmic loss of the PEMEC. The electrical resistivities of
LGDL and BP materials do not change much with the temperature range from 20 to 80 oC, and
their impacts on ohmic losses would be very limited. In addition, the higher temperature will result
in improved diffusion processes, catalytic activity and electrode kinetics, and promote oxygen and
hydrogen evolution reactions. Both the catalytic transfer coefficient and exchange current density
increase with the temperature.56 The mass transport in PEMECs will also be enhanced at higher
temperature. As shown in Fig. 5(B), the second arc of the EIS becomes smaller at higher
temperature. As a result, the PEMEC performance improves significantly with increasing
temperature. Most importantly, it can be noted that the PEMEC with the new LGDLs has an
Page 17 of 31 Energy & Environmental Science
Ene
rgy
&E
nvir
onm
enta
lSci
ence
Acc
epte
dM
anus
crip
t
Publ
ishe
d on
11
Oct
ober
201
6. D
ownl
oade
d by
Uni
vers
ity o
f T
enne
ssee
at K
noxv
ille
on 1
1/10
/201
6 16
:47:
21.
View Article OnlineDOI: 10.1039/C6EE02368A
18
impressive performance even at low temperature (20 - 40 oC) compared to the literature, 57, 58 which
demonstrates that PEMECs with thin/well-tunable LGDLs can operate at room temperature, an
exciting possibility for further applications.
Page 18 of 31Energy & Environmental Science
Ene
rgy
&E
nvir
onm
enta
lSci
ence
Acc
epte
dM
anus
crip
t
Publ
ishe
d on
11
Oct
ober
201
6. D
ownl
oade
d by
Uni
vers
ity o
f T
enne
ssee
at K
noxv
ille
on 1
1/10
/201
6 16
:47:
21.
View Article OnlineDOI: 10.1039/C6EE02368A
19
Fig. 5 Impact of temperature change on PEMEC. (A) performance curves comparison at different
temperature; (B) EIS curves comparison at different temperature
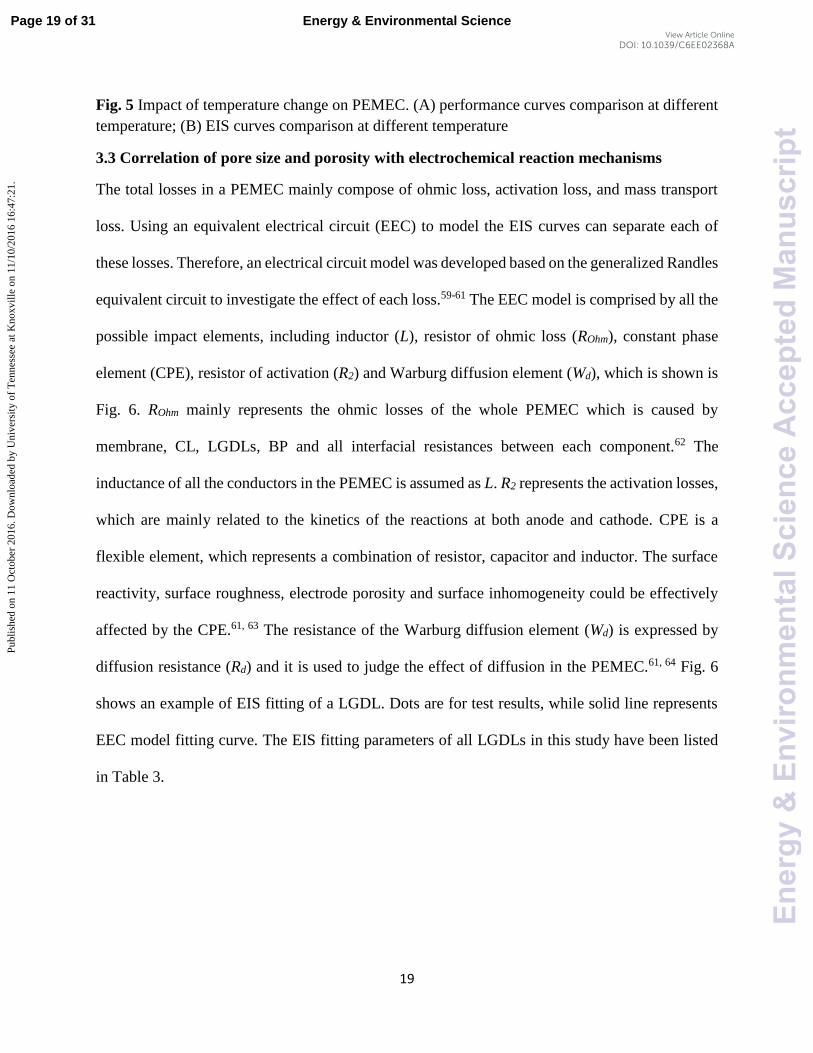
3.3 Correlation of pore size and porosity with electrochemical reaction mechanisms
The total losses in a PEMEC mainly compose of ohmic loss, activation loss, and mass transport
loss. Using an equivalent electrical circuit (EEC) to model the EIS curves can separate each of
these losses. Therefore, an electrical circuit model was developed based on the generalized Randles
equivalent circuit to investigate the effect of each loss.59-61 The EEC model is comprised by all the
possible impact elements, including inductor (L), resistor of ohmic loss (ROhm), constant phase
element (CPE), resistor of activation (R2) and Warburg diffusion element (Wd), which is shown is
Fig. 6. ROhm mainly represents the ohmic losses of the whole PEMEC which is caused by
membrane, CL, LGDLs, BP and all interfacial resistances between each component.62 The
inductance of all the conductors in the PEMEC is assumed as L. R2 represents the activation losses,
which are mainly related to the kinetics of the reactions at both anode and cathode. CPE is a
flexible element, which represents a combination of resistor, capacitor and inductor. The surface
reactivity, surface roughness, electrode porosity and surface inhomogeneity could be effectively
affected by the CPE.61, 63 The resistance of the Warburg diffusion element (Wd) is expressed by
diffusion resistance (Rd) and it is used to judge the effect of diffusion in the PEMEC.61, 64 Fig. 6
shows an example of EIS fitting of a LGDL. Dots are for test results, while solid line represents
EEC model fitting curve. The EIS fitting parameters of all LGDLs in this study have been listed
in Table 3.
Page 19 of 31 Energy & Environmental Science
Ene
rgy
&E
nvir
onm
enta
lSci
ence
Acc
epte
dM
anus
crip
t
Publ
ishe
d on
11
Oct
ober
201
6. D
ownl
oade
d by
Uni
vers
ity o
f T
enne
ssee
at K
noxv
ille
on 1
1/10
/201
6 16
:47:
21.
View Article OnlineDOI: 10.1039/C6EE02368A
20
Fig. 6 EIS results of sample A4 and its equivalent circuit fitting
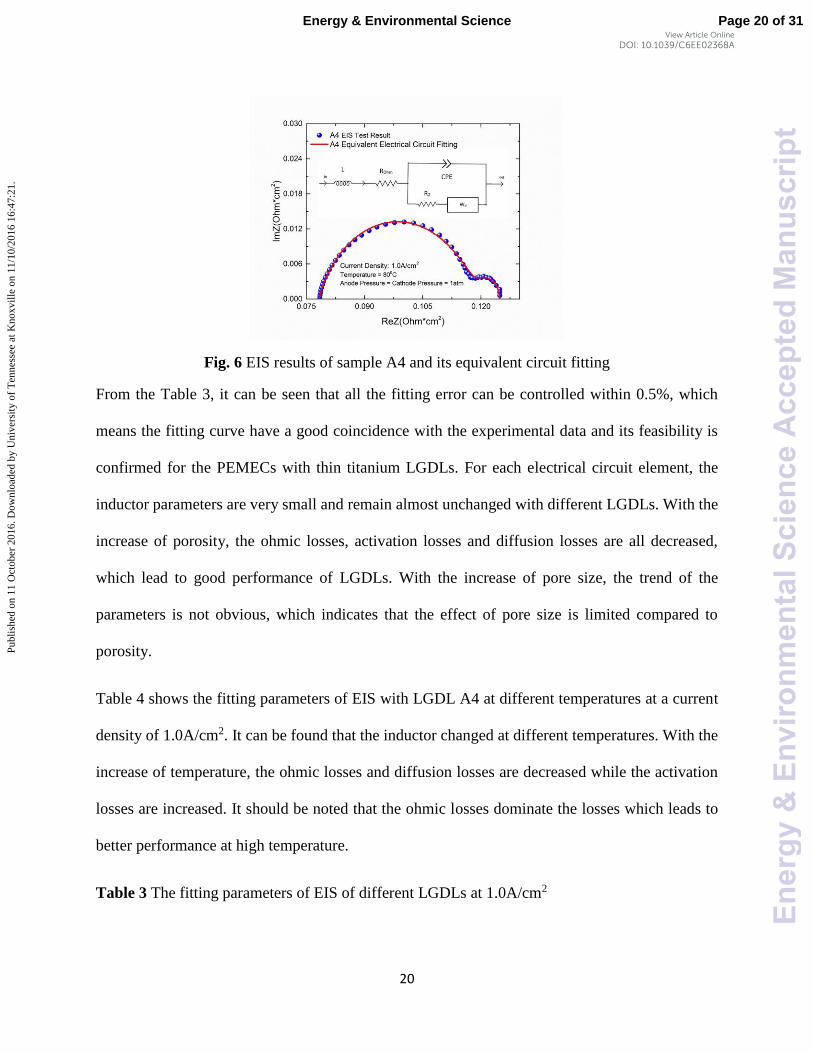
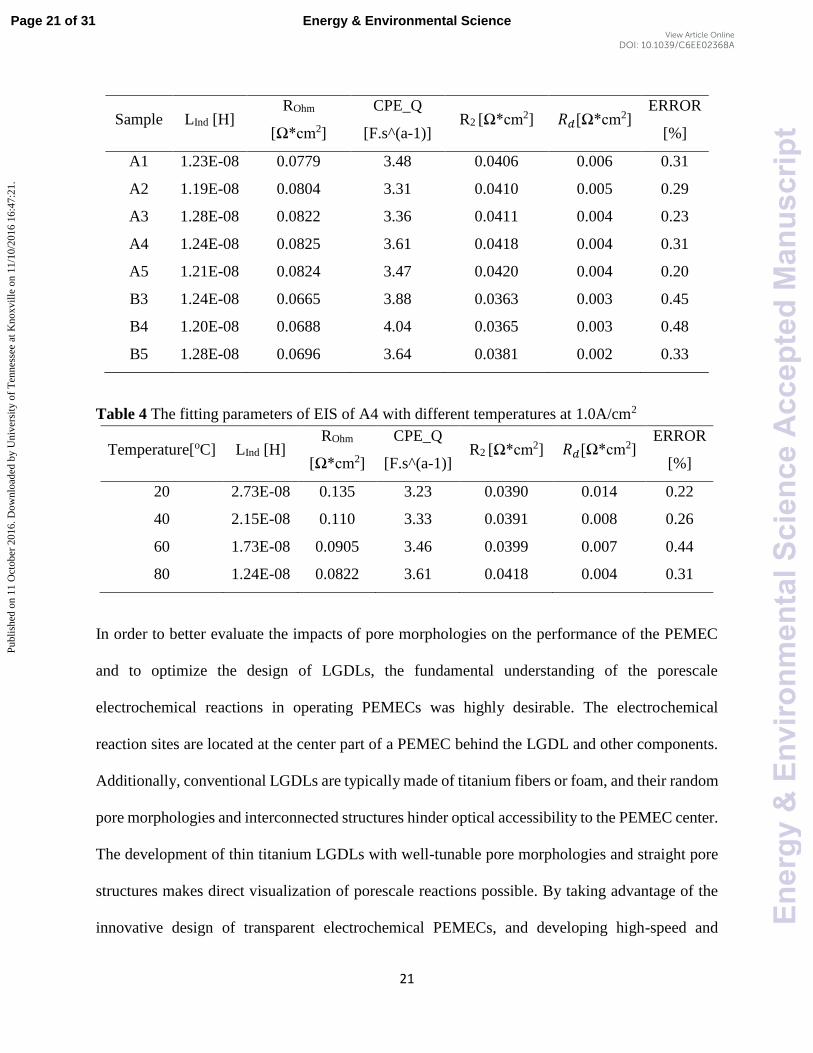
From the Table 3, it can be seen that all the fitting error can be controlled within 0.5%, which
means the fitting curve have a good coincidence with the experimental data and its feasibility is
confirmed for the PEMECs with thin titanium LGDLs. For each electrical circuit element, the
inductor parameters are very small and remain almost unchanged with different LGDLs. With the
increase of porosity, the ohmic losses, activation losses and diffusion losses are all decreased,
which lead to good performance of LGDLs. With the increase of pore size, the trend of the
parameters is not obvious, which indicates that the effect of pore size is limited compared to
porosity.
Table 4 shows the fitting parameters of EIS with LGDL A4 at different temperatures at a current
density of 1.0A/cm2. It can be found that the inductor changed at different temperatures. With the
increase of temperature, the ohmic losses and diffusion losses are decreased while the activation
losses are increased. It should be noted that the ohmic losses dominate the losses which leads to
better performance at high temperature.
Table 3 The fitting parameters of EIS of different LGDLs at 1.0A/cm2
Page 20 of 31Energy & Environmental Science
Ene
rgy
&E
nvir
onm
enta
lSci
ence
Acc
epte
dM
anus
crip
t
Publ
ishe
d on
11
Oct
ober
201
6. D
ownl
oade
d by
Uni
vers
ity o
f T
enne
ssee
at K
noxv
ille
on 1
1/10
/201
6 16
:47:
21.
View Article OnlineDOI: 10.1039/C6EE02368A
21
Sample LInd [H] ROhm
[Ω*cm2]
CPE_Q
[F.s^(a-1)] R2 [Ω*cm2] 𝑅𝑑[Ω*cm2]
ERROR
[%]
A1 1.23E-08 0.0779 3.48 0.0406 0.006 0.31
A2 1.19E-08 0.0804 3.31 0.0410 0.005 0.29
A3 1.28E-08 0.0822 3.36 0.0411 0.004 0.23
A4 1.24E-08 0.0825 3.61 0.0418 0.004 0.31
A5 1.21E-08 0.0824 3.47 0.0420 0.004 0.20
B3 1.24E-08 0.0665 3.88 0.0363 0.003 0.45
B4 1.20E-08 0.0688 4.04 0.0365 0.003 0.48
B5 1.28E-08 0.0696 3.64 0.0381 0.002 0.33
Table 4 The fitting parameters of EIS of A4 with different temperatures at 1.0A/cm2
Temperature[oC] LInd [H] ROhm
[Ω*cm2]
CPE_Q
[F.s^(a-1)] R2 [Ω*cm2] 𝑅𝑑[Ω*cm2]
ERROR
[%]
20 2.73E-08 0.135 3.23 0.0390 0.014 0.22
40 2.15E-08 0.110 3.33 0.0391 0.008 0.26
60 1.73E-08 0.0905 3.46 0.0399 0.007 0.44
80 1.24E-08 0.0822 3.61 0.0418 0.004 0.31
In order to better evaluate the impacts of pore morphologies on the performance of the PEMEC
and to optimize the design of LGDLs, the fundamental understanding of the porescale
electrochemical reactions in operating PEMECs was highly desirable. The electrochemical
reaction sites are located at the center part of a PEMEC behind the LGDL and other components.
Additionally, conventional LGDLs are typically made of titanium fibers or foam, and their random
pore morphologies and interconnected structures hinder optical accessibility to the PEMEC center.
The development of thin titanium LGDLs with well-tunable pore morphologies and straight pore
structures makes direct visualization of porescale reactions possible. By taking advantage of the
innovative design of transparent electrochemical PEMECs, and developing high-speed and
Page 21 of 31 Energy & Environmental Science
Ene
rgy
&E
nvir
onm
enta
lSci
ence
Acc
epte
dM
anus
crip
t
Publ
ishe
d on
11
Oct
ober
201
6. D
ownl
oade
d by
Uni
vers
ity o
f T
enne
ssee
at K
noxv
ille
on 1
1/10
/201
6 16
:47:
21.
View Article OnlineDOI: 10.1039/C6EE02368A
22
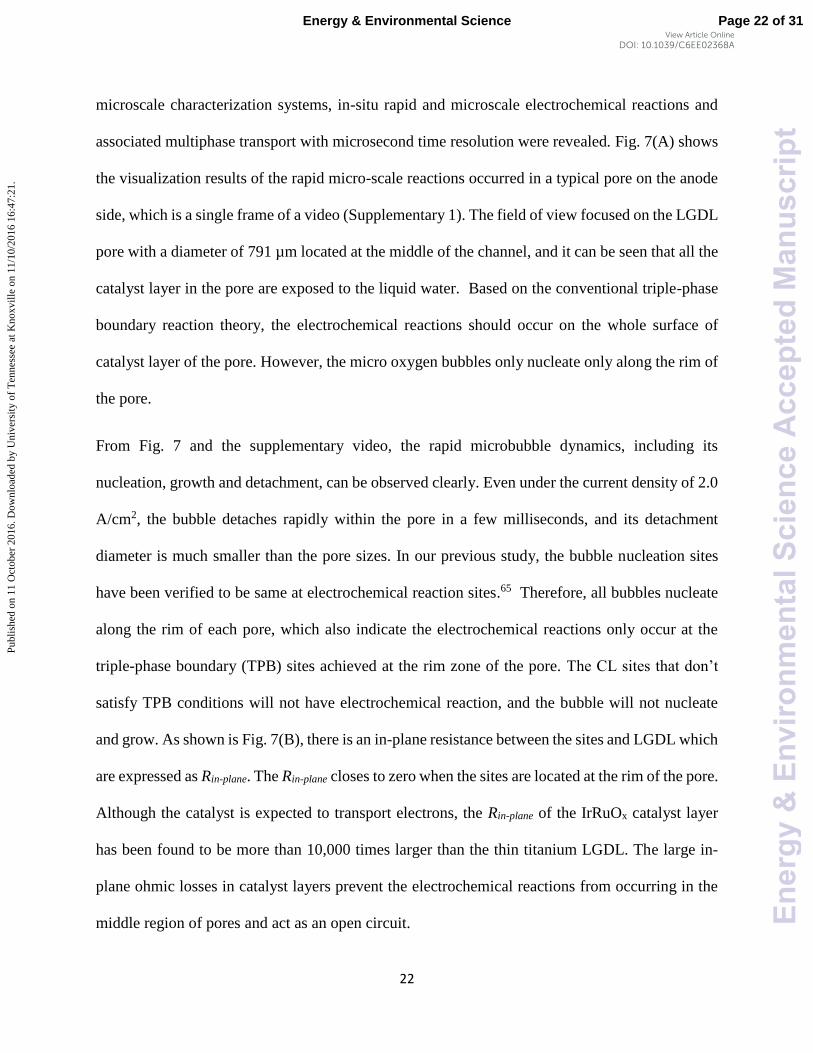
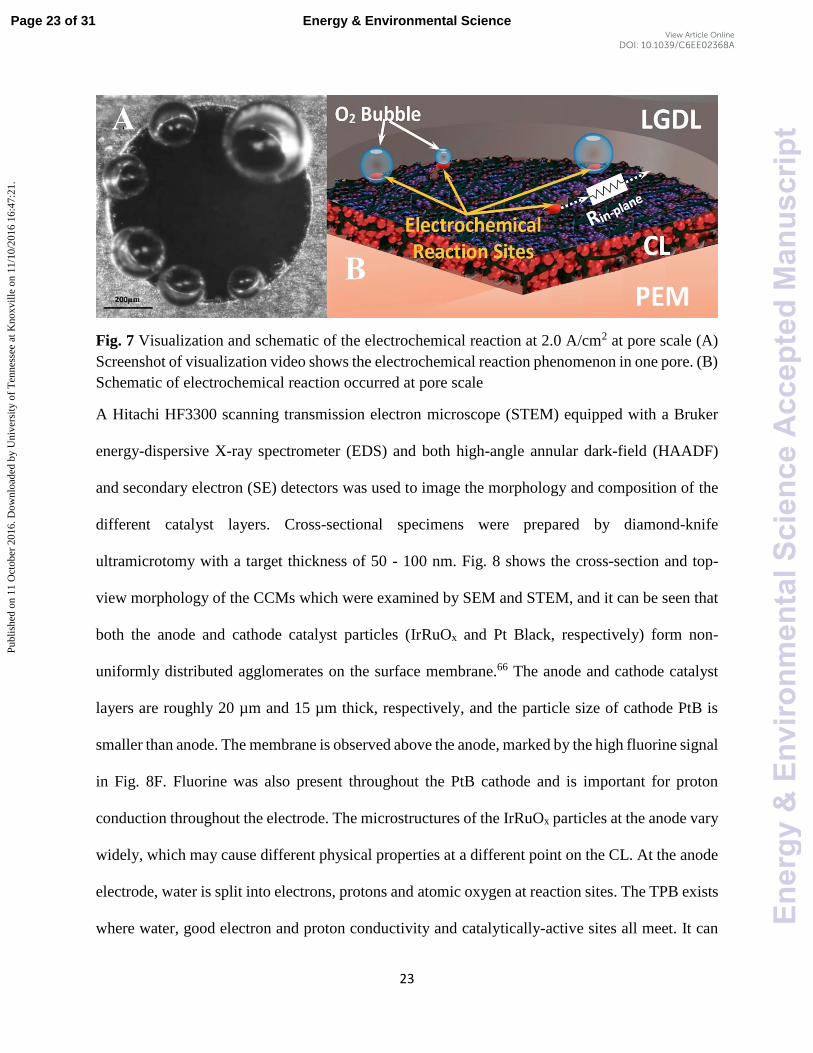
microscale characterization systems, in-situ rapid and microscale electrochemical reactions and
associated multiphase transport with microsecond time resolution were revealed. Fig. 7(A) shows
the visualization results of the rapid micro-scale reactions occurred in a typical pore on the anode
side, which is a single frame of a video (Supplementary 1). The field of view focused on the LGDL
pore with a diameter of 791 µm located at the middle of the channel, and it can be seen that all the
catalyst layer in the pore are exposed to the liquid water. Based on the conventional triple-phase
boundary reaction theory, the electrochemical reactions should occur on the whole surface of
catalyst layer of the pore. However, the micro oxygen bubbles only nucleate only along the rim of
the pore.
From Fig. 7 and the supplementary video, the rapid microbubble dynamics, including its
nucleation, growth and detachment, can be observed clearly. Even under the current density of 2.0
A/cm2, the bubble detaches rapidly within the pore in a few milliseconds, and its detachment
diameter is much smaller than the pore sizes. In our previous study, the bubble nucleation sites
have been verified to be same at electrochemical reaction sites.65 Therefore, all bubbles nucleate
along the rim of each pore, which also indicate the electrochemical reactions only occur at the
triple-phase boundary (TPB) sites achieved at the rim zone of the pore. The CL sites that don’t
satisfy TPB conditions will not have electrochemical reaction, and the bubble will not nucleate
and grow. As shown is Fig. 7(B), there is an in-plane resistance between the sites and LGDL which
are expressed as Rin-plane. The Rin-plane closes to zero when the sites are located at the rim of the pore.
Although the catalyst is expected to transport electrons, the Rin-plane of the IrRuOx catalyst layer
has been found to be more than 10,000 times larger than the thin titanium LGDL. The large in-
plane ohmic losses in catalyst layers prevent the electrochemical reactions from occurring in the
middle region of pores and act as an open circuit.
Page 22 of 31Energy & Environmental Science
Ene
rgy
&E
nvir
onm
enta
lSci
ence
Acc
epte
dM
anus
crip
t
Publ
ishe
d on
11
Oct
ober
201
6. D
ownl
oade
d by
Uni
vers
ity o
f T
enne
ssee
at K
noxv
ille
on 1
1/10
/201
6 16
:47:
21.
View Article OnlineDOI: 10.1039/C6EE02368A
23
Fig. 7 Visualization and schematic of the electrochemical reaction at 2.0 A/cm2 at pore scale (A)
Screenshot of visualization video shows the electrochemical reaction phenomenon in one pore. (B)
Schematic of electrochemical reaction occurred at pore scale
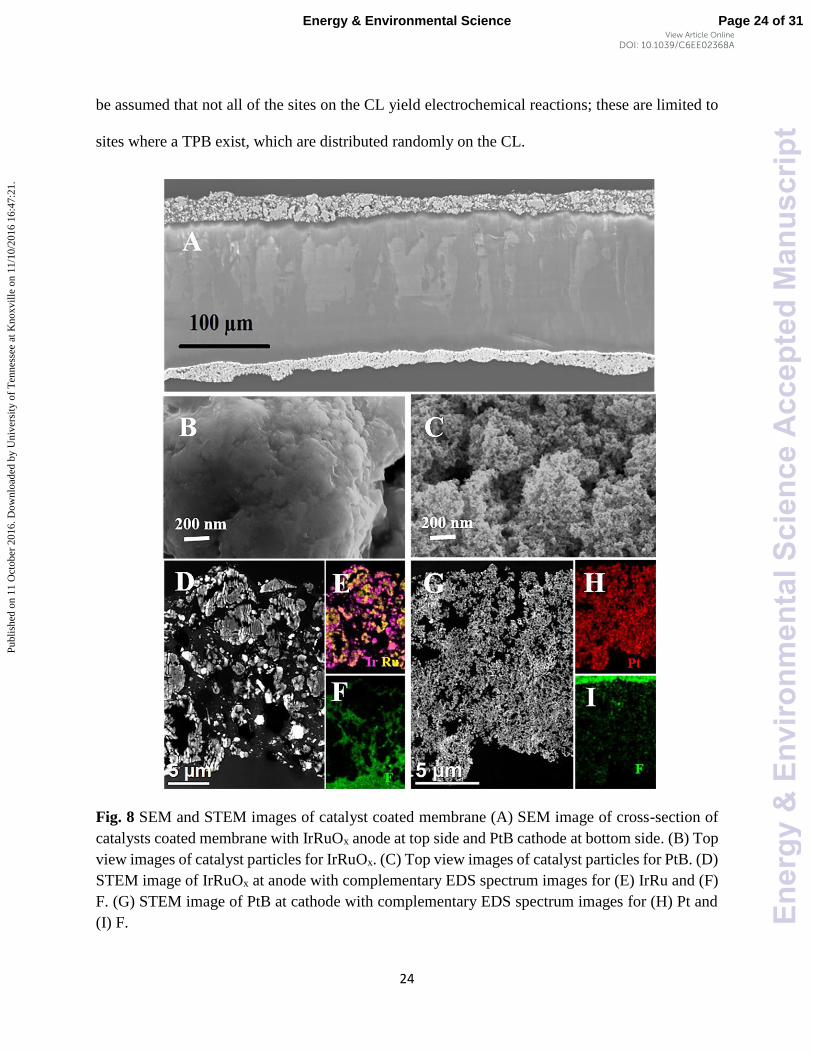
A Hitachi HF3300 scanning transmission electron microscope (STEM) equipped with a Bruker
energy-dispersive X-ray spectrometer (EDS) and both high-angle annular dark-field (HAADF)
and secondary electron (SE) detectors was used to image the morphology and composition of the
different catalyst layers. Cross-sectional specimens were prepared by diamond-knife
ultramicrotomy with a target thickness of 50 - 100 nm. Fig. 8 shows the cross-section and top-
view morphology of the CCMs which were examined by SEM and STEM, and it can be seen that
both the anode and cathode catalyst particles (IrRuOx and Pt Black, respectively) form non-
uniformly distributed agglomerates on the surface membrane.66 The anode and cathode catalyst
layers are roughly 20 µm and 15 µm thick, respectively, and the particle size of cathode PtB is
smaller than anode. The membrane is observed above the anode, marked by the high fluorine signal
in Fig. 8F. Fluorine was also present throughout the PtB cathode and is important for proton
conduction throughout the electrode. The microstructures of the IrRuOx particles at the anode vary
widely, which may cause different physical properties at a different point on the CL. At the anode
electrode, water is split into electrons, protons and atomic oxygen at reaction sites. The TPB exists
where water, good electron and proton conductivity and catalytically-active sites all meet. It can
Page 23 of 31 Energy & Environmental Science
Ene
rgy
&E
nvir
onm
enta
lSci
ence
Acc
epte
dM
anus
crip
t
Publ
ishe
d on
11
Oct
ober
201
6. D
ownl
oade
d by
Uni
vers
ity o
f T
enne
ssee
at K
noxv
ille
on 1
1/10
/201
6 16
:47:
21.
View Article OnlineDOI: 10.1039/C6EE02368A
24
be assumed that not all of the sites on the CL yield electrochemical reactions; these are limited to
sites where a TPB exist, which are distributed randomly on the CL.
Fig. 8 SEM and STEM images of catalyst coated membrane (A) SEM image of cross-section of
catalysts coated membrane with IrRuOx anode at top side and PtB cathode at bottom side. (B) Top
view images of catalyst particles for IrRuOx. (C) Top view images of catalyst particles for PtB. (D)
STEM image of IrRuOx at anode with complementary EDS spectrum images for (E) IrRu and (F)
F. (G) STEM image of PtB at cathode with complementary EDS spectrum images for (H) Pt and
(I) F.
Page 24 of 31Energy & Environmental Science
Ene
rgy
&E
nvir
onm
enta
lSci
ence
Acc
epte
dM
anus
crip
t
Publ
ishe
d on
11
Oct
ober
201
6. D
ownl
oade
d by
Uni
vers
ity o
f T
enne
ssee
at K
noxv
ille
on 1
1/10
/201
6 16
:47:
21.
View Article OnlineDOI: 10.1039/C6EE02368A
25
From the above phenomena and conclusions, some assumptions are made to establish a model that
could investigate the performance of PEMEC using titanium thin/well-tunable LGDLs: (a) there
are n reaction sites on each length l on the rim of the pore; (b) δRm is the local resistance of the
reaction site m, all reaction sites are in parallel with each other (The difference of resistance
between each sites probably due to the non-uniformly distributed anode catalysts which can be
seen in Fig. 8.); (c) At is the active reaction area of the PEMEC which is 5 cm2 in this study; (d) D
and ε are the pore diameter and porosity of the thin LGDL, respectively; (e) I is the current of the
PEMEC. So the total reaction sites N can be calculated by equation (2).
𝑁 = 4𝐴𝑡 ×𝑛
𝑙×
𝜀
𝐷 (2)
It can be found that with the increase of porosity or decrease of pore size, the total reaction sites
will increase correspondingly. When the current, I, is kept constant, the hydrogen/oxygen
production rate will remain unchanged according to Faraday’s Law. So the production rate at each
reaction sites will decrease when the number of reaction sites is increased in order to keep a
constant total gas producing rate. For each local reaction site, the local voltage, Vm, can be
expressed as:
𝑉𝑚 = 𝐼𝑚 × 𝛿𝑅𝑚 (𝑚 = 1,2,3 ⋯ 𝑁) (3)
Where, Im is the local current at each reaction site and it has a relation with PEMEC current I.
𝐼 = ∑ 𝐼𝑚𝑁𝑚=1 (4)
The Vm of different reaction sites will be the same due to the parallel relation between all the
reaction sites. So the local current density may vary because of the different local resistance and
area of each reaction site, which will cause different oxygen production rates at different reaction
Page 25 of 31 Energy & Environmental Science
Ene
rgy
&E
nvir
onm
enta
lSci
ence
Acc
epte
dM
anus
crip
t
Publ
ishe
d on
11
Oct
ober
201
6. D
ownl
oade
d by
Uni
vers
ity o
f T
enne
ssee
at K
noxv
ille
on 1
1/10
/201
6 16
:47:
21.
View Article OnlineDOI: 10.1039/C6EE02368A

26
sites; this phenomenon can be confirmed from the visualization video. When the current remains
unchanged, the local current will decrease with the increase of total reaction sites N. As a result,
the local voltage, Vm, will decrease which will result in the decrease of the cell voltage.
So, it can be concluded that as the total reaction sites increases, the cell voltage of the PEMEC will
decrease. It can also be found that with larger pore size, a large amount of catalyst sites located
away from the rim will not behave normally due to the large in-plane resistance, which will result
in worse performance and catalyst underutilization. By increasing the porosity or decreasing the
pore size, the number of reaction sites can be increased and more catalysts are active. Meanwhile,
the total ohmic losses can be decreased due to more parallel resistances which exist in the
equivalent circuit, which will lead to better performance. On the other hand, the increase of the
total reaction sites N means more active catalyst, which will impact the kinetics and decrease the
activation loss. In the Butler-Volmer model of kinetics, the activation potential is related to many
factors, such as reaction mechanism, catalyst morphology, operating parameters, species
concentrations and so on.55 The larger porosity LGDLs with more reaction sites will lead to a
larger roughness factor which causes higher effective exchange current density and result in a
smaller activation overpotential. It can be concluded that the smaller ohmic loss and activation loss
are the two main reasons why larger porosity thin LGDLs can achieve better performance.
Conclusion
In this study, a set of thin and planar titanium LGDLs with well-tunable pore morphologies are
developed to promote PEMEC performance, and to precisely investigate the impacts of the LGDL
pore size and porosity. The thin LGDLs have exhibited exceptional performance. At a current
density of 2.0 A/cm2 with a porosity of 0.7 and a pore size of 400 µm, the required voltage reaches
1.661 V, the lowest value that has been publicly reported so far. The PEMEC has a better
Page 26 of 31Energy & Environmental Science
Ene
rgy
&E
nvir
onm
enta
lSci
ence
Acc
epte
dM
anus
crip
t
Publ
ishe
d on
11
Oct
ober
201
6. D
ownl
oade
d by
Uni
vers
ity o
f T
enne
ssee
at K
noxv
ille
on 1
1/10
/201
6 16
:47:
21.
View Article OnlineDOI: 10.1039/C6EE02368A
27
performance with a larger porosity under a fixed pore size. It can also be found that the PEMEC
performance decreases gradually with the increase of pore size from 100 to 800 µm, but pore-size
impacts are not as significant as porosity. Additionally, operating temperatures have a large impact
on the PEMEC performance. The PEMEC performance is significantly improved when the
temperature increased from 20 oC to 80 oC. For better understanding the performance mechanisms,
EIS evaluations are conducted and comprehensive equivalent electrical circuits, including CPE
and Warburg diffusion element, are established to quantify the ohmic, activation and transport
losses, respectively. The thin/well-tunable titanium-based LGDLs remarkably reduce mass
transport, ohmic and activation losses. By taking advantage of the straight-through pores of the
novel LGDLs and transparent PEMECs, the direct visualizations of the electrochemical reactions
were captured with a high-speed and micro-scale visualization system to interpret the effects of
pore size and porosity on the PEMEC performance. The observation reveals that the oxygen bubble
only generated and nucleated at the rim of the pores and the PEMEC performance is closely related
to the number of the reaction sites. Larger porosity and smaller pore size will increase the reaction
sites and enhance the PEMEC performance. Furthermore, due to the thin feature of the novel
LGDL, not only the thickness/volume/weight of the PEMEC stack can be reduced greatly, but also
the materials used for LGDLs can be decreased which helps to reduce the cost. The precisely
controlled pore parameters are extremely valuable to advance numerical modeling of
electrochemical reactions and associated multiphase flow as well. Because all titanium thin
LGDLs in this study have a better performance than the conventional ones (like titanium felt), they
are expected to have many potential applications in energy and environmental engineering. More
work will be performed to investigate the other parameters that may have affect the PEMEC
performance.
Page 27 of 31 Energy & Environmental Science
Ene
rgy
&E
nvir
onm
enta
lSci
ence
Acc
epte
dM
anus
crip
t
Publ
ishe
d on
11
Oct
ober
201
6. D
ownl
oade
d by
Uni
vers
ity o
f T
enne
ssee
at K
noxv
ille
on 1
1/10
/201
6 16
:47:
21.
View Article OnlineDOI: 10.1039/C6EE02368A
28
Acknowledgements
The authors greatly appreciate the support from U.S. Department of Energy's National Energy
Technology Laboratory under Award DE-FE0011585. This research was partially conducted at
the Center for Nanophase Materials Sciences, which is a DOE Office of Science User Facility. The
authors also wish to express their appreciation to Dr. Bo Han, Dr. Lee Leonard, Dr. Jacqueline
Anne Johnson, William Barnhill, Stuart Steen, Alexander Terekhov, Douglas Warnberg, Kate
Lansford, and Andrew Mays for their help.
References
1. J. W. Ager, M. R. Shaner, K. A. Walczak, I. D. Sharp and S. Ardo, Energ Environ Sci, 2015, 8, 2811-2824.
2. W. T. Hong, M. Risch, K. A. Stoerzinger, A. Grimaud, J. Suntivich and Y. Shao-Horn, Energ Environ Sci, 2015, 8, 1404-1427.
3. J. A. Turner, Science, 1999, 285, 687-689. 4. W. Isherwood, J. R. Smith, S. M. Aceves, G. Berry, W. Clark, R. Johnson, D. Das, D. Goering and R.
Seifert, Energy, 2000, 25, 1005-1020. 5. X. Chen, C. Li, M. Grätzel, R. Kostecki and S. S. Mao, Chem Soc Rev, 2012, 41, 7909-7937. 6. C. A. Rodriguez, M. A. Modestino, D. Psaltis and C. Moser, Energ Environ Sci, 2014, 7, 3828-3835. 7. Y. Hou, M. R. Lohe, J. Zhang, S. Liu, X. Zhuang and X. Feng, Energ Environ Sci, 2016. 8. X. Lai, J. E. Halpert and D. Wang, Energ Environ Sci, 2012, 5, 5604-5618. 9. H. Tang, C. M. Hessel, J. Wang, N. Yang, R. Yu, H. Zhao and D. Wang, Chem Soc Rev, 2014, 43, 4281-
4299. 10. M. Debe, S. Hendricks, G. Vernstrom, M. Meyers, M. Brostrom, M. Stephens, Q. Chan, J. Willey,
M. Hamden and C. K. Mittelsteadt, J Electrochem Soc, 2012, 159, K165-K176. 11. A. Javadekar, A. Jayakumar, R. J. Gorte, J. M. Vohs and D. Buttrey, J Electrochem Soc, 2012, 159,
A386-A389. 12. D. Shapiro, J. Duffy, M. Kimble and M. Pien, Sol Energy, 2005, 79, 544-550. 13. W. Smith, J Power Sources, 2000, 86, 74-83. 14. H.-Y. Jung, S.-Y. Huang and B. N. Popov, J Power Sources, 2010, 195, 1950-1956. 15. F. Barbir, Sol Energy, 2005, 78, 661-669. 16. D.-H. Ha, B. Han, M. Risch, L. Giordano, K. P. Yao, P. Karayaylali and Y. Shao-Horn, Nano Energy,
2016. 17. J. Baxter, Z. Bian, G. Chen, D. Danielson, M. S. Dresselhaus, A. G. Fedorov, T. S. Fisher, C. W. Jones,
E. Maginn and U. Kortshagen, Energ Environ Sci, 2009, 2, 559-588. 18. M. B. Gorensek and C. W. Forsberg, Int J Hydrogen Energ, 2009, 34, 4237-4242. 19. M. Uzunoglu, O. Onar and M. Alam, Renew Energ, 2009, 34, 509-520. 20. C.-j. Liu, U. Burghaus, F. Besenbacher and Z. L. Wang, Acs Nano, 2010, 4, 5517-5526. 21. H. Oh, J. Park, K. Min, E. Lee and J.-Y. Jyoung, Appl Energ, 2015, 149, 186-193.
Page 28 of 31Energy & Environmental Science
Ene
rgy
&E
nvir
onm
enta
lSci
ence
Acc
epte
dM
anus
crip
t
Publ
ishe
d on
11
Oct
ober
201
6. D
ownl
oade
d by
Uni
vers
ity o
f T
enne
ssee
at K
noxv
ille
on 1
1/10
/201
6 16
:47:
21.
View Article OnlineDOI: 10.1039/C6EE02368A
29
22. J. Qi, X. Lai, J. Wang, H. Tang, H. Ren, Y. Yang, Q. Jin, L. Zhang, R. Yu and G. Ma, Chemical Society Reviews, 2015, 44, 6749-6773.
23. B. Han, J. Mo, Z. Kang and F.-Y. Zhang, Electrochimica Acta, 2016, 188, 317-326. 24. B. Han, J. Mo, Z. Kang and F.-Y. Zhang, AIAA 2015-3915, 2015. 25. B. Han, S. M. Steen, J. Mo and F.-Y. Zhang, Int J Hydrogen Energ, 2015, 40, 7006-7016. 26. J. Fall, D. Humphreys and S. Guo, J Fuel Cell Sci Tech, 2009, 6, 031003. 27. G. Chen, C. C. Waraksa, H. Cho, D. D. Macdonald and T. E. Mallouka, J Electrochem Soc, 2003, 150,
E423-E428. 28. J. O. M. Bockris, Materials, 2011, 4, 2073-2091. 29. A. Nikiforov, I. Petrushina, E. Christensen, A. Tomás-García and N. Bjerrum, Int J Hydrogen Energ,
2011, 36, 111-119. 30. R. E. Fuentes, J. Farell and J. W. Weidner, Electrochemical and Solid-State Letters, 2011, 14, E5-E7. 31. S. S. Dihrab, K. Sopian, M. Alghoul and M. Y. Sulaiman, Renewable and Sustainable Energy Reviews,
2009, 13, 1663-1668. 32. J. Mo, S. M. Steen, F.-Y. Zhang, T. J. Toops, M. P. Brady and J. B. Green, Int J Hydrogen Energ, 2015,
40, 12506–12511. 33. F.-Y. Zhang, S. G. Advani and A. K. Prasad, J Power Sources, 2008, 176, 293-298. 34. T. Matsuura, M. Kato and M. Hori, J Power Sources, 2006, 161, 74-78. 35. S. Arisetty, A. K. Prasad and S. G. Advani, J Power Sources, 2007, 165, 49-57. 36. H. Tawfik, Y. Hung and D. Mahajan, J Power Sources, 2007, 163, 755-767. 37. H. Wang and J. Turner, Fuel Cells, 2010, 10, 510-519. 38. S. Grigoriev, P. Millet, S. Volobuev and V. Fateev, Int J Hydrogen Energ, 2009, 34, 4968-4973. 39. P. Millet, D. Dragoe, S. Grigoriev, V. Fateev and C. Etievant, Int J Hydrogen Energ, 2009, 34, 4974-
4982. 40. L. Ma, S. Sui and Y. Zhai, Int J Hydrogen Energ, 2009, 34, 678-684. 41. C. M. Hwang, M. Ishida, H. Ito, T. Maeda, A. Nakano, Y. Hasegawa, N. Yokoi, A. Kato and T. Yoshida,
Int J Hydrogen Energ, 2011, 36, 1740-1753. 42. C. M. Hwang, M. Ishida, H. Ito, T. Maeda, A. Nakano, A. Kato and T. Yoshida, J Power Sources, 2012,
202, 108-113. 43. H. Ito, T. Maeda, A. Nakano, C. M. Hwang, M. Ishida, A. Kato and T. Yoshida, Int J Hydrogen Energ,
2012, 37, 7418-7428. 44. H. Ito, T. Maeda, A. Nakano, A. Kato and T. Yoshida, Electrochim Acta, 2013, 100, 242-248. 45. J. Mo, S. M. Steen, B. H. III, Z. Kang, A. Terekhov, F.-Y. Zhang, S. T. Retterer and D. A. Cullen, AIAA
2015-3914, 2015. 46. J. Mo, S. M. Steen, S. Retterer, D. A. Cullen, A. Terekhov and F.-Y. Zhang, ECS Transactions, 2015,
66, 3-10. 47. F.-Y. Zhang, A. K. Prasad and S. G. Advani, J Micromech Microeng, 2006, 16, N23. 48. M. Carmo, D. L. Fritz, J. Mergel and D. Stolten, Int J Hydrogen Energ, 2013, 38, 4901-4934. 49. A. T. Marshall, S. Sunde, M. Tsypkin and R. Tunold, Int J Hydrogen Energ, 2007, 32, 2320-2324. 50. J. Xu, G. Liu, J. Li and X. Wang, Electrochimica acta, 2012, 59, 105-112. 51. J. Xu, R. Miao, T. Zhao, J. Wu and X. Wang, Electrochem Commun, 2011, 13, 437-439. 52. J. Mo, Z. Kang, G. Yang, S. T. Retterer, D. A. Cullen, T. J. Toops, J. B. Green and F.-Y. Zhang, Applied
Energy, 2016, 177, 817-822. 53. S. Sun, Y. Xiao, D. Liang, Z. Shao, H. Yu, M. Hou and B. Yi, Rsc Adv, 2015, 5, 14506-14513. 54. N. Dale, M. Mann, H. Salehfar, A. Dhirde and T. Han, J Fuel Cell Sci Tech, 2010, 7, 031010. 55. M. M. Mench, Fuel cell engines, John Wiley & Sons, 2008. 56. H. Su, V. Linkov and B. J. Bladergroen, Int J Hydrogen Energ, 2013, 38, 9601-9608. 57. J. M. Spurgeon and N. S. Lewis, Energ Environ Sci, 2011, 4, 2993-2998.
Page 29 of 31 Energy & Environmental Science
Ene
rgy
&E
nvir
onm
enta
lSci
ence
Acc
epte
dM
anus
crip
t
Publ
ishe
d on
11
Oct
ober
201
6. D
ownl
oade
d by
Uni
vers
ity o
f T
enne
ssee
at K
noxv
ille
on 1
1/10
/201
6 16
:47:
21.
View Article OnlineDOI: 10.1039/C6EE02368A
30
58. S. Grigoriev, V. Porembsky and V. Fateev, International Journal of Hydrogen Energy, 2006, 31, 171-175.
59. J. Mainka, G. Maranzana, J. Dillet, S. Didierjean and O. Lottin, J Electrochem Soc, 2010, 157, B1561-B1568.
60. D. Malevich, E. Halliop, B. A. Peppley, J. G. Pharoah and K. Karan, J Electrochem Soc, 2009, 156, B216-B224.
61. A. Ter Heijne, O. Schaetzle, S. Gimenez, F. Fabregat-Santiago, J. Bisquert, D. P. Strik, F. Barriere, C. J. Buisman and H. V. Hamelers, Energ Environ Sci, 2011, 4, 5035-5043.
62. S.-J. Seo, J.-J. Woo, S.-H. Yun, H.-J. Lee, J.-S. Park, T. Xu, T.-H. Yang, J. Lee and S.-H. Moon, Phys Chem Chem Phys, 2010, 12, 15291-15300.
63. J.-B. Jorcin, M. E. Orazem, N. Pébère and B. Tribollet, Electrochim Acta, 2006, 51, 1473-1479. 64. K. M. Jeong, C. K. Lee and H. J. Sohn, J Electrochem Soc, 1992, 139, 1927-1931. 65. J. Mo, Z. Kang, S. T. Retterer, D. A. Cullen, T. J. Toops, J. B. Green, M. M. Mench and F.-Y. Zhang,
Science Advances, 2016, (in press). 66. J. Peron, Z. Shi and S. Holdcroft, Energ Environ Sci, 2011, 4, 1575-1591.
Page 30 of 31Energy & Environmental Science
Ene
rgy
&E
nvir
onm
enta
lSci
ence
Acc
epte
dM
anus
crip
t
Publ
ishe
d on
11
Oct
ober
201
6. D
ownl
oade
d by
Uni
vers
ity o
f T
enne
ssee
at K
noxv
ille
on 1
1/10
/201
6 16
:47:
21.
View Article OnlineDOI: 10.1039/C6EE02368A
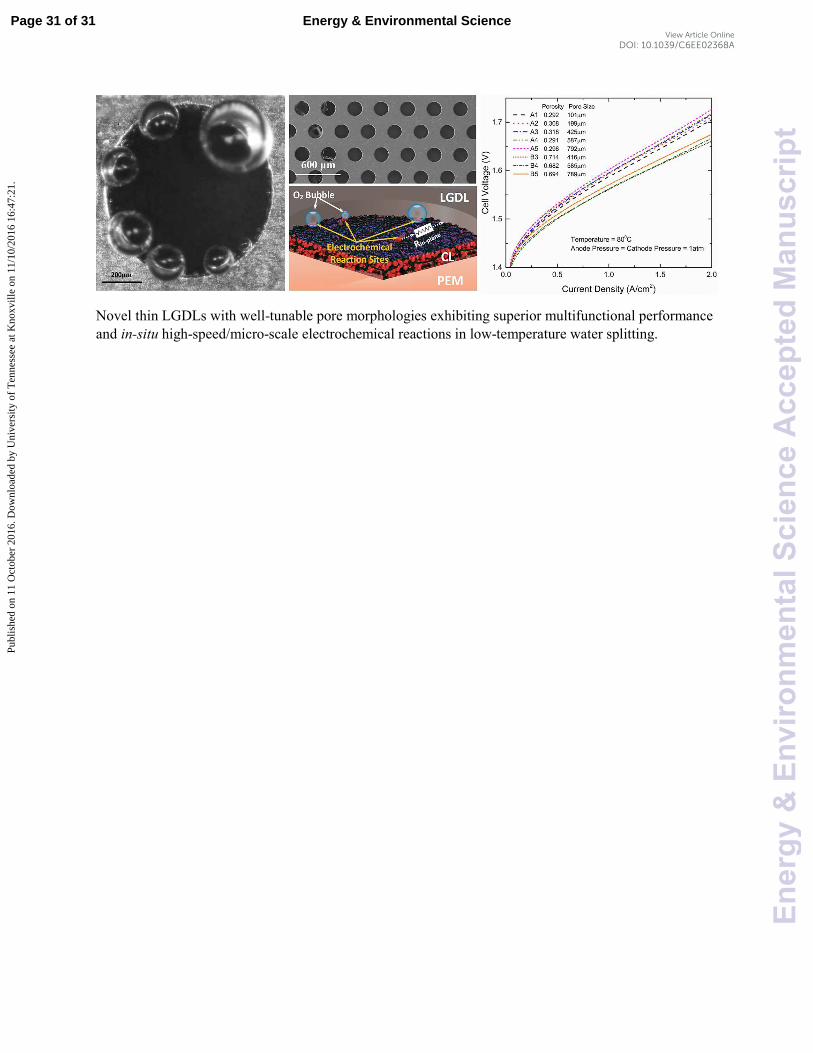
Novel thin LGDLs with well-tunable pore morphologies exhibiting superior multifunctional performance
and in-situ high-speed/micro-scale electrochemical reactions in low-temperature water splitting.
Page 31 of 31 Energy & Environmental Science
Ene
rgy
&E
nvir
onm
enta
lSci
ence
Acc
epte
dM
anus
crip
t
Publ
ishe
d on
11
Oct
ober
201
6. D
ownl
oade
d by
Uni
vers
ity o
f T
enne
ssee
at K
noxv
ille
on 1
1/10
/201
6 16
:47:
21.
View Article OnlineDOI: 10.1039/C6EE02368A