Embed Size (px)
Citation preview

Energy management and shifting stability control for a
novel dual input clutchless transmission system
by
Hanfei Wu 1, Paul Walker 2, Jinglai Wu, Jiejunyi Liang 1,*, Jiageng Ruan 3, Nong Zhang
4
1 School of Electrical, Mechanical and Mechatronic Systems
The University of Technology, Sydney, NSW 2007, Australia

Abstract
A dual input clutchless transmission system based on automated manual transmission (AMT) structure is proposed for pure electric vehicles. In order to fully exploit the potential of the powertrain system, an energy management strategy (EMS) is developed to determine the power distribution between two motors and the optimal gear state. A mathematical model is built to minimize the energy consumption of the motors at each instant based on the motor efficiency maps. However, the proposed EMS in line with other energy oriented strategies often lead to excessive gear shifting and compromised drivability. To avoid the undesired gear shifting, a shifting stabilizer is built in the EMS objective function to improve shifting quality. Accordingly, to achieve a balance between the energy consumption and the drivability, a multi-objective optimization method is adopted to reduce the unnecessary shifting events while minimizing energy consumption. Two driving cycles representing typical daily driving conditions are used to demonstrate the effectiveness of the proposed system in terms of energy efficiency and shifting stability.
Keywords: electric vehicles; dual input powertrain; energy management strategy; excessive gear shifting; optimal control.
Nomenclature
vehicle front area
AT automatic transmission
AMT automated manual transmission
CVT continuous variable transmission
DCT dual clutches transmission
DP dynamic programming
DDP determinist dynamic programming
MPC model predictive control
ECMS equivalent consumption minimization strategy
EMS energy management strategy
function of power consumption
function of gear shifting times
gravity acceleration
HEV hybrid electric vehicle
, the working gear ratio for motor 1 and the fixed gear ratio for motor 2
counter gear for motor 1
counter gear for motor 2
line current
inertia of driven gear
inertia of AMT driving gear
inertia of synchronizer
inertia of driving gear for motor 2
equivalent inertia of motor 1
equivalent inertia of motor 2

equivalent inertia of vehicle body including transmission components
K electromagnetic torque constant
back emf constant
L line inductance
MC Markov chain
R line resistance
RL reinforcement learning
tire radius
electromagnetic torque
driving resistance torque
the last gear shifting time
dwell time for bump function
UC ultra-capacitor
V input line voltage
is the vehicle speed
WT wavelet transform
air density
air resistance coefficient
vehicle mass
gravity acceleration
incline angle of the road
rolling friction coefficient
dynamic friction coefficient
static friction coefficient
acceleration
, specific efficiency for motor 1 and motor 2 under certain speed and torque
proportionate weight factor
amplitude of the bump function
1. Introduction
With the continuous development of social economy and the deteriorating ecological crisis, the energy dilemma is becoming increasingly serious, especially in the automobile industry [1]. The pressure from higher fossil fuel price and stricter legislation for green gas emissions are driving the transportation market towards electric solutions, which provide more efficient and environment-friendly passenger vehicles. As a result, hybrid electric vehicles [2, 3] and battery electric vehicles [4, 5] have attracted broad attention in both academic and manufacturing worlds due to the advantages of high-efficiency, clean emission, and satisfying driving comfort.
In order to achieve a high overall efficiency, the basic transmission structure plays an important role. In [6-

9], it is demonstrated that the application of multi-speed transmissions in electric vehicle powertrains will not only reduce the motor size but also provide a wider range of traction torque. Among all existing types of multi-speed transmission, AMT is a decent candidate due to its high efficiency, lightweight, robustness and low manufacturing costs [10-12]. In comparison, the overall efficiency of dual clutches transmission (DCT) is relatively lower, and the structure is complex and costly. Automatic transmission (AT) suffers from poor efficiency of the torque converter during gearshifts, although locking the clutches are now adopted when the input and output speeds are equal. Continuous variable transmission (CVT) has low mechanical efficiency due to the belt or cone ‘slipping’ as the force is passed through friction and heat generation. The drawbacks of AMT are also obvious, including inevitable large vehicle jerk, torque interruption during gear shifting. Fortunately, the design of the dual input transmission system allows for non-interrupted gear shifting by eliminating the torque hole with the second motor [13-15]. The transmission can be coupled to a torque vectoring differential, therefore providing the energy efficiency benefit of a multiple-speed transmission and the vehicle dynamic performance of individual wheel powertrains, which have the packaging and weight-related constraint of being characterized by a single-speed transmission. The dual-motor layout of this drivetrain allows a high load factor of the electric machines, when they are operated singularly, with a further potential increase of the overall energy efficiency depending on the motor characteristics. As for the transmission efficiency, one of the most significant disadvantages of implementing multispeed transmission systems is the increased parasitic efficiency losses presented through clutches, gear mesh and so on [16]. However, the small inertia and controllable speed of the electric motor make it possible to remove friction clutch in the transmission for electric vehicles to minimize the parasitic losses [17-19].
Apart from the merits of the architecture, the power distribution algorithm between the two motors is also the key factor to make the most of energy saving ability. Many energy management strategies based on optimal control theory have been studied to determine the power distribution in multi-input configurations according to time and vehicle speed. These approaches can be roughly classified into four groups: rule-based control strategy, fuzzy logic control strategy, offline optimization control strategy, and online optimization control strategy [20]. The rule-based control strategy is widely used for it is simple and practical, with fast computing speed, low configuration requirements, and relatively stable control quality [21, 22]. Despite the simplicity of rule-based control, the disadvantage is that the overall efficiency is compromised. The fuzzy logic control, based on approximate reasoning, can achieve a real-time and suboptimal power distribution. The human expertise and engineering knowledge can be coded into rules to direct behaviors especially for a multi-domain, nonlinear and time-varying system [23, 24]. Although fuzzy logic has the advantages in dealing with nonlinearities and uncertainties via an approximation method, when it turns to accurate and precise solutions, fuzzy logic seems to be not accurate and rigorous enough. The offline optimization method is based on the pre-known knowledge of past or future demands. One of the most common methods for offline optimization is Dynamic Programming (DP), which requires decisions to be made in steps with the objective of finding a minimal penalty pathway [25, 26]. DP ensures the global optimality through searching all states and control grids exhaustively. However, the main limitation is that the computation time increases exponentially with the number of state variables. To avoid the limitation of DP, N. Murkowski et al.[27] use a convex modelling approach which allows for a simultaneous optimization of battery size and energy management of a plug-in hybrid powertrain by solving a semidefinite convex problem. In this optimization approach the power characteristics of the engine, the engine-generator unit and the electric machines are approximated by a convex second order polynomial, and the convex battery model assumes quadratic losses. Compared to DP, the results of convex optimization indicate a similar solution but with less computational effort.
In contrast to offline optimization that keeps track of previous decisions to formulate the next solution, online optimization is an algorithm converting global criterion into an instantaneous minimization problem

without restriction of pre-knowledge. As a receding horizon control strategy, model predictive control (MPC) has been widely employed in HEVs today because of its ability to incorporate predictive future cycle information into various EMSs. The formulation of future driving condition is generally based on GPS and ITS prediction or statistics and cluster analysis method, and the algorithm performance relies on model quality, sampling step, and prediction horizon length. Moreover, the prediction horizon and implementation of faster algorithms, such as quadratic programming, allow for its potential application in real-time control [28]. Another representative online optimization method is equivalent consumption minimization strategy (ECMS), in which the total fuel consumption is calculated in real-time as the sum of the real fuel consumption by engine and the equivalent fuel consumption of the electric motor. However, the local minimization is strictly rely on the equivalent factor, which is cycle-dependent and lacks the flexibility for different situations. To avoid the limitation, Rizzoni et al. [29] use an adaptive ECMS to match the equivalent cost with the current driving schedule. In this approach, an on-the-fly algorithm for estimation of the equivalent factors according to the driving conditions is obtained through periodically refresh the control parameters with the current driving load. Recently, an emerging method, reinforcement learning (RL), have been presented to implement real-time optimization feasible for HEVs. In [30], a combination of RL with velocity forecasts indicative of future road information is conducted. In this approach, a finite-state Markov chain (MC) is exploited to learn transition probabilities of power demand. The Q-learning algorithm is harnessed to realize the predictive optimal control for increasing fuel economy and maintaining battery charge sustenance. For hybrid energy storage system which consists of a battery and an ultra-capacitor (UC), a power split strategy based on wavelet transform (WT) technique is adopted to perform real-time power allocation, with the drive to assign high-frequency components of load profile to the UC bank, and the rest to the battery bank [31]. This approach helps to protect the battery bank from frequent charging/discharging transients, and has the advantage of online and easy implementation.
All the above methods aim at optimizing the energy distribution among different power sources. However, for the dual-motor input architecture, these EMS methods cannot be directly used, because both of the motors are driven from only one power source, the battery. Thus, the power distribution is not related with the energy transfer issues, instead, the driving pattern or the driving demand becomes the key element for the overall efficiency. Therefore, a new energy management strategy is designed for the proposed powertrain architecture. In the pure electric system where energy comes from only one single source, the efficiency at different timing is relatively independent. Based on this, a real-time strategy without any prior knowledge of the whole trip can be achieved, which can guarantee the two motors work in efficient region to achieve a satisfying dynamic performance.
However, most EMS methods taking energy consumption minimization as a primary goal neglecting the drivability constraints [32-34]. As a subjective evaluation index in terms of smoothness and steadiness of acceleration, drivability is increasingly becoming a key determinant of the competitiveness of passenger cars because the ultimate decision of customers to buy a car is usually based more or less on the driving experience. Unfortunately, optimizing energy consumption often lead to excessive gear shifting, which has a strong impact on drivability performance [35-37]. By observing specific shifting situations, there are generally two undesirable shifting cases. The first case is that although the result of optimization control strategy determines the need for shifting, the improvement of economic efficiency is practically insignificant. Avoiding this situation can reduce the shifting frequency without sacrificing too much economy. The other case is that the gear shifting interval is too short. While the last shifting has just completed, the next shifting is about to occur, which is far from realistic. Avoiding this situation can make the energy management strategy more reasonable and more correspondence with real driving conditions. To solve above problems, a designed shifting stabilizer is embedded into the energy management strategy to make a restriction on gear shifting events.
In order to achieve a better balance between the efficiency and the dynamic performance, the weighting

factors of the designed shifting stabilizer are of great importance. However, the optimization goal is contradictory itself, because the reduction of gear events leads to the increase of energy consumption. To address this problem, multi-objective optimization methods have attracted a lot of attention. Compared with the single-objective algorithm, the multi-objective search algorithm is closer to the actual problem and with more reference value. In recent years, applying evolutionary algorithms into multi-objective optimization problems is a popular research topic [38, 39]. The most important concept in multi-objective optimization methods is the non-inferior solution in which an improvement in one objective requires a degradation of another. All non-inferior solutions form the non-inferior set, which is also called the Pareto optima [40].
The main contribution of this paper is to propose an energy management strategy addressing power distribution problems in the dual input transmission system and gear shifting management. To avoid excessive gear shifting caused by EMS, a multi-objective optimization method is introduced to achieve a balance between energy consumption and gear shifting. The following parts of this paper are organized as the following. Section 2 presents the powertrain architecture, focusing on its motor parameter selection and its mathematical modelling. Section 3 explains the proposed real-time energy management strategy. Section 4 introduces a designed shifting stabilizer embedded into the energy management strategy to include the drivability constraints. In section 5, a modified multi-objective optimization algorithm is used to optimize the coefficients of the shifting stabilizer. Section 6 presents the simulation results of specific driving cycles. At last in Section 7, conclusions are drawn.
2. Powertrain modelling and evaluation
Even though facing-backward models have better computational ability, this paper adopts the facing-forward model of powertrain due to the higher accuracy in economic performance investigation of elective vehicles [41]. Since the economy performance is the main research orientation in this paper, the battery model is not included. In the facing-forward model of powertrain, the mathematic model of the powertrain is built, and the flexibility of shafts is ignored with respect to economic performance. In addition, as electric motors have a quick torque response ability, the motor output torque is considered as an ideal torque without any time delay.
2.1 Powertrain model
The vehicle resistance is normally consisted of three categories: air resistance, wheel rolling resistance, and the incline of the road, which can be expressed by
12
sin 1
where is the driving resistance torque, refers to the air density, represents the area of the vehicle front side, is the air resistance coefficient, is the vehicle speed, and denotes the mass of the vehicle, is the gravity acceleration, is the incline angle of the road, and is the rolling friction coefficient. The diagram of the powertrain is showed in Fig. 1.

Figure. 1 Architecture of the powertrain system
Accordingly, the equations of system inputs are expressed as the following,
2
where the symbol is the equivalent inertia, is the acceleration, is the torque, and are the working gear ratio for motor 1 and the fixed gear ratio for motor 2, respectively.
The main parameters of transmission and the vehicle are listed in Table 1.
Table 1 Inertia of gear set and parameters of the vehicle model
Symbol Name Value Driven gear 0.2 ∙ AMT Driving gear 0.02 ∙ synchronizer 0.025 ∙ Driving gear for motor 2 0.02 ∙ Vehicle mass 1200 kg
Air density 1.127 / A Front area 3
Air resistance coefficient 0.3 Tire rolling friction
coefficient 0.35
Tyre radius 0.3 m
2.2 Transmission operation
Although the electric motors are easily controllable, the motor speed is difficult to get the 100% follow-ups due to the limitation of accuracy range. So the synchronizers can help complete the shift process to reduce the impact of speed error. The working status of the transmission is determined by the proposed EMS, including the torque distribution of both motors and optimal gear selection. The strategy is explained in detail in section 3.
Unlike traditional AMT, this transmission has two inputs so that it can achieve power-on shift with the addition of the second motor. The coordinated control of power-on shift is shown in Fig. 2. In the beginning of shift progress, the motor 1 torque is reduced to a nominal value gradually. To achieve a power-on shift,
EM1 EM2
Output shaft
Differential
Final drive
Gear 1 Gear 2
Gear 3
Synchronizer
Wheel
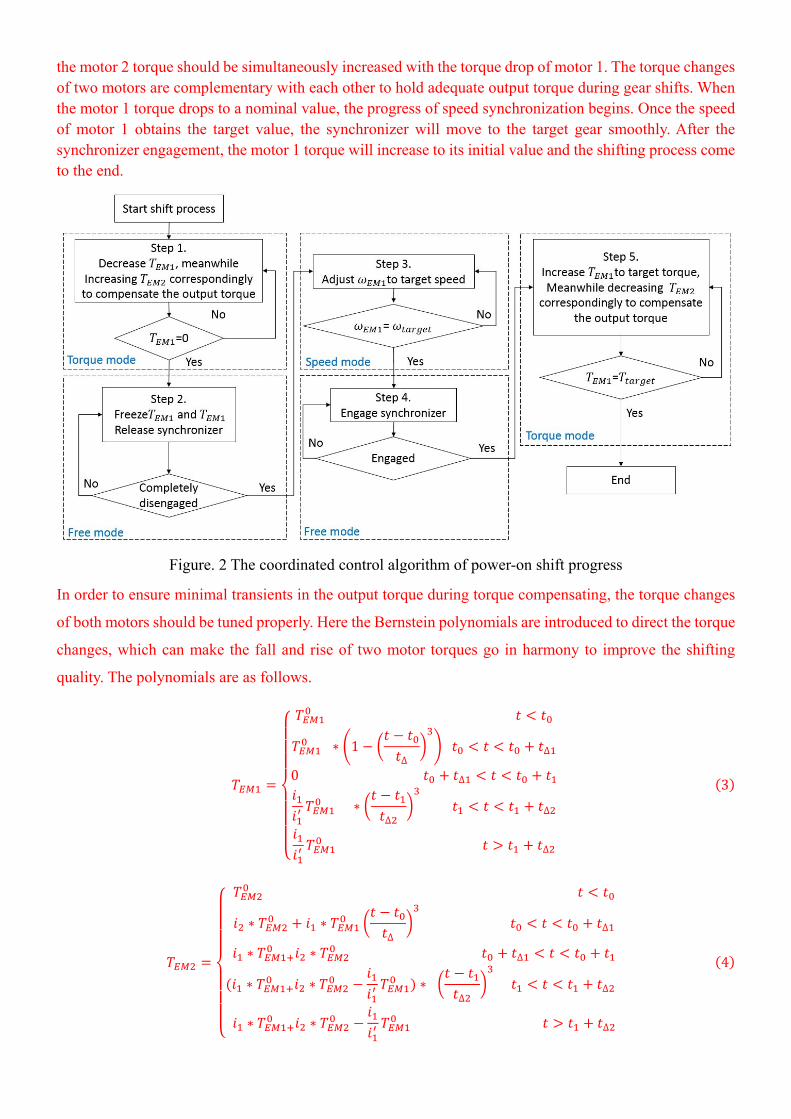
the motor 2 torque should be simultaneously increased with the torque drop of motor 1. The torque changes of two motors are complementary with each other to hold adequate output torque during gear shifts. When the motor 1 torque drops to a nominal value, the progress of speed synchronization begins. Once the speed of motor 1 obtains the target value, the synchronizer will move to the target gear smoothly. After the synchronizer engagement, the motor 1 torque will increase to its initial value and the shifting process come to the end.
Figure. 2 The coordinated control algorithm of power-on shift progress
In order to ensure minimal transients in the output torque during torque compensating, the torque changes
of both motors should be tuned properly. Here the Bernstein polynomials are introduced to direct the torque
changes, which can make the fall and rise of two motor torques go in harmony to improve the shifting
quality. The polynomials are as follows.
∗ 1∆
∆
0 ∆
∗∆
∆
∆
3
∗ ∗∆
∆
∗ ∗ ∆
∗ ∗ ∗ ∆
∆
∗ ∗ ∆
4

Where and are the initial input torque of two motors, is the starting time of the
synchronizer disengagement, ∆ is the duration time of the synchronizer disengagement, is the
starting time of the synchronizer engagement, ∆ is the duration of the synchronizer engagement, and
are the current gear ratio and target gear ratio for motor 1 respectively, is the fixed gear ratio for
motor 2.
Figure. 3 Torque interruption compensating during upshifting
For a linear acceleration process, the motor 1 torque starts from 25Nm and motor 2 torque is 50Nm. So the
output torque of transmission should be 259.5Nm, 187.05Nm, and 147.15Nm, according to corresponding
gear numbers. Fig. 3(b) shows that the motor 1 output torque reduces to 0 during the shift process, which
leading to the power interruption. As shown in Fig. 3(c), with the addition of second motor, the motor 2
torque can smoothly increases to compensate the torque hole. Fig. 3(d) compares the proposed dual input
Gea
r nu
mbe
rM
otor
1 to
rque
(N
m)
Mot
or 2
torq
ue (
Nm
) O
utpu
t tor
que

transmission with single input transmission, in which the dual input transmission can adequately
compensate the torque hole during shifting.
2.3 Constraints for the motors
The DC equivalent circuit model is applied in this study to represent a three phase permanent magnet AC motor during simulations. It reduces a relatively complex power electronic system to a single linear equation of motion, whilst retaining electrical characteristics of the system. The physical characteristics of the motor is captured without the requirement for complex and computationally intensive power electronics system. In fact, if the system is represented as a transfer function, the response will be defined by the transfer function coefficients and applied in a similar manner to the DC equivalent circuit. As for other methods, i.e. time delays or slew rates, these will produce results that are approximately similar at marginally lower computational costs. Consequently, the use of equivalent circuit models or transfer functions better represents the physical system, whilst time delays, etc. are computationally marginally beneficial, with the acceptance of the model not being representative of the physical system. An equivalent DC circuit model [42] is introduced, the differential equation for the electric circuit is defined as:
5 where is the line inductance, is the line current, is the back emf constant, R is the line resistance, and is input line voltage. The corresponding electromagnetic torque is produced as the following:
∙ 6 where is the electromagnetic torque and is the torque constant.
However, as motor 1 and motor 2 are designed for different purposes, parameters for the two motors should be selected according to their respective characteristics. Motor 1 is supposed to work as the primary power source in frequent changing driving conditions. The combination of electric motors and AMT copes better with urban traffic where frequent launching and stopping are required. On the other hand, motor 2, which is directly connected to lay shaft through a fixed gear ratio, is supposed to compensate the torque interruption during gear shifting. Besides, motor 2 can also help provide torque, either when the driving demand goes beyond the capability of the motor 1 or when motor 2 can work in its high-efficiency region. Considering the torque compensating process where motor 1 works in an idle state and motor 2 provides the whole power supplement, the peak torque and speed for the motor 2 should be in coordination with motor 1 to guarantee the smooth operation of the transmission system. The relationship between two motors are written as the following:
7
8
From Eq.(6) and Eq.(7), as motor 1 is equipped with a multi-speed transmission, the peak torque and speed for motor 2 are supposed to be bigger than those of motor 1. However, for a quite short process like gear changing, it is acceptable that motors can operate beyond their preference. That means, through selecting the appropriate parameters, two motors can cooperate with each other to help motor 1 work in its high-efficiency area while meeting the power requirements during gear shifting. Fig. 4 shows the efficiency map of two motors.
In order to reduce the size and cost while satisfying the dynamic requirements, the power of both motors is designed closely about 42 KW. By doing this, motor 2 helps provide power in most driving conditions

instead of being an idling load. For this system, the corresponding gear ratios are listed in Table 2.
Table 2 Selected gear ratios
Symbol Name Value Counter gear for motor 1 4.62 1st gear for motor 1 3.46 2nd gear for motor 1 2.08 3rd gear for motor 1 1.32 Counter gear for motor 2 2.16 Fixed gear for motor 2 3.46
Considering the urban driving situation, 1st and 2nd gear ratio are designed relatively large to cope with low-speed conditions where frequent launching and stopping events happen. The 3rd gear ratio will work together with motor 2’s gear ratio to handle the medium and high speed conditions to guarantee the drivability and efficiency.
Figure. 4: Motor efficiency map, (a) motor 1, (b) motor 2
3. Energy management strategy
Since the proposed powertrain has two motors, the most important element of EMS is to determine the
power distribution between two motors. Traditional control methods, such as rule-based control strategy,
cannot be used because it deals with specific working status rather than power distribution. Another widely
used method is ECMS, which relies on an equivalent factor for comparing the electrical energy with the
fuel energy. Unfortunately, this powertrain is a pure electric vehicle, which means that there is no energy
transfer issues. DP can solve such problems in discretized state space, the optimal control policy is
recursively obtained by Bellman’s principle of optimality. Although DP ensures the global optimality by
thoroughly examining every possible options, it is based on pre-known driving information and difficult
for real-time applications as noncausal strategies. To break through these limitations, a real-time energy
management strategy is introduced in this section to determine the power flow between two motors to
improve the overall efficiency of the powertrain.
As a pure electric vehicle, the existing power flows into two forms: consumed power and charging power. For the consumed power, the overall power consumption for both motors can be expressed as
∗ ∗ ∗ 0& ∗ 0 9
where and are the specific efficiencies under the certain speed and torque for motor 1 and motor 2, respectively.
Considering the regenerative braking or the situation when one of the motors works in the generator mode, the charging power is defined as the following:
∗ ∗ ∗ 0& ∗ 0 10
In order to minimize the power consumption, the consumed power of the two motors at each instant will be the objective function to be minimized. The objective function can be expressed as the following
11
There are 4 designed variables in the objective function i.e. , , and . However, these variables are not independent. For a given cycle, as the driving speed and acceleration is decided, the speeds of two motors can be calculated by
∙ ,
∙ 12
where is the target speed, is the working gear of AMT. As a result, the independent variable in and is the working gear of AMT.
Moreover, since two motors work together to provide power with the total demanding torque known, once one of the motor torque is settled, the other one is calculated right away. In this study, is chosen as the independent design variable. The relationship between and is expressed as the following:
∗ ∗ ∗∗ 13
where ∗ is the total demanding torque decided by driving cycle, denoting the equivalent
inertia of vehicle body including transmission components and denoting the angular acceleration
of final shaft. , refer to the equivalent inertia of motor 1 and motor 2 respectively. and
are the corresponding demanding angular acceleration for each motor.
Therefore, there are only two independent design variables of the proposed energy management strategy, one is the torque of motor 1 and the other is the working gear ratio of AMT.
For any driving cycles where the target speed and acceleration are given, the optimization model is expressed by
, , , subject to
, , ;
, , ,
, ,
, , ,
14
In the process of optimization, it is common to see that search results are likely to fall into local optimal points. To avoid this problem, the enumeration method is introduced to hunt for the approximate global optimal points of motor torque. In this method, the design variable T_EM1 is discretised by a regular dense grid with 1 Nm interval in its design space. For these discretised points, the objective function value P and constraints values of every gear number of AMT are calculated orderly. After removing the points in the infeasible region, the toque with the minimum target value is selected. Then, the selected torque is used to calculate the power consumption of each gear number, the final optimal gear ratio with the minimum value is determined then.
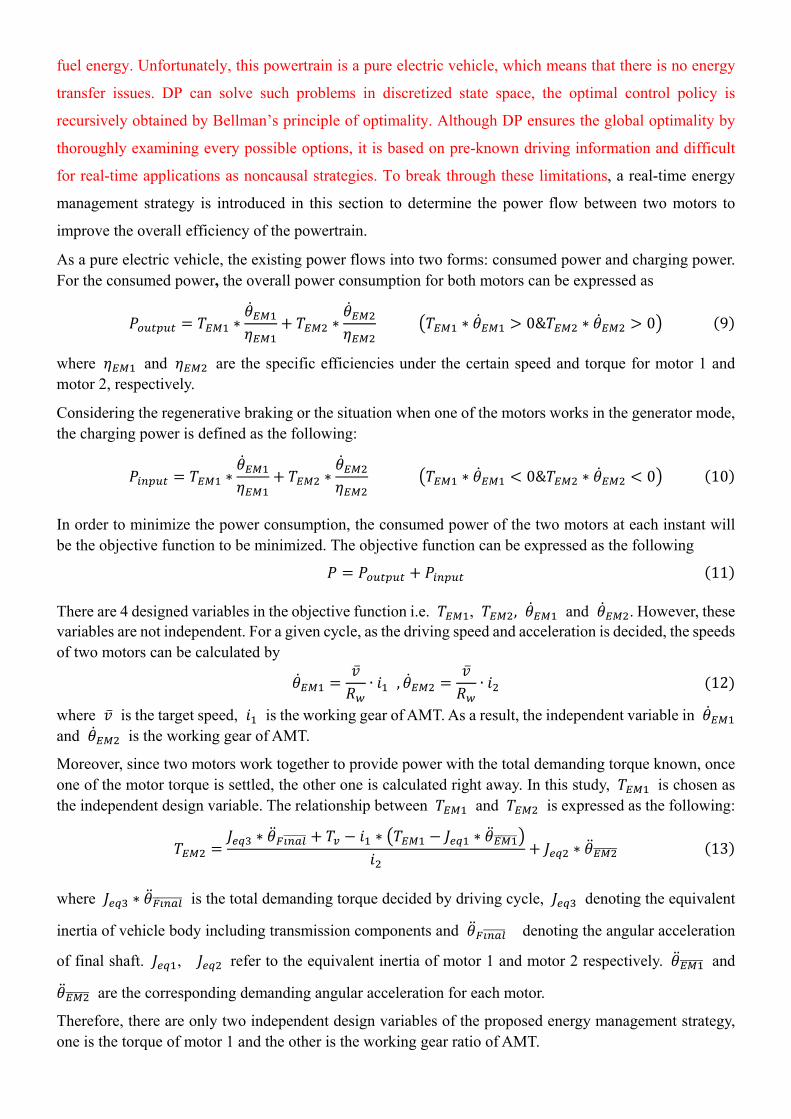
The calculation speed of this method is very fast so that it can meet the computation requirement of real-time application. The interval division of the motor torque can well meet the precision requirements and the results are very close to optimal solutions. Fig. 5 shows the objective function of different driving requirements in the feasible area.
Figure. 5 Objective function value of different driving conditions
According to the given vehicle speed and acceleration, the objective function changes with the driving conditions to decide the best gear states and working point of both motors. The chosen working point represents the minimum energy consumption. In Fig. (a), in the condition of low speed and minimum acceleration demand, the feasible working torque for motor 1 is between -70 Nm and 70 Nm. If the acceleration rises to 1m/ , it can be seen from Fig. 5 (b) that the feasible working space narrows down, from -40 Nm to 70 Nm. In Fig. 5 (c), as motor 1 is set to disconnect with the powertrain in the request of EMS, the power stays constant. In Fig. 5 (d), since the speed and acceleration are high, the torque of motor 1 has to stay in the positive domain. And if the torque of motor 1 drops below 10Nm, the energy
Pow
er [
w]
Pow
er [
w]
Pow
er [
w]
Pow
er [
w]

consumption would increase significantly for the reason that the corresponding torque of motor 2 is beyond its limit. The proposed EMS strategy is summarized in Fig. 6.
Figure. 6 Proposed energy management strategy
4. Shifting stability control
Since the proposed EMS as well as most energy management strategies focusing on the minimization of power consumption, attributes such as vehicle acceleration responsiveness and smoothness are often overlooked. However, these strategies impact the quality of gear shifting, particularly for real-time strategy where decisions are made instantly as the global minimization problems are divided into instantaneous minimization steps. As a result, optimal gear ratio will change frequently with the driving conditions, which leads to excessive gear shifting. Moreover, excessive gear shifting not only influences drivability but also increase energy consumption because the shifting actuator consumes energy as well.
In order to reduce excessive gear shifting encountered by the proposed energy management strategy, drivability constraints should be considered. Two main approaches can be found in several previous studies. One of them consists in adding to the fuel consumption criterion a penalty that is proportionate to the total number of gear shifts during the vehicle’s mission. The other consists of adding a penalty that is proportionate to the quadratic difference between the numbers associated with the current and target gear ratios. Due to the specific nature of transmission considered in this paper, the proposed strategy had to be more general for gear transitions. To make a restriction on shifting frequency, a novel shifting stabilizer is built to make a trade-off between the energy consumption and the gear shifting frequency, which can significantly reduce the gear shifting e11tyujkvents with insignificant extra energy consumption. They are written as the followings
∗
∗
15
subject to
0 1
1,2,3,4
where α is the weight factor, P is the corresponding consumed power of each gear state, is for the designed amplitude coefficient of the bump function, x is used to control the duration of gear shifting, in which Time is the system time, is the last gear shifting time, is the dwell time of the bump function.
(n=1, 2, 3, 4) is for the gear states from idle to gear 1 to gear 3, is the current working

gear.
As mentioned before, the proposed real-time EMS is set to calculate the power consumption of every gear number to choose the lowest one as the working gear. Based on that, the cost function only works with non-working gears , which means that the power of the working gear is set as benchmark and will not be imposed any penalty. At the same time the power of other gear numbers will be added extra costs so that the system is likely to keep the current gear in working when comparing the power consumption of all the gears.
The first part of the shifting stabilizer is designed to avoid unnecessary gear events by improving the shifting threshold. Initially, to improve energy efficiency, the gear change schedule is set to follow the trajectory of minimum power consumption. However, the disadvantage is that sometimes the power consumption between the current gear and the next gear is quite close, which means that the saved energy consumption from gear shifting is insignificant. To solve this issue, a shifting threshold controller is designed to increase the threshold required for shifting, which only allows for gear changes when energy saving is obvious.
The shifting margin controller can be expressed as the following α ∗ 16
Figure. 7 The schematic diagram of the designed shifting margin controller.
Fig. 7 illustrates the conceptual principle of the shifting margin controller, in which Fig. 7 (a) represents the instant power consumption of each gear directed by EMS. Based on the minimum power consumption principle, the intersections of the lowest curve are the points where gear shifting occurs. Accordingly, the determined gear shifting schedule is showed in Fig. 7 (b). However, it is worth noting that the saved energy from changing gear 1 to gear 2 is insignificant, which causes unnecessary gear shifting. To avoid this condition, the shifting margin controller will impose a penalty to all other non-working gears, which causes overall elevation in their power consumption. As shown in Fig. 7 (c), gear 1 (green line) is the working gear in the initial stage, so that the power consumption of gear 2 (blue line) and gear 3 (orange line) is modified to a higher level by the shifting margin controller. In consequent, the unnecessary gear shifting is reduced and there is no gear change, as shown in Fig. 7 (d).
The second part of the shifting stabilizer is designed to avoid undesired gear events by extending the shifting interval. This means to avoid successive and frequent gear shifting in a short period, which is not desired even though it could save much energy. Furthermore, a modified bump function is introduced to prevent too short shifting interval.
The shifting interval controller can be expressed as the following
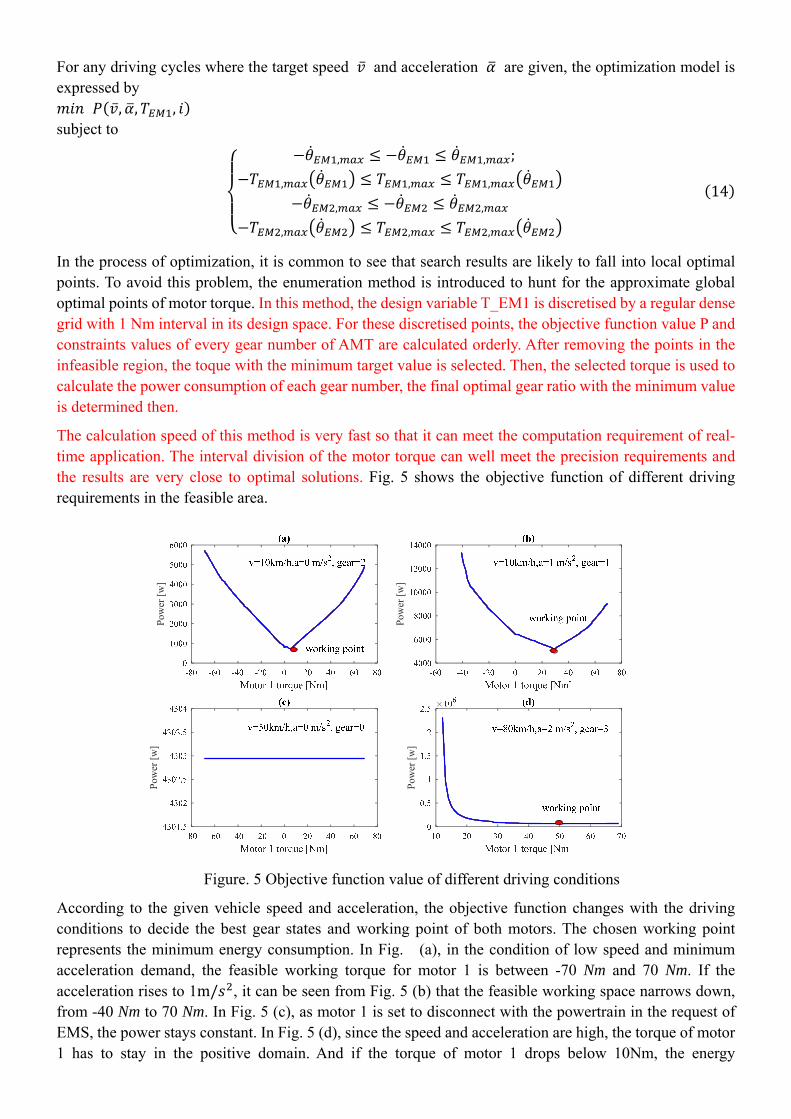
∗ 17
Figure. 8 Diagram of the bump function
As shown in Fig. 8, the bump function declines slowly in the early stage but fast at the late stage. According to this, the shifting interval controller will impose a large penalty to the non-working gears when gear shifting is just completed. As a result, the system prefers to maintain the working gear when searching for the minimum power consumption of each gear. Moreover, the penalty value will decline fast to zero to reduce the continuous influence.
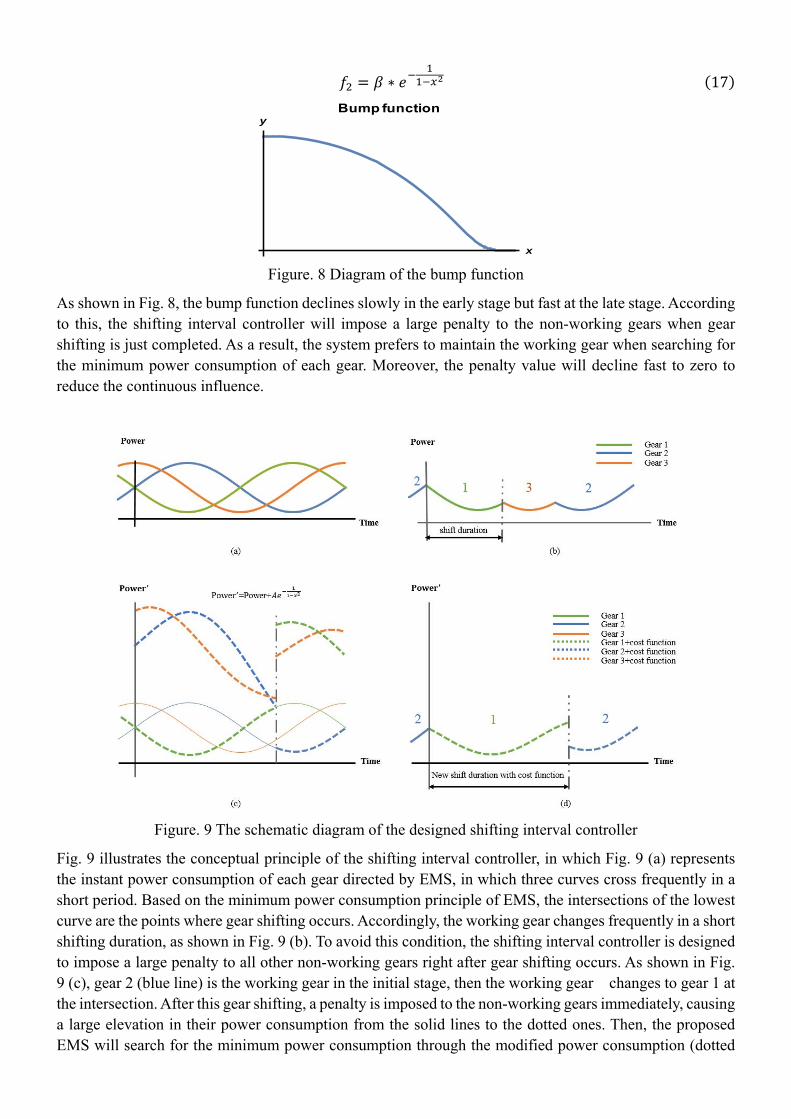
Figure. 9 The schematic diagram of the designed shifting interval controller
Fig. 9 illustrates the conceptual principle of the shifting interval controller, in which Fig. 9 (a) represents the instant power consumption of each gear directed by EMS, in which three curves cross frequently in a short period. Based on the minimum power consumption principle of EMS, the intersections of the lowest curve are the points where gear shifting occurs. Accordingly, the working gear changes frequently in a short shifting duration, as shown in Fig. 9 (b). To avoid this condition, the shifting interval controller is designed to impose a large penalty to all other non-working gears right after gear shifting occurs. As shown in Fig. 9 (c), gear 2 (blue line) is the working gear in the initial stage, then the working gear changes to gear 1 at the intersection. After this gear shifting, a penalty is imposed to the non-working gears immediately, causing a large elevation in their power consumption from the solid lines to the dotted ones. Then, the proposed EMS will search for the minimum power consumption through the modified power consumption (dotted
x
yBump function

lines). As a result, in Fig. 9 (d), the shift duration of gear 1 is longer than that in Fig. 9 (b). Moreover, every time gear shifting occurs, the shifting interval controller will intervene to avoid successive and frequent gear shifting.
With the two points elaborated above, the original objective function focusing on minimum energy consumption in the energy management strategy is developed to take shifting stability into consideration. The final objective function can be written as the following:
∗ ∗ 18
5. Multi-objective optimization
From Eq. (18), in order to filter out undesired gear shifting while minimizing the extra energy consumption, the weight factor α, amplitude (A) and the duration ( ) play important roles. To compromise between energy consumption and gear shifting, a multi-objective genetic algorithm is introduced to optimize these coefficients.
In a 3-dimensional domain, the multi-objective functions and constraints are expressed as
1 ∗ ∗ ∗ ∗ 19
20
subject to 0 α 1 0 A 200 0 100
where and represent the total power consumption and gear shifting times respectively, and is a counter for gear shifting. The bounds of the variable are set below certain values because
with larger values, the weight of shifting stabilizer will be too strong so that there are no gear changes anymore.
Since ≪ , the fitness value should be normalized by dividing its values by the average value of all children in the generation. For example, if is the fitness value for generation, and is the average value of all children in this generation, the normalized fitness is expressed as:
21
Similarly, for the second objective, the normalized value is expressed as:
22
As for the multi-objective optimization, the most important part during the iteration process is the population evolution. In the multi-objective optimization problem, if an individual X has at least one feature better than Y while the rest features are not worse than that of the individual Y, individual X is non-inferior to Y and the rank value of Y is set lower than that of X. In the condition where X, Y is non-inferior to each other, X and Y are set to have the same rank value. The rank system is showed as Fig.10. The ranking value depends on the numbers of the individual within the rectangle formed by the fitness value [ , ] and the axes. The individuals within this rectangle indicate that their fitness values are inferior to the current individual. For example, there is only 1 individual falls in the rectangle formed by the fitness value of

individual , , then its rank is set to 2.
Figure. 10 The principle of fitness ranking
Besides the rank value, population diversity is also important because the selection and replacement of individuals are based on rank value and diversity. When the rank values are different, the individuals with the smaller rank value will be selected, regardless of their diversity. When the rank value is the same, individuals with better diversity will be selected so that those elite individuals are automatically retained in the selection and replacement process.
Since gear shifting is based on minimum energy consumption, reducing gear events will definitely increase energy consumption. The goal is to reduce the undesired gear shifting while ensuring that there is not much increase in energy consumption. Hence, the weight of energy consumption should be higher than reducing gear shifting. In order to alleviate the penalty against individuals concentrating around an attractor, individuals are divided into subpopulations. Based on a combination of uniform distribution and Gaussians probabilistic distribution, the individuals I is expressed by π and θ respectively.
I | | 23
where c denote the number of Gaussians, denote the weights, subject to ∑ 1.
Then entropy is introduced as a measure of population diversity. For a populationX | 1,2 , the entropy is defined as the following
H X12
log 24
As log is higher at the distribution margin, individuals will not be punished for being congested until most of the population converges.
Besides the population, to describe the distribution of objective function, the Gaussians is introduced as the following:
N μ, σ
1
√2exp
12
25
where

μ12
26
27
The differential entropy of N μ, σ is calculated as the following.
H N N μ, σ logN μ, σ 28
Then, through crossover and mutation, the non-inferior solution will converge to the Pareto front. In order to include all driving conditions as much as possible, some typical parts of different driving cycles are chosen as a hybrid driving condition, where the energy consumption before optimization is 2.3698 ∙h, and the total shifting time is 352. After optimization, the Pareto solutions, are selected as shown in Fig. 10.
Figure. 11 The optimization results of the Pareto front
Fig. 11 shows that there are five sets of feasible solutions. However, for specific situation about the balance between energy consumption and gear shifting times, limitations of less than 5% extra energy consumption (the vertical dotted line) and more than 70% gear shifting reduction (the horizontal dotted line) are used as index to decide the final optimization results, which is within the lower left corner. The corresponding coefficients are listed in Table 3.
Table 3 Optimization results
A 0.0818 157.8525 48.9767
Actually, we optimize the parameters with LA-92 and HWFET individually. The results are as below in Table 4.
Table 4 Comparison between single driving cycle and hybrid driving cycle
Gearshifts Energy consumption
LA-92 before 392 0.8418
after individually 55 0.8648
hybrid 60 0.8703

HWFET before 122 2.0564
after individually 29 2.0453
hybrid 31 2.0630
From the results, it is easy to see that the optimization performance under certain driving cycle is slightly better than the specific driving cycle, but the difference is very small. So the optimization results works for both driving cycles.
6. Driving cycle results analysis
In this section, the proposed energy management strategy and shifting stability control strategy are verified by using two typical driving cycles, LA92 and HWFET. The LA-92 driving cycle is used to validate the effectiveness of these strategies in low-speed conditions, while HWFET driving cycle is used to validate the vehicle performance in medium to high-speed cruising conditions. These two driving cycles cover most situations for light-duty vehicles from daily use to traveling. As for the vehicle economic performance, this paper mainly focuses on the power distribution between two motors at a system level, so the detailed shifting dynamics are ignored to lessen the calculative burden in the simulations of different driving cycles.
For the real-time energy management strategy, the results of DP is used as a reference because DP provides a benchmark to evaluate the optimality of real-time strategies. Besides, the strategies of fixed proportion distribution between two motors are used to show the superiority of optimal distribution in term of efficiency improvement.
For the shifting stability control, the results compare the shifting frequency with and without shifting stability control. In [35], the authors design a penalty table for different transmission modes to penalize each transition individually. The penalty corresponding to a transition from the transmission mode to the transmission mode is decided by , . And a weighting factor is introduced to balance the trade-off between fuel consumption and drivability. However, the value of β is specific to each powertrain and should be tuned in accordance with the transition’s inconvenience. In comparison, our designed shifting stabilizer is intended to analyse the root cause of excessive gear shifting to avoid unnecessary and undesired gear shifting, which makes it more general to different powertrain configurations.
6.1 LA-92 driving cycle
The LA-92 driving cycle is a light-duty chassis dynamometer schedule and a representation of urban driving patterns. This cycle has a distance of 15.8km and an average speed of 39.6km/h in1435s.
EMS analysis
Fig. 12 shows the vehicle speed, and compares the efficiency of different power distribution strategies with the proposed EMS.

Figure. 12 Simulation results of vehicle speed and efficiency
Specifically, Fig. 12 (a) shows that the average speed of LA-92 is relatively low with frequent launching and stopping; acceleration and deceleration is easy to see in form of speed peaks. The speed file illustrates that the vehicle speed can follow the target speed accurately. Fig. 12 (b) compares the efficiency of proposed EMS with those of other power distribution strategies. Since the motor will work as the generator in regenerative braking, the efficiency is not monotonically increasing. It shows that the DP approach achieves the highest efficiency due to its global optimality. Then, it is followed by the proposed EMS due to the sub-optimality of real-time strategy. However, the efficiency of the proposed EMS is fairly close to that of the DP, which proves the effectiveness of the proposed EMS. The fixed ratio distribution strategies fall behind in an order of the distribution with 100% and 0% of motor 1 and 2, 50% and 50% of motor 1 and 2, and 0% and 100% of motor 1 and 2. This is because neither motor can work in its relatively high efficiency points in the fixed ratio distribution strategies. The efficiency of the distribution with 100% and 0% of motor 1 and 2 is higher due to the advantage of AMT in frequent acceleration and deceleration working conditions, as motor 1 drives the AMT directly. The efficiency of the distribution with 0% and 100% of motor 1 and 2 is the lowest because it is equivalent to the single-gear transmission, in which the efficiency of the electric motor is relatively low in low speed working conditions.
Shifting stability analysis
Fig. 13 shows the gearshift maps and the speed of two motors.
Gea
r ra
tio
(rp
m)
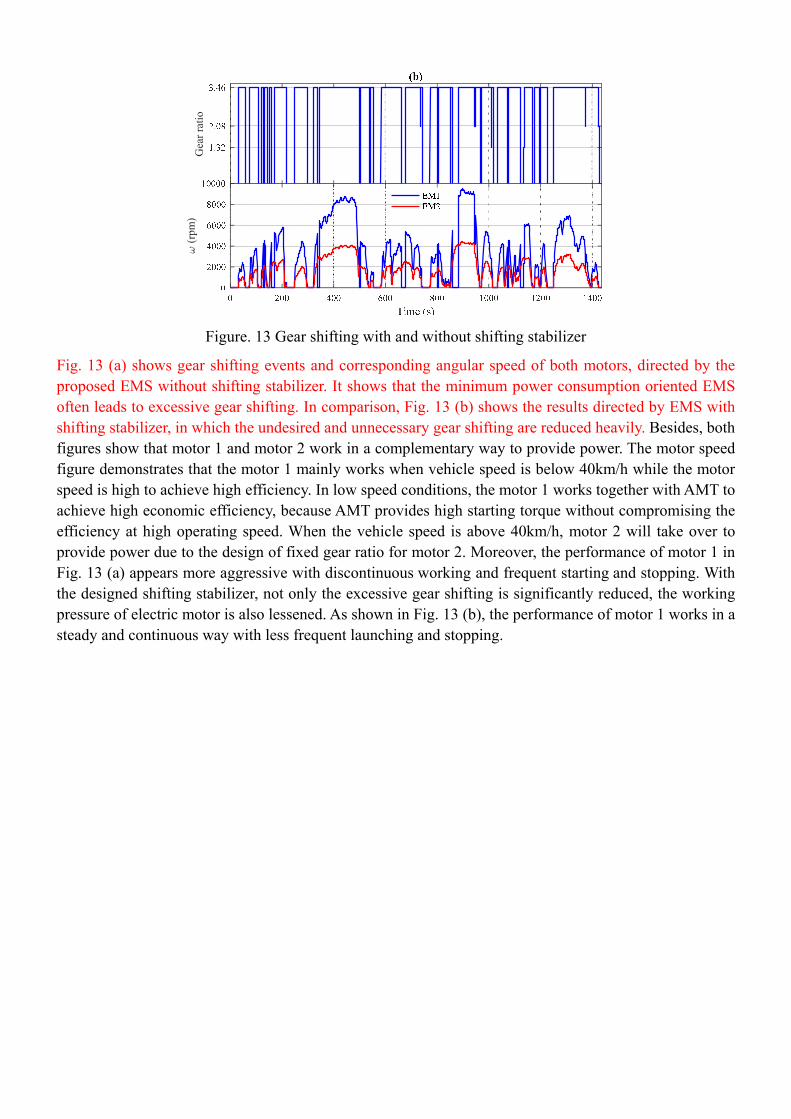
Figure. 13 Gear shifting with and without shifting stabilizer
Fig. 13 (a) shows gear shifting events and corresponding angular speed of both motors, directed by the proposed EMS without shifting stabilizer. It shows that the minimum power consumption oriented EMS often leads to excessive gear shifting. In comparison, Fig. 13 (b) shows the results directed by EMS with shifting stabilizer, in which the undesired and unnecessary gear shifting are reduced heavily. Besides, both figures show that motor 1 and motor 2 work in a complementary way to provide power. The motor speed figure demonstrates that the motor 1 mainly works when vehicle speed is below 40km/h while the motor speed is high to achieve high efficiency. In low speed conditions, the motor 1 works together with AMT to achieve high economic efficiency, because AMT provides high starting torque without compromising the efficiency at high operating speed. When the vehicle speed is above 40km/h, motor 2 will take over to provide power due to the design of fixed gear ratio for motor 2. Moreover, the performance of motor 1 in Fig. 13 (a) appears more aggressive with discontinuous working and frequent starting and stopping. With the designed shifting stabilizer, not only the excessive gear shifting is significantly reduced, the working pressure of electric motor is also lessened. As shown in Fig. 13 (b), the performance of motor 1 works in a steady and continuous way with less frequent launching and stopping.
Gea
r ra
tio
(rp
m)

Figure. 14 Motor 1 efficiency map with and without shifting stabilizer
Fig. 14 (a) shows the efficiency map of motor 1 without shifting stabilize, in which most working points concentrate around (1500 rpm, 35Nm). This is because the power distribution strategy directed by EMS keeps the motor working in an efficient area as much as possible, but this also leads to excessive gear shifting. In comparison, Fig. 14 (b) shows the efficiency map of motor 1 with shifting stabilizer, where the working points are more scattered. This is because many working points remain the same gear ratio instead of changing gear. Accordingly, the working points with low speeds and high torques will move towards high speed and low torque area driven by the shifting stabilizer. These results show that the shifting stabilizer not only reduces the number of gear shifting but also improves the usable speed range. Moreover, it is worth noting that the overall efficiency with and without the shifting stabilizer is quite similar.
(a)
0 1000 2000 3000 4000 5000 6000 7000
Time (s)
0
10
20
30
40
50
60
70
Torq
ue (
Nm
)
(b)
0 1000 2000 3000 4000 5000 6000 7000
Time (s)
0
10
20
30
40
50
60
70
Torq
ue (
Nm
)
maximum torque
maximum torque
9392
9391
9190
87.585
8075
70
65
65
70
7580
8587.5
9092

Figure. 15 Power distribution with and without shifting stabilizer
Fig. 15 (a) shows the actual power consumption of each gear at every instant. The solid lines refer to power consumption oriented EMS without shifting stabilizer, while the dotted lines refer to EMS with shifting stabilizer. Since the power distribution strategy is still working when the gear ratio is fixed, the power consumption in each gear state is quite close, which verifies the effectiveness of the proposed EMS. According to the EMS, the gear state with lowest power consumption will be set as the working gear. As shown in Fig. 15 (b), gear 0 and gear 1 alternate to have the lowest power consumption, so that the corresponding working gear switches between them frequently. However, the shifting stabilizer will keep the power consumption of the working gear unchanged while imposing a penalty to the non-working gears.

This is showed in Fig. 15 (c), having the lowest power consumption makes gear 1 the working gear in early state. Therefore, the power consumption of the non-working gears is modified to a higher level by the shifting stabilizer. As a result, the gear 1will remain to have the lowest power consumption, and gear states will be stable during this period.
Figure. 16 Power consumption with and without shifting stabilizer in LA-92
Fig.16 compares the power consumption with and without shifting stabilizer in LA-92 driving cycle. The goals of saving-power consumption and reducing-gear shifting are contradictory, which means the reduction in gear shifting causes the increase of power consumption. As a result, while the gear changes are reduced significantly, the extra power consumption caused by shifting stabiliser is relatively small.
However, it should be noted that the shifting process also consumes energy. Considering the cumulative energy consumption caused by gear events, the reduction in excessive gear shifting saves energy as well. When gearshifts happen, motor 1 is temporarily in idling state so that motor 2 can compensate the torque hole. In this process, the energy losses are mainly caused by the efficiency loss of motor. Specifically, the loss is caused by motor 1 working from its high efficiency area to low efficiency area. The efficiency of both motors vary from 0.6 to 0.96. The shifts complete in 1.2s. Based on these, the energy losses are estimated as below:
Firstly, the average power consumption is decided by
29
Then, the power loss is calculated by
∙ 0.6 30
So the energy loss is calculated by
∙ 1.2 ∙ 0.6 ∙ 1.2 31
Where and is the total energy consumption and time span of the driving cycle, is the average efficiency, 0.6 is the lowest efficiency of motors and 1.2 is the time needed for shift. The gearshift cost for LA-92 and HWFET is estimated in Table 5.
Table 5 Energy loss estimation of gearshift
LA-92 0.848 kwh 1435s 0.8 0.00015 kwh
HWFET 2.0564 kwh 765s 0.9 0.00097 kwh
Pow
er (
kwh)

The comparison of energy consumptions is listed in Table 6. In the whole LA-2 driving cycle, the number of gear events reduce from 392 times to 60 times (84.693% down), while the energy consumption rising by 3.387%. Considering the shifting cost, the final energy is saved by 2.37%.
Table 6 Results of LA-92 driving cycle
LA-92 Gear shifting Energy consumption (kwh)
Shifting cost (kwh)
Total (kwh)
Before 392 0.8418 392*0.00015=0.0588
0.9006
After 60 0.8703 60*0.00015=0.009 0.8793
Overall 84.693% (down) 3.387% (up) 2.37% (down)
6.2 HWFET driving cycle
HWFET driving cycle is a representation of high speed cruising with a distance of 16.45 km and an average speed of 77.7km/h in 765s.
EMS analysis
Fig. 16 shows the vehicle speed and compares the efficiency of different power distribution systems.
Figure. 17 Simulation results of vehicle speed and efficiency
Different from LA-92, the average speed of HWFET is relatively high. The speed file in Fig. 17 (a) illustrates that the vehicle speed follows the target speed accurately. Fig. 17 (b) compares the efficiency of proposed EMS with that of different power distribution strategies. Since the driving condition is more stable with less braking, acceleration and deceleration, the efficiency is steadier than that of LA-92. The details shows that DP achieves the highest efficiency. As a global optimization, the result of DP is used as a reference for real-time strategies. Compared to the DP, the efficiency of proposed EMS is lower but quite close, which validates the effectiveness of the proposed EMS. The fixed ratio distribution strategies fall behind because both motors cannot work in their high efficiency area. The efficiency of the distribution with 0% and 100% of motor 1 and 2 is higher due to the advantage of motor 2 in cruising condition. Compared to LA-92, due to high average vehicle speed and less complicated driving conditions, both motor

speeds are high and easy to work at their high efficiency. As a result, the overall efficiency of HWFET is higher and the difference between different strategies is smaller.
Shifting stability analysis
Fig. 18 shows the gearshift maps and the speed of two motors.
Figure. 18 Gear shifting reduction with and without shifting stabilizer
Specifically, Fig. 18 (a) shows the gear shifting events and corresponding angular speed of both motors directed by the proposed EMS without shifting stabilizer. Compared to LA-92, as the driving condition is simple, the overall gear shifting is much less. However, excessive gear shifting still exists when speed changes. Fig. 18 (b) shows the results directed by EMS with shifting stabilizer, in which the excessive gear shifting is further reduced. The motor speed figure demonstrates that the motor 1 only helps provide power during acceleration and deceleration. But the angular speed of motor 1 is high to guarantee high efficiency. At the same time, motor 2 works as the main power source because the designed fixed gear can not only satisfy the dynamic performance but also guarantee high efficiency of motor 2 in high speed cruising. In comparison, the number of gear shifting is reduced significantly, while the performance of motor 1 becomes
Gea
r ra
tio
(rp
m)
Gea
r ra
tio
(rp
m)
steadier without on and off interruptions.
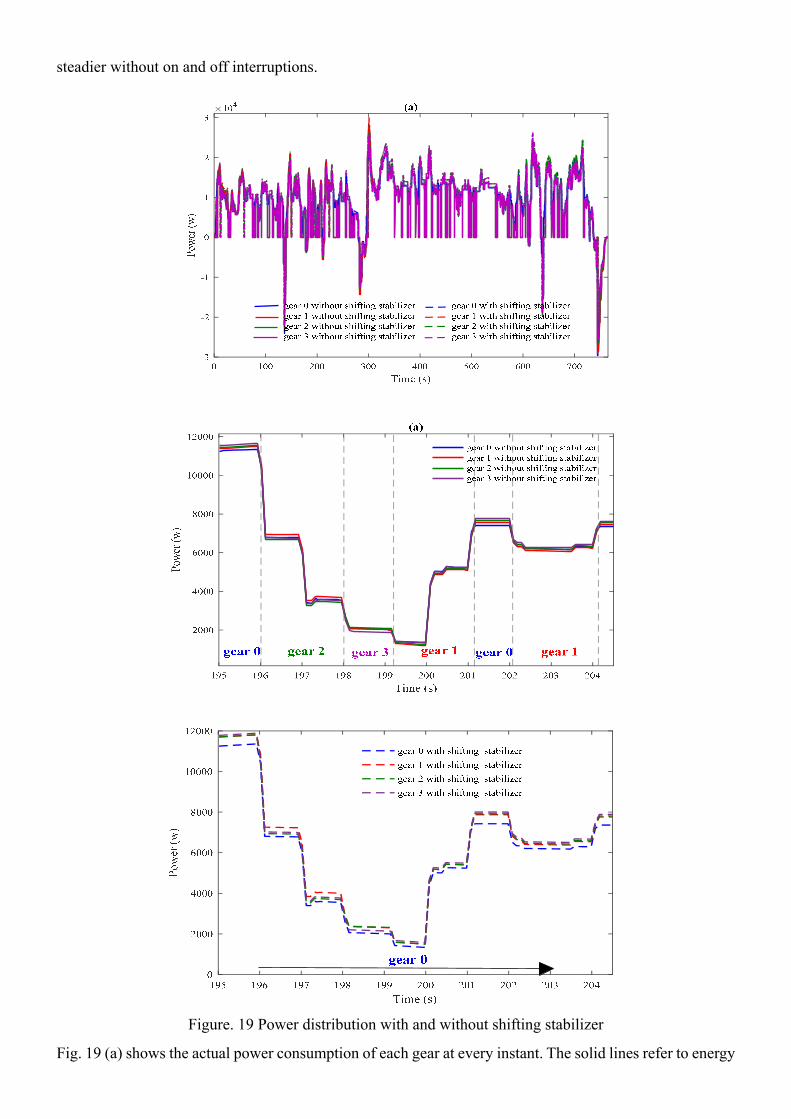
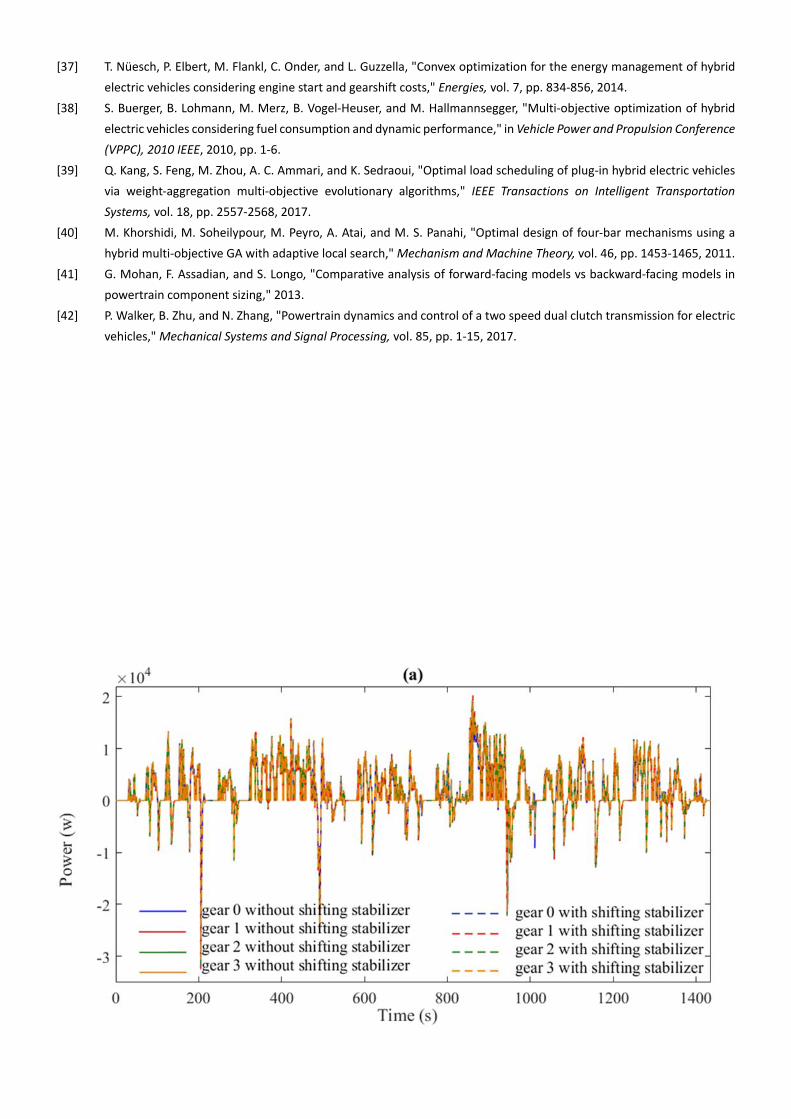
Figure. 19 Power distribution with and without shifting stabilizer
Fig. 19 (a) shows the actual power consumption of each gear at every instant. The solid lines refer to energy

consumption oriented EMS without shifting stabilizer, while the dotted lines refer to EMS with shifting stabilizer. Since the power distribution strategy is still working when the gear ratio is fixed, the power consumption in each gear state is quite close, which verifies the effectiveness of the proposed EMS. According to the EMS, the gear state with lowest power consumption will be set as the working gear. As shown in Fig. 19 (b), the working gear change frequently in a short period from gear 0, gear 2, gear 3, gear 1, and gear 0 to gear 1. With the shifting stabilizer, the strategy will keep the instant power consumption of the working gear unchanged while imposing a penalty to all the non-working gear states, which is showed in Fig. 19 (c). Having the lowest power consumption makes gear 0 the working gear in the early state. With the shifting stabilizer, the power consumption of the non-working gears is modified to a higher level by the shifting stabilizer. As a result, the gear 0 will remain to have the lowest power consumption so that short shifting intervals are avoid.
Figure. 20 Power consumption with and without shifting stabilizer in
HWFET
Fig. 20 compares the power consumption with and without shifting stabilizer in the HWFET driving cycle. Since the basic overall efficiency of the HWFET driving cycle is higher than that of the LA-92, the power consumption with and without shifting stabilizer is closer. The details of energy consumption are listed in Table 7. In the whole HWFET driving cycle, the gear events reduce from 122 times to 31 times (75.590% down), while the energy consumption rise by 0.811%. Since the driving condition is simpler than that of LA-92, the shifting times and the shifting reduction is less. At the same time, as the average speed is much higher than that of LA-92, both motors are easy to work in their high efficiency area so that the extra energy consumption caused by gear shifting reduction is much less. The extra energy consumption will be further minimized when taking shifting cost for each gear change into account. After this, the total extra energy consumption is saved by 3.75%.
Table 7 Results of HWFET driving cycle
HWFET Gear shifting Energy consumption (kwh)
Shifting cost (kwh)
Total (kwh)
Before 122 2.0564 122*0.00097=0.1183 2.1747
After 31 2.0630 31*0.00097=0.0301 2.0931
Overall 74.590%(down) 0.811% (up) 3.75%(down)
7. Conclusions
This paper proposes a real-time EMS for a dual input system, where one motor is connected to an AMT transmission the other one directly drives the vehicle through a fixed gear. Since the energy management strategy is based on minimizing the energy consumption of the two motors at every instant, excessive gear shifting will be a problem. To avoid undesired gear shifting, a shifting stabilizer is proposed to improve shifting stability. To reach a balance between gear shifting and energy consumption, a multi-objective optimization algorithm is adopted to determine the optimal coefficient of proposed shifting stabilizer. Two
Pow
er (
kwh)

driving cycles covering from urban driving conditions to mid-high cruising driving conditions are used to demonstrate the effectiveness of the proposed EMS and the improvement of the shifting stability. Compared with various power distribution systems, the proposed EMS has been validated through the results that it has the ability to effectively harmonize two motors in different driving conditions. By managing the two motors working alternatively or simultaneously according to their efficiency, the proposed strategy can achieve a decent overall efficiency. With the designed shifting stabilizer, the excessive gear shifting is reduced significantly by improving the shifting margin and interval. The results show that the reduction of unnecessary gear shifting makes motor 1 operate in a more stable and continuous way. Moreover, considering the shifting cost from actuator, it also save energy by reducing the number of shifts.
Future work will include (1) deployment of EMS and shift control strategies on dSpace MicroAutoBox for real time control studies, and (2) comparison of proposed methodologies for EMS and shifting to conventional strategies.
References
[1] D. Tesar, "Open architecture vehicles of the future," Mechanism and Machine Theory, vol. 89, pp. 107‐127, 2015.
[2] A. Sciarretta and L. Guzzella, "Control of hybrid electric vehicles," IEEE Control systems, vol. 27, pp. 60‐70, 2007.
[3] X. Zeng, N. Yang, J. Wang, D. Song, N. Zhang, M. Shang, et al., "Predictive‐model‐based dynamic coordination control
strategy for power‐split hybrid electric bus," Mechanical Systems and Signal Processing, vol. 60, pp. 785‐798, 2015.
[4] R. C. Kroeze and P. T. Krein, "Electrical battery model for use in dynamic electric vehicle simulations," in Power
Electronics Specialists Conference, 2008. PESC 2008. IEEE, 2008, pp. 1336‐1342.
[5] X. Hu, C. M. Martinez, and Y. Yang, "Charging, power management, and battery degradation mitigation in plug‐in hybrid
electric vehicles: A unified cost‐optimal approach," Mechanical Systems and Signal Processing, vol. 87, pp. 4‐16, 2017.
[6] Q. Ren, D. Crolla, and A. Morris, "Effect of transmission design on electric vehicle (EV) performance," in Vehicle Power
and Propulsion Conference, 2009. VPPC'09. IEEE, 2009, pp. 1260‐1265.
[7] M. Roozegar, Y. Setiawan, and J. Angeles, "Design, modelling and estimation of a novel modular multi‐speed
transmission system for electric vehicles," Mechatronics, vol. 45, pp. 119‐129, 2017.
[8] Y.‐B. Bang and M. Yoon, "3‐Speed Transmission Using Dual Motors and One‐Way Clutches," IEEE/ASME Transactions
on Mechatronics, vol. 21, pp. 412‐418, 2016.
[9] J. Liang, P. D. Walker, J. Ruan, H. Yang, J. Wu, and N. Zhang, "Gearshift and brake distribution control for regenerative
braking in electric vehicles with dual clutch transmission," Mechanism and Machine Theory, vol. 133, pp. 1‐22, 2019.
[10] G. Wu and Z. Dong, "Design, analysis and modeling of a novel hybrid powertrain system based on hybridized
automated manual transmission," Mechanical Systems and Signal Processing, vol. 93, pp. 688‐705, 2017.
[11] L. Miao, X. Cheng, Z. Liu, X. Li, and X. Liu, "Optimal control of gearshift in automatic mechanical transmission," in 2015
International Conference on Automation, Mechanical Control and Computational Engineering, 2015.
[12] B. Gao, Y. Xiang, H. Chen, Q. Liang, and L. Guo, "Optimal trajectory planning of motor torque and clutch slip speed for
gear shift of a two‐speed electric vehicle," Journal of Dynamic Systems, Measurement, and Control, vol. 137, p. 061016,
2015.
[13] A. Sorniotti, T. Holdstock, M. Everitt, M. Fracchia, F. Viotto, C. Cavallino, et al., "A novel clutchless multiple‐speed
transmission for electric axles," International Journal of Powertrains, vol. 2, pp. 103‐131, 2013.
[14] J. Liang, H. Yang, J. Wu, N. Zhang, and P. D. Walker, "Shifting and power sharing control of a novel dual input clutchless
transmission for electric vehicles," Mechanical Systems and Signal Processing, vol. 104, pp. 725‐743, 2018.
[15] J. Liang, H. Yang, J. Wu, N. Zhang, and P. D. Walker, "Power‐on shifting in dual input clutchless power‐shifting
transmission for electric vehicles," Mechanism and Machine Theory, vol. 121, pp. 487‐501, 2018.
[16] J. Ruan, P. D. Walker, N. Zhang, and J. Wu, "An investigation of hybrid energy storage system in multi‐speed electric
vehicle," Energy, vol. 140, pp. 291‐306, 2017.
[17] H. V. Alizadeh, M. R. Mousavi, and B. Boulet, "Synchromesh torque estimation in an electric vehicle's clutchless
automated manual transmission using unknown input observer," in Vehicle Power and Propulsion Conference (VPPC),
2015 IEEE, 2015, pp. 1‐5.
[18] M. S. R. Mousavi, H. V. Alizadeh, and B. Boulet, "Estimation of synchromesh frictional torque and output torque in a
clutchless automated manual transmission of a parallel hybrid electric vehicle," IEEE Transactions on Vehicular
Technology, vol. 66, pp. 5531‐5539, 2017.
[19] C.‐Y. Tseng and C.‐H. Yu, "Advanced shifting control of synchronizer mechanisms for clutchless automatic manual
transmission in an electric vehicle," Mechanism and Machine Theory, vol. 84, pp. 37‐56, 2015.
[20] E. Chemali, M. Preindl, P. Malysz, and A. Emadi, "Electrochemical and electrostatic energy storage and management
systems for electric drive vehicles: State‐of‐the‐art review and future trends," IEEE Journal of Emerging and Selected
Topics in Power Electronics, vol. 4, pp. 1117‐1134, 2016.
[21] T. Hofman, R. van Druten, M. Steinbuch, and A. Serrarens, "Rule‐based equivalent fuel consumption minimization
strategies for hybrid vehicles," IFAC Proceedings Volumes, vol. 41, pp. 5652‐5657, 2008.
[22] J. Peng, H. He, and R. Xiong, "Rule based energy management strategy for a series–parallel plug‐in hybrid electric bus
optimized by dynamic programming," Applied Energy, vol. 185, pp. 1633‐1643, 2017.
[23] N. J. Schouten, M. A. Salman, and N. A. Kheir, "Energy management strategies for parallel hybrid vehicles using fuzzy
logic," Control Engineering Practice, vol. 11, pp. 171‐177, 2003.
[24] H. Yin, W. Zhou, M. Li, C. Ma, and C. Zhao, "An adaptive fuzzy logic‐based energy management strategy on
battery/ultracapacitor hybrid electric vehicles," IEEE Transactions on Transportation Electrification, vol. 2, pp. 300‐311,
2016.
[25] Z. Chen, C. C. Mi, J. Xu, X. Gong, and C. You, "Energy management for a power‐split plug‐in hybrid electric vehicle based
on dynamic programming and neural networks," IEEE Transactions on Vehicular Technology, vol. 63, pp. 1567‐1580,
2014.
[26] S. Zhang and R. Xiong, "Adaptive energy management of a plug‐in hybrid electric vehicle based on driving pattern
recognition and dynamic programming," Applied Energy, vol. 155, pp. 68‐78, 2015.
[27] N. Murgovski, L. Johannesson, J. Sjöberg, and B. Egardt, "Component sizing of a plug‐in hybrid electric powertrain via
convex optimization," Mechatronics, vol. 22, pp. 106‐120, 2012.
[28] C. M. Martinez, X. Hu, D. Cao, E. Velenis, B. Gao, and M. Wellers, "Energy management in plug‐in hybrid electric vehicles:
Recent progress and a connected vehicles perspective," IEEE Trans. Veh. Technol, vol. 66, pp. 4534‐4549, 2017.
[29] C. Musardo, G. Rizzoni, Y. Guezennec, and B. Staccia, "A‐ECMS: An adaptive algorithm for hybrid electric vehicle energy
management," European Journal of Control, vol. 11, pp. 509‐524, 2005.
[30] T. Liu, X. Hu, S. E. Li, and D. Cao, "Reinforcement learning optimized look‐ahead energy management of a parallel hybrid
electric vehicle," IEEE/ASME Transactions on Mechatronics, vol. 22, pp. 1497‐1507, 2017.
[31] L. Zhang, X. Hu, Z. Wang, F. Sun, J. Deng, and D. G. Dorrell, "Multiobjective optimal sizing of hybrid energy storage
system for electric vehicles," IEEE Transactions on Vehicular Technology, vol. 67, pp. 1027‐1035, 2018.
[32] M. Debert, T. Miro Padovani, G. Colin, Y. Chamaillard, and L. Guzzella, "Implementation of comfort constraints in
dynamic programming for hybrid vehicle energy management," International journal of vehicle design, vol. 58, pp.
367‐386, 2012.
[33] P. Pisu, K. Koprubasi, and G. Rizzoni, "Energy management and drivability control problems for hybrid electric vehicles,"
in Decision and Control, 2005 and 2005 European Control Conference. CDC‐ECC'05. 44th IEEE Conference on, 2005, pp.
1824‐1830.
[34] D. F. Opila, X. Wang, R. McGee, R. B. Gillespie, J. A. Cook, and J. W. Grizzle, "An energy management controller to
optimally trade off fuel economy and drivability for hybrid vehicles," IEEE Transactions on Control Systems Technology,
vol. 20, pp. 1490‐1505, 2012.
[35] T. Miro‐Padovani, G. Colin, A. Ketfi‐Chérif, and Y. Chamaillard, "Implementation of an energy management strategy for
hybrid electric vehicles including drivability constraints," IEEE Transactions on Vehicular Technology, vol. 65, pp. 5918‐
5929, 2016.
[36] D. F. Opila, X. Wang, R. McGee, R. B. Gillespie, J. A. Cook, and J. Grizzle, "Real‐world robustness for hybrid vehicle
optimal energy management strategies incorporating drivability metrics," Journal of Dynamic Systems, Measurement,
and Control, vol. 136, p. 061011, 2014.
[37] T. Nüesch, P. Elbert, M. Flankl, C. Onder, and L. Guzzella, "Convex optimization for the energy management of hybrid
electric vehicles considering engine start and gearshift costs," Energies, vol. 7, pp. 834‐856, 2014.
[38] S. Buerger, B. Lohmann, M. Merz, B. Vogel‐Heuser, and M. Hallmannsegger, "Multi‐objective optimization of hybrid
electric vehicles considering fuel consumption and dynamic performance," in Vehicle Power and Propulsion Conference
(VPPC), 2010 IEEE, 2010, pp. 1‐6.
[39] Q. Kang, S. Feng, M. Zhou, A. C. Ammari, and K. Sedraoui, "Optimal load scheduling of plug‐in hybrid electric vehicles
via weight‐aggregation multi‐objective evolutionary algorithms," IEEE Transactions on Intelligent Transportation
Systems, vol. 18, pp. 2557‐2568, 2017.
[40] M. Khorshidi, M. Soheilypour, M. Peyro, A. Atai, and M. S. Panahi, "Optimal design of four‐bar mechanisms using a
hybrid multi‐objective GA with adaptive local search," Mechanism and Machine Theory, vol. 46, pp. 1453‐1465, 2011.
[41] G. Mohan, F. Assadian, and S. Longo, "Comparative analysis of forward‐facing models vs backward‐facing models in
powertrain component sizing," 2013.
[42] P. Walker, B. Zhu, and N. Zhang, "Powertrain dynamics and control of a two speed dual clutch transmission for electric
vehicles," Mechanical Systems and Signal Processing, vol. 85, pp. 1‐15, 2017.

382 383 384 385 386 387 388Time (s)
0
1000
2000
3000
4000
5000
6000
7000(b)
gear 0 gear 1gear 1gear 0gear 1
gear 0 without shifting stabilizergear 1 without shifting stabilizergear 2 without shifting stabilizergear 3 without shifting stabilizer
Pow
er (
s)

Pow
er (
w)
195 196 197 198 199 200 201 202 203 204Time (s)
2000
4000
6000
8000
10000
12000(b)
gear 0 without shifting stabilizergear 1 without shifting stabilizergear 2 without shifting stabilizergear 3 without shifting stabilizer
gear 2 gear 1gear 0gear 1gear 3gear 0

Pow
er (
w)

(a)
0 1000 2000 3000 4000 5000 6000 7000Speed (rpm)
0
10
20
30
40
50
60
70
(b)
0 1000 2000 3000 4000 5000 6000 7000Speed (rpm)
0
10
20
30
40
50
60
70
939291
90
87.5
85
80
75
7065
93929190
87.5
85
80
75
70
65
maximum torque
maximum torque