Embed Size (px)
Citation preview

Energy Research and Development Div is ion FINAL PROJECT REPORT
Repowering Solid Fuel Biomass Electricity Generation
Prepared for: California Energy Commission
Prepared by: California Biomass Collective, University of California, Davis
APRIL 2012CEC ‐500 ‐2013 ‐097

Contract Number: 500-08-017 Prepared for: California Energy Commission Prab Sethi Contract Manager Linda Spiegel Office Manager Energy Generation Research Office Laurie ten Hope Deputy Director ENERGY RESEARCH AND DEVELOPMENT DIVISION Robert P. Oglesby Executive Director
PREPARED BY: Primary Authors: Jaquelyn Birdsall Rob Williams Bryan Jenkins Steve Kaffka California Biomass Collaborative University of California Davis Davis, CA 95616
DISCLAIMER This report was prepared as the result of work sponsored by the California Energy Commission. It does not necessarily represent the views of the Energy Commission, its employees or the State of California. The Energy Commission, the State of California, its employees, contractors and subcontractors make no warranty, express or implied, and assume no legal liability for the information in this report; nor does any party represent that the uses of this information will not infringe upon privately owned rights. This report has not been approved or disapproved by the California Energy Commission nor has the California Energy Commission passed upon the accuracy or adequacy of the information in this report.

ACKNOWLEDGEMENTS
The California Biomass Collaborative of UC Davis must thank the individuals and organizations that provided us with additional input and insight that was invaluable in assembling this project. Participating organizations include, Ken Brennan, Pacific gas and Electric Company, Bryan Jenkins, California Renewable Energy Collaborative and UC Davis Energy Institute, Ty Korenwinder, Southern California Gas Company, Russ Lester, Dixon Ridge Farm, Gary Matteson, Consultant, Rob Neenan, California League of Food Processors, Tim Raibley, HDR, Inc., Sharon Shoemaker, California Institute of Food and Agricultural Research, UC Davis, Paul Singh, Department of Biological and Agricultural Engineering, UC Davis, Jim Thompson, Department Of Biological and Agricultural Engineering, UC Davis, Valentino Tiangco, Sacramento Municipal Utility District, Robert Williams, California Biomass Collaborative, UC Davis, Ed Yates, California League of Food Processors, Ruihong Zhang, Department of Biological and Agricultural Engineering, UC Davis.
Other Acknowledgements:
The authors appreciate the support provided by staff from food processing companies, city public work districts, Regional Water Quality Control Board offices and private consultants, as well as staff at California State Universities Fresno and Chico and University of California, Davis.
i

PREFACE
The California Energy Commission Energy Research and Development Division supports public interest energy research and development that will help improve the quality of life in California by bringing environmentally safe, affordable, and reliable energy services and products to the marketplace.
The Energy Research and Development Division conducts public interest research, development, and demonstration (RD&D) projects to benefit California.
The Energy Research and Development Division strives to conduct the most promising public interest energy research by partnering with RD&D entities, including individuals, businesses, utilities, and public or private research institutions.
Energy Research and Development Division funding efforts are focused on the following RD&D program areas:
• Buildings End‐Use Energy Efficiency
• Energy Innovations Small Grants
• Energy‐Related Environmental Research
• Energy Systems Integration
• Environmentally Preferred Advanced Generation
• Industrial/Agricultural/Water End‐Use Energy Efficiency
• Renewable Energy Technologies
• Transportation
Repowering Solid Fuel Biomass Electricity Generation is the interim report for the CREC Task 3.2.1.6 project (Contract Number 500‐08‐017) conducted by the California Biomass Collaborative. The information from this project contributes to the Energy Research and Development Division’s Renewable Energy Technologies Program.
For more information about the Energy Research and Development Division, please visit the Energy Commission’s website at www.energy.ca.gov/research/ or contact the Energy Commission at 916‐327‐1551.
ii

ABSTRACT
Biomass contributes approximately 19 percent of California’s renewable power and represents about two percent of California’s total power mix. The objective of this study was to evaluate the current solid fuel biomass facilities that produce electrical energy from largely forest, urban and agricultural residues and to investigate the potential for additional or improved generation by repowering these facilities. This analysis investigated the potential for adapting (repowering) current combustion‐based biomass power generation systems to other technologies, in particular integrated gasification systems either in simple cycle or combined cycle. The co‐generation of heat was also considered for generating electricity. Several repowering scenarios were analyzed and the results indicated that economic opportunities exist for the biomass power industry to refurbish or replace generating equipment or to install new systems. A number of uncertainties were also identified, and the authors concluded that the lack of large‐scale demonstrations, higher efficiency power systems, and specific performance and cost information made it difficult to resolve these uncertainties. Reductions in emissions would also allow for capacity expansions at existing sites, but additional research is needed to more fully assess individual sites as well as industry‐wide potentials for economic and other performance benefits that might accrue through repowering. Keywords: biomass, bioenergy, municipal solid waste (MSW), repowering, combined heat and power (CHP), integrated gasification combined cycle (IGCC)
Please use the following citation for this report:
Birdsall, Jaquelyn; Williams, Rob; Jenkins, Bryan; Kaffka, Steve. (California Biomass Collaborative, University of California, Davis. 2012. CREC TASK 3.2.1.6 (BIOMASS): Repowering Solid Fuel Biomass Electricity Generation. California Energy Commission. Publication number: CEC‐500‐2013‐097.
iii

TABLE OF CONTENTS
Acknowledgements ................................................................................................................................... i
PREFACE ................................................................................................................................................... ii
ABSTRACT .............................................................................................................................................. iii
TABLE OF CONTENTS ......................................................................................................................... iv
LIST OF FIGURES .................................................................................................................................... v
LIST OF TABLES .................................................................................................................................... vi
EXECUTIVE SUMMARY ........................................................................................................................ 7
Introduction ............................................................................................................................................ 7
Project Purpose ....................................................................................................................................... 7
Project Results ......................................................................................................................................... 8
Project Benefits ..................................................................................................................................... 12
CHAPTER 1: Introduction .................................................................................................................... 13
CHAPTER 2: Literature Review ........................................................................................................... 19
2.1 Current status of the Industry ...................................................................................................... 19
2.2 Repowering Defined ...................................................................................................................... 21
2.3 Technologies ................................................................................................................................... 22
2.3.1 Direct‐Fired Biomass or Direct Combustion ....................................................................... 24
2.3.2 Biomass Gasification ............................................................................................................... 25
2.3.3 Fuel Cells .................................................................................................................................. 28
2.3.4 Pyrolysis ................................................................................................................................... 29
2.4 Permitting ........................................................................................................................................ 29
CHAPTER 3: Methods of Analysis ...................................................................................................... 31
3.1 Economic Analysis ......................................................................................................................... 32
3.2 Additional cost factors associated with bioenergy .................................................................... 32
3.2.1 Feedstock Costs ....................................................................................................................... 32
3.2.2 Capacity Factor ........................................................................................................................ 32
3.2.3 Tax Credits ............................................................................................................................... 32
iv

3.2.4 Carbon Accounting ................................................................................................................. 33
CHAPTER 4: Conversion Pathways .................................................................................................... 34
4.1 Direct Combustion with Steam Turbine (base case) ................................................................. 35
4.2 Direct Combustion with Cogeneration ....................................................................................... 36
4.3 Gasifier/Gas Turbine ...................................................................................................................... 38
4.4 Integrated Gasifier Combined Cycle (IGCC with Gas Turbine) ............................................. 39
4.5 Integrated Gasifier Fuel Cell (IGFC) ........................................................................................... 41
4.6 Gasifier/fuel cell/CC ....................................................................................................................... 42
4.7 Cost Summary ................................................................................................................................ 43
CHAPTER 5: Conclusions ..................................................................................................................... 45
REFERENCES .......................................................................................................................................... 46
APPENDIX A ......................................................................................................................................... A‐1
LIST OF FIGURES
Figure ES 1: Feedstock Demand and Changes in Annual Feedstock Costs and Electricity Revenues with Conversion Efficiency for a Reference 45 MWe Biomass Power Plant ................... 9
Figure ES 2: Net of Annual Electricity Revenue and Feedstock Cost with Efficiency for a 45 MWe Reference Biomass Power Plant. Feedstock Cost Increment between Curves is $10/dry ton. ................................................................................................................................................................ 9
Figure ES 3: Net of Annual Electricity Revenue and Feedstock Cost with Efficiency for a 45 MWe Reference Biomass Power Plant. Electricity Price Increment between Curves is $0.01/kWh. ................................................................................................................................................. 10
Figure 1: Feedstock Demand and Changes in Annual Feedstock Costs and Electricity Revenues with Conversion Efficiency for a Reference 45 MWe Biomass Power Plant ................................... 16
Figure 2: Net of Annual Electricity Revenue and Feedstock Cost with Efficiency for a 45 MWe Reference Biomass Power Plant. Feedstock Cost Increment between Curves is $10/dry ton. ..... 17
Figure 3: Net of Annual Electricity Revenue and Feedstock Cost with Efficiency for a 45 MWe Reference Biomass Power Plant. Electricity Price Increment between Curves is $0.01/kWh. ..... 18
Figure 4: Assessment Methodology ...................................................................................................... 19
Figure 5: Thermochemical Conversion Pathways of Solid Fuel Biomass Feedstock ..................... 22
Figure 6: Instant Costs of Various Power Generation Pathways from Literature .......................... 23
Figure 7: Diagram of Generic Rankine Cycle Solid‐Fuel Combustion Plant ................................... 24
v

vi
Figure 8: O&M Cost Components for Gasifier Based Biomass Power Generation Facilities from Literature ................................................................................................................................................... 27
Figure 9: Gasifier System Component Costs from Literature ............................................................ 28
Figure 10: Permitted Emissions at California Solid Fuel Bioenergy Facilities ................................. 30
Figure 11: Cogeneration with Extraction of Medium Pressure Steam for Heat Utilization .......... 37
Figure 12: Schematic of Generic High Pressure Air Blown BIGCC System (USDOE 1997) .......... 40
LIST OF TABLES
Table ES 1: Summary of Capital Cost and LCOE for Repowering Scenarios .................................. 11
Table 1: Status of Solid Fuel Biomass Facilities in California ............................................................ 20
Table 2: Summary of California Solid Biomass Power Facility Status ............................................. 21
Table 3: Capital Cost Assumptions and LCOE for Base Case Scenario (repowered by replacing boiler and other components with new, but similar equipment) ..................................................... 35
Table 4: Sensitivity of Incremental LCOE for Base Case Repowering .............................................. 36
Table 5: Capital Cost Assumptions and LCOE for Repowering with CHP System ....................... 38
Table 6: Capital Cost Assumptions and LCOE for REPOWering with Gasifier/GT System ......... 39
Table 7: Capital Cost Assumptions and LCOE for Repowering with IGCC System ..................... 40
Table 8: Capital Cost Assumptions and LCOE for Repowering with IGFC system ...................... 42
Table 9: Capital Cost Assumptions and LCOE for Repowering with IGFCCC system ................. 43
Table 10: Summary of Capital Cost and LCOE for repowering Scenarios ...................................... 43

EXECUTIVE SUMMARY
Introduction Biomass contributes more than 5.7 terrawatt hours (TWh) to California’s in‐state renewable power (about 19 percent of in‐state renewable power and two percent of California’s total power mix) (CEC 2010). Current operating biopower capacity is about 900 megawatts (MW), including approximately 550 MW of woody biomass solid fuel combustion, 280 MW of landfill gas‐to‐energy and 75 MW from wastewater treatment biogas (CBC 2011). It is estimated that there is sufficient in‐state “technically” recoverable biomass to support another 2,800 MW of capacity or 21 TWh of electricity (Williams et al., 2008). “Technically” refers to biomass resources that can be sustainably recovered with minimal impacts to erosion, riparian zones, soil organic matter and other agronomic factors. There is no economic filter applied to the technical resource estimate. These values assume all biomass resources are used for power generation. Where used for fuel production or other applications, the quantity available for electricity generation is reduced.
Most biomass energy is derived from woody material, (including urban wood waste, forest product residue as well as agricultural residues), representing an estimated 3.6 TWh per year. There is a growing interest in using municipal solid waste (MSW) and applying co‐digestion techniques at wastewater treatment facilities to generate electricity and renewable fuels.
At its peak, the California solid‐fuel biomass industry generated 4.5 TWh per year of electricity (Morris G. , 2003). This was in the early 1990s, before deregulation. The existing facilities provide a significant portion of the state’s renewable baseload renewable electricity. The continued economic feasibility of this source of renewable energy is uncertain, however, and improvements to increase overall performance and economic competitiveness would help to achieve the state’s objectives for both near‐ and longer‐term renewable energy development.
Bioenergy facilities provide baseload renewable energy but are also considered a beneficial disposal outlet for certain wastes. Non‐market factors such as resource diversity, waste mitigation, and environmental impact are not necessarily fully incorporated into prices paid for energy from biomass facilities. Competition‐based pricing does not favor solid‐fuel biomass energy generation against wind and geothermal power within California’s Renewable Portfolio Standard (RPS), or against natural gas and other sources in the electricity market.
The vast majority of California’s solid fuel biomass power plants were built in the 1980s and are 25‐30 years old. Because of nitrogen oxide (NOx) and particulate matter (PM) emissions from these systems (combustion boiler with steam Rankine power cycle), it will be difficult and expensive to site significant new capacity using this technology in California’s non‐attainment air quality regions.
Project Purpose The objective of this study was to evaluate the current solid fuel biomass facilities that produce electrical energy from largely forest, urban and agricultural residues and to investigate the potential for additional or improved generation by repowering these facilities. This analysis
7

investigated the potential for adapting (repowering) current combustion‐based biomass power generation systems to other technologies, in particular integrated gasification systems either in simple cycle or combined cycle. The co‐generation of heat was also considered for generating electricity. Biochemical processes such as fermentation or anaerobic digestion were not addressed here nor were hybrid natural gas/solid biomass facilities or facilities that make biomethane/synthetic natural gas (SNG) for pipeline injection.
Project Results The study found that the economic opportunity for repowering lies in part in the reduced feedstock demand associated with higher conversion efficiency, as shown in Figure ES 1. For a reference 45 megawatt electric (MWe) power plant fueled with biomass operating at an 85 percent capacity factor and generating 335 gigawatt hours (GWh) per year of electrical energy, an increase from 20 to 30 percent electrical efficiency reduced annual feedstock requirements by 123,000 dry tons and increased annual net revenues by $3.7 million for an electricity price of $0.08 per kilowatt hour (kWh) and feedstock cost of $30 per dry ton. This would also allow increased capacity and generation from the feedstock released to the market as well as potentially affecting feedstock market price due to changes in market demand. The incremental net revenue increased as fuel costs increased, so that at $60 per dry ton feedstock cost, the same increase in efficiency resulted in an annual net revenue increase of $7.4 million, although total net revenue is reduced at any efficiency due to the higher cost for feedstock, as shown in Figure ES 2. The effect was amplified if electricity prices increased as the conversion efficiency increased, or buffered if electricity prices decreased, as shown in Figure ES 3. At a $30 per dry ton feedstock cost, the increase in net revenue was $17.1 million as efficiency increased from 20 to 30 percent and the electricity price increased from $0.08 to 0.12/kWh, nearly five times the increase at a constant electricity price. A decline in electricity prices from $0.08 to 0.05/kWh at 20 percent efficiency would result in annual net revenues declining by $10.1 million. The loss in annual net revenue would be only $6.4 million if the same electricity price declines occurred while efficiency improved from 20 to 30 percent. These values only took into account the differences between electricity revenues and feedstock costs. Other factors included changes in capital, operating and maintenance, permitting, and other costs or benefits associated with any attempt to repower the facility, the effects of which were addressed in the economic assessments discussed later in the report.
8

Figure ES 1: Feedstock Demand and Changes in Annual Feedstock Costs and Electricity Revenues with Conversion Efficiency for a Reference 45 MWe Biomass Power Plant
‐30
‐20
‐10
0
10
20
30
40
50
0.0
0.2
0.4
0.6
0.8
1.0
1.2
1.4
1.6
0 10 20 30 40 50 60 70
Revenu
e or Cost (M
illion $/y)
Feed
stock Dem
and (M
illion tons/y)
Efficiency (%)
Electricity Revenue →
45 MWe, 335 GWh/yFuel Cost = $30/tonElectricity Price = $0.08/kWh
← Feedstock Demand
Feedstock Cost →
Net Revenue →
Breakeven
Figure ES 2: Net of Annual Electricity Revenue and Feedstock Cost with Efficiency for a 45 MWe
Reference Biomass Power Plant. Feedstock Cost Increment between Curves is $10/dry ton.
‐70
‐60
‐50
‐40
‐30
‐20
‐10
0
10
20
30
0 10 20 30 40 50 60 7
Efficiency (%)
Net Reven
ue ($
million/year)
0
$60/ton$20/ton
Feedstock Cost
Electricity Price = $0.08/kWh
45 MWe, 335 GWh/yNet of Electricity Income and Feedstock Cost(Excludes Capital and O&M expenses)
Breakeven
9

Figure ES 3: Net of Annual Electricity Revenue and Feedstock Cost with Efficiency for a 45 MWe Reference Biomass Power Plant. Electricity Price Increment between Curves is $0.01/kWh.
‐40
‐30
‐20
‐10
0
10
20
30
40
0 10 20 30 40 50 60 7Electrical Efficiency (%)
Net Reven
ue ($
million)
0
$0.05/kWh
$0.12/kWhFeedstock cost = $30/ton
ElectricityPrice
45 MWe, 335 GWh/yNet of Electricity Income and Feedstock Cost(Excludes Capital and O&M expenses)
Breakeven
Six repowering scenarios were considered, including a base case:
• Base case (boiler replaced with new boiler). • Base case plus heat recovery. • Gasifier with single‐cycle gas turbine. • Integrated gasification combined cycle (IGCC). • Integrated gasification and fuel cell (IGFC). • Integrated gasification and fuel cell combined with steam bottoming cycle (IGFCCC).
The capital cost assumptions and the estimated levelized cost of energy (LCOE) by scenario are summarized in Table ES 1. The scenario with the lowest capital cost (base case at $1427/kW) had a mid‐range electricity generation cost (LCOE, constant $0.048 per kWh). The lowest LCOE was the base case with combined heat and power (CHP) at $0.038 per kWh where heat sales more than compensated for the additional capital cost of the CHP equipment.
10
Table ES 1: Summary of Capital Cost and LCOE for Repowering Scenarios
Capital Cost, Installed ($/kW net)
LCOE (Current, $/kWh)
LCOE (Constant, $/kWh)
Base Case 1427 0.055 0.048Base Case + CHP 1549 0.044 0.038
Gasifier w/ GT 1698 0.059 0.051BIGCC 1801 0.047 0.041IGFC 3033 0.074 0.064IGFCCC 3137 0.069 0.060
The highest LCOE scenarios were associated with gasifier‐to‐fuel cells ($0.64 and $0.60 per kWh) where the capital cost increment was more than the associated efficiency improvement. These results were preliminary pending scrutiny of the literature and capital cost assumptions for the scenarios. For instance, conservative assumptions on system efficiencies for the combustion pathways were used for both electricity and CHP. Assessing the sensitivity of costs to efficiencies in the combustion scenarios as well as the others may change the rank ordering of these scenarios, at least by the criterion of LCOE. A quantitative discussion of emissions for each scenario (and comparisons to business as usual – not repowering) would help inform scenario outcomes and offer insight for potential health and air‐shed improvements. The economic potential of selling emissions reductions on offset markets needs to be analyzed for impacts on LCOE in scenarios with emissions reductions.
The analysis of repowering scenarios suggested that economic opportunities exist for the biomass power industry in addressing refurbishment or replacement needs for generating equipment or for installing new systems. A number of uncertainties surrounded this issue, especially as large‐scale demonstrations are mostly lacking alternative and potentially higher efficiency power systems and specific performance and cost information have yet to be developed. Implementing CHP where possible in facilities currently generating electricity only had some clear LCOE advantages if heat was consistently valued with heat from purchased natural gas. IGCC could also realize cost advantages in comparison with Rankine cycle combustion power plants, but the difference in estimated LCOE ($0.041 vs. 0.048 per kWh) was in a range where significant amounts of new information on commercial scale cost and performance was required to gain substantial confidence in the potential benefits associated with this type of repowering. Integrated fuel cell systems may also offer substantial efficiency advantages, but estimated capital costs resulted in LCOE above both the reference Rankine cycle and IGCC systems. Reductions in emissions would also allow for capacity expansions at existing sites, but additional research is needed to more fully assess individual sites as well as industry‐wide potentials for economic and other performance benefits that might accrue through repowering.
11

Project Benefits This project investigated the potential for additional or improved generation by repowering solid fuel biomass facilities. If the scenarios analyzed in this study were implemented, additional electrical generation would be produced from biomass energy, which would reduce greenhouse gas emissions that cause climate change and also reduce other emissions that cause air pollution and adverse health effects.
12

CHAPTER 1: Introduction With an increasing demand for energy ‐ renewable energy generation is critical to allow for a sustainable energy future. The California Renewable Portfolio Standard (RPS, SB 10781 and following legislation) was implemented to ensure California would lead in the development of renewable power generation. The RPS requires investor‐owned utilities, electric service providers, and community choice aggregators to procure 33 percent of electricity from eligible renewable energy resources by 2020. To support biomass as a renewable source, the Governor’s executive order EO‐06‐06 calls for a minimum of 20 percent of the renewable electricity under the RPS come from biopower. This executive order carries no force of law, and so does not mandate this level of generation from biomass but constitutes a continuing interest in renewable electricity from this resource.
As part of the RPS and the future higher penetration of renewables in the electricity generation mix, biomass is also useful because it can serve as a source of baseload power to help stabilize the electricity transmission and distribution grid handling high levels of intermittent solar and wind based generation.
Biomass contributes more than 5.7 TWh to California’s instate renewable power (about 19 percent of in‐state renewable power and 2 percent of full California power mix) (CEC 2010). Current operating biopower capacity is about 900 MW (including approximately 550 MW of woody biomass solid fuel combustion, 280 MW of landfill gas‐to‐energy and 75 MW from wastewater treatment biogas) (CBC 2011). It is estimated that there is sufficient in‐state ‘technically’ 2 recoverable biomass to support another 2,800 MW of capacity or 21 TWh of electricity (Williams et al., 2008). These values assume all resource is used for power generation. Where used for fuel production or other applications, the quantity available for electricity generation is reduced.
While most biomass energy is derived from woody material, estimated 3.6TWh/y (including urban wood waste, forest product residue as well as agricultural residues), there is a growing interest in using municipal solid waste (MSW) and applying co‐digestion techniques at wastewater treatment facilities to generate electricity and renewable fuels.
At its peak, the California solid‐fuel biomass industry generated 4.5 TWh/y of electricity (Morris G. , 2003). This peak occurred in the early 1990s, before the electric utilities were deregulated. The energy generated from the biomass industry has since continued to decline with slight fluctuations based on largely on economic feasibility.
1http://www.energy.ca.gov/portfolio/documents/documents/SB1078.PDF
2 Technical biomass resource is that which can be sustainably recovered with minimal impacts to erosion, riparian zones, soil organic matter and other agronomic factors. There is no economic filter applied to the technical resource estimate.
13

The existing facilities provide a significant portion of the state’s renewable base load renewable electricity. The continued economic feasibility of this source of renewable energy is uncertain, however, and improvements to increase overall performance and economic competitiveness would be beneficial in helping to achieve the state’s objectives for both near and longer term renewable energy development.
Although bioenergy facilities are also considered a beneficial disposal outlet for certain wastes, non‐market factors such as resource diversity, waste mitigation, and environmental impact are not necessarily fully incorporated into prices paid for energy from biomass facilities. Competition‐based pricing does not at present favor solid‐fuel biomass energy generation against wind and geothermal power within the RPS, or against natural gas and other sources in the electricity market.
In addition to waste mitigation, carbon neutrality serves as an advantageous aspect of bioenergy. Biomass and biogas resources that are converted into energy might otherwise be burned or flared without useful energy production. The value of removing selected biomass materials from forests to reduce the risk of wildfire has been suggested to yield an economic advantage, adding economic growth to rural communities while reducing the costs associated with wildfires (predominantly avoided costs of firefighting, (Overend, 1997)).This does not include the avoided emissions costs associated with wildfires (Becker, et al., 2009; Mason, et al., 2006). If carbon trading were implemented, the carbon offsets from utilizing the waste streams compared to their “alternate fates” would improve economics for biomass facilities.
The objective of this study is to evaluate the current solid fuel biomass facilities that produce electrical energy from largely forest, urban and agricultural residues and investigate the potential for additional or improved generation by repowering these facilities.
The vast majority of the state’s solid fuel biomass power plants were built in the 1980’s and are 25‐30 years old. Because of NOx and particulate matter (PM) emissions from these systems (combustion boiler with steam Rankine power cycle), it will be difficult (and expensive) to site significant new capacity using this technology in California’s non‐attainment air quality regions.
This analysis investigates the potential for adapting (repowering) current combustion‐based biomass power generation systems to other technologies, in particular integrated gasification systems either in simple or combined cycle. The generation of heat is also considered in the context of combined heat and power applications, again with the principal consideration being the generation of electricity. Biochemical processes such as fermentation or anaerobic digestion are not addressed here. Co‐firing with coal is a well investigated option for the utilization of biomass in power generation. The California power grid is, however, dominated by natural gas. Natural gas is currently cofired with biomass in direct combustion (solid fuel) facilities; to cofire biomass in natural gas thermal power stations would require specific redesign of most facilities, especially combined‐cycle facilities, where the biomass is not first converted to a biomethane or substitute natural gas (SNG) for pipeline injection. This option is also not considered in the analyses here.
14
Specifically, this report focuses on the repowering of biomass solid fuel electricity generation facilities. Hereafter ‘repowering’ is used to describe the redesign and conversion of a biopower facility by one the following options: replacing the existing boiler, adding an additional cycle or new prime mover, and/or adding gasification units. The focus on existing facilities is central to this report, as idle or operating biopower facilities have already received their operating permits and, in most cases, identified sustainable sources of biomass for the feedstock. Additionally, many biomass facilities may have a long term contracts for feedstock supply. Repowering is meant to decrease emissions, improve feedstock conversion efficiencies and economic competitiveness, and potentially increase generation capacity and energy.
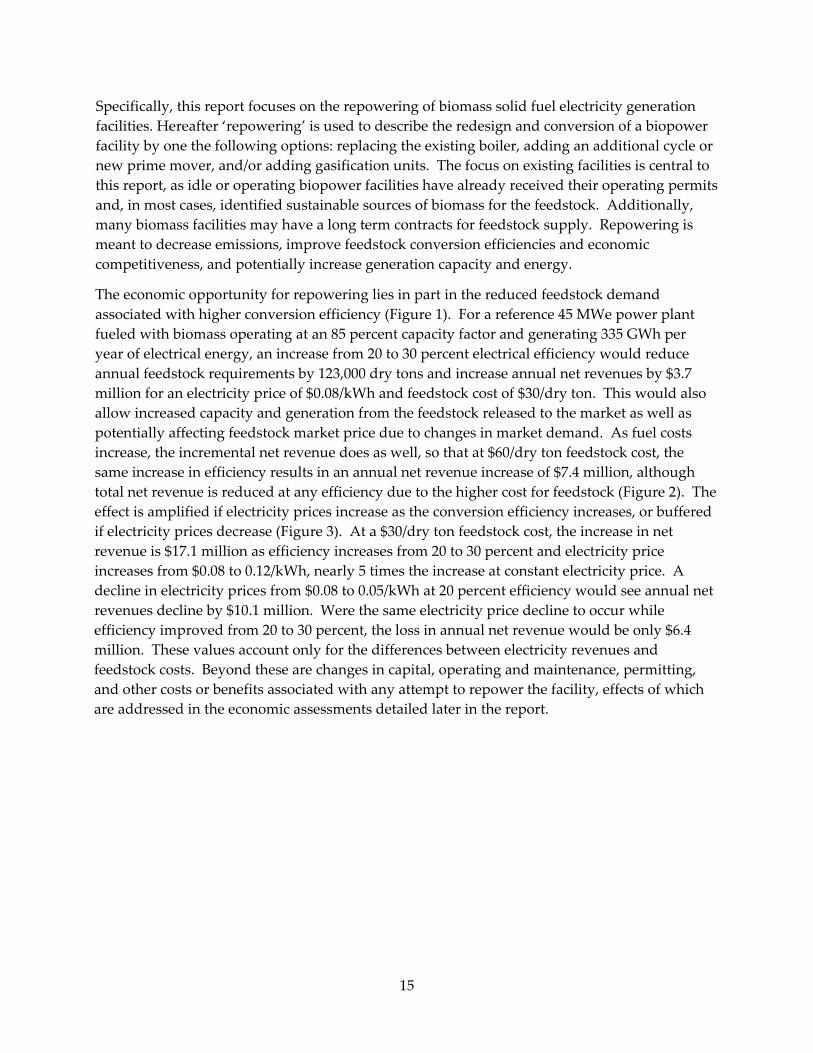
The economic opportunity for repowering lies in part in the reduced feedstock demand associated with higher conversion efficiency (Figure 1). For a reference 45 MWe power plant fueled with biomass operating at an 85 percent capacity factor and generating 335 GWh per year of electrical energy, an increase from 20 to 30 percent electrical efficiency would reduce annual feedstock requirements by 123,000 dry tons and increase annual net revenues by $3.7 million for an electricity price of $0.08/kWh and feedstock cost of $30/dry ton. This would also allow increased capacity and generation from the feedstock released to the market as well as potentially affecting feedstock market price due to changes in market demand. As fuel costs increase, the incremental net revenue does as well, so that at $60/dry ton feedstock cost, the same increase in efficiency results in an annual net revenue increase of $7.4 million, although total net revenue is reduced at any efficiency due to the higher cost for feedstock (Figure 2). The effect is amplified if electricity prices increase as the conversion efficiency increases, or buffered if electricity prices decrease (Figure 3). At a $30/dry ton feedstock cost, the increase in net revenue is $17.1 million as efficiency increases from 20 to 30 percent and electricity price increases from $0.08 to 0.12/kWh, nearly 5 times the increase at constant electricity price. A decline in electricity prices from $0.08 to 0.05/kWh at 20 percent efficiency would see annual net revenues decline by $10.1 million. Were the same electricity price decline to occur while efficiency improved from 20 to 30 percent, the loss in annual net revenue would be only $6.4 million. These values account only for the differences between electricity revenues and feedstock costs. Beyond these are changes in capital, operating and maintenance, permitting, and other costs or benefits associated with any attempt to repower the facility, effects of which are addressed in the economic assessments detailed later in the report.
15

Figure 1: Feedstock Demand and Changes in Annual Feedstock Costs and Electricity Revenues with Conversion Efficiency for a Reference 45 MWe Biomass Power Plant
‐30
‐20
‐10
0
10
20
30
40
50
0.0
0.2
0.4
0.6
0.8
1.0
1.2
1.4
1.6
0 10 20 30 40 50 60 70
Revenu
e or Cost (Million $/y)
Feed
stock Dem
and (M
illion tons/y)
Efficiency (%)
Electricity Revenue →
45 MWe, 335 GWh/yFuel Cost = $30/tonElectricity Price = $0.08/kWh
← Feedstock Demand
Feedstock Cost →
Net Revenue →
Breakeven
16
Figure 2: Net of Annual Electricity Revenue and Feedstock Cost with Efficiency for a 45 MWe Reference Biomass Power Plant. Feedstock Cost Increment between Curves is $10/dry ton.
‐70
‐60
‐50
‐40
‐30
‐20
‐10
0
10
20
30
0 10 20 30 40 50 60 7
Efficiency (%)
Net Reven
ue ($
million/year)
0
$60/ton$20/ton
Feedstock Cost
Electricity Price = $0.08/kWh
45 MWe, 335 GWh/yNet of Electricity Income and Feedstock Cost(Excludes Capital and O&M expenses)
Breakeven
17

Figure 3: Net of Annual Electricity Revenue and Feedstock Cost with Efficiency for a 45 MWe Reference Biomass Power Plant. Electricity Price Increment between Curves is $0.01/kWh.
‐40
‐30
‐20
‐10
0
10
20
30
40
0 10 20 30 40 50 60 7Electrical Efficiency (%)
Net Reven
ue ($
million)
0
$0.05/kWh
$0.12/kWhFeedstock cost = $30/ton
ElectricityPrice
45 MWe, 335 GWh/yNet of Electricity Income and Feedstock Cost(Excludes Capital and O&M expenses)
Breakeven
18

CHAPTER 2: Literature Review The current state of the industry, definition of repowering and capabilities to repower, costs associated with bioenergy and repowering, permitting issues, and available technologies are highlighted in the following sections as found in literature. The background provides the basis for the analysis of the applicable pathways for power generation by solid fuel biomass conversion in California (Figure 4).
Figure 4: Assessment Methodology
2.1 Current status of the Industry The current biomass industry in California can be attributed to the federal Public Utilities Regulatory Policy Act (PURPA) of 1978. Before PURPA, most solid biomass waste was burned or otherwise disposed of without the capture of useable energy(Morris, 2000). PURPA did this by requiring that utilities purchase power provided by qualifying independent power producers at the utility “avoided cost”(Morris, 2000), essentially the cost for the next increment of electrical energy needed by the utility that would be provided instead by alternative sources (e.g., natural gas). Due to high fossil fuel prices and supportive renewable legislation in California, the 1980s to early 1990s is known as the “growth period” for biomass facilities and laid the foundation for the utilization of approximately 6.5 million tons of waste(Morris , 2000). The primary economic incentives for the growth of the biomass power sector in the state was Standard Offer 4 contracting from the utilities that provided for ten year contracts with
19
escalating prices for electricity. Due to oversubscription from multiple generation sources, SO4 contracting was suspended by the CPUC in 1985, although construction of facilities holding SO4 contracts continued for a number of years. The electricity sector in California was restructured by law in 1996 (AB 1890), and few financial incentives for additional generation capacity have existed since then, and increasingly stringent air quality standards have made permitting for solid‐fuel direct combustion facilities, among others, more difficult. Since 1996, the biomass industry has remained relatively static.
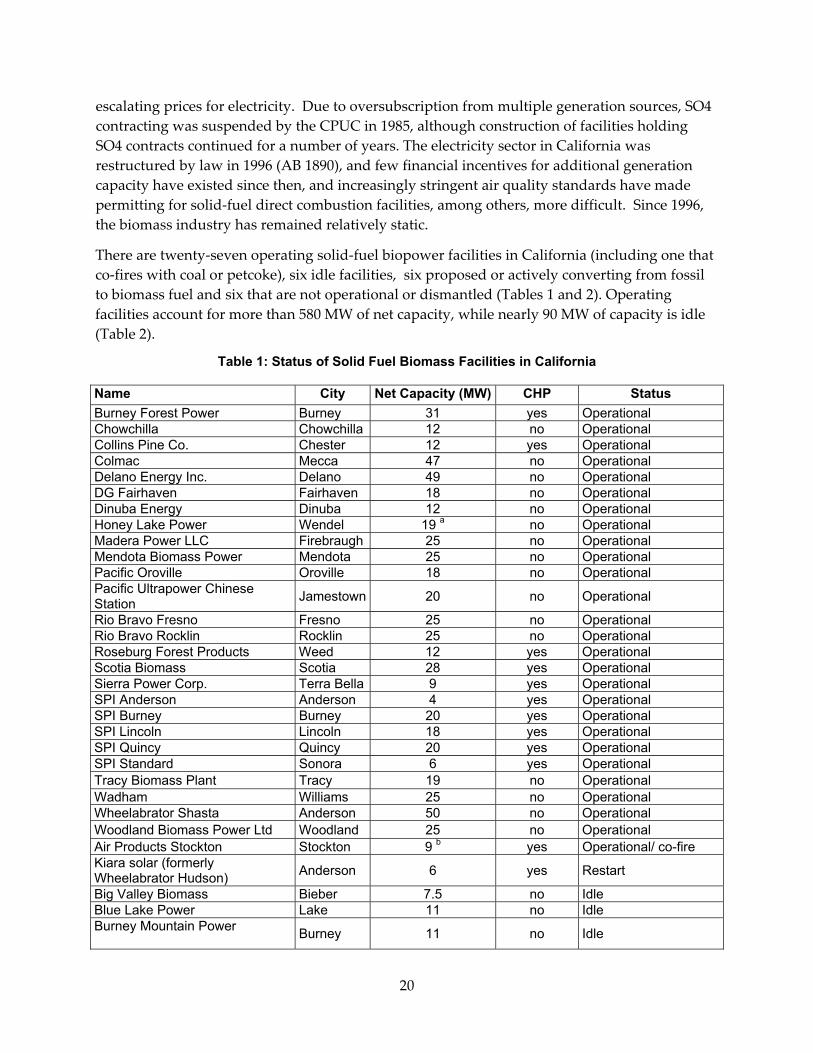
There are twenty‐seven operating solid‐fuel biopower facilities in California (including one that co‐fires with coal or petcoke), six idle facilities, six proposed or actively converting from fossil to biomass fuel and six that are not operational or dismantled (Tables 1 and 2). Operating facilities account for more than 580 MW of net capacity, while nearly 90 MW of capacity is idle (Table 2).
Table 1: Status of Solid Fuel Biomass Facilities in California
Name City Net Capacity (MW) CHP Status Burney Forest Power Burney 31 yes Operational Chowchilla Chowchilla 12 no Operational Collins Pine Co. Chester 12 yes Operational Colmac Mecca 47 no Operational Delano Energy Inc. Delano 49 no Operational DG Fairhaven Fairhaven 18 no Operational Dinuba Energy Dinuba 12 no Operational Honey Lake Power Wendel 19 a no Operational Madera Power LLC Firebraugh 25 no Operational Mendota Biomass Power Mendota 25 no Operational Pacific Oroville Oroville 18 no Operational Pacific Ultrapower Chinese Station Jamestown 20 no Operational
Rio Bravo Fresno Fresno 25 no Operational Rio Bravo Rocklin Rocklin 25 no Operational Roseburg Forest Products Weed 12 yes Operational Scotia Biomass Scotia 28 yes Operational Sierra Power Corp. Terra Bella 9 yes Operational SPI Anderson Anderson 4 yes Operational SPI Burney Burney 20 yes Operational SPI Lincoln Lincoln 18 yes Operational SPI Quincy Quincy 20 yes Operational SPI Standard Sonora 6 yes Operational Tracy Biomass Plant Tracy 19 no Operational Wadham Williams 25 no Operational Wheelabrator Shasta Anderson 50 no Operational Woodland Biomass Power Ltd Woodland 25 no Operational Air Products Stockton Stockton 9 b yes Operational/ co-fire Kiara solar (formerly Wheelabrator Hudson) Anderson 6 yes Restart
Big Valley Biomass Bieber 7.5 no Idle Blue Lake Power Lake 11 no Idle Burney Mountain Power Burney 11 no Idle
20

Name City Net Capacity (MW) CHP Status Imperial Valley Resource Recover Brawley 18 no Idle
Merced Power (El Nido) El Nido 10 no Idle Mt. Lassen Power Westwood 11 no Idle SPI Loyalton Loyalton 20 no Idle Buena Vista Power Ione 18 no Converting to biomass DTE Stockton Stockton 45 yes Converting to biomass
Mt. Poso Cogeneration Bakersfield 44 yes Converting to biomass c
SPI Anderson Project Anderson 31 yes Proposed New build
Rio Bravo Jasmin Bakersfield 40 yes Proposed Conversion to biomass
Rio Bravo Poso Bakersfield 40 yes Proposed Conversion to biomass
Mesquit Lake Resource Recovery Brawely 18.5 no Not Operational
(possible restart)
Susanville Susanville 12.5 no Not Operational (possible restart)
Sierra Biomass Auberry 7.5 no Not Operational Soledad Energy Soledad 13 no Not Operational Diamond Walnut Stockton 4.5 no Dismantled Freshwater Pulp Samoa 50 yes Dismantled Notes: a) Capacity is 32MW, currently operating at 19MW. b)Facility is 45MW net, 9 MW from 20% biomass (cofire w/ coal, petcoke, TDF). c) Initially will cofire biomass and coal/petcoke, then plans 100% biomass. Source: Mayhead, http://ucanr.org/sites/WoodyBiomass/Woody_Biomass_Utilization_2/California_Biomass_Power_Plants/ (2012)
Table 2: Summary of California Solid Biomass Power Facility Status
Status Category No. of Facilities Capacity (MW)
Operational 27 583
Undergoing Restart 1 6
Idle 7 88.5
Converting to Biomass 3 107
Proposed New or Conversion 3 111
Not Operational or Dismantled 6 106
2.2 Repowering Defined Repowering includes upgrading an existing facility by increasing boiler efficiency, replacing/improving the prime mover, adding an additional cycle, or replacing the entire system with a different technology such as gasification with combined cycle power generation. Other equipment on site which did need upgrading would continue to be used (e.g., fuel and ash storage and handling, components of grid connection, water treatment and conditioning, etc.).Repowering allows for continued utilization of capital invested in existing equipment.
Considerations of repowering include(Black & Veatch, 2010):
21

• Condition and expected life of existing systems, • biomass fuel composition, • resource availability, • performance impacts, and • emissions and permitting .
Repowering can extend the life of a facility and may be less costly than building a new plant because portions of the plant infrastructure can continue to be used, power contracts may not need renegotiating and it may be simpler to modifiy existing permits than to obtain new permits (Phillips, 2011). The potentials of different pathways for repowering are investigated in section 4 of this report.
2.3 Technologies Bioenergy products include heat, power, or fuels (such as renewable diesel, SNG, or hydrogen). A wide range of conversion options exist, some commercial, some developmental, and some only in the research stages. Thermochemical conversion pathways for solid biomass (combustion, gasification and pyrolysis) are illustrated in Figure 5. Not shown are co‐firing pathways which include solid biomass cofired with other solid fuels (coal, petcoke, MSW, RDF), gasified biomass product gas co‐fired with natural gas (or fired in a gas burner into a solid‐fuel boiler), solid or biomass product gas fired in the HRSG (or separate boiler) for heat addition in a natural gas combined cycle facility.
Figure 5: Thermochemical Conversion Pathways of Solid Fuel Biomass Feedstock3
3 Source: Williams (2010).
22

Instant costs4 of gasification and combustion pathways from literature are shown in figure 6.Based on literature data direct combustion with stoker boilers carries one of the higher instant costs, although uncertainties associated with this finding are high. This could mainly be attributed to lower efficiencies of feedstock conversion in a stoker boiler compared to projected costs for biomass integrated gasifier combined cycle systems (BIGCC), consistent with cost trends from the IEA (IEA Bioenergy, 2009). At larger scales, the gasifier costs are estimated mainly from smaller demonstration plants as further discussed in the section below. Similarly, no commercial biomass‐based fuel cell system of substantial capacity equivalent to the upper ranges of existing combustion based systems has been demonstrated, so the costs reported are also estimates. In this way, both gasification and fuel cell technology suffer from large uncertainties associated with estimated instant costs not yet validated by full‐scale commercial operation.
Figure 6: Instant Costs of Various Power Generation Pathways from Literature5
4Instant Cost, sometimes referred to as overnight cost, assumes that the plant can be built instantly (includes component, engineering, permitting, connection costs). Installed Cost accounts for the sales tax and the construction loan.
5Antonio C. Caputo, 2005; California Energy Commission, 2009; Craig & Mann, 1996; Los Angeles County Sanitation District, 2009; McDannel M. W., 2007; Rhodes, 2005; Rodrigues, 2003; Searcy, 2009; Weyerhaeuser Co, 2000; Williams R. L., 1996; Wiltsee, 2000.
23

2.3.1 Direct-Fired Biomass or Direct Combustion Direct combustion of biomass for power generation involves the oxidation of biomass with excess air to produce heat. In current electricity generating applications, the Rankine cycle is used almost exclusively with feedstock combustion raising high pressure steam in a boiler (Figure 7). The steam is then expanded through a turbine connected to a generator for electricity generation. Modern facilities primarily use traveling‐gate , fluidized bed, or suspension fired furnaces to convert the feedstock into hot combustion gas.
Figure 7: Diagram of Generic Rankine Cycle Solid-Fuel Combustion Plant6
System efficiency can be improved by increasing steam temperature and/or pressure, pre‐heating combustion air and boiler feedwater (by heat exchange with boiler flue exhaust) improving air flow, optimizing boiler insulation, maintaining a low inlet air flow, or decreasing furnace exit gas temperature. Most facilities incorporate these efficiency measures but boiler‐tube materials limit maximum steam temperature and pressure (tube life and strength limited by temperature and temperature dependent corrosion). Most energy losses are due to heat losses from the boiler or incomplete combustion(Cheng, 2010). Stoker boilers are simple and more flexible in fuel particle size, thus decreasing fuel preparation costs, but are being replaced by higher efficiency fluidized bed boilers (Cheng, 2010). Bubbling fluidized beds (BFB) and
6 Western Virginia University (http://www.mae.wvu.edu/~smirnov/mae320/notes.html/)
24

circulating fluidized beds (CFB) are more flexible in fuel moisture content than stokers; however, they require a more stringent particle size and ash controls.
Devices (or prime movers)used for power generation from biomass combustion include steam turbines, steam piston engines, steam screw engines, steam turbines in combination with an organic Rankine cycles (ORC), external Brayton cycles (externally fired gas turbine), or Stirling engines. The steam screw engine and external Brayton cycle have not been proven for large combustion processes. Steam piston engines (which have relatively low efficiency) and steam turbines with ORC are used for smaller (less than 1.5 MWe) applications, along with current demonstrations of Stirling engines (Koppejan, 2008). Steam Rankine cycles are generally utilized in solid‐fuel combustion facilities larger than ~ 5 MWe. Gas turbines are further described in section 2.5.2. 2.3.2 Biomass Gasification Biomass‐based integrated gasification combined cycle (IGCC or BIGCC) is attractive for biomass power production because it offers higher net efficiencies than Rankine steam cycles. Components of the gasification system include fuel receiving, sizing, preparation (and possibly drying), a gasifier, gas cleaning and conditioning(Craig & Mann, 1996). An integrated gasifier combined cycle utilizes a topping cycle with gas turbine‐generator and bottoming cycle utilizing a heat‐recovery steam‐generator (HRSG) and steam turbine‐generator—using what would have been waste heat to increase efficiency. Searcy (2009) indicates that where a biomass resource or plant capacity is fixed, BIGCC can produce power at a lower price than direct combustion when the feedstock price is relatively high (e.g. $270/MWh for a 4500 BDT/day processing cost). This conclusion is highly uncertain given the lack of commercial scale demonstration and reflects the value of high conversion efficiency with expensive feedstock.
Gas turbines for power generation up to about 100 MW are derived from aircraft propulsion turbines (so called aerodervitive turbinesincluding the LM 1600 (S&S), LM 2500 (GE), and PGT 25 (Nuovo) (Rodrigues, 2003). GE Energy markets a turbine for syngas from IGCC 7. With steam injection, larger turbines can produce electricity at up to 40 percent efficiency (simple cycle, Williams,1996). Biomass gasification systems can enable utilization of gas turbines (also with combined steam cycle), which potentially can improve efficiencies compared to single cycle steam turbines (Electric Power Research Institute, 1995). Gas conditioning, including the removal of byproduct tar, alkali, and other contaminants thatcan be harmful to engines,is a significant issue for gasification systems (Maniatis, 2002).
2.3.2.1 BIGCC History Though several coal fired IGCC systems exist such as Buggenum IGCC in the Netherlands producing 250 MWe (Negro, 2008), BIGCC systems are still develomental. The US DOE biomass power program supported development work on biomass integrated combined cycle systems in the 1990s. There were at least three projects undertaken in the US which had various degrees of success, though none operated in full IGCC mode (Paia, HI; Burlington, VT; Granite Falls, MN). The European Union, through the THERMIE energy program, supported 7http://www.ge‐energy.com/products_and_services/products/gasification/syngas_turbine.jsp
25

commercial scale BIGCC demonstration systems. At this time, the only large scale demonstration that ran for any significant length of time was at Värnamo, Sweden between 1996 and 1999 (Williams, 2005).
2.3.2.2 Värnamo, Sweden The BIGCC pilot system demonstratedat Värnamo, Sweden (Stahl et al., 2004)) was the world’s first biomass‐fueled IGCC plant that operated successfully for extended periods of time. This demonstration facility produced power and heat (6 MWe, 9MWth) and was developed by Sydkraft AB and Foster Wheeler International. The gasifier was a pressurized air‐blown circulating fluid bed reactor that operated at pressures of 18‐22 atmospheres. The facility used finely ground, dried wood and bark feedstock (10 to 20 percent moisture content) delivered to the power generation site from an adjacent preparation facility. Limited tests with pelletized straw and refuse‐derived fuel (RDF) were also performed with some success (Stevens, 2001).
The gas cleaning system consisted of a cyclone separator followed by heat exchange to cool the gas to about 350ºC from ~ 900°C) thereby condensing alkali vapors on particulate matter (Stevens, 2001). The partially cooled gas was passed through a barrier filter (ceramic and/or sintered metal ‘candle’ filters). Tar and alkali content in the filtered gas were less than 5 g/m3and 0.1 ppm (by weight) respectively (Stahl & Neergaard, 1998). The filtered gas was then fired in a gas turbine (European Gas Turbines, Ltd). The gas turbine generated about 4 MWeand the steam bottoming cycle produced 2 MWe additional (Engstrom, 1998).
The Värnamo gasification system has more operational experience than any other biomass fired gas turbine system. The gasifier was completed in 1993. In total, the gasifier operated for more than 7000 hours. The gas turbine was modified for use with low‐energy gas in 1995, and test operations of the integrated biomass fueled power generation system began that year. By the end of 1999, the integrated facility had operated for a total of about 3500 hours, with most of those during 1998 and 1999. The facility was built as a near‐commercial demonstration and was not intended to provide long‐term power generation on a commercial basis. The demonstration of the technology was completed in 1999, and no further testing of the power generation system was planned (Stevens, 2001).
From costs reported in the literature, operations and maintenance costs (O&M) are a significant portion of the full system levelized cost of energy (COE) [Figures 8] The gasifier reactor constitutes a large share of the overall system cost [Figure 9].
26

Figure 8: O&M Cost Components for Gasifier Based Biomass Power Generation Facilities from Literature8
8 Each symbol indicates a data point from literature. The box indicates the average values with high or low lines outside depicting outliers. Literature sources: Electric Power Research Institute, 1995; Weyerhaeuser Co, 2000; Wiltsee, 2000; Craig & Mann, 1996.
27
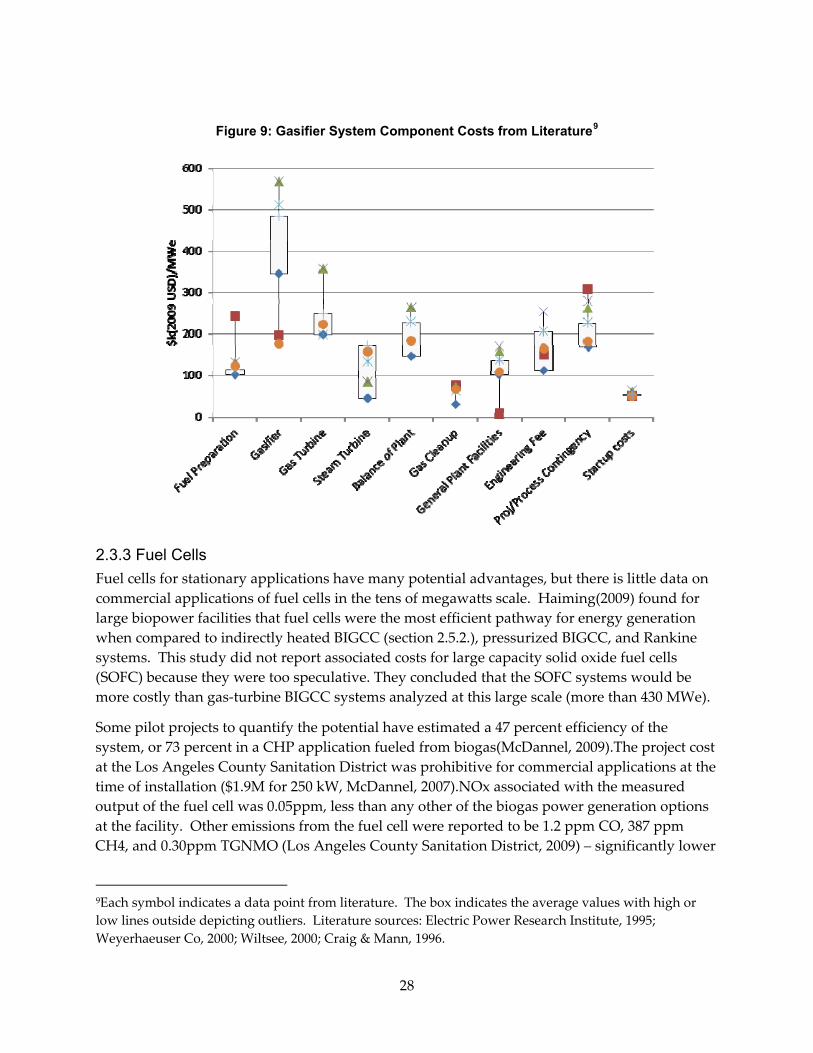
Figure 9: Gasifier System Component Costs from Literature9
2.3.3 Fuel Cells Fuel cells for stationary applications have many potential advantages, but there is little data on commercial applications of fuel cells in the tens of megawatts scale. Haiming(2009) found for large biopower facilities that fuel cells were the most efficient pathway for energy generation when compared to indirectly heated BIGCC (section 2.5.2.), pressurized BIGCC, and Rankine systems. This study did not report associated costs for large capacity solid oxide fuel cells (SOFC) because they were too speculative. They concluded that the SOFC systems would be more costly than gas‐turbine BIGCC systems analyzed at this large scale (more than 430 MWe).
Some pilot projects to quantify the potential have estimated a 47 percent efficiency of the system, or 73 percent in a CHP application fueled from biogas(McDannel, 2009).The project cost at the Los Angeles County Sanitation District was prohibitive for commercial applications at the time of installation ($1.9M for 250 kW, McDannel, 2007).NOx associated with the measured output of the fuel cell was 0.05ppm, less than any other of the biogas power generation options at the facility. Other emissions from the fuel cell were reported to be 1.2 ppm CO, 387 ppm CH4, and 0.30ppm TGNMO (Los Angeles County Sanitation District, 2009) – significantly lower
9Each symbol indicates a data point from literature. The box indicates the average values with high or low lines outside depicting outliers. Literature sources: Electric Power Research Institute, 1995; Weyerhaeuser Co, 2000; Wiltsee, 2000; Craig & Mann, 1996.
28

than their combustion based facilities. However, without a comparable set of data at 10‐50 MWe there is not sufficient information to compare larger capacity fuel cells to more commercially available technology. (Cigolotti, 2009).
2.3.4 Pyrolysis Pyrolysis systems are usually optimized for producing char, torrefied biomass or a liquid intermediate (bio‐oil). They may be utilized in combination with combustion or gasification based systems for power generation but not likely by themselves except for the production of liquid fuels sold through commercial markets. Therefore, pyrolysis as a stand‐alone option is not evaluated in this report.
2.4 Permitting The permitting process for energy generation in California is complex and has been identified as one hurdle in establishing biomass and other energy and industrial facilities ( Jenkins et al., 2006). Much of the complexity comes from air quality constraints that can be different across thirty‐five separate air quality management districts, some of which are non‐attainment for the National Ambient Air Quality Standards under the Federal Clean Air Act, and may require different emission controls and emission offsets. In addition to an air permit, there are also permits associated with water and solid waste discharge or disposal, land use, and building and fire safety.
The first step in the permitting process is to determine whether the facility will be a major or minor air pollution source and whether it will be built at site of an existing facility already having permits or a new unpermitted site. The permitting process for repowering in this discussion focuses on existing sites. Facilities are permitted based on local district rules and require an authority to construct, a permit to operate, and a Federal Title V air permit if a major source of air pollutants. A permit to operate must be renewed annually and typically can cost between $16,000 and $45,000 to procure. 10
Most air permits regulate emissions of nitrogen oxides (NOx), particulate matter (PM), volatile organic compounds (VOC, or sometimes reactive organic gases, ROG or non‐methane hydrocarbons, NMHC), carbon monoxide (CO), and hazardous air pollutants (HAPs) such as hydrogen chloride(HCl). Permit limits for 33 of the solid fuel biomass energy facilities in California shown as pounds of pollutant per megawatt‐hour (lb/MWh) of net electricity vary widely depending on year of permitting and location (Figure 10). In many cases the operating emissions may be substantially below the permit limits, and variances are required for short term operation above the limits such as during maintenance.
10From Northern Sierra Air Quality Management District permits.
29

Figure 10: Permitted Emissions at California Solid Fuel Bioenergy Facilities11
Land use permitting includes siting, zoning conformance, conditional use permits, community acceptance, and the California Environmental Quality Act (CEQA). Siting, zoning, and community acceptance may be less of a concern for existing sites where a facility is already operating or has previously operated and continues to maintain permits. CEQA requires state and local agencies within California to follow a protocol of analysis and public disclosure of environmental impacts of proposed projects and adopt all feasible measures to mitigate those impacts (State of California, 2012).
11 Each marker denotes one facility data point. Permits obtained through requests for public information from: Shasta, Tuolumne, Northern Sierra, South Coast, San Joaquin, North Coast Unified, Placer, Monterey Bay, and Yolo‐Solano Air Quality Management Districts.
30

CHAPTER 3: Methods of Analysis Repowering existing biopower facilities leverages investments already made including permitting, feedstock sources, land acquisition, and equipment based on the extent to which the plant will undergo redesign.
Utilizing the same feedstock, emission levels, conversion efficiencies, and levelized cost of energy based on different technologies were evaluated. Principal revenue sources within the evaluation include:
1. Electrical energy 2. Co‐products including heat, ash, char
a. ash can be utilized for road construction or landscaping materials, as components of cement or for lightweight aggregates
3. Carbon credits or REC’s 4. Tipping fees where applicable 5. Dispatchable capacity 6. Subsidies
In addition the following costs have been incorporated into the economic model:
1. Feedstock 2. Capital 3. Operation and Maintenance 4. Penalties associated with excess emissions
Constraints limiting available technology include:
1. Feedstock availability and facility scale 2. Emissions 3. Feedstock quality
The outcome of the method to evaluate the repowering potential focuses on profit as influenced by sensitivities to feedstock costs, carbon credits, electricity generation capacity, and emissions, where the profit is defined by the difference between levelized revenues and costs determined for the generation facility.
31
3.1 Economic Analysis An economic model was developed to evaluate the levelized cost of energy required for repowering biopower facilities using several technology types (i.e., gasification and combustion with different prime movers and/or heat recovery). 12
The economic model was specifically developed to evaluate the differences in the levelized cost of electricity based on differences in equipment cost, efficiencies, CHP (cogeneration) capabilities and carbon credit accounting. Additionally, it allows for different depreciation schedules including MACRS 5 year, 10 year, and 20 year, 20 year straight line depreciation. Details and description of the economic model are in the appendix.
3.2 Additional cost factors associated with bioenergy 3.2.1 Feedstock Costs Solid fuel biomass currently used in California includes various agricultural residues (mainly orchard and vineyard prunings or whole tree removals), food processing residues (fruit and olive pits, some nut shells, rice hulls), clean urban wood and forest product residues and forest thinnings. At this time, no purpose‐grown energy crops are used in California for electricity generation, although corn is used in ethanol production. This report considers only the utilization of biomass residues and omits dedicated biomass crops from analysis.
3.2.2 Capacity Factor Capacity factors (otherwise known as utilization rates) have a strong influence on overall cost and instant costs. The capacity factor defines the average power generated by the facility relative to its rated design power capacity, generally measured on an annual basis as the ratio of actual energy generation to the design energy generation. Capacity factors for biomass power facilities are reported to range from 19 to 106 percent, the former value quite low from a design perspective and the latter indicating an actual performance superior to the design basis. The range in capacity factor is based mainly on fuel availability and maintenance requirements, and allows for a large fluctuation in reported costs(Wiltsee, 2000).
3.2.3 Tax Credits Certain technologies are eligible for renewable energy production tax credits and renewable energy production incentives through the Federal Energy Policy Act (EPAct) until 2013. These include a tax credit of $10.20 (2011 USD)/MWh and $21.50 (2011 USD)/MWh for open and closed loop biomass respectively. This is available to merchant vendors for a period of 10 years(Klein J. , 2009).
Conceivable economic incentives and subsidies include feed‐in‐tariffs, more favorable pricing under power purchase agreements (PPA), and research and development grants among other 12 Here, repowering costs are assumed to be lower than complete new‐build due to ability to continue to use some existing plant, permits, etc. The LCOE calculations are therefore incremental compared to complete LCOE for new facilities.
32

strategies to assist the development of the biomass industry(California Energy Commission, 2011). Feed in tariffs were recently expanded up to 20MW for individual facilities through a Renewable Auction Mechanism, beyond the 1.5MW previously allowed. The policy is an avenue for investor owned utilities (IOUs) to purchase Renewable Energy Credits from biopower producers under auction reflecting fair prices to the consumer and identifies the additional value provided by biomass facilities to provide baseload power.
3.2.4 Carbon Accounting The concept of biomass as a carbon neutral (or even carbon net negative) feedstock has recently been debated. The carbon footprint (or degree of carbon neutrality) of biomass feedstock depends on the source of the biomass and how it was otherwise managed or used (e.g. burned or left to decompose above ground or in a landfill, or from old‐growth trees or cultivated for energy purposes).Depending on assessed carbon footprint and future development of markets for carbon emissions reductions, some economic benefit could accrue to a bionenergy project.
33

CHAPTER 4: Conversion Pathways Electrical generation from solid fuel biomass feedstock at a power plant of greater than 10MWe predominantly comes from two conversion technologies: direct combustion or gasification(Koppejan, 2008). In the following sections, pathways for both conversion technologies are broken into six scenarios (base case (boiler replaced with new boiler, base case + heat recovery, gasifier with single‐cycle gas turbine, IGCC, integrated gasifier and fuel cell (IGFC), integrated gasifier and fuel cell combined with steam bottoming cycle (IGFCCC). The environmental and economic methods outlined in the previous sections are used to evaluate the performance of each scenario. Scenarios are compared against a reference case consisting of a conventional direct combustion‐steam Rankine cycle power plant.
The main components of a biomass combustion plant are (Koppejan, 2008):
• Feedstock (fuel) storage • Fuel feeding and handling • Furnace • Boiler or HRSG (combined cycle) • Ash handling and pre treatment • Flue gas cleaning system • Stack • Monitoring, control and visualization equipment • Electric and hydraulic utilities • Prime mover (e.g. steam turbine)
Similarly, gasification plants include:
• Feedstock (fuel) storage • Fuel feeding and handling • Gasifier • HRSG (combined cycle) • Ash handling and pre treatment • Flue gas cleaning system • Stack • Control and visualization equipment • Electric and hydraulic utilities • Prime mover(s) (e.g. gas turbine, reciprocating engine, steam turbine)
For simplification, the following systems will be assumed to have the same feedstock, fuel storage, feeding and handling, stack, control and visualization equipment, and electric and hydraulic installations. Therefore, the evaluation of each system will be based on varying the
34
furnace, boiler, HRSG, ash handling and pretreatment, flue gas cleaning system (as the ash content and flue gas varies with combustion or gasification technologies), gasifier, and prime movers.
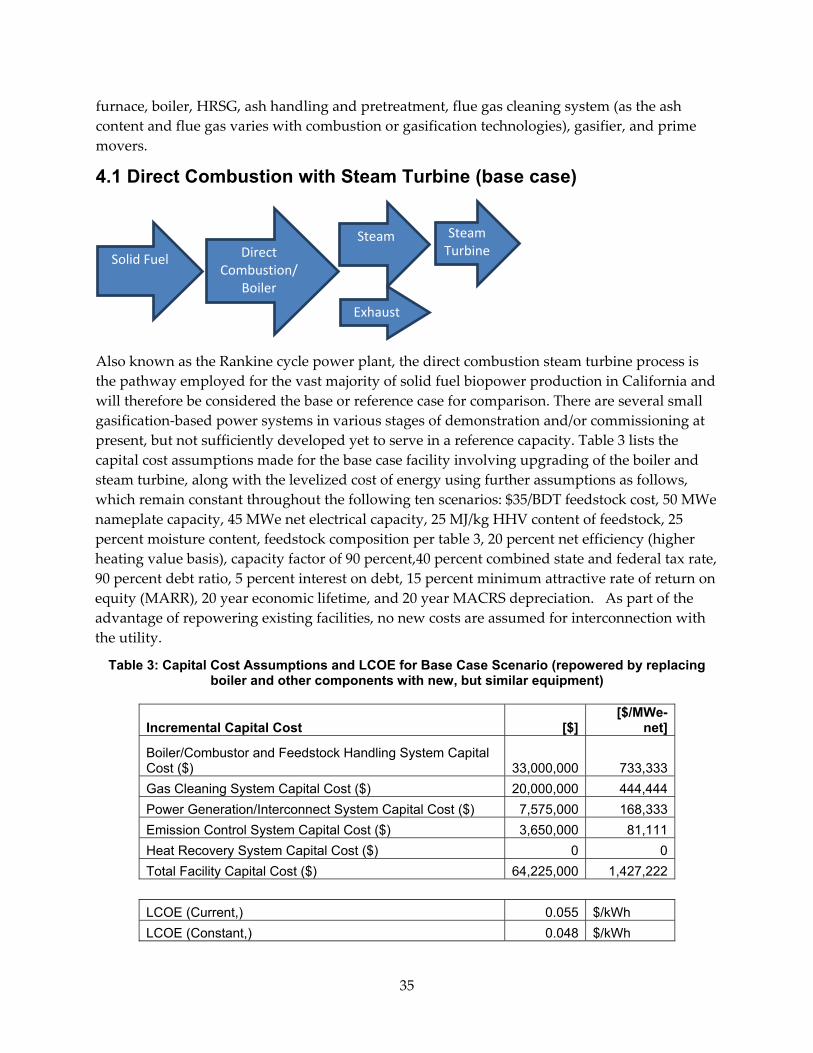
4.1 Direct Combustion with Steam Turbine (base case)
Also known as the Rankine cycle power plant, the direct combustion steam turbine process is the pathway employed for the vast majority of solid fuel biopower production in California and will therefore be considered the base or reference case for comparison. There are several small gasification‐based power systems in various stages of demonstration and/or commissioning at present, but not sufficiently developed yet to serve in a reference capacity. Table 3 lists the capital cost assumptions made for the base case facility involving upgrading of the boiler and steam turbine, along with the levelized cost of energy using further assumptions as follows, which remain constant throughout the following ten scenarios: $35/BDT feedstock cost, 50 MWe nameplate capacity, 45 MWe net electrical capacity, 25 MJ/kg HHV content of feedstock, 25 percent moisture content, feedstock composition per table 3, 20 percent net efficiency (higher heating value basis), capacity factor of 90 percent,40 percent combined state and federal tax rate, 90 percent debt ratio, 5 percent interest on debt, 15 percent minimum attractive rate of return on equity (MARR), 20 year economic lifetime, and 20 year MACRS depreciation. As part of the advantage of repowering existing facilities, no new costs are assumed for interconnection with the utility.
Table 3: Capital Cost Assumptions and LCOE for Base Case Scenario (repowered by replacing boiler and other components with new, but similar equipment)
Incremental Capital Cost [$] [$/MWe-
net]
Boiler/Combustor and Feedstock Handling System Capital Cost ($) 33,000,000 733,333Gas Cleaning System Capital Cost ($) 20,000,000 444,444Power Generation/Interconnect System Capital Cost ($) 7,575,000 168,333Emission Control System Capital Cost ($) 3,650,000 81,111Heat Recovery System Capital Cost ($) 0 0Total Facility Capital Cost ($) 64,225,000 1,427,222 LCOE (Current,) 0.055 $/kWh LCOE (Constant,) 0.048 $/kWh
Steam
Exhaust
Steam Turbine Direct
Combustion/Boiler
Solid Fuel
35
Effects of varying parameters including tax credits and depreciation schedules in constant $/kWh are shown in table 4.
Table 4: Sensitivity of Incremental LCOE for Base Case Repowering
$/kWhWith carbon credit of $50/tC 0.049With carbon credit of $10/tC 0.059With REC of $21.5 per MWh 0.049Using MACRS 5 year 0.055Using MACRS 10 year 0.058Using 20 year straight line 0.062Using no depreciation 0.067
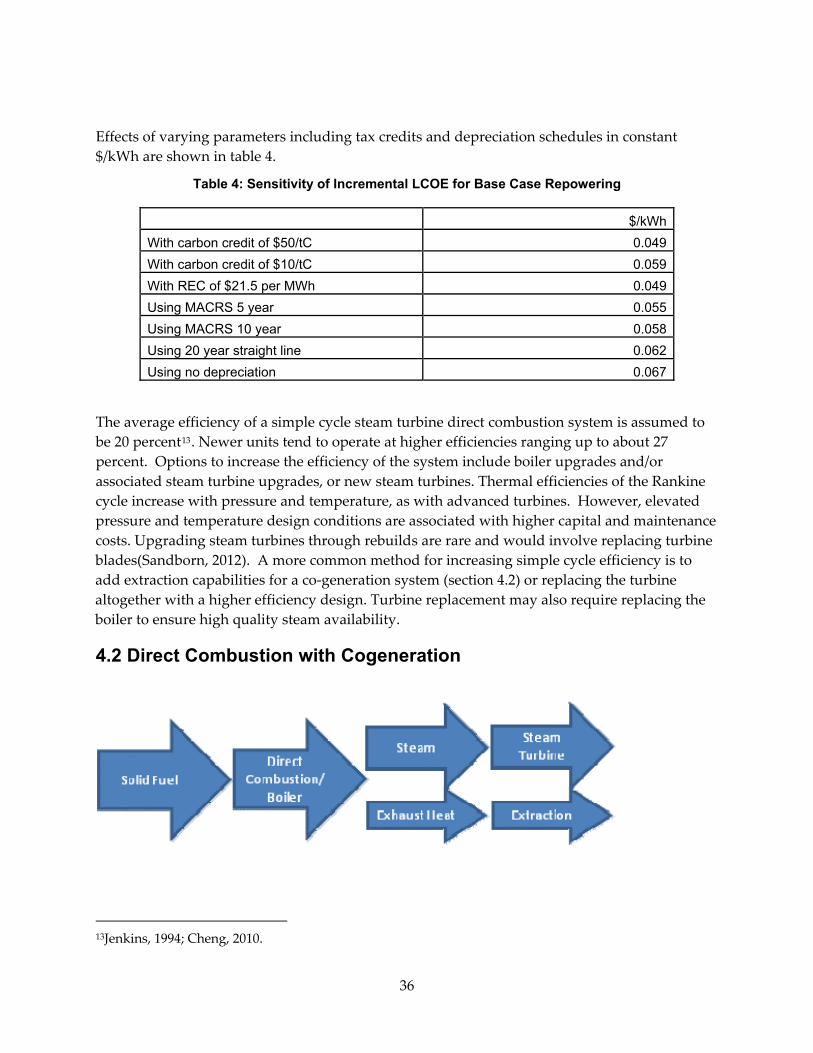
The average efficiency of a simple cycle steam turbine direct combustion system is assumed to be 20 percent13. Newer units tend to operate at higher efficiencies ranging up to about 27 percent. Options to increase the efficiency of the system include boiler upgrades and/or associated steam turbine upgrades, or new steam turbines. Thermal efficiencies of the Rankine cycle increase with pressure and temperature, as with advanced turbines. However, elevated pressure and temperature design conditions are associated with higher capital and maintenance costs. Upgrading steam turbines through rebuilds are rare and would involve replacing turbine blades(Sandborn, 2012). A more common method for increasing simple cycle efficiency is to add extraction capabilities for a co‐generation system (section 4.2) or replacing the turbine altogether with a higher efficiency design. Turbine replacement may also require replacing the boiler to ensure high quality steam availability.
4.2 Direct Combustion with Cogeneration
13Jenkins, 1994; Cheng, 2010.
36
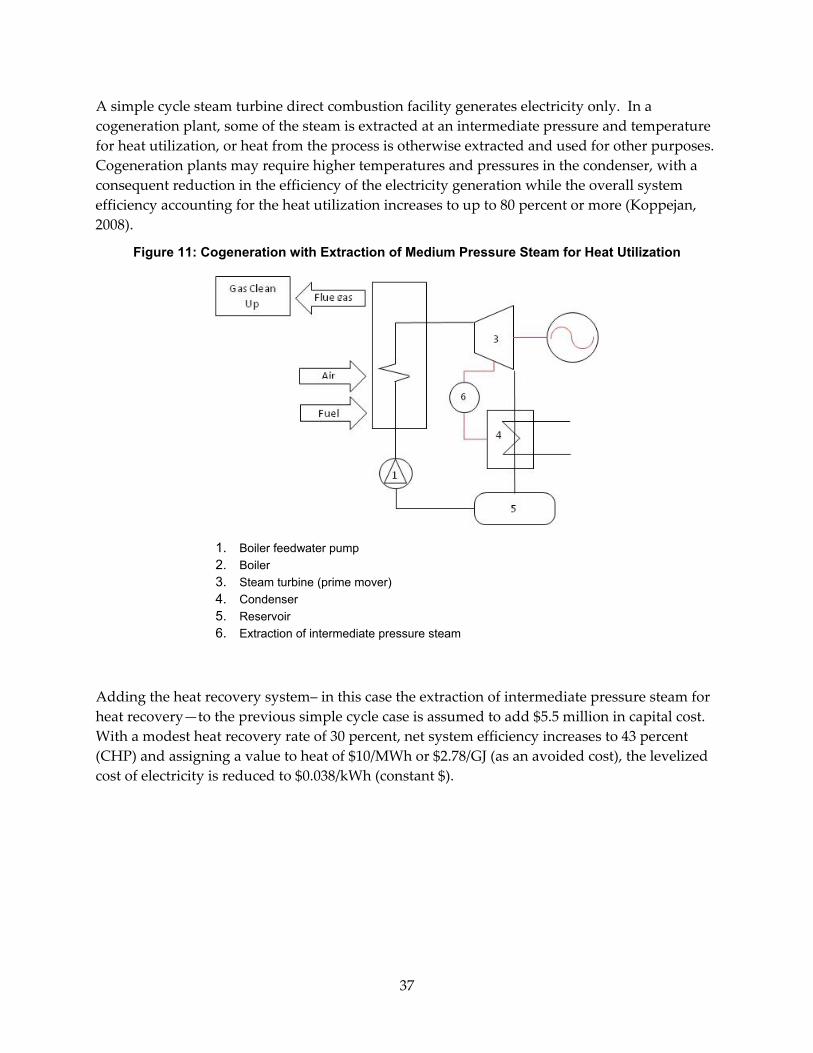
A simple cycle steam turbine direct combustion facility generates electricity only. In a cogeneration plant, some of the steam is extracted at an intermediate pressure and temperature for heat utilization, or heat from the process is otherwise extracted and used for other purposes. Cogeneration plants may require higher temperatures and pressures in the condenser, with a consequent reduction in the efficiency of the electricity generation while the overall system efficiency accounting for the heat utilization increases to up to 80 percent or more (Koppejan, 2008).
Figure 11: Cogeneration with Extraction of Medium Pressure Steam for Heat Utilization
1. Boiler feedwater pump 2. Boiler 3. Steam turbine (prime mover) 4. Condenser 5. Reservoir 6. Extraction of intermediate pressure steam
Adding the heat recovery system– in this case the extraction of intermediate pressure steam for heat recovery—to the previous simple cycle case is assumed to add $5.5 million in capital cost. With a modest heat recovery rate of 30 percent, net system efficiency increases to 43 percent (CHP) and assigning a value to heat of $10/MWh or $2.78/GJ (as an avoided cost), the levelized cost of electricity is reduced to $0.038/kWh (constant $).
37

Table 5: Capital Cost Assumptions and LCOE for Repowering with CHP System
Incremental Capital Cost ($) ($/MWe-
net)
Boiler/Combustor and Feedstock Handling System Capital Cost ($) 33,000,000 733,333Gas Cleaning System Capital Cost ($) 20,000,000 444,444Power Generation ($) 7,575,000 168,333Emission Control System Capital Cost ($) 3,650,000 81,111Heat Recovery System Capital Cost ($) 5,500,000 122,222Total Facility Capital Cost ($) 69,725,000 1,549,444 LCOE (Current) 0.044 $/kWh LCOE (Constant) 0.038 $/kWh
4.3 Gasifier/Gas Turbine
Gas Turbine Syngas/ Producer Gas
Gasifier Solid Fuel
Another option, though more capital intensive, is to replace the entire boiler system and steam turbine with a gasifier and gas turbine. The gasifier converts the feedstock to producer‐ or syngas, which is then fed to a gas turbine14 as the prime mover. Particulate matter removal and syngas cleanup are extensive in gasifier/gas turbine systems. Using an average of capital costs from literature, the assumptions above, and the same feedstock composition, the LCOE for a gasification with simple‐cycle gas turbine unit with the same nameplate capacity is $0.051/kWh. Assuming a net thermal efficiency of 21 percent (65 percent cold gas efficiency for the gasifier and 32 percent gas turbine efficiency)there is a slight feedstock reduction of 1200 kg/hr, compared to the reference case.
14http://www.ge‐energy.com/products_and_services/products/gasification/syngas_turbine.jsp
38

Table 6: Capital Cost Assumptions and LCOE for REPOWering with Gasifier/GT System
Incremental Capital Cost ($) ($/MWe-
net)Gasifier and Feedstock Handling System Capital Cost ($) 37,525,000 833,889Gas Cleaning System Capital Cost ($) 4,145,000 92,111Power Generation/Interconnect System Capital Cost ($) 19,920,000 442,667Emission Control System Capital Cost ($) 14,800,000 328,889Heat Recovery System Capital Cost ($) 0 0Total Facility Capital Cost ($) 76,390,000 1,697,556
LCOE (Current) 0.059 $/kWh LCOE (Constant) 0.051 $/kWh
4.4 Integrated Gasifier Combined Cycle (IGCC with Gas Turbine)
Steam Turbine
HRSG
Heat
Gas Conditioning
Gas Turbine
Gasifier Solid Fuel
To increase the efficiency of the gasification facility (and with further capital expense) the simple cycle gasification/gas turbine facility could have a bottoming cycle added to it – creating what is known as a combined cycle. The bottoming cycle utilizes the exhaust gas from the turbine in a heat recovery steam generator (HRSG) which can then be paired with another prime mover, typically a steam turbine. In this pathway, the superheated steam from the HRSG is fed to a steam turbine which generates additional electricity. Also known as biomass integrated gasification combined cycle or BIGCC, this advanced power generation option has only been demonstrated in Värnamo (section 2.3.2) and cost assumptions are averages from the literature. Adding the bottoming cycle decreases the LCOE to $0.041/kWh because of increased overall efficiency. Feedstock requirement is 12,400 kg/h less than the base case.
39

Figure 12: Schematic of Generic High Pressure Air Blown BIGCC System (USDOE 1997)
Table 7: Capital Cost Assumptions and LCOE for Repowering with IGCC System
Incremental Capital Cost ($) ($/MWe-
net)Gasifier and Feedstock Handling System Capital Cost ($) 37,525,000 833,889Gas Cleaning System Capital Cost ($) 4,145,000 92,111Power Generation/Interconnect System Capital Cost ($) 19,920,000 442,667Emission Control System Capital Cost ($) 14,800,000 328,889Heat Recovery System Capital Cost ($) 4,674,000 103,867Total Facility Capital Cost ($) 81,064,000 1,801,422
LCOE (Current) 0.047 $/kWh LCOE (Constant) 0.041 $/kWh
40

4.5 Integrated Gasifier Fuel Cell (IGFC)
Fuel Cell Syngas/ Producer Gas
Gasifier Solid Fuel
One potential high efficiency pathway for solid fuel biomass is for the hydrogen rich syngas to be fed to a high temperature fuel cell (section 2.3.3). To increase the hydrogen content the amount of steam fed to the gasifier would have to be increased or further reforming of the gas would be needed.
Recently, the largest fuel cell installation was announced in South Korea and comprises four 2.8 MW DFC3000 Direct FuelCell® (DFC®) power plants for an overall capacity of 11.2 MW with a feedstock of imported natural gas. Although costs were not identified with this announcement, the system is stated to be 90 percent efficient in CHP mode and 47 percent efficient in electricity generation alone15. Although fed from natural gas, utility scale fuel cell systems will increase the understanding of fuel cell capabilities and associated economics for grid power as they are demonstrated. Doherty et al. (2010) modeled a solid oxide fuel cell fed by biomass syngas and found net electrical efficiency (biomass‐to‐electricity) of 33 percent and 74 percent for CHP. These efficiencies are lower because of energy used to produce the syngas and a lower conversion efficiency of the syngas compared to natural gas.
Costs for fuel cells from section 2.3.3 were used to estimate the cost of the fuel cell as the prime mover. Assuming emission controls and no HRSG the LCOE becomes $0.064/kWh.
15http://fcel.client.shareholder.com/releasedetail.cfm?ReleaseID=623842
41

Table 8: Capital Cost Assumptions and LCOE for Repowering with IGFC system
Incremental Capital Cost ($) ($/MWe-
net)Gasifier and Feedstock Handling System Capital Cost ($) 37,525,000 833,889Gas Cleaning System Capital Cost ($) 18,945,000 421,000Power Generation/Interconnect System Capital Cost ($) 80,000,000 1,777,778Emission Control System Capital Cost ($) 0 0Heat Recovery System Capital Cost ($) 0 0Total Facility Capital Cost ($) 136,470,000 3,032,667
LCOE (Current) 0.074 $/kWh LCOE (Constant) 0.064 $/kWh
4.6 Gasifier/fuel cell/CC
Heat
Steam Turbine
HRSG
Fuel Cell
Syngas/ Producer
Gas
Gasifier Solid Fuel
Adding a bottoming cycle to the gasifier/fuel cell pathway has never been demonstrated; however, besides electricity and excess hydrogen, a product of the electrochemical process within the fuel cell is heat, especially if using a solid oxide fuel cell. The heat could be used to generate steam to turn a steam turbine or with an ORC at lower exhaust temperatures.
Although CHP efficiencies of fuel cell systems approach 90 percent (section 4.5), the CHP efficiency of the biomass gasifier to fuel cell/combined cycle system is assumed to be 52 percent (33 percent electricity with 19 percent additional from heat) resulting in a LCOE decreased slightly from $0.064/kWh to $0.060/kWh from the previous case. This can be attributed to the high capital cost of the fuel cell serving as the primary factor in the economics of the system with the addition of a heat recovery system contributing a relatively small amount of the overall capital cost.
42
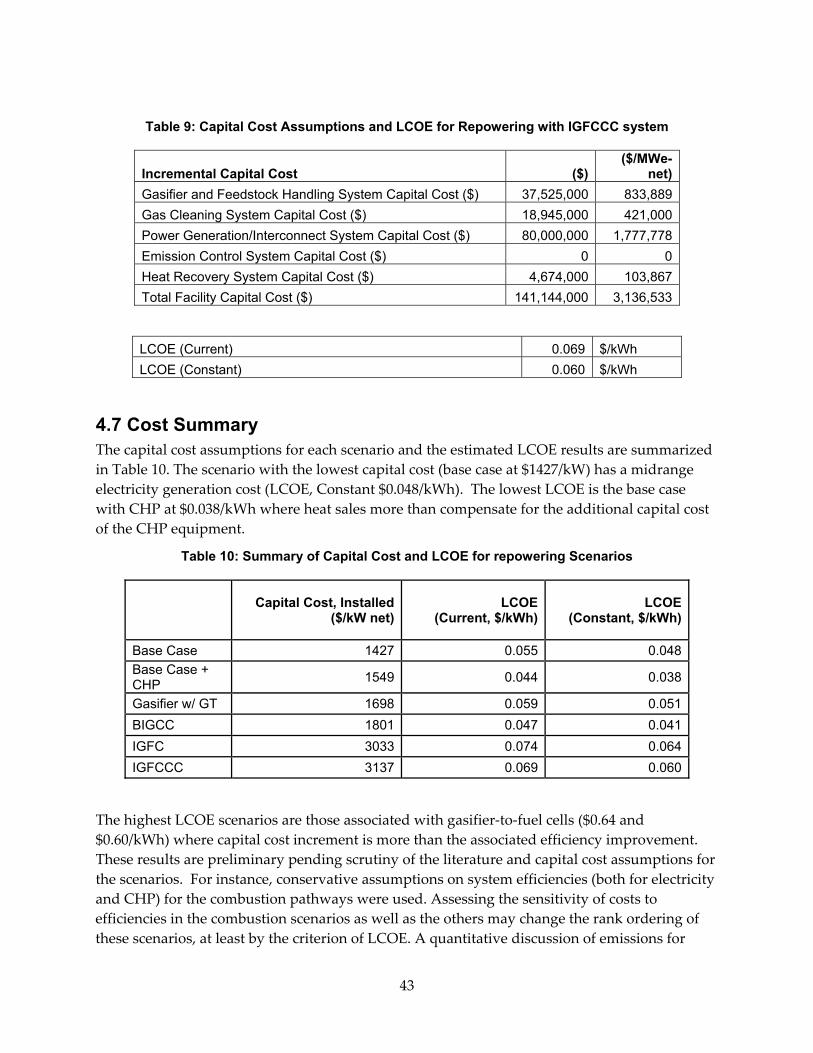
Table 9: Capital Cost Assumptions and LCOE for Repowering with IGFCCC system
Incremental Capital Cost ($) ($/MWe-
net)Gasifier and Feedstock Handling System Capital Cost ($) 37,525,000 833,889Gas Cleaning System Capital Cost ($) 18,945,000 421,000Power Generation/Interconnect System Capital Cost ($) 80,000,000 1,777,778Emission Control System Capital Cost ($) 0 0Heat Recovery System Capital Cost ($) 4,674,000 103,867Total Facility Capital Cost ($) 141,144,000 3,136,533
LCOE (Current) 0.069 $/kWh LCOE (Constant) 0.060 $/kWh
4.7 Cost Summary The capital cost assumptions for each scenario and the estimated LCOE results are summarized in Table 10. The scenario with the lowest capital cost (base case at $1427/kW) has a midrange electricity generation cost (LCOE, Constant $0.048/kWh). The lowest LCOE is the base case with CHP at $0.038/kWh where heat sales more than compensate for the additional capital cost of the CHP equipment.
Table 10: Summary of Capital Cost and LCOE for repowering Scenarios
Capital Cost, Installed ($/kW net)
LCOE (Current, $/kWh)
LCOE (Constant, $/kWh)
Base Case 1427 0.055 0.048Base Case + CHP 1549 0.044 0.038
Gasifier w/ GT 1698 0.059 0.051BIGCC 1801 0.047 0.041IGFC 3033 0.074 0.064IGFCCC 3137 0.069 0.060
The highest LCOE scenarios are those associated with gasifier‐to‐fuel cells ($0.64 and $0.60/kWh) where capital cost increment is more than the associated efficiency improvement. These results are preliminary pending scrutiny of the literature and capital cost assumptions for the scenarios. For instance, conservative assumptions on system efficiencies (both for electricity and CHP) for the combustion pathways were used. Assessing the sensitivity of costs to efficiencies in the combustion scenarios as well as the others may change the rank ordering of these scenarios, at least by the criterion of LCOE. A quantitative discussion of emissions for
43

each scenario (and comparisons to business as usual – not repowering) would help inform scenario outcomes and offer insight for potential health and air‐shed improvements. For scenarios with emissions reductions, the economic potential from selling emissions reductions on offset markets needs analyzing for impacts on LCOE.
44

CHAPTER 5: Conclusions The analysis of repowering scenarios outlined here suggests economic opportunities exist for the biomass power industry in addressing refurbishment or replacement needs for generating equipment or for installing new systems. However, a number of uncertainties surround this issue, especially as large scale demonstrations are mostly lacking of alternative and potentially higher efficiency power systems and specific performance and cost information are still to be developed. Implementing CHP where possible in facilities currently generating electricity only has some clear advantages in levelized cost of electricity (LCOE) if heat is consistently valued with that from purchased natural gas. Integrated gasification combined cycles (IGCC) may also realize cost advantages in comparison with Rankine cycle combustion power plants, but the difference in estimated LCOE ($0.041 vs. 0.048/kWh) is in a range where substantial new information on commercial scale cost and performance is required to gain substantial confidence in the potential benefits associated with this type of repowering. Integrated fuel cell systems may also offer substantial efficiency advantages, but estimated capital costs result in LCOE above both the reference Rankine cycle and IGCC systems. Reductions in emissions would also allow for capacity expansions at existing sites, and related investigation constitutes a further element of continued research needed to more fully assess individual site as well as industry‐wide potentials for economic and other performance benefits that might accrue through repowering.
45

REFERENCES
ANTARES Group, Inc., Parsons Power. (1996). Utility Coal‐Biomass Co‐firing Plant Opportunities and Conceptual Assessments. Washington, D.C.: Northeast Regional Biomass Program.
Becker, D., Larson, D., & Lowell, E. (2009). Financial Considerations of Policy Options to Enhance Biomass Utilization for Reducing Wildfire Hazards. Journal of Forest Policy and Economics 11 (2009) 628‐635.
Black & Veatch. (2010). Biomass Co‐firing and Repowering. EUCI Webinar.
Bolhar‐Nordenkampf. (2002). Biomass CHP Plant Gussing ‐ Using Gasification for Power Generation. Vienna, Austia: Institute of Chemical Engineering, Getreidemarkt.
California Biomass Collaborative. (2011, December). California Biomass Collaborative Tools. (Retrieved from Biomass Facilities Website: http://biomass.ucdavis.edu/tools/
California Energy Commission. (2009). 2009 Integrated Energy Policy Report, Final Commission Report. CEC ‐100‐2009‐003‐CMF.
California Energy Commission, 2010, California Energy Commission, Total System Power: http://www.energyalmanac.ca.gov/electricity/total_system_power.htmlTotal
California Energy Commission. (2011). 2011 Integrated Energy Policy Report: Lead Commissioner Draft Report. Sacramento: CEC‐100‐2011‐001.
Caputo, A.C. (2005). Economic of biomass energy utilization in combustion and gasification plants: effects of logistic variables. Biomass and Bioenergy, 28: 35‐51.
Carbon Finance at the World Bank. (2011). State and Trends of the Carbon Market 2010. Washington, DC: World Bank.Cheng, J. (2010). Biomass to Renewable Energy Processes. Boca Raton: CRC Press.
Christiaan M. van der Meijden, H. J. (2009). Bioenergy II: Scale‐up of the Milena Biomass Gasification Process. Chemical Reactor Engineering, Vol 7, Article 35.
Christiaan van der Meijden, e. a. (2009). Bioenergy II: Scale‐Up of the Milena Biomass GasificatioN Process. Chemical Reactor Engineering, Article A53.
Cigoletti . V. (2009). Nonconventional Fuels for High Temperature Fuel Cells: Status and Issues. Fuel Cell Science and Technology, Vol 6. 021311‐1.
Community Power Corporation. (2009). 2009 Source Test Report. Dixon: Dixon Ridge Farms.
Craig, K. R., & Mann, M. K. (1996). Cost and Performance Analysis of Biomass‐Based Integrated Gasification Combined‐Cycle (BIGCC) Power Systems. Golden, CO: National Renewable Energy Laboratory.
Doherty, W., A. Reynolds and D. Kennedy (2010). "Computer simulation of a biomass gasification‐solid oxide fuel cell power system using Aspen Plus." Energy35(12): 4545‐4555.
46
DTE Energy News Room. (2011, June 14). DTE Energy Receives Approval to COnvert Northern California Coal‐Fired Plant to Biomass. Ann Arbor, MI.
Electric Power Research Institute. (1995). Making Biopower Work for Utilities: A Rationale for Near‐Term Investment in Integrated Biomass Power Systems. Palo Alto: EPRI.
Engstrom, F. (1998). ʺHot gas clean‐up bioflow ceramic filter experience.ʺ Biomass and Bioenergy15(3): 259‐262.
Foster Wheeler. (2011, August 1). Pioneering CFB Technology. Retrieved from http://www.fwc.com/publications/pdf/CFBBrochure.pdf
Germain (2006)
Haiming Jin, E. D. (2009). Performance and cost analysis of future, commercially mature gasification‐based electric power generation from switchgrass. Society of Chemical Industry and John Wiley & Sons, Ltd. Biofuels, Bioprod. Bioref., 3:142–173 (2009).
IEA Bioenergy. (2009). Bioenergy – a Sustainable and Reliable Energy Source. Utrecht: Energy Research Centre of the Netherlands.
Jenkins, B. M., R. B. Williams, M. C. Gildart and R. E. Aldas. (2006). "A roadmap for the development of biomass in California." California Biomass Collaborative. CEC‐500‐2006‐095‐D
Jenkins, S. W. (1994). Biomass Fueled Fluidized Bed Combustion: Atmospheric Emissions, Emission Control Devices and Environmental Regulations. Biomass and Bioenergy, Vol. 6 No. 4 pp. 243‐260.
Klein, J. (2009). Comparitive Costs of California Central Station Electricity Generation. Sacramento, Ca: California Energy Commission, CEC 200‐2009‐017‐SD.
Koppejan, S. v. (2008). The Handbook of Biomass Combustion and Co‐firing. London: Earthscan.
Los Angeles County Sanitation District. (2009). Palmdale Fuel Cell Project Review. Energy Recovery Engineering Section.
Lucier, A. &. (2010). Biomass Carbon Neutrality in the Context of Forest‐based Fuels and Products. National Council for Air and Stream Improvement, Inc.
Maniatis, K. (2002). Progress in Biomass Gasification: an Overview. Brussels, Belgium: European Commission, Directorate General for Energy & Transport.
Mason, C., Lippke, D., Zobrist, K., & Bloxton, T. e. (2006). Investments in Fuel Removals to Avoid Forest Fires Result in Substanitial Benefits. Journal of Forestry 104 (1) 37‐31.
Mayhead, G. (2012). California Biomass Power Plant Map and Status. UC Berkeley. Accessed January, 2012. http://ucanr.org/sites/WoodyBiomass/Woody_Biomass_Utilization_2/California_Biomass_Power_Plants
47

McDannel, M. (2009). Digester Gas‐Fired Combined Heat and Poweer: Technologies and Challenges. California Energy Commission Workshop. Los Angeles County Sanitation Districts.
McDannel, M. W. (2007). The Power of Digester Gas, a Technology Review from Micro to Megawatts. Whittier, Ca: County Sanitation Districts of Los Angeles County.
Morris, G. (1999). The Value of the Benefits of U.S. Bimass Power. Golden, CO: National Renewable Energy Laboratory.
Morris, G. (2000). Biomass Energy Production in California: The Case for a Biomass Policy Initiative. Golden: National Renewable Energy Laboratory.
Morris, G. (2003). The Status of Biomass Power Generation in California, July 31, 2003. Green Power Institute. Golden, CO: National Renewable Energy Laboratory.
Morris, G. (2008). Bioenergy and Greenhouse Gases. Berkeley, CA: Pacific Institute.
Negro, S. (2008). The Bumpy Road of Biomass Gasification in the Netherlands: Explaining the Rise and Fall of an Emerging Innovation System. Journal of Technological Forecasting and Social Change, 57‐77.
O’Donnell, C., Baumstark, P., Nibler, V., Corfee, K., & Sullivan, K. (. (2009). Renewable Energy Cost of Generation Update. Sacramento, Ca: PIER Interim Project Report. California Energy Commission. CEC‐500‐2009‐084.
Orta, J. Z. (2010). 2009 Progress to Plan ‐ Bioenergy Action Plan for California. California Energy Commission. CEC‐500‐2010‐007.
Overend, R. (1997). The Environmental Costs and Benefits of Biomass Energy Use in California. Golden, CO: National Renewable Energy Laboratory.
Phillips, B. (2011, August 18). Emery Energy Interview. (J. Birdsall, Interviewer)
Rebecca L. Rowe, N. R. (2009). Identifying potential environmental impacts of large‐scale deployment of dedicated bioenergy crops in the UK. Renewable and Sustainable Energy Reviews, 271‐290.
Reese, W. P. (2010, May 17). Letter RE: Comments on Boiler MACT Rule. Somis, Ca: California Biomass Energy Alliance.
Rhodes, J. K. (2005). Engineering economic analysis of biomass IGCC with carbon capture and storage. Journal of Biomass and Bioenergy, 440‐450.
Rodrigues, M. F. (2003). Techno‐economic analysis of co‐fired biomass integrated gasification/combined cycle systems with inclusion of economies of scale. Journal of Energy, 1229‐1258.
Sandborn, S. (2012, January 9). Senior Engineer., Personal communication (J. Birdsall, Interviewer)
48

49
Searcy, E. F. (2009). The Impact of Biomass Availability and Processing Cost on Optimum Size and Processing Technology Selection. Applied Biochemical Biotechnology, 154: 271‐286.
Sierra Energy Corporation. (2011). FastOx : Waste Conversion. Retrieved from http://www.sierraenergycorp.com/solutions/fastox/
Stahl, K. Waldheim. & M. Morris. (2004). Biomass IGCC at Varnamo, Sweden ‐ Past and Future. GCEP Energy Workshop, April 27, 2004. Stanford University, Ca.
Stahl, K. and M. Neergaard (1998). ʺIGCC power plant for biomass utilization, Varnamo, Sweden.ʺ Biomass and Bioenergy15(3): 205‐211.
State of California. (2012). “CEQA Historyʺ. Department of Justice, Office of Attorney General. Accessed January, 2012. http://ag.ca.gov/globalwarming/ceqa.php
Stevens, D. (2001). Hot gas conditioning: Recent progress with larger‐scale biomass gasification systems, NREL/SR‐510‐29952
Uddin, S. B. (2007). Biomass‐fired cogeneration systems with CO2 capture and storage. Journal of Renewable Energy, 1006‐1019.
US Departmen of Energy. (1997). Renewable Energy Technology Characterizations. Office of Utility Technologies, Energy Efficiency and Renewable Energy.
Weyerhaeuser Co. (2000). Biomass Gasification Combined Cycle DE‐FC36‐96GO10173. Washington D.C.: U.S. Department of Energy.
Williams, R. B. (2010). Gasification. Presentation at the Woody Biomass Utilization Workshop Oroville, California, UC Cooperative Extension.
Williams, R. B., M. Gildart and B. M. Jenkins (2008). An Assessment of Biomass Resources in California, 2007. CEC PIER Contract 500‐01‐016, California Biomass Collaborative.Williams, R. B. (2005). Technology assessment for advanced biomass power generation ‐ Final Report for SMUD ReGen program. University of California, Davis. CEC PIER Contract 500‐00‐034.
Williams, R. L. (1996). Biomass Gasifier Gas Turbine Power Generating Technology. Journal of Biomass and Bioenergy, 149‐166.
Wiltsee, G. (2000). Lessons Learned from Existing Biomass Power Plants. Golden, CO: National Renewable Energy Laboratory.
Xcel Energy. (2010, 08 13). Bay Front Biomass Gasification Project. Retrieved 08 13, 2010, from Excel Energy: http://www.xcelenergy.com/North%20Dakota/Company/Newsroom/Current%20Issues/Pages/BayFrontBiomassGasificationProject.aspx

APPENDIX A All shaded boxes can be changed to alter the outcome and compare sensitivities.
Table A‐1: Model shown for the Generic Gasifier
Capital Cost ($) ($/MWe-net)Gasifier and Feedstock Handling System Capital Cost ($) 33,000,000 733,333Gas Cleaning System Capital Cost ($) 20,000,000 444,444Power Generation/Interconnect System Capital Cost ($) 9,000,000 200,000Emission Control System Capital Cost ($) 32,000,000 3,555,556Heat Recovery System Capital Cost ($) 6,000,000 133,333Total Facility Capital Cost ($) 100,000,000 2,222,222
Total Facility =∑Gasifier(or boiler):HRSG Capitol Cost
Table A‐2: Electrical and Fuel
Electrical and Fuel--base year Gross Electrical Capacity (MWe) 50 Net Electrical Capacity (MWe) 45 Efficiency (%) 90 Capacity Factor (%) 90 Annual Hours 7,884 Annual Net Electricity Generation (MWh) 354,780 HHV Efficiency of Gasification/Combustion System--Biomass to Clean Gas (%) 65.0 Net HHV Efficiency of Power Generation (%) 40.0 Overall Net System Efficiency (%) 26.0 Clean Gas Composition (% by volume, dry) - from emissions model CO 24.2 H2 28.0 Hydrocarbons (as CH4) 0.0 CO2 5.4 O2 0.0 N2 38.2 Clean Gas Molecular Mass (kg/kmol) 19.77 Clean Gas Density 298K, 1 atm (kg/Nm3) 0.809 Clean Gas Higher Heating Value (MJ/kg) 42 Clean Gas Lower Heating Value (MJ/kg) 36 Total Fuel Power Input (MW) 113 Gas Flow Rate (kg/h) 9,596 Annual Clean Gas Consumption (kg/y) 75,656,451 HHV of Biomass Feedstock (MJ/kg) 25 Moisture Content of Biomass Feedstock (% wet basis) 15.0 Biomass Feed Rate (kg/h)--dry basis 24,923 Annual Biomass Consumption (kg/y)--dry basis 196,493,538 Annual Biomass Consumption (kg/y)--wet basis 231,168,869 Ash Content of Biomass (% dry matter) 5 Carbon Concentration of Char (% dry basis) 30 Char Production Rate (kg/h)--dry 1,780
A‐1

Annual Char Production (kg/y)--dry 14,035 Given:
Table A‐3
Mc 12.01115 [kg/mole] MH 1.00797 MS 32.064 MO2 31.9988 MCO 28.01055 MCO2 44.00995 MH2O 18.01534 MH2 2.01594 MSO2 64.0628 MN2 28.0134
HHV [MJ/kg] LHV [MJ/kg]
CO 10.1 10.1H2 142 120CH4 55.5 50
Efficiency =
Annual Hours = x 8760
Annual Net Electricity Generation = Annual Hours x Net Electrical Capacity
Overall Net System Efficiency =
Clean Gas Molecular Mass =
Where
CO, H2, SO2, Hydrocarbons (as CH4), CO2, O2, and N2 are the clean gas composition as a percentage by mass, dry, from the emissions model in section 3.1.
Clean Gas Density at 298K, 1atm (conversion factors) = Clean Gas Molecular Mass x
Clean gas higher heating value = for the clean gas composition
= higher heating value for each component of the clean gas composition
Clean gas lower heating value = for the clean gas composition
= lower heating value for each component of the clean gas composition
A‐2
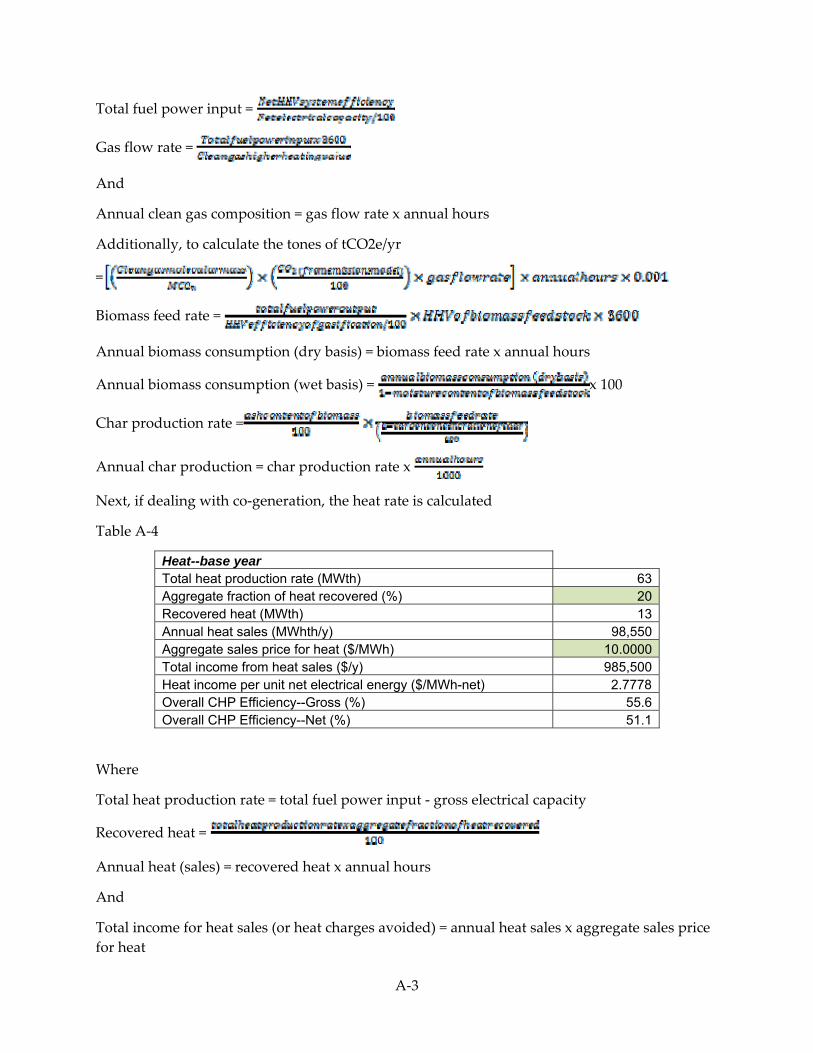
Total fuel power input =
Gas flow rate =
And
Annual clean gas composition = gas flow rate x annual hours
Additionally, to calculate the tones of tCO2e/yr
=
Biomass feed rate =
Annual biomass consumption (dry basis) = biomass feed rate x annual hours
Annual biomass consumption (wet basis) = x 100
Char production rate =
Annual char production = char production rate x
Next, if dealing with co‐generation, the heat rate is calculated
Table A‐4
Heat--base year Total heat production rate (MWth) 63 Aggregate fraction of heat recovered (%) 20 Recovered heat (MWth) 13 Annual heat sales (MWhth/y) 98,550 Aggregate sales price for heat ($/MWh) 10.0000 Total income from heat sales ($/y) 985,500 Heat income per unit net electrical energy ($/MWh-net) 2.7778 Overall CHP Efficiency--Gross (%) 55.6 Overall CHP Efficiency--Net (%) 51.1
Where
Total heat production rate = total fuel power input ‐ gross electrical capacity
Recovered heat =
Annual heat (sales) = recovered heat x annual hours
And
Total income for heat sales (or heat charges avoided) = annual heat sales x aggregate sales price for heat
A‐3

Heat income per unit net electrical energy =
Overall CHP efficiency (gross) =
Overall CHP efficiency (net) =
Taking the given capital cost above the expenses are calculated as
Table A‐5: Title Needed
Expenses--base year Delivered feedstock cost ($/kg) 0.04 Annual feedstock cost ($) 6,877,274 Operating expenses rate (% of capital investment) 4 Operating expenses ($) 4,000,000 Total annual expenses including feedstock 10,877,274
Where delivered feedstock cost is calculated as
Feedstock cost ($/kg) =
Annual feedstock cost = feedstock cost x annual biomass consumption (dry basis)
Operating expenses =
Total annual expenses =annual feedstock cost + operating expenses
Table A‐6: Title Needed
Other Revenues or Cost Savings ($/year) Electrical energy 0 Incentive payments 0 Capacity 0 Total income for heat sales [$/yr] 985,500 Char cost [$/kg] 5 Residues 70,176 Total 1,055,676
Residues = Char cost x annual char production
Total =
A‐4

Table A‐7
Taxes and Tax credit Federal Tax Rate (%) 34.00 State Tax Rate (%) 9.30 Production Tax Credit ($/MWe) 0.000 Carbon Reduction Credit ($) 743621.966 Negative taxes allowed to offset taxes elsewhere? (Yes or No) Yes Combined Tax Rate (%) 40.14
Table A‐8
Carbon credit 5 $/tCO2e
148,724 tCO2e/yr
Carbon credit = $/tCO2e x tCO2e/yr
Combined tax rate =State tax rate + Federal tax rate x
Assume escalation on all payments/credit/sales as 2.10 %/yr
A‐5

Table A‐9
Financing Value Debt ratio (%) 90.00 Interest rate on debt (IRD) (%/y) 5.00 One year debt reserve required? (Yes or No) Yes Minimum attractive rate of return on equity (MARR) (%/year) 15 Economic Life (y) 20 Amount of capital financing ($) 100,000,000 Equity ratio (%) 10.00 Weighted Cost of Money (Current, %) 6.00 Weighted Capital Recovery Factor (Current, Overall) 0.0872 Real Cost of Money (Constant, %) 3.82 Weighted Capital Recovery Factor (Constant, Overall) 0.0724 Debt recovery: Total debt principal ($) 90,000,000 Capital Recovery Factor (Debt) 0.0802 Annual debt repayment ($/year) 7,221,833 Total debt repayment (principal plus interest) ($) 144,436,657 Equity recovery: Total Equity Principal ($) 10,000,000 Capital Recovery Factor (equity MARR) 0.1598 Annual equity repayment at MARR ($/year) 1,597,615 Total equity repayment (principal plus interest) ($) 31,952,294 Real Cost of Equity (Constant, %) 12.63 Capital Recovery Factor (equity, Constant) 0.1392 Total Debt + Equity Recovery: Annual total capital recovery ($/year) 8,819,448 Total capital recovery ($) 176,388,951
Where:
Equity ratio = 100 – debt ratio
Weighted cost of money (WCM) =
Weighted capital recovery =
Note: economic life must be 30 years or less
Real cost of money (RCM) =
Weighted capital recovery factor
Total debt principle = amount of capital financed x
A‐6

Capital recovery factor (debt) =
Annual debt repayment = total debt principal x capital recovery factor
Total debt repayment = annual debt repayment x economic life
Total equity principal =
Capital recovery factor (equity) =
Annual equity repayment = total equity principal x capital recovery factor (equity)
Total equity repayment = annual equity repayment x economic lifetime
Real cost of equity (RCE) =
Capital recovery factor (equity, constant) =
Annual total capital recover = annual debt repayment + annual equity repayment
Total capital recovery = total debt repayment + total equity repayment
The depreciation can be chosen from the options listed above and affects the taxes in the annual cash flow calculations shown in Appendix 1.
The levelized energy revenue requirements are calculated as total present worth x MARR. The levelized cost of energy is then the revenue requirements divided by the annual net electricity generation and can be in current or constant dollars.
A‐7

Depreciation Schedule of Economic Model
The following shows the depreciation schedules for the five options. This particular model run uses the 50 MWe(45 MWe net) plant with a 20 year lifetime referenced in section 3.2, and the MACRS 20 year depreciation schedule.
Table A‐10
3
Year 1 2 3 4 5
1 MACRS 5 year 0.2000 0.3200 0.1920 0.1152 0.1152
2 MACRS 10 year 0.1000 0.1800 0.1440 0.1152 0.0922
3 MACRS 20 year 0.0375 0.0722 0.0668 0.0618 0.0571
4 20 year straight line 0.0500 0.0500 0.0500 0.0500 0.0500
5 No depreciation 0.0000 0.0000 0.0000 0.0000 0.0000
Fraction Applied 0.0500 0.0500 0.0500 0.0500 0.0500
Tax Credit Schedule Years Applied
Year 5 1 2 3 4 5
Percentage in year (%) 100 100 100 100 100
<‐‐Choose schedule # to use for depreciation (1, 2, 3, 4 or 5)
Schedu
le
6 7 8 9 10 11 12 13 14 15 16 17 18 19 20
0.0576
0.0737 0.0655 0.0655 0.0655 0.0655 0.0329
0.0529 0.0489 0.0452 0.0446 0.0446 0.0446 0.0446 0.0446 0.0446 0.0446 0.0446 0.0446 0.0446 0.0446 0.0446
0.0500 0.0500 0.0500 0.0500 0.0500 0.0500 0.0500 0.0500 0.0500 0.0500 0.0500 0.0500 0.0500 0.0500 0.0500
0.0000 0.0000 0.0000 0.0000 0.0000 0.0000 0.0000 0.0000 0.0000 0.0000 0.0000 0.0000 0.0000 0.0000 0.0000
0.0500 0.0500 0.0500 0.0500 0.0500 0.0500 0.0500 0.0500 0.0500 0.0500 0.0500 0.0500 0.0500 0.0500 0.0500
6 7 8 9 10 11 12 13 14 15 16 17 18 19 20
0 0 0 0 0 0 0 0 0 0 0 0 0 0 0
A‐8

Table A‐11a: Annual Cash Flow
Annual Cash Flows
Year 0 1 2 3 4 5 6
Equity Recovery 1,597,615 1,597,615 1,597,615 1,597,615 1,597,615 1,597,615
Equity Interest 1,500,000 1,485,358 1,468,519 1,449,155 1,426,886 1,401,277
Equity Principal Paid 97,615 112,257 129,095 148,460 170,729 196,338
Equity Principal Remaining 9,902,385 9,790,128 9,661,033 9,512,573 9,341,844 9,145,506Debt Recovery 7,221,833 7,221,833 7,221,833 7,221,833 7,221,833 7,221,833
Debt Interest 4,500,000 4,363,908 4,221,012 4,070,971 3,913,428 3,748,008
Debt Principal Paid 2,721,833 2,857,924 3,000,821 3,150,862 3,308,405 3,473,825
Debt Principal Remaining 87,278,167 84,420,243 81,419,422 78,268,560 74,960,155 71,486,330
Fuel Cost 6,877,274 7,021,697 7,169,152 7,319,704 7,473,418 7,630,360
Non‐feedstock Operating Expenses 4,000,000 4,084,000 4,169,764 4,257,329 4,346,733 4,438,014
Debt Reserve 7,221,833 0 0 0 0 0Expenses 10,877,274 11,105,697 11,338,916 11,577,033 11,820,151 12,068,374
Depreciation 5,000,000 5,000,000 5,000,000 5,000,000 5,000,000 5,000,000
Income or Savings‐‐Electrical energy 0 0 0 0 0 0
Income‐‐Incentive payments 0 0 0 0 0 0
Income‐‐Capacity 0 0 0 0 0 0
Income‐‐Heat 985,500 1,006,196 1,027,326 1,048,899 1,070,926 1,093,416Income‐‐Residue 70,176 71,650 73,155 74,691 76,259 77,861
Interest on Debt Reserve 144,437 144,437 144,437 144,437 144,437 144,437
Taxes before credit 4,385,986 47,901
Tax Credit 743,622 743,622 743,622 743,622 743,622 743,622
Taxes Negative taxes allowed? Yes 3,887,381
Energy Revenue Required 29,605,823 17,839,191 18,145,589 18,461,200 18,786,357 19,121,405Present Worth of Energy Revenue Required ($/year) 25,744,194 13,488,991 11,931,019 10,555,251 9,340,139 8,266,711
Total Present Worth ($/year) 131,031,180 No error on sum
Levelized Energy Revenue Requirements (Current $/year) 20,933,734
Levelized Energy Revenue Requirements (Constant $/year) 18,244,604
LCOE (Current, $/MWh) 59.00 0.059 [$/KWh]
LCOE (Constant, $/MWh) 51.43 0.051 [$/KWh]
‐365,066 ‐269,253 ‐168,649 ‐63,015
‐863,671 ‐767,858 ‐667,254 ‐561,620 ‐450,704
A‐9

6 7 8 9 10 11 12 13 14 15 16 17 18 19 20
1,597,615 1,597,615 1,597,615 1,597,615 1,597,615 1,597,615 1,597,615 1,597,615 1,597,615 1,597,615 1,597,615 1,597,615 1,597,615 1,597,615 1,597,615
1,401,277 1,371,826 1,337,958 1,299,009 1,254,218 1,202,709 1,143,473 1,075,352 997,012 906,922 803,318 684,173 547,157 389,588 208,385
196,338 225,789 259,657 298,606 343,396 394,906 454,142 522,263 600,603 690,693 794,297 913,441 1,050,458 1,208,026 1,389,230
9,145,506 8,919,718 8,660,061 8,361,455 8,018,059 7,623,153 7,169,011 6,646,748 6,046,145 5,355,452 4,561,155 3,647,714 2,597,256 1,389,230
7,221,833 7,221,833 7,221,833 7,221,833 7,221,833 7,221,833 7,221,833 7,221,833 7,221,833 7,221,833 7,221,833 7,221,833 7,221,833 7,221,833 7,221,8333,748,008 3,574,317 3,391,941 3,200,446 2,999,377 2,788,254 2,566,575 2,333,812 2,089,411 1,832,790 1,563,338 1,280,413 983,342 671,418 343,897
3,473,825 3,647,516 3,829,892 4,021,387 4,222,456 4,433,579 4,655,258 4,888,021 5,132,422 5,389,043 5,658,495 5,941,420 6,238,491 6,550,415 6,877,936
71,486,330 67,838,814 64,008,922 59,987,535 55,765,079 51,331,500 46,676,242 41,788,221 36,655,800 31,266,757 25,608,262 19,666,842 13,428,351 6,877,936 0
7,630,360 7,790,598 7,954,200 8,121,238 8,291,784 8,465,912 8,643,696 8,825,214 9,010,543 9,199,764 9,392,959 9,590,212 9,791,606 9,997,230 10,207,172
4,438,014 4,531,213 4,626,368 4,723,522 4,822,716 4,923,993 5,027,397 5,132,972 5,240,764 5,350,820 5,463,188 5,577,915 5,695,051 5,814,647 5,936,755
0 0 0 0 0 0 0 0 0 0 0 0 0
12,068,374 12,321,810 12,580,568 12,844,760 13,114,500 13,389,905 13,671,093 13,958,186 14,251,307 14,550,585 14,856,147 15,168,126 15,486,657 15,811,877 16,143,9265,000,000 5,000,000 5,000,000 5,000,000 5,000,000 5,000,000 5,000,000 5,000,000 5,000,000 5,000,000 5,000,000 5,000,000 5,000,000 5,000,000 5,000,000
0 0 0 0 0 0 0 0 0 0 0 0 0 0 0
0 0 0 0 0 0 0 0 0 0 0 0 0 0 0
0 0 0 0 0 0 0 0 0 0 0 0 0 0 0
1,093,416 1,116,378 1,139,821 1,163,758 1,188,197 1,213,149 1,238,625 1,264,636 1,291,193 1,318,308 1,345,993 1,374,259 1,403,118 1,432,584 1,462,668
77,861 79,496 81,165 82,870 84,610 86,387 88,201 90,053 91,944 93,875 95,847 97,859 99,914 102,013 104,155144,437 144,437 144,437 144,437 144,437 144,437 144,437 144,437 144,437 144,437 144,437 144,437 144,437 144,437 144,437
47,901 164,363 286,647 415,046 549,865 691,424 840,062 996,132 1,160,005 1,332,071 1,512,741 1,702,445 1,901,634 2,110,782
743,622 743,622 743,622 743,622 743,622 743,622 743,622 743,622 743,622 743,622 743,622 743,622 743,622 743,622 743,622
51,260 192,819 341,457 497,527 661,400 833,466 1,014,136 1,203,840 1,403,029 1,612,177
19,121,405 19,466,705 19,822,634 20,189,584 20,567,964 20,958,199 21,360,735 21,776,034 22,204,580 22,646,879 23,103,455 23,574,859 24,061,664 24,564,468 13,019,761
8,266,711 7,318,255 6,480,054 5,739,140 5,084,086 4,504,823 3,992,474 3,539,214 3,138,144 2,783,176 2,468,945 2,190,715 1,944,306 1,726,030 795,511
0
0 ‐7,221,833
‐2,511,915
‐450,704 ‐334,243 ‐211,958 ‐83,559 ‐3,010,520
A‐10
Table A‐11b: cont.Annual Cash Flow