Embed Size (px)
Citation preview

Publ ic Interest Energy Research (PIER) Program
FINAL PROJECT REPORT
ENERGY REDUCTION IN MEMBRANE FILTRATION PROCESS THROUGH OPTIMIZATION OF NANOSUSPENEDED PARTICLE REMOVAL
MARCH 2011
CEC-‐XXX-‐XXXX-‐XXX
Prepared for: California Energy Commission
Prepared by: University of California, Irvine and Kennedy/Jenks Consultants

Prepared by: Primary Author(s): Diego Rosso University of California, Irvine Department of Civil and Environmental Engineering Irvine, CA 92697 Ganesh Rajagopalan Kennedy/Jenks Consultants 2355 Main Street, Suite 140 Irvine, CA 92614 Contract Number: 502-02-004 Prepared for: California Energy Commission Carl Blumstein Contract Manager Paul Roggensack Project Manager XXXX XXXXXX Office Manager Name of Office Goes Here XXXX XXXXXX Deputy Director Division Name Goes Here Melissa Jones Executive Director
DISCLAIMER
This report was prepared as the result of work sponsored by the California Energy Commission. It does not necessarily represent the views of the Energy Commission, its employees or the State of California. The Energy Commission, the State of California, its employees, contractors and subcontractors make no warrant, express or implied, and assume no legal liability for the information in this report; nor does any party represent that the uses of this information will not infringe upon privately owned rights. This report has not been approved or disapproved by the California Energy Commission nor has the California Energy Commission passed upon the accuracy or adequacy of the information in this report.

i
ACKNOWLEDGEMENTS The authors wish to acknowledge Jana Safarik of the Orange County Water District, and Eric M.V. Hoek and Minghua Li of the University of California, Los Angeles for the help during experimental setup.

ii
PREFACE The California Energy Commission Public Interest Energy Research (PIER) Program supports public interest energy research and development that will help improve the quality of life in California by bringing environmentally safe, affordable, and reliable energy services and products to the marketplace.
The PIER Program conducts public interest research, development, and demonstration (RD&D) projects to benefit California.
The PIER Program strives to conduct the most promising public interest energy research by partnering with RD&D entities, including individuals, businesses, utilities, and public or private research institutions.
PIER funding efforts are focused on the following RD&D program areas:
• Buildings End-Use Energy Efficiency
• Energy Innovations Small Grants
• Energy-Related Environmental Research
• Energy Systems Integration
• Environmentally Preferred Advanced Generation
• Industrial/Agricultural/Water End-Use Energy Efficiency
• Renewable Energy Technologies
• Transportation
Energy Reduction in Membrane Filtration Process through Optimization of Nanosuspended Particles Removal is the final report for the project XXX-‐XXXX-‐XXX conducted by University of California, Irvine and Kennedy/Jenks. The information from this project contributes to PIER’s [insert RD&D program area from bulleted list above] Program.
For more information about the PIER Program, please visit the Energy Commission’s website at www.energy.ca.gov/research/ or contact the Energy Commission at 916-654-4878.

iii
ABSTRACT As more tertiary processes are implemented for water reclamation, membrane filtration is gaining ground their energy intensity is being investigated. A better understanding of membrane fouling is key to reducing energy requirements, which in turn lower running costs. Nanomaterials, due to their small size, have the potential to cause pore plugging of the membranes, which is very difficult to mitigate. Previous studies by others have indicated that pore plugging by biogenic nanoscale particles may account for up to 80% of flux reduction, causing irreversible fouling that necessitates costly chemical cleaning. As a first step towards evaluating the impact of manufactured nanoparticles, we investigated here the extent of biogenic nanoscale particles impact on membrane flux reduction and energy consumption using wastewater samples from three treatment plants. For each sample, a filtration series was conducted with 0.45, 0.2, 0.1, 0.08, 0.05, 0.03, and 0.01 micron membranes. At each step, filtrate was collected, COD was measured, and Zetasizer Nano analysis was performed to quantify particle size distribution and count rate (number of particles per second detected by the instrument, i.e. total amount of particles in the water). As the pore size became smaller, the count rate in the samples reduced, showing that not only the larger particles were removed, but the overall number of particles is decreased by the filtration process. During the same incremental filtration series, COD did not vary, showing that the largest contribution to COD was given by the small particles that bypass all the filtration events.
Please use the following citation for this report:
Rosso, Diego, and Ganesh, Rajagopalan. University of California Irvine and Kennedy/Jenks Consultants. 2011. Energy Reduction in Membrane Filtration Process Through Optimization of Nanosuspended Particles Removal. California Energy Commission. CEC-XXX-2010-XXX.

iv
TABLE OF CONTENTS
(THIS WILL BE FINALIZED IN THE FINAL VERSION OF THE REPORT)
Acknowledgements ................................................................................................................................... i ............................................................................................................Error! Bookmark not defined.
PREFACE ....................................................................................................................................................ii ABSTRACT .............................................................................................................................................. iii TABLE OF CONTENTS..........................................................................................................................iv EXECUTIVE SUMMARY ........................................................................................................................ 1
Heading 2 .............................................................................................Error! Bookmark not defined. Heading 3 .........................................................................................Error! Bookmark not defined.
Heading 2 .............................................................................................Error! Bookmark not defined. CHAPTER 1: .............................................................................................................................................. 2
Heading 1.1 ............................................................................................................................................. 2 Heading 1.1.1 ...................................................................................................................................... 2
Heading 1.2 ..........................................................................................Error! Bookmark not defined. Heading 1.2.1 ...................................................................................Error! Bookmark not defined. Heading 1.2.2 ...................................................................................Error! Bookmark not defined.
CHAPTER 2: ............................................................................................. Error! Bookmark not defined. Heading 2.1 ..........................................................................................Error! Bookmark not defined.
Heading 2.1.1 ...................................................................................Error! Bookmark not defined. Heading 2.2 ..........................................................................................Error! Bookmark not defined.
Heading 2.2.1 ...................................................................................Error! Bookmark not defined. APPENDIX A: ........................................................................................................................................A-1

1
EXECUTIVE SUMMARY Particle size distribution is a key factor that impacts process/energy efficiency in wastewater treatment processes. Membrane processes for water and wastewater treatment are highly energy intensive. Pretreatment techniques, including coagulation/precipitation can potentially remove nanoscale particles prior to membrane filtration. In Southern California, the total water reclaimed using membrane processes is estimated to exceed 300 MGD. The goal of this project is to investigate the role of biogenic nanoparticles present in secondary wastewater effluent on the fouling of tertiary membranes for water reclamation.
We investigated here the extent of biogenic nanoscale particles impact on membrane flux reduction and energy consumption using wastewater samples from three treatment plants. We measured COD and particle size distribution for each sample. Subsequently, we performed membrane filtration with incrementally smaller pore sizes. As the pore size became smaller, the count rate in the samples reduced, showing that not only the larger particles were removed, but the overall number of particles is decreased by the filtration process. During the same incremental filtration series, COD did not vary, showing that the largest contribution to COD was given by the small particles that bypass all the filtration events.
2
CHAPTER 1: Introduction 1.1 Background In wastewater treatment process, particle size distribution is long considered a key factor that impacts process/energy efficiency. Most of the historic studies on particle size distribution focused on micron (or larger) size fraction. Micron (or larger) size particles can impact coagulation/precipitation, membrane filtration, activated sludge, disinfection and solids dewatering during water / wastewater treatment. Several studies have been performed to improve treatment process efficiency, which in many cases resulted in energy conservation.
Although several studies have been performed to improve water and wastewater treatment efficiency through removal of larger size particles, very little studies have been performed to date to understand the role of sub-micron/nanoscale suspended particles. Limited data available in literature indicate that sub-micron/nanoscale fraction of suspended solids in water/wastewater may play a more significant role than micron (or larger) size particles with respect to process/energy efficiency. For example, 2 to 500 nm size fractions of suspended particles appear to foul membrane elements (MF, UF, RO) more permanently, resulting in larger energy demand during water treatment (1,2). Also, polymer dosing at current sludge dewatering processes do not capture nanoscale suspended particles effectively. Evidence in literature indicates that capture of these particles can significantly conserve energy during sludge dewatering (3).
Although sporadic data are present, to date no systematic studies have been done to evaluate i) the role nanoscale particles in the energy demand during water treatment, and ii) methods to optimize their removal to improve energy efficiency. With the emergence of nanotechnology new tools are now available to detect/monitor nanoscale materials in wastewaters.
To date very little systematic studies have been done to evaluate the impact of nanoscale constituents on wastewater treatment processes. Available information on the removal of nanoparticles by membrane filtration processes and coagulation (as pretreatment to membrane) is briefly summarized below.
1.2 Nanoscale Particles and Membrane Filtration Membrane processes for water and wastewater treatment are highly energy intensive. Depending on the water quality characteristics, energy requirement for treating about 1 million gallons of water may range from 600 to 800 kW for microfiltration (MF) membrane to 1600 to 2000 kW for a reverse osmosis (RO) membrane. A limited number of modeling and laboratory scale studies have evaluated the impact of colloidal particles size on the fouling of pressurized membranes (4, 5). A theoretical model developed by Wiesner and Chellam (4) suggested that individual or agglomerated nanoparticles of about 100 nm have the highest potential to foul the membranes. Particles larger and smaller than 100 nm had a lower impact on membrane fouling. However, deviations to these predictions were observed in studies using different membrane systems, as well as the type of nanoparticles, as discussed below: Orange County Water District (OCWD), our partners for this study, have performed detailed studies to evaluate fouling of microfiltration (MF) membranes by submicron suspended particles in their secondary treated wastewater (2, 6). In their study, they compared the fouling characteristics of the unfiltered wastewater with that of wastewater samples pre-filtered using 200, 3.5 and 2.5 nm pore size cartridges. Their studies indicated that, biogenic nanoparticles of
3
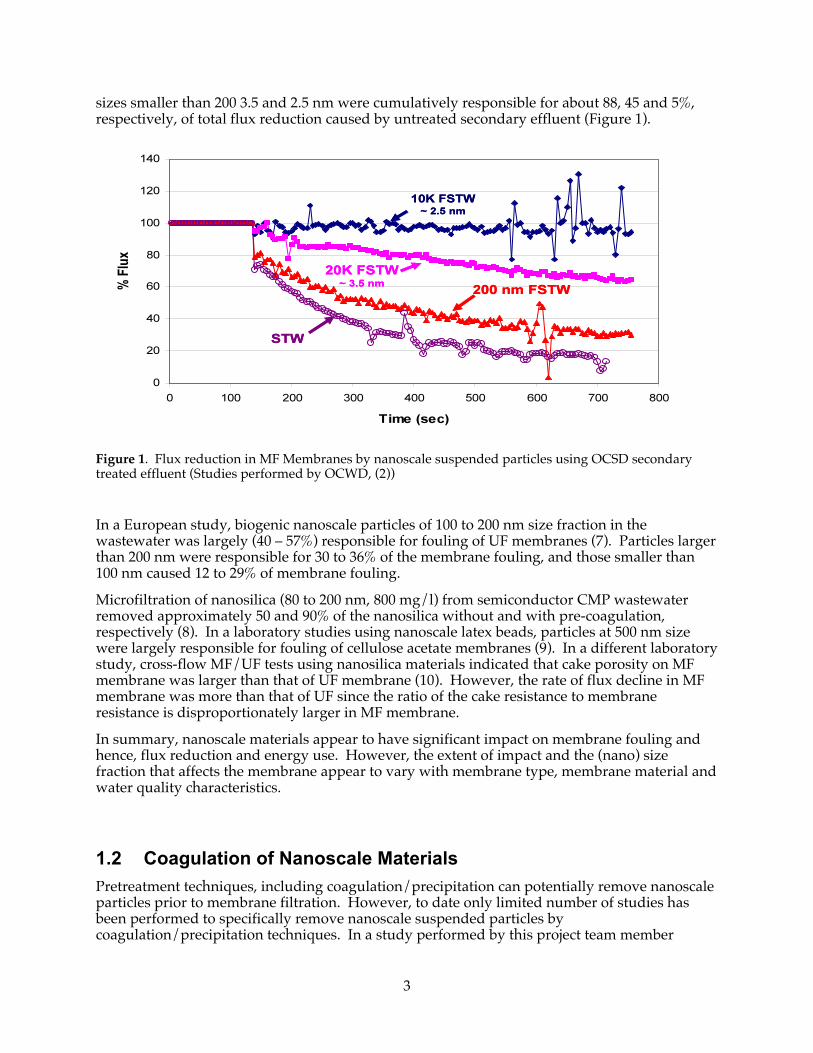
sizes smaller than 200 3.5 and 2.5 nm were cumulatively responsible for about 88, 45 and 5%, respectively, of total flux reduction caused by untreated secondary effluent (Figure 1).
Figure 1. Flux reduction in MF Membranes by nanoscale suspended particles using OCSD secondary treated effluent (Studies performed by OCWD, (2))
In a European study, biogenic nanoscale particles of 100 to 200 nm size fraction in the wastewater was largely (40 – 57%) responsible for fouling of UF membranes (7). Particles larger than 200 nm were responsible for 30 to 36% of the membrane fouling, and those smaller than 100 nm caused 12 to 29% of membrane fouling.
Microfiltration of nanosilica (80 to 200 nm, 800 mg/l) from semiconductor CMP wastewater removed approximately 50 and 90% of the nanosilica without and with pre-coagulation, respectively (8). In a laboratory studies using nanoscale latex beads, particles at 500 nm size were largely responsible for fouling of cellulose acetate membranes (9). In a different laboratory study, cross-flow MF/UF tests using nanosilica materials indicated that cake porosity on MF membrane was larger than that of UF membrane (10). However, the rate of flux decline in MF membrane was more than that of UF since the ratio of the cake resistance to membrane resistance is disproportionately larger in MF membrane.
In summary, nanoscale materials appear to have significant impact on membrane fouling and hence, flux reduction and energy use. However, the extent of impact and the (nano) size fraction that affects the membrane appear to vary with membrane type, membrane material and water quality characteristics.
1.2 Coagulation of Nanoscale Materials Pretreatment techniques, including coagulation/precipitation can potentially remove nanoscale particles prior to membrane filtration. However, to date only limited number of studies has been performed to specifically remove nanoscale suspended particles by coagulation/precipitation techniques. In a study performed by this project team member

4
(Kennedy/Jenks Consultants), conventional polymer treatment removed only about 65% of nanosuspended particles from municipal wastewater sludge (Figure 2). (Subsequently, a specially designed polymer additive, by the project team member, Kennedy/Jenks Consultants, removed more than 90% of the nanoscale particles that were NOT removed by the conventional polymer treatment).
Figure 2. Nanoscale (< 450 nm) particle count in untreated and polymer treated sludge filtrate. Polymer treatment removed only about 65% of the submicron particles.
In yet another study coagulation using aluminum polysulfate removed about 90% of the submicron (< 500 nm) suspended particles from a slaughterhouse wastewater (11). However, the optimum reaction time (5 minutes coagulation, 60 minutes flocculation, and 60 minutes settling) was significantly longer than typical reaction times used in treatment plants. Furthermore, this study did not systematically evaluate the particle size range below 500 nm. In another study using manufactured nanoparticles, only about 40 to 60% of metal oxide nanoparticles were removed by alum and ferric coagulation (12). Nearly 10 to 30% of initial concentration remained in suspension after coagulation followed by filtration (0.45 µm).
No systematic study has been performed using other pretreatment processes (e.g. adsorption, ion exchange) to specifically remove nanoscale suspended particles from wastewater.
In summary, current knowledge on the pretreatment of nanoscale suspended particles appear to be very limited. Available data appear to indicate that current techniques are not very effective in removing nanoscale particles, and modifications are required to optimize pretreatment processes for targeted removal of nanoscale particles.
1.3 Energy Implications A survey of RO facilities in Southern California service area indicated that there are 16 reclamation facilities, 8 desalination facilities, 26 brackish water facilities, 5 municipal water treatment facilities serving more than 500 people, and 18 small municipal water treatment facilities serving less than 500 people (13). The design flow rates for 54 out of the 74 facilities were obtained. The total flow rate for the facilities with known flow rates is about 315 MGD. The overall treatment capacity of these facilities varied from 0.1 to 90 MGD. For the remaining
5
facilities, assuming an average flow rate of 2 MGD for the larger systems and 0.25 MGD for the smaller systems, the total water treated by membrane processes in the project area is about 330 MGD.
Furthermore, a survey by American Membrane Technologies Association indicates that there are at least 345 microfiltration treatment plants (88 MGD capacity), 2 nanofiltration facilities (9 MGD), 31RO facilities (93 MGD) and six UF facilities (42 MGD) in California (14). This list is not a complete list as it does not include some major filtration facilities including the 70 MGD OCWD MF facility. Industrial membrane treatment facilities are also not included in this compilation.
There is potential to improve the energy efficiency of these membrane treatment facilities in California, as well as other industrial/municipal membrane treatment facilities outside California.
1.4 Project Goals The goal of this project is to investigate the role of biogenic nanoparticles present in secondary wastewater effluent on the fouling of tertiary membranes for water reclamation. In order to do so, we performed bench-scale studies to evaluate potential role of biogenic nanoscale materials on membrane (UF, NF, RO and MF) filtration efficiency, and identify ways to improve energy efficiency through removal/mitigation of nanoscale particles. A secondary goal of this project is to initiate development of relationship between the type of membranes, water quality characteristics and the critical size of nanoparticles responsible for flux reduction (and energy use).

6
CHAPTER 2: Project Approach In this study there are four distinct tasks that were proposed to be completed;
• Task 1. Establish nanoscale materials fate and removal in existing treatment process
• Task 2. Evaluate impact of sub-micron particles on flux reduction in UF, NF and RO membranes
• Task 3. Pretreatment to remove nanoscale suspended particles
• Task 4. Estimation of energy reduction due to removal of nanoscale suspended particles
A description and summary of these tasks are presented below:
2.1 Fate and Removal of Nanoscale particles In Existing Treatment Plants Under this task, a detailed evaluation of fate and removal of nanoscale materials in three major wastewater treatment processes was performed. The treatment plants include i) the water reclamation facility at IRWD, ii) the trickling filter plant at Santa Margarita Water District, and iii). the activated sludge treatment plant at OCWD. The treatment process at Michelson treatment plant at IRWD includes screening, primary settling, activated sludge process, secondary clarification, dual media filtration and disinfection. The existing treatment processes in Santa Margarita Water District, Chiquita reclamation plant (6 MGD) include influent pumping, grit removal, primary clarifiers, trickling filters/solids contact, anaerobic digestion and belt filter presses for dewatering. During water reclamation, OCWD receives secondary treated wastewater from OCSD that undergoes screening, advanced primary clarification, activated sludge process, disinfection (and anaerobic digestion). For the proposed study, effluent samples (duplicate) from various unit processes (e.g. primary influent, settling tank, secondary effluent, media filters) were analyzed for distribution of biogenic nanoscale materials. Analyses includes i) nanoscale particle size distribution using a nanoparticle counter (Malvern Zetasizer) at UCI, and , ii) TOC analyses to relate the nanoscale particle size distribution to equivalent TOC in the wastewater samples.
2.2 Evaluate Impact of Sub-micron Particle Size on Flux Reduction in MF and UF Membranes This task evaluated the relationship between nanoparticle size range and membrane type / membrane materials. The secondary treated water from the three wastewater treatment plants identified in Task 1 were used in this Task. Membrane type evaluated includes ultrafiltration (UF) and microfiltration (MF).
Figure 4 shows the schematic of the experimental setup. The flask containing 250 ml secondary treated wastewater is constantly stirred in a stirring table. The sample is drawn to the 50 ml vial containing 20 cm long dead-end filtration fiber (e.g. US Filter, M10CPP, 0.2 µm pore MF fiber) at

7
-5 psi vacuum pressure. The filtered water is collected in a collection vial placed on an electronic balance. The mass of filtered water in the collection vial is continuously measured, converted to flux rate and recorded in the computer using the Win Wedge program (Tal Tech, PA). The experiment was stopped after a 95% flux drop. The feed and permeate waters were analyzed for TOC concentration, particle size distribution and turbidity.
Figure 4. Experimental arrangement to be used for membrane filtration studies.
Furthermore, in order to understand the impact of specific size range of nanoscale particles, the secondary effluents was pre-filtered using membranes of different pore size. Bench scale AMI membranes of 2.5 nm, 3.5 nm, 100 nm, 200 nm and 450 nm (e.g. MU1812PAN40050 (20,000 MW cutoff); M-U182PES50 (10,000 MW cutoff)) were used to pre-filter the samples and used for the filtration studies shown in Figure 1. A relationship between particle size and flux drop were developed and the critical particle size range responsible for major membrane fouling for different wastewaters and membrane types were identified. Table 1 summarizes various factors that were evaluated during the bench scale membrane studies.
Table 1. Summary of factors evaluated for nanoscale particles impact during membrane filtration
Wastewater Pre-Filtration Membrane Type
1. IRWD Activated Sludge Treatment
1. Unfiltered Effluent
1. Ultrafiltration

8
Plant Effluent
2. SMWD Trickling Filter Plant Effluent
3. OCWD Activated Sludge Secondary Effluent
2. Filtration by 450 nm, 200 nm, 100nm, 3.5 nm and 2.5 nm cartridges
2. Microfiltration
2.3 Pretreatment to Remove Nanoscale Suspended Particles Two pre-treatment techniques (Coagulation/precipitation and adsorption) were performed to evaluate removal of nanoscale suspended particles from the secondary effluent from the three wastewater treatment facilities.
Coagulation/precipitation studies were performed using a Phipps & Bird jar tester containing six paddles. Three coagulants (alum, ferric chloride and Sumaclear 1000, an aluminum polychloride based polymer, Summit Research Lab, NJ) were used. Three concentrations of each coagulants (alum 20, 40 and 50 mg/l; ferric chloride 25, 50, 75 mg/l; polymer 10, 15, 20 mg/l) were used. The alum and ferric chloride concentrations were selected based on Kennedy/Jenks Consultants previous studies for a California Central Coast WWTP effluent (15). The polymer dose is selected based on earlier OCWD studies (2, 6). Six 1L jars containing 700 mls of samples will be used in each jar test. Upon coagulant addition, the samples were rapidly mixed at 120 rpm for 1 minute and slowly mixed at 30 rpm for 10 minutes, and then allowed to settle for 10 minutes. Supernatants were collected and analyzed for nanoscale particle size distribution, TOC levels, zeta potential, turbidity and pH to determine the role of various parameters on coagulation of nanoscale materials in wastewaters.
2.4 Estimation of Energy Reduction Due to Removal of Nanoscale Suspended Particles This task evaluated i) the demand exerted by various size fractions of biogenic nanoparticles, and ii) net energy savings resulting from the removal of nanoscale particles using various pre-treatment techniques, during membrane treatment of the wastewaters used in this study. The underlying hypothesis of this evaluation is that, the pretreatment for removal of nanoscale foulants will lower the flux drop across the membrane, resulting in lower energy use during treatment. The relationship between the flux rate and energy demand can be expressed using the following equation:
Energy for Filtration (kWh) = F X (PA/A) X (2.31X0.746/3960) (1) Where, F = filtrate flow rate in liters/minute; Pa/A = Vacuum pressure per unit filter area (Psi).
The energy conserved due to removal of nanoscale particles through pretreatment were estimated using the following equation:
Econs (kWh) = (FT – FU) X (PA/A) X (2.31X0.746/3960) (2) Where, Econs is the energy conserved due to pretreatment for removal of nanoscale particles, FT is the flow rate of the pretreated secondary effluent, and FU is the flow rate for the untreated secondary effluent.

9
The flow rate for the two systems will be assessed after the time that is required for a drop of 95 % in flux rate for the untreated effluent.
2.5 Analytical Methods 2.5.1 Nanoparticle Counter Particle size distributions for nanomaterials in various samples were measured using a Malvern Zetasizer ZS sub-micron particle counter at UCI facility. This equipment has been successfully used for analyses of a variety of nanomaterials (e.g. nanosilica, nano zero-valent iron) from industrial and laboratory samples (16, 17). An output from the Zetasizer during analyses of secondary effluent from OCWD at UCI is shown in Figure 5. Nanoparticles distribution at 65 nm size range was effectively captured by the instrument. Zetasizer uses a non-invasive back scatter (NIBS®) technology that facilitates particle sizing to sensitivity in the 0.6 nm to 6 micron range. This is achieved by a combination of laser Doppler velocimetry and phase analysis light scattering (PALS) technique. Required sample volume is less than 1 ml.
Figure 5. Biogenic nanoparticle size distribution of the OCSD Secondary effluent measured using Malvern Zetasizer ZS at UCI Laser Spectroscopy Facility.
2.5.2 Other Supernatant Analytical Methods Samples were analyzed using Hach colorimeter (Hach Method 8000). Turbidity and pH analyzes were performed at UCI laboratory using Standard Methods.

10
CHAPTER 3: Project Outcomes The sections below summarize the results found in this study.
3.1 Fate and removal of nanoscale particles in existing treatment processes
• Primary influent, primary effluent, and secondary effluent samples were obtained from OCSD, SMWD, and IRWD treatment plants.
• Samples were filtered in series from 450 nm to 10 nm and the filtrate from each step was collected to be analyzed for particle size and sCOD.
3.1.1 OCSD Results
• There is a strong correlation seen in all figures between the count rate and pore size
• The count rate represents the number of particles in the sample
• The results show that at each sample point the number of particles (kcps) noticeably decreases due to the treatment process.
• At the 450 nm filtration step in the primary influent sample the count rate is highest at 600 kcps then decreases to approximately 450 kcps in the primary effluent and then finally to 175 kcps in the secondary effluent sample. Subsequent filtration steps show proportional decreases in the number of particles.
• sCOD results show that the soluble COD is not affect within these size ranges
Figure 6. This figure relates the filtration pore size to the count rate and sCOD of OCSD primary influent wastewater.

11
Figure 7. This figure relates the filtration pore size to the count rate and sCOD of OCSD primary effluent wastewater.
Figure 8. This figure relates the filtration pore size to the count rate and sCOD of OCSD secondary effluent wastewater.
3.1.2 IRWD Results
• The results were expected to be similar to OCSD due to similar treatment process
• However, primary influent has significantly less nanoscale particles compared to the primary effluent sample. This could be an isolated incident where primary effluent grab sample simply had more particles. It is possible that the removal of the larger particles thought the primary treatment process exposes the smaller nanoscale particles in solution.
• There is a strong correlation is seen in both primary influent and effluent figures between the count rate and pore size
• The secondary effluent sample shows low correlation which may be due to a relatively low number of particles in the 450 nm filtration step. This shows that particles are removed very well at this specific size range possible due to a higher MCRT.

12
Figure 9. This figure relates the filtration pore size to the count rate and sCOD of IRWD primary influent wastewater.
Figure 10. This figure relates the filtration pore size to the count rate and sCOD of IRWD primary effluent wastewater

13
Figure 11. This figure relates the filtration pore size to the count rate and sCOD of IRWD secondary effluent wastewater
3.1.3 SMWD Results
• We see a similar trend however the count rate is significantly higher in all the samples. This may be due to the characteristics of the wastewater that SMWD receives. Also the treatment process (trickling filtration) may not be as effective at removing smaller nanoscale particles.
Figure 12. This figure relates the filtration pore size to the count rate and sCOD of SMWD primeary influent wastewater
Figure 13. This figure relates the filtration pore size to the count rate and sCOD of SMWD primeary effluent wastewater

14
Figure 14. This figure relates the filtration pore size to the count rate and sCOD of SMWD secondary effluent wastewater
3.1.4 Particle Removal through the Treatment Process • The figures below show relatively how much particles are removed after the secondary
treatment process compared to the number of particles in the primary influent sample.
• OCSD shows more than 50% removal of up to 80 nm particles. Particles smaller than 50 nm show no removal.
• IRWD shows significant removal of nanoscale particles at almost all size ranges.
• SMWD shows approximately 50% removal at the higher filtration sizes (450, 100, and 80 nm) but actually show production of nanoparticles at the smaller size ranges (200, 50 and 30nm).
Figure 15. This figure shows the removal of particles at OCSD’s secondary effluent sample relative to the the number of particles in the primary influent sample

15
Figure 16. This figure shows the removal of particles at IRWD’s secondary effluent sample relative to the the number of particles in the primary influent sample
Figure 17. This figure shows the removal of particles at SMWD’s secondary effluent sample relative to the the number of particles in the primary influent sample
3.1.5 Comparison of Treatment Plants • The figures below compares the particle count at each of the sampling points
• Primary influent and effluent samples show similar results for all treatment plants. All three of the treatment plants use the same process.
• However the secondary treatment process differs for each treatment plant so it was expected that the results would differ.
• At the higher filtration sizes (450 and 200 nm) SMWD has many more particles compared to the other plants. This suggest that the trickling filter process may promote shedding of the nanoscale particles
• IRWD is shown to have fewer particles than the other treatment plants. As discussed before this may be due to a higher MCRT

16
Figure 18. This figure compares the number of particles in the primary influent samples of all three treatment plants at each filtration step
Figure 19. This figure compares the number of particles in the primary effluent samples of all three treatment plants at each filtration step

17
Figure 20. This figure compares the number of particles in the secondary effluent samples of all three treatment plants at each filtration step
3.2 Potential impact of nanoscale material on flux in certain filtration membranes
• This experiment develops a relationship between nanoparticle size and membrane type.
• Secondary effluent samples from the three treatment plants was filtered and run through flux experiments using MF and UF fibers.
3.2.1 Flux Analysis of Polypropylene Membranes • As expected the fouling of the membranes increases with larger particles however the
100nm pre-filtered sample still show significant fouling or the same time span.
• When comparing the three plants IRWD is shown to have the highest flux of all the samples. This is likely due to cleaner water, which is also discussed in task 1 results.
• SMWD samples fouled much more rapidly compared to the other plant. This is likely due to the higher number of particles after the secondary treatment. This is also seen in the task 1 results
Figure 21. This figure shows the reduction in flux due to fouling of a polypropylene membrane for OCSD secondary effluent sample

18
Figure 22. This figure shows the the number and size of the particles with in OCSD feed samples used in the flux reduction experiments.
Figure 23. This figure shows the the number and size of the particles with in OCSD permeate samples used in the flux reduction experiments.

19
Figure 24. This figure shows the reduction in flux due to fouling of a polypropylene membrane for IRWD secondary effluent sample
Figure 25. This figure shows the the number and size of the particles with in IRWD feed samples used in the flux reduction experiments.

20
Figure 26. This figure shows the the number and size of the particles with in IRWD permeate samples used in the flux reduction experiments.
Figure 26. This figure shows the reduction in flux due to fouling of a polypropylene membrane for SMWD secondary effluent sample
21
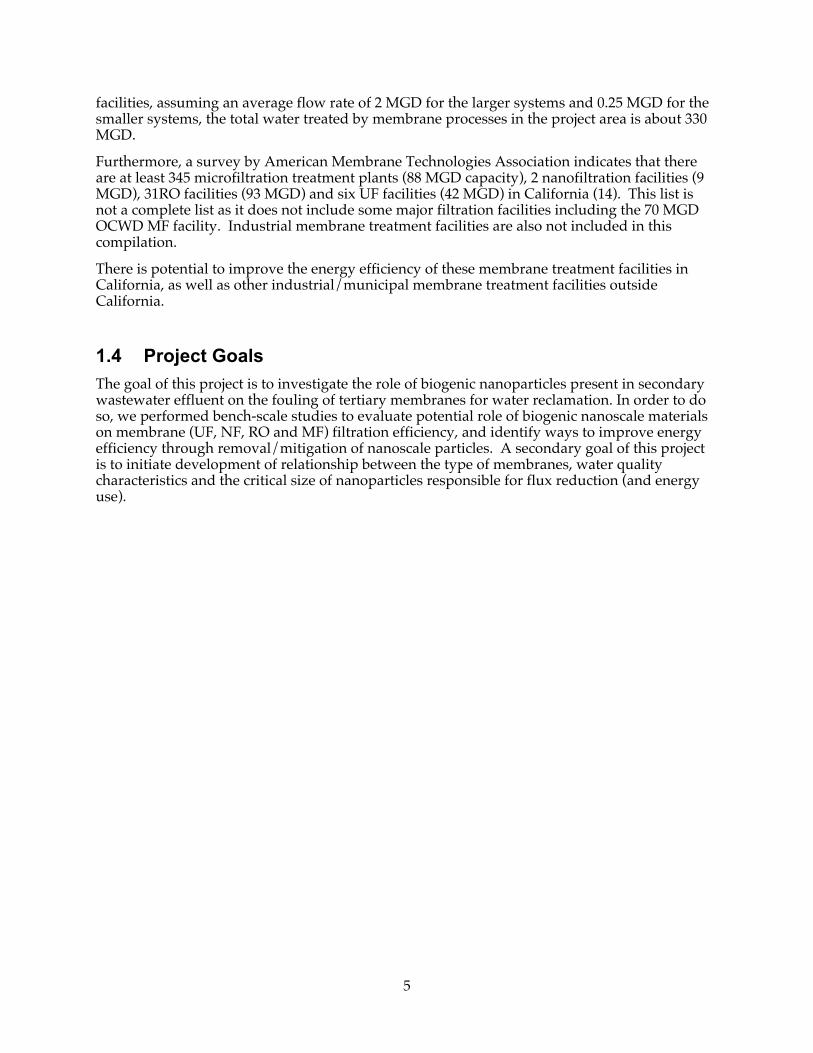
Figure 27. This figure shows the the number and size of the particles with in IRWD feed samples used in the flux reduction experiments.
Figure 28. This figure shows the the number and size of the particles with in SMWD permeate samples used in the flux reduction experiments 3.2.2 Flux Analysis of PVDF Membranes
• According to the figures below there is the same trend as polypropylene membranes where samples with larger particles foul the membrane more rapidly.
• SMWD results are not as clear due to more particles within the samples.
• IRWD again shows the least fouling due to clean secondary effluent water

22
Figure 29. This figure shows the reduction in flux due to fouling of a PVDF membrane for OCSD secondary effluent sample
Figure 30. This figure shows the the number and size of the particles within OCSD feed samples used in the flux reduction experiments

23
Figure 31. This figure shows the the number and size of the particles within OCSD permeate samples used in the flux reduction experiments
Figure 32. This figure shows the reduction in flux due to fouling of a PVDF membrane for IRWD secondary effluent sample

24
Figure 33. This figure shows the the number and size of the particles within IRWD feed samples used in the flux reduction experiments
Figure 34. This figure shows the the number and size of the particles within OCSD permeate samples used in the flux reduction experiments

25
Figure 35. This figure shows the reduction in flux due to fouling of a PVDF membrane for SMWD secondary effluent sample
Figure 36. This figure shows the the number and size of the particles within SMWD feed samples used in the flux reduction experiments

26
Figure 37. This figure shows the the number and size of the particles within SMWD permeate samples used in the flux reduction experiments
3.3 Pretreatment to remove nanoscale suspended particles • This section discusses the removal of nanoscale particles using
coagulation/precipitation techniques
• Generally, all the coagulants show very similar trends at similar coagulant concentrations and no one coagulant appears to stand out significantly
• Ferric chloride and alum appear to lower the COD and turbidity slightly more the sumaclear at equivalent concentrations but not by much
• The count rate shows similar results for the sumaclear and ferric chloride. However, alum appears to vary in the unfiltered and filtered samples. In the unfiltered results the Alum appears to not remove as many particles as the other coagulants at similar coagulant concentrations. However, in the filtered results it appears that the alum removes these particles noticeably better than the other coagulants. So alum is able to coagulate smaller particles better than others but many of the particles do not become big enough to readily settle out of solution compared to the other coagulants at higher coagulant concentrations
• In terms of particle size it difficult to see a clear trend with all the results. Generally, it appears the particle size increases with increasing coagulant concentration. Some result show particle sizes increasing up to about 50 mg/l concentration but then stabilizes or decreases in size. This shows particles are agglomerating and increasing in size but at a certain coagulant concentration the particles become big enough to settle out of solution which does not add to the results.

27
Figure 38. This figure relates the concentration of the coagulant to the relative sCOD removal for SumaClear 1000, ferric chloride, and alum of unfiltered samples
Figure 39. This figure relates the concentration of the coagulant to the relative sCOD removal for SumaClear 1000, ferric chloride, and alum of 450 nm filtered samples
Figure 40. This figure relates the concentration of the coagulant to the relative number of particles removed by SumaClear 1000, ferric chloride, and alum of unfiltered samples
28
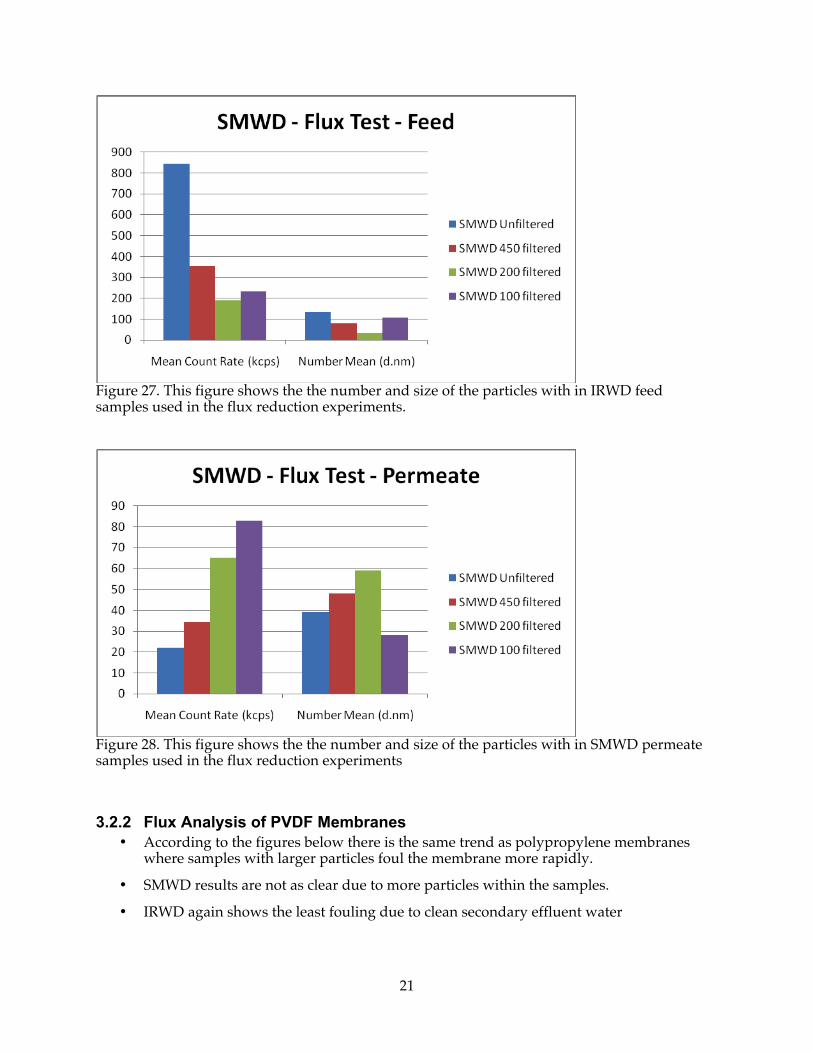
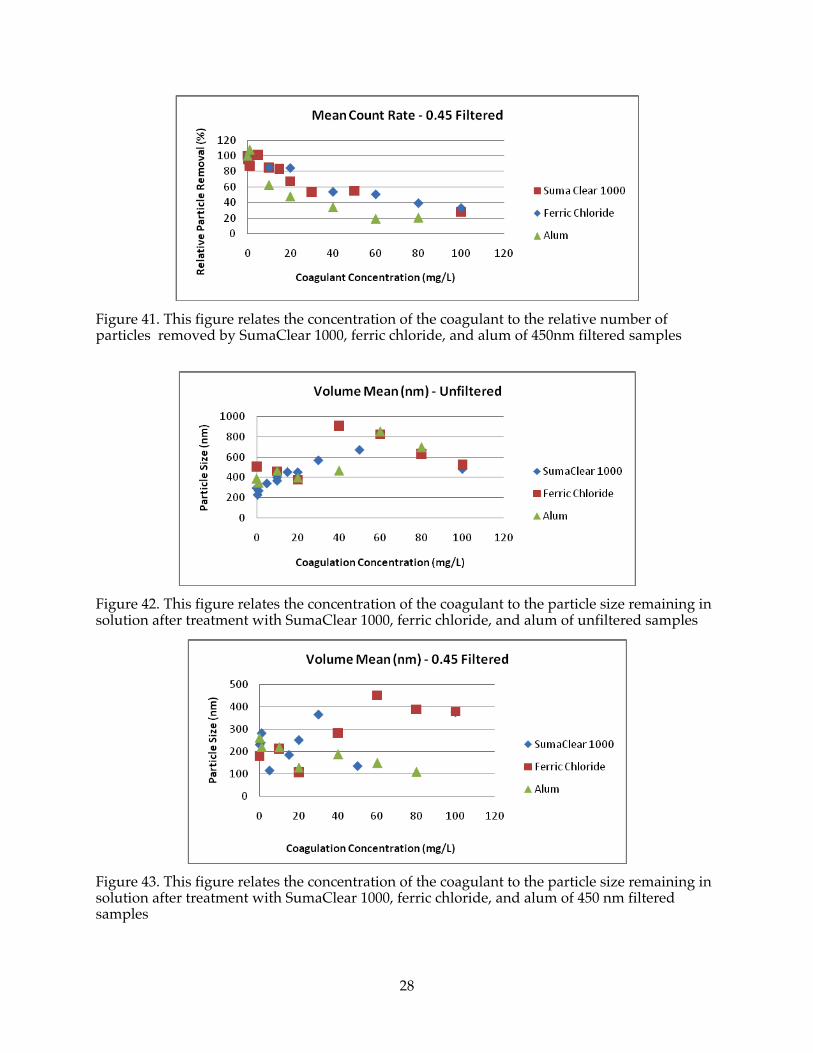
Figure 41. This figure relates the concentration of the coagulant to the relative number of particles removed by SumaClear 1000, ferric chloride, and alum of 450nm filtered samples
Figure 42. This figure relates the concentration of the coagulant to the particle size remaining in solution after treatment with SumaClear 1000, ferric chloride, and alum of unfiltered samples
Figure 43. This figure relates the concentration of the coagulant to the particle size remaining in solution after treatment with SumaClear 1000, ferric chloride, and alum of 450 nm filtered samples

29

30
APPENDIX A: Common Editor / Proofreading Marks