Embed Size (px)
Citation preview
DEGREE PROJECT IN STRUCTURAL ENGINEERING AND BRIDGES,SECOND CYCLE, 30 CREDITSSTOCKHOLM, SWEDEN 2020
Optimization ofgeometric roaddesign forautonomous vehicle
Prabin Aryal
KTH ROYAL INSTITUTE OF TECHNOLOGYSCHOOL OF ARCHITECTURE AND THE BUILT ENVIRONMENT

AuthorPrabin Aryal
TRITAABEMBT20773Department of Civil and Architectural EngineeringDivision of Structural Engineering and BridgesKTH Royal Institute of TechnologyStockholm, Sweden
ExaminerNicole KringosStockholm, SwedenKTH Royal Institute of Technology
Supervisor
Romain Balieu
Stockholm, Sweden
KTH Royal Institute of Technology
iii

Abstract These days most of the research related to autonomous vehicle technology focuses on vehicle
technology itself and lesser on road infrastructure, including geometric design. This research
project aims to lower the deficiency of research works required to make the optimized
geometric road design for autonomous vehicle sustainable. In geometric design, significant
concerns are designing the road geometrics such as lane width, the radius of horizontal
curves, sag vertical curves and crest vertical curves, extra widening, setback distance, and
intersection, making the road safer for the vehicles to travel comfortably.
Road geometrics is widely designed using the stopping sight distance model, which provides
sufficient time to avoid accidents and is efficient. Here in the research work, the stopping
sight design model is used for autonomous vehicle technology. At first, the art of autonomous
vehicle technology is studied, and a significant difference between autonomous vehicle
technology and human-driven vehicle to apply stopping sight distance model is figured out. A
literature study is also done for the geometric design of the road for the vehicle with the
human driver and autonomous vehicle. The AASHTO model derived for the human-driven
vehicle is used and modified for the autonomous vehicle, which gives the optimized
geometric design for the autonomous vehicle. The Optimized geometric design parameter is
designed individually in AutoCAD Civil 3D. Two road designs follow this in a random rural
topography consisting of a normal road design for the vehicle with the human driver and a
fully autonomous vehicle. Finally, the sustainability of optimized geometric design compared
to road design for the human-driven vehicle is checked in terms of earthwork, pavement
surface areas, and pavement materials volume. The result shows that the optimization of a
geometric road design for autonomous vehicles is sustainable and extensive research is
required.
Keywords Autonomous vehicle, Optimization, Geometric design, Highway, Road, AutoCAD Civil 3D,
Sustainability, Self-driving car, Vehicle with a human driver, Radius, Horizontal curve,
Vertical Curve, Earthwork
Sammanfattning
Nu för tiden är forskningen kring autonom fordonsteknik mestadels fokuserad på själva
fordonstekniken och mindre på väginfrastrukturen, inklusive geometriska design. Således
syftar detta forskningsprojekt till att minska arbetsinsatsen för att göra den optimerade
geometriska vägkonstruktionen för autonoma fordon hållbar.
I geometrisk design är det stora problem att utforma väggeometrierna som körbredd, radie av
horisontella kurvor, hängande vertikala kurvor och krönt vertikala kurvor, extra vidgning,
baklängesavstånd och korsningar som gör vägen säkrare för fordonet och gör det möjligt att
resa bekvämt.
Väggeometri är allmänt utformad med hjälp av en stoppsiktmodell som ger tillräckligt med tid
för att undvika olyckor. Stoppsiktsmodellen är en effektiv modell och används i detta arbete
för autonom fordonsteknik.
Först studeras autonoma fordon och jämförs med fordon med en mänsklig förare. Jämförelsen
används sedan för att räkna ut hur stoppsiktsmodellen kan tillämpas för autonoma fordon.
En litteraturstudie utförs för geometrisk design av väg för fordon med mänsklig förare och
autonomt fordon. Sen modifieras en AASHTO modell för mänskligt kontrollerade fordon till
autonoma fordon, vilket resulterar i den optimerade geometriska designen för autonoma
fordon. Optimerad geometrisk designparameter konstrueras individuellt i AutoCAD civil 3D.
Detta följs av två vägkonstruktioner i en slumpmässig topografi bestående av normal
vägkonstruktion för fordon med mänsklig förare och en konstruktion för autonomt fordon.
Slutligen kontrolleras hållbarheten för den optimerad geometrisk designen för autonoma
fordon med vägkonstruktionen för fordon med mänsklig förare i termer av markarbete,
beläggningsytor, beläggningsmaterialvolym. Resultatet visar att optimering av geometrisk
vägkonstruktion för autonoma fordon är hållbar och omfattande forskning i denna riktning
krävs.
Nyckelord
Autonomt fordon, Optimering, Geometrisk design, Motorväg, Väg, AutoCAD Civil 3D,
Hållbarhet, Självkörande bil, Fordon med mänsklig förare, Radie, Horisontell kurva, Vertikal
kurva, Markarbete
Abbreviations and symbols
Abbreviations
AASHTO American Association of State Highway And Transportation Officials
AV Autonomous Vehicle
AADT Annual Average Daily Traffic
DSD Decision sight distance
EU Europian Union
HSO Horizontal sightline Offset
NHTSA National Highway Transportation Safety Administration
PCE Passenger Car Equivalent
PSD Passing sight distance
SAE Society of Automotive Engineering
SSD Stopping sight distance
VHD Vehicle with Human Driver
Symbols
a acceleration rate, m/s2
R radius of the curve
V design speed, Km/h
v vehicle speed, m/S
e superelevation
f fractional factor
g acceleration due to gravity

Preface
This thesis work is conducted at KTH Royal Institute of Technology of Sweden, department
of structural Engineering and bridges, under the supervision of Dr. Romain Roger Balieu.
This research thesis is related to sustainable optimization possibilities of geometric design of
road for an autonomous vehicle using AutoCAD civil 3D software.
I want to thank my supervisor Romain for providing valuable suggestions, showing directions
and correcting when required throughout the project. I am greatly indebted to his constant
support, deep interest in this futuristic research topic and motivation for better output
continuously. I would also like to thank my thesis examiner, professor Nicole Kringos, for
providing valuable comments with inspiration for the improvement of this thesis work.
I would also like to thank Senior Highway Engineer Prem Lamsal for sharing his working
experience and expertise to make the thesis work more productive. I would also like to thank
my mentors, family members, friends and relatives who always motivated me throughout the
journey. My uncle’s family, based in Gothenburg, Sweden, has provided me enormous
support, encouragement and love, for which I am forever grateful. Most importantly, I would
also like to remember my late mother, who always inspired, nurtured me with her love, care
and guidance during my childhood, which became the strong foundation for transforming me
into a graduated Engineer. This thesis work is dedicated to my parents and sisters for their
endless love, support, and encouragement, without which this piece of work would not have
been possible.
Stockholm, December 2020
Prabin Aryal
Contents
1 Introduction ......................................................................................................................... 7
1.1 Background And Motivation ....................................................................................... 7
1.2 Current Research Status ............................................................................................... 8
1.3 Aim and scope of Research ....................................................................................... 10
1.3.1 Aim of research .................................................................................................. 10
1.3.2 Scope of research ............................................................................................... 10
1.4 Methodology .............................................................................................................. 10
2 Literature Study ................................................................................................................. 11
2.1 State Of Art On Autonomous Vehicle Technology ................................................... 11
2.1.1 Level of Automated Driving .............................................................................. 12
2.1.2 Autonomous vehicle technology and supportive infrastructure ......................... 13
2.1.3 Impacts of Interconnected Autonomous Vehicle ............................................. 16
2.2 Geometric Design of Road ........................................................................................ 19
2.2.1 Control Criteria for Geometric design ............................................................... 19
2.3 Elements of Geometric Design of Road .................................................................... 22
2.3.1 Sight Distance .................................................................................................... 22
2.3.2 Cross-Section ..................................................................................................... 24
2.3.3 Horizontal Alignment ......................................................................................... 25
2.3.4 Vertical Alignment ............................................................................................. 28
2.3.5 Grades ................................................................................................................. 31
2.3.6 Intersection ......................................................................................................... 31
2.4 Geometric design parameter for Autonomous vehicle .............................................. 37
2.4.1 Lane width .......................................................................................................... 37
2.4.2 Sight Distance .................................................................................................... 38
2.4.3 Horizontal Alignment ......................................................................................... 39
2.4.4 Vertical Alignment ............................................................................................. 39
3 Geometric Design parameter optimization for autonomous vehicle ................................. 43
3.1 Stopping Sight Distance ............................................................................................ 43
3.2 Passing sight distance ................................................................................................ 45
3.3 Lane width ................................................................................................................. 46
3.4 Horizontal curve radius according to sight distance requirements ............................ 47
3.5 Extra widening in horizontal curves .......................................................................... 50
3.6 Minimum Setback Distance ....................................................................................... 52
3.6.1 Vertical Alignment ............................................................................................. 54
4 Case Study of Road Design ............................................................................................... 60

4.1 Results and Discussions ............................................................................................. 62
5 Conclusion and Future Works ........................................................................................... 63
6 References ......................................................................................................................... 65
7 Appendix ........................................................................................................................... 67
1 Introduction
1.1 Background And Motivation
Road transportation has become the most effective means of transportation for several
centuries, and advancement within road transportation is going on. Road transportation has
various advantages over other means of transportation. But also, it comes up with several
challenges that require to be addressed for sustainable transport. It comes with a vast number
of road accidents and casualties every day in road accidents because human error is the cause
most of the time. Also, the transportation industry is ranked as one of the significant
contributors to greenhouse emissions. The growing usage of private vehicles is affecting our
environment with a massive amount of carbon emission.
Moreover, research suggests that almost 95% of the time, private vehicles are idle, which
indicates the necessity of vehicles for a shorter duration and requiring more parking
requirements only(Fortune website). With the introduction of self-driving cars, this situation
could be changed, and the vehicle can be operating on the road all the time safely and with
lesser environmental impacts. The research is going on towards making sustainable
autonomous vehicle technology. The autonomous vehicle is defined by SAE (The society of
automotive Engineers) as the vehicle that can operate on the road without requiring any
human assistance and possessing artificial intelligence to make decisions and operate. Also,
the development of autonomous vehicle technology is advancing for several decades. In
recent years, advancement is more rapid, and it seems the road might have a significant
amount of autonomous vehicle traffic soon.
At present, the roads are occupied with the vehicle with the human driver (VHD), and the
geometric design of the road is done considering the human driver to operate the vehicle. The
highway's geometric design elements consist of horizontal and vertical alignment, sight
distances, superelevation, horizontal and vertical curves, carriageway width, design speed,
and other roadside features to have safe and efficient road transportation. These factors are
different for human-driven vehicles and autonomous vehicles as these factors depend on the
perception by the human brain and decision making for the traditional vehicle. In contrast,
interconnected autonomous vehicle technology will reduce the error and reduce geometrical
elements requirements. The reason behind differences is that while measuring by human eyes,
it is prone to error. But by using interconnected autonomous vehicles with proper machine
vision technology, it is less prone to error. The space requirement for human error can be
optimized, thus requiring narrow streets and sharp curves. The roads are currently being
designed based on human drivers' limitations, such as reaction time, sight distance, and
human errors in approximation. So, the minimum value of geometric design parameters
required for a human-driven vehicle is higher than for autonomous vehicles. However, if
autonomous vehicles can optimize these limitations, we can optimize roads' geometric design
for fully autonomous vehicles and make sustainable transportation infrastructure.
An autonomous vehicle requiring lesser sight distance and efficient and narrow road path will
help the rapid construction of roads, reduce climatic impact, and save more money in the long
run that needs to be spent on road infrastructure. Thus, determining how to optimize roads'
geometric design for safer, environmental, and economical friendly roads for autonomous
vehicles is of primary importance. Geometric design optimization of the road for autonomous
vehicles determines the road's proper and efficient design dimensions for autonomous
vehicles.

According to UN Envision 2030, providing everyone with safe, accessible, and sustainable
transport systems is one of 17 sustainable development goals. This agenda is well supported
by all UN member states, including the European Union, and Sweden has already started
working for it since 2015 while continuing its vision zero policy in 1997. This sustainable
transport infrastructure goal can only be achieved by the sustainable transport system
involving a fully autonomous vehicle.
Globally, the research work is more focused on autonomous vehicle technology itself. Some
minor steps are only being taken towards smart transportation infrastructure, such as
electrified roads that can charge the vehicle while driving on the road. The transportation
industry cannot be sustainable if the transport infrastructures are not sustainable along with
vehicle technology. Once the autonomous vehicle technology is finalized and proved
sustainable and is ready to join the traditional vehicle fleet or eliminate the human-driven
vehicle fleet from the roads, the road should be safer and efficient enough for operating
autonomous vehicles. However, there has been very limited research in optimizing the road's
geometric requirements for an autonomous vehicle, which is of paramount importance and
concern right now to make the road sustainable for the fully autonomous vehicle.
Nevertheless, having fully autonomous traffic on the roads is not very probable in near future.
Initially, autonomous vehicles share the existing road infrastructures with a significant
proportion of human-driven vehicles during the transition phase. So, proper geometric design
study should be done for mixed traffic conditions separately. Nevertheless, in the case of a
closed environment such as the mining industry, ports, transporting goods, etc., the geometric
design can be optimized for fully autonomous vehicles.
By formulating the geometric design parameters of the road for an autonomous vehicle
followed by an application in the real case scenario of road design, it is possible to assess the
sustainability of road design for an autonomous vehicle fleet. So, this research thesis is
focused on reducing those uncertainties in the geometric design of road for autonomous
vehicles by understanding the autonomous vehicle technology, determine the possible
geometric design parameter that can be optimized for autonomous vehicle technology, and
optimize it for the closed environment based on their geometric design requirements and
assessing the sustainability of those optimized road design.
1.2 Current Research Status
Khouri et al. (2019) state that vehicles' autonomous level can range from zero level to level 5,
i.e., requiring a human driver to fully autonomous vehicle, which requires no driver at all for
driving. In the article, authors have stated the two types of models for geometric design of the
road, namely stopping sight distance (SSD) and decision sight distance (DSD) model. SSD
model represents the design of geometric parameters of road, considering the vehicle must
have the ability to be stopped safely when required. In the decision sight distance model, the
driver should have sufficient sight distance to detect obstacles and perform suitable action as
required. In the paper, the authors state that eliminating a human driver will affect SSD and
DSD models. In the SSD model, they cite that the perception reaction time could be reduced.
The AASHTO model can be modified with reduced perception reaction time value and
stopping sight distance can be calculated. The SSD value for level roads and roads on grade
was calculated using braking time as 0.5 seconds for autonomous vehicles. However, the
DSD model is also presented, which is important for an unexpected situation when an
autonomous vehicle needs to act instantaneously. In this case, five types of avoidance
maneuvers have been introduced and applied with the braking time of 0.5 seconds. However,
Chris et al. (Autonomous Braking, A Comparative Study of Human, Hybrid and Autonomous
Braking Control for Cars) discusses the safety mechanism of an autonomous braking system
along with the hybrid system and found out PRT for an autonomous vehicle to be around
0.2seconds.
In the SSD model, Khouri et al. (2019) consider the perception reaction time for the human-
driven vehicles to be 2.5 seconds from the AASHTO model and apply a reduced value to be
0.5 seconds braking time for an autonomous vehicle. Khouri et al. have developed the vertical
curve's geometric design only based upon the stopping sight distance and decision sight
distance model. However, it lacks the consideration of THE horizontal curve. Horizontal
alignment also differs and should be considered in the design for the road with an autonomous
vehicle.
Washburn and Washburn (2018) consider that geometric design standards will not
significantly change than non-autonomous vehicles based on driving dynamics or vehicle
performance. However, they also mentioned that the reaction time required will be very low
for the machine to act autonomously during object detection and braking. It will eventually
reduce the geometric design of roads. For vertical curve design, Khouri et al. suggested the
AASHTO model equation. They applied it as an analogy in the case of autonomous vehicle
updating the LIDAR sensor height for the WAYMO model. However, this value depends on a
different model of autonomous cars with different LIDAR sensors' height. For example,
Waymo’s autonomous car has a sensor height of 1.84 meters.
Autonomous vehicles from different companies like Waymo, Volvo, Tesla, Audi are being
tested. Eldada L (2014) claims LIDAR to be the most effective sensor among other sensors
used for object detection in autonomous vehicles. Most of the autonomous vehicles of present
days under development phases use LIDAR and are considered effective. Autonomous
vehicle manufacturer, Waymo’s website states their self-driving car uses LIDAR technology
equipped with other camera sensors that are even effective during night time. Volvo, the
vehicle manufacturing company, has also been working with US-based LIDAR sensors
company Luminar for using the LIDAR sensors in its autonomous vehicles. Valeo, the driving
assistance sensors company, manufactures LIDAR sensors and claims to be manufacturing in
huge numbers in the future too. So, it can be inferred that LIDAR technology equipped with
camera sensors can be the most probable sensing technology in an autonomous vehicle.
From the literature studied, it can be observed that the researches are being focused on
vehicular technology more, and very few types of researches are done in the field of
geometric design of road for the autonomous vehicle. Some researches that have been done
also are based on only a few of the geometric design elements, such as Khouri et al. focusing
on only horizontal and vertical curves. The researchers are also following road design
guidelines from different countries directly or indirectly motivated by AASHTO guidelines.
These research papers are not inclusive of the geometric design of the road as a whole for the
autonomous vehicle. These papers have just initiated to point out that there will be differences
in geometric design parameters for the road for an autonomous vehicle. Also, the
sustainability of the revised geometric design is not checked. So, the research in formulating
the new geometric design guidelines for an autonomous vehicle is significantly important.
Here, the optimization is done considering the road for fully autonomous vehicles operating in
a closed environment.
1.3 Aim and scope of Research
1.3.1 Aim of research
To facilitate the autonomous vehicle to take on the road once the vehicle technology is
finalized and mass production starts, this thesis aims to contribute to it by meeting the
following objectives.
Finding out the geometric design parameters of road that can be optimized,
eliminating human driver as a vehicle operator considering the state of the art of
autonomous vehicle technology.
Formulate the new geometric design requirements of the road for autonomous
vehicles.
Design the road for autonomous vehicles and compare with the design of road for
human-driven vehicle.
Suggest whether the optimization of the road for autonomous vehicles is overall
sustainable or not.
1.3.2 Scope of research
The research work consists of design optimization for the autonomous vehicle in the case of
closed environment such as mining industry, ports, for goods transportation etc. It also does
not include the cost estimation for the construction of road. During sustainability study,
sustainability in terms of earthwork, safety, efficient dimensions are considered but not cost
aspect. Also, mixed traffic conditions is considered for future studies but not for this research.
1.4 Methodology
The thesis work methodology includes the four steps procedure for achieving the thesis's
overall objective, including literature study, optimization of geometric design parameters,
assessing the sustainability of the individual geometric design parameters, and a case study.
Case study involves optimized road design for autonomous vehicles and human-driven
vehicles using AutoCAD Civil 3D software and assessing the sustainability of overall
optimized road design for the autonomous vehicle.
1. Literature Study
A study about autonomous vehicle technology and its working principle needs to be done to
differentiate between traditional vehicle technology and autonomous vehicle technology. This
will also provide proper insights while dealing with the geometric design requirements for
autonomous vehicle technology. Apart from this, a literature study about geometric design
parameters of the road for human-driven vehicles and the autonomous vehicle is done, which
follows determining geometric design parameters that can be optimized for road design for an
autonomous vehicle.
2. Optimization of geometric design parameters of road
After finding the geometric design parameters that can be optimized in the case of a road
design for an autonomous vehicle, those parameters are carefully studied, and new design
requirements are formulated for an autonomous vehicle, which is termed as optimized
geometric design requirements for the fully autonomous vehicle. Here, many of the
parameters are optimized, taking AASHTO road design guidelines, AASHTO 2011 (green
book). AASHTO stands for the American Association of State Highways and Transportation
Official, which is responsible for regulating road design guidelines in the USA and its
guidelines are widely accepted throughout the world. It is prepared by extensive study and is
comprehensive and supportive towards the formulation of design requirements for
autonomous vehicles. The optimization is done by calculation, or it’s more theoretical
approach optimization.
3. Assess the individual optimized parameters' sustainability compared to the vehicle
parameters with a human driver (VHD).
The optimized parameters are considered assuming some specific relevant conditions and
checked on the specific optimization's sustainability using AutoCAD Civil 3D software from
Autodesk, comparing it with the human-driven vehicles' parameters.
4. Case study of optimized road Design using AutoCAD Civil 3D and assessing
Sustainability
Finally, the task is to do a case study on a fictitious environment having mountainous
topography and design the road in rural areas with a convenient situation to try out to include
all the possible optimized parameters for road design. The design will include the road design
for the human-driven vehicle (VHD) and autonomous vehicle. After the design, sustainability
is assessed in comparison with the road design for a traditional vehicle.
2 Literature Study
2.1 State Of Art On Autonomous Vehicle Technology
Self-driving vehicles or autonomous vehicles are defined as vehicles capable of operating safely with
the help of sensors and software to control, navigate and drive without human interference (Union Of
concerned Scientists, 2017). The fully autonomous vehicle is being tested by various companies like
Waymo (former Google Autonomous vehicle), Apple, Baidu, Audi, Volvo, etc. (Diaz, et al., 2018).
All the automated vehicles are not the autonomous vehicle as they have various automation levels,
ranging as in following section 2.1.1 along with the specific functions in various automation levels.
2.1.1 Level of Automated Driving
According to the National Highway Traffic Safety Administration, USA, the level of vehicle
automation varies from level 0 of automation to Automation level 4 and is described as following:
Level 0 (No Automation)
In this automation level, the vehicle is solely controlled by the driver himself, and the driver support
system could assist the driver. However, steering, braking and throttling are controlled by the driver.
Vehicles having secondary controls such as wipers, hazard lights, headlights automated also lie at this
level (NHTSA, 2013).
Level 1 (Function-specific Automation)
In this level of automation, some particular control functions are automated without those functions
being in unison. In case more than one function being automated, they work independently and only
assist the driver for the safe and efficient operation. These automated assistive functions reduce the
control needed but will not allow the driver to completely disengage from using any primary control
functions such as steering, braking, /throttling. Some examples of assistive functions include dynamic
brake support while in an emergency, adaptive cruise control, lane-keeping, etc. (NHTSA, 2013).
Level 2 (Combined Function Automation)
In this level of automation, at least two primary functions work in unison. In level two of automation,
the driver must take control of the vehicle when needed but temporarily can become detached from
specific functions such as control steering and accelerator simultaneously. The driver must be
available to quickly take control of the vehicle as the automated system can stop taking control
without pre-warning. An example of usage of automation level 2 can be seen in adaptive cruise control
along with lane-keeping (NHTSA, 2013).
Level 3 (Limited Self-Driving Automation)
In automation level 3, the vehicle is designed to operate safely fully autonomously in a certain
environment without the driver taking any control. When the driving environment changes occur, the
driver must take control in available sufficient transition time and operate further. An example of such
an automation system is an autonomous car, which can sense when the system cannot continue driving
autonomously when changes in the driving environment occur and informs the driver to take manual
control in sufficient time. The autonomous system is regularly monitoring the roadway, which
distinguishes it from automation level 2 (NHTSA, 2013).
Level 4 (Full Self Driving Automation)
In this mode, the vehicle operates fully autonomously without any human driver's involvement during
the trip. The vehicle can monitor the roadway and operate on its own after providing the destination
only. The vehicle can be carrying passengers or completely unoccupied as the design involves all the
safety systems to make it completely driverless (NHTSA, 2013). According to SAE, the level of
automation is classified into level 0 to 5, while level 3 in NHTSA classification is subdivided in to
level 3, and level 4 by SAE and the fully autonomous vehicle lies in level 5 according to SAE
classification (SAE International, 2018).
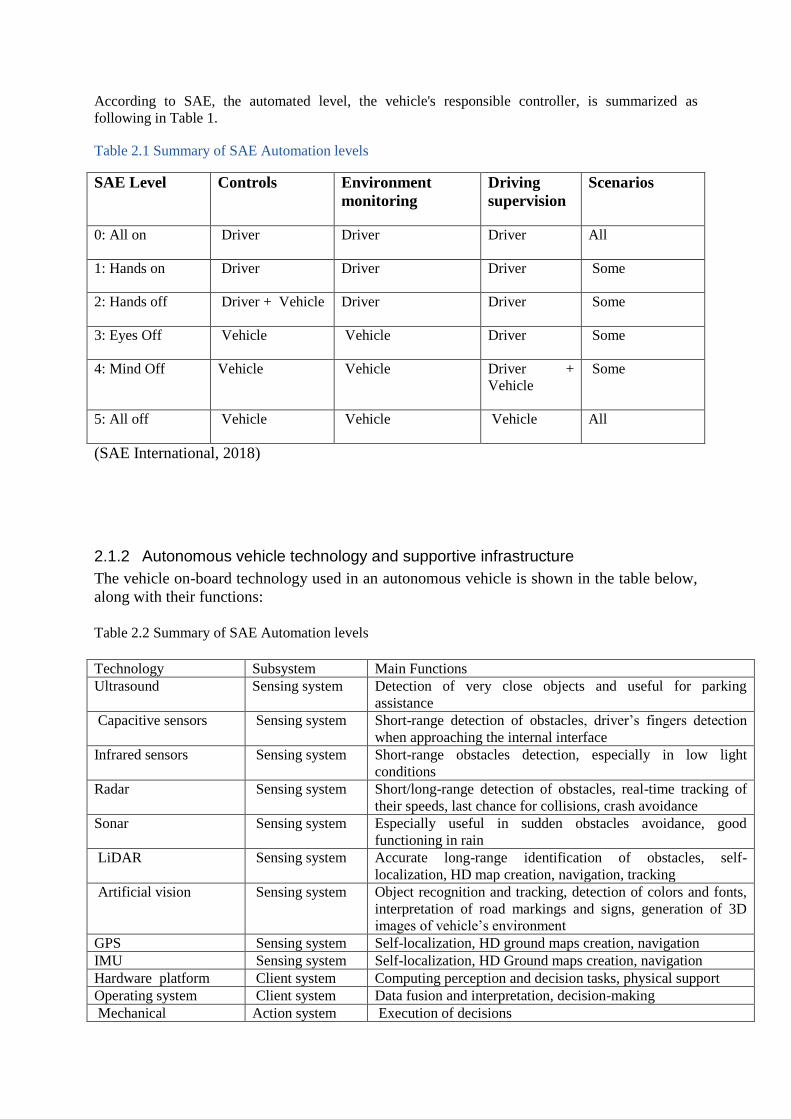
According to SAE, the automated level, the vehicle's responsible controller, is summarized as
following in Table 1.
Table 2.1 Summary of SAE Automation levels
SAE Level Controls Environment
monitoring
Driving
supervision
Scenarios
0: All on Driver Driver Driver All
1: Hands on Driver Driver Driver Some
2: Hands off Driver + Vehicle Driver Driver Some
3: Eyes Off Vehicle Vehicle Driver Some
4: Mind Off Vehicle Vehicle Driver +
Vehicle
Some
5: All off Vehicle Vehicle Vehicle All
(SAE International, 2018)
2.1.2 Autonomous vehicle technology and supportive infrastructure
The vehicle on-board technology used in an autonomous vehicle is shown in the table below,
along with their functions:
Table 2.2 Summary of SAE Automation levels
Technology Subsystem Main Functions
Ultrasound Sensing system Detection of very close objects and useful for parking
assistance
Capacitive sensors Sensing system Short-range detection of obstacles, driver’s fingers detection
when approaching the internal interface
Infrared sensors Sensing system Short-range obstacles detection, especially in low light
conditions
Radar Sensing system Short/long-range detection of obstacles, real-time tracking of
their speeds, last chance for collisions, crash avoidance
Sonar Sensing system Especially useful in sudden obstacles avoidance, good
functioning in rain
LiDAR Sensing system Accurate long-range identification of obstacles, self-
localization, HD map creation, navigation, tracking
Artificial vision Sensing system Object recognition and tracking, detection of colors and fonts,
interpretation of road markings and signs, generation of 3D
images of vehicle’s environment
GPS Sensing system Self-localization, HD ground maps creation, navigation
IMU Sensing system Self-localization, HD Ground maps creation, navigation
Hardware platform Client system Computing perception and decision tasks, physical support
Operating system Client system Data fusion and interpretation, decision-making
Mechanical Action system Execution of decisions
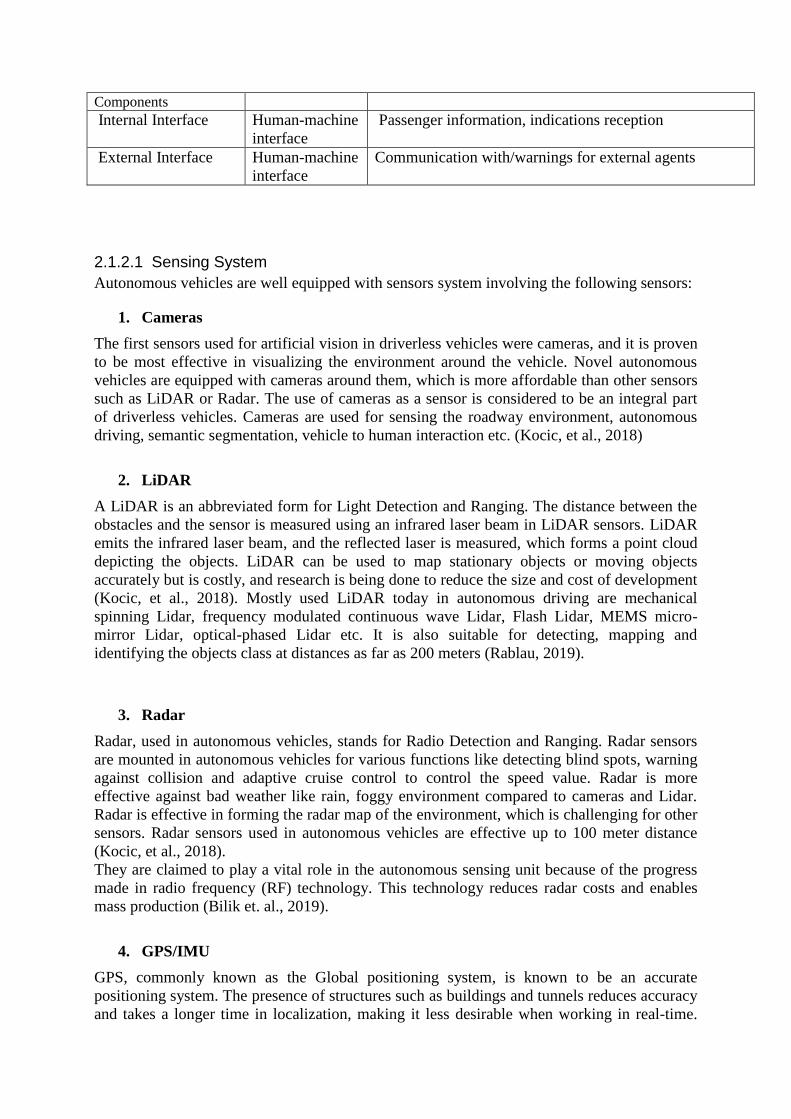
Components
Internal Interface Human-machine
interface
Passenger information, indications reception
External Interface Human-machine
interface
Communication with/warnings for external agents
2.1.2.1 Sensing System
Autonomous vehicles are well equipped with sensors system involving the following sensors:
1. Cameras
The first sensors used for artificial vision in driverless vehicles were cameras, and it is proven
to be most effective in visualizing the environment around the vehicle. Novel autonomous
vehicles are equipped with cameras around them, which is more affordable than other sensors
such as LiDAR or Radar. The use of cameras as a sensor is considered to be an integral part
of driverless vehicles. Cameras are used for sensing the roadway environment, autonomous
driving, semantic segmentation, vehicle to human interaction etc. (Kocic, et al., 2018)
2. LiDAR
A LiDAR is an abbreviated form for Light Detection and Ranging. The distance between the
obstacles and the sensor is measured using an infrared laser beam in LiDAR sensors. LiDAR
emits the infrared laser beam, and the reflected laser is measured, which forms a point cloud
depicting the objects. LiDAR can be used to map stationary objects or moving objects
accurately but is costly, and research is being done to reduce the size and cost of development
(Kocic, et al., 2018). Mostly used LiDAR today in autonomous driving are mechanical
spinning Lidar, frequency modulated continuous wave Lidar, Flash Lidar, MEMS micro-
mirror Lidar, optical-phased Lidar etc. It is also suitable for detecting, mapping and
identifying the objects class at distances as far as 200 meters (Rablau, 2019).
3. Radar
Radar, used in autonomous vehicles, stands for Radio Detection and Ranging. Radar sensors
are mounted in autonomous vehicles for various functions like detecting blind spots, warning
against collision and adaptive cruise control to control the speed value. Radar is more
effective against bad weather like rain, foggy environment compared to cameras and Lidar.
Radar is effective in forming the radar map of the environment, which is challenging for other
sensors. Radar sensors used in autonomous vehicles are effective up to 100 meter distance
(Kocic, et al., 2018).
They are claimed to play a vital role in the autonomous sensing unit because of the progress
made in radio frequency (RF) technology. This technology reduces radar costs and enables
mass production (Bilik et. al., 2019).
4. GPS/IMU
GPS, commonly known as the Global positioning system, is known to be an accurate
positioning system. The presence of structures such as buildings and tunnels reduces accuracy
and takes a longer time in localization, making it less desirable when working in real-time.
However, this deficiency can be fixed using inertial measurement units (IMU) in combination
with GPS (Diaz, et al., 2018).
Infrastructure Based Sensors (Roadside LiDAR)
The network of sensors equipped in the autonomous vehicle is crucial for the safer operation
of autonomous vehicles. However, focusing on sensors within autonomous vehicle
technology only is restrictive in terms of road safety and achieving system energy gains
compared to an integrated transportation system with enhanced infrastructure. Also, LiDAR
sensors cost almost half of the car's typical cost without LiDAR sensors these days, and it
might limit the proportion of vehicles equipped with LiDAR sensors in the future. So, an
integrated transportation system, including both vehicle-based and infrastructure-based
sensors, are required. One way of infrastructure enhancement is using LiDAR sensors on
intersections that can monitor the intersection areas with a 360-degree view and share
information with vehicles in that area. With this system, the vehicles around the intersection
area have more visibility of the intersections and help avoid accidents with lesser congestion
(Jun & Markel, 2014).
With the current connected vehicle system, it’s possible to know the real-time traffic
information of connected vehicles but not about the unconnected vehicles. So, it’s necessary
to adopt some mechanism to have information about unconnected vehicles. This can be done
by adopting the enhanced connected infrastructures capable of sensing the traffics' status
around it with LiDAR sensors and broadcasting this message to the connected vehicles. The
purpose of roadside LiDAR sensors is to (Cui, et al., u.d.).
2.1.2.2 Client System
It is like the brain for the autonomous vehicle system, which has the role of sensing the
environment, locating the vehicle, deciding the vehicles' next actions through sensors, the
fusion of sensors data, and deep learning techniques. A deep learning technique is a machine
learning process that effectively deals with big data with artificial intelligence (Diaz, et al.,
2018). The client system includes subsystems such as robotics operation systems and even
hardware platform. The system integrates algorithms such as localization and perception to
meet real-time and reliability requirements (Liu et. al., 2017).
2.1.2.3 Action System
The action system consists of the steering system, braking system and power train mechanism
that controls the steering of the wheel, stopping or reducing the vehicle's speed and providing
motion to the vehicle. Here, the client system's decisions are converted into action by the
action system (Diaz, et al., 2018).
2.1.2.4 Human-Machine Interface
The Human-machine interface includes the hardware and software fusion of autonomous
vehicles to facilitate passengers to interact with the vehicle system to get information about
the driving situation. The HMIs system can also include starting and stopping the system and
choosing the destination (Diaz, et al., 2018). The Human-machine interface should integrate
the following key functions: information acquisition and analysis, decision making and
execution. Similarly, for transparent HMI results, situation awareness, discomfort feeling and
participant’s preferences must be accessed and taken into accounts (Pokam et. al, 2019).
2.1.2.5 Communications
The advantages of an autonomous vehicle system can be taken only if the co-operation
between vehicle to vehicle, vehicle to infrastructure exists. V2V represents the vehicle to
vehicle interaction. V2I represents a vehicle to infrastructure, while V2X represents the
vehicle to everything interaction. V2I communications are necessary for managing the
efficient traffic flow and coordinating with the autonomous vehicle. The surveillance system
equipped with the infrastructure collects and analyses the data it shares with the vehicles
group and suggests explicit action in real-time.V2V communications are useful for
cooperation between vehicles operating close-by. V2v communication, when acting
coordinated with V2I, can work well for traffic management strategies.
There should also be common standards for communication models between different bodies
relevant to autonomous vehicle manufacture, operation, and governing bodies such as
manufacturers, government administrations, and tech companies to have common
understandings and effective communications. For interconnected autonomous vehicle
features, short and long-range communications are established (Diaz, et al., 2018).
2.1.2.6 Cloud System
The interconnected autonomous vehicle uses the complex process, CAD known as
cooperative autonomous driving. CAD is a sophisticated process that involves receiving,
sending and processing big data. For computing such data, on-board vehicle devices should be
supported by the external computing system like cloud platforms (Diaz, et al., 2018). As it is
now possible to transmit point cloud data for cooperative perception via an existing network.
An intelligent vehicle can combine its data with other vehicles and surrounding, so improves
object detection accuracy and safe driving (Chen, et al., 2017).
2.1.2.7 Supportive Infrastructure
Autonomous vehicles need support from the infrastructure for effective autonomous driving.
So, when an autonomous system is to be upgraded, upgradation on infrastructure is also
needed. Also, the infrastructure should be upgraded technologically to have proper V2I
features. A robust infrastructure well equipped for V2I is the basic requirement for
cooperative autonomous driving (CAD). While making infrastructure well suited for V2I
involves having high speed and secure wireless network, proper interoperability features,
proper legislation preventing cyber threats, training drivers to respond well to infrastructure
warnings etc. (Diaz, et al., 2018).
2.1.3 Impacts of Interconnected Autonomous Vehicle
The impacts of an interconnected autonomous vehicle are discussed as following:
2.1.3.1 Vehicle Sharing
Since the last decades, public concern in developed countries is rising towards sustainability,
and it is being prioritized even at the administrative level by the government. Among different
sustainability areas, transport sustainability is also one of the focus areas, lacking
sustainability issues currently due to a high level of congestion and environmental pollution.
From a sustainability point of view, if considering the usages and economic aspects, owning a
private vehicle has been less profitable than sharing it. Also, while looking at different vehicle
sharing companies (e.g., Zipcar, Drive Now, Car2Go, Flinkster), focusing on it and the
business model they are applying suggests that it is sustainable economically in terms of
pollution reduction too. However, car-sharing trips are very low these days, which could rise
with autonomous cars as they are efficient with trips, safer to use, and driverless. Countries
like China are already focusing on autonomous vehicle sharing systems (Diaz, et al., 2018).
Autonomous vehicles are most likely to be electric, making them green and eliminating
customer requirements for car pick-up and return. Vehicle sharing must account for
interrelations among vehicle fleets, charging stations, performance, and the customer's
demand to be successful (Kang et. al., 2016).
2.1.3.2 Change In Travel Demand
The increase in the efficient vehicle sharing system brings a reduction in vehicle ownership.
Based on the studies conducted, vehicle automation is forecasted to bring a 23% rise in travel
by a private car in Europe to reduce transportation costs. Another factor leading to increased
travel demand is the rise in population, urbanization, and shifts in travel moderom public
transport to autonomous cars (Diaz, et al., 2018).
2.1.3.3 Traffic Flow
Big cities and industrial importance areas face a huge traffic congestion problem, which can
be improved by introducing interconnected autonomous vehicles in the traffic. So, the
interconnection between autonomous vehicles is important for efficient traffic flow and safety
and passenger comfort. If the autonomous vehicles are not interconnected, the possibility of
ungenerous decisions in selecting the route, lane changing, vehicle speeds creates
disturbances to other vehicles using the same roadway. Conversely, if the vehicles are
interconnected, they can safely form a platoon and drive with very small gaps, thus improving
traffic flow (Diaz, et al., 2018). A numerical investigation conducted on heterogeneous traffic,
with automated and conventional vehicles, revealed that the road's capacity to carry vehicles
increased, increasing the flow (Ye et. al., 2018).
2.1.3.4 Safety Impacts
The main reason for road accidents is human error, as the research conducted by European
researchers suggests. So, the introduction of autonomous vehicles should be reducing
accidents very significantly. However, the vision zero concept initiated from Sweden is too
enthusiastic and idealistic even for an autonomous vehicle because sometimes unexpected
situations might arise, which cannot prevent accidents. Also, the enhancement in safety is not
believed to be significant with autonomous vehicles as the accidents might prevail with
failures in vehicles and software regulating it.
For transitional time duration, autonomous vehicles are supposed to be sharing the road with
the classical vehicle fleet. The enhancement in safety conditions is not supposed to be
significant in mixed traffic conditions as the reason for accidents is not only by failures in the
autonomous system but also due to human errors. For certainty about it, proper research
should be carried out, and some researches are being done in countries like th USA and EU.
However, these researches are not sufficient to have certainty in evaluating the safety impacts.
In another way, the interconnected autonomous system is vulnerable to unethical hacking and
promoting terrorism activities. To fight such problems, the autonomous vehicle system is
considered to be built up with an extravagant security system that can respond to external
attacks. This will significantly increase vehicles' costs, but it comes up with reducing the risk
and making the vehicle more safe and reliable (Diaz, et al., 2018).
2.1.3.5 Social Impacts
Autonomous vehicle usage in transportation is considered beneficial financially as it will
reduce the cost of travelling and saves the travel time that can be simultaneously used for
other activities. The cost of transportation abatement is due to lesser staff need due to
automatization, more effective traffic execution and lesser parking requirements. However,
AN autonomous vehicle system is considered to have adverse impacts on the profession of
vehicles driver. Also, the repair and maintenance of the vehicle’s profession will be shifted
towards information technologies and electronics along with data analysis.
Autonomous vehicles are considered to be popular among users for their enhancement in
safety and comfort. However, surveys raised the question of its acceptability among
prospective users. Surveys in the EU zone provided information about widespread
unacceptability for passenger vehicles but some inclination towards its usage for transporting
goods at the moment (Diaz, et al., 2018). A study conducted in Japan showed that public
acceptance is likely to change as its knowledge increases. The study also suggested that
proper management and diffusion of information, including public information campaigns,
test-ride events, will likely influence social acceptability (Chikaraishi et. al., 2020).
2.1.3.6 Environmental Impacts
The use of petroleum products for the road transportation sector has made its primary source
of air quality reduction. As global warming is already a big issue, different countries are
taking steps to reduce greenhouse gas emissions from the transportation industry.
Autonomous vehicles are designed with the electric engine while shifting from the petrol
engine, and they have zero greenhouse gas emissions. Considering the global usage of electric
vehicles, countries like China, Norway have huge percentages of electric vehicles in the
traffic (Diaz, et al., 2018).
2.1.3.7 Moral and Legal Issues
For semi-autonomous vehicles up to SAE level 3, the ultimate control lies within the human
drivers in urgent situations. Autonomous vehicles will have complex situations to decide
based on ethics and moral justification and material and human losses, making it hard for
autonomous vehicles to decide. However, for SAE level 4 and level 5 vehicles, the liability
becomes debatable in case of accidents. When the vehicle is used within design specifications,
the liability for damage goes to the vehicle manufacturer. However, making vehicle
manufacturers solely responsible will hinder the development and manufacture of the
autonomous vehicle.
Prevailing laws governing autonomous vehicles is not sufficient for fully autonomous
vehicles. So, globally accepted and uniform ethical guidelines should be developed before the
autonomous vehicles are ready to take on the existing road network independently (Diaz, et
al., 2018).
An ethics committee of independent experts worked in Germany on the need for broader
ethics code for such autonomous driving and released ethical guidelines in 2017 with twenty
statements. These statements also try to address situations where accidents cannot be
completely avoided, and a decision has to be made (Luetge, 2017).
2.2 Geometric Design of Road
The Geometric design of the road includes the calculations and analysis made by the highway
designers to fit the road with the required safety and level of service in the given terrain. It
includes the highway elements seen by highway users and has the objective of aligning the
roadway in the allowed right of the way, ensuring the needed operating speed, safety, and ride
quality (Cheu, 2006).
2.2.1 Control Criteria for Geometric design
The Geometric design of the road in an optimized way depends on some of the factors
described as following.
2.2.1.1 Design Vehicle
Vehicles operating on the road vary in types and dimensions. Different types of vehicles are
classified into general classes, and representative vehicles of such groups having
representative weight, dimension, operating characteristics that are required for geometric
design of the road is known as design vehicle (AASHTO, 2011). Design vehicles play an
important role in determining the minimum value of the geometric elements of the road.
Design vehicles can be classified into four categories, according to AASHTO.
(1) Passenger cars, (2) buses, (3) trucks, and (4) recreational vehicles.
Vehicles stated in the four classes above are subdivided into 20 types of design vehicles by
AASHTO, and representative dimensions are also provided for these types of design vehicles.
Highway facilities are designed based upon the size of the largest vehicles using the highway
infrastructure. Larger the length and size of the vehicles, larger geometric features are
required. It means vehicles having a longer length, such as trucks and buses, require greater
geometric dimensions such as a larger minimum turning radius than passenger cars. Also,
Bicycles are considered a design vehicle if they are allowed to operate on the highway
(AASHTO, 2011) .
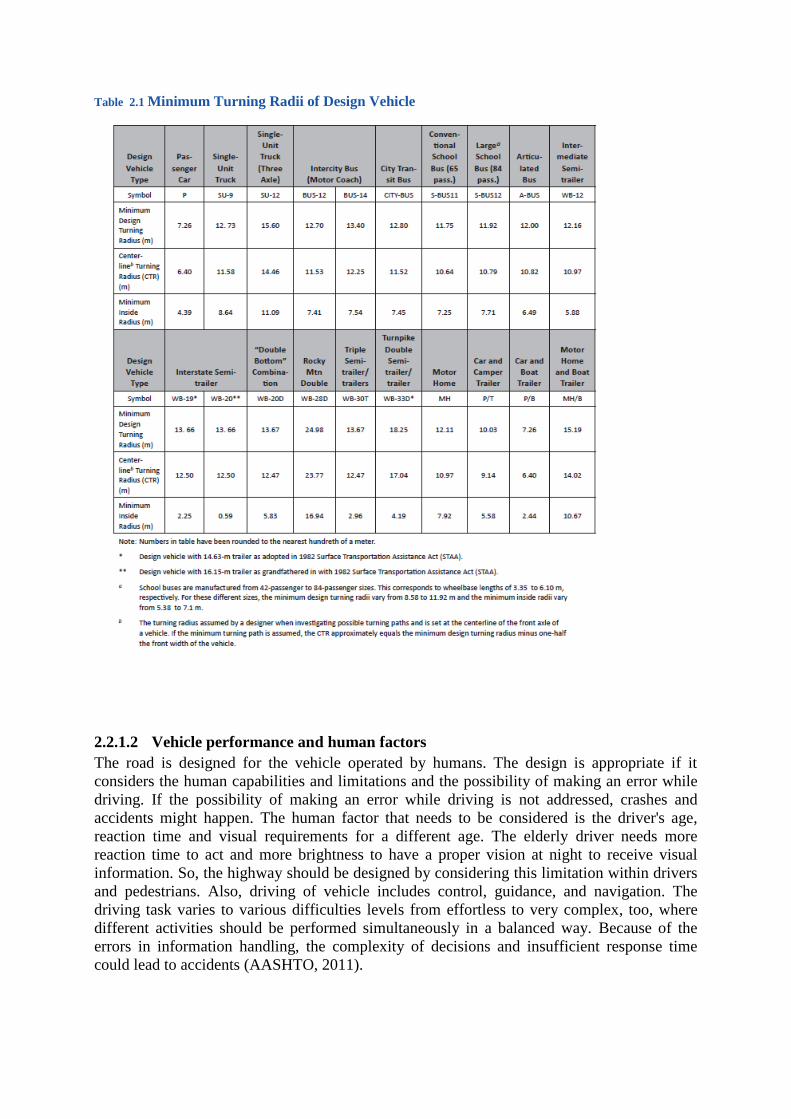
Table 2.1 Minimum Turning Radii of Design Vehicle
2.2.1.2 Vehicle performance and human factors
The road is designed for the vehicle operated by humans. The design is appropriate if it
considers the human capabilities and limitations and the possibility of making an error while
driving. If the possibility of making an error while driving is not addressed, crashes and
accidents might happen. The human factor that needs to be considered is the driver's age,
reaction time and visual requirements for a different age. The elderly driver needs more
reaction time to act and more brightness to have a proper vision at night to receive visual
information. So, the highway should be designed by considering this limitation within drivers
and pedestrians. Also, driving of vehicle includes control, guidance, and navigation. The
driving task varies to various difficulties levels from effortless to very complex, too, where
different activities should be performed simultaneously in a balanced way. Because of the
errors in information handling, the complexity of decisions and insufficient response time
could lead to accidents (AASHTO, 2011).
When driving, the driver receives the visual information on the road ahead and responds as
required. When braking is required, the average brake reaction time for the unexpected event
is 2.5 seconds, a study made by Johannson and Rumar (1971) suggests. Also, this value is
further validated by Koppa (Fwa, 2006). Also, the probability of accidents is higher during
night time due to reduced sight distance and increased reaction time by around 0.4 seconds at
night conditions compared to day time. The study by Gaca et al. showed in different types of
roads, night time speed changed from average daytime speed by somewhere decreasing and
somewhere increasing. So, while considering the design speed, this human factor impacting
the design speed should also be considered, and geometric design should be done (Gaca &
Kiec, u.d.).
2.2.1.3 Design Speed
Travellers prefer the transportation facility convenient and economical, which depends
directly on the vehicle's speed. People have different desired speed while using the vehicle.
But the design speed should try to reflect the desirable speed of the majority of the drivers
using the road. High highway designers should also consider user habit, safety, traffic flow
capacity, appearance, and socio-political effects while selecting the road's design speed.
Proper determination of design speed is an essential task before designing the geometric
elements as some geometric elements are directly related to the design speed. For example,
variations in design speed vary the required minimum curve radius, superelevation and sight
distance. An increase in vehicles' speed comes up with the reduced field of view for drivers,
which reduces the time duration available for sensing environment, possible obstacles on the
road ahead, and acts accordingly as required. For example, during night time, the visibility of
road gets reduced for some drivers when the vehicle travels at high speed, providing reduced
time for vision. (AASHTO, 2011)
The highway designer should design the road based on the vehicle's maximum possible speed
on the road. Different functional types of roads have different design speeds, such as
expressways and other rural ways, with the speed of 110km/h, while urban arterial roads are
designed for0 to 70 km/h (Fwa, 2006) .
According to Swedish road design guidelines VU94, the recommended design speed limit is
as following:
90 and sometimes 110 on national rural roads,
90 and sometimes 70 on regional rural roads
70 and sometimes 50 on local roads
Sometimes speed control is used if geometry restricts design speed
2.2.1.4 Traffic Characteristics
Traffic flows and vehicle type distribution determine the required number of lanes, width of
lanes, alignments, and road grades. Traffic data is normally collected by related agencies that
involve traffic characteristics such as average daily traffic (ADT) volume for days and time of
the year with vehicles following the route. Average daily traffic is the average traffic volume
in a given road per day within the given time period. Vehicle flow is not the same for the
design period, and the traffic flow is estimated for twenty years design period. The maximum
hourly traffic flow in the predicted time period is estimated, and the congestion is predicted.
In a certain time of the day, the traffic flow is maximum, termed peak hour traffic. Designing
the road based upon ADT might not be sufficient to accommodate the traffic well and
designing the road based upon peak hour traffic might not become economic and fully used
most of the time. So, upon studying the relationship between peak hour traffic and average
daily traffic, the hourly traffic volume used in the design is the 30th highest hourly volume of
the year termed as 30 HV. In some cases, the traffic volumes can be exceptionally high due to
several reasons, and 30 HV becomes insufficient. In such cases, traffic volume should be
measured, and suitable DHV should be determined.
2.3 Elements of Geometric Design of Road
2.3.1 Sight Distance
Drivers need to see forward through the length of the road to at least for certain minimum
distances to control the vehicle to avoid colliding with unexpected objects or other vehicles
along the road, which is known as sight distance. The purpose of sight distance is to allow the
driver to act accordingly when obstacles are faced. Minimum sight distances are required for
various purposes, such as stopping the vehicle, passing another vehicle, and making decisions
in complex situations. Stopping sight distance, passing sight distance, decision sight distance,
and intersection sight distance are required aspects for the geometric design of the road.
Passing sight distance is considered in two-lane rural roads in certain distance intervals and is
of little importance in two-lane urban streets (AASHTO, 2011).
Stopping Sight Distance
AASHTO defines Stopping sight distance as the minimum length of visible roadway required
to stop a vehicle travelling at the design speed. To have a greater value of visible roadway is
preferred. However, the minimum length of sight distance required at any point in the
roadway to bring the vehicle to rest should be fulfilled. SSD includes the sum of distances
travelled during reaction time and distance travelled by the vehicle after applying the brake.
The time gap between the sensing of obstacles and the moment of application of brake by the
driver is brake reaction time. It varies with a driver, the environmental conditions, quality of
road and nature of obstacles. However, a study suggested 2.5 s be sufficient reaction time for
even complex scenarios. Distance travelled during brake reaction time is termed as brake
reaction distance. (AASHTO, 2011).
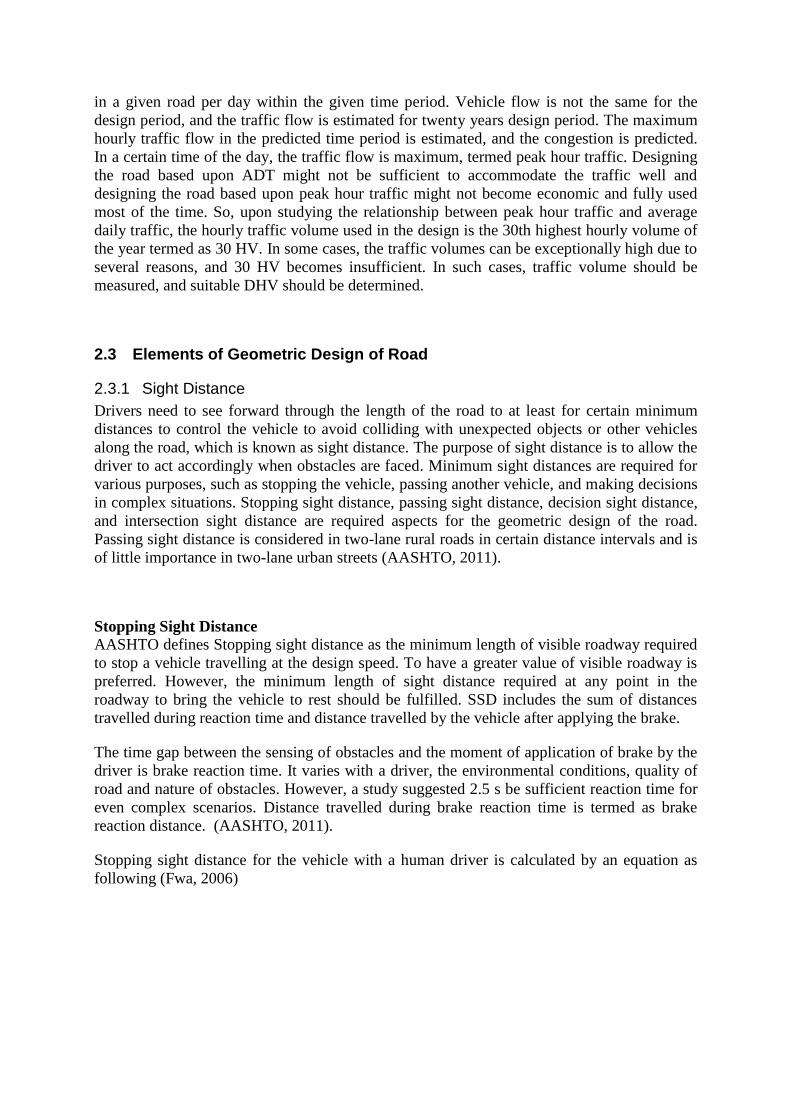
Stopping sight distance for the vehicle with a human driver is calculated by an equation as
following (Fwa, 2006)
d = Vt +
V2
2(a + Gg)
2.1
Where V is the design speed, the rate of deceleration on braking, G, the grade of the road (In
decimal, positive value for upgrade and negative value for downgrade), g is the acceleration
due to gravity and g=9.81 m/s2, ‘t’ is reaction time (t=2.5 second) and a=3.4m/s2 as
recommended by AASHTO.
Table 2.2 Stopping Sight Distance value on roads on Grade recommended by AASHTO 2011
Passing Sight Distance
The roads constructed are mostly two-lane roads having traffic in both directions, and also
fast-moving vehicles overtake slower moving vehicles in both directions. When overtaking in
a two-lane road, sufficient sight distance must be available while overtaking the vehicle and

allowing sufficient distance to pass vehicles from the opposite direction. Driver must see the
vehicles travelling from the opposite direction and overtake the slower moving vehicles if
sufficient time and distance are available ahead to make a passing maneuver and return to the
right lane and cancel overtaking action if the opposing vehicle is too close to make passing
maneuvers. This sight distance required for safe passing maneuver is termed as passing sight
distance. For the two-lane roads having traffic in both directions, the minimum value of
required passing sight distance is twice the minimum stopping sight distance value at the
same design speed. (AASHTO, 2011).
It’s not possible to provide passing sight distance on the whole length of the road, so the
section of road not safe for overtaking is identified and overtaking is forbidden in those
segments. While calculating passing sight distance parameters such as driver’s eye height,
object height, a width of the lane, clear zone, speed of the vehicle, height of headlight,
acceleration of the passing vehicle, length of passing sections, etc. are required ( (Namala &
Rys, 2006).
2.3.2 Cross-Section
Lane width
The width of the road lane affects the driving speed of the vehicle, along with driving
psychology and also highway capacity. The width of the lane is more in freeways and lesser
in urban roads with low travel speeds (Fwa, 2006).
Table 2.3 Lane width with Road type
Road type Minimum Lane Width (Meter)
Two lanes Undivided Highway 3,6 m
Residential area roads 2,7 m
Urban streets 3,0 m
According to VU94, traffic lanes width at a speed of 90 and 110 km/h is normally 3.75 meters
with a 2.75-meter shoulder for normal two-lane undivided highways. Also, another trend has
a 5.5-meter lane width with the 1-meter shoulder on either side.
Shoulder
The shoulder is the area on the side of the pavement that has the function of providing
structural lateral support for the pavement and also functions in space for stopped vehicles.
The width of the shoulder in low volume road can be as low as 0.6 meters under restricted
conditions, while the shoulder width that can serve better at any condition is 3 meters. For the
highways having low traffic flow, 1.8-2.4 m shoulder width is recommended, and for

highways having high traffic flow, 3-3.6 m shoulder width is recommended. The normal slope
of the shoulder to enhance the drainage of water is 2 to 6 % (Fwa, 2006) (AASHTO, 2011).
In the case of Swedish road design guidelines VU94, the recommended shoulder width for
two lanes, the roadway is a 1-meter shoulder for a lane width of 5.5 meters and a 2.75-meter
shoulder for 3.75-meter lane width.
Cross Slope
The undivided highways are provided with two types of cross slope designs, one with the
crown at the center and cross slope towards both road edges while the other one with the high
point on one edge and a cross slope across the whole road width. The cross slopes are
effective in draining the water from the road surface. The slope should be limited, too,
because of its adverse effect on steering control and the probability of skidding. So,
recommended cross slope value is normally in the range of 1.5% to 2%, and 2% is the
maximum limit (Fwa, 2006).
Median
The section on the highway used to separate road sections having traffic in opposite
directions. The width of the median is the distance between the edges of the roadway having
traffic in the opposite direction. The function of the median is to reduce the possibility of
collision of vehicles in opposite directions, providing space to park in emergencies and also
provide space for future road extension (AASHTO, 2011). Normally, the medians are
provided on roads with four or more lanes and not normally provided in two lanes roads. The
median used these days range from 3 meters to as much as 4.8 meters. (AASHTO, 2011)
2.3.3 Horizontal Alignment
The horizontal alignment involves the joining of the straight section of the road with simple
curves having a constant radius, which facilitates the safe and smooth passage of the vehicle.
While designing horizontal alignment, proper determination of the radius of the curve, the
proper location of the curve, use, and location of the transition curve is considered. The
transition curve is provided for a smooth transition from the straight road section with an
infinite radius to the curve of finite radius and is the spiral curve. There are four types of
curves used in horizontal alignment design, and these are simple, compound, reversed, and
spiral curve. Reverse curves are not recommended in normal situations because of lacking
comfort in driving with the sudden change of travel direction (Nicholas J. Garber, 2009).
Radius of Horizontal Curve
When the vehicle travels in a horizontal curve, the centripetal acceleration tends to pull the
vehicle towards the center of curvature. In order to counteract this force and make the vehicle
follow the curve safely, the vehicle’s weight, superelevation, the friction force between tires
and road surface can be utilized in design (AASHTO, 2011).

Figure 2.1 Vehicle in a super-elevated road section
The lateral slope provided in the road to resist centrifugal force and prevent overturning and
skid of vehicle by raising the road's outer edge with respect to the inner edge is termed as
superelevation. Super-elevation ‘e’ is denoted in percentage and has a relation with frictional
force, speed, and radius of the curve (Anupoju, 2020).
e + f =
V2
gR
2.2
Where e is superelevation in %, f is a frictional factor, g is the acceleration due to gravity, R is
the radius of the horizontal curve.
The maximum value of superelevation depends upon the climatic conditions of design
location, topography, and frequency of slow-moving vehicles using the road. For consistency
in design and uniformity in design element dimensions, which helps lower the accident
frequencies, uniformity in design element needs to be followed. The maximum value of
superelevation ranges from 8 to 12 percent. Superelevation above 8 percent is only used in
areas without snow. So, normally 8 percent superelevation rate is considered as the maximum
limit regardless of climatic conditions.
The radius of the horizontal curve required depends upon the superelevation, design speed,
frictional factor jointly. Adopting the minimum radius of curvature for the specific design
speed leads to an increase in superelevation, which reduces comfort to passengers and reduces
safety against vehicle rollover. Also, at the very flat horizontal curves, the use of
superelevation is not required. The minimum radius of curvature is calculated using the
following equation:
𝑅𝑚𝑖𝑛=
V2
127(0.01emax + fmax)
2.3

Where Rmin is the minimum radius of curvature, V is design speed in Km/h, e, and f
represents the maximum superelevation and maximum allowable frictional factor value
respectively.
(AASHTO, 2011)
Extra Widening On Horizontal Curves
Normally in a larger vehicle, when traveling in a horizontal curve, the rear wheel does not
follow the same path accurately as followed by the front wheel. This phenomenon is termed
off-tracking, and this problem is solved by widening the roads in horizontal curves. Although
Off-tracking is a typical phenomenon to all vehicles, it is more visible for the larger vehicles
when approaching the horizontal curve (AASHTO, 2011). The off-tracking phenomenon can
be considered in the road design by providing extra widened roads in the curve.
Extra widening is the sum of mechanical widening and psychological widening, which is
given by:
Ew = Wm + Wp 2.4
Where Wm is mechanical widening, Wp is psychological widening, and Ew is extra
widening.
Ew =
nl2
2R+
V
9.5√R
2.5
Where n denotes the number of lanes, l denotes the length of the wheelbase, R denotes the
radius of the curve. (Sautya, 2019)
Sight Distance on Horizontal Curves
In horizontal curves, the visibility of the road gets limited if the obstructions are present on
the inside of the curves. However, it is important to have sufficient sight distance at any point
on the curve. The roadway sight can be obstructed by walls, cut slopes, buildings, and other
obstacles on the line of sight of the curve. So, the design is adjusted when obstructions are
present. The horizontal line offset measured from the centerline of the road to the line of sight
is by the following equation (AASHTO, 2011).
𝐻𝑆𝑂 = 𝑅[1 − 𝑐𝑜𝑠 (
28.65𝑆
𝑅)]
2.6
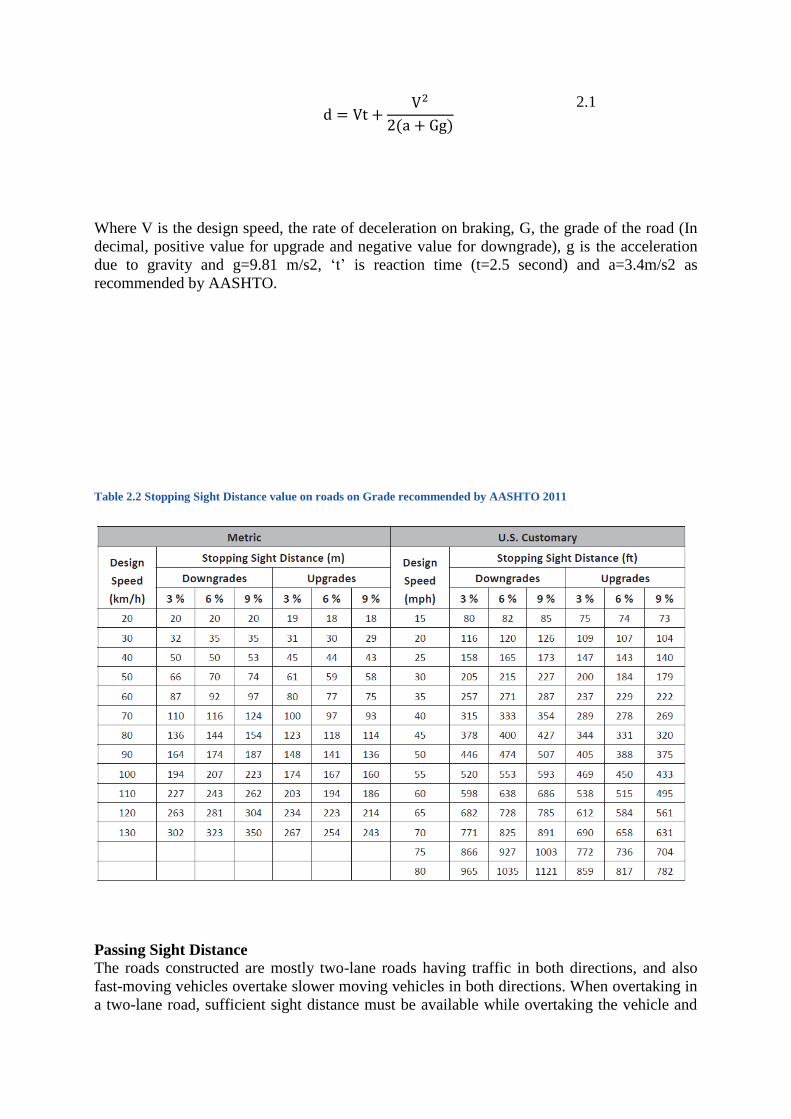
Where,
HSO=Horizontal Line Offset or set back distance
S=Stopping Sight Distance
R=Radius of the curve and all the units are in the metric system.
Figure 2.2: Sight distance requirement in horizontal curves
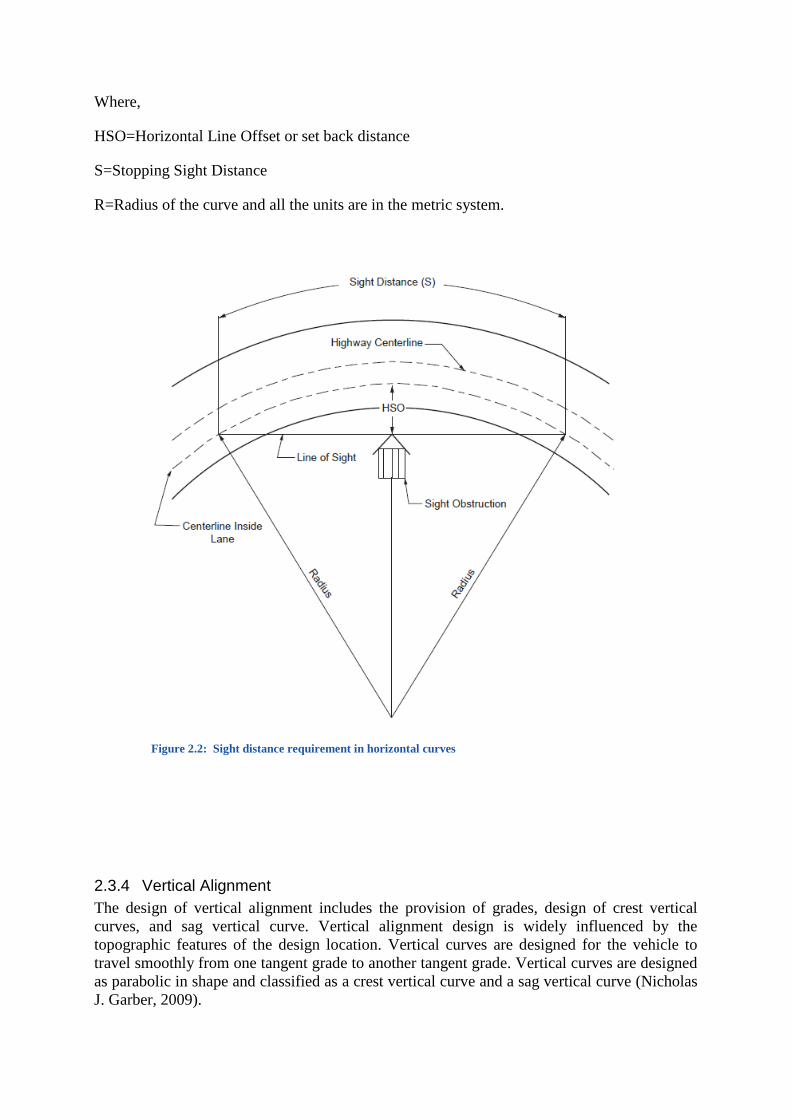
2.3.4 Vertical Alignment
The design of vertical alignment includes the provision of grades, design of crest vertical
curves, and sag vertical curve. Vertical alignment design is widely influenced by the
topographic features of the design location. Vertical curves are designed for the vehicle to
travel smoothly from one tangent grade to another tangent grade. Vertical curves are designed
as parabolic in shape and classified as a crest vertical curve and a sag vertical curve (Nicholas
J. Garber, 2009).
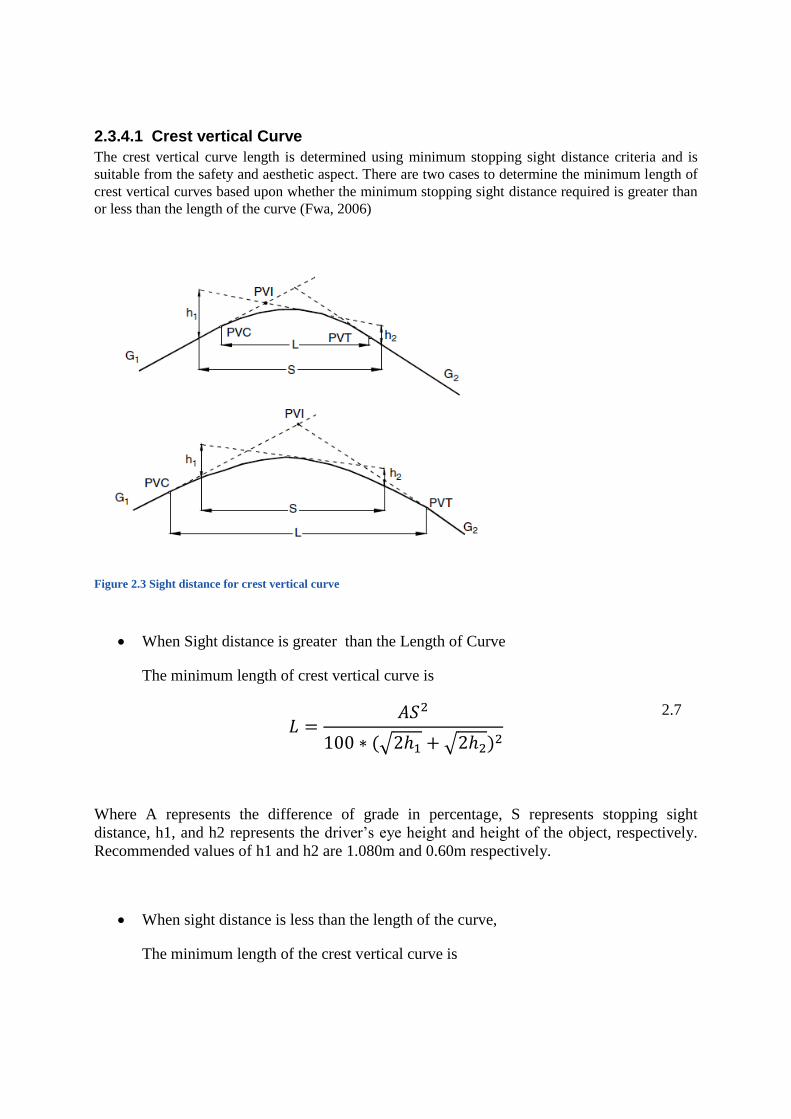
2.3.4.1 Crest vertical Curve
The crest vertical curve length is determined using minimum stopping sight distance criteria and is
suitable from the safety and aesthetic aspect. There are two cases to determine the minimum length of
crest vertical curves based upon whether the minimum stopping sight distance required is greater than
or less than the length of the curve (Fwa, 2006)
Figure 2.3 Sight distance for crest vertical curve
When Sight distance is greater than the Length of Curve
The minimum length of crest vertical curve is
𝐿 =
𝐴𝑆2
100 ∗ (√2ℎ1 + √2ℎ2)2
2.7
Where A represents the difference of grade in percentage, S represents stopping sight
distance, h1, and h2 represents the driver’s eye height and height of the object, respectively.
Recommended values of h1 and h2 are 1.080m and 0.60m respectively.
When sight distance is less than the length of the curve,
The minimum length of the crest vertical curve is
𝐿 = 2 [𝑆 −100(√ℎ1 + √ℎ2)2
𝐴]
2.8
Where S represents stopping sight distance, A represents grade difference in percentage, h1
represents the height of the driver’s eye, and h2 represents object height, respectively (Fwa,
2006).
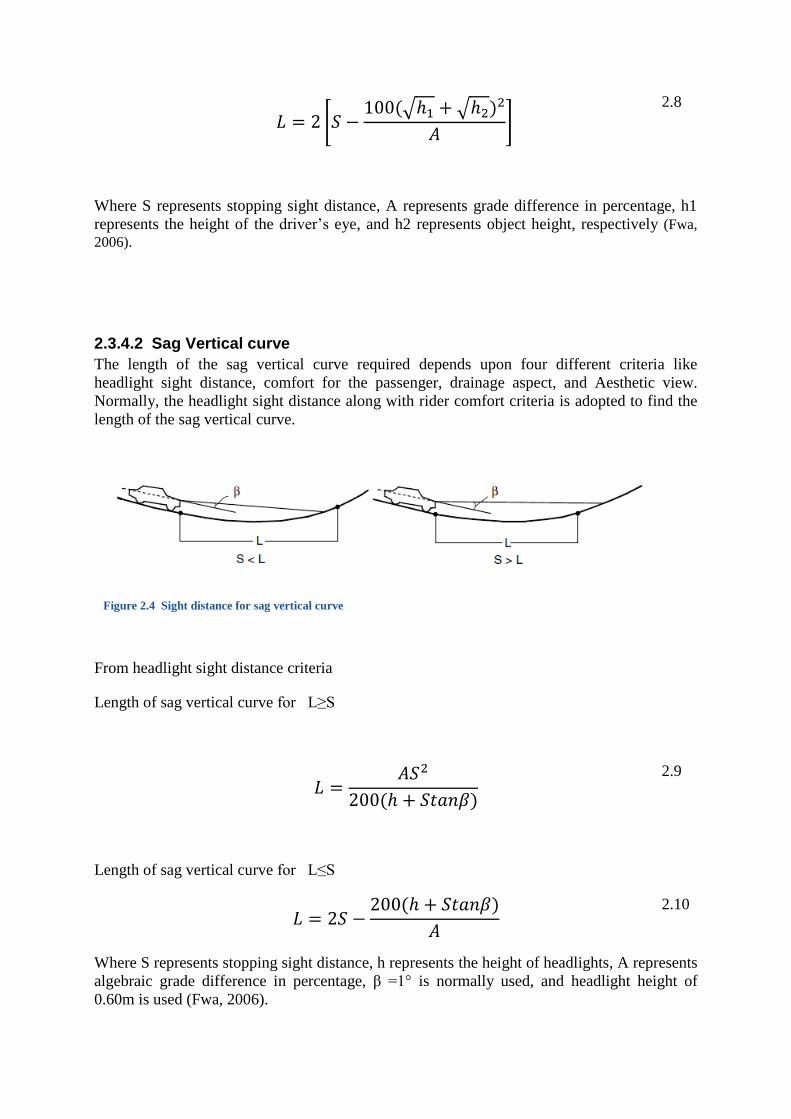
2.3.4.2 Sag Vertical curve
The length of the sag vertical curve required depends upon four different criteria like
headlight sight distance, comfort for the passenger, drainage aspect, and Aesthetic view.
Normally, the headlight sight distance along with rider comfort criteria is adopted to find the
length of the sag vertical curve.
Figure 2.4 Sight distance for sag vertical curve
From headlight sight distance criteria
Length of sag vertical curve for L≥S
𝐿 =
𝐴𝑆2
200(ℎ + 𝑆𝑡𝑎𝑛𝛽)
2.9
Length of sag vertical curve for L≤S
𝐿 = 2𝑆 −
200(ℎ + 𝑆𝑡𝑎𝑛𝛽)
𝐴
2.10
Where S represents stopping sight distance, h represents the height of headlights, A represents
algebraic grade difference in percentage, β =1° is normally used, and headlight height of
0.60m is used (Fwa, 2006).
2.3.5 Grades
The effect of grades on vehicle operating speed should be considered as the vehicle has
significant speed variation in steep upgrades and downgrades. AASHTO suggests that when
normal passenger cars travel the uphill with a grade of 4 to 5%, it does not have significant
speed losses with distance. However, with steeper upgrades than it, the speed loss gets
significant. If we consider the effects of speed loss in trucks in upgrades, it is very significant
compared to passenger cars, and due to significant losses in speed, the maximum and
minimum grades are determined and are adopted during design. (AASHTO, 2011).
Chen et al. (2017) studied the effects of grades on the speed of the vehicles on interstate
highways and found the speed to be decreasing with an increase in the grade value. For this,
the elevation data of the roads was extracted from google earth and converted to grade data.
Also, the speed was gathered along those sections, and the increase in grade was found to be
reducing the speed of the vehicle (Chen, et al., 2017). So, we can consider the effects of grade
in vehicle speed, which in turn affects the geometric design of the road. Also, Liu et al.
studied the relationship between road grades and vehicle acceleration behavior, which
suggested the vehicle acceleration rising with the rise in grades value. It also showed the
heavy-duty buses accelerating more sensitively compared to light-duty vehicles with the
change in grades (Liu, et al., 2019).
AASHTO recommends different grade thresholds based upon the functional classification of
the road and the design speed. For higher design speed, the maximum allowable grade is
lower, and for lower design speed, an allowable grade is higher. For example, if we have the
road with a design speed of 110 km/h, a maximum grade of 5 % is allowed, while for the
design speed of 50 km/h, 7 to 12 % grade can be used. On the two-lane highway, if the grade
is steeper and trucks have significant speed losses, then extra climbing lanes for trucks and
recreational vehicles can be designed (AASHTO, 2011).
2.3.6 Intersection
When two or more highways meet at an area, an intersection is formed. An intersection is a
point where the conflict between traffic occurs, and it requires proper design for efficient
operations and low crash frequencies. An intersection can be at grade or grade-separated
intersections. At-grade intersection requires complex knowledge and design consideration.
The design should consider traffic flow, environmental, appearance, socio-cultural aspect, and
user necessity. The four-legged intersection is the most commonly recommended intersection
when two highways meet. When the vehicle is approaching an intersection, the driver should
have a clear view of an intersection and vehicles approaching it. For safety against collisions,
drivers should have a clear view of an intersection ahead at least equal to the stopping sight
distance (Fwa, 2006).
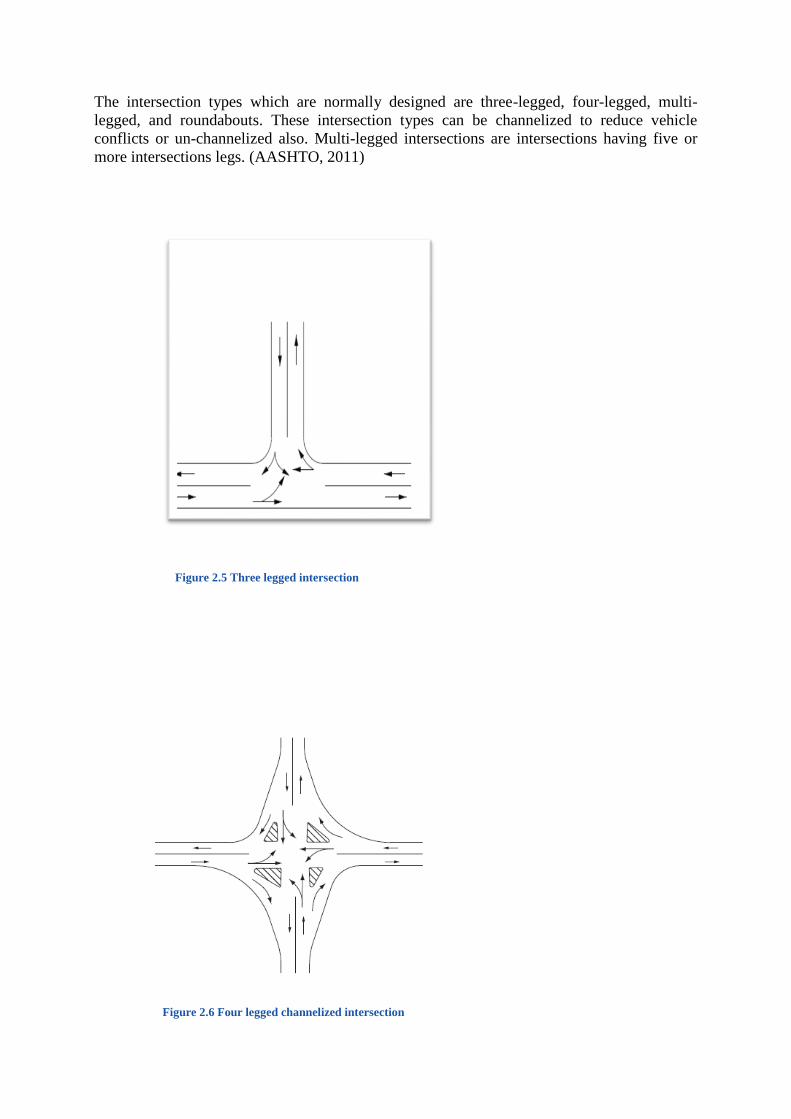
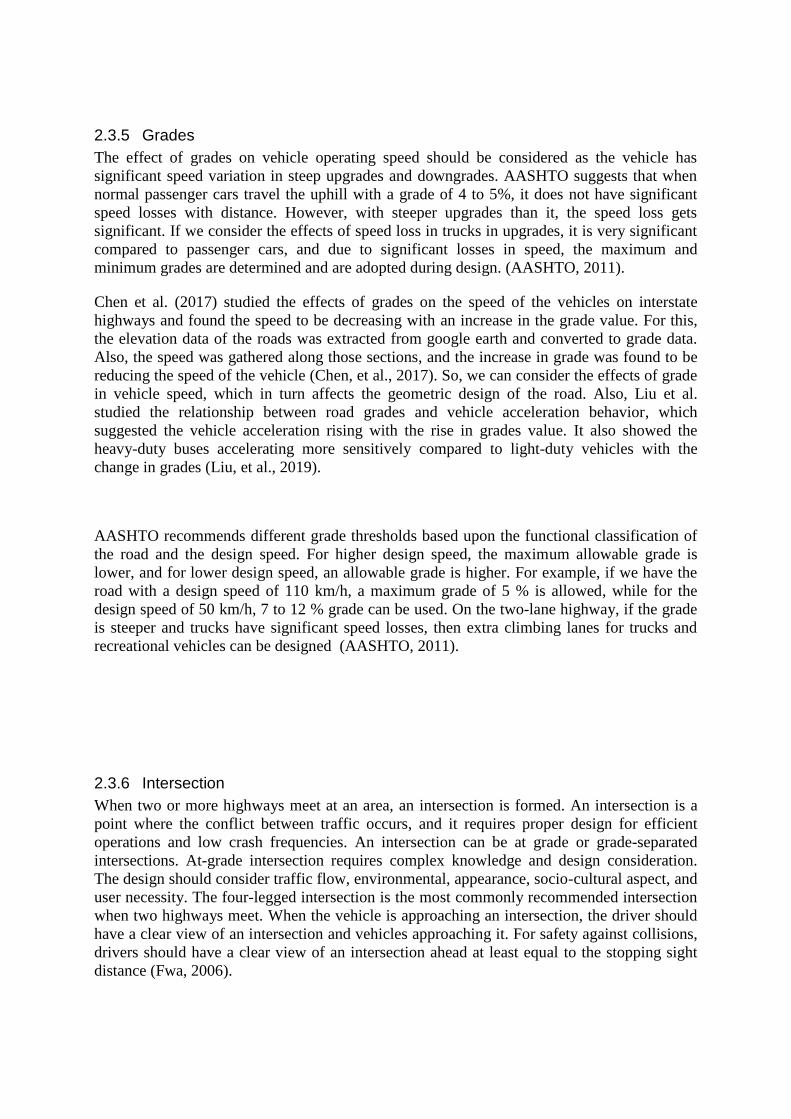
The intersection types which are normally designed are three-legged, four-legged, multi-
legged, and roundabouts. These intersection types can be channelized to reduce vehicle
conflicts or un-channelized also. Multi-legged intersections are intersections having five or
more intersections legs. (AASHTO, 2011)
Figure 2.5 Three legged intersection
Figure 2.6 Four legged channelized intersection
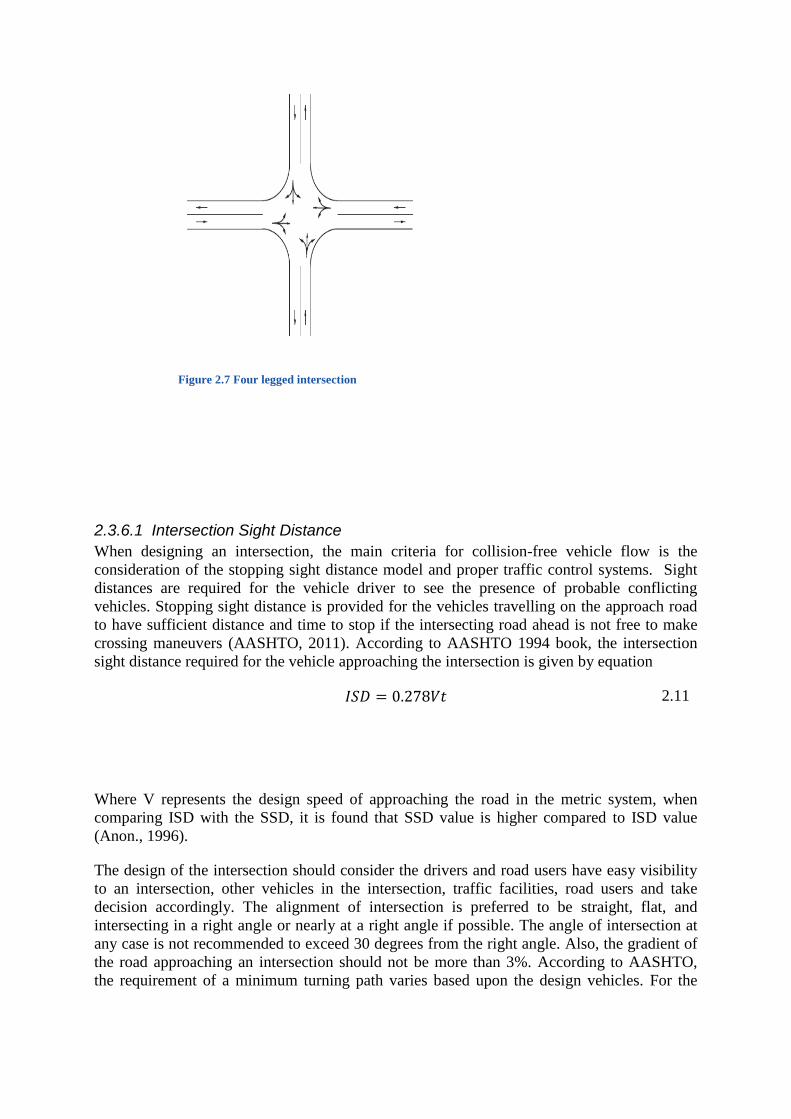
2.3.6.1 Intersection Sight Distance
When designing an intersection, the main criteria for collision-free vehicle flow is the
consideration of the stopping sight distance model and proper traffic control systems. Sight
distances are required for the vehicle driver to see the presence of probable conflicting
vehicles. Stopping sight distance is provided for the vehicles travelling on the approach road
to have sufficient distance and time to stop if the intersecting road ahead is not free to make
crossing maneuvers (AASHTO, 2011). According to AASHTO 1994 book, the intersection
sight distance required for the vehicle approaching the intersection is given by equation
𝐼𝑆𝐷 = 0.278𝑉𝑡 2.11
Where V represents the design speed of approaching the road in the metric system, when
comparing ISD with the SSD, it is found that SSD value is higher compared to ISD value
(Anon., 1996).
The design of the intersection should consider the drivers and road users have easy visibility
to an intersection, other vehicles in the intersection, traffic facilities, road users and take
decision accordingly. The alignment of intersection is preferred to be straight, flat, and
intersecting in a right angle or nearly at a right angle if possible. The angle of intersection at
any case is not recommended to exceed 30 degrees from the right angle. Also, the gradient of
the road approaching an intersection should not be more than 3%. According to AASHTO,
the requirement of a minimum turning path varies based upon the design vehicles. For the
Figure 2.7 Four legged intersection
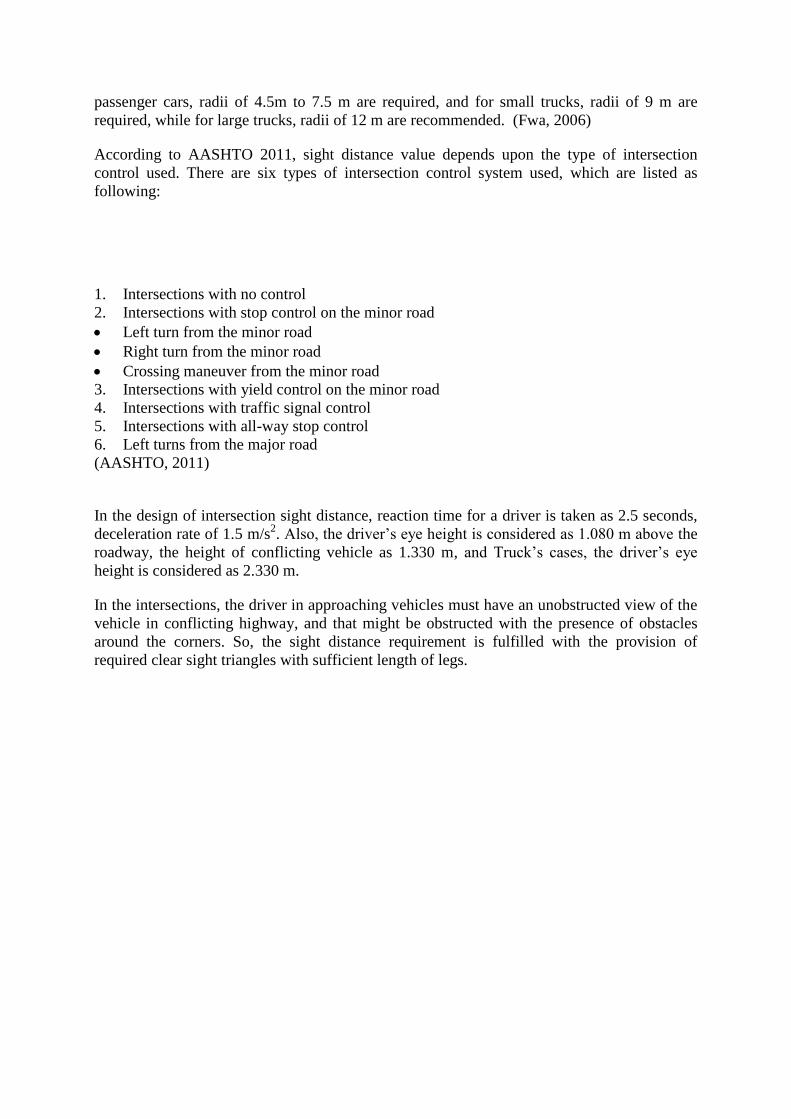
passenger cars, radii of 4.5m to 7.5 m are required, and for small trucks, radii of 9 m are
required, while for large trucks, radii of 12 m are recommended. (Fwa, 2006)
According to AASHTO 2011, sight distance value depends upon the type of intersection
control used. There are six types of intersection control system used, which are listed as
following:
1. Intersections with no control
2. Intersections with stop control on the minor road
Left turn from the minor road
Right turn from the minor road
Crossing maneuver from the minor road
3. Intersections with yield control on the minor road
4. Intersections with traffic signal control
5. Intersections with all-way stop control
6. Left turns from the major road
(AASHTO, 2011)
In the design of intersection sight distance, reaction time for a driver is taken as 2.5 seconds,
deceleration rate of 1.5 m/s2. Also, the driver’s eye height is considered as 1.080 m above the
roadway, the height of conflicting vehicle as 1.330 m, and Truck’s cases, the driver’s eye
height is considered as 2.330 m.
In the intersections, the driver in approaching vehicles must have an unobstructed view of the
vehicle in conflicting highway, and that might be obstructed with the presence of obstacles
around the corners. So, the sight distance requirement is fulfilled with the provision of
required clear sight triangles with sufficient length of legs.
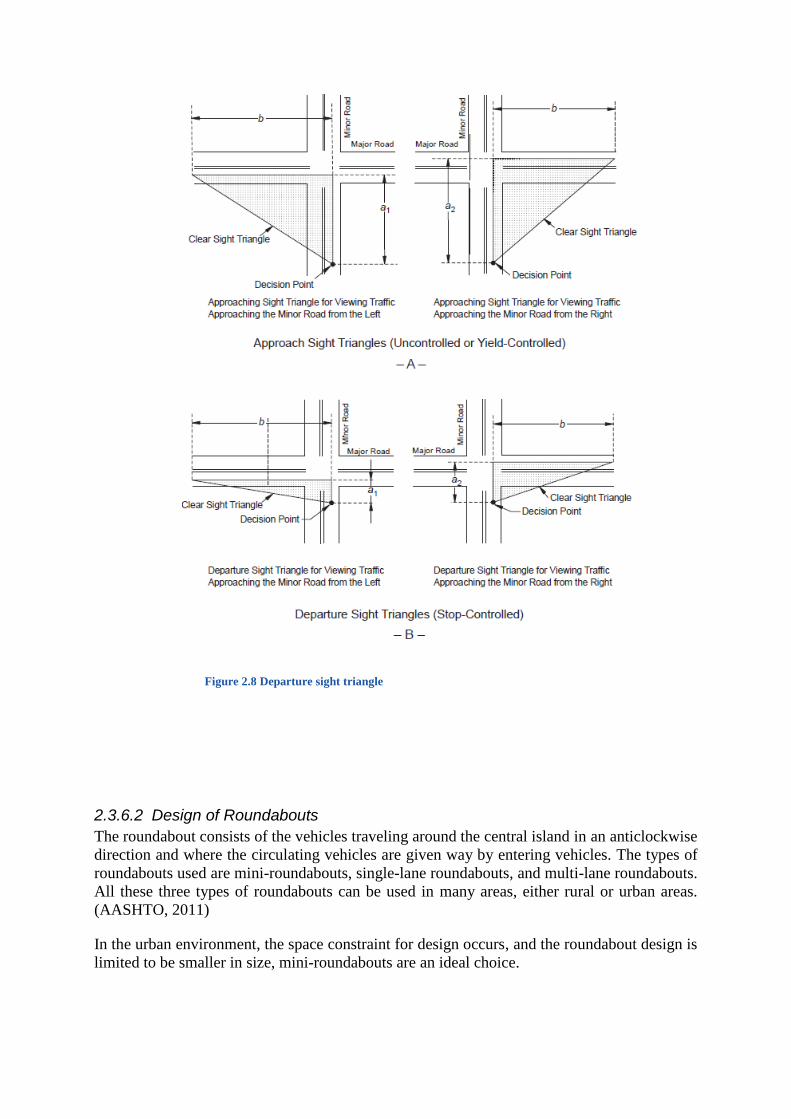
2.3.6.2 Design of Roundabouts
The roundabout consists of the vehicles traveling around the central island in an anticlockwise
direction and where the circulating vehicles are given way by entering vehicles. The types of
roundabouts used are mini-roundabouts, single-lane roundabouts, and multi-lane roundabouts.
All these three types of roundabouts can be used in many areas, either rural or urban areas.
(AASHTO, 2011)
In the urban environment, the space constraint for design occurs, and the roundabout design is
limited to be smaller in size, mini-roundabouts are an ideal choice.
Figure 2.8 Departure sight triangle
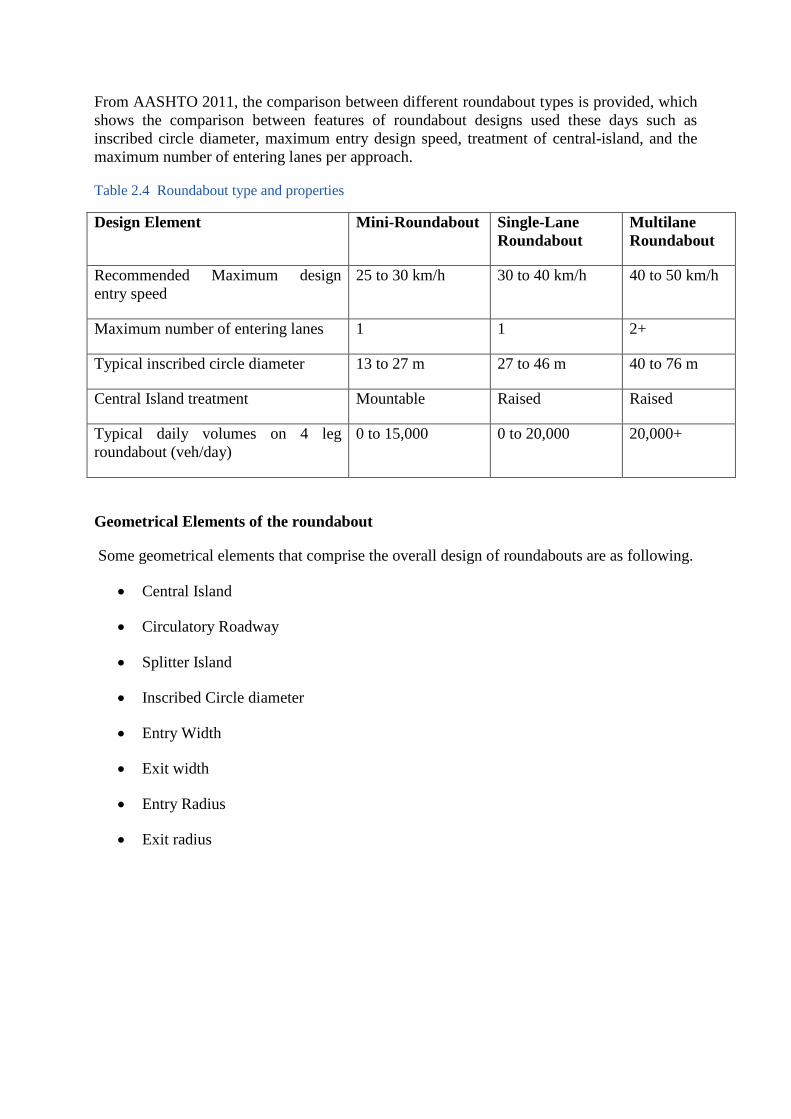
From AASHTO 2011, the comparison between different roundabout types is provided, which
shows the comparison between features of roundabout designs used these days such as
inscribed circle diameter, maximum entry design speed, treatment of central-island, and the
maximum number of entering lanes per approach.
Table 2.4 Roundabout type and properties
Design Element Mini-Roundabout Single-Lane
Roundabout
Multilane
Roundabout
Recommended Maximum design
entry speed
25 to 30 km/h 30 to 40 km/h 40 to 50 km/h
Maximum number of entering lanes 1 1 2+
Typical inscribed circle diameter 13 to 27 m 27 to 46 m 40 to 76 m
Central Island treatment Mountable Raised Raised
Typical daily volumes on 4 leg
roundabout (veh/day)
0 to 15,000 0 to 20,000 20,000+
Geometrical Elements of the roundabout
Some geometrical elements that comprise the overall design of roundabouts are as following.
Central Island
Circulatory Roadway
Splitter Island
Inscribed Circle diameter
Entry Width
Exit width
Entry Radius
Exit radius
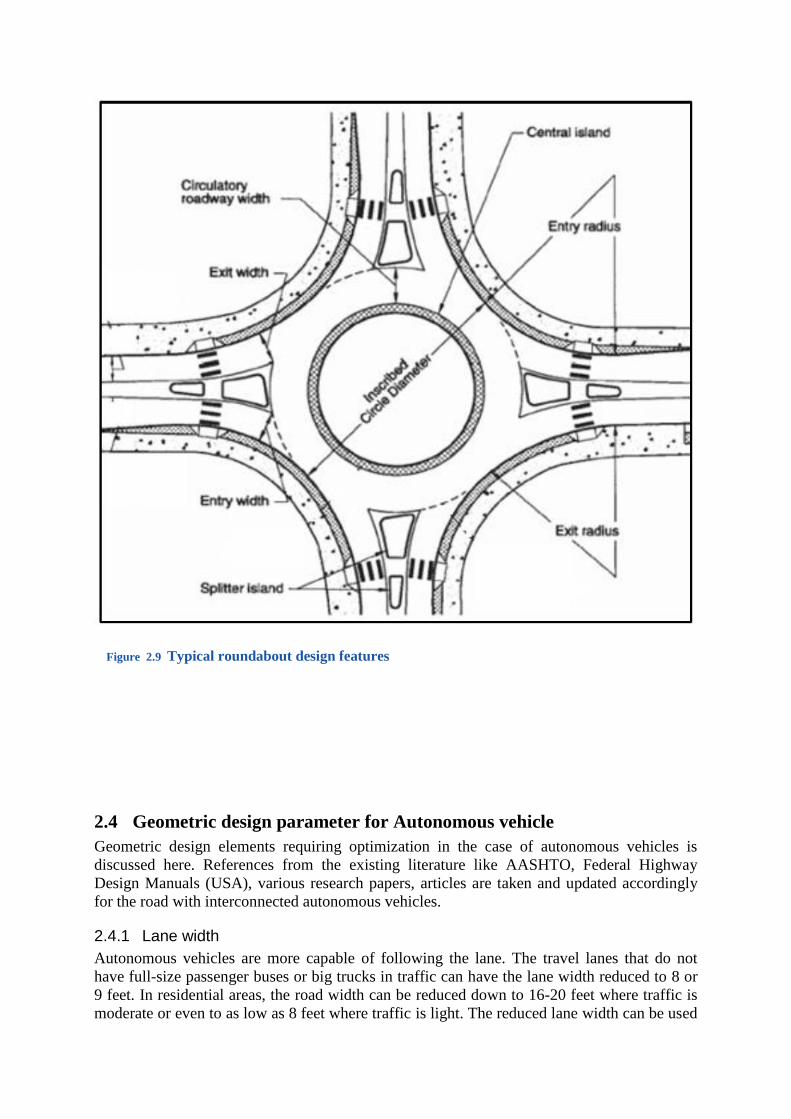
Figure 2.9 Typical roundabout design features
2.4 Geometric design parameter for Autonomous vehicle
Geometric design elements requiring optimization in the case of autonomous vehicles is
discussed here. References from the existing literature like AASHTO, Federal Highway
Design Manuals (USA), various research papers, articles are taken and updated accordingly
for the road with interconnected autonomous vehicles.
2.4.1 Lane width
Autonomous vehicles are more capable of following the lane. The travel lanes that do not
have full-size passenger buses or big trucks in traffic can have the lane width reduced to 8 or
9 feet. In residential areas, the road width can be reduced down to 16-20 feet where traffic is
moderate or even to as low as 8 feet where traffic is light. The reduced lane width can be used
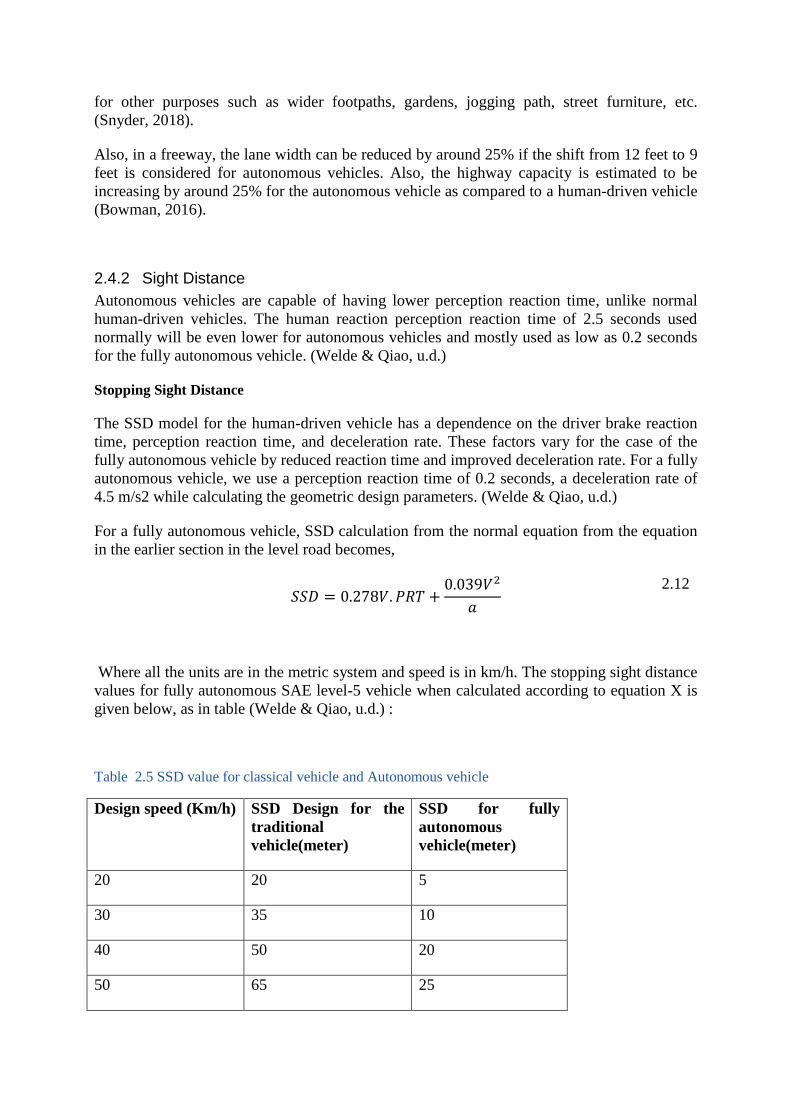
for other purposes such as wider footpaths, gardens, jogging path, street furniture, etc.
(Snyder, 2018).
Also, in a freeway, the lane width can be reduced by around 25% if the shift from 12 feet to 9
feet is considered for autonomous vehicles. Also, the highway capacity is estimated to be
increasing by around 25% for the autonomous vehicle as compared to a human-driven vehicle
(Bowman, 2016).
2.4.2 Sight Distance
Autonomous vehicles are capable of having lower perception reaction time, unlike normal
human-driven vehicles. The human reaction perception reaction time of 2.5 seconds used
normally will be even lower for autonomous vehicles and mostly used as low as 0.2 seconds
for the fully autonomous vehicle. (Welde & Qiao, u.d.)
Stopping Sight Distance
The SSD model for the human-driven vehicle has a dependence on the driver brake reaction
time, perception reaction time, and deceleration rate. These factors vary for the case of the
fully autonomous vehicle by reduced reaction time and improved deceleration rate. For a fully
autonomous vehicle, we use a perception reaction time of 0.2 seconds, a deceleration rate of
4.5 m/s2 while calculating the geometric design parameters. (Welde & Qiao, u.d.)
For a fully autonomous vehicle, SSD calculation from the normal equation from the equation
in the earlier section in the level road becomes,
𝑆𝑆𝐷 = 0.278𝑉. 𝑃𝑅𝑇 +
0.039𝑉2
𝑎
2.12
Where all the units are in the metric system and speed is in km/h. The stopping sight distance
values for fully autonomous SAE level-5 vehicle when calculated according to equation X is
given below, as in table (Welde & Qiao, u.d.) :
Table 2.5 SSD value for classical vehicle and Autonomous vehicle
Design speed (Km/h) SSD Design for the
traditional
vehicle(meter)
SSD for fully
autonomous
vehicle(meter)
20 20 5
30 35 10
40 50 20
50 65 25

60 85 35
70 105 50
80 130 60
90 160 80
100 185 95
110 220 115
120 250 135
130 285 155
2.4.3 Horizontal Alignment
Horizontal alignment design consists of the horizontal curves design, design of super-
elevation, and frictional factor of the pavement surface. The minimum radius value for the
horizontal curve depends upon the design speed, super-elevation value, and frictional factor
value.
According to AASHTO 2011,
𝑅min =
𝑉2
127(0.01𝑒𝑚𝑎𝑥 + 𝑓𝑚𝑎𝑥)
2.13
Above equation 2.13 clearly shows the horizontal radius of curve value does not depend upon
the perception reaction time or other human factors but depends solely upon the driving
dynamics. So, the minimum radius value for the design of a horizontal curve from driving
dynamics remains the same for a fully autonomous vehicle like a traditional vehicle with a
human driver.
2.4.4 Vertical Alignment
The vertical alignment design of the road consists of a design of the crest vertical curve and a
sag vertical curve design.
2.4.4.1 Crest Vertical Curve
In the design of the crest vertical curve, the SSD model is used, and the SSD model, as in the
stopping sight distance section, depends upon the perception reaction time, deceleration rate.
In the case of vertical curve design for the fully autonomous vehicle, the height of the LIDAR
sensor from the ground, height of an object above the road is used as the height of the driver’s
eye, and object height is used in case of a vehicle with a human driver. Waymo’s fully
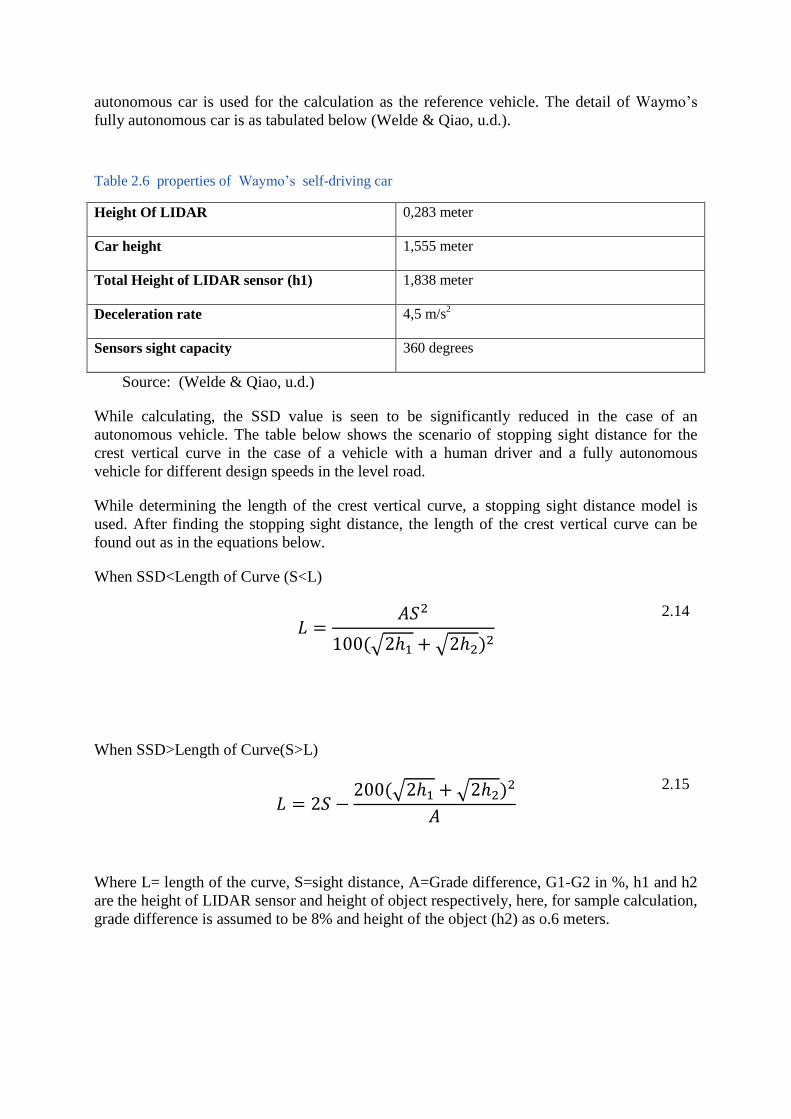
autonomous car is used for the calculation as the reference vehicle. The detail of Waymo’s
fully autonomous car is as tabulated below (Welde & Qiao, u.d.).
Table 2.6 properties of Waymo’s self-driving car
Height Of LIDAR 0,283 meter
Car height 1,555 meter
Total Height of LIDAR sensor (h1) 1,838 meter
Deceleration rate 4,5 m/s2
Sensors sight capacity 360 degrees
Source: (Welde & Qiao, u.d.)
While calculating, the SSD value is seen to be significantly reduced in the case of an
autonomous vehicle. The table below shows the scenario of stopping sight distance for the
crest vertical curve in the case of a vehicle with a human driver and a fully autonomous
vehicle for different design speeds in the level road.
While determining the length of the crest vertical curve, a stopping sight distance model is
used. After finding the stopping sight distance, the length of the crest vertical curve can be
found out as in the equations below.
When SSD<Length of Curve (S<L)
𝐿 =
𝐴𝑆2
100(√2ℎ1 + √2ℎ2)2
2.14
When SSD>Length of Curve(S>L)
𝐿 = 2𝑆 −200(√2ℎ1 + √2ℎ2)2
𝐴
2.15
Where L= length of the curve, S=sight distance, A=Grade difference, G1-G2 in %, h1 and h2
are the height of LIDAR sensor and height of object respectively, here, for sample calculation,
grade difference is assumed to be 8% and height of the object (h2) as o.6 meters.
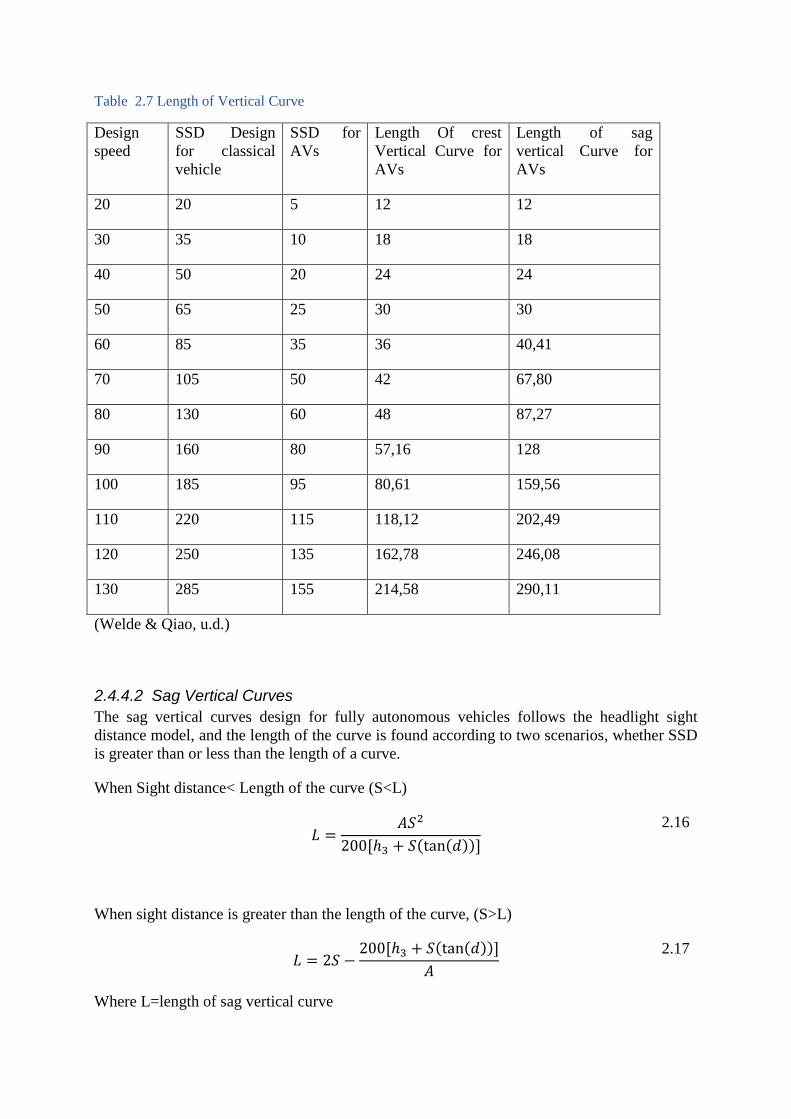
Table 2.7 Length of Vertical Curve
Design
speed
SSD Design
for classical
vehicle
SSD for
AVs
Length Of crest
Vertical Curve for
AVs
Length of sag
vertical Curve for
AVs
20 20 5 12 12
30 35 10 18 18
40 50 20 24 24
50 65 25 30 30
60 85 35 36 40,41
70 105 50 42 67,80
80 130 60 48 87,27
90 160 80 57,16 128
100 185 95 80,61 159,56
110 220 115 118,12 202,49
120 250 135 162,78 246,08
130 285 155 214,58 290,11
(Welde & Qiao, u.d.)
2.4.4.2 Sag Vertical Curves
The sag vertical curves design for fully autonomous vehicles follows the headlight sight
distance model, and the length of the curve is found according to two scenarios, whether SSD
is greater than or less than the length of a curve.
When Sight distance< Length of the curve (S<L)
𝐿 =
𝐴𝑆2
200[ℎ3 + 𝑆(tan(𝑑))]
2.16
When sight distance is greater than the length of the curve, (S>L)
𝐿 = 2𝑆 −
200[ℎ3 + 𝑆(tan(𝑑))]
𝐴
2.17
Where L=length of sag vertical curve

A=grade differences, G1-G2 %
S=Light beam distance in meter
h3=Height of the headlight, 0.6 meters.
d=upward divergence of the light beam from the vehicle’s longitudinal axis, 1°.
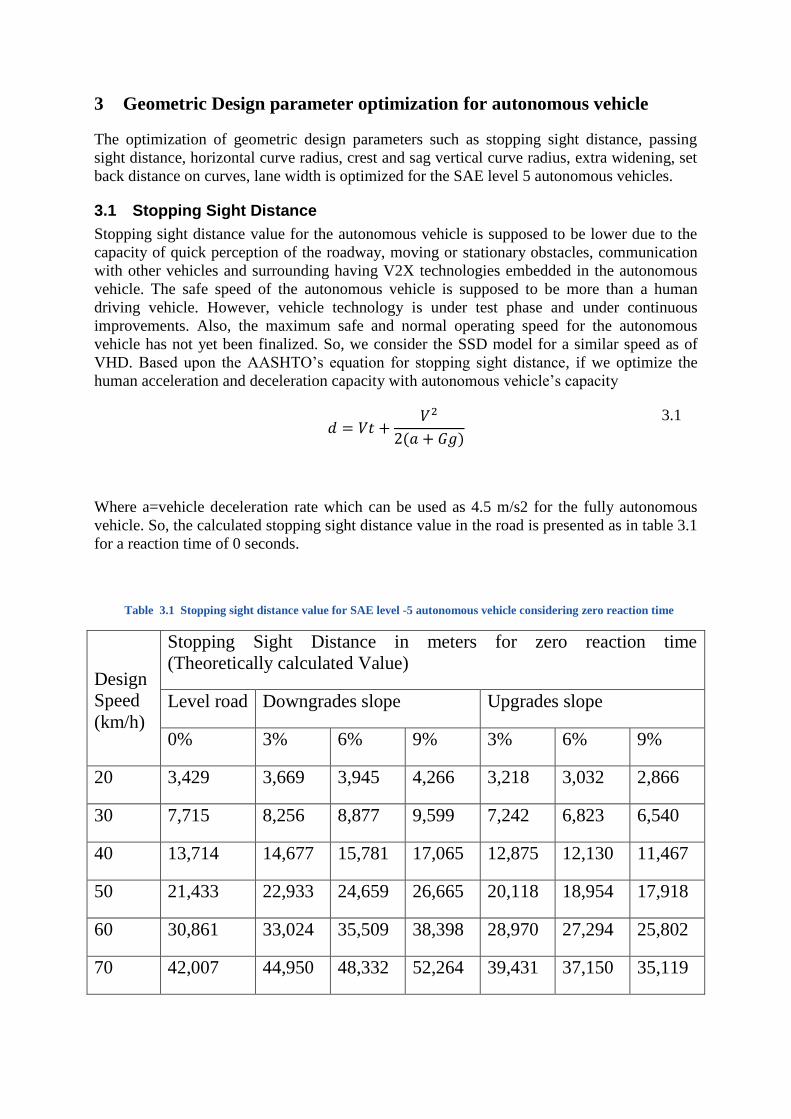
3 Geometric Design parameter optimization for autonomous vehicle
The optimization of geometric design parameters such as stopping sight distance, passing
sight distance, horizontal curve radius, crest and sag vertical curve radius, extra widening, set
back distance on curves, lane width is optimized for the SAE level 5 autonomous vehicles.
3.1 Stopping Sight Distance
Stopping sight distance value for the autonomous vehicle is supposed to be lower due to the
capacity of quick perception of the roadway, moving or stationary obstacles, communication
with other vehicles and surrounding having V2X technologies embedded in the autonomous
vehicle. The safe speed of the autonomous vehicle is supposed to be more than a human
driving vehicle. However, vehicle technology is under test phase and under continuous
improvements. Also, the maximum safe and normal operating speed for the autonomous
vehicle has not yet been finalized. So, we consider the SSD model for a similar speed as of
VHD. Based upon the AASHTO’s equation for stopping sight distance, if we optimize the
human acceleration and deceleration capacity with autonomous vehicle’s capacity
𝑑 = 𝑉𝑡 +
𝑉2
2(𝑎 + 𝐺𝑔)
3.1
Where a=vehicle deceleration rate which can be used as 4.5 m/s2 for the fully autonomous
vehicle. So, the calculated stopping sight distance value in the road is presented as in table 3.1
for a reaction time of 0 seconds.
Table 3.1 Stopping sight distance value for SAE level -5 autonomous vehicle considering zero reaction time
Design
Speed
(km/h)
Stopping Sight Distance in meters for zero reaction time
(Theoretically calculated Value)
Level road Downgrades slope Upgrades slope
0% 3% 6% 9% 3% 6% 9%
20 3,429 3,669 3,945 4,266 3,218 3,032 2,866
30 7,715 8,256 8,877 9,599 7,242 6,823 6,540
40 13,714 14,677 15,781 17,065 12,875 12,130 11,467
50 21,433 22,933 24,659 26,665 20,118 18,954 17,918
60 30,861 33,024 35,509 38,398 28,970 27,294 25,802
70 42,007 44,950 48,332 52,264 39,431 37,150 35,119

80 54,868 58,710 63,127 68,263 51,80 48,523 45,870
90 69,444 74,305 79,895 86,396 65,182 61,412 58,055
100 85,735 91,734 98,636 106,662 80,472 75,818 71,673
110 103,734 110,998 119,350 129,061 97,371 91,740 86,724
120 123,454 132,097 142,037 153,593 115,880 109,178 103,209
130 144,889 155,031 166,696 180,259 135,998 128,132 121,127
140 168,039 179,800 193,328 209,058 157,725 148,603 140,479
150 192,904 206,403 221,933 239,990 181,062 170,591 161,264
However, we consider the fully autonomous vehicle also to have some minimum reaction
time, such as 0.2 seconds. It is because of the fact that even the machine vision takes time for
obstacle detection and sensing of the roadway environment. So, the minimum stopping sight
distance value for a fully autonomous vehicle considering 0.2 second reaction time is listed in
the following table.
Table 3.2: Stopping Sight distance value for SAE level- 5 autonomous vehicles considering 0.2 second reaction time
Design
Speed
(km/h)
Stopping Sight Distance in meters for 0,2 Sec reaction time
(Theoretically calculated value)
Level
road,
G=0%
Downgrades slope Upgrades slope
0% 3% 6% 9% 3% 6% 9%
20 4,272 4,780 5,056 5,377 4,329 4,143 3,977
30 9,383 9,922 10,543 11,265 8,908 8,489 8,206
40 15,941 16,899 18,093 19,287 15,097 14,352 13,689
50 24,213 25,710 27,436 29,442 22,895 21,731 20,695
60 34,197 36,357 38,842 41,731 32,303 30,627 29,135
70 45,899 48,283 51,665 55,597 42,764 40,483 38,452
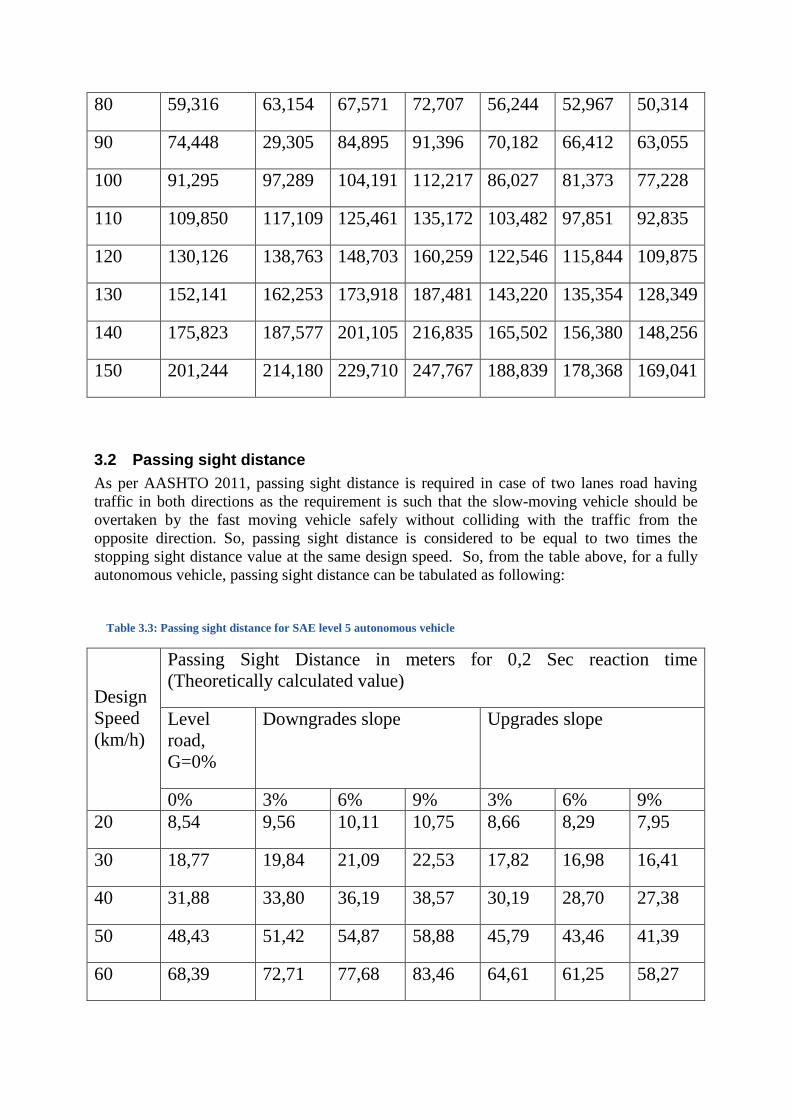
80 59,316 63,154 67,571 72,707 56,244 52,967 50,314
90 74,448 29,305 84,895 91,396 70,182 66,412 63,055
100 91,295 97,289 104,191 112,217 86,027 81,373 77,228
110 109,850 117,109 125,461 135,172 103,482 97,851 92,835
120 130,126 138,763 148,703 160,259 122,546 115,844 109,875
130 152,141 162,253 173,918 187,481 143,220 135,354 128,349
140 175,823 187,577 201,105 216,835 165,502 156,380 148,256
150 201,244 214,180 229,710 247,767 188,839 178,368 169,041
3.2 Passing sight distance
As per AASHTO 2011, passing sight distance is required in case of two lanes road having
traffic in both directions as the requirement is such that the slow-moving vehicle should be
overtaken by the fast moving vehicle safely without colliding with the traffic from the
opposite direction. So, passing sight distance is considered to be equal to two times the
stopping sight distance value at the same design speed. So, from the table above, for a fully
autonomous vehicle, passing sight distance can be tabulated as following:
Table 3.3: Passing sight distance for SAE level 5 autonomous vehicle
Design
Speed
(km/h)
Passing Sight Distance in meters for 0,2 Sec reaction time
(Theoretically calculated value)
Level
road,
G=0%
Downgrades slope Upgrades slope
0% 3% 6% 9% 3% 6% 9%
20 8,54 9,56 10,11 10,75 8,66 8,29 7,95
30 18,77 19,84 21,09 22,53 17,82 16,98 16,41
40 31,88 33,80 36,19 38,57 30,19 28,70 27,38
50 48,43 51,42 54,87 58,88 45,79 43,46 41,39
60 68,39 72,71 77,68 83,46 64,61 61,25 58,27
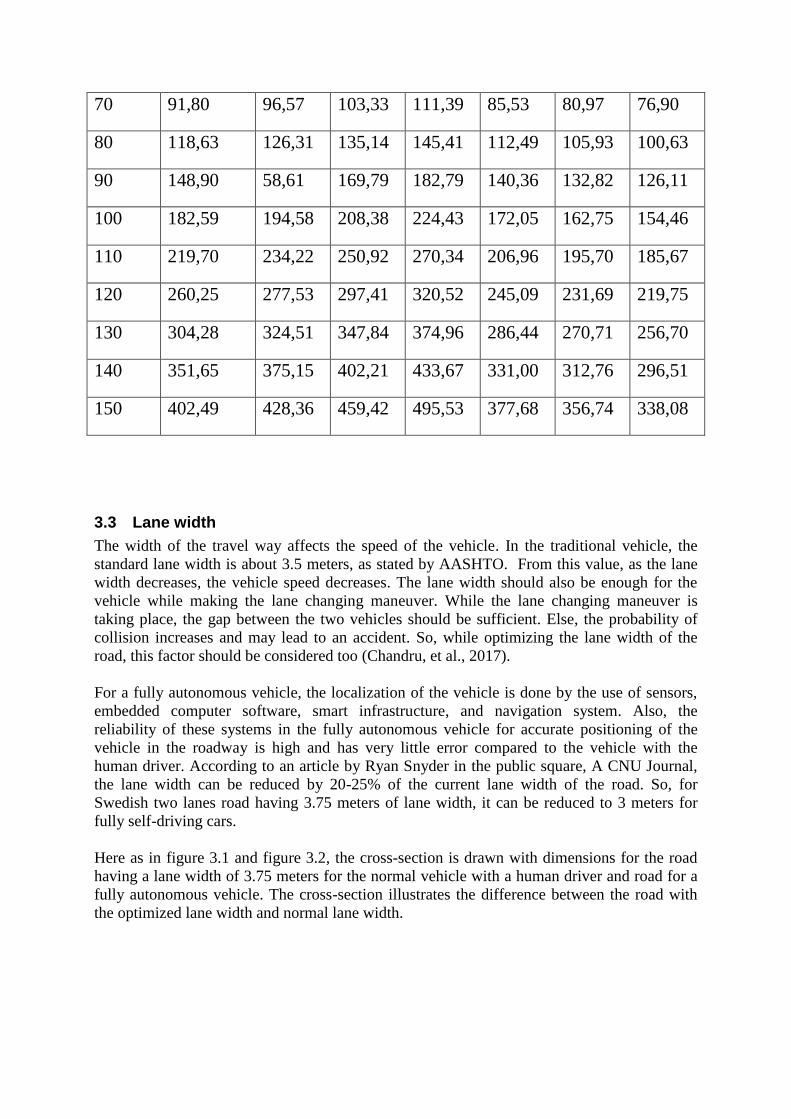
70 91,80 96,57 103,33 111,39 85,53 80,97 76,90
80 118,63 126,31 135,14 145,41 112,49 105,93 100,63
90 148,90 58,61 169,79 182,79 140,36 132,82 126,11
100 182,59 194,58 208,38 224,43 172,05 162,75 154,46
110 219,70 234,22 250,92 270,34 206,96 195,70 185,67
120 260,25 277,53 297,41 320,52 245,09 231,69 219,75
130 304,28 324,51 347,84 374,96 286,44 270,71 256,70
140 351,65 375,15 402,21 433,67 331,00 312,76 296,51
150 402,49 428,36 459,42 495,53 377,68 356,74 338,08
3.3 Lane width
The width of the travel way affects the speed of the vehicle. In the traditional vehicle, the
standard lane width is about 3.5 meters, as stated by AASHTO. From this value, as the lane
width decreases, the vehicle speed decreases. The lane width should also be enough for the
vehicle while making the lane changing maneuver. While the lane changing maneuver is
taking place, the gap between the two vehicles should be sufficient. Else, the probability of
collision increases and may lead to an accident. So, while optimizing the lane width of the
road, this factor should be considered too (Chandru, et al., 2017).
For a fully autonomous vehicle, the localization of the vehicle is done by the use of sensors,
embedded computer software, smart infrastructure, and navigation system. Also, the
reliability of these systems in the fully autonomous vehicle for accurate positioning of the
vehicle in the roadway is high and has very little error compared to the vehicle with the
human driver. According to an article by Ryan Snyder in the public square, A CNU Journal,
the lane width can be reduced by 20-25% of the current lane width of the road. So, for
Swedish two lanes road having 3.75 meters of lane width, it can be reduced to 3 meters for
fully self-driving cars.
Here as in figure 3.1 and figure 3.2, the cross-section is drawn with dimensions for the road
having a lane width of 3.75 meters for the normal vehicle with a human driver and road for a
fully autonomous vehicle. The cross-section illustrates the difference between the road with
the optimized lane width and normal lane width.
Figure 3.1 Cross-section with dimensions of the road with a lane width of 3.75 meters for VHD
Figure 3.2 Cross Section of the road with dimensions for lane width of 3 meters for autonomous vehicle
3.4 Horizontal curve radius according to sight distance requirements
When the traditional vehicle with a human driver transits to a fully autonomous vehicle, the
geometric road design requirement changes. The stopping sight distance value decreases
because of the perception reaction time being reducing to almost zero, and the parameters to
influence the stopping sight distance model are only due to the vehicle dynamics, friction
coefficient, and operating speed of the vehicle.
From sight distance perspectives, the minimum radius of the horizontal curve required also
changes as the stopping sight distance value changes for the autonomous vehicle because of
almost zero value of reaction time (around 0.2 seconds).
The minimum radius of the horizontal curve required depends upon several factors such as
super-elevation, frictional factor and stopping sight distance, presence of sight obstructions,
etc. When the horizontal sightline offset (HSO), also called setback distance value, is low, it
affects the stopping sight distance value, and the radius of the curve required increases. On the
contrary, if the HSO is higher, the required radius of the curve reduces. Also, if the required
sight distance value is increased and the obstruction is fixed, the required minimum radius of
the curve increases too.
In the following cases, the horizontal sightline offset is considered to be the minimum setback
distance, considering the extreme cases of sight obstructions on cutting slopes. In such cases,
the stopping sight distance value governs the radius of the horizontal curve. The stopping
sight distance value is dependent upon the design speed.
So, it becomes necessary to consider the case of the road design for higher stopping sight
distance, which also means designing for higher design speed becomes inclusive for the case
of lower speed value too.
Let us consider the two scenarios as following, which illustrate the required minimum radius
value for the cases of VHD and fully autonomous vehicles.
Case 1: Minimum Radius for VHD based upon sight distance requirement
Let us consider the representative case of the minimum radius of the curve that is based upon
certain cases having sight obstructions. The radius of the horizontal curve is required
normally from the point of view of driving dynamics and sight distance requirements. When
there is sight obstruction, it influences the required radius of the horizontal curve. So, we
consider one extreme case of the horizontal curve where the HSO is very low and having only
the road width accommodated for the line of sight, and that has the cutting slope on the curve.
We are considering the case of two lanes road while optimizing the parameters and analyzing
how the optimized design has a difference with the normal geometric design of road for the
traditional vehicle with human drivers. So, in Sweden design speed of two-lane rural
highways is 90 km/h. For a design speed of 90 km/h, a sight distance of 310 meters is
required for sight distance when designing two lanes road with traffic in both directions. So,
we consider one scenario when the road passes through the horizontal curve in the cutting
slopes. Due to the horizontal curve and slope cutting, the sight distance is limited inside the
cutting slope. If the
the road has the design speed of 90 km/h, and the curved road is going through an extreme cut
slope with lane and shoulder width of 2.75 meters only, then the minimum radius required
depends upon the sight distance requirements, and it is calculated to be equal to 2580 meter
by using AASHTO’s equation.
Case 2: Minimum Radius for self-driving cars based upon sight distance requirements
For a fully self-driving car, the perception reaction time is very low or almost zero. So, the
Stopping sight distance value becomes lower compared to VHD. In the level road, the
stopping sight distance value for an autonomous vehicle for different design speed is
calculated as in the table. When stopping sight distance becomes the governing parameter for
the given scenario of horizontal sight obstructions in the curve, the required radius of the
horizontal curve is affected. Let us consider a situation of two lanes road having fully
autonomous vehicle traffic in either direction, as in case 1. As the road approaches the sharp
horizontal curve, the radius of the curve required from the sight distance perspective is
different from the driving dynamics perspective. In Sweden, normally, two lanes road have a
design speed of 90 km/h and a shoulder width of 2.75 meters. For the design speed of 90 km/h
sight distance required for fully autonomous vehicles on two lanes road, having traffic in both
directions is 150 meters. So, the minimum radius required from the sight distance perspective
is calculated to be around 600 meters.
It can be seen that for an autonomous vehicle according to sight distance requirements, the
horizontal radius can be optimized very effectively, and the road can be designed with the
lower value of radius required from sight distance requirements. The difference between the
minimum radius requirements can be shown by the alignment showing the horizontal curves
using minimum radius value for both of the cases.
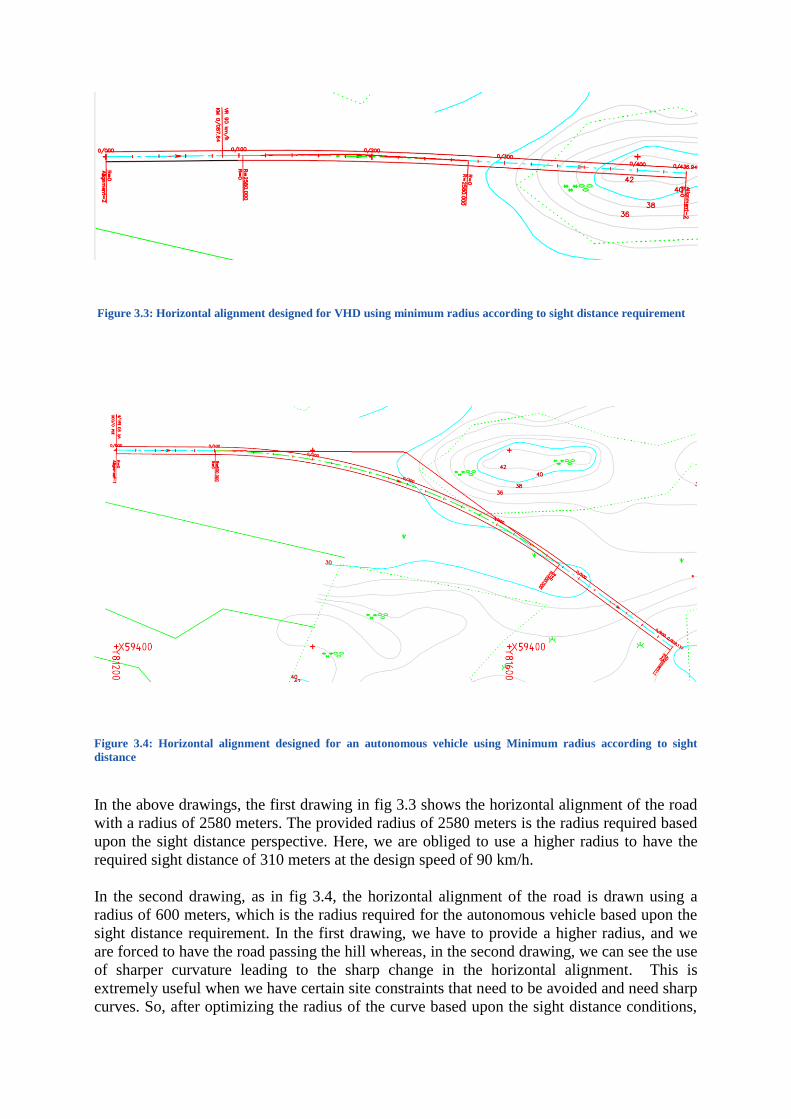
Figure 3.3: Horizontal alignment designed for VHD using minimum radius according to sight distance requirement
Figure 3.4: Horizontal alignment designed for an autonomous vehicle using Minimum radius according to sight
distance
In the above drawings, the first drawing in fig 3.3 shows the horizontal alignment of the road
with a radius of 2580 meters. The provided radius of 2580 meters is the radius required based
upon the sight distance perspective. Here, we are obliged to use a higher radius to have the
required sight distance of 310 meters at the design speed of 90 km/h.
In the second drawing, as in fig 3.4, the horizontal alignment of the road is drawn using a
radius of 600 meters, which is the radius required for the autonomous vehicle based upon the
sight distance requirement. In the first drawing, we have to provide a higher radius, and we
are forced to have the road passing the hill whereas, in the second drawing, we can see the use
of sharper curvature leading to the sharp change in the horizontal alignment. This is
extremely useful when we have certain site constraints that need to be avoided and need sharp
curves. So, after optimizing the radius of the curve based upon the sight distance conditions,
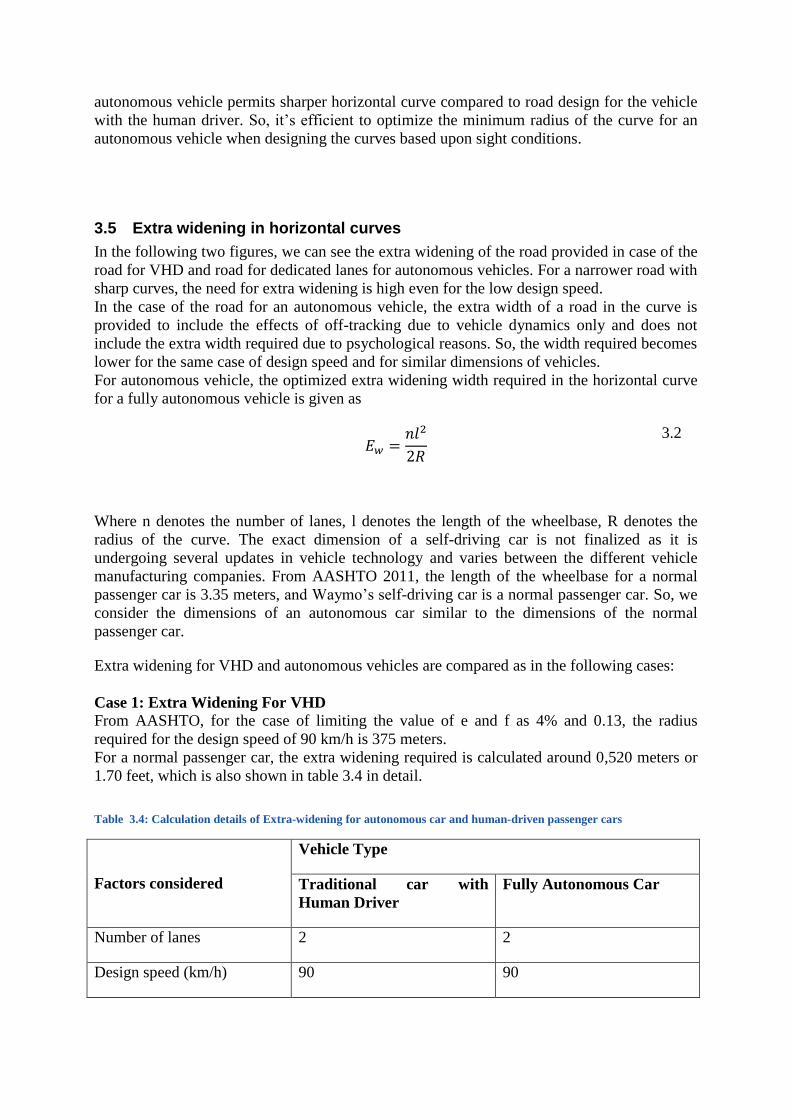
autonomous vehicle permits sharper horizontal curve compared to road design for the vehicle
with the human driver. So, it’s efficient to optimize the minimum radius of the curve for an
autonomous vehicle when designing the curves based upon sight conditions.
3.5 Extra widening in horizontal curves
In the following two figures, we can see the extra widening of the road provided in case of the
road for VHD and road for dedicated lanes for autonomous vehicles. For a narrower road with
sharp curves, the need for extra widening is high even for the low design speed.
In the case of the road for an autonomous vehicle, the extra width of a road in the curve is
provided to include the effects of off-tracking due to vehicle dynamics only and does not
include the extra width required due to psychological reasons. So, the width required becomes
lower for the same case of design speed and for similar dimensions of vehicles.
For autonomous vehicle, the optimized extra widening width required in the horizontal curve
for a fully autonomous vehicle is given as
𝐸𝑤 =
𝑛𝑙2
2𝑅
3.2
Where n denotes the number of lanes, l denotes the length of the wheelbase, R denotes the
radius of the curve. The exact dimension of a self-driving car is not finalized as it is
undergoing several updates in vehicle technology and varies between the different vehicle
manufacturing companies. From AASHTO 2011, the length of the wheelbase for a normal
passenger car is 3.35 meters, and Waymo’s self-driving car is a normal passenger car. So, we
consider the dimensions of an autonomous car similar to the dimensions of the normal
passenger car.
Extra widening for VHD and autonomous vehicles are compared as in the following cases:
Case 1: Extra Widening For VHD
From AASHTO, for the case of limiting the value of e and f as 4% and 0.13, the radius
required for the design speed of 90 km/h is 375 meters.
For a normal passenger car, the extra widening required is calculated around 0,520 meters or
1.70 feet, which is also shown in table 3.4 in detail.
Table 3.4: Calculation details of Extra-widening for autonomous car and human-driven passenger cars
Factors considered
Vehicle Type
Traditional car with
Human Driver
Fully Autonomous Car
Number of lanes 2 2
Design speed (km/h) 90 90
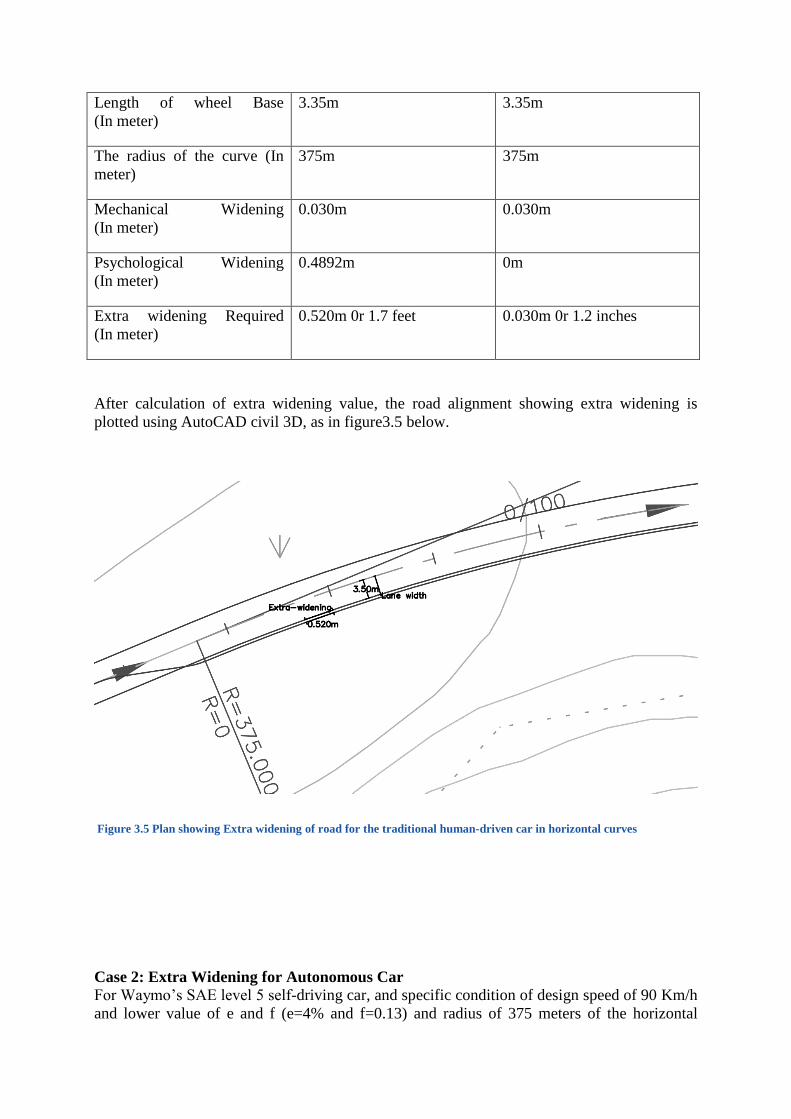
Length of wheel Base
(In meter)
3.35m 3.35m
The radius of the curve (In
meter)
375m 375m
Mechanical Widening
(In meter)
0.030m 0.030m
Psychological Widening
(In meter)
0.4892m 0m
Extra widening Required
(In meter)
0.520m 0r 1.7 feet 0.030m 0r 1.2 inches
After calculation of extra widening value, the road alignment showing extra widening is
plotted using AutoCAD civil 3D, as in figure3.5 below.
Figure 3.5 Plan showing Extra widening of road for the traditional human-driven car in horizontal curves
Case 2: Extra Widening for Autonomous Car
For Waymo’s SAE level 5 self-driving car, and specific condition of design speed of 90 Km/h
and lower value of e and f (e=4% and f=0.13) and radius of 375 meters of the horizontal

curve, the extra widening required is calculated. For this, the psychological widening is
considered to be unnecessary as it does not involve the human driver. Then, the extra
widening value required is calculated to be 0,030 meters. The extra widening value is very
low because of the lower value of design speed, elimination of psychological widening for an
autonomous vehicle and shorter length of wheelbase for passenger car as an off-tracking is
more visible in large vehicles compared to passenger cars and also due to the provision of a
higher value of radius provided according to driving dynamics.
The plan drawing containing extra widening details of road required for an autonomous
vehicle is plotted using AutoCAD Civil 3D, as in figure 3.6 below.
Figure 3.6 Plan showing Extra widening of road for Autonomous car in horizontal curves
The difference between the extra widening required for the traditional car with human drivers
and the fully autonomous car can be seen in the plan drawings as in the figure. In figure 3.5,
the extra widening required is visible as around 0.5 meter extra width of the pavement is
required for a traditional vehicle. And for an autonomous vehicle, just 0.03m of extra width is
required on the horizontal curve, which is almost negligible compared to the widening
requirement for VHD.
But in reality, the extra widening width lesser than 2 feet is considered as not required to be
provided and neglected as per AASHTO 2011 (A policy on geometric design of Highways
and Streets). So, here conclusion can be made that the extra widening required for both of the
cases can be neglected for a design speed of 90 kmph and a curve radius of 375 meters. From
the above results, It can also be inferred that if the design vehicle changes from passenger cars
to larger design vehicles, extra widening required can be significantly optimized for an
autonomous vehicle compared to VHD.
3.6 Minimum Setback Distance
The minimum setback distance required when the vehicle passes through the horizontal curve
is given by the AASHTO’s equation as following:

𝐻𝑆𝑂 = 𝑅 [1 − cos (
28,65𝑆
𝑅)]
3.3
Minimum setback distance is required for both the cases of the vehicle with the human driver
and driverless vehicle. Setback distance decreases with an increase in the radius of the curve
and vice versa. Setback distance depends on the speed of the vehicle, radius of the curve and
required sight distance. In the following two cases, the minimum setback distance is
calculated, and a comparison is made between the setback distance required for a traditional
vehicle with a human driver and a fully autonomous vehicle.
Setback distance for VHD
Let us consider the vehicle is traveling in a two-lane road having a horizontal curve of radius
375 meters with sight restrictions on the inside of the curve at the design speed of 90 km/h. If
the passing sight distance of 320 meters is required, then the required setback distance is
calculated from the equation given by AASHTO, and it is equal to 34.15 meters.
Figure 3.7 Plan showing setback distance requirement for VHD
Also, in a similar situation, the fully autonomous vehicle is travelling through the curve of
radius 375 meters at the design speed of 90 km/h. Then the required design passing sight
distance for a fully autonomous vehicle is 160 meters, and by using AASHTO’s equation for
horizontal sightline offset, the minimum value of setback distance is calculated to be 8.55
meters.
So, the minimum setback distance required for an autonomous vehicle can be greatly reduced
in the case of an autonomous vehicle when sight distance and minimum radius provided is
just sufficient from driving dynamics. It means we can have horizontal curves with the lower
value of the side cut for an autonomous vehicle compared to a traditional vehicle with a
human driver. This difference between these two cases can be illustrated in figure 3.7 and
figure 3.8.

Figure 3.8: Plan showing setback distance requirement for autonomous cars
From the above result, it can also be inferred that if the stopping sight distance value is used
instead of passing sight distance, then the required setback distance will be even lower for the
traditional vehicle with a human driver and also for autonomous vehicles.
3.6.1 Vertical Alignment
While designing the vertical curve, mainly stopping sight distance and headlight sight
distance criteria governs the design requirement. So, while optimizing it for specific
autonomous vehicle type, the height of sensors and angle of inclination of the headlight beam
is considered. So, here optimization is done to find the minimum radius of curvature for the
fully autonomous car considering Waymo’s self-driving car as a reference vehicle and
traditional normal passenger car for reference vehicle for VHD.
When designing the crest vertical curve, the height of the crest affects the sight distance of the
curve. If the curve is longer and has more curvature, it provides more sight distance.
However, it is not always feasible and economical to have a curve with very high curvature as
topography, design constraints and financial aspect due to cutting and filling volume play a
significant role in highway design.
In the following four cases, the minimum rate of a radius of curvature (K) value for VHD and
the autonomous car is determined at first. ‘K’ value represents the horizontal distance along
which 1% grade change occurs on the vertical curve. After determining the minimum ‘K’
value, we take the specific situation in some random topography and design the given
segments of road in civil 3D using the cases for autonomous vehicle and traditional vehicle
where topography demands the use of crest vertical curves and sag vertical curves and
required earthwork is calculated.
Case 1: Crest Vertical curve design for VHD Let us consider a situation when a normal passenger car with a human driver is traveling in
two lanes road having traffic in both directions at 90km/h, which needs a minimum passing
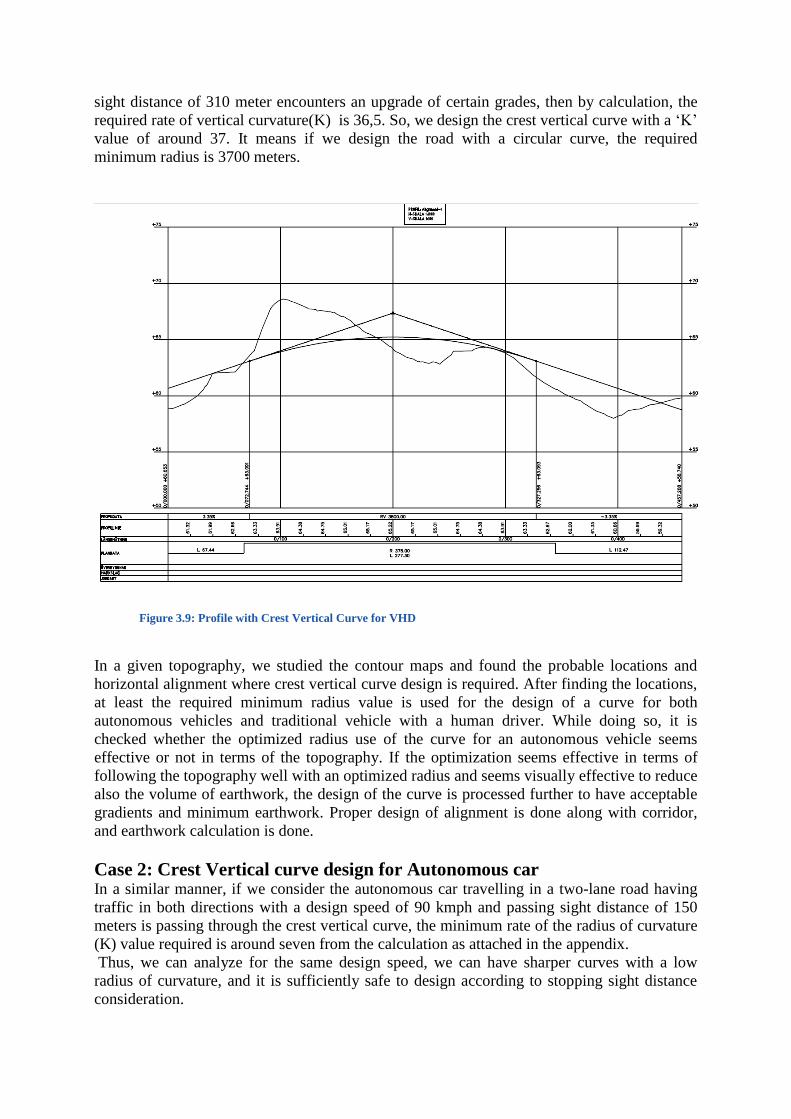
sight distance of 310 meter encounters an upgrade of certain grades, then by calculation, the
required rate of vertical curvature(K) is 36,5. So, we design the crest vertical curve with a ‘K’
value of around 37. It means if we design the road with a circular curve, the required
minimum radius is 3700 meters.
Figure 3.9: Profile with Crest Vertical Curve for VHD
In a given topography, we studied the contour maps and found the probable locations and
horizontal alignment where crest vertical curve design is required. After finding the locations,
at least the required minimum radius value is used for the design of a curve for both
autonomous vehicles and traditional vehicle with a human driver. While doing so, it is
checked whether the optimized radius use of the curve for an autonomous vehicle seems
effective or not in terms of the topography. If the optimization seems effective in terms of
following the topography well with an optimized radius and seems visually effective to reduce
also the volume of earthwork, the design of the curve is processed further to have acceptable
gradients and minimum earthwork. Proper design of alignment is done along with corridor,
and earthwork calculation is done.
Case 2: Crest Vertical curve design for Autonomous car In a similar manner, if we consider the autonomous car travelling in a two-lane road having
traffic in both directions with a design speed of 90 kmph and passing sight distance of 150
meters is passing through the crest vertical curve, the minimum rate of the radius of curvature
(K) value required is around seven from the calculation as attached in the appendix.
Thus, we can analyze for the same design speed, we can have sharper curves with a low
radius of curvature, and it is sufficiently safe to design according to stopping sight distance
consideration.
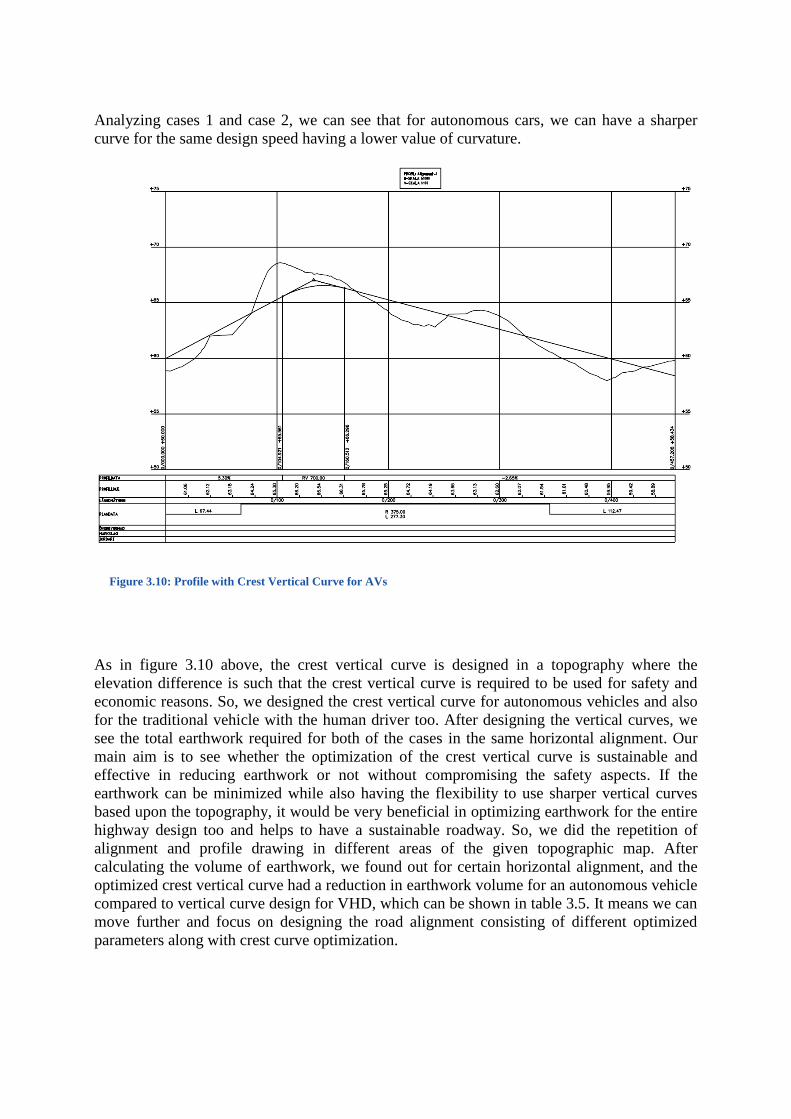
Analyzing cases 1 and case 2, we can see that for autonomous cars, we can have a sharper
curve for the same design speed having a lower value of curvature.
Figure 3.10: Profile with Crest Vertical Curve for AVs
As in figure 3.10 above, the crest vertical curve is designed in a topography where the
elevation difference is such that the crest vertical curve is required to be used for safety and
economic reasons. So, we designed the crest vertical curve for autonomous vehicles and also
for the traditional vehicle with the human driver too. After designing the vertical curves, we
see the total earthwork required for both of the cases in the same horizontal alignment. Our
main aim is to see whether the optimization of the crest vertical curve is sustainable and
effective in reducing earthwork or not without compromising the safety aspects. If the
earthwork can be minimized while also having the flexibility to use sharper vertical curves
based upon the topography, it would be very beneficial in optimizing earthwork for the entire
highway design too and helps to have a sustainable roadway. So, we did the repetition of
alignment and profile drawing in different areas of the given topographic map. After
calculating the volume of earthwork, we found out for certain horizontal alignment, and the
optimized crest vertical curve had a reduction in earthwork volume for an autonomous vehicle
compared to vertical curve design for VHD, which can be shown in table 3.5. It means we can
move further and focus on designing the road alignment consisting of different optimized
parameters along with crest curve optimization.
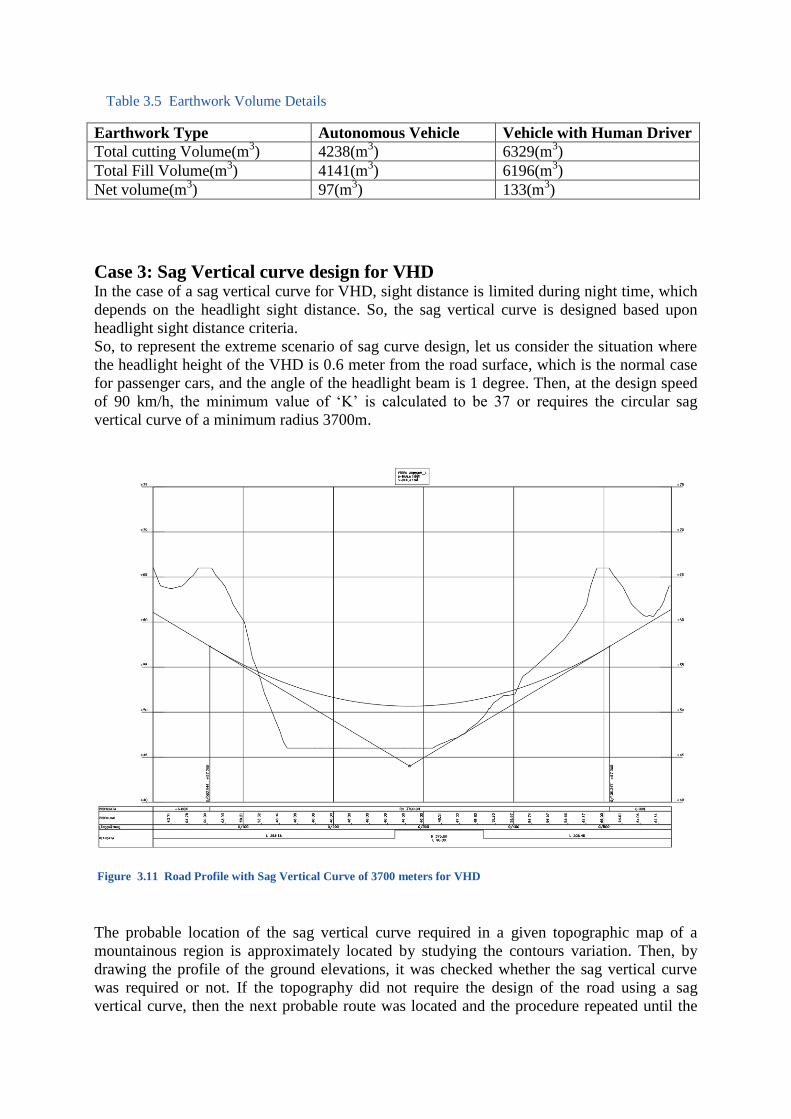
Table 3.5 Earthwork Volume Details
Earthwork Type Autonomous Vehicle Vehicle with Human Driver
Total cutting Volume(m3) 4238(m
3) 6329(m
3)
Total Fill Volume(m3) 4141(m
3) 6196(m
3)
Net volume(m3) 97(m
3) 133(m
3)
Case 3: Sag Vertical curve design for VHD In the case of a sag vertical curve for VHD, sight distance is limited during night time, which
depends on the headlight sight distance. So, the sag vertical curve is designed based upon
headlight sight distance criteria. So, to represent the extreme scenario of sag curve design, let us consider the situation where
the headlight height of the VHD is 0.6 meter from the road surface, which is the normal case
for passenger cars, and the angle of the headlight beam is 1 degree. Then, at the design speed
of 90 km/h, the minimum value of ‘K’ is calculated to be 37 or requires the circular sag
vertical curve of a minimum radius 3700m.
Figure 3.11 Road Profile with Sag Vertical Curve of 3700 meters for VHD
The probable location of the sag vertical curve required in a given topographic map of a
mountainous region is approximately located by studying the contours variation. Then, by
drawing the profile of the ground elevations, it was checked whether the sag vertical curve
was required or not. If the topography did not require the design of the road using a sag
vertical curve, then the next probable route was located and the procedure repeated until the

design of vertical alignment demanded the use of a sag vertical curve. For a given alignment
of two lanes road with a lane width of 3.5 meters, the quantity of cut and fill volume was
calculated. The calculation provided by AutoCAD civil 3D provided results as in table 3.6
later.
Case 4: Sag Vertical curve for Autonomous Vehicle For autonomous vehicles from Waymo, the given headlight height is considered as 0.6
meters, and the angle of the headlight beam is 1 degree from horizontal, as stated in the earlier
section too. So, let us consider a situation where the road is to be designed for 90 km/h of
design speed with a sight distance requirement of at least 75 meters. By calculation from
headlight sight distance criteria, the minimum required ‘K’ value is around 15. But according
to comfort criteria, the rate of the radius of curvature (K) is 20. Therefore, we can use the
minimum radius of curvature as 2000 in the case of an autonomous vehicle. If user comfort is
compromised in case of unavoidable constraints where providing a 2000 meter radius is not
possible, we can design with a ‘K’ value of 1500 meter.
For a given topographic map, we considered the different horizontal alignment design and
vertical curve design for traditional vehicles and fully autonomous vehicles. For some routes,
we found out the topography demanded the design of a sag vertical curve. Then, we designed
the sag vertical curve for the traditional vehicle with a human driver and also for the fully
autonomous vehicle. While designing the curve, careful attention was given to maximum
grade limits of 6% according to the Swedish limit for huge gradient cases, and a 6% grade
limit affects less for passenger cars compared to trucks and other heavy vehicles.
Figure 3.12 : Road profile with Sag Vertical Curve of radius 2000 meter For Autonomous Vehicle
Actually, in the above topography, it is favorable for bridge construction because of the
horizontal distance, elevation of the starting and endpoint of the alignment. Nevertheless, the
resource required is huge for bridge construction, and as an alternative solution, we can
design a sag vertical curve like figure 3.12 and 3.13 and design the culverts beneath the sag
curve. For this, the balance between cutting and filling of the existing ground is maintained,
and alignment is designed.
So from above case 3 and 4, we can analyze that autonomous car can be designed for very
sharp curvature of sag vertical curve compared to the vertical curve design for the traditional
vehicle with a human driver and also shows based upon the existing terrain level, it can
optimize the total earthwork also and becomes helpful in maintaining mass balance over the
length of the designed road.
In just around six hundred meters in length, the curve design for the normal vehicle with
human and fully autonomous vehicles yielded the following results.
Table 3.6 Details of Earthwork Volume in Sag vertical Curve
Earthwork Type Autonomous Vehicle Vehicle with Human Driver
Total cutting Volume(m3) 23254(m
3) 27235(m
3)
Total Fill Volume(m3) 23189(m
3) 24393(m
3)
Net volume(m3) 65(m
3) 2842 (m
3)
The result in the table above shows that without compromising the sight distance
requirements, the huge reduction of minimum radius of curvature brought the reduction of
earthwork in considered alignment to a huge extent. The earthwork net volume is quite
balanced for AVs while it has a higher cut volume for VHD, thus reducing sustainability.
Optimizing the vertical curve radius became very useful in the design of the road for an
autonomous vehicle here as we can design the alignment with more freedom and can have
more flat curves when the topography demands a flatter curve and also use sharper curves
when the topography demands sharper vertical curves like this case.

4 Case Study of Road Design
After finalizing the geometric design parameters for an autonomous vehicle in chapter 3, the
road design is done for the vehicle with the human driver and also for the fully autonomous
vehicle. The design is compared in terms of sustainability and analyzed whether the
optimization of the geometric design parameter is sustainable or not in terms of pavement
material, earthwork volume, environmental sustainability, etc.
In a certain topographic environment, the road was needed to be designed for both the vehicle
with a human driver and autonomous vehicle and followed by a sustainability check. So, the
road was designed for a normal passenger car with a human driver and also for SAE level 5
autonomous car from Waymo. The road designed includes the extreme cases of cutting and
filling, use of a number of horizontal curves with different dimensions along with the use of
sag vertical curve and crest vertical curves of varying radius as required by the topography.
The road is designed as a two-lane roadway at the design speed of 90 kmph having traffic in
both directions.
The cross-section consists of the normal road cross-sections with two lanes and one added
shoulder on each side. While in cutting slope, the road section consists of cut width towards
the inside of the curve for required setback distance. Roadside features are not considered into
the design aspects here apart from shoulder. We are more concerned with the requirement of
proper setback distance, proper vertical curve radius, proper lane width, proper shoulder width
use, required extra widening use and optimize the earthwork and pavement material cost.
While designing the road, the following considerations have been applied for both cases.
Table 4.1 Details of Road Design Consideration
Components Vehicle with human Driver
Autonomous vehicle
Design Environment Mountainous Topography Mountainous Topography
Design Speed 90 Kmph 90 Kmph
Lane width 3.75 meter 3 meter
Number of lanes 2 2
Traffic Flow Two way Two way
Alignment Type Undivided Crowned Undivided Crowned
Shoulder Width 2.40 meter 2.40 meter
Super-elevation 4% 4%
Horizontal Curve Radius 375 meter, 760 meter 375 meter, 760 meter
Vertical Curve Minimum Crest Curve Radius: 3800m Crest Curve Radius: 700m
Radius Sag curve Radius: 3700m Sag curve Radius: 2000m
Minimum Setback distance
for 375 meter curve radius
34.15 meter 8.5 meter
Setback distance for 760
meter curve radius
16.85 meter 4.20 meter
Pavement layer 4 nos. 4 nos.
Horizontal Alignment
In certain topography of rural areas, the two-lane road was needed to be designed for
traditional vehicle with a human driver and also for autonomous cars and find out whether the
optimized design is sustainable or not. For this, we design the same horizontal alignment for
both of the designs and make the variation in vertical alignment according to the minimum
radius of the curve required. The alignment drawn shows the variation of radius required
according to the design requirements to connect two locations. So, the alignment uses the two
horizontal curves of the radius of 375 meters and one horizontal curve of radius 760 meters.
In the designed horizontal alignment, the road passes through the hills initially before the
horizontal curve starts with a radius of 375 meters. After the horizontal curve ends, it passes
through the straight road section, which then follows through the hill with a radius of 760
meters. The road is followed by straight sections and followed by a horizontal curve of 375
meters.
Profile
The vertical alignment of the given topography is varying gradually with hills and sharp
changes in elevations. So, the vertical alignment design demanded the use of crest and sag
vertical curves of varying radius along with some straight road sections. The profile for VHD
and the autonomous vehicle is given in the appendix attached at the end of the report.
The profile for VHD consists of two crest vertical curves and two sag vertical curves. The
profile is designed considering the gradient limitation of 6% and the minimum radius of
curvature and drainage consideration.
The profile design for the autonomous vehicle required more number of curves (two crest and
four sag curves) over the same alignment and length because of favoring sharp vertical curves
in short horizontal distance.
Cross Sections
The cross-section consists of typical sections for VHD as attached in appendix B. The
different sections are normal section when there is no cutting slope, the section which consists
of cutting slope with setback distance on the left side of the road for curve radius of 375
meters, the section which consists of cutting slope and setback distance on right side of the
road of curve radius of 760 meters and the section with setback distance on the left side of the
curve of the radius of 375 meters. For sectional drawings, four assemblies were drawn on civil

3D and used for the corridor creation. Assembly represents the cross-sectional design of the
road and used in corridor creation.
Similarly, typical cross-sections are drawn for the autonomous vehicles also as in Appendix
A. these typical cross-sections represent the section in cutting and filling with different cases
of setback distance and horizontal curve radius.
Corridor
The corridor is the three-dimensional representation of the road. The corridor for autonomous
vehicles and VHD is attached as in the appendix. The corridor for VHD clearly shows
covering the larger areas compared to the corridor for autonomous vehicles. Setback distance
on cutting can also be observed to be more on a lower radius curve compared to cutting in a
higher radius curve.
4.1 Results and Discussions In civil 3D, the design involved the same centerline location of the road with different lane
width and varying side cuts and vertical curve radius. From the corridor and section, we can
clearly see that the reduction in the side cut and lane width of the road for the autonomous
vehicles made the corridor region look smaller. But in the case of VHD, in a certain segment
of road in cutting, the corridor looked bigger in areas. Also, the cross-sectional view of the
road showed that different types of sections in cutting and filling was seen because of the
varying radius of the left or right-hand side curve.
After making the design and analysis by Civil3D, the total volume of cutting and filling is
analyzed. It also calculates the total volume of pavement materials and material quantity of
pavement by specific layers too. The result obtained from Civil3D is listed in the table below.
4.2 Quantity of material calculated by Civil 3D.
Description Vehicle with
human driver
Autonomous Vehicle
Cumulative Cut
Volume(m3)
121392 88126
Cumulative Fill
Volume(m3)
110652 84561
Net Volume(m3) 10740 3565
Pavement surface layer
volume (m3)
681.5 599
The total surface area of
the pavement surface
layer (m2)
27260
23960
From the result in table 4.2, the volume of cutting and filling work is significantly lesser in the
case of an autonomous vehicle compared to that of VHD. Also, the net volume is quietly
balanced for an autonomous vehicle compared to VHD. During excavation work, all the
excavated cut cannot be used in filling as all the excavated soil might not be suitable for
filling and also the organic materials, like trees, plants cannot be used in filling. So, the
remaining extra volume of cut available may not require hauling to the landfill site.
Also, pavement material calculation shows that the total volume of the surface layer of
pavement material is 681.50 cubic meters for VHD and around 600 cubic meters for
autonomous cars.
The thickness of the pavement considered is 0.025 meters. It means, by calculation, the
surface areas of pavement is 27260 meter square for VHD and 23960 meter square for
autonomous cars. When the pavement area is reduced, the environmental impact of
construction is also reduced. It also shows that along with earthwork, pavement material
volume is also reduced while optimizing the geometric design of the road for an autonomous
vehicle. So, optimizing the existing geometric design for autonomous vehicles is more
sustainable in terms of cost, the quantity of material and minimizing the environmental
impacts.
5 Conclusion and Future Works
The thesis work started with the literature study of the state of the art of an autonomous
vehicle along with its impact. It provided information that autonomous vehicle technology
affects widely from the change in user safety, travel behavior, socio-economic impacts on
legal and environmental aspects. Also, it was understood that the optimization of geometric
design parameters of the road for autonomous vehicles is feasible. The factors that can be
optimized for the geometric design of the road for autonomous vehicles start with the
elimination of human error, lowering perception reaction time and improved sight distance,
improved braking efficiency, etc. As most of the geometric design parameters are based upon
the SSD model, reducing the minimum required stopping sight distance reduced minimum
required geometric dimensions such as horizontal radius of the curve, the curvature of vertical
curves, setback distance, extra widening, etc. For optimizing SSD, reaction time was taken as
0.2 seconds and stopping sight distance value was also calculated for different design speeds.
Also, SSD calculation based upon reaction time value showed that lowering the reaction time
lowered the minimum stopping sight distance requirement.
Based upon the stopping sight distance, the minimum radius of the horizontal curve was
calculated and compared to that for VHD. Also, lane width, extra widening requirement,
setback distance requirement, vertical curve radius requirement was also formulated for an
autonomous vehicle. After formulating the design parameter, the road design was done using
AutoCAD Civil 3D software for VHD and SAE level 5 autonomous vehicles. The study
showed that the geometric design parameters could be optimized and the optimization brings
a reduction in the minimum required geometric design value for the autonomous vehicle
along with the reduction in net earthwork volume, pavement material volumes, and
environmental impacts. By reduction in cutting volume, filling volume, net earthwork

volume, material volume and total surface area of pavements, the total cost of road
construction also gets reduced, thereby making optimization sustainable.
This project is the preliminary study of the sustainability of the optimization of a road design
for an autonomous vehicle in terms of efficient dimension, safety, earthwork quantity. It
included the comparison made between the traditional road design approach for VHD and the
optimized road design approach for an autonomous vehicle. Here, the geometric design of the
road is optimized for an autonomous vehicle without considering the pavement structural
differences for human-driven vehicles and autonomous vehicles. Autonomous vehicles are
capable of following the same path continuously. When the lane width is optimized for the
autonomous vehicle, repeated wheel loading occurs on the same part of the roadway, which
makes the faster pavement deterioration on that portion. So, the rutting occurs more quickly
compared to the pavement for non-autonomous vehicles. So, this aspect should be considered
in future studies too. Also, the optimized road design was targeted for the case of dedicated
lanes for autonomous vehicles only. Consideration was not made for mixed traffic conditions
during a transitional phase, where the roads will be shared by both human-driven vehicles and
autonomous vehicles both. Also, we can expect that there will always be some non-
autonomous vehicles on the road in near future. So, in future studies of geometric design, this
can be considered too. However, optimization considering autonomous vehicles only is
especially useful in a closed environment such as the mining industry, ports, transporting
goods, etc., where other human-driven vehicles are not allowed.
Since geometric design has a wider scope apart from this thesis objective too, following future
studies are suggested within this field.
Optimization of geometric design of road for mixed traffic conditions.
Optimization of geometric design of roundabouts and intersections.
Optimization of turning radius of the road for the autonomous vehicle using Autodesk
swept path analysis tools.
Since the result of preliminary sustainability analysis gave promising results, we can
design the road with a further detailed design consisting of all the required roadside
structures and also in the urban environment.
Optimizing the reaction time of autonomous vehicles with a further detailed study on
autonomous vehicle property, which can help in further optimizing the geometric
design parameters of road.
Study of rutting behaviors on pavement structure by the autonomous vehicle.
6 References
AASHTO, 2011. A policy On geometric Design of Highways And Street. u.o.:AASHTO.
AASHTO, 2011. AASHTO Roadside Design Guide. u.o.:u.n.
Anon., 1996. Intersection Sight Distance, Washington D.C.: Transport Research Board.
Anon., 2011. A policy on Geometric Design Of highway and streets. i: u.o.:AASHTO.
Anupoju, S., 2020. The Constructor. [Online]
Available at: https://theconstructor.org/transportation/superelevation-design-highway-
engineering/10998/
Bowman, J. J., 2016. FMI. [Online]
Available at: https://www.fminet.com/fmi-quarterly/article/2016/09/how-autonomous-
vehicles-will-change-the-future-of-road-design-and-construction/
[Använd 07 09 2020].
California Department of Transportation, u.d. Highway Design Manual. u.o.:California
Department of Transportation.
Chandru, R. o.a., 2017. Safe Autonomous Lane Changes in Dense Traffic. u.o., u.n.
Chen, X. o.a., 2017. Evaluating the impacts of grades on vehicular speeds on interstate
highways.
Cheu, R., 2006. Geometric Design. i: The textbook of Highway Engineering. u.o.:Taylor &
Francis Group, LLC.
Devid et al, 2017. Report on the state of the art of connected and automated driving in Europe
(Final), u.o.: SCOUT.
Diaz, M. M., Soriguera, F. & Perez, I., 2018. Autonomous driving: a bird's eye view. The
Institution of Engineering and Technology.
Fwa, T., 2006. The Hand book Of Highway Engineering. u.o.:Taylor And Francis Group.
Gaca, S. & Kiec, M., u.d. Impact of Human Factor on Speed choice2015. Györ, IEEE.
Ivanchev et al, 2017. Potential and Implications of Dedicated Highway Lanes for
Autonomous Vehicles. September.
Jun, M. & Markel, T., 2014. Infrastructure-based sensors augmenting efficient autonomous
vehicle operations, u.o.: National renewable laboratory.
Kocic, J., Jovicic, N. & Drndarevic, V., 2018. Sensors and Sensor Fusion in Autonomous
Vehicles. u.o., u.n.
Liu, H., Rodgers, M. O. & Guensler, R., 2019. The impact of road grade on vehicle
accelerations behavior, PM2.5 emissions, and dispersion modelling. ScienceDirect.
McGee, H. W. & Alexandria, 2020. Decision Sight Distance for Higwhay Design And Traffic
Control Requirements. [Online]
Available at: http://onlinepubs.trb.org/Onlinepubs/trr/1979/736/736-003.pdf
Namala, R. S. & Rys, J. M., 2006. Automated Calculation of Passing Sight Distance using
global positioning system data, u.o.: u.n.
NHTSA, 2013. Policy On Automated Vehicles. [Online]
Available at:
https://www.nhtsa.gov/staticfiles/rulemaking/pdf/Automated_Vehicles_Policy.pdf
[Använd 07 04 2020].
Nicholas J. Garber, L. A. H., 2009. Traffic And Highway Engineering. u.o.:u.n.
Rablau, C., 2019. Lidar: a new self-driving vehicle for introducing optics to broader
engineering and non-engineering audiences. [Online].
SAE International, 2018. Taxonomy and Definitions for Terms Related to Driving Automation
Systems for On-Road Motor Vehicles. [Online]
Available at: https://www.sae.org/standards/content/j3016_201806/
Sautya, M., 2019. Extra Widening Of pavement on curve road. [Online]
Available at: www.civilnoteppt.com
Snyder, R., 2018. Street Design Implications of Autonomous Vehicles, u.o.: Public Square: A
CNU journal.
Union Of concerned Scientists, 2017. Self DrivinG Cars Explained. [Online]
Available at: https://www.ucsusa.org/resources/self-driving-cars-101
Welde, Y. & Qiao, F., u.d. Effects of Autonomous and Automated Vehicles on Stopping
Sight Distance and Vertical Curves in Geometric Design. ASCE.
Wolhuter, K. M., u.d. Geometric Design of Roads Handbook. u.o.:CRC Press.
7 Appendix
APPENDIX- Contents
Appendix A Cross Section of the road for autonomous vehicle
Appendix B Cross Section of the road for the vehicle with the human driver
Appendix C Profile Drawing
Appendix D Horizontal Alignment
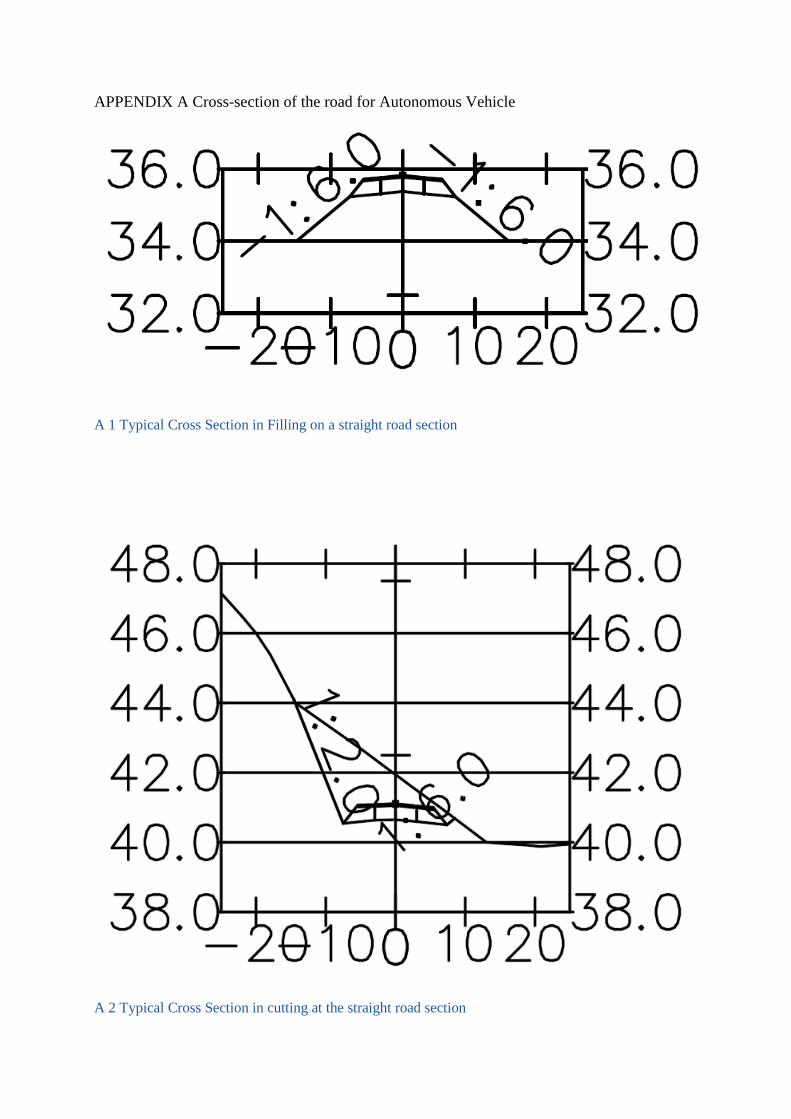
APPENDIX A Cross-section of the road for Autonomous Vehicle
A 1 Typical Cross Section in Filling on a straight road section
A 2 Typical Cross Section in cutting at the straight road section
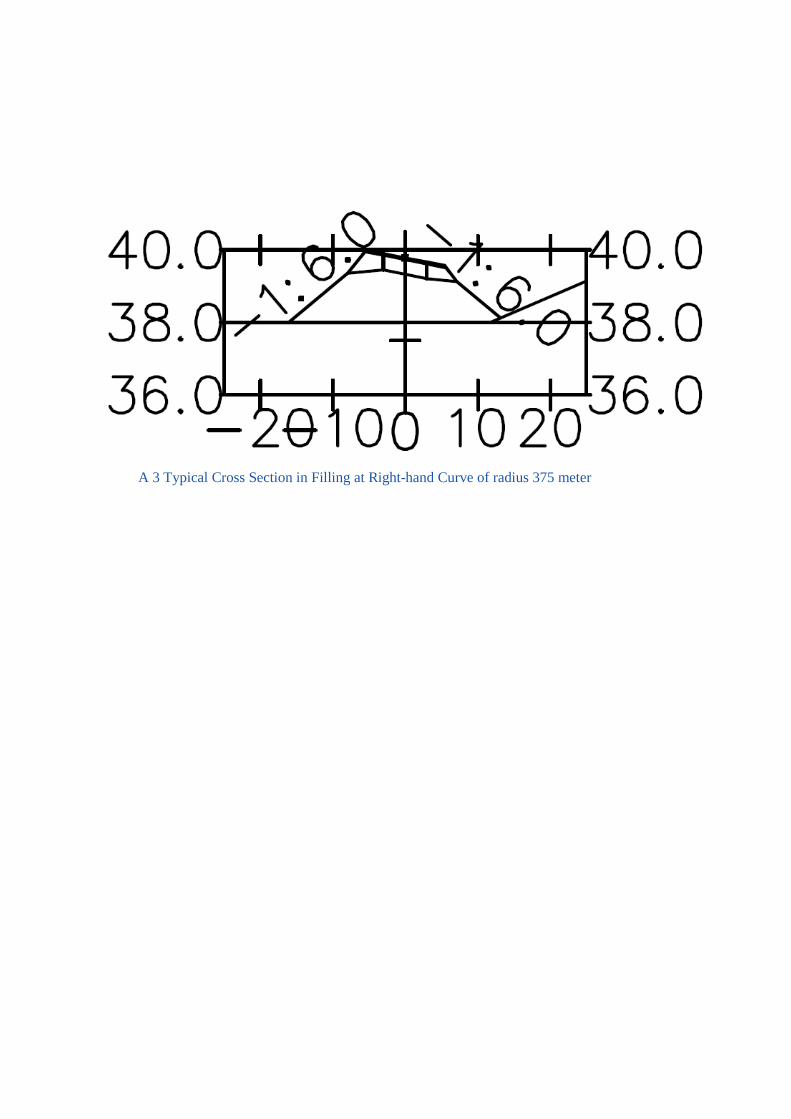
A 3 Typical Cross Section in Filling at Right-hand Curve of radius 375 meter

A 4 Typical Cross Section in cutting at the right-hand horizontal curve of radius 375 meter
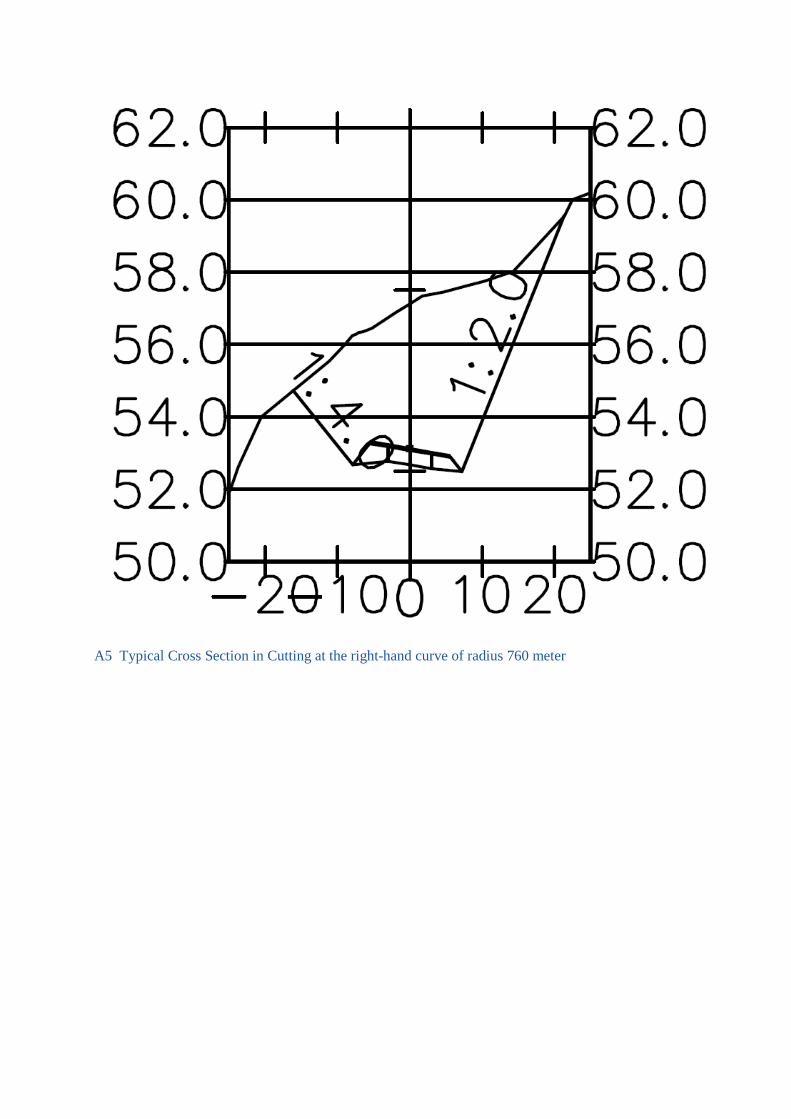
A5 Typical Cross Section in Cutting at the right-hand curve of radius 760 meter
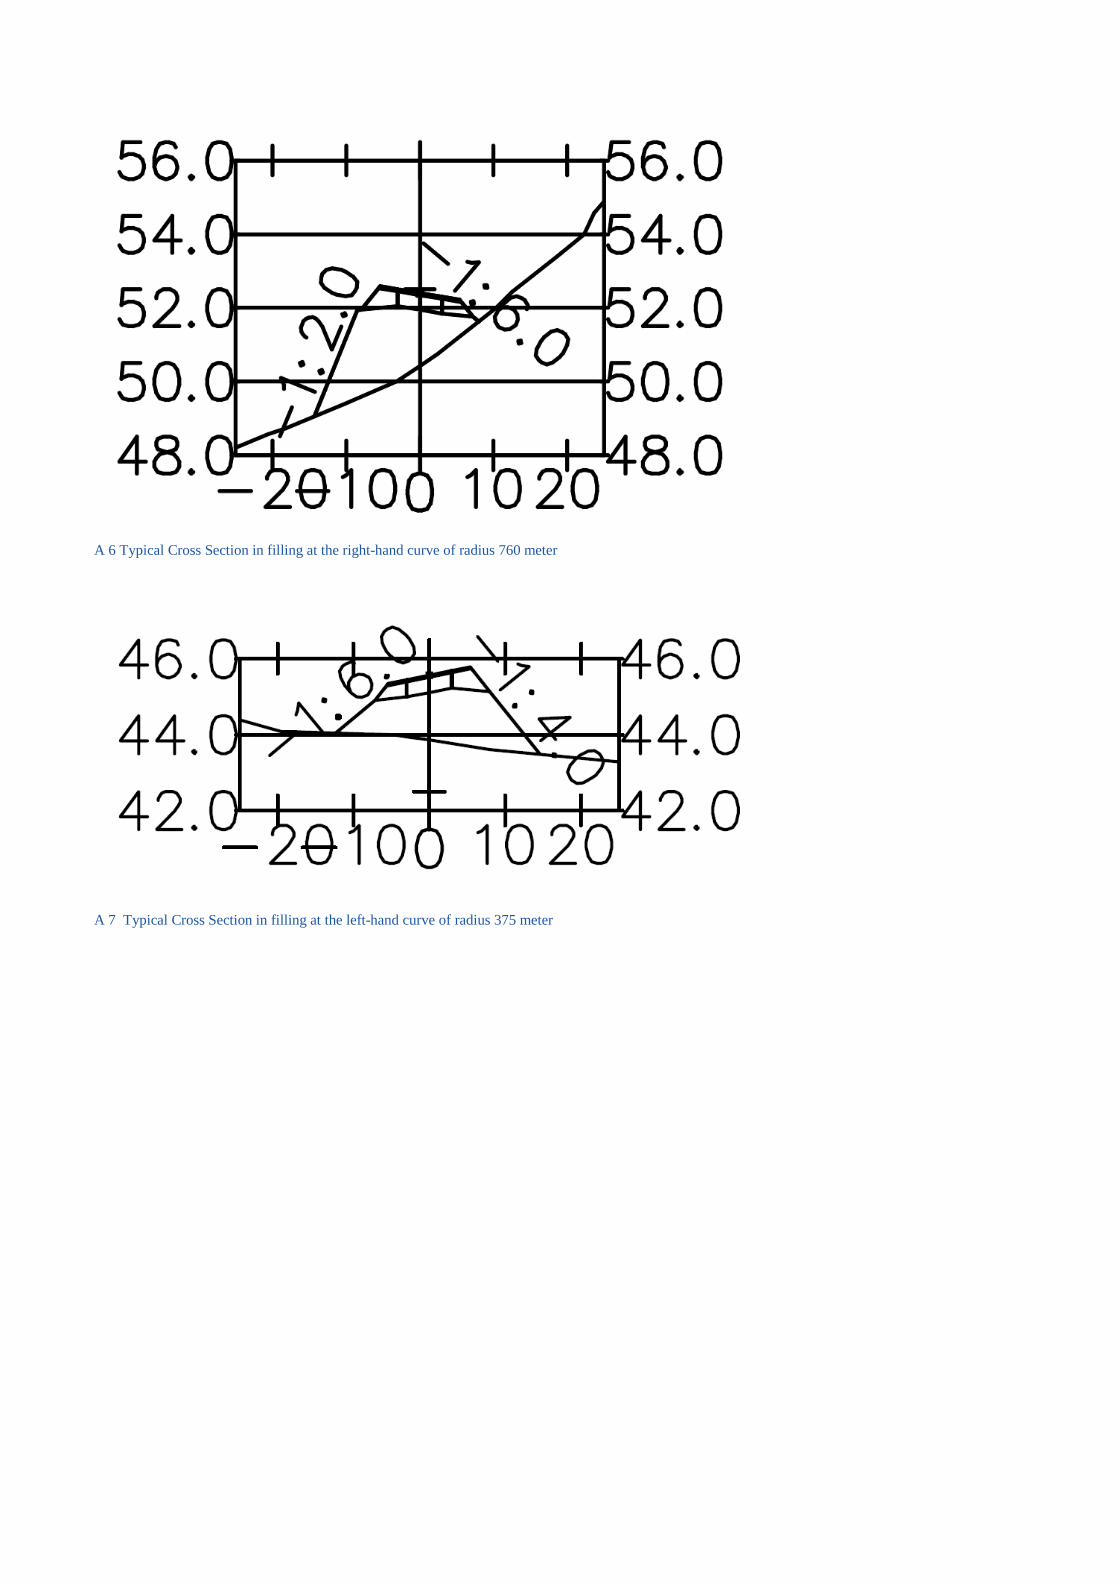
A 6 Typical Cross Section in filling at the right-hand curve of radius 760 meter
A 7 Typical Cross Section in filling at the left-hand curve of radius 375 meter

A 8 Typical Cross-section in cutting at the left-hand curve of radius 375 meter
Appendix B Cross Section of the road for VHD
B 1 Typical cross-section in cutting at the straight road section
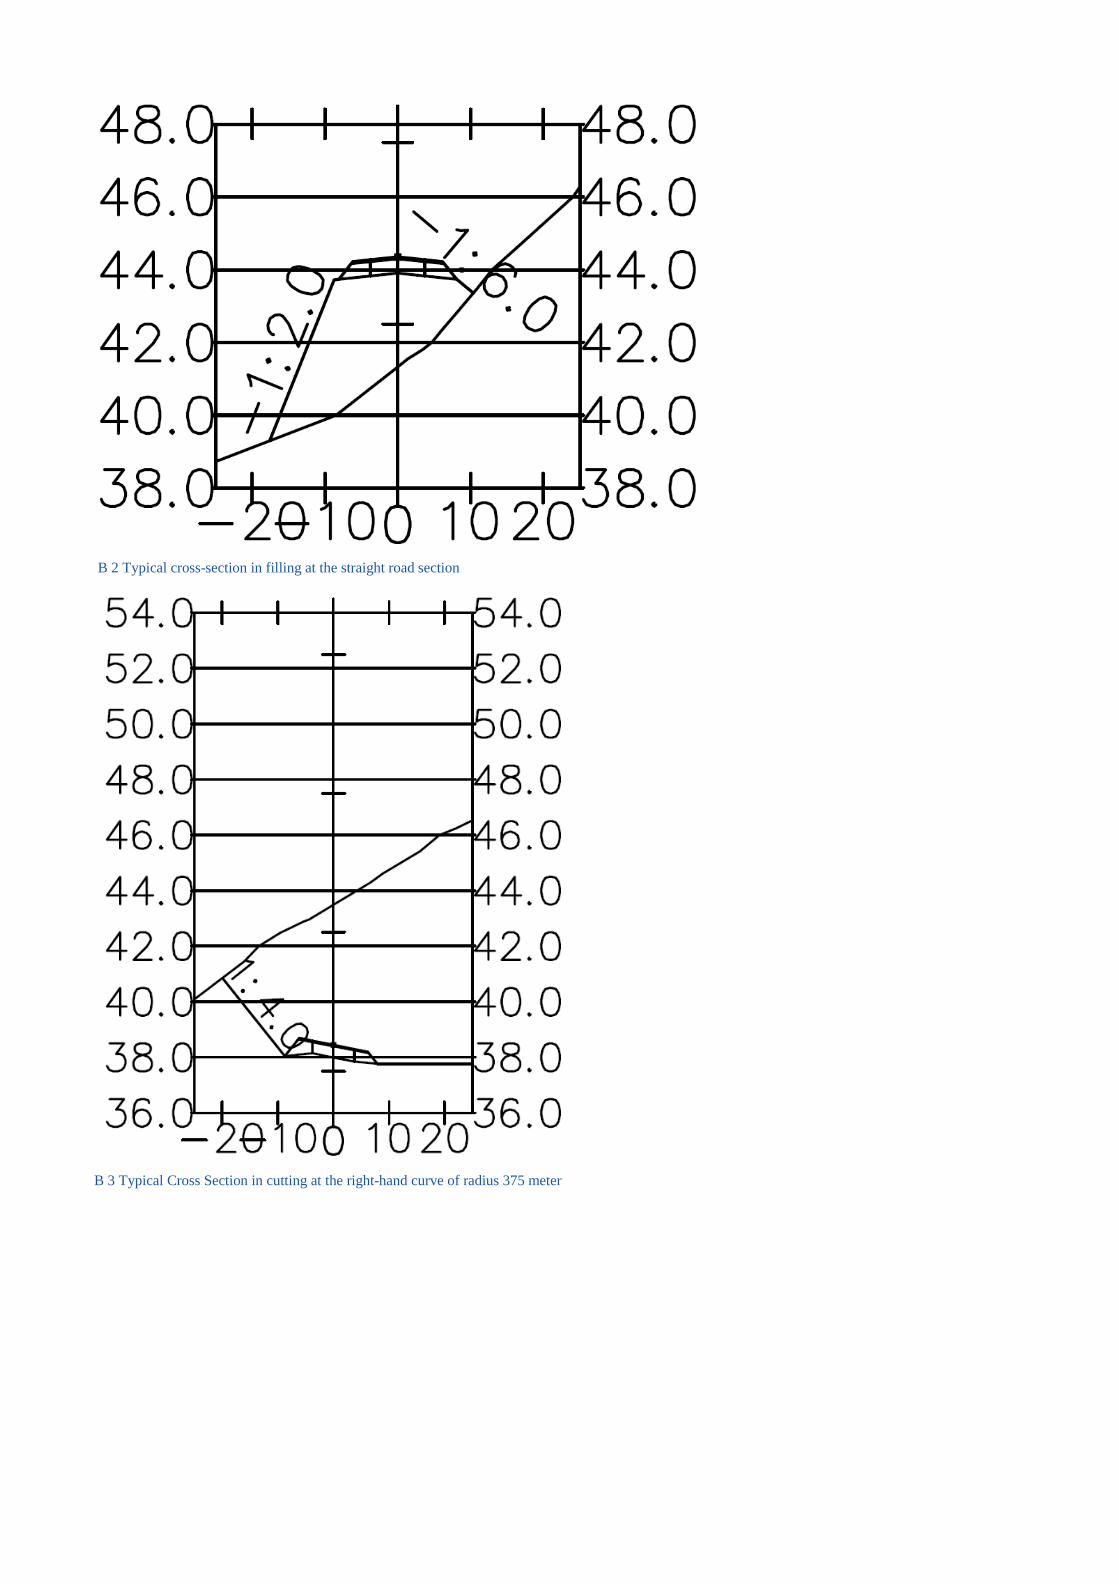
B 2 Typical cross-section in filling at the straight road section
B 3 Typical Cross Section in cutting at the right-hand curve of radius 375 meter

B4 Typical Cross Section in filling at the right-hand curve of radius 375 meter
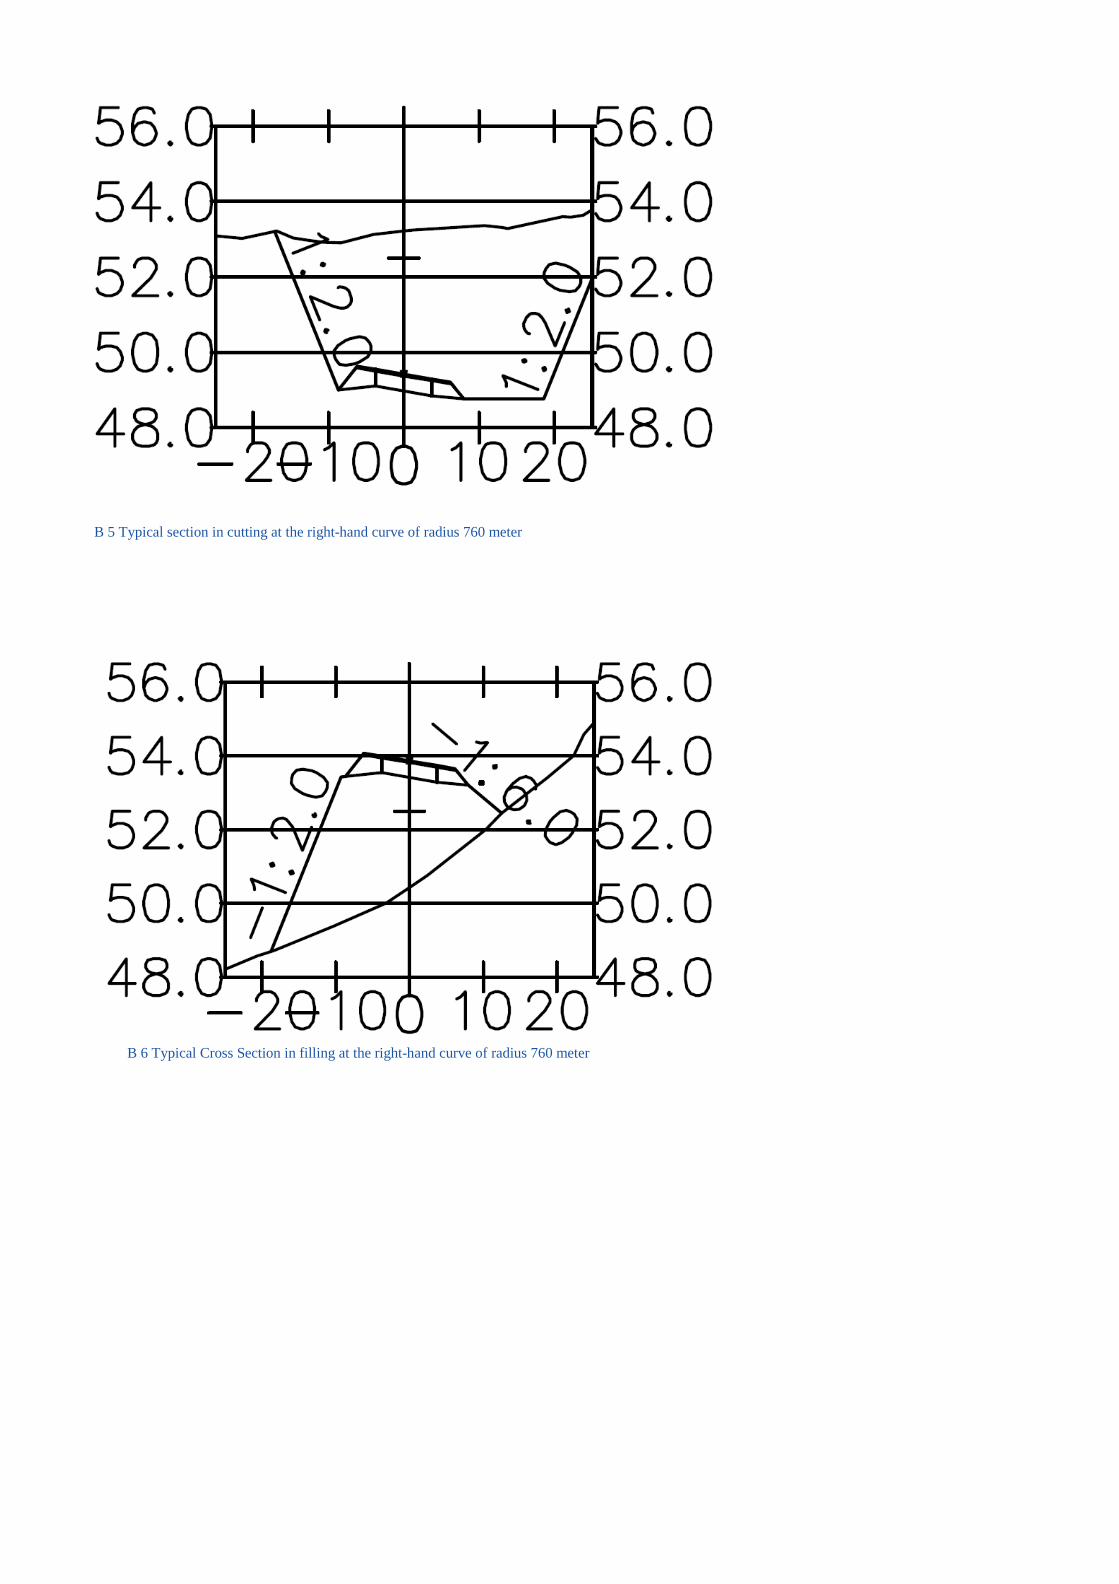
B 5 Typical section in cutting at the right-hand curve of radius 760 meter
B 6 Typical Cross Section in filling at the right-hand curve of radius 760 meter

B 7 Typical Cross Section in cutting at the left-hand curve of radius 375 meter
B 8 Typical section in filling at the left-hand curve of radius 375 meter
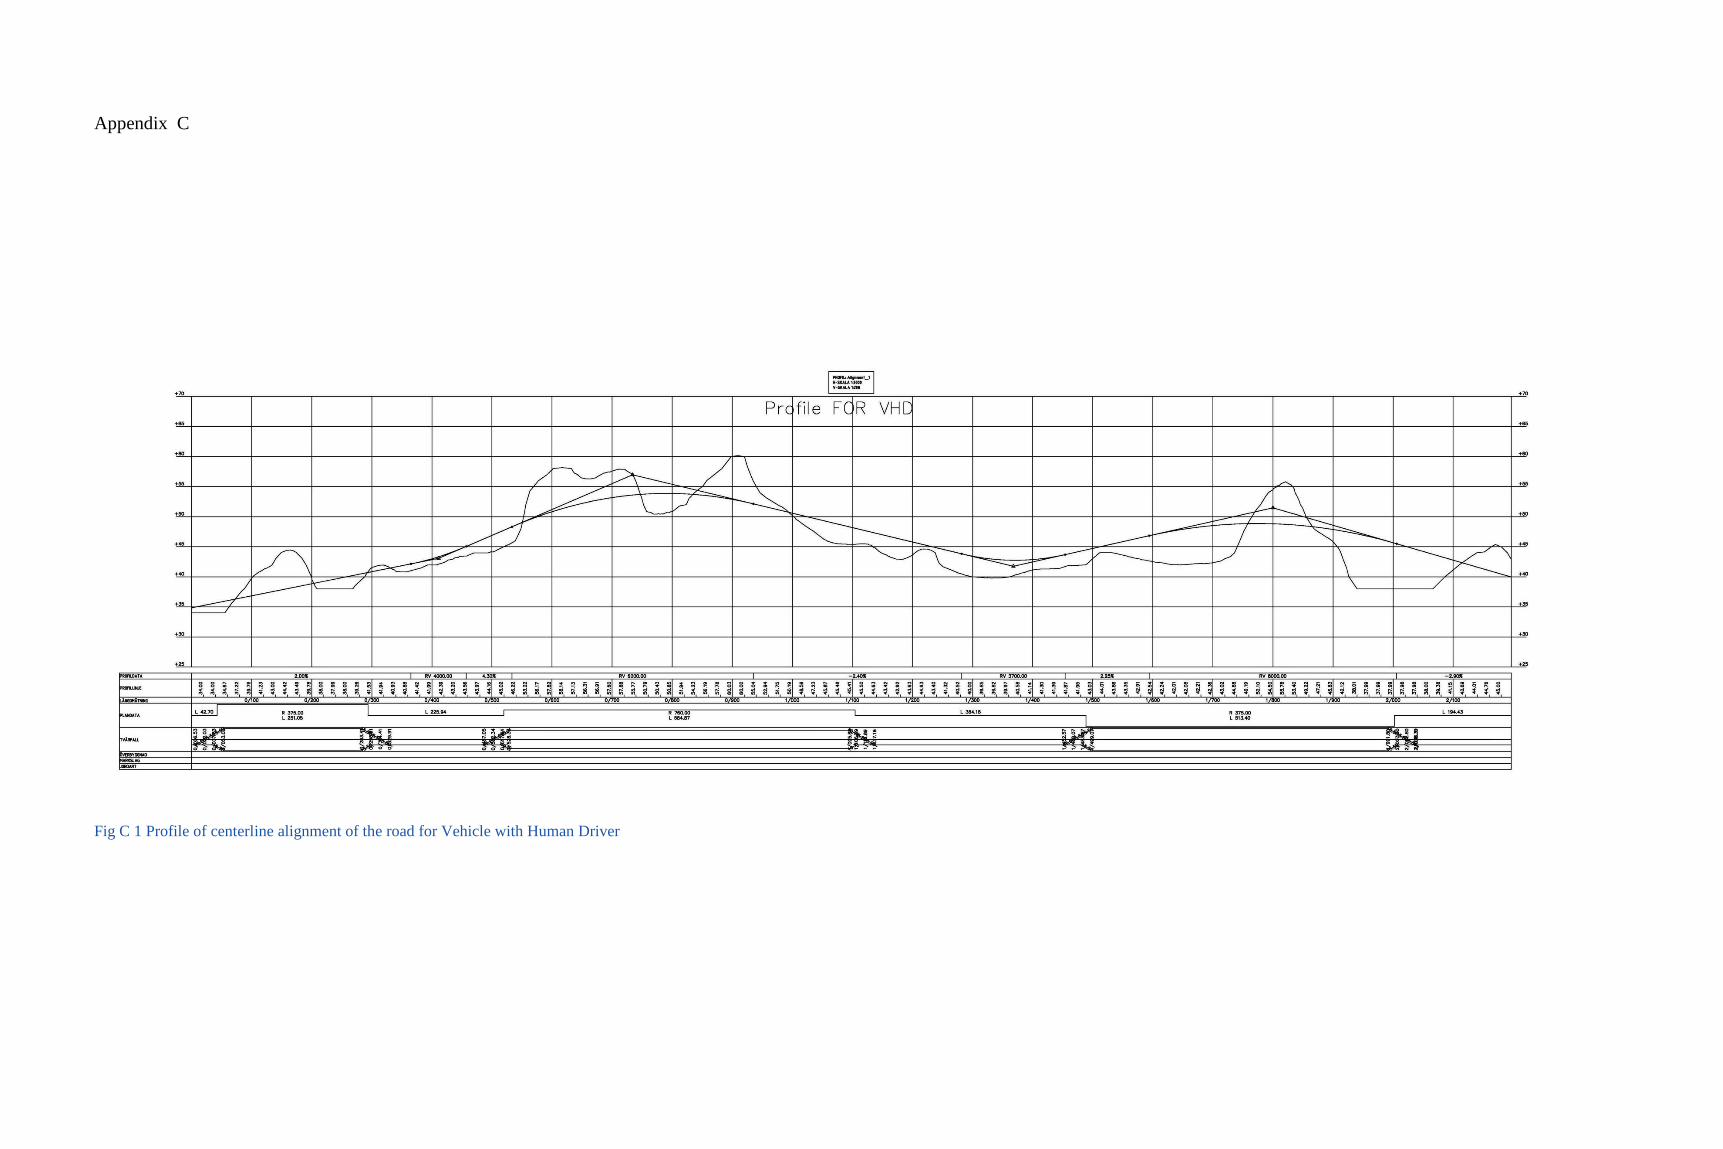
Appendix C
Fig C 1 Profile of centerline alignment of the road for Vehicle with Human Driver
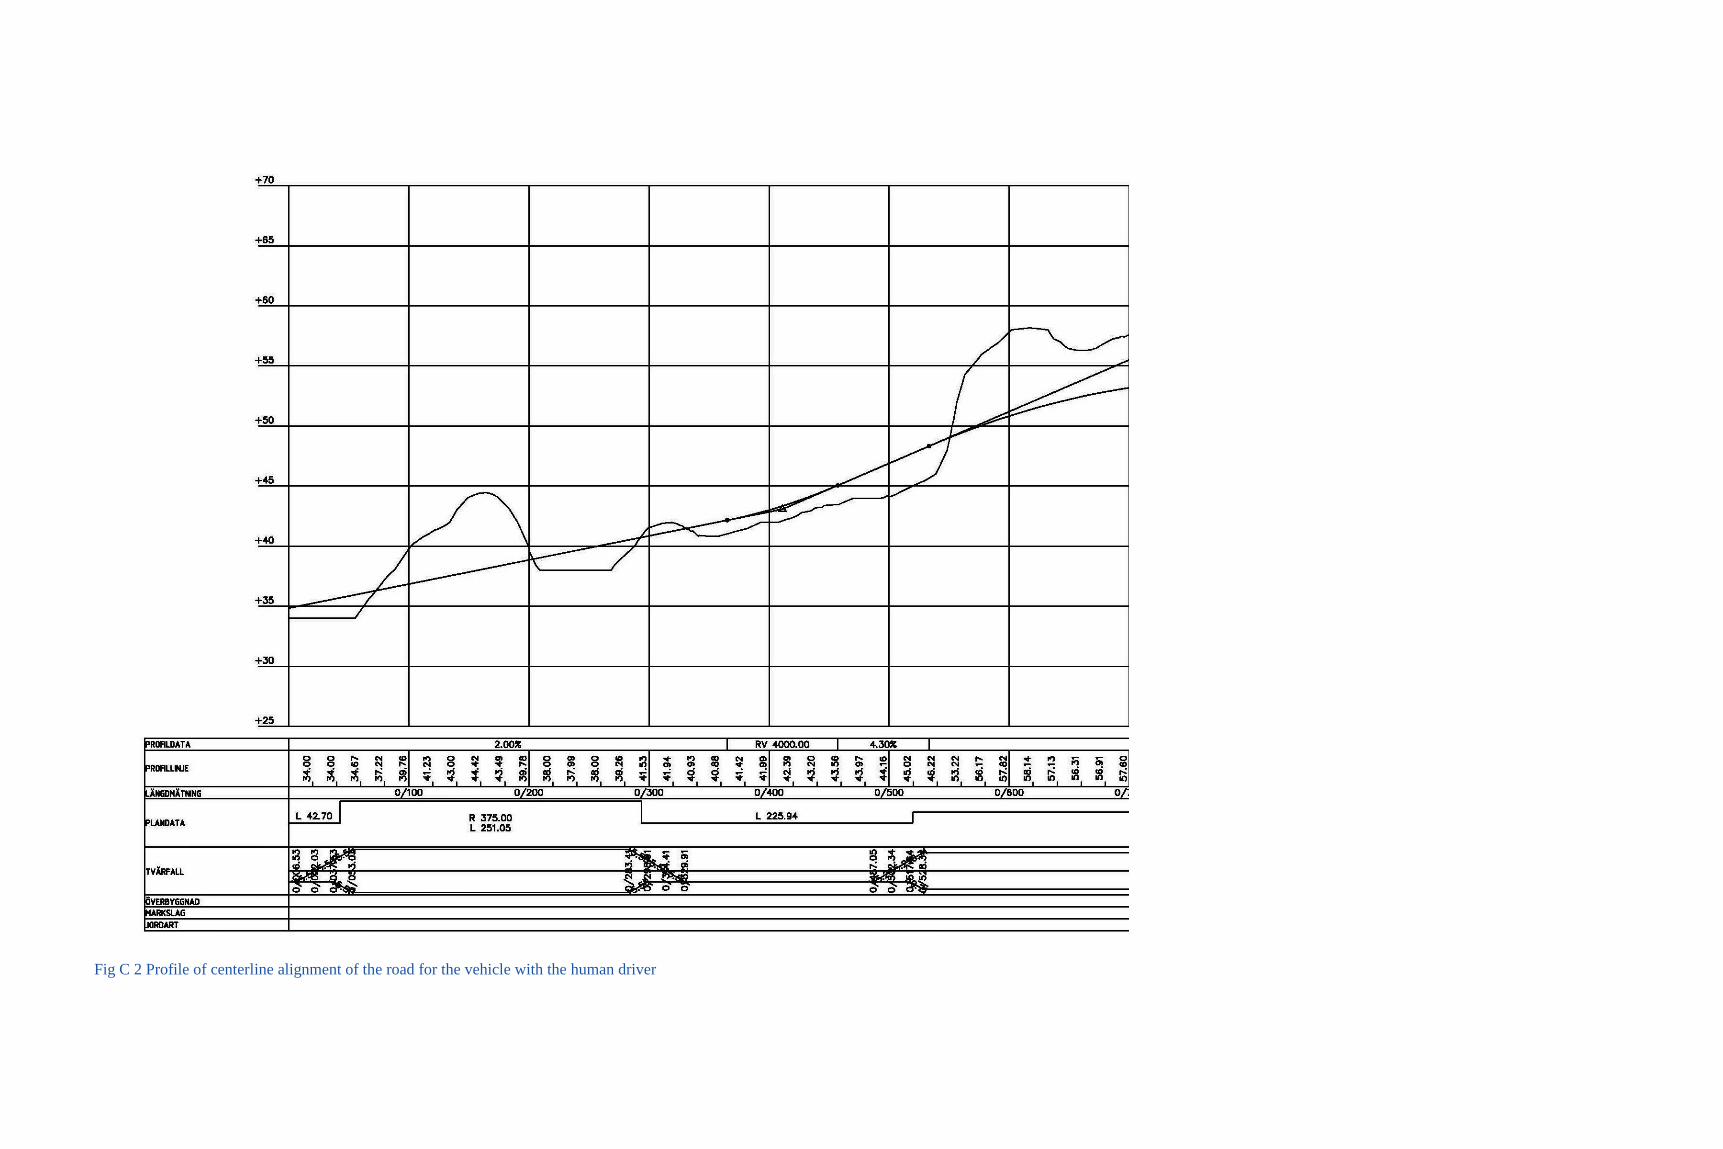
Fig C 2 Profile of centerline alignment of the road for the vehicle with the human driver
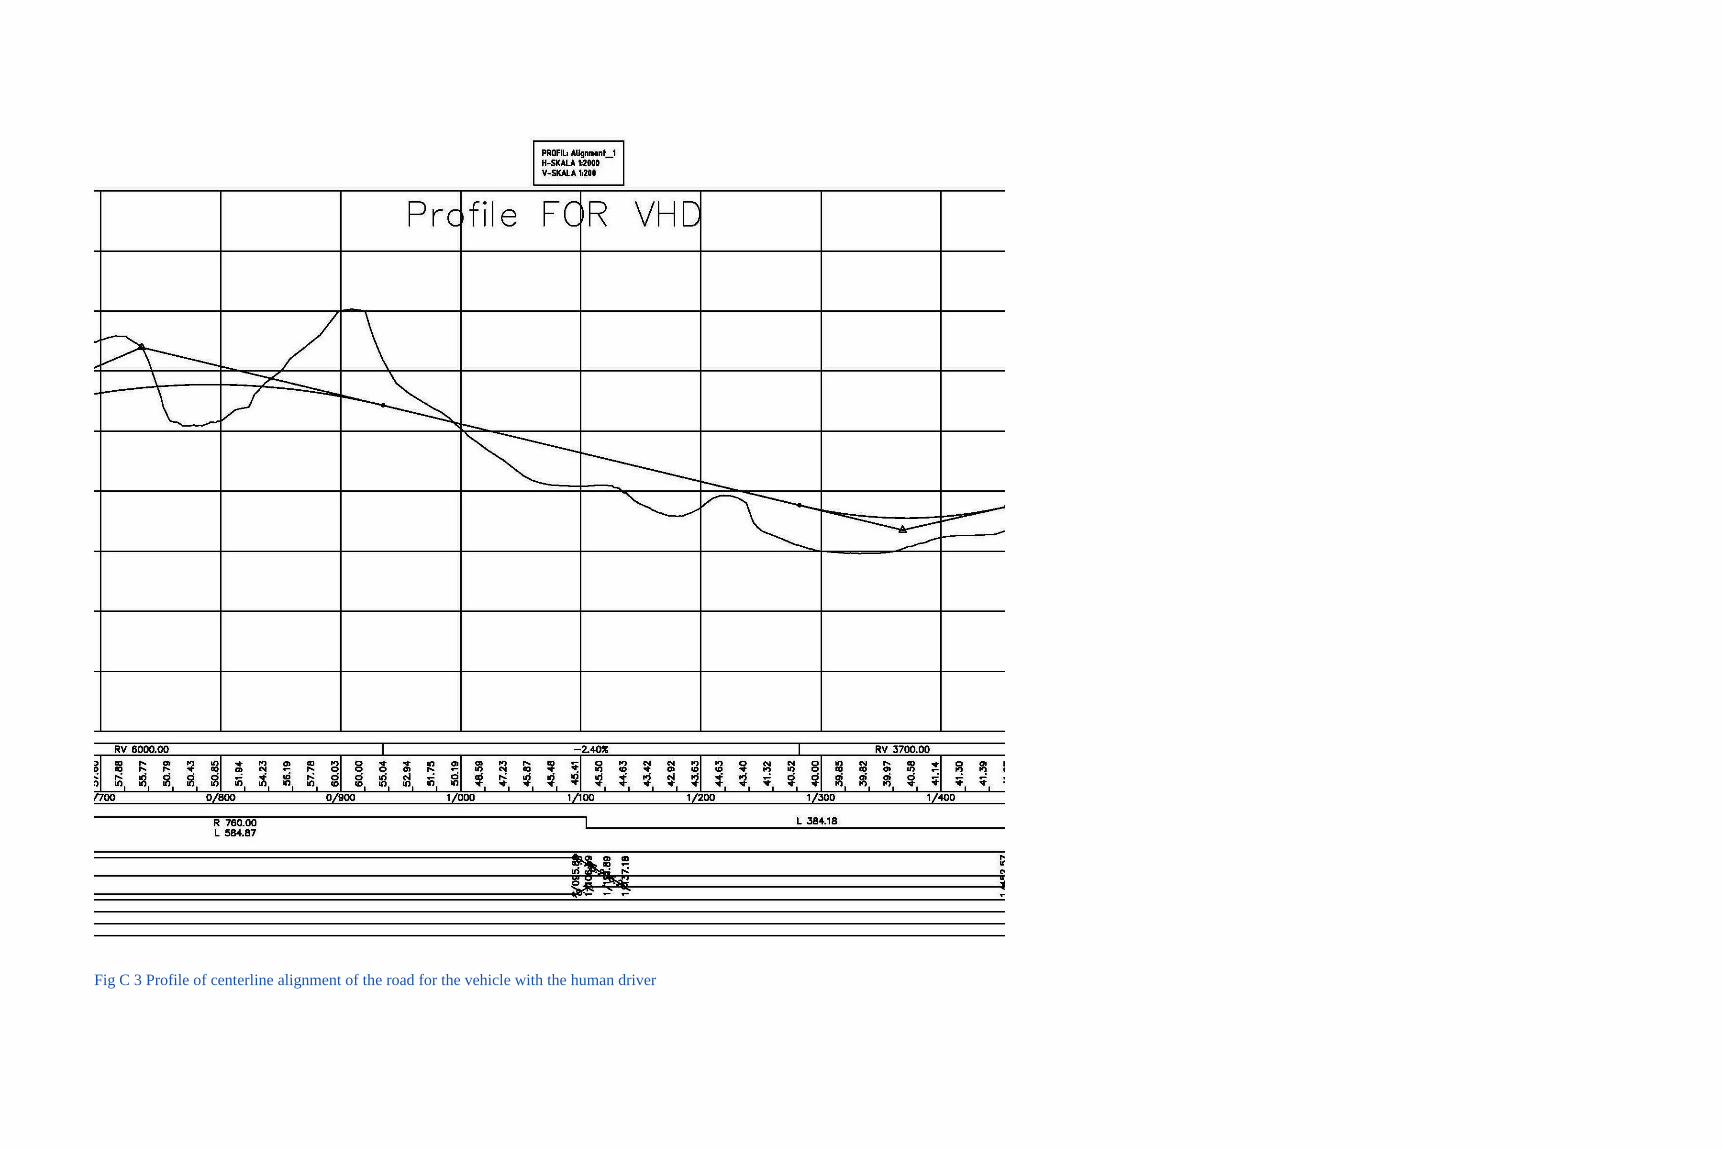
Fig C 3 Profile of centerline alignment of the road for the vehicle with the human driver
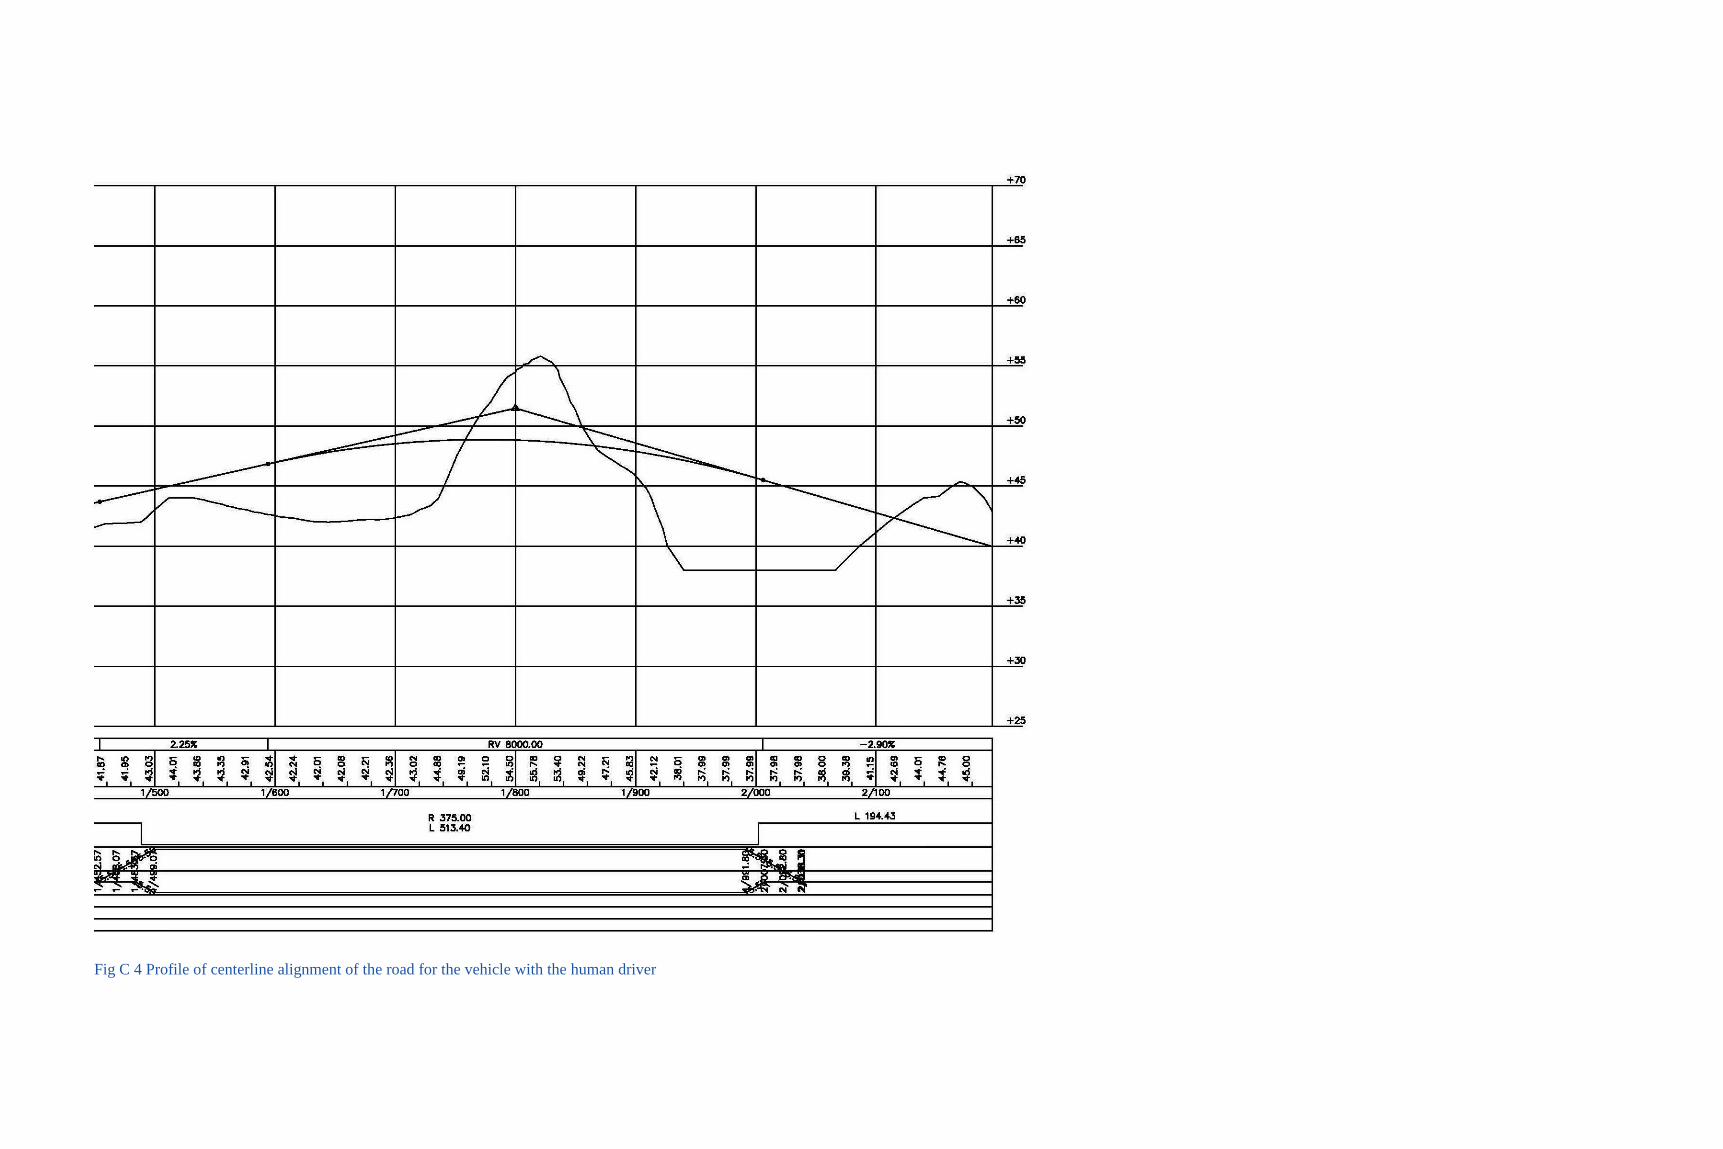
Fig C 4 Profile of centerline alignment of the road for the vehicle with the human driver
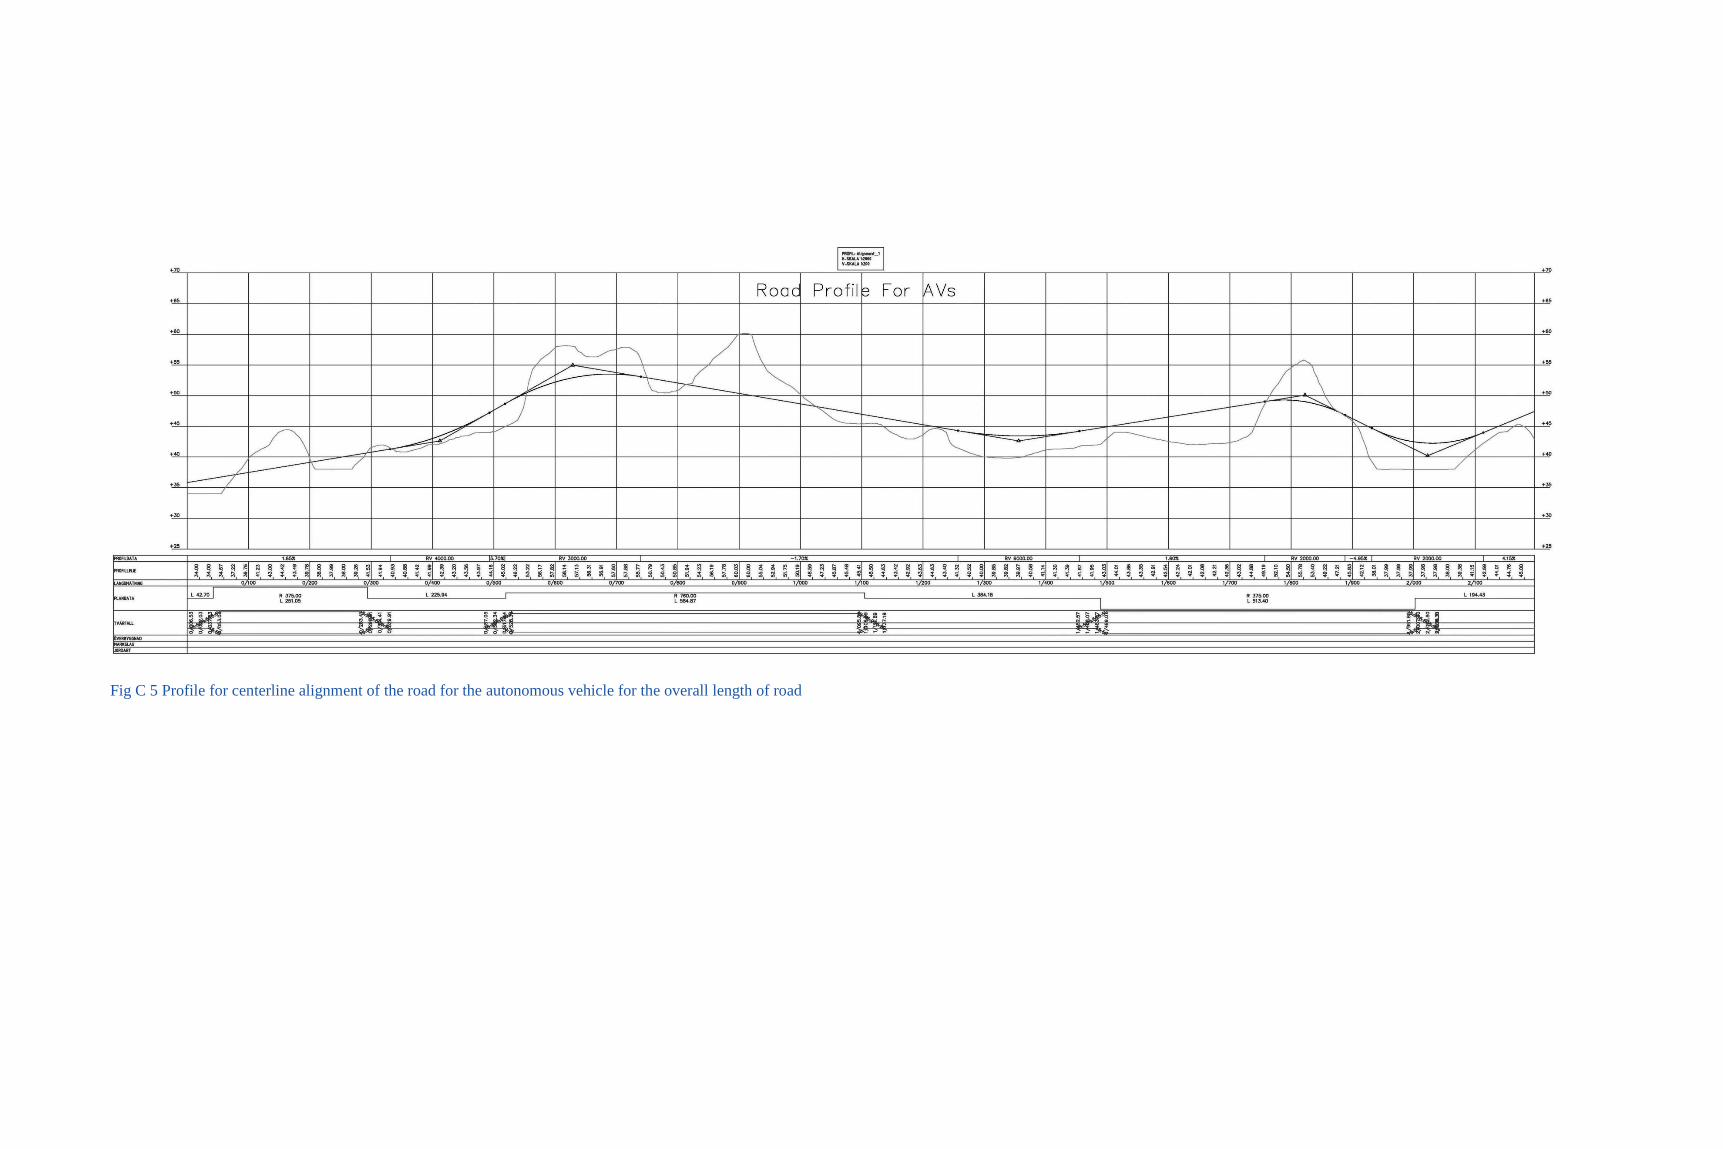
Fig C 5 Profile for centerline alignment of the road for the autonomous vehicle for the overall length of road
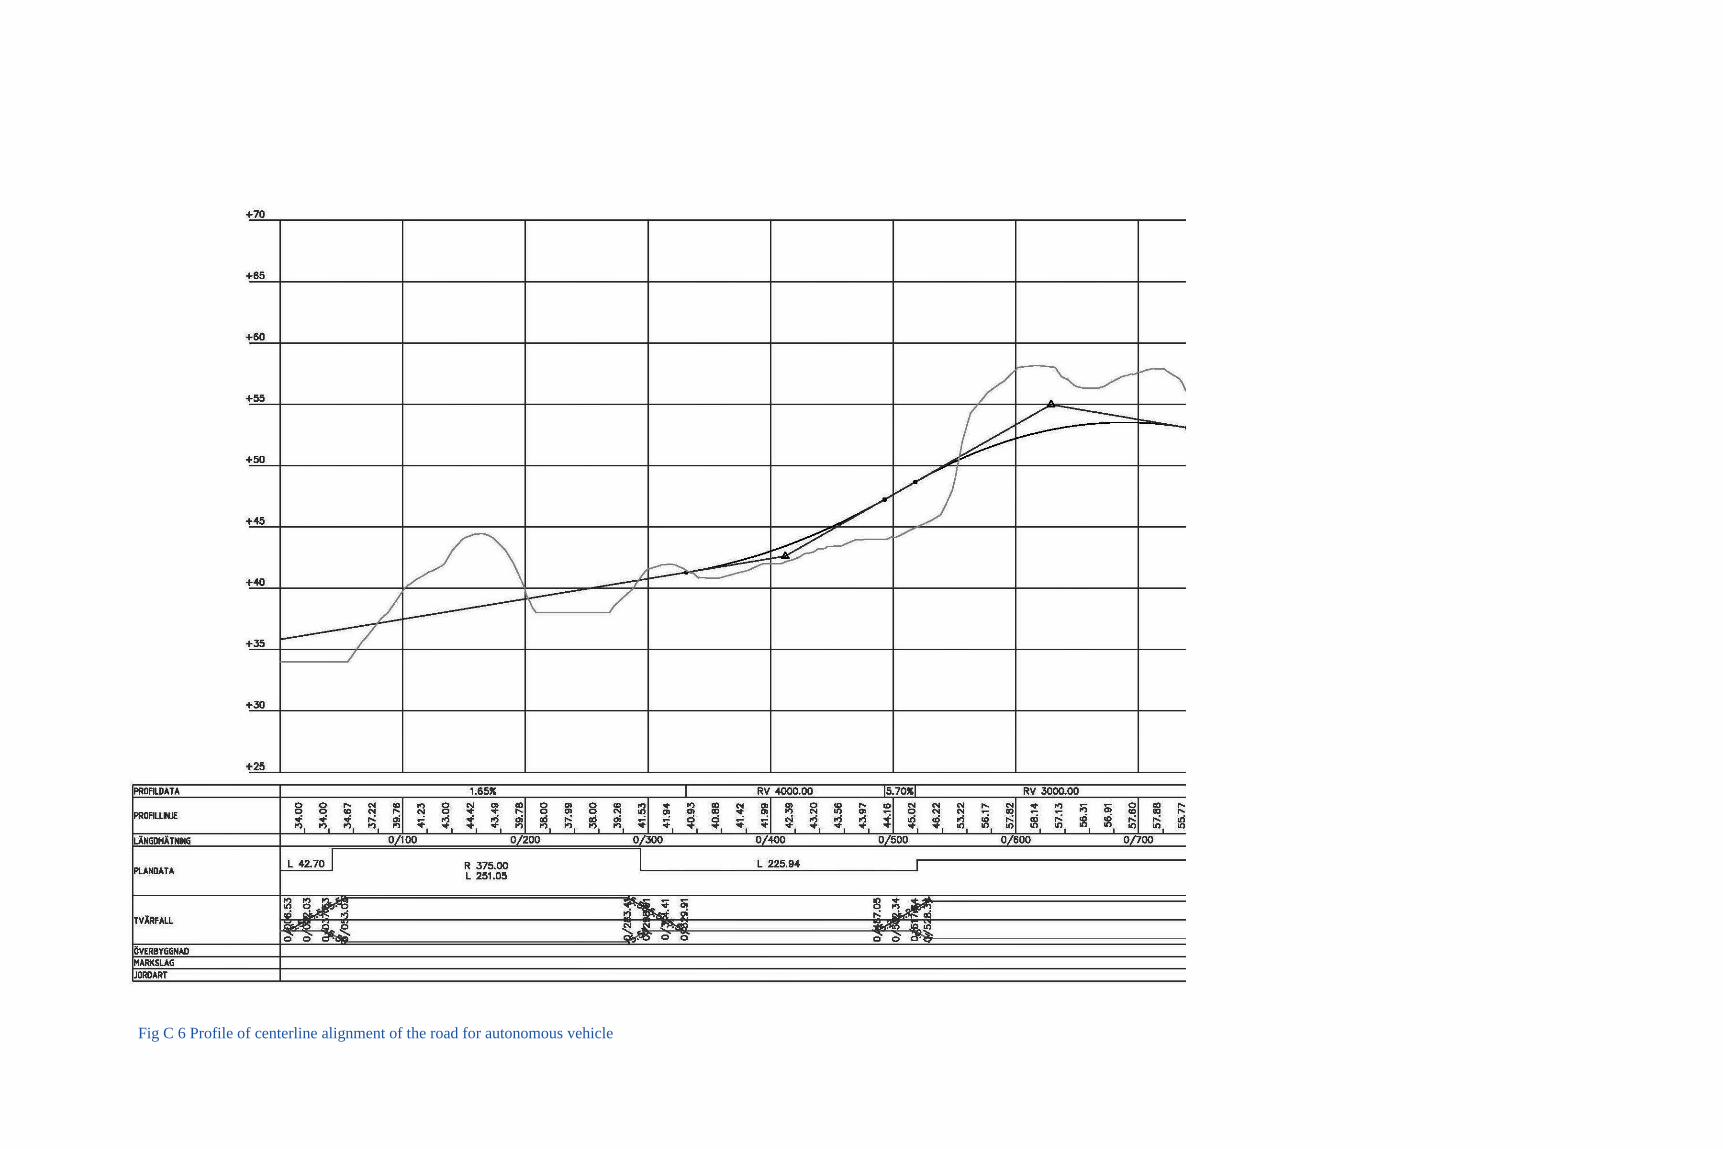
Fig C 6 Profile of centerline alignment of the road for autonomous vehicle
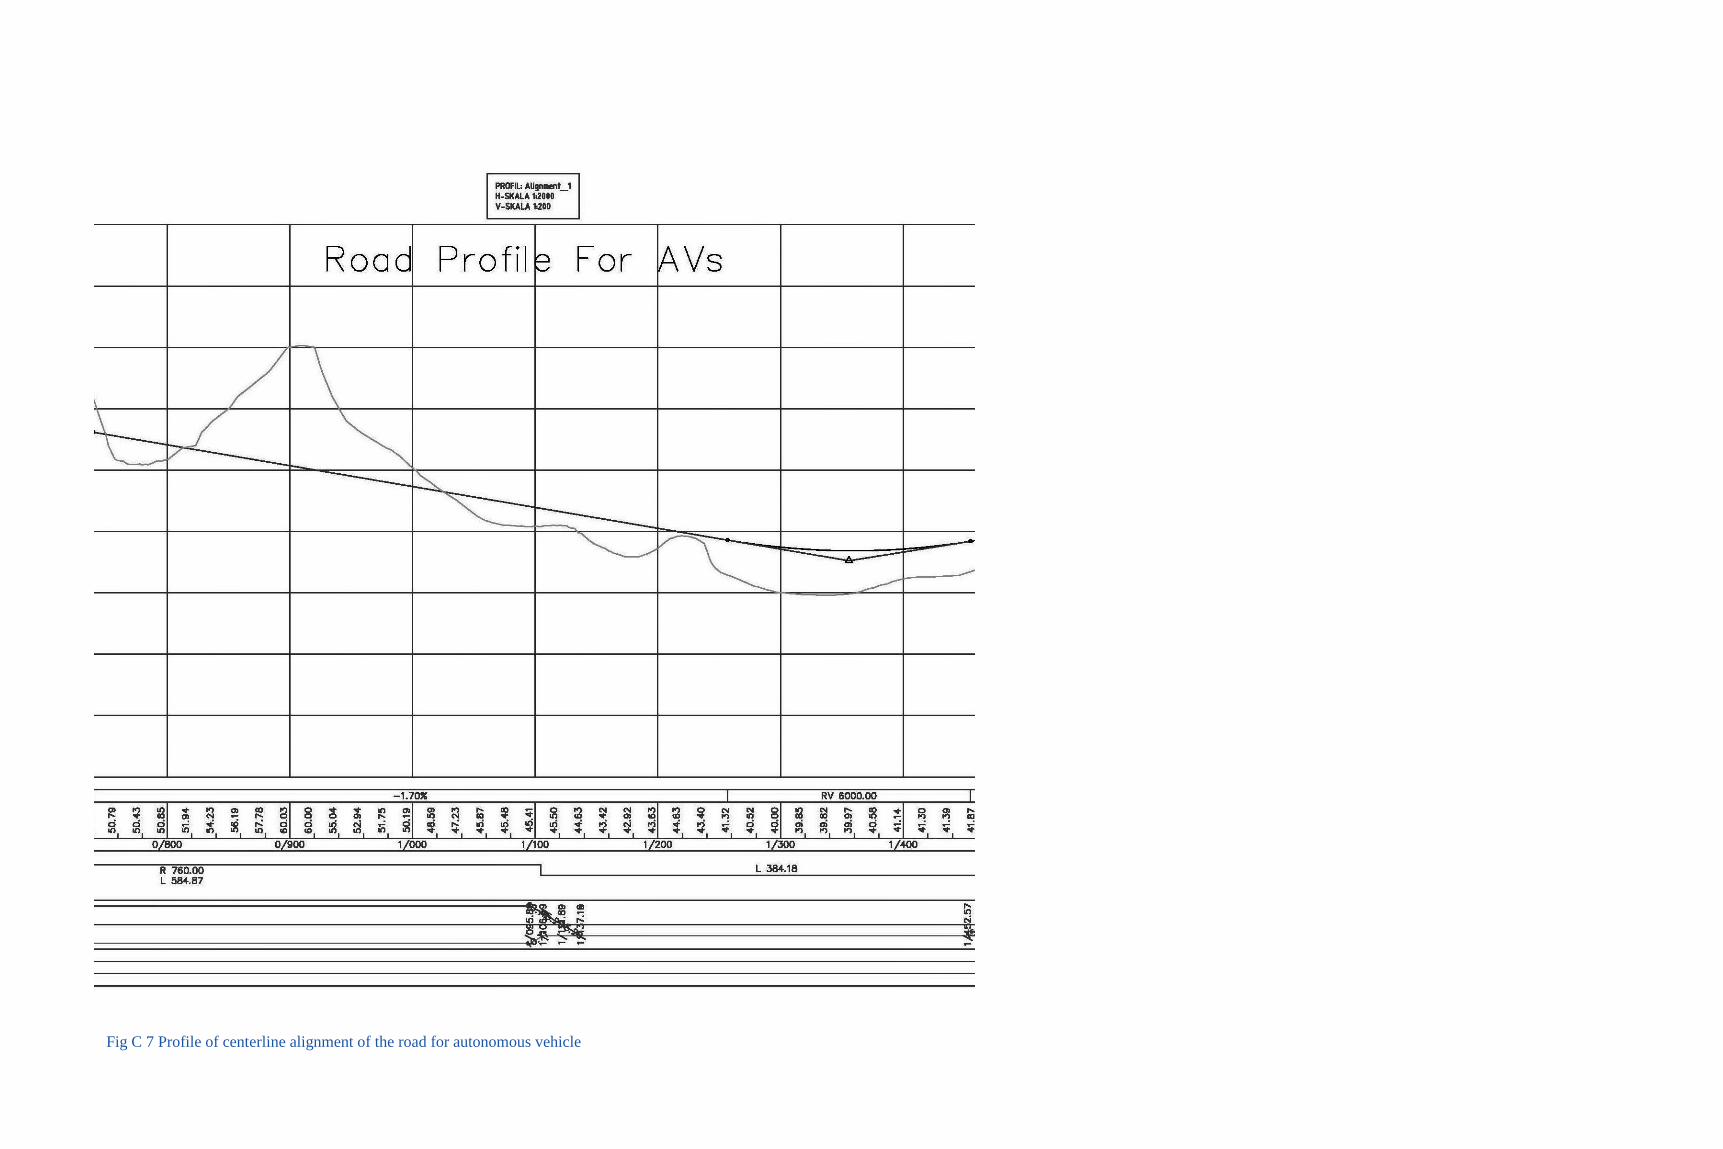
Fig C 7 Profile of centerline alignment of the road for autonomous vehicle
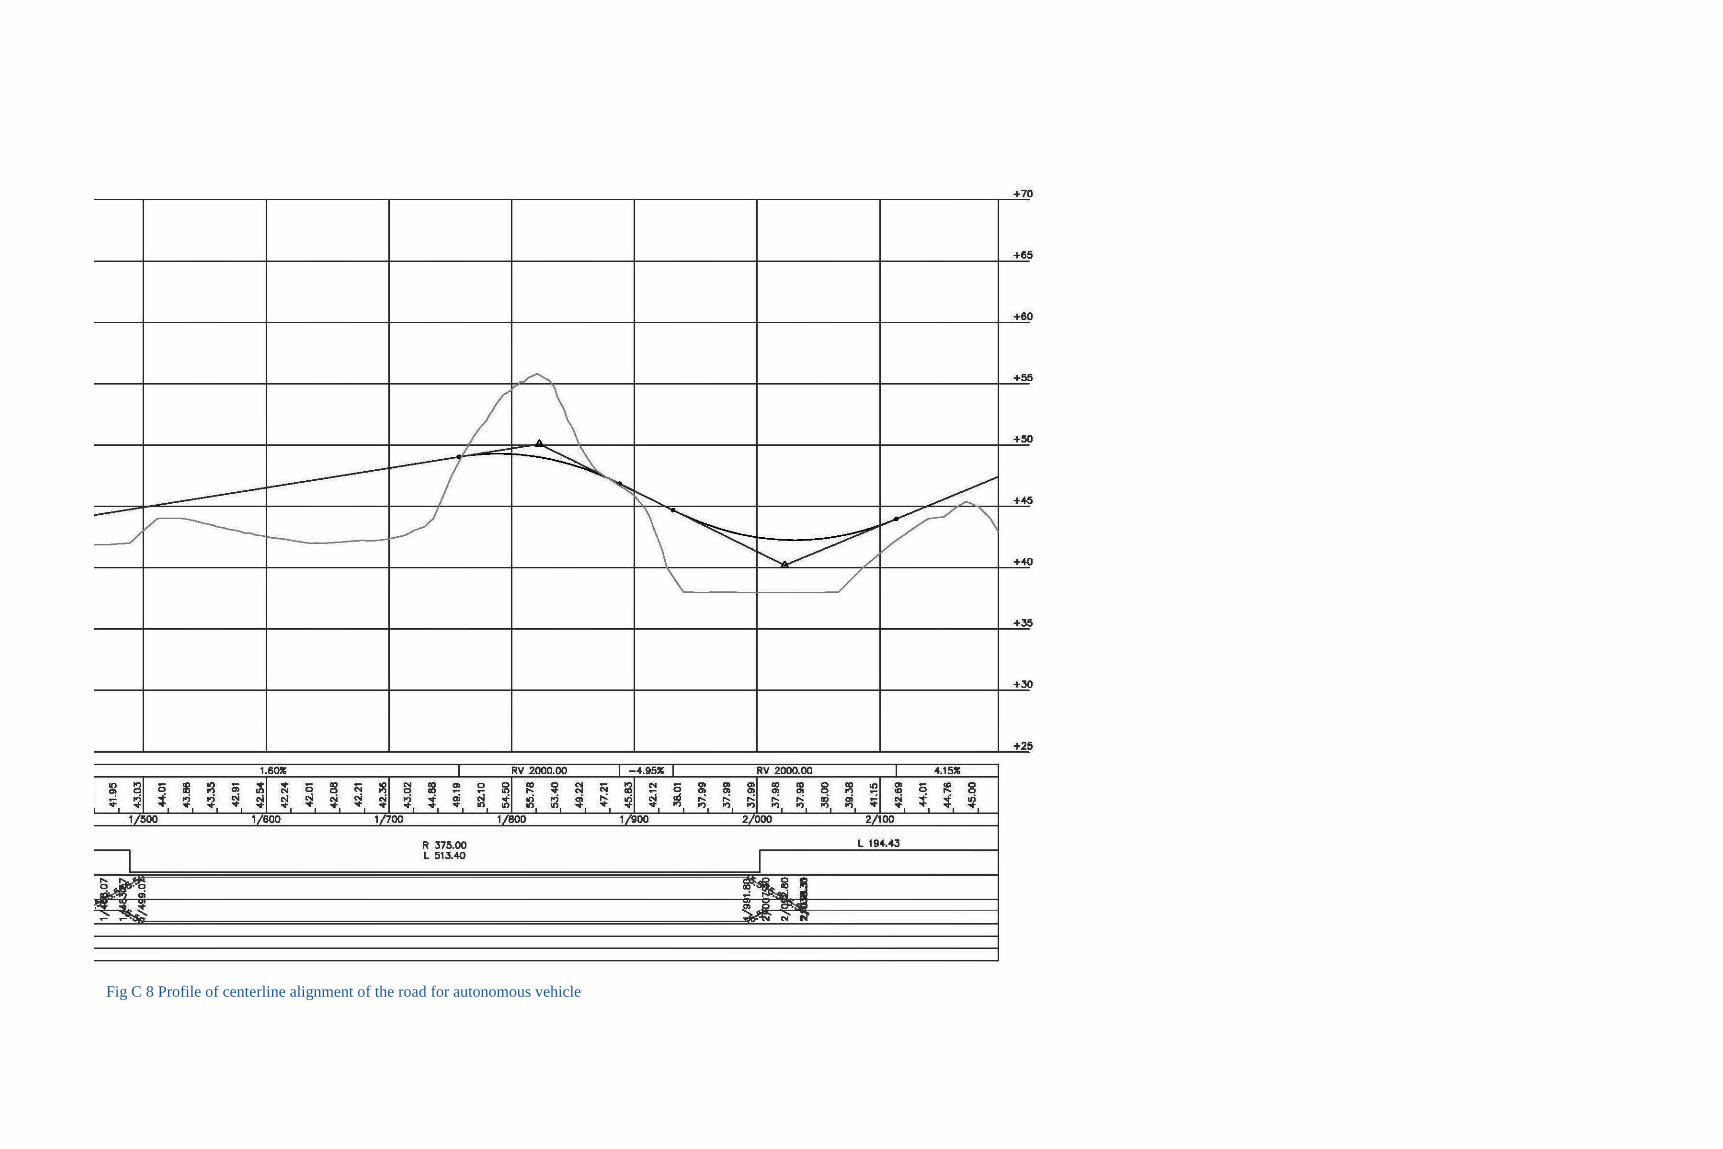
Fig C 8 Profile of centerline alignment of the road for autonomous vehicle
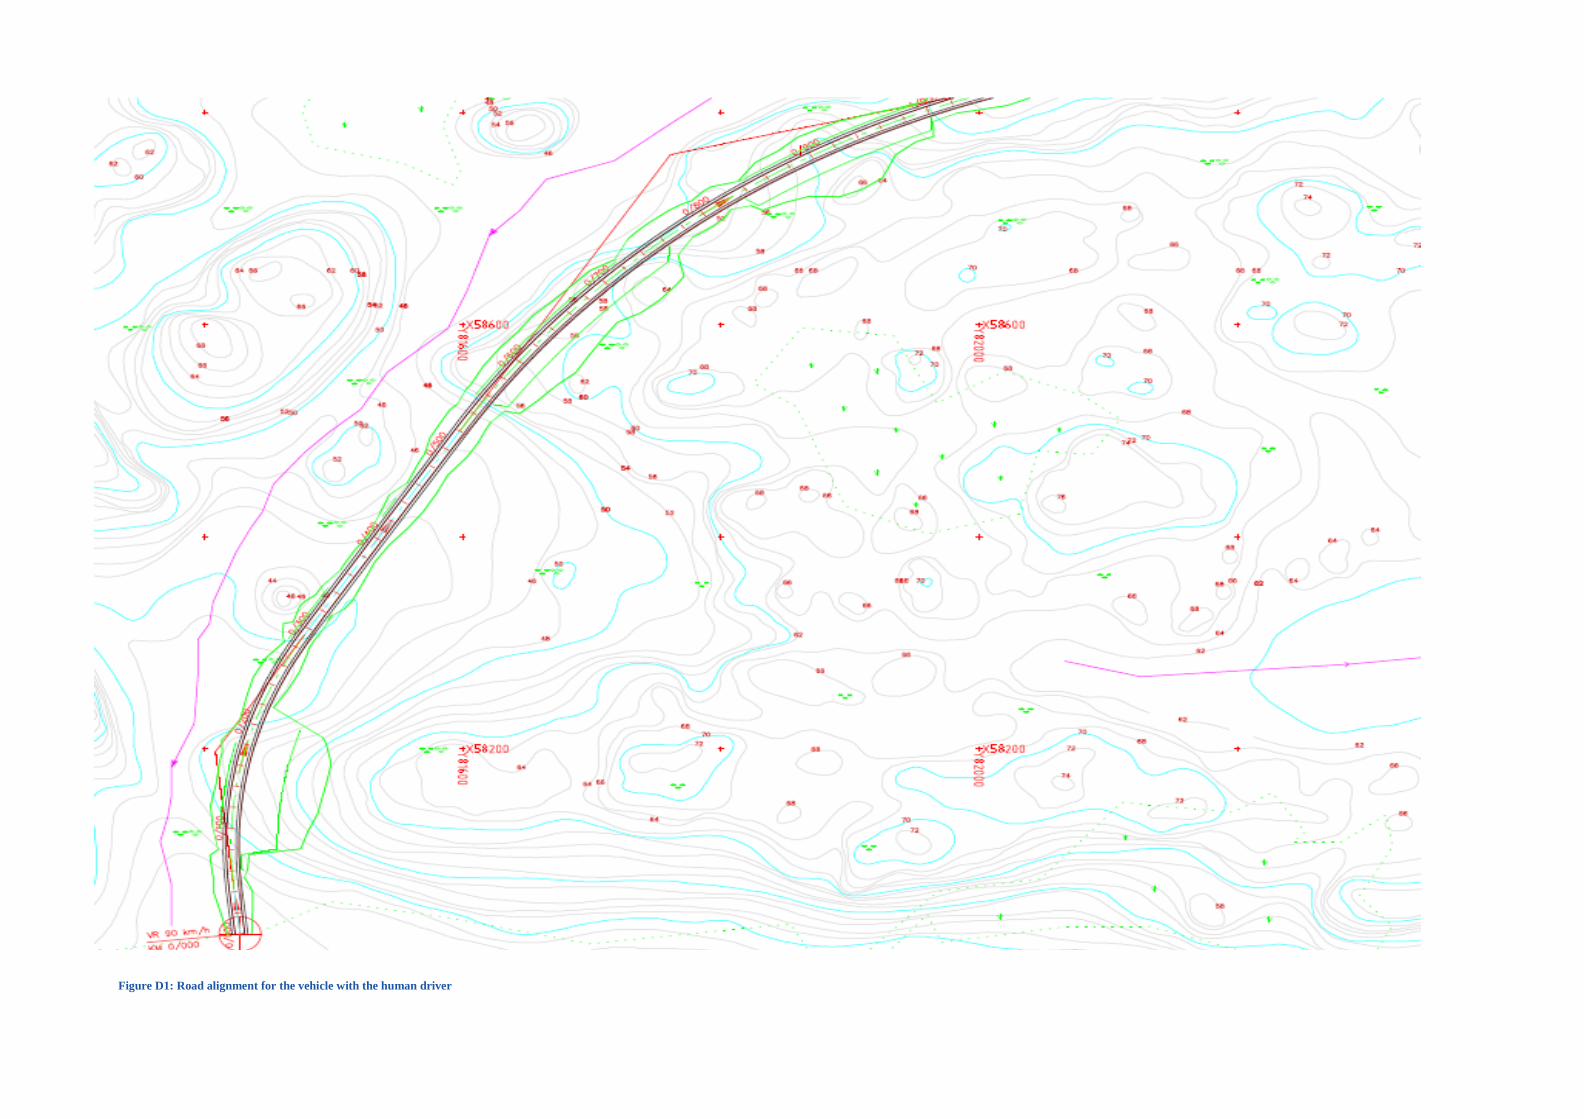
Figure D1: Road alignment for the vehicle with the human driver
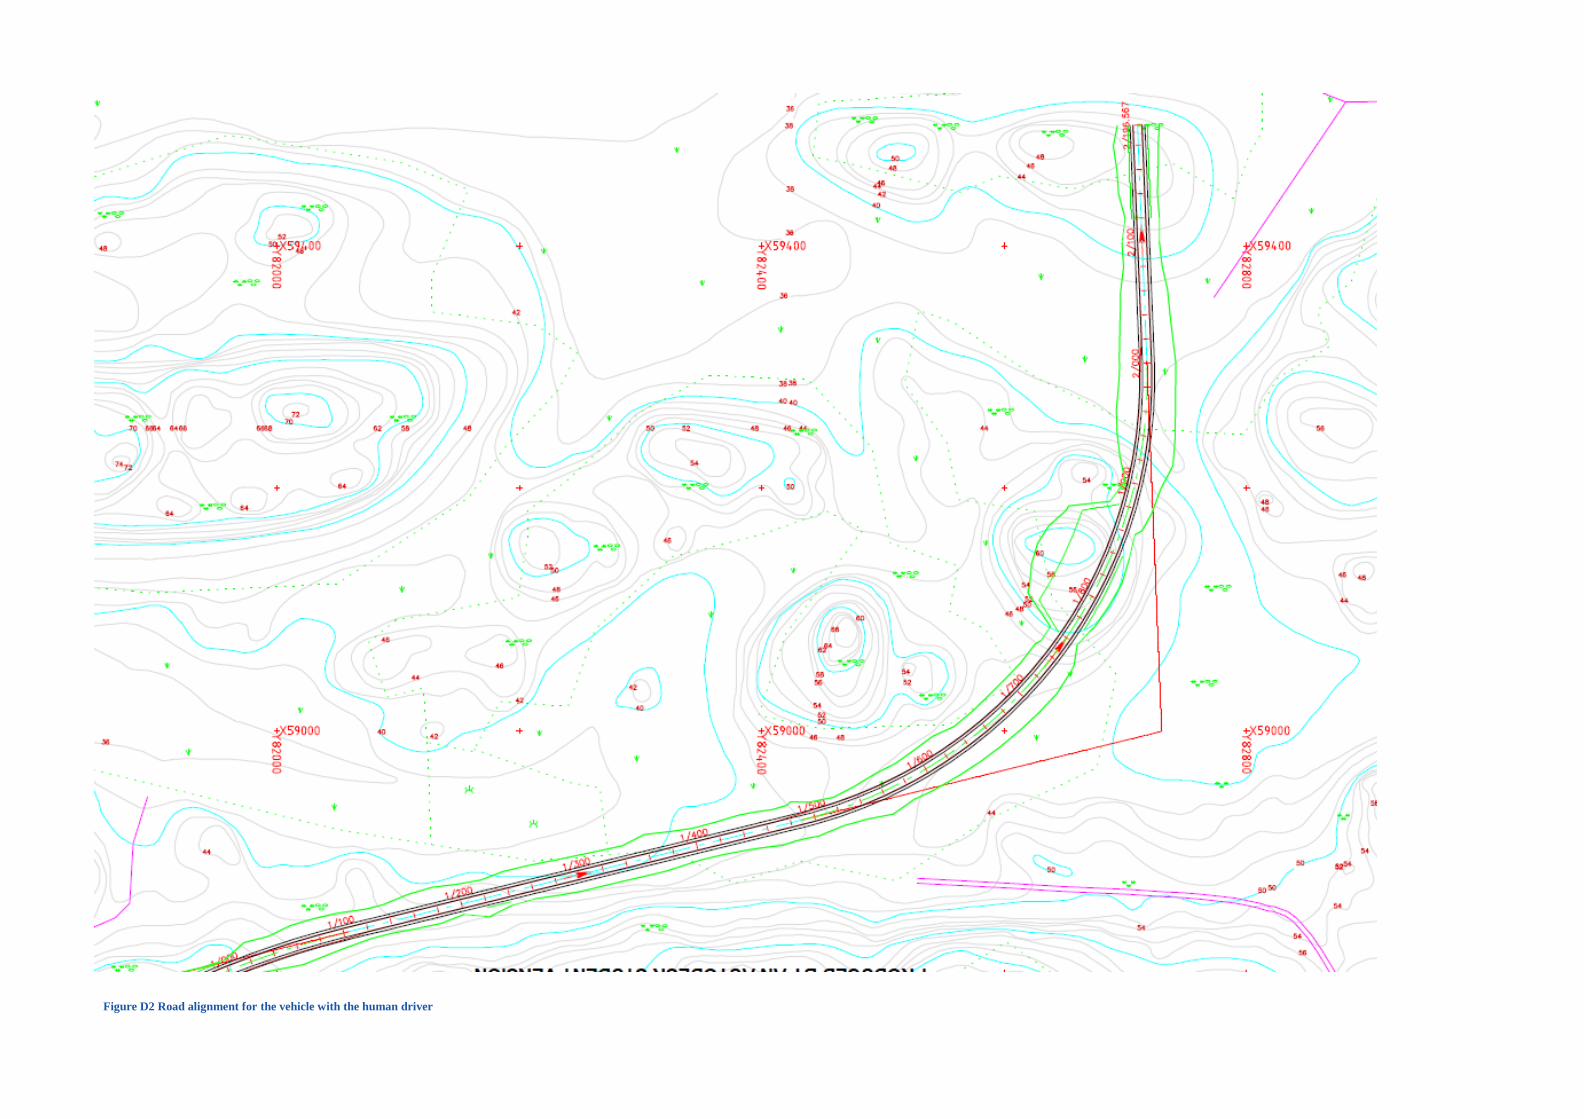
Figure D2 Road alignment for the vehicle with the human driver
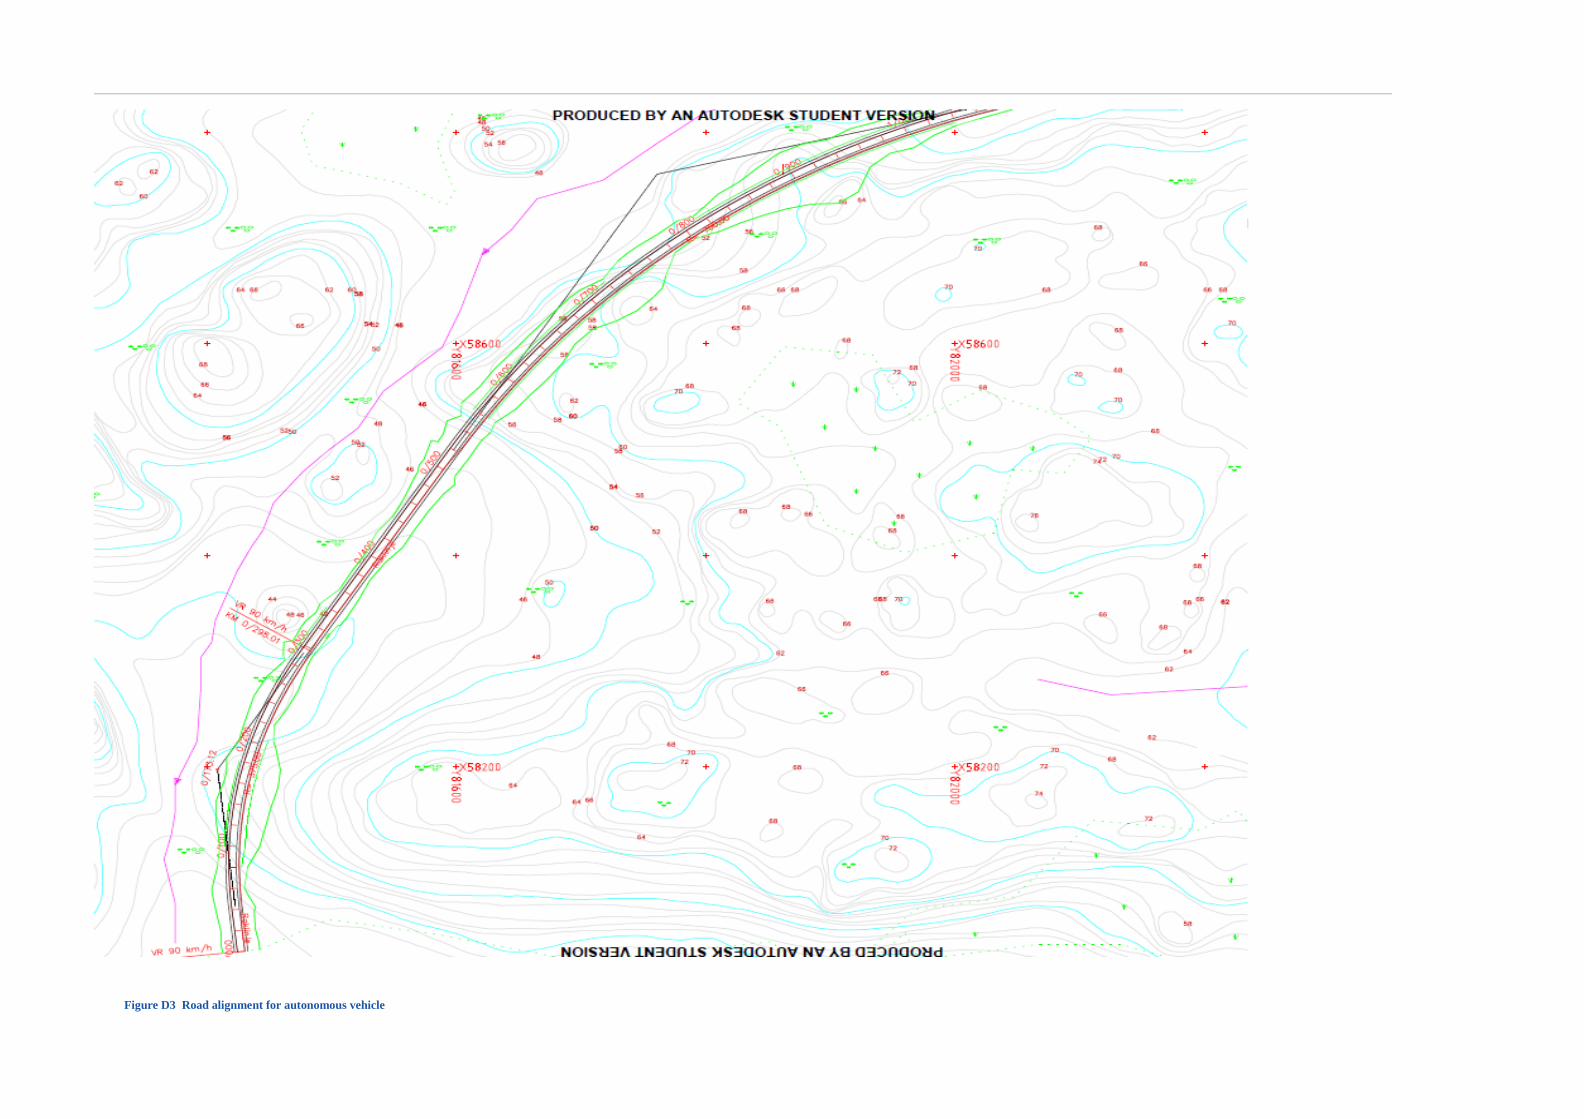
Figure D3 Road alignment for autonomous vehicle
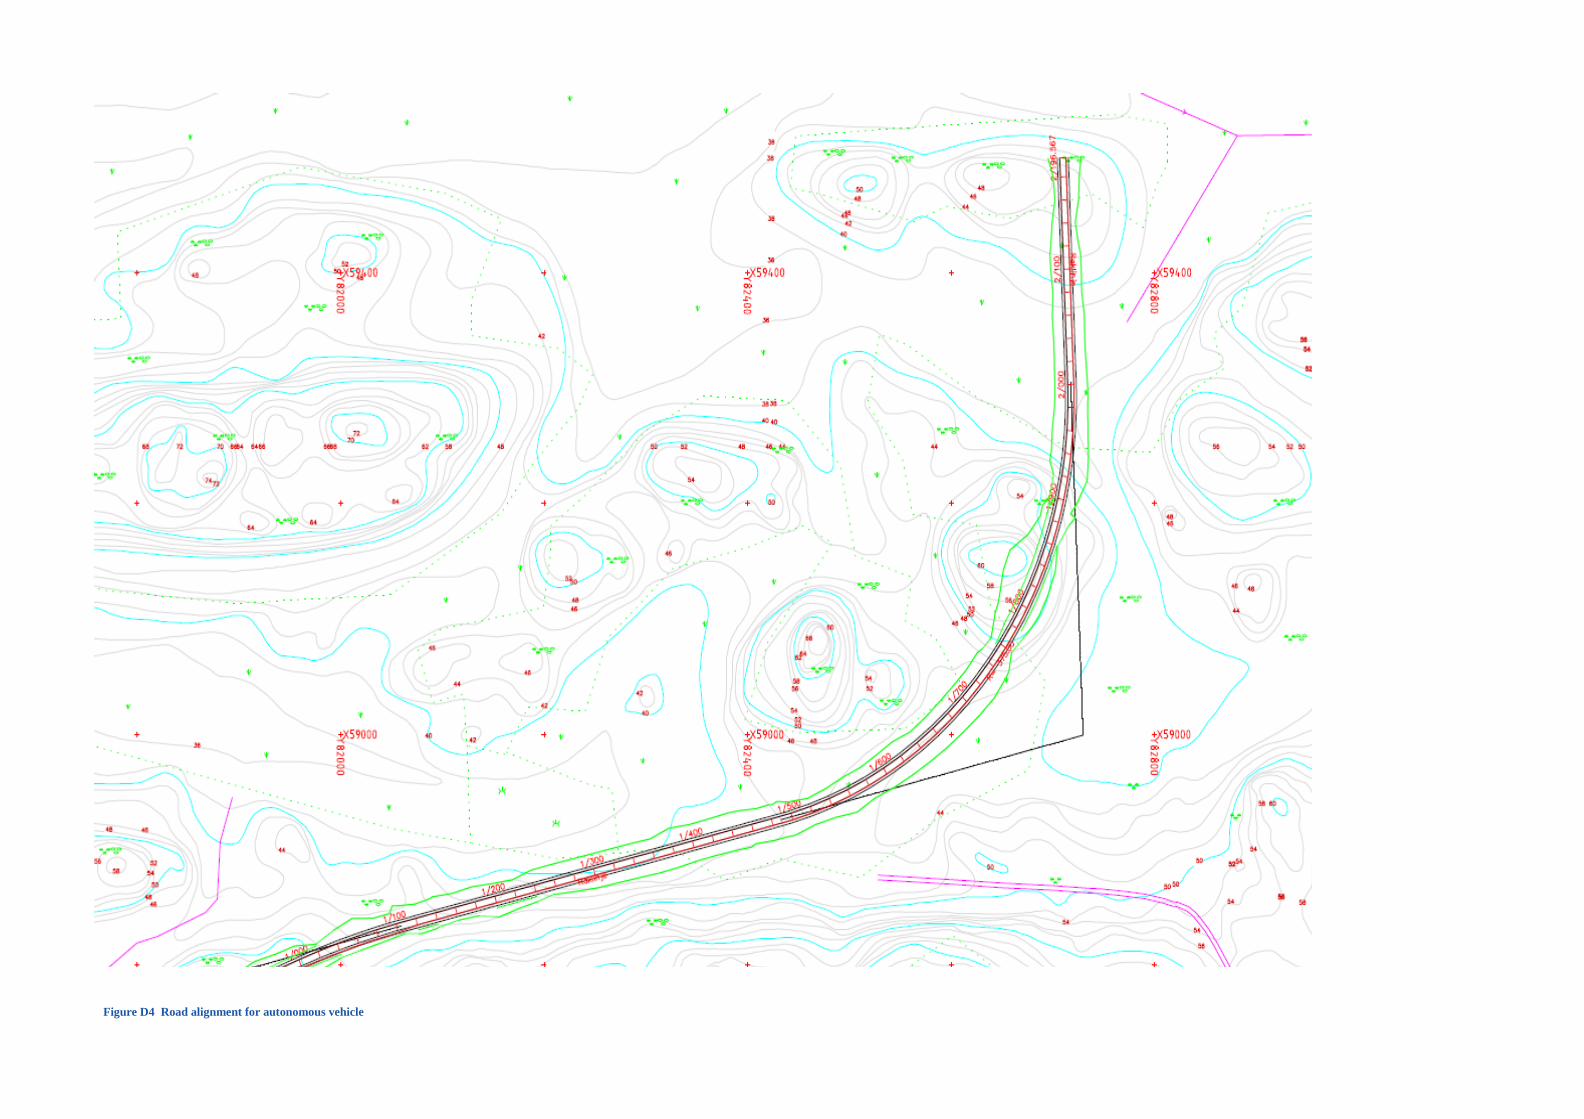
Figure D4 Road alignment for autonomous vehicle

TRITA ABE-MBT-20773
www.kth.se