Embed Size (px)
Citation preview
March, 2014

Investment Thesis
1
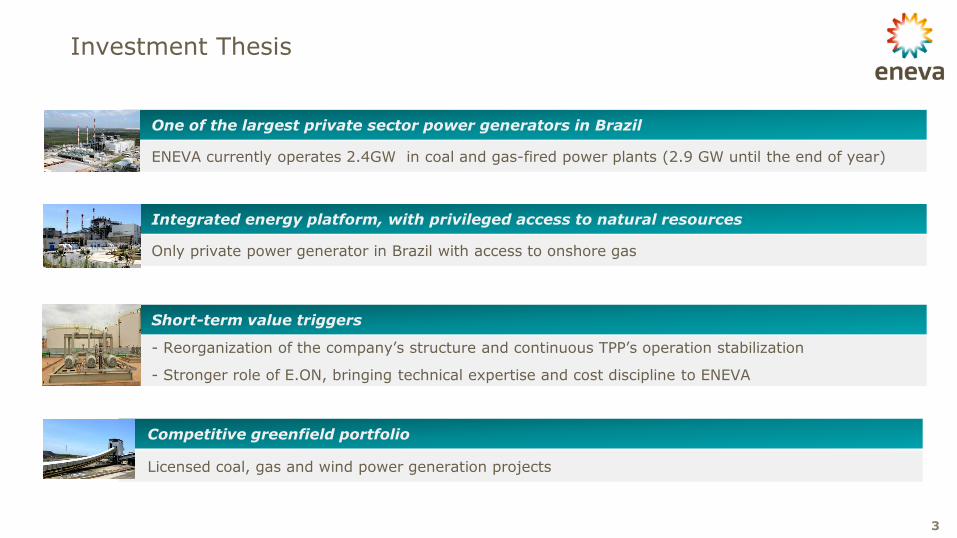
Investment Thesis
One of the largest private sector power generators in Brazil
ENEVA currently operates 2.4GW in coal and gas-fired power plants (2.9 GW until the end of year)
Integrated energy platform, with privileged access to natural resources
Only private power generator in Brazil with access to onshore gas
Short-term value triggers
- Reorganization of the company’s structure and continuous TPP’s operation stabilization
- Stronger role of E.ON, bringing technical expertise and cost discipline to ENEVA
Competitive greenfield portfolio
Licensed coal, gas and wind power generation projects
3
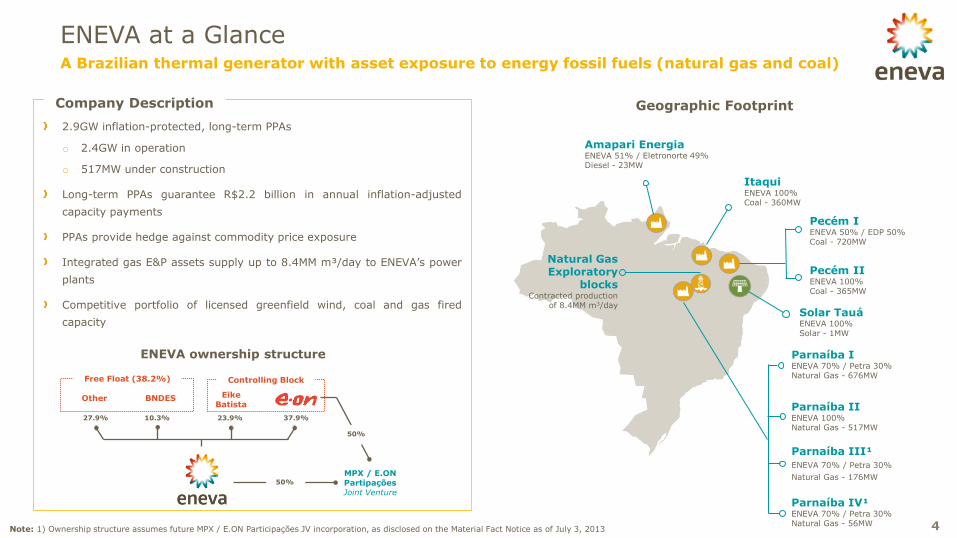
A Brazilian thermal generator with asset exposure to energy fossil fuels (natural gas and coal)
ENEVA at a Glance
2.9GW inflation-protected, long-term PPAs
o 2.4GW in operation
o 517MW under construction
Long-term PPAs guarantee R$2.2 billion in annual inflation-adjusted
capacity payments
PPAs provide hedge against commodity price exposure
Integrated gas E&P assets supply up to 8.4MM m³/day to ENEVA’s power
plants
Competitive portfolio of licensed greenfield wind, coal and gas fired
capacity
Company Description
4
ENEVA ownership structure
Geographic Footprint
Parnaíba I ENEVA 70% / Petra 30% Natural Gas - 676MW
Amapari Energia ENEVA 51% / Eletronorte 49% Diesel - 23MW
Itaqui ENEVA 100% Coal - 360MW
Natural Gas Exploratory
blocks Contracted production
of 8.4MM m3/day
Pecém I ENEVA 50% / EDP 50% Coal - 720MW
Pecém II ENEVA 100% Coal - 365MW
Parnaíba II ENEVA 100% Natural Gas - 517MW
Parnaíba III¹ ENEVA 70% / Petra 30%
Natural Gas - 176MW
Parnaíba IV¹ ENEVA 70% / Petra 30% Natural Gas - 56MW
Free Float (38.2%)
37.9% 23.9%
Other
MPX / E.ON Partipações Joint Venture
50%
50%
BNDES
10.3%
Eike Batista
Controlling Block
27.9%
Solar Tauá ENEVA 100% Solar - 1MW
Note: 1) Ownership structure assumes future MPX / E.ON Participações JV incorporation, as disclosed on the Material Fact Notice as of July 3, 2013

Company Overview
2
6
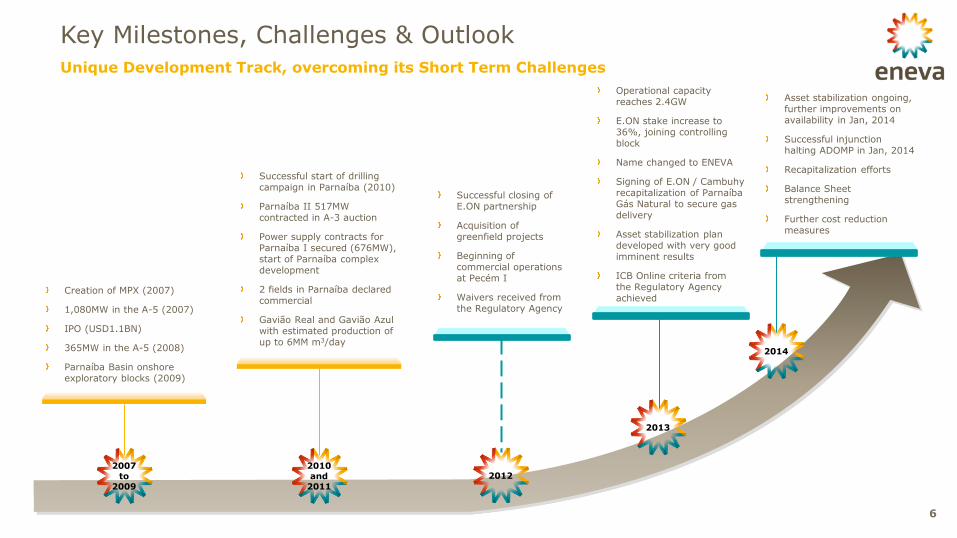
Creation of MPX (2007)
1,080MW in the A-5 (2007)
IPO (USD1.1BN)
365MW in the A-5 (2008)
Parnaíba Basin onshore exploratory blocks (2009)
Successful closing of E.ON partnership
Acquisition of greenfield projects
Beginning of commercial operations at Pecém I
Waivers received from the Regulatory Agency
Operational capacity reaches 2.4GW
E.ON stake increase to 36%, joining controlling block
Name changed to ENEVA
Signing of E.ON / Cambuhy recapitalization of Parnaíba Gás Natural to secure gas delivery
Asset stabilization plan developed with very good imminent results
ICB Online criteria from the Regulatory Agency achieved
2007 to
2009
2012
2013
2014
Asset stabilization ongoing, further improvements on availability in Jan, 2014
Successful injunction halting ADOMP in Jan, 2014
Recapitalization efforts
Balance Sheet strengthening
Further cost reduction measures
Successful start of drilling campaign in Parnaíba (2010)
Parnaíba II 517MW contracted in A-3 auction
Power supply contracts for Parnaíba I secured (676MW), start of Parnaíba complex development
2 fields in Parnaíba declared commercial
Gavião Real and Gavião Azul with estimated production of up to 6MM m3/day
2010 and
2011
Unique Development Track, overcoming its Short Term Challenges
Key Milestones, Challenges & Outlook
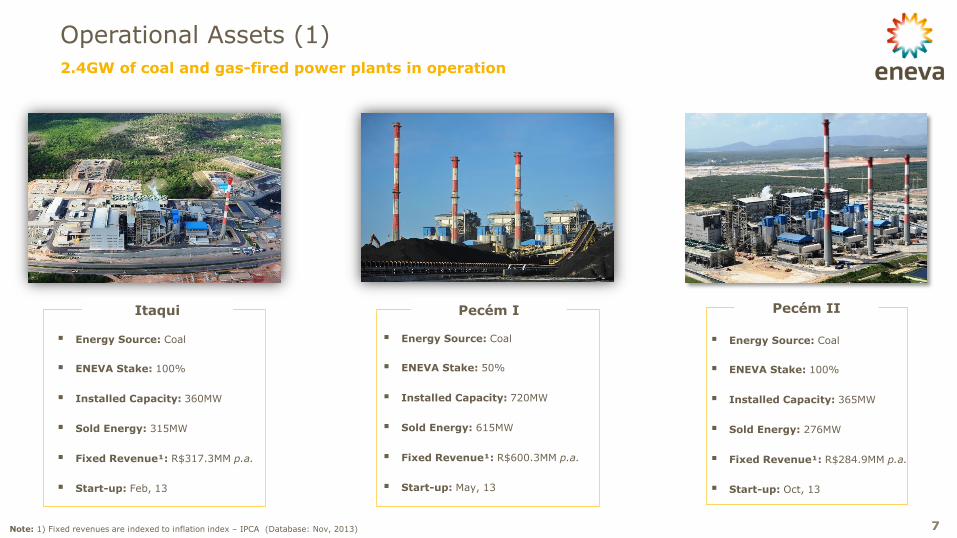
2.4GW of coal and gas-fired power plants in operation
Operational Assets (1)
7
Pecém I
Energy Source: Coal
ENEVA Stake: 50%
Installed Capacity: 720MW
Sold Energy: 615MW
Fixed Revenue¹: R$600.3MM p.a.
Start-up: May, 13
Energy Source: Coal
ENEVA Stake: 100%
Installed Capacity: 360MW
Sold Energy: 315MW
Fixed Revenue¹: R$317.3MM p.a.
Start-up: Feb, 13
Itaqui
Note: 1) Fixed revenues are indexed to inflation index – IPCA (Database: Nov, 2013)
Energy Source: Coal
ENEVA Stake: 100%
Installed Capacity: 365MW
Sold Energy: 276MW
Fixed Revenue¹: R$284.9MM p.a.
Start-up: Oct, 13
Pecém II
8
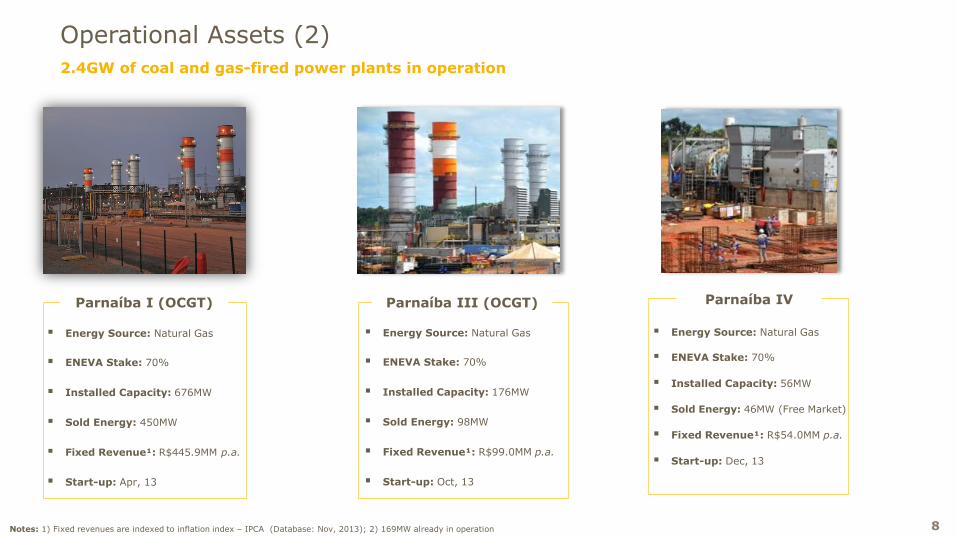
Parnaíba I (OCGT)
Energy Source: Natural Gas
ENEVA Stake: 70%
Installed Capacity: 676MW
Sold Energy: 450MW
Fixed Revenue¹: R$445.9MM p.a.
Start-up: Apr, 13
Energy Source: Natural Gas
ENEVA Stake: 70%
Installed Capacity: 176MW
Sold Energy: 98MW
Fixed Revenue¹: R$99.0MM p.a.
Start-up: Oct, 13
Parnaíba III (OCGT)
Energy Source: Natural Gas
ENEVA Stake: 70%
Installed Capacity: 56MW
Sold Energy: 46MW (Free Market)
Fixed Revenue¹: R$54.0MM p.a.
Start-up: Dec, 13
Parnaíba IV
2.4GW of coal and gas-fired power plants in operation
Operational Assets (2)
Notes: 1) Fixed revenues are indexed to inflation index – IPCA (Database: Nov, 2013); 2) 169MW already in operation
9
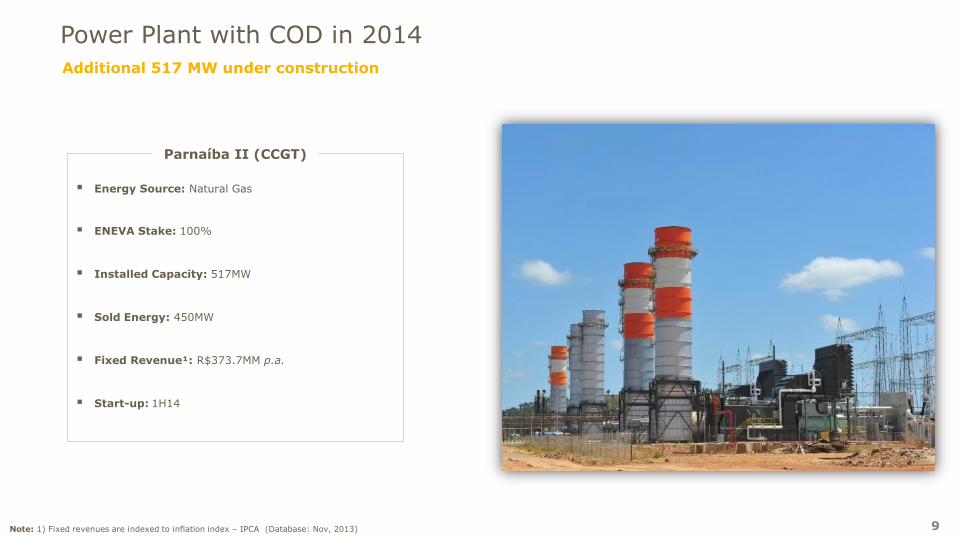
Energy Source: Natural Gas
ENEVA Stake: 100%
Installed Capacity: 517MW
Sold Energy: 450MW
Fixed Revenue¹: R$373.7MM p.a.
Start-up: 1H14
Parnaíba II (CCGT)
Note: 1) Fixed revenues are indexed to inflation index – IPCA (Database: Nov, 2013)
Additional 517 MW under construction
Power Plant with COD in 2014
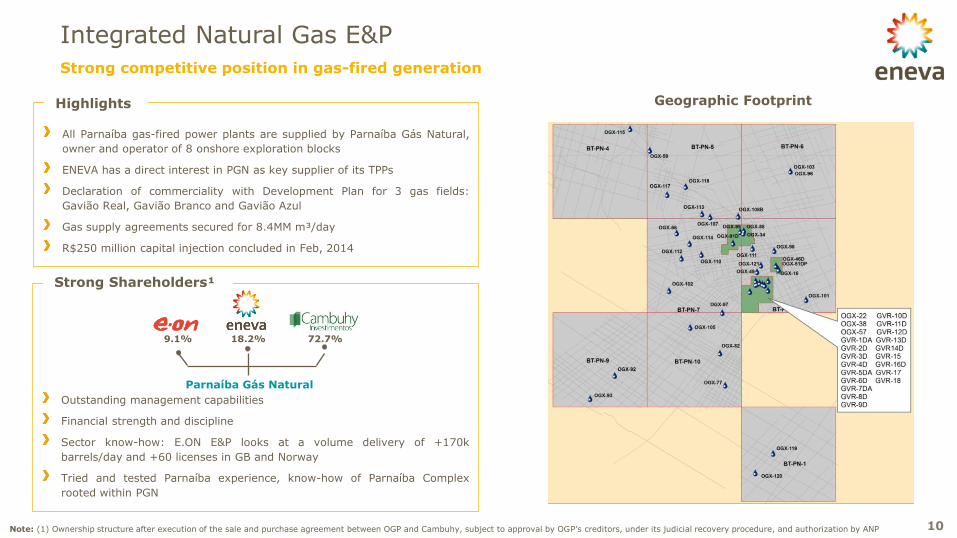
Outstanding management capabilities
Financial strength and discipline
Sector know-how: E.ON E&P looks at a volume delivery of +170k
barrels/day and +60 licenses in GB and Norway
Tried and tested Parnaíba experience, know-how of Parnaíba Complex
rooted within PGN
Strong Shareholders¹
All Parnaíba gas-fired power plants are supplied by Parnaíba Gás Natural,
owner and operator of 8 onshore exploration blocks
ENEVA has a direct interest in PGN as key supplier of its TPPs
Declaration of commerciality with Development Plan for 3 gas fields:
Gavião Real, Gavião Branco and Gavião Azul
Gas supply agreements secured for 8.4MM m³/day
R$250 million capital injection concluded in Feb, 2014
Highlights
10
Integrated Natural Gas E&P
Strong competitive position in gas-fired generation
Parnaíba Gás Natural
18.2% 9.1% 72.7%
Geographic Footprint
Note: (1) Ownership structure after execution of the sale and purchase agreement between OGP and Cambuhy, subject to approval by OGP’s creditors, under its judicial recovery procedure, and authorization by ANP
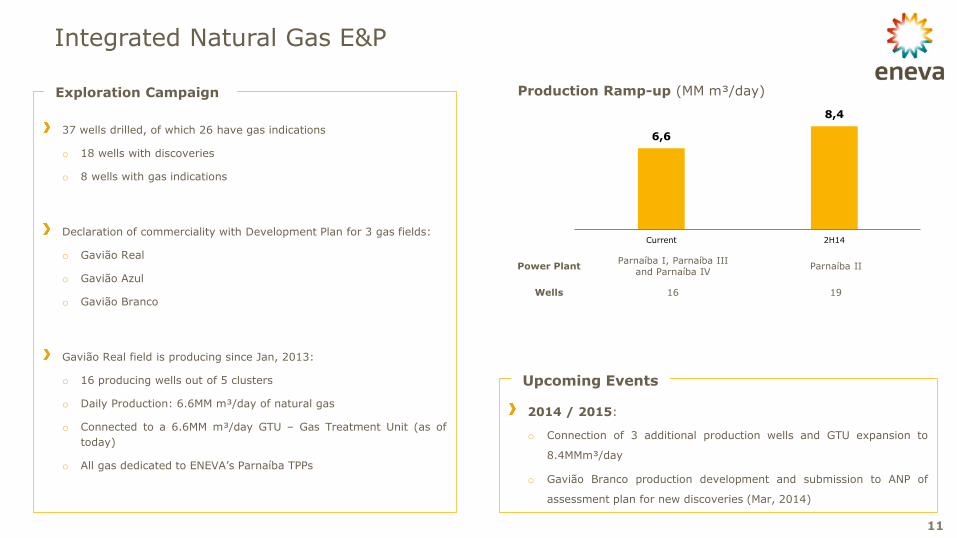
37 wells drilled, of which 26 have gas indications
o 18 wells with discoveries
o 8 wells with gas indications
Declaration of commerciality with Development Plan for 3 gas fields:
o Gavião Real
o Gavião Azul
o Gavião Branco
Gavião Real field is producing since Jan, 2013:
o 16 producing wells out of 5 clusters
o Daily Production: 6.6MM m³/day of natural gas
o Connected to a 6.6MM m³/day GTU – Gas Treatment Unit (as of
today)
o All gas dedicated to ENEVA’s Parnaíba TPPs
Exploration Campaign
11
Integrated Natural Gas E&P
2014 / 2015:
o Connection of 3 additional production wells and GTU expansion to
8.4MMm³/day
o Gavião Branco production development and submission to ANP of
assessment plan for new discoveries (Mar, 2014)
Upcoming Events
Power Plant Parnaíba I, Parnaíba III
and Parnaíba IV Parnaíba II
Wells 16 19
Production Ramp-up (MM m³/day)
6,6
8,4
Current 2H14

Short-Term Value Triggers
3
13
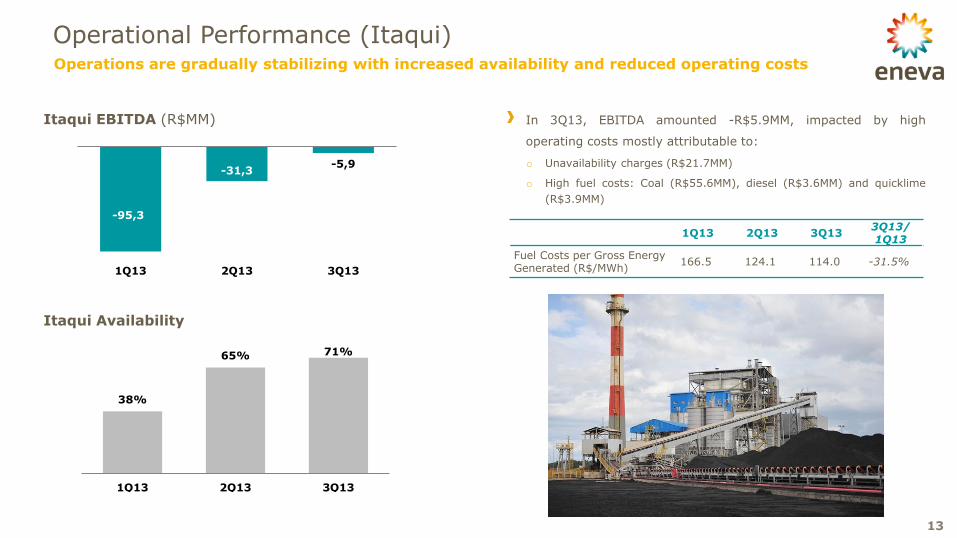
Operational Performance (Itaqui)
-95,3
-31,3 -5,9
1Q13 2Q13 3Q13
Itaqui EBITDA (R$MM)
38%
65% 71%
1Q13 2Q13 3Q13
Itaqui Availability
Operations are gradually stabilizing with increased availability and reduced operating costs
In 3Q13, EBITDA amounted -R$5.9MM, impacted by high
operating costs mostly attributable to:
o Unavailability charges (R$21.7MM)
o High fuel costs: Coal (R$55.6MM), diesel (R$3.6MM) and quicklime
(R$3.9MM)
1Q13 2Q13 3Q13 3Q13/ 1Q13
Fuel Costs per Gross Energy Generated (R$/MWh)
166.5 124.1 114.0 -31.5%
14
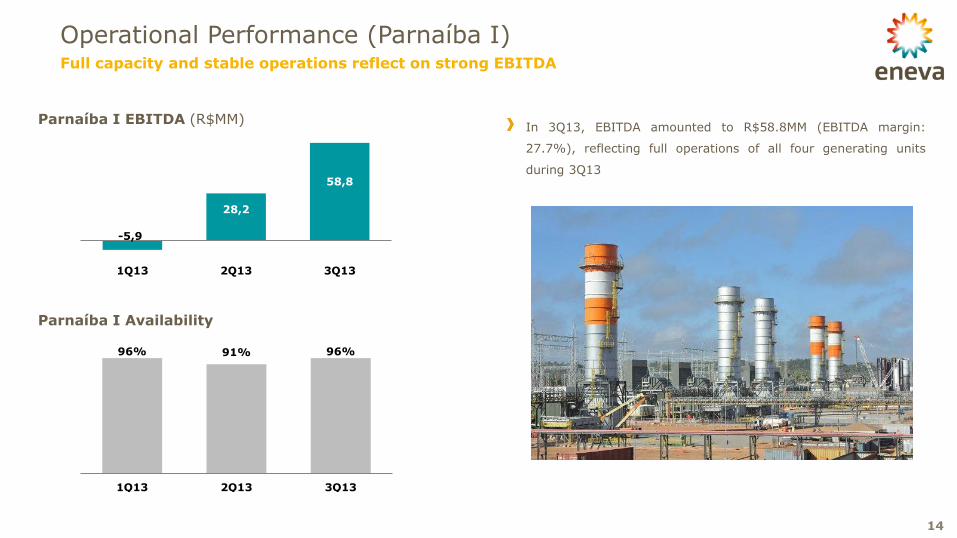
Operational Performance (Parnaíba I)
-5,9
28,2
58,8
1Q13 2Q13 3Q13
Parnaíba I EBITDA (R$MM)
96% 91% 96%
1Q13 2Q13 3Q13
Parnaíba I Availability
Full capacity and stable operations reflect on strong EBITDA
In 3Q13, EBITDA amounted to R$58.8MM (EBITDA margin:
27.7%), reflecting full operations of all four generating units
during 3Q13
15
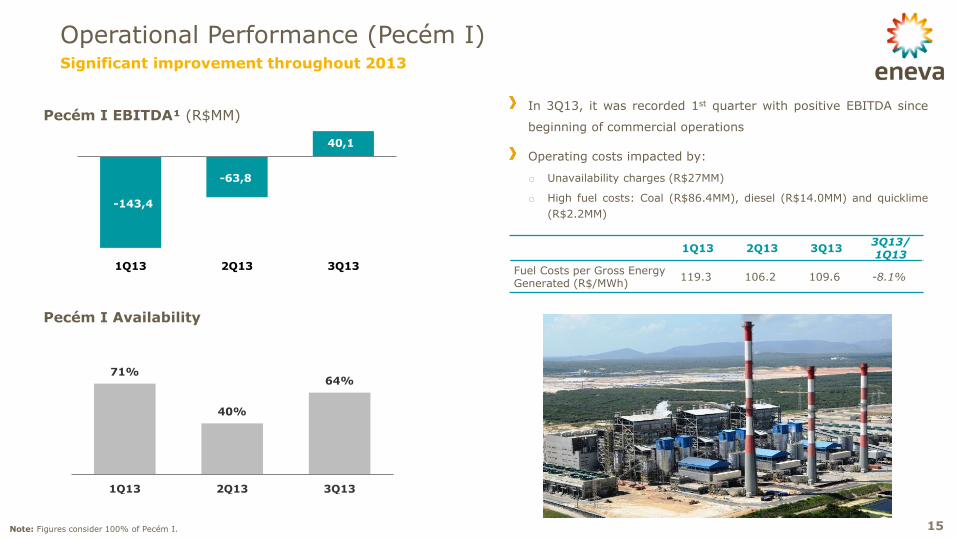
Significant improvement throughout 2013
-143,4
-63,8
40,1
1Q13 2Q13 3Q13
Operational Performance (Pecém I)
Pecém I EBITDA¹ (R$MM)
Pecém I Availability
In 3Q13, it was recorded 1st quarter with positive EBITDA since
beginning of commercial operations
Operating costs impacted by:
o Unavailability charges (R$27MM)
o High fuel costs: Coal (R$86.4MM), diesel (R$14.0MM) and quicklime
(R$2.2MM)
1Q13 2Q13 3Q13 3Q13/ 1Q13
Fuel Costs per Gross Energy Generated (R$/MWh)
119.3 106.2 109.6 -8.1%
71%
40%
64%
1Q13 2Q13 3Q13
Note: Figures consider 100% of Pecém I.
16
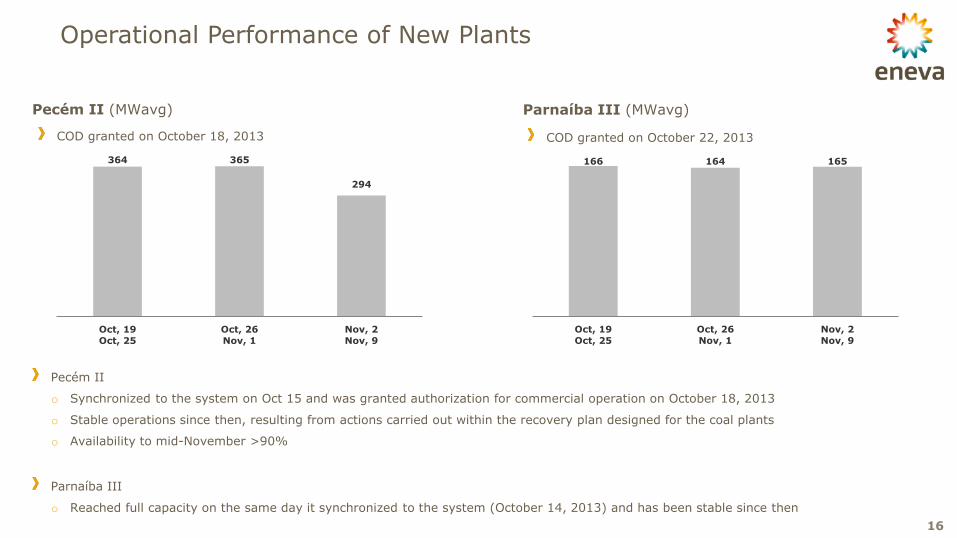
Operational Performance of New Plants
Pecém II (MWavg) Parnaíba III (MWavg)
COD granted on October 22, 2013 COD granted on October 18, 2013
Pecém II
o Synchronized to the system on Oct 15 and was granted authorization for commercial operation on October 18, 2013
o Stable operations since then, resulting from actions carried out within the recovery plan designed for the coal plants
o Availability to mid-November >90%
Parnaíba III
o Reached full capacity on the same day it synchronized to the system (October 14, 2013) and has been stable since then
364 365
294
Oct, 19
Oct, 25
Oct, 26
Nov, 1
Nov, 2
Nov, 9
166 164 165
Oct, 19
Oct, 25
Oct, 26
Nov, 1
Nov, 2
Nov, 9
5,584
5,195
150
357
5,733
5,551
2Q13 3Q13
Net Debt Cash and Cash Equivalents
17
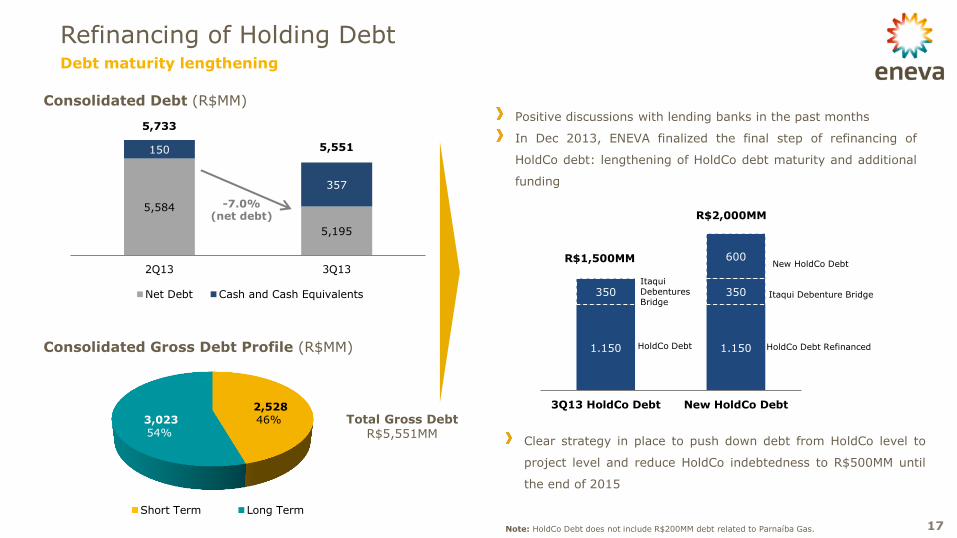
Refinancing of Holding Debt Debt maturity lengthening
Consolidated Debt (R$MM)
Total Gross Debt R$5,551MM
Consolidated Gross Debt Profile (R$MM)
Positive discussions with lending banks in the past months
In Dec 2013, ENEVA finalized the final step of refinancing of
HoldCo debt: lengthening of HoldCo debt maturity and additional
funding
2,528 46% 3,023
54%
Short Term Long Term
-7.0% (net debt)
Clear strategy in place to push down debt from HoldCo level to
project level and reduce HoldCo indebtedness to R$500MM until
the end of 2015
1.150 1.150
350 350
600
3Q13 HoldCo Debt New HoldCo Debt
New HoldCo Debt
Itaqui Debenture Bridge
Itaqui Debentures Bridge
HoldCo Debt HoldCo Debt Refinanced
R$1,500MM
R$2,000MM
Note: HoldCo Debt does not include R$200MM debt related to Parnaíba Gas.
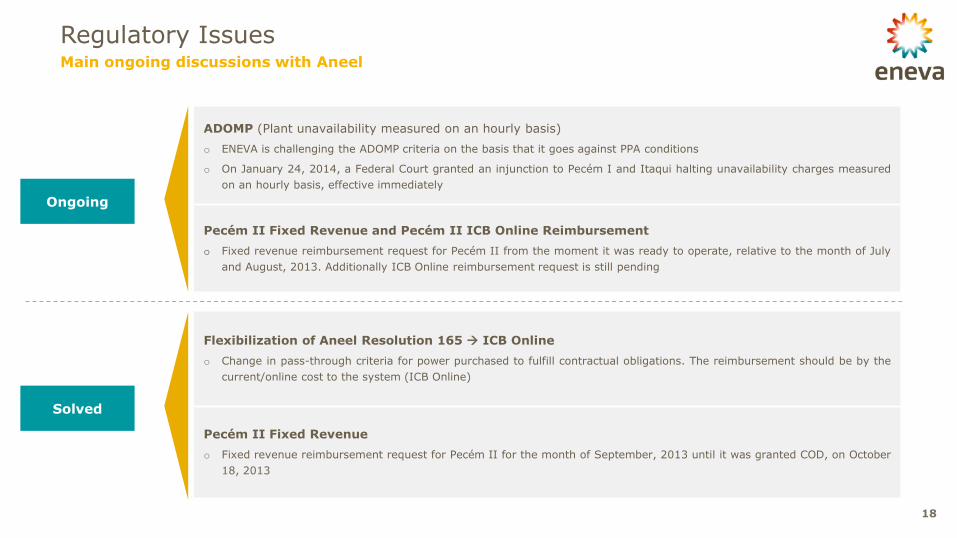
Ongoing
Solved
Flexibilization of Aneel Resolution 165 ICB Online
o Change in pass-through criteria for power purchased to fulfill contractual obligations. The reimbursement should be by the
current/online cost to the system (ICB Online)
Pecém II Fixed Revenue
o Fixed revenue reimbursement request for Pecém II for the month of September, 2013 until it was granted COD, on October
18, 2013
ADOMP (Plant unavailability measured on an hourly basis)
o ENEVA is challenging the ADOMP criteria on the basis that it goes against PPA conditions
o On January 24, 2014, a Federal Court granted an injunction to Pecém I and Itaqui halting unavailability charges measured
on an hourly basis, effective immediately
Pecém II Fixed Revenue and Pecém II ICB Online Reimbursement
o Fixed revenue reimbursement request for Pecém II from the moment it was ready to operate, relative to the month of July
and August, 2013. Additionally ICB Online reimbursement request is still pending
18
Regulatory Issues Main ongoing discussions with Aneel
19
Cost Reduction Program
ENEVA developed a Medium Term Plan 2014-2016 aimed at achieving significant cost reduction at
holding and project level through:
Leaner organizational structure
Headcount reduction
Decrease in third-party services
Reduction of fixed costs at project level

Brazilian Power Market and Greenfield Portfolio
4
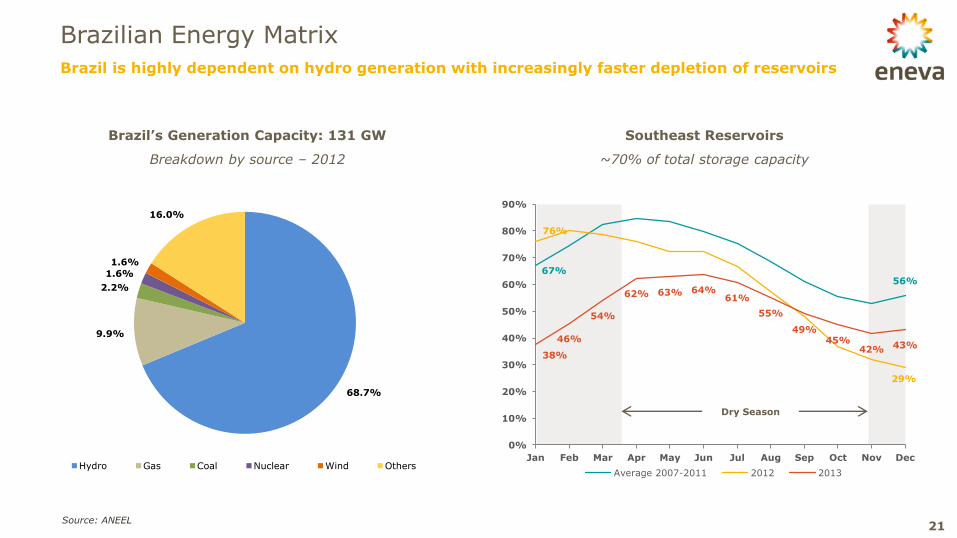
Southeast Reservoirs
~70% of total storage capacity
Source: ANEEL
Brazil’s Generation Capacity: 131 GW
Breakdown by source – 2012
68.7%
9.9%
2.2%
1.6%
1.6%
16.0%
Hydro Gas Coal Nuclear Wind Others
Brazil is highly dependent on hydro generation with increasingly faster depletion of reservoirs
Brazilian Energy Matrix
21
Dry Season
67% 56%
76%
29%
38%
46%
54%
62% 63% 64% 61%
55%
49% 45%
42% 43%
0%
10%
20%
30%
40%
50%
60%
70%
80%
90%
Jan Feb Mar Apr May Jun Jul Aug Sep Oct Nov Dec
Average 2007-2011 2012 2013
Source: ONS
Autonomy = Storage Capacity / (Load – Thermal Generation)
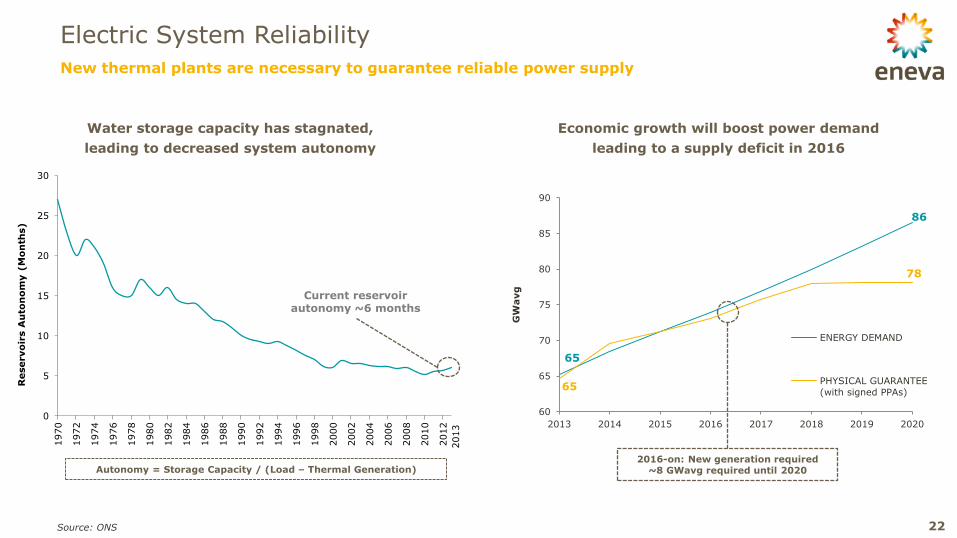
Economic growth will boost power demand
leading to a supply deficit in 2016
Water storage capacity has stagnated,
leading to decreased system autonomy
65
86
65
78
60
65
70
75
80
85
90
2013 2014 2015 2016 2017 2018 2019 2020
GW
avg
ENERGY DEMAND
PHYSICAL GUARANTEE
(with signed PPAs)
2016-on: New generation required ~8 GWavg required until 2020
22
Electric System Reliability
New thermal plants are necessary to guarantee reliable power supply
0
5
10
15
20
25
30
1970
1972
1974
1976
1978
1980
1982
1984
1986
1988
1990
1992
1994
1996
1998
2000
2002
2004
2006
2008
2010
2012
Reservo
irs A
uto
no
my (
Mo
nth
s)
2013
Current reservoir autonomy ~6 months
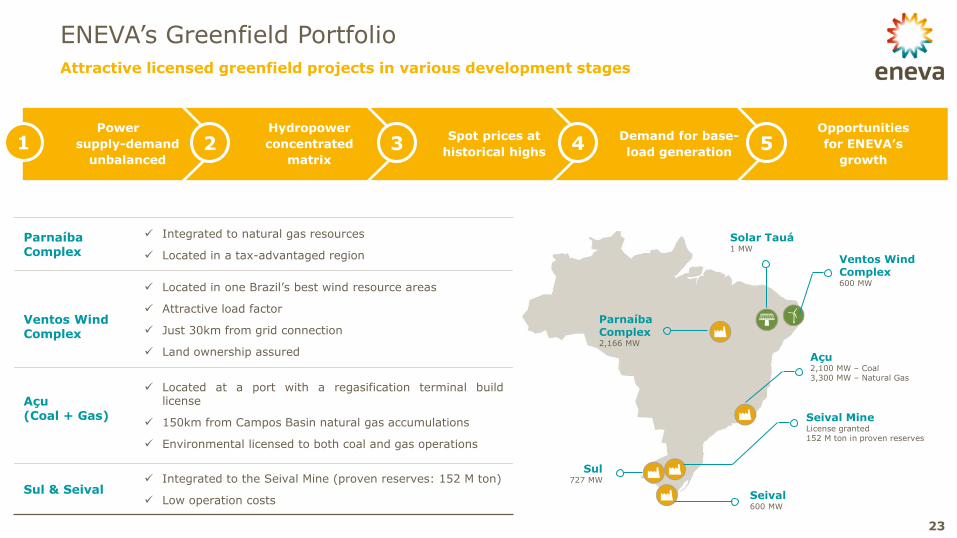
Parnaíba Complex
Integrated to natural gas resources
Located in a tax-advantaged region
Ventos Wind Complex
Located in one Brazil’s best wind resource areas
Attractive load factor
Just 30km from grid connection
Land ownership assured
Açu (Coal + Gas)
Located at a port with a regasification terminal build license
150km from Campos Basin natural gas accumulations
Environmental licensed to both coal and gas operations
Sul & Seival Integrated to the Seival Mine (proven reserves: 152 M ton)
Low operation costs
Power
supply-demand
unbalanced
Hydropower
concentrated
matrix
Spot prices at
historical highs
Demand for base-
load generation
Opportunities
for ENEVA’s
growth 2 3 4 5 1
Sul 727 MW
Parnaíba Complex 2,166 MW
Seival 600 MW
Açu 2,100 MW – Coal 3,300 MW – Natural Gas
Solar Tauá 1 MW
Ventos Wind Complex 600 MW
Seival Mine License granted 152 M ton in proven reserves
ENEVA’s Greenfield Portfolio
23
Attractive licensed greenfield projects in various development stages

Appendix | Images
5
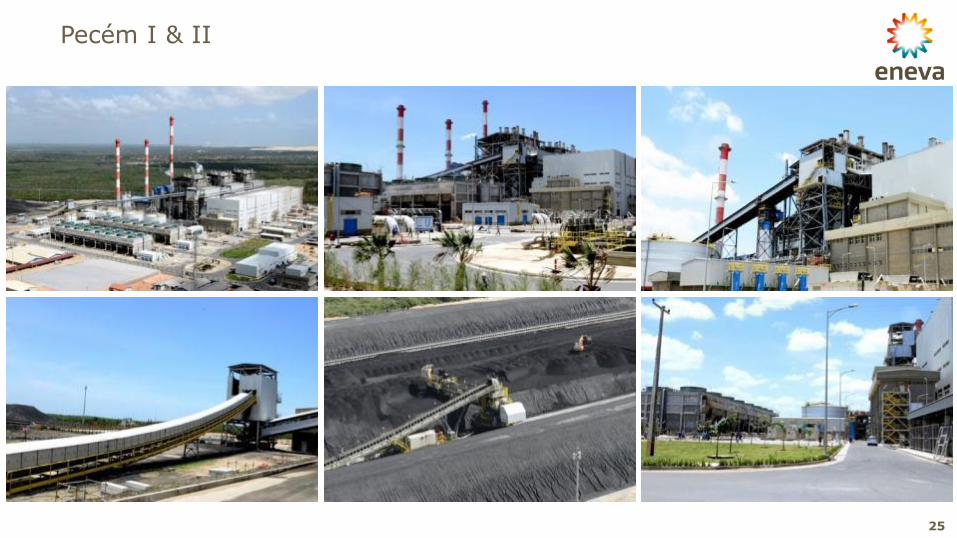
Pecém I & II
25
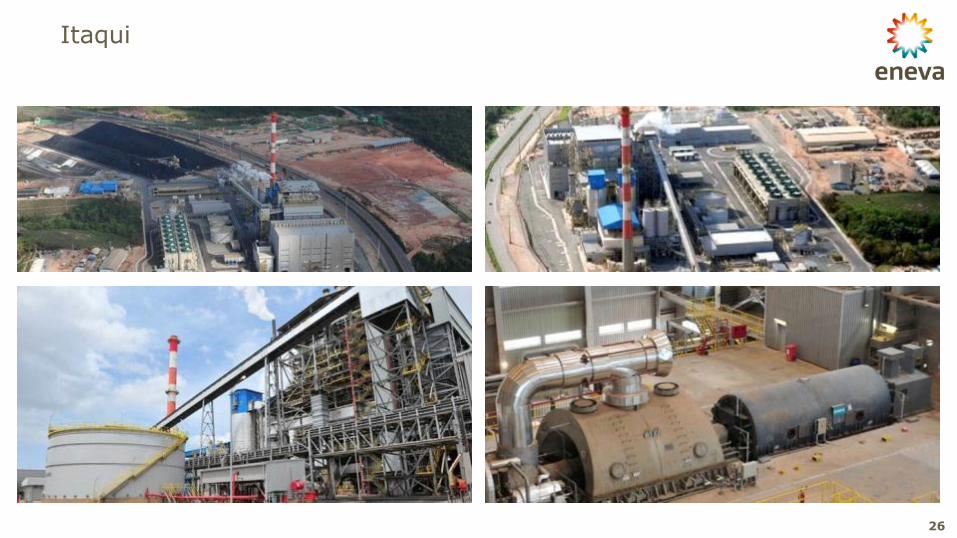
Itaqui
26
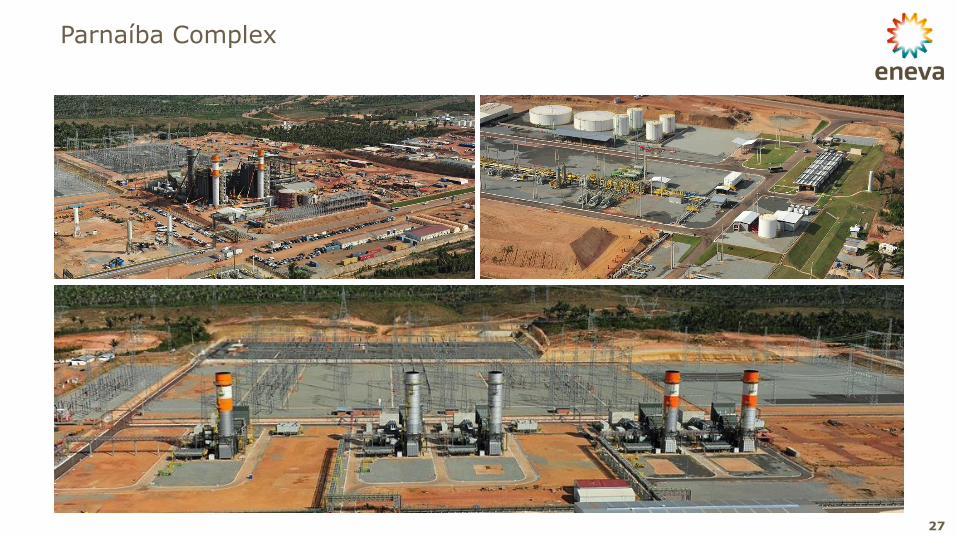
Parnaíba Complex
27
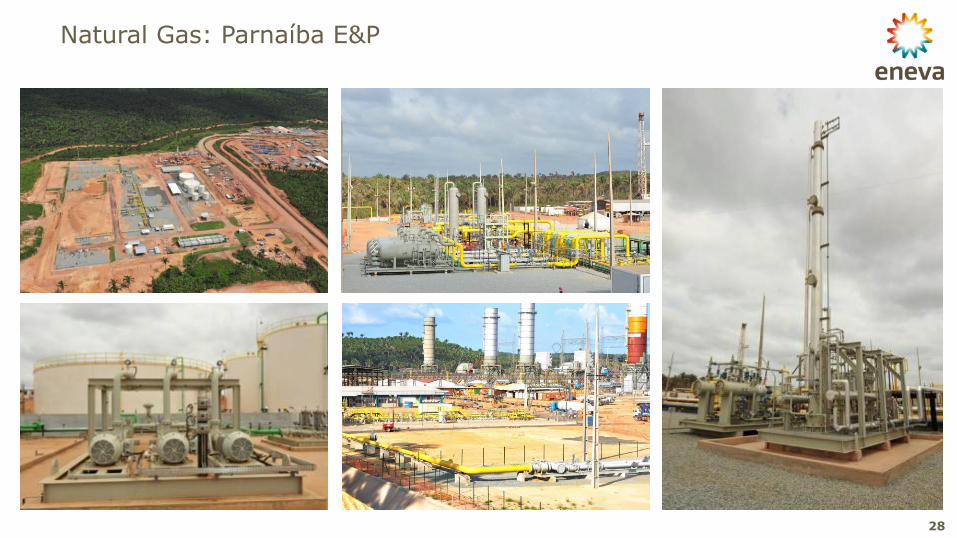
Natural Gas: Parnaíba E&P
28
Disclaimer
The material that follows is a presentation of general background information about ENEVA S.A. and its subsidiaries (collectively, “ENEVA” or the “Company”) as of
the date of the presentation. It is information in summary form and does not purport to be complete. No representation or warranty, express or implied, is made
concerning, and no reliance should be placed on, the accuracy, fairness, or completeness of this information.
This presentation may contain certain forward-looking statements and information relating to ENEVA that reflect the current views and/or expectations of the
Company and its management with respect to its performance, business and future events. Forward looking statements include, without limitation, any statement
that may predict, forecast, indicate or imply future results, performance or achievements, and may contain words like “may”, “plan”, “believe”, “anticipate”,
“expect”, “envisages”, “will likely result”, or any other words or phrases of similar meaning. Such statements are subject to a number of risks, uncertainties and
assumptions. We caution you that a number of important factors could cause actual results to differ materially from the plans, objectives, expectations, estimates
and intentions expressed in this presentation. In no event, neither the Company, any of its affiliates, directors, officers, agents or employees nor any of the
placement agents shall be liable before any third party (including investors) for any investment or business decision made or action taken in reliance on the
information and statements contained in this presentation or for any consequential, special or similar damages.
This presentation does not constitute an offer, or invitation, or solicitation of an offer, to subscribe for or purchase any securities.
Neither this presentation nor anything contained herein shall form the basis of any contract or commitment whatsoever.
Recipients of this presentation are not to construe the contents of this summary as legal, tax or investment advice and recipients should consult their own advisors
in this regard.
The market and competitive position data, including market forecasts, used throughout this presentation were obtained from internal surveys, market research,
publicly available information and industry publications. Although we have no reason to believe that any of this information or these reports are inaccurate in any
material respect, we have not independently verified the competitive position, market share, market size, market growth or other data provided by third parties or
by industry or other publications. ENEVA, the placement agents and the underwriters do not make any representation as to the accuracy of such information.
This presentation and its contents are proprietary information and may not be reproduced or otherwise disseminated in whole or in part without ENEVA’s prior
written consent.
Thank you. www.eneva.com.br