Embed Size (px)
Citation preview
Eng. & Tech. Journal, Vol.31,Part (B), No.4,2013.4444
471
Color Removal from Industrial Textile Wastewater Using Chemical Adsorption
Dr. Najah M. Al-Shuwaiki Air Refrigeration and Conditioning Department, Dijlah University College/ Baghdad Emil: [email protected] Dr. Balasim A. Abid Chemical Engineering Department, University of Technology/ Baghdad Dr.Mahmood M. Brbooti Applied Science Department, University of Technology/ Baghdad
Received on: 2/7/2012 & Accepted on: 6/12/2012
ABSTRACT Industrial wastewaters from local state textile industry (Al-Khadimia Textile
Co.) as well as aqueous prepared solutions of color dyes were subjected to simple physico-chemical treatment. The effect of pollutants concentrations, magnesia and other coagulants doses, filtration rate and the overall run time on the water quality were studied in detail.
The treatment involves the addition of either magnesia or lime-water suspensions (combined with CPE) in various doses, 0.1-1.0 g/l to the wastewater and colored samples, to study the effect of varying doses on the treatment efficiency. The optimum values of MgO doses were found to be 0.2-0.4 g/l for synthetic colored. Doses of 0.05-0.2 g/l were the best for industrial wastewater. The removal efficiency of all the pollutants in the different samples increases to more than 95% by increasing the pH values to the range of 9.5 to 10 with MgO coagulant and pH of 11.5 to 12 with CaO coagulant.
In the jar experiments the rotation speed, N, of 120-140 rpm, for two minutes was the most favorable speed of coagulation mixing for industrial waters. For flocculation, the mixing speed of 35-40 rpm, (G of 40-45 s-1) gave the best removal efficiencies with 20-30 min detention time.
At the best operating conditions of the pilot plant, the removal efficiencies of Turbidity, TSS, and color were 97-99%, 94-96%, 94-95%. The TDS removal efficiency was of 39% for Al-Khadimia wastewater.
Keywords:Removal of colors, Chemical adsorption, Magnesium oxide, lime.
الامتزاز باستخدامالمصرفة الصناعیة النسیج میاه من ازالة الملوثات الصبغیة الكیمیاوي
الخلاصة
نس یج مص نع -الش ركة العام ة للص ناعات القطنی ة (ان المی اه الص ناعیة المص رفة م نق د وكذلك المحالیل المائیھ المحضره مختبریا لعدة صبغات مختلفة وبتراكی ز مختلف ة كلھ ا ) الكاظمیة
PDF created with pdfFactory Pro trial version www.pdffactory.com
Eng. & Tech. Journal, Vol, 31. Part (B), No.4, 2013. Color Removal from Industrial Textile Wastewater Using Chemical Adsorption
472
ھ ذه الطریق ھ تتض من أض افة معل ق اوكس ید المغنیس وم م ع . بالطریقة الفیزیاوی ة الكیمیاوی ة عولجتالم اء یتب ع ذل ك عملی ة فلت ره لجع ل مواص فات الم اء المع الج اق رب م ا یمك ن م ن مواص فات م اء
س بص وره مكثف ة كأس اقد درست عملیة التخثیر والتلبید وعملیة الفلتره عن طریق الرمل ان .الاسالةبص ورة جی دة ع ن طری ق حبیب ات تامتص ان الصبغات اللونیة ق د وقد وجد .علمي لعملیة المعالجة
تركی ز اوكس ید ، كی ز الملوث اتاتردرس ت . اوكس ید المغنیس یوم وق د انفص لت ع ن الس ائل الاص ليمع دل الفلت ره وعام ل ال زمن واث ر ھ ذه ، درج ة الح رارة، المغنیس وم والم واد الكیمیاوی ة الاخ رى
.وامل على نوعیة الماء المعالج الناتجالعالم اء -الم اء او اوكس ید الكالس یوم -المعالج ة تتض من أض افة معل ق اوكس ید المغنیس یوم
لدراس ة أث ر تغی ر ، ال ى المی اه المص رفة والعین ات الملون ة لت ر/ غم )1.0-0.1(بجرعات مختلفة من .كمیات الجرعات على كفاءة العملیة
للمحالی ل لت ر /غ م ) 0.4-0.2( جرعات اوكس ید المغنیس یوم وج دت ھ يان أنسب الكمیات لان افض ل الجرع ات م ن اوكس ید المغنیس یوم لمعالج ة المی اه الص ناعیة الحقیقی ة . الملون ة المحض ره
بزی ادة % 95ان كفاءة ازالة الملوثات عموم ا تزی د لاكث ر م ن . لتر /غم ) 0.2-0.05(المصرفة ھي 10-9.5الى pHالاس الھیدروجیني
و لم دة دقیقت ین دقیق ة/ دوره 140 -120لتجاربتم تحدید سرعةلباستخدام جھاز فحص الجرة .یمیر والتلبید باعتبارھا افضل القلمرحلتي التخث دقیقة) 30-20(لمدة دقیقة/ دورة) 35-40(
TDSكان ت كف اءة ازال ة العك ورة و لمنظومة الریادی ة عن د افض ل الض روف التش غیلیةلللمیاه الصناعیة المص رفة م ن % 39و % 95-94، %96-94، % 99-97ھي TSSوالالوان و
.الكاظمیة
INTRODUCTION astewater generated from various industries creates the major environmental detrimental effects leading to imbalance of bio-system. Textile industry, which is one the largest water consumer in the world,
produces the wastewater comprising various recalcitrant agents such as dyes, sizing agents, and dyeing aids. Therefore it has to be really concerned in releasing these types of wastewater to environment. Color dyes are very important in the disposal of textile wastewater due to aesthetic deterioration as well as the obstruction of penetration of dissolved oxygen, DO, and sun light into natural water bodies. The reduction of DO and sunlight penetration into natural water sources seriously affects the aquatic life. Besides, the dye precursors and the dye degradation products are proven to be carcinogenic and mutagenic in nature (Babu et al., 2000).
Textile industries wastewater is characterized primarily by measurements of BOD, COD, TDS, TSS, and color. These industries effluents exhibit large amounts of dye chemicals, organic substances and many pollutants which create severe water pollution. It is therefore important to reduce the dye concentration in the wastewater before discharging into the environment. There are many technologies currently available for treating wastewater from these industries, they are: 1) biological treatment 2) chemical precipitation 3) ultra filtration 4) carbon adsorption and 5) oxidation with ozone. The physical methods used in treating wastewater include precipitation (coagulation, flocculation, sedimentation), adsorption on activated carbon, filtration, or reverse osmosis membrane processes (Babu et al., 2007 and 2000).
W
PDF created with pdfFactory Pro trial version www.pdffactory.com
Eng. & Tech. Journal, Vol, 31. Part (B), No.4, 2013. Color Removal from Industrial Textile Wastewater Using Chemical Adsorption
473
Chemical coagulation process with settling or floatation is a simple technique, which may be applied to the heavily contaminated wastewater stream, to remove, primarily the colloidal impurities including dyestuff and the associated biochemical and chemical oxygen demand (BOD, COD). Coagulation will not remove all the pollutants but it can be useful technique to initiate treatment in the first phase to reduce pollution level up to some extent (Sheikh, 1999).
Removal of dyes from wastewater can be effected by chemical coagulation, air floatation, and adsorption methods (Sabroota, 2000). Coagulation-flocculation treatments are generally used to eliminate organic substances, but the chemicals normally used in this process have no effect on the elimination of soluble dyestuffs. Using magnesium oxide effectively eliminates soluble dyes by adsorption on its solid particles.
EXPERIMENTAL STUDIES Materials and Chemicals
The coagulants and chemicals used to enhance the removal efficiency (more data can be seen by AL-Shuwaiki N. M. A., 2009) are: 1.Magnesia, magnesium oxide 99% from CARLO ERBA, Italy. Its molecular weight, molecular volume and density are 40.32 g/gmol, 11.2 cm3 /gm, and 3.6 g/cm3 respectively. 2.Lime, calcium oxide, 99% from CARLO ERBA, Italy. Its molecular weight is 56.1 g/gmol.
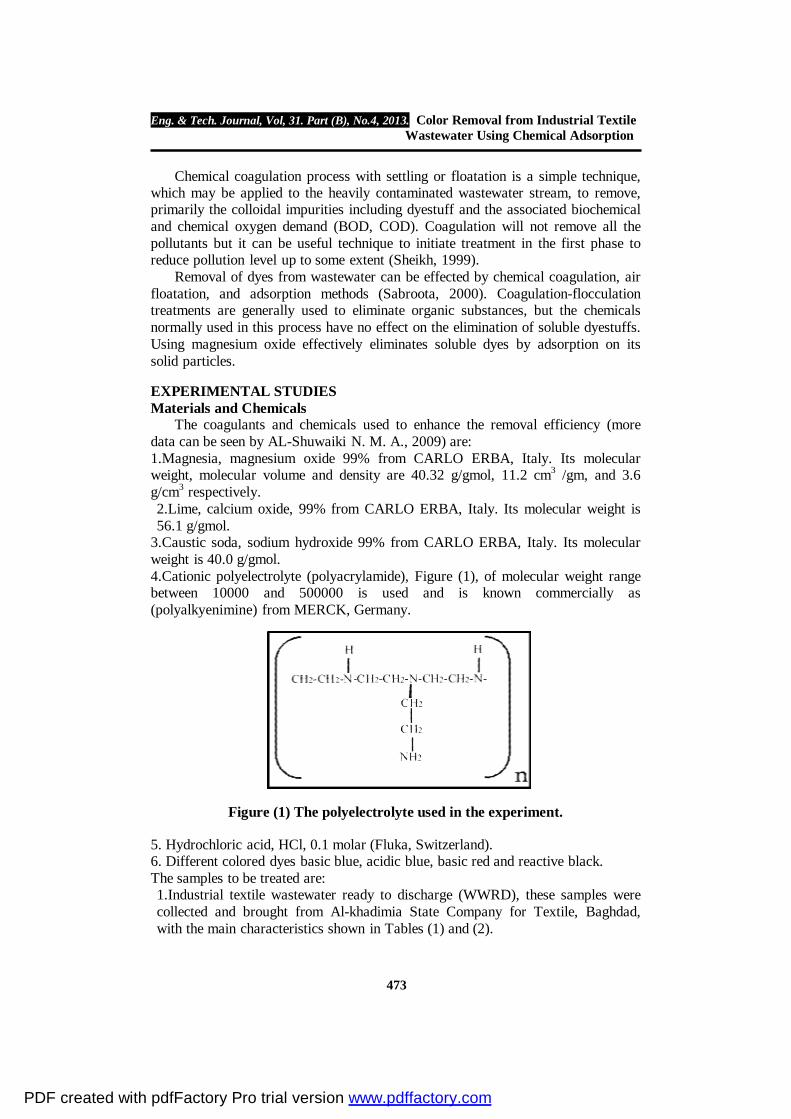
3.Caustic soda, sodium hydroxide 99% from CARLO ERBA, Italy. Its molecular weight is 40.0 g/gmol. 4.Cationic polyelectrolyte (polyacrylamide), Figure (1), of molecular weight range between 10000 and 500000 is used and is known commercially as (polyalkyenimine) from MERCK, Germany.
Figure (1) The polyelectrolyte used in the experiment.
5. Hydrochloric acid, HCl, 0.1 molar (Fluka, Switzerland). 6. Different colored dyes basic blue, acidic blue, basic red and reactive black. The samples to be treated are: 1.Industrial textile wastewater ready to discharge (WWRD), these samples were collected and brought from Al-khadimia State Company for Textile, Baghdad, with the main characteristics shown in Tables (1) and (2).
PDF created with pdfFactory Pro trial version www.pdffactory.com
Eng. & Tech. Journal, Vol, 31. Part (B), No.4, 2013. Color Removal from Industrial Textile Wastewater Using Chemical Adsorption
474
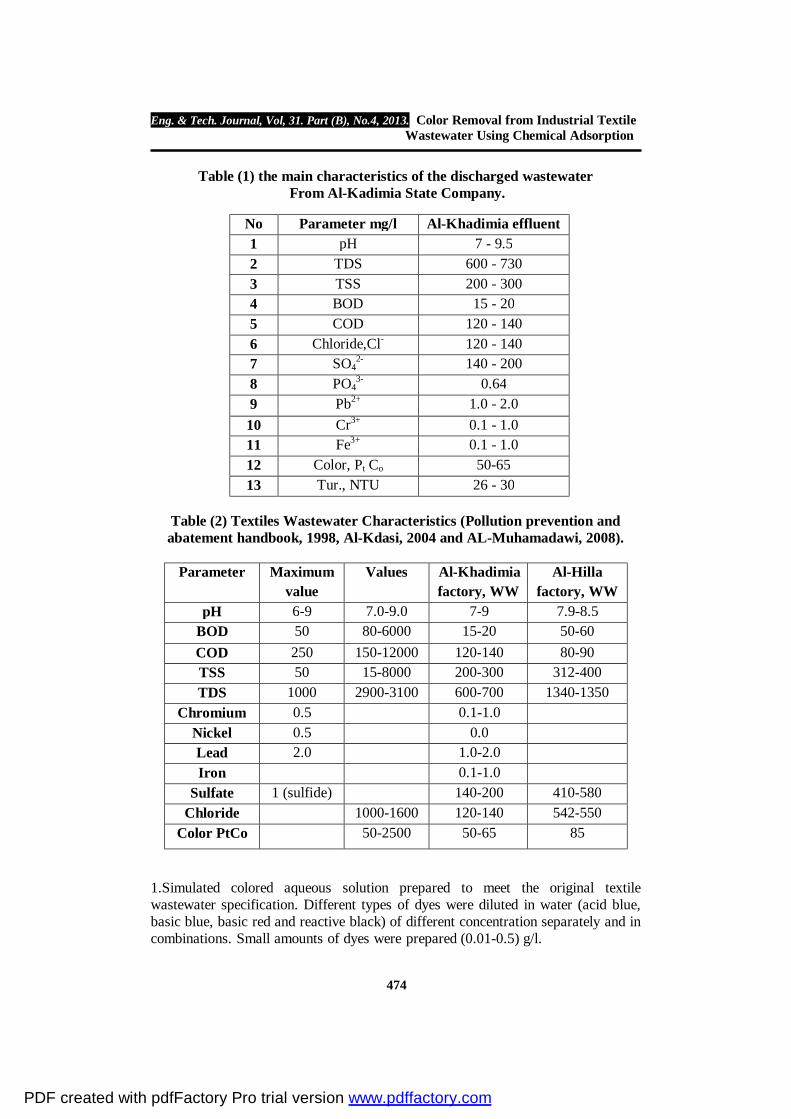
Table (1) the main characteristics of the discharged wastewater From Al-Kadimia State Company.
Table (2) Textiles Wastewater Characteristics (Pollution prevention and abatement handbook, 1998, Al-Kdasi, 2004 and AL-Muhamadawi, 2008).
Parameter Maximum
value Values Al-Khadimia
factory, WW Al-Hilla
factory, WW pH 6-9 7.0-9.0 7-9 7.9-8.5
BOD 50 80-6000 15-20 50-60 COD 250 150-12000 120-140 80-90 TSS 50 15-8000 200-300 312-400 TDS 1000 2900-3100 600-700 1340-1350
Chromium 0.5 0.1-1.0 Nickel 0.5 0.0 Lead 2.0 1.0-2.0 Iron 0.1-1.0
Sulfate 1 (sulfide) 140-200 410-580 Chloride 1000-1600 120-140 542-550
Color PtCo 50-2500 50-65 85
1.Simulated colored aqueous solution prepared to meet the original textile wastewater specification. Different types of dyes were diluted in water (acid blue, basic blue, basic red and reactive black) of different concentration separately and in combinations. Small amounts of dyes were prepared (0.01-0.5) g/l.
Al-Khadimia effluent Parameter mg/l No 7 - 9.5 pH 1
600 - 730 TDS 2 200 - 300 TSS 3 15 - 20 BOD 4
120 - 140 COD 5 120 - 140 Chloride,Cl- 6 140 - 200 SO4
2- 7 0.64 PO4
3- 8 1.0 - 2.0 Pb2+ 9 0.1 - 1.0 Cr3+ 10 0.1 - 1.0 Fe3+ 11
50-65 Color, Pt Co 12 26 - 30 Tur., NTU 13
PDF created with pdfFactory Pro trial version www.pdffactory.com
Eng. & Tech. Journal, Vol, 31. Part (B), No.4, 2013. Color Removal from Industrial Textile Wastewater Using Chemical Adsorption
475
2.The suspensions of magnesia, lime, and caustic soda were prepared by dissolving 10 gm of MgO, CaO, and NaOH separately in one liter (1000 ml) of tap water. Measuring Instrumentations and Equipment Jar Tester
Jar test model (Floc Tester CHC) Hoelze and Chelus Com. KG was used in tests techniques to determine the best type and dose of the desired precipitator. pH Meter
pH 211, produced by HANNA with accuracy of 0.1% instruments was used in pH test, temperature and electrical conductivity. Another set of tests was measured by (pH Meter 3320 JENWAY) available in Ministry of Environment labs. Turbidity Meter
The turbidity of samples was tested and measured by turbidity meter of type (Hach A 2001-Lab turbidity meter) with accuracy of ± 0.5% and by (La Motte 2020 e TURBIDIMETER) available in the ministry of Environment Labs. These meters were used to test the turbidity of the samples before and after the treatment. The measuring unit was NTU unit. Total Dissolved Solids Meter
The total dissolved solids and electrical conductivity were measured by a meter model 214 EC HANNA, with accuracy of ± 0.4% and by (CyberScan 10, Conductivity – TDS – o C Meter). Filter Funnel
Filter funnel was used in the determination of suspended and dissolved solids concentrations by filtering wastewater samples on a filter paper type (Whatman 40, Ltd, and UK). Color Meter
To measure colors of wastewater before treating and after, an Aquarius Spectrophotometer CECIL, available in labs of Ministry of Environment was used with absorption range of (0.0-3.0) mg/l and wavelengths range of (300-800) nm. The color intensity was measured as mg/l for the corresponding wavelength. Some samples were measured by the HI 83000 Multiparameter Bench Photometers with the range of 0.0 to 500 Pt.Co of accuracy ± 0.5 %. Pilot Plant System
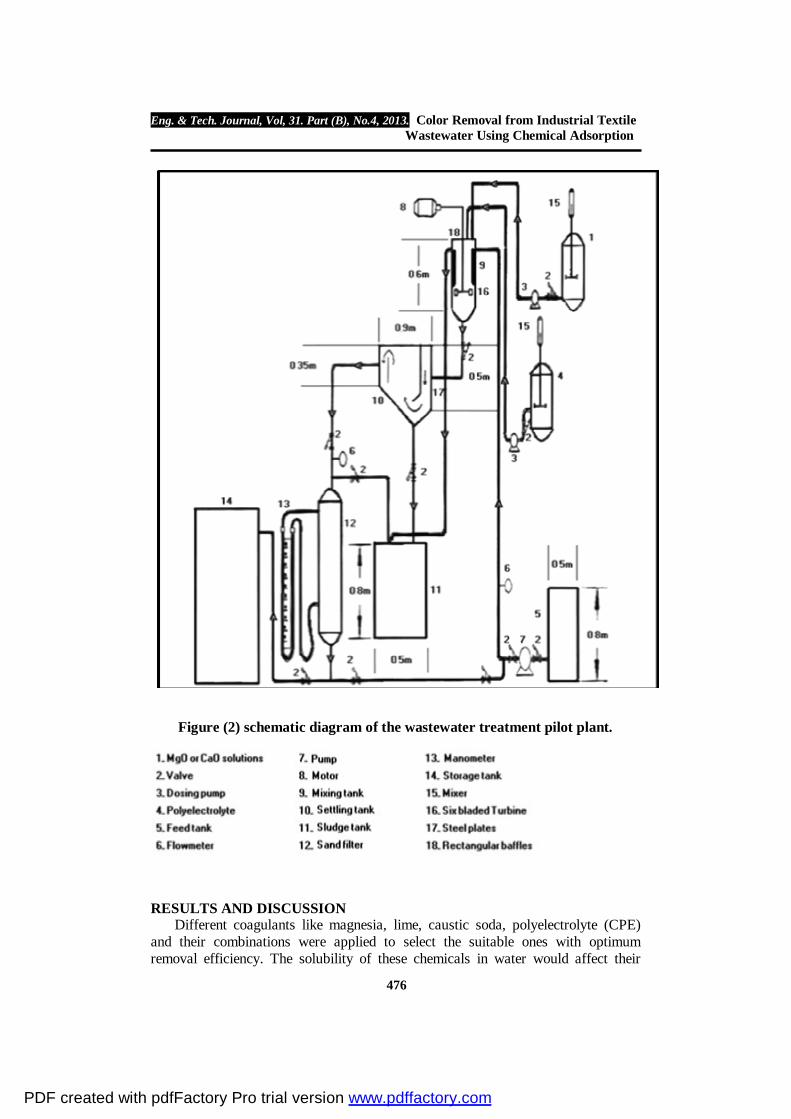
The pilot plant includes mixing tank provided with a mechanical mixing motor with a six-bladed disc turbine agitator as impeller, settling tank, sand filter, collection and storage tanks, dosing pump ,chemicals mixing tank with motor and agitator, U -tube manometer, valves flow meter and drain tanks as can be seen in Figure (2).
PDF created with pdfFactory Pro trial version www.pdffactory.com
Eng. & Tech. Journal, Vol, 31. Part (B), No.4, 2013. Color Removal from Industrial Textile Wastewater Using Chemical Adsorption
476
Figure (2) schematic diagram of the wastewater treatment pilot plant.
RESULTS AND DISCUSSION Different coagulants like magnesia, lime, caustic soda, polyelectrolyte (CPE)
and their combinations were applied to select the suitable ones with optimum removal efficiency. The solubility of these chemicals in water would affect their
PDF created with pdfFactory Pro trial version www.pdffactory.com
Eng. & Tech. Journal, Vol, 31. Part (B), No.4, 2013. Color Removal from Industrial Textile Wastewater Using Chemical Adsorption
477
behavior as coagulants. The solubility of MgO is 1.0 g/80 liter (insoluble), the CaO is slightly soluble and NaOH is highly soluble as cited in The Merck Index.
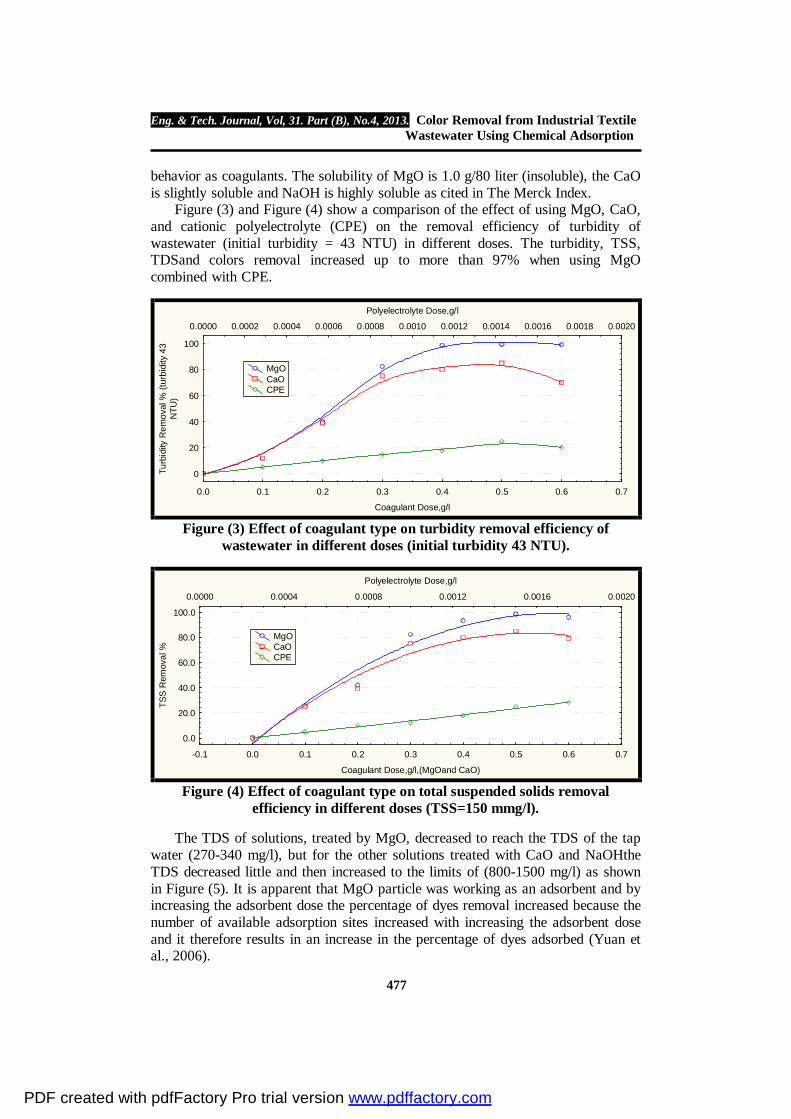
Figure (3) and Figure (4) show a comparison of the effect of using MgO, CaO, and cationic polyelectrolyte (CPE) on the removal efficiency of turbidity of wastewater (initial turbidity = 43 NTU) in different doses. The turbidity, TSS, TDSand colors removal increased up to more than 97% when using MgO combined with CPE.
0.0 0.1 0.2 0.3 0.4 0.5 0.6 0.7
Coagulant Dose,g/l
0.0000 0.0002 0.0004 0.0006 0.0008 0.0010 0.0012 0.0014 0.0016 0.0018 0.0020
Polyelectrolyte Dose,g/l
0
20
40
60
80
100
Turb
idity
Rem
oval
% (t
urbi
dity
43
NTU
)
MgO CaO CPE
Figure (3) Effect of coagulant type on turbidity removal efficiency of wastewater in different doses (initial turbidity 43 NTU).
-0.1 0.0 0.1 0.2 0.3 0.4 0.5 0.6 0.7
Coagulant Dose,g/l,(MgOand CaO)
0.0000 0.0004 0.0008 0.0012 0.0016 0.0020
Polyelectrolyte Dose,g/l
0.0
20.0
40.0
60.0
80.0
100.0
TSS
Rem
oval
%
MgO CaO CPE
Figure (4) Effect of coagulant type on total suspended solids removal efficiency in different doses (TSS=150 mmg/l).
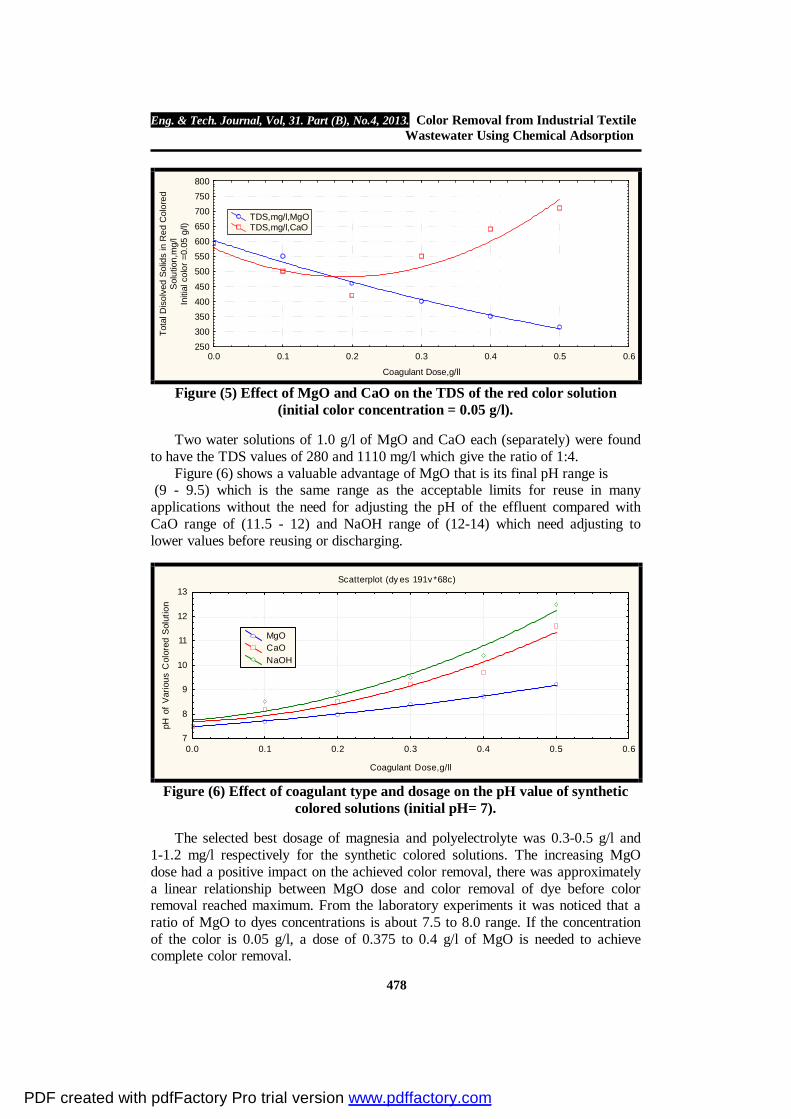
The TDS of solutions, treated by MgO, decreased to reach the TDS of the tap water (270-340 mg/l), but for the other solutions treated with CaO and NaOHthe TDS decreased little and then increased to the limits of (800-1500 mg/l) as shown in Figure (5). It is apparent that MgO particle was working as an adsorbent and by increasing the adsorbent dose the percentage of dyes removal increased because the number of available adsorption sites increased with increasing the adsorbent dose and it therefore results in an increase in the percentage of dyes adsorbed (Yuan et al., 2006).
PDF created with pdfFactory Pro trial version www.pdffactory.com
Eng. & Tech. Journal, Vol, 31. Part (B), No.4, 2013. Color Removal from Industrial Textile Wastewater Using Chemical Adsorption
478
0.0 0.1 0.2 0.3 0.4 0.5 0.6
Coagulant Dose,g/ll
250
300
350
400
450
500
550
600
650
700
750
800
Tota
l Dis
olve
d So
lids
in R
ed C
olor
edS
olut
ion,
mg/
lIn
itial
col
or =
0.05
g/l)
TDS,mg/l,MgO TDS,mg/l,CaO
Figure (5) Effect of MgO and CaO on the TDS of the red color solution (initial color concentration = 0.05 g/l).
Two water solutions of 1.0 g/l of MgO and CaO each (separately) were found to have the TDS values of 280 and 1110 mg/l which give the ratio of 1:4.
Figure (6) shows a valuable advantage of MgO that is its final pH range is (9 - 9.5) which is the same range as the acceptable limits for reuse in many applications without the need for adjusting the pH of the effluent compared with CaO range of (11.5 - 12) and NaOH range of (12-14) which need adjusting to lower values before reusing or discharging.
Scatterplot (dy es 191v *68c)
0.0 0.1 0.2 0.3 0.4 0.5 0.6
Coagulant Dose,g/ll
7
8
9
10
11
12
13
pH o
f V
ario
us C
olor
ed S
olut
ion
MgO CaO NaOH
Figure (6) Effect of coagulant type and dosage on the pH value of synthetic colored solutions (initial pH= 7).
The selected best dosage of magnesia and polyelectrolyte was 0.3-0.5 g/l and 1-1.2 mg/l respectively for the synthetic colored solutions. The increasing MgO dose had a positive impact on the achieved color removal, there was approximately a linear relationship between MgO dose and color removal of dye before color removal reached maximum. From the laboratory experiments it was noticed that a ratio of MgO to dyes concentrations is about 7.5 to 8.0 range. If the concentration of the color is 0.05 g/l, a dose of 0.375 to 0.4 g/l of MgO is needed to achieve complete color removal.
PDF created with pdfFactory Pro trial version www.pdffactory.com
Eng. & Tech. Journal, Vol, 31. Part (B), No.4, 2013. Color Removal from Industrial Textile Wastewater Using Chemical Adsorption
479
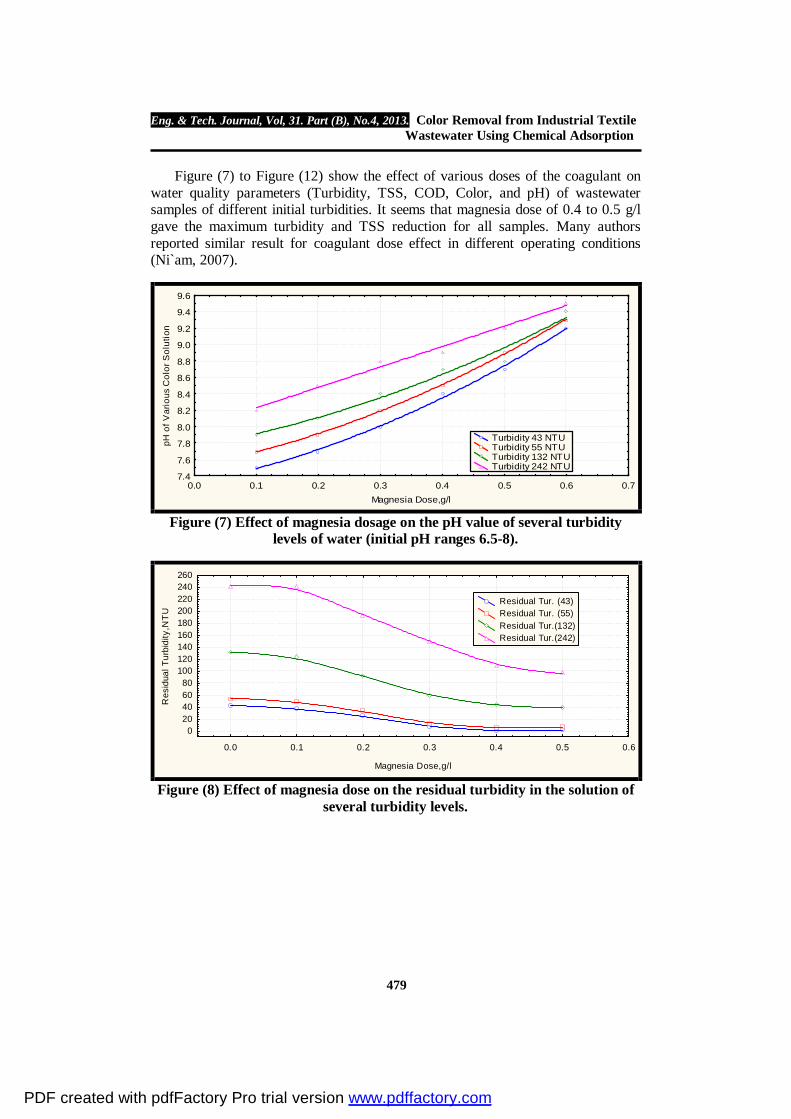
Figure (7) to Figure (12) show the effect of various doses of the coagulant on water quality parameters (Turbidity, TSS, COD, Color, and pH) of wastewater samples of different initial turbidities. It seems that magnesia dose of 0.4 to 0.5 g/l gave the maximum turbidity and TSS reduction for all samples. Many authors reported similar result for coagulant dose effect in different operating conditions (Ni`am, 2007).
0.0 0.1 0.2 0.3 0.4 0.5 0.6 0.7Magnesia Dose,g/l
7.4
7.6
7.8
8.0
8.2
8.4
8.6
8.8
9.0
9.2
9.4
9.6
pH o
f Var
ious
Col
or S
olut
ion
Turbidity 43 NTU Turbidity 55 NTU Turbidity 132 NTU Turbidity 242 NTU
Figure (7) Effect of magnesia dosage on the pH value of several turbidity levels of water (initial pH ranges 6.5-8).
0.0 0.1 0.2 0.3 0.4 0.5 0.6
Magnesia Dose,g/l
020406080
100120140160180200220240260
Res
idua
l Tur
bidi
ty,N
TU
Residual Tur. (43) Residual Tur. (55) Residual Tur.(132) Residual Tur.(242)
Figure (8) Effect of magnesia dose on the residual turbidity in the solution of several turbidity levels.
PDF created with pdfFactory Pro trial version www.pdffactory.com
Eng. & Tech. Journal, Vol, 31. Part (B), No.4, 2013. Color Removal from Industrial Textile Wastewater Using Chemical Adsorption
480
0.0 0.1 0.2 0.3 0.4 0.5 0.6
Magnesia Dose,g/l
0
20
40
60
80
100
Turb
idity
Rem
oval
%
Turbidity 43 NTU Turbidity 55 NTU Turbidity 132 NTU Turbidity 242 NTU
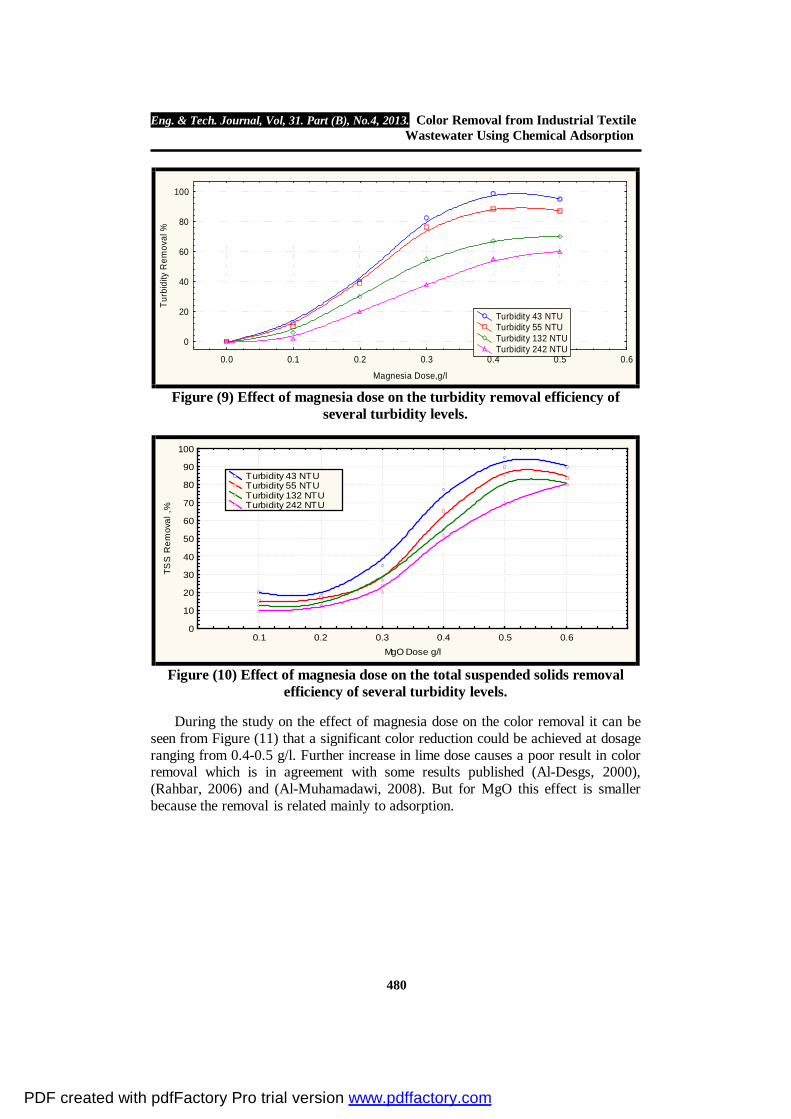
Figure (9) Effect of magnesia dose on the turbidity removal efficiency of several turbidity levels.
0.1 0.2 0.3 0.4 0.5 0.6MgO Dose g/l
0
10
20
30
40
50
60
70
80
90
100
TSS
Rem
oval
,%
Turbidity 43 NTU Turbidity 55 NTU Turbidity 132 NTU Turbidity 242 NTU
Figure (10) Effect of magnesia dose on the total suspended solids removal efficiency of several turbidity levels.
During the study on the effect of magnesia dose on the color removal it can be seen from Figure (11) that a significant color reduction could be achieved at dosage ranging from 0.4-0.5 g/l. Further increase in lime dose causes a poor result in color removal which is in agreement with some results published (Al-Desgs, 2000), (Rahbar, 2006) and (Al-Muhamadawi, 2008). But for MgO this effect is smaller because the removal is related mainly to adsorption.
PDF created with pdfFactory Pro trial version www.pdffactory.com
Eng. & Tech. Journal, Vol, 31. Part (B), No.4, 2013. Color Removal from Industrial Textile Wastewater Using Chemical Adsorption
481
0.0 0.1 0.2 0.3 0.4 0.5
Coagulant Dose,g/l
020406080
100120140160180200220240
Res
idua
l Col
or in
Sol
utio
n , P
tCol
MgO+ 1.0 mg/l CPE CaO only MgO only
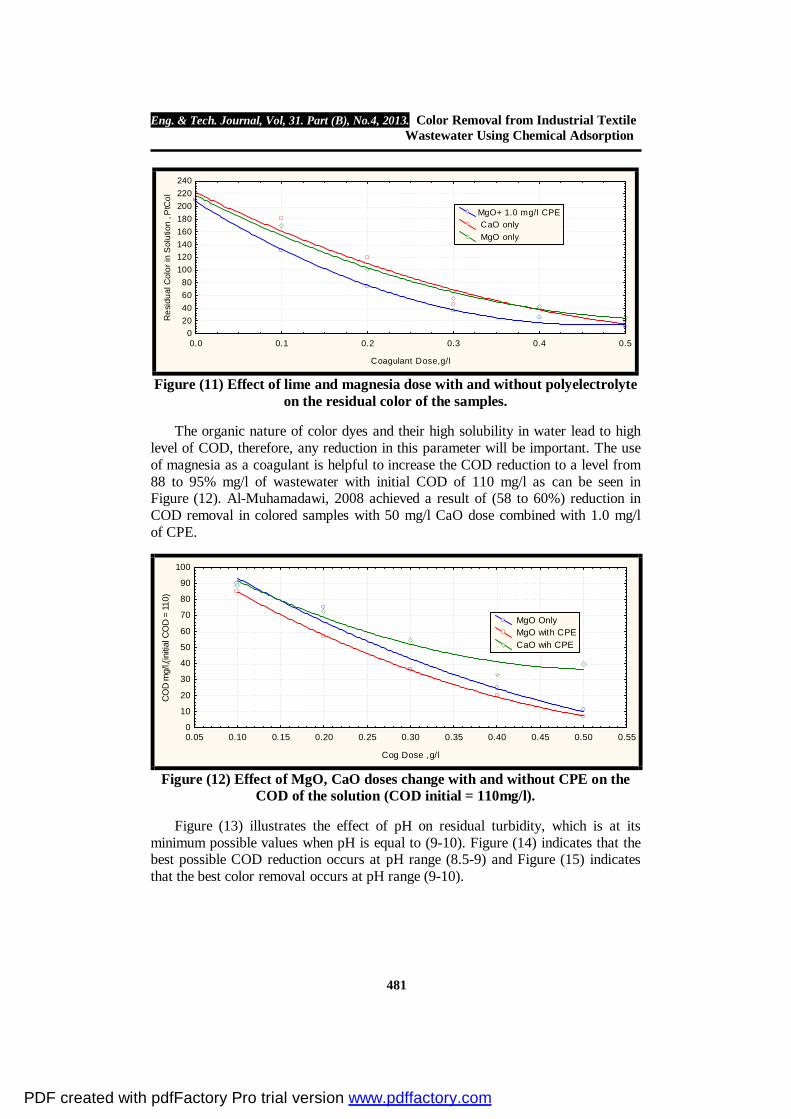
Figure (11) Effect of lime and magnesia dose with and without polyelectrolyte on the residual color of the samples.
The organic nature of color dyes and their high solubility in water lead to high level of COD, therefore, any reduction in this parameter will be important. The use of magnesia as a coagulant is helpful to increase the COD reduction to a level from 88 to 95% mg/l of wastewater with initial COD of 110 mg/l as can be seen in Figure (12). Al-Muhamadawi, 2008 achieved a result of (58 to 60%) reduction in COD removal in colored samples with 50 mg/l CaO dose combined with 1.0 mg/l of CPE.
0.05 0.10 0.15 0.20 0.25 0.30 0.35 0.40 0.45 0.50 0.55
Cog Dose ,g/l
0
10
20
30
40
50
60
70
80
90
100
CO
D m
g/l,(
initi
al C
OD
= 11
0)
MgO Only MgO with CPE CaO wih CPE
Figure (12) Effect of MgO, CaO doses change with and without CPE on the COD of the solution (COD initial = 110mg/l).
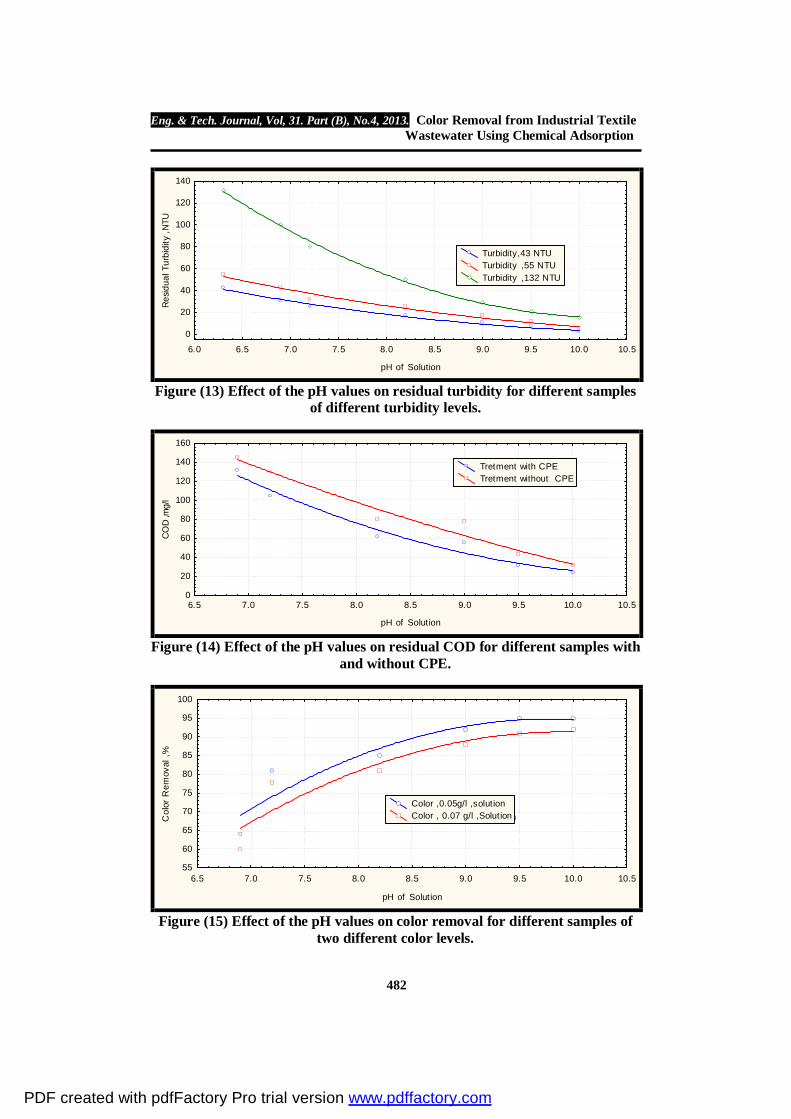
Figure (13) illustrates the effect of pH on residual turbidity, which is at its minimum possible values when pH is equal to (9-10). Figure (14) indicates that the best possible COD reduction occurs at pH range (8.5-9) and Figure (15) indicates that the best color removal occurs at pH range (9-10).
PDF created with pdfFactory Pro trial version www.pdffactory.com
Eng. & Tech. Journal, Vol, 31. Part (B), No.4, 2013. Color Removal from Industrial Textile Wastewater Using Chemical Adsorption
482
6.0 6.5 7.0 7.5 8.0 8.5 9.0 9.5 10.0 10.5
pH of Solution
0
20
40
60
80
100
120
140
Res
idua
l Tur
bidi
ty ,
NTU
Turbidity,43 NTU Turbidity ,55 NTU Turbidity ,132 NTU
Figure (13) Effect of the pH values on residual turbidity for different samples of different turbidity levels.
6.5 7.0 7.5 8.0 8.5 9.0 9.5 10.0 10.5
pH of Solution
0
20
40
60
80
100
120
140
160
CO
D ,m
g/l
Tretment with CPE Tretment without CPE
Figure (14) Effect of the pH values on residual COD for different samples with and without CPE.
6.5 7.0 7.5 8.0 8.5 9.0 9.5 10.0 10.5
pH of Solution
55
60
65
70
75
80
85
90
95
100
Col
or R
emov
al ,%
Color ,0.05g/l ,solution Color , 0.07 g/l ,Solution
Color ,0.05g/l ,solution Color , 0.07 g/l ,Solution
Figure (15) Effect of the pH values on color removal for different samples of two different color levels.
PDF created with pdfFactory Pro trial version www.pdffactory.com
Eng. & Tech. Journal, Vol, 31. Part (B), No.4, 2013. Color Removal from Industrial Textile Wastewater Using Chemical Adsorption
483
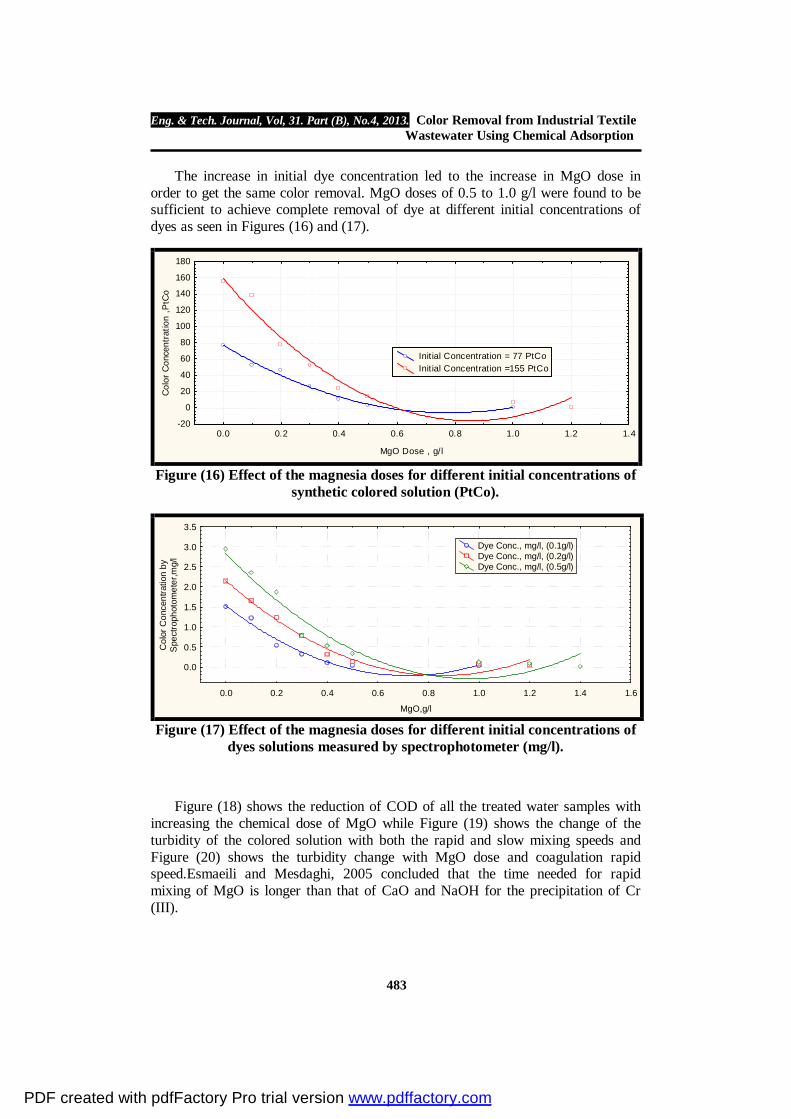
The increase in initial dye concentration led to the increase in MgO dose in order to get the same color removal. MgO doses of 0.5 to 1.0 g/l were found to be sufficient to achieve complete removal of dye at different initial concentrations of dyes as seen in Figures (16) and (17).
0.0 0.2 0.4 0.6 0.8 1.0 1.2 1.4
MgO Dose , g/l
-20
0
20
40
60
80
100
120
140
160
180
Col
or C
once
ntra
tion
,PtC
o
Init ial Concentration = 77 PtCo Initial Concentration =155 PtCo
Figure (16) Effect of the magnesia doses for different initial concentrations of synthetic colored solution (PtCo).
0.0 0.2 0.4 0.6 0.8 1.0 1.2 1.4 1.6
MgO,g/l
0.0
0.5
1.0
1.5
2.0
2.5
3.0
3.5
Col
or C
once
ntra
tion
byS
pect
roph
otom
eter
,mg/
l
Dye Conc., mg/l, (0.1g/l) Dye Conc., mg/l, (0.2g/l) Dye Conc., mg/l, (0.5g/l)
Figure (17) Effect of the magnesia doses for different initial concentrations of dyes solutions measured by spectrophotometer (mg/l).
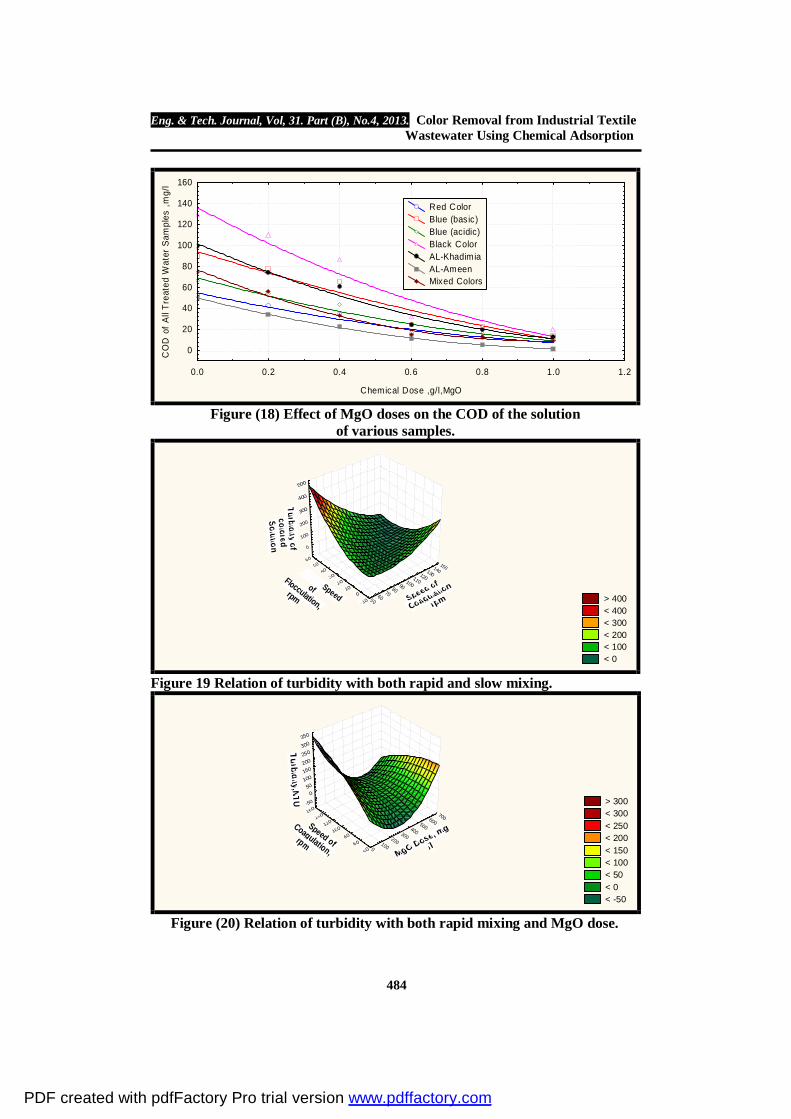
Figure (18) shows the reduction of COD of all the treated water samples with increasing the chemical dose of MgO while Figure (19) shows the change of the turbidity of the colored solution with both the rapid and slow mixing speeds and Figure (20) shows the turbidity change with MgO dose and coagulation rapid speed.Esmaeili and Mesdaghi, 2005 concluded that the time needed for rapid mixing of MgO is longer than that of CaO and NaOH for the precipitation of Cr (III).
PDF created with pdfFactory Pro trial version www.pdffactory.com
Eng. & Tech. Journal, Vol, 31. Part (B), No.4, 2013. Color Removal from Industrial Textile Wastewater Using Chemical Adsorption
484
0.0 0.2 0.4 0.6 0.8 1.0 1.2
Chemical Dose ,g/l,MgO
0
20
40
60
80
100
120
140
160
CO
D o
f All
Trea
ted
Wat
er S
ampl
es ,m
g/l
Red Color Blue (basic) Blue (acidic) Black Color AL-Khadimia AL-Ameen Mixed Colors
Figure (18) Effect of MgO doses on the COD of the solution of various samples.
> 400 < 400 < 300 < 200 < 100 < 0
5060
7080
90100
110120
130140
150
Speed of
Coagulation
rpm-100
1020
3040
5060
Speedof
Flocculation,rpm
0
100
200
300
400
500
Tur bidi ty ofcol or edSol ut ion
Figure 19 Relation of turbidity with both rapid and slow mixing.
> 300 < 300 < 250 < 200 < 150 < 100 < 50 < 0 < -50
0100
200300
400500
600700
MgO Dose, mg
/l4060
80100
120140
160
Speed of
Coagulation,rpm
-50
050
100150200250300350
Tu rbi dit y,NTU
Figure (20) Relation of turbidity with both rapid mixing and MgO dose.
PDF created with pdfFactory Pro trial version www.pdffactory.com
Eng. & Tech. Journal, Vol, 31. Part (B), No.4, 2013. Color Removal from Industrial Textile Wastewater Using Chemical Adsorption
485
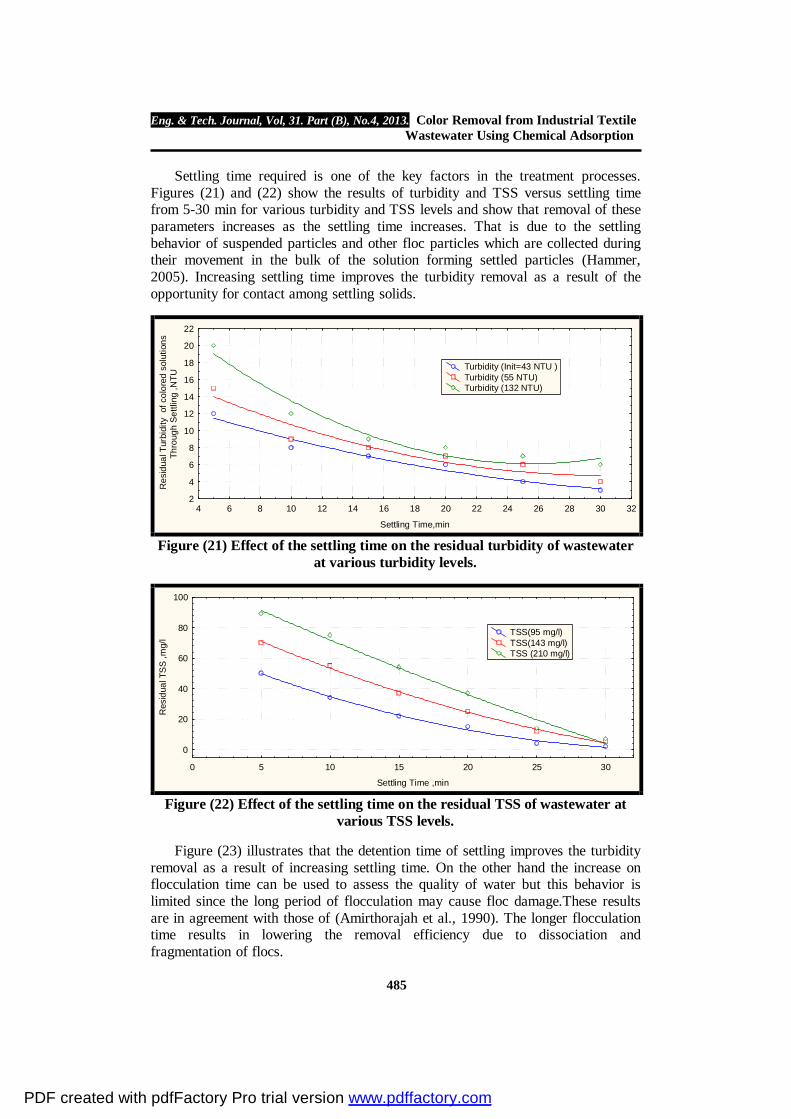
Settling time required is one of the key factors in the treatment processes. Figures (21) and (22) show the results of turbidity and TSS versus settling time from 5-30 min for various turbidity and TSS levels and show that removal of these parameters increases as the settling time increases. That is due to the settling behavior of suspended particles and other floc particles which are collected during their movement in the bulk of the solution forming settled particles (Hammer, 2005). Increasing settling time improves the turbidity removal as a result of the opportunity for contact among settling solids.
4 6 8 10 12 14 16 18 20 22 24 26 28 30 32
Settling Time,min
2
4
6
8
10
12
14
16
18
20
22
Res
idua
l Tur
bidi
ty o
f col
ored
sol
utio
nsTh
roug
h S
ettli
ng ,N
TU
Turbidity (Init=43 NTU ) Turbidity (55 NTU) Turbidity (132 NTU)
Figure (21) Effect of the settling time on the residual turbidity of wastewater at various turbidity levels.
0 5 10 15 20 25 30
Settling Time ,min
0
20
40
60
80
100
Res
idua
l TS
S ,m
g/l
TSS(95 mg/l) TSS(143 mg/l) TSS (210 mg/l)
Figure (22) Effect of the settling time on the residual TSS of wastewater at various TSS levels.
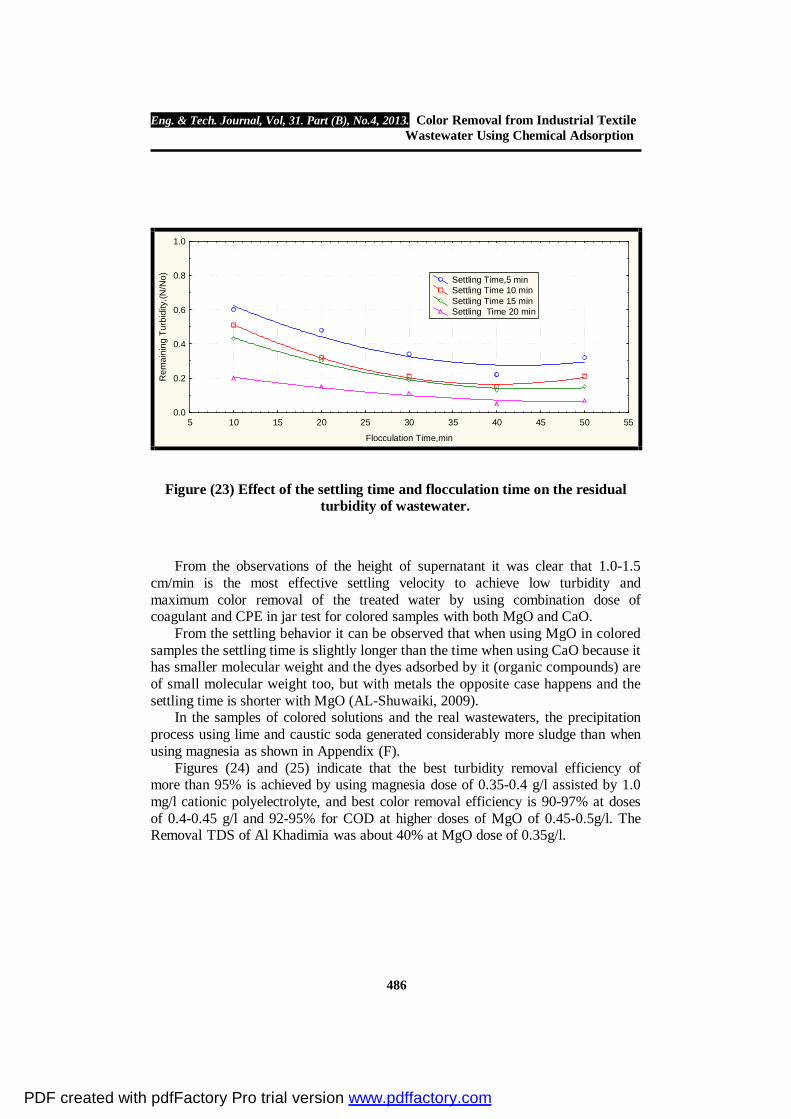
Figure (23) illustrates that the detention time of settling improves the turbidity removal as a result of increasing settling time. On the other hand the increase on flocculation time can be used to assess the quality of water but this behavior is limited since the long period of flocculation may cause floc damage.These results are in agreement with those of (Amirthorajah et al., 1990). The longer flocculation time results in lowering the removal efficiency due to dissociation and fragmentation of flocs.
PDF created with pdfFactory Pro trial version www.pdffactory.com
Eng. & Tech. Journal, Vol, 31. Part (B), No.4, 2013. Color Removal from Industrial Textile Wastewater Using Chemical Adsorption
486
5 10 15 20 25 30 35 40 45 50 55
Flocculation Time,min
0.0
0.2
0.4
0.6
0.8
1.0
Rem
aini
ng T
urbi
dity
,(N/N
o) Settling Time,5 min Settling Time 10 min Settling Time 15 min Settling Time 20 min
Figure (23) Effect of the settling time and flocculation time on the residual turbidity of wastewater.
From the observations of the height of supernatant it was clear that 1.0-1.5 cm/min is the most effective settling velocity to achieve low turbidity and maximum color removal of the treated water by using combination dose of coagulant and CPE in jar test for colored samples with both MgO and CaO.
From the settling behavior it can be observed that when using MgO in colored samples the settling time is slightly longer than the time when using CaO because it has smaller molecular weight and the dyes adsorbed by it (organic compounds) are of small molecular weight too, but with metals the opposite case happens and the settling time is shorter with MgO (AL-Shuwaiki, 2009).
In the samples of colored solutions and the real wastewaters, the precipitation process using lime and caustic soda generated considerably more sludge than when using magnesia as shown in Appendix (F).
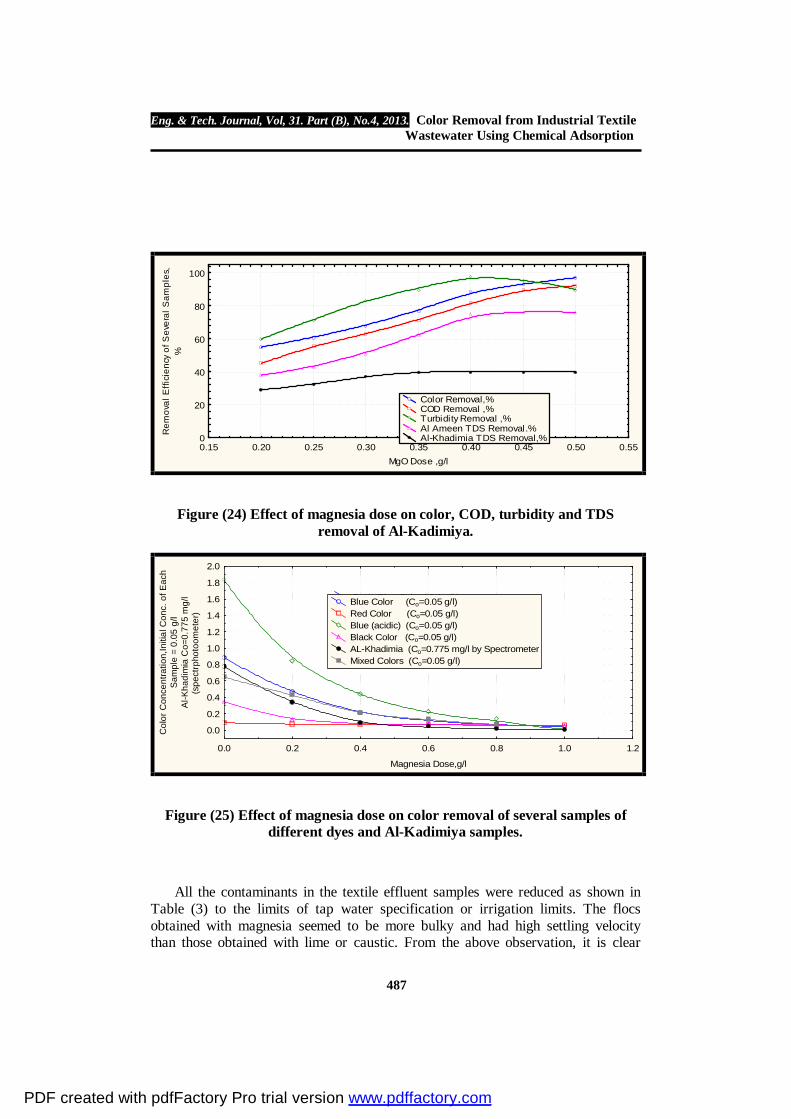
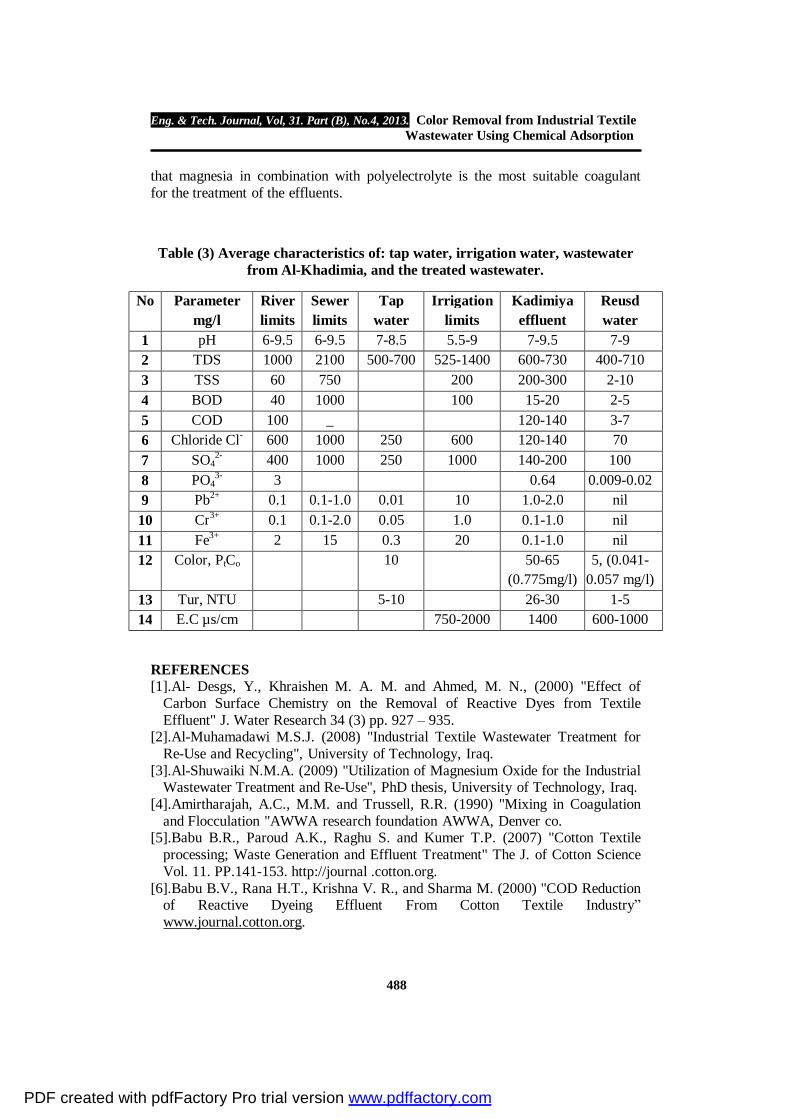
Figures (24) and (25) indicate that the best turbidity removal efficiency of more than 95% is achieved by using magnesia dose of 0.35-0.4 g/l assisted by 1.0 mg/l cationic polyelectrolyte, and best color removal efficiency is 90-97% at doses of 0.4-0.45 g/l and 92-95% for COD at higher doses of MgO of 0.45-0.5g/l. The Removal TDS of Al Khadimia was about 40% at MgO dose of 0.35g/l.
PDF created with pdfFactory Pro trial version www.pdffactory.com
Eng. & Tech. Journal, Vol, 31. Part (B), No.4, 2013. Color Removal from Industrial Textile Wastewater Using Chemical Adsorption
487
0.15 0.20 0.25 0.30 0.35 0.40 0.45 0.50 0.55MgO Dose ,g/l
0
20
40
60
80
100
Rem
oval
Effi
cien
cy o
f Sev
eral
Sam
ples
,%
Color Removal,% COD Removal ,% Turbidity Removal ,% Al Ameen TDS Removal.% Al-Khadimia TDS Removal,%
Figure (24) Effect of magnesia dose on color, COD, turbidity and TDS removal of Al-Kadimiya.
0.0 0.2 0.4 0.6 0.8 1.0 1.2
Magnesia Dose,g/l
0.0
0.2
0.4
0.6
0.8
1.0
1.2
1.4
1.6
1.8
2.0
Col
or C
once
ntra
tion,
Initi
al C
onc.
of E
ach
Sam
ple
= 0.
05 g
/lA
l-Kha
dim
ia C
o=0.
775
mg/
l(s
pect
rpho
toom
eter
)
Basic Blue Color ( 0.1 g/l ) Red Color (0.1 g/l ) Blue (acidic) (0.1 g/l ) Black Color ( 0.1 g/l ) AL-Khadimia ( 0.1 g/l ) Mixed Colors (0.1 g/l )
Blue Color (Co=0.05 g/l) Red Color (Co=0.05 g/l) Blue (acidic) (Co=0.05 g/l) Black Color (Co=0.05 g/l) AL-Khadimia (Co=0.775 mg/l by Spectrometer Mixed Colors (Co=0.05 g/l)
Figure (25) Effect of magnesia dose on color removal of several samples of different dyes and Al-Kadimiya samples.
All the contaminants in the textile effluent samples were reduced as shown in Table (3) to the limits of tap water specification or irrigation limits. The flocs obtained with magnesia seemed to be more bulky and had high settling velocity than those obtained with lime or caustic. From the above observation, it is clear
PDF created with pdfFactory Pro trial version www.pdffactory.com
Eng. & Tech. Journal, Vol, 31. Part (B), No.4, 2013. Color Removal from Industrial Textile Wastewater Using Chemical Adsorption
488
that magnesia in combination with polyelectrolyte is the most suitable coagulant for the treatment of the effluents.
Table (3) Average characteristics of: tap water, irrigation water, wastewater from Al-Khadimia, and the treated wastewater.
Reusd water
Kadimiya effluent
Irrigation limits
Tap water
Sewer limits
River limits
Parameter mg/l
No
7-9 7-9.5 5.5-9 7-8.5 6-9.5 6-9.5 pH 1 400-710 600-730 525-1400 500-700 2100 1000 TDS 2
2-10 200-300 200 750 60 TSS 3 2-5 15-20 100 1000 40 BOD 4 3-7 120-140 _ 100 COD 5 70 120-140 600 250 1000 600 Chloride Cl- 6
100 140-200 1000 250 1000 400 SO42- 7
0.009-0.02 0.64 3 PO43- 8
nil 1.0-2.0 10 0.01 0.1-1.0 0.1 Pb2+ 9 nil 0.1-1.0 1.0 0.05 0.1-2.0 0.1 Cr3+ 10 nil 0.1-1.0 20 0.3 15 2 Fe3+ 11
5, (0.041- 0.057 mg/l)
50-65 (0.775mg/l)
10 Color, PtCo 12
1-5 26-30 5-10 Tur, NTU 13 600-1000 1400 750-2000 E.C µs/cm 14
REFERENCES [1].Al- Desgs, Y., Khraishen M. A. M. and Ahmed, M. N., (2000) "Effect of
Carbon Surface Chemistry on the Removal of Reactive Dyes from Textile Effluent" J. Water Research 34 (3) pp. 927 – 935.
[2].Al-Muhamadawi M.S.J. (2008) "Industrial Textile Wastewater Treatment for Re-Use and Recycling", University of Technology, Iraq.
[3].Al-Shuwaiki N.M.A. (2009) "Utilization of Magnesium Oxide for the Industrial Wastewater Treatment and Re-Use", PhD thesis, University of Technology, Iraq.
[4].Amirtharajah, A.C., M.M. and Trussell, R.R. (1990) "Mixing in Coagulation and Flocculation "AWWA research foundation AWWA, Denver co.
[5].Babu B.R., Paroud A.K., Raghu S. and Kumer T.P. (2007) "Cotton Textile processing; Waste Generation and Effluent Treatment" The J. of Cotton Science Vol. 11. PP.141-153. http://journal .cotton.org.
[6].Babu B.V., Rana H.T., Krishna V. R., and Sharma M. (2000) "COD Reduction of Reactive Dyeing Effluent From Cotton Textile Industry” www.journal.cotton.org.
PDF created with pdfFactory Pro trial version www.pdffactory.com
Eng. & Tech. Journal, Vol, 31. Part (B), No.4, 2013. Color Removal from Industrial Textile Wastewater Using Chemical Adsorption
489
[7].Esmaeili A. Mesdaghi A., Vazirinjad R. (2005) "Chromium (III) Removal an
Recovery from Tannery Wastewater by Precipitation Process", American Journal of Applied Science 2(10): pp.1471-1473.
[8].Hammer M. J. (2005) "Water and Wastewater Technology " Pearson, Prentice Hall. 5th edition.
[9].Niam M.F., Othman F. and Fauzia Z. (2007)" Removal of COD and Turbidity to improve wastewater Quality Using electro coagulation Technique: The Malaysian J. Of analytical science, vol: 11, No: 1.pp. 198-205.
[10].Pollution Prevention and Abatement Handbook, WORLD BANK GROUP, July 1998.
[11].Rahbar, M.S., Alipour, E. and Sedighi, R.E. (2006) "Color Removal from Industrial Wastewater with a Novel Coagulant Flocculation" Int. J. Environ. Sci. Tech. vol.3, No.1, pp. 79-88 E-mail: [email protected].
[12].Sabroota D. (2000) "Textile Effluent Treatment- a Solution of the Environment Pollution" e-mail: [email protected].
[13].Sheikh, H.R., (1999), "Pollution Related Dangers in the Textile Industry" Pakistan Textile Journal, 29-32, July 1999.
[14].Yuan Yu-Li Wen, Yue-Zhong (2006) "Treatment of Wastewater from Dye Manufacturing Industry by Coagulation" J. of Zhejiang University Science an E-mail [email protected].
PDF created with pdfFactory Pro trial version www.pdffactory.com


![Zen Tech Eng Offshore Presentation[May3]REV01](https://img.pdfslide.net/doc/110x75/55358c854a795967228b4632/zen-tech-eng-offshore-presentationmay3rev01.jpg)