Embed Size (px)
Citation preview

2004 Annual Report
ENGINEERED FORPERFORMANCE
EnPro Industries, Inc.5605 Carnegie Boulevard, Suite 500Charlotte, North Carolina 28209-4674www.enproindustries.com
. . . . . . . . . . . . . . . . . . . . . . . . . ..............................
EN
PR
O IN
DU
ST
RIE
S, IN
C. 2004 A
NN
UA
L R
EP
OR
T

SHAREHOLDER INFORMATION
............................................................................................................ .....
COMPANY HEADQUARTERSEnPro Industries, Inc.5605 Carnegie Boulevard, Suite 500Charlotte, North Carolina 28209-4674Telephone: 704-731-1500For additional information, please visit our website, www.enproindustries.com.
STOCK EXCHANGE LISTINGEnPro Industries common stock is listed on the New York Stock Exchange.Symbol: NPO
ANNUAL MEETINGThe Annual Meeting of Shareholders of EnPro Industries, Inc. will be held at the Hyatt Charlotte at SouthPark, 5501 Carnegie Boulevard, Charlotte, North Carolina, on Tuesday, May 10, 2005, at 11:00 a.m.
AUDITORSPricewaterhouseCoopers LLP 214 North Tryon Street Suite 3700 Charlotte, North Carolina 28202
SHAREHOLDER SERVICESQuestions about shareholder accounts, including lost certificates and other related items, should be addressed to our transfer agent and registrar :
Wachovia Bank, N.A. Shareholder Services Group – NC1153 1525 West W. T. Harris Blvd., 3C3 Charlotte, NC 28288-1153 Toll Free: 800-829-8432 Local: 704-590-0394 Fax: 704-590-7618 E-mail: [email protected] Website: www.wachovia.com/equityservices
To access your shareholder account directly, please visit www.wachovia.com/firstlink.
INVESTOR AND MEDIA INQUIRIESAnalysts, investors, media and others seeking financial or general information about EnPro should contact:
Don WashingtonDirector, Investor Relations and Corporate CommunicationsEnPro Industries, Inc.5605 Carnegie Boulevard, Suite 500Charlotte, NC 28209Telephone: 704-731-1527E-mail: investor. [email protected]
Copies of our Annual Report, Form 10-K, Form 10-Q, proxy statement or quarterly earnings announcements can be obtained free of charge by visiting our website, www.enproindustries.com, or by calling 704-731-1522.
Des
igne
d an
d pr
oduc
ed b
y C
orpo
rate
Rep
orts
Inc.
/Atla
nta
w
ww
.cor
pora
tere
port
.com
������������ ���������������� �
�����������������������
. . . . . . . . . . . . . . . . . . . . . . . . . . . . . . . . . . . .
. . . . . . . . . . . . . . . . . . . . . . . . . . . . . . . . . . . .
. . . . . . . . . . . . . . . . . . . . . . . . . . . . . . . . . . . .
. . . . . . . . . . . . . . . . . . . . . . . . . . . . . . . . . . . .
. . . . . . . . . . . . . . . . . . . . . . . . . . . . . . . . . . . .
����� ������������
������
��������
����������
�������������
���� � � ��� � � � ��
�����
���� � � ��� � � � ��
����
���
���
���
���
��������
����
���
���
���
������������� �������������
�
�
�
�
�
����
��
��
��
��
���
���
���
���
���
���
��
��
��
��
��
���
�
�
�
�
�
�
�����
������� Shares of EnPro Industries, Inc. (NYSE: NPO) began regular trading on June 3, 2002. The chart above shows the relative performance of EnPro shares to the Russell 2000® Index of
small cap companies, which includes EnPro, from June 3, 2002 to December 31, 2004.
OURPERFORMANCE

ur companies manufacture components that are engineered for
performance in critical applications – applications unseen by
the consumer but that make everyday life better, from turning
on the lights to turning a corner to saving lives. Our business
strategies are also engineered for performance. We are invest-
ing in our businesses, improving efficiencies, developing new
products and expanding our markets, all with the goal of building
a company as valuable to our investors as our products are to
our customers.
EnPro Industries, Inc. was spun out from Goodrich Corporation on May 31, 2002. Although we are a young company, some of our businesses have been market leaders for over 100 years. Our brand names are well known and widely respected – names like Garlock, Stemco, GGB, Quincy Compressor and Fairbanks Morse Engine are synonymous with superior products. EnPro companies employ 4,200 people, operate 29 primary manufacturing facilities in nine countries and serve over 50,000 customers around the world.
page 1 2004 Annual Report /

ENGINEERED FORPERFORMANCE
An Investment In SlovakiaAs GGB’s European customers look east, GGB will be there to meet them. In November 2004, GGB opened a brand new 109,000-square-foot Eastern European manufacturing facility in Sucany, Slovakia. From this new state-of-the-art facility, GGB will serve customers both in traditional European locations and in new loca-tions established to compete in the expanding economies of the region.
/ 2004 Annual Report: pages 2 / 3

Our Bearings Make It Possible To Drop The Top And Put The Wind In Your Hair
ENGINEERED PRODUCTS: GGBThey also make it possible to move the seat, turn the corner or wipe away the rain on a
windshield. In fact, there are dozens of automotive uses for GGB bearings, from steering to
suspension, and thousands of other uses in just about anything that moves, from prosthetic limbs
to hydroelectric power plants. What makes these bearings so special? A frictionless polymer
coating, applied to a metal backing that allows effortless movement without lubrication –
engineered for performance in any application.

It Takes A Certain Kind Of Energy To Save Lives
ENGINEERED PRODUCTS: QUINCY COMPRESSORAir is the world’s third largest source of energy, and in hospital emergency
rooms, clean reliable air is critical to saving patients’ lives. Quincy Compressor
helps make emergency procedures possible with its line of air compressors
designed specifically for medical applications. But Quincy’s capabilities don’t stop
with hospitals. Quincy Compressors are found everywhere from auto repair
shops to large industrial manufacturing facilities because they are engineered to
perform quietly, efficiently and dependably. With a new plant opening in China
in 2004, the Quincy name is spreading to new parts of the world.
ENGINEERED PRODUCTS:
FRANCE COMPRESSOR
Products That Keep Up The PressureNatural gas moves through a pipeline under pressure. The compressors that supply the pressure rely on valves, seals and other components engi-neered by France Compressor Products to improve their customers’ peformance, so the gas can move reliably to the consumer.
/ 2004 Annual Report: pages 4 / 5

When The Fleet Sails, One Company Keeps The Engines At Full Speed Ahead
ENGINE PRODUCTS AND SERVICES: FAIRBANKS MORSE ENGINEWhether the U.S. Navy needs diesel engines for new ships or service for
engines already in the fleet, it relies on Fairbanks Morse Engine. Fairbanks
Morse has been manufacturing and servicing engines for over 110 years, and
for most of those years, those engines have been found in U.S. Navy ships.
Whether they are engineered to be a reliable source of electricity or provide
dependable power for propulsion, Fairbanks Morse engines are the Navy’s
engines of choice, and Fairbanks Morse technicians are the choice to keep
them running smoothly and reliably, so the fleet can keep sailing.
ENGINEERED FORPERFORMANCENew Ships, New Engines U.S. Navy programs call for increasing the number of ships that are capable of responding to the kinds of situations the Navy will face in the future. Since 2001, the number of Navy shipbuild-ing programs involving Fairbanks Morse has grown from one to five, and the programs extend into the middle of the next decade. Ships, such as the Navy’s new Littoral Combat Ship, will depend on these engines to move sailors safely and dependably wherever they are needed.

These Seals Help You Start The Day With Hot Coffee
SEALING PRODUCTS: GARLOCK SEALING TECHNOLOGIESHighly sophisticated Garlock seals protect critical components and processes that help power plants
generate the electricity to heat the coffee or light a room – and that’s not all. Garlock seals are engineered
to make possible many other products as well – from the water to make the coffee, to the paper
and ink to print the news, to the steel to make the spoon, to the plastics to make the computer.
Somewhere in the production of these materials, a seal protected a process, so our customers could produce
high quality products. Chances are, the seal was engineered for performance by Garlock because Garlock
provides more industrial sealing solutions than any other company in the world.
/ 2004 Annual Report: pages 6 / 7
ENGINEERED FORPERFORMANCEWhen Performance Counts Where fluids move – in chemical plants, refineries and other process industries – the gasket that is most likely to protect the flow is a Garlock gasket. Why? Because for over 100 years, Garlock has set the standard for fluid sealing products. The name means quality, reliability and safety in industries where failure is unacceptable. When performance counts, there is no other gasket like a Garlock.


ENGINEERED FORPERFORMANCEA New Product DevelopmentTires and fuel are a trucking fleet’s biggest expenses. Stemco helps fleets keep those expenses in check with a new product line that uses radio frequencies and advanced sensors to collect and transmit critical data to a central system. Using BAT RF products, operators have easy access to data on mileage and tire pres-sure. Because properly inflated tires last longer, improve fuel efficiency and are less likely to fail, Stemco customers operate more efficiently, and the highway is a safer place for all of us.
This Digital Device Helps A Truck Go The Extra Mile
SEALING PRODUCTS: STEMCOThe trucks that deliver the goods that make life more comfortable
cover millions and millions of miles every year. What keeps the wheels
turning? Seals, hub caps, bearings and other wheel-end products pro-
vided by Stemco – the leading supplier of these products in the United
States. In 2004, Stemco products took a new turn, with a fleet infor-
mation system that allows truck operators an accessible and accurate
way to collect critical data on mileage and tire pressure, so tires last
longer, trucks use less fuel and the goods keep moving.
/ 2004 Annual Report: pages 8 / 9

Tapes That Seal High Wire Acts
SEALING PRODUCTS: PLASTOMER TECHNOLOGIESWhen an airliner’s rudder turns, tapes made by Plastomer Technologies
help that movement happen by providing a strong, frictionless coating
for the cable that controls the rudder – the cable moves, the rudder
turns and the airliner gets to its destination. Plastomer Technologies
makes tapes and fibers from polytetrafluoroethylene (PTFE) engineered
to perform in dozens of other applications – from threads sewn into
life rafts to dental floss to the production of pharmaceuticals and
semiconductors.
SEALING PRODUCTS:
GARLOCK RUBBER TECHNOLOGIES
Where The Rubber Meets The LoadMaterials industries like aggregate production depend on Garlock Rubber Technologies to engineer rugged, durable belting that can hold up to the load. Garlock Rubber also produces sheet rubber products used in bridge and road construction and in building construction to isolate vibration.

To My Fellow Shareholders:
Like the products EnPro companies manufacture, the strategies we use to manage our businesses
are engineered for performance. They are straightforward – improve our operational efficiency,
expand our markets, strengthen the mix of our businesses and manage the settlement of asbestos
claims against Garlock Sealing Technologies – and they are designed to lead to sustainable and
lasting value for our shareholders. Several important accomplishments helped us execute our
strategies and engineer our performance in 2004.
/ 2004 Annual Report: pages 10 / 11
Above: Ernie Schaub, President and Chief Executive Officer, with Len Lacey, Manufacturing and Shipping Manager, Stemco, at Stemco’s Longview, Texas, manufacturing plant and headquarters.

Improved Results in Improved MarketsOur markets strengthened considerably in 2004, and we were well-positioned to take advantage of them. Our sales improved by 13% compared to 2003, to $826 million, as each segment experienced growth. Segment profits grew to $92 million, a 5% increase over 2003, even after we incurred over $9 million in restructuring expenses related primarily to moving operations from old or high-cost facilities to new, more efficient facilities. The increase was also after the recognition of a $7.5 million loss on several open contracts at Fairbanks Morse Engine. Before the effect of restructuring expenses, segment profits improved by about 10% and segment profit margins exceeded 12%, marking continuous improvement in profits and margins since 2002, the year of our spin-off from Goodrich Corporation. Our restructuring in 2004 was an investment in our businesses that will move us toward better performance in the future. The loss at Fairbanks Morse, however, was a disappointment. Fluctuations in foreign exchange, which increased the cost of engine components procured in Europe, and operational issues were the root of the problem. We acted quickly to resolve the operational issues and we are developing dollar-based and in-house sources for components to reduce foreign exchange risks. These steps should put Fairbanks Morse in posi-tion to improve its performance in the future. Market conditions made a significant contri-bution to our results in 2004, but we also saw benefits from cost reductions. We’ve now com-pleted the training of 100% of our employees in Total Customer Value, our customer-focused, lean manufacturing program. We have cut the days sales are held in inventory to 44, a 35% reduction since 2002, and we mitigated raw material price increases in 2004 through aggressive supply chain management. We also improved both on-time delivery and response time to customers at almost all of our businesses.
Investments in Our FutureOur most significant achievement in 2004 came with the opening of three new facilities – quite an accomplishment for a company with our short history. Each of these facilities improves both an EnPro company’s access to important markets and its operating efficiencies. France Compressor Products shifted its U.S. headquarters to the Gulf Coast from the mid-Atlantic. Because France Compressor’s products are used in the gas gathering and gas transmis-sion industries, the new Houston location puts them in the heart of their primary U.S. market. GGB opened a new manufacturing facility in Slovakia, in a region where many of GGB’s European customers are also locating. GGB will relocate high-labor content manufacturing from other European locations to the facility. In time, other EnPro manufacturing operations may be located there, as well.
In China, Quincy Compressor opened a new assembly facility in Kunshan, near Shanghai, to serve China and other Asian markets. Kunshan will also house an engineering staff to support both regional markets and Quincy’s U.S. markets. In keeping with our market strategy, other EnPro companies will likely follow the lead of GGB and Quincy Compressor in 2005 to increase their international presences.
Asbestos Claims DeclineIn each of our three years as an independent public company, we have kept commitments for new settlements of asbestos claims against Garlock Sealing Technologies near the level of annual insurance recoveries. This has led to a sharp decline in the net cash outflow for asbestos settlements and related expenses compared to 2001, the peak year, when it exceeded $70 million. Although the net outflow increased to about $40 million in 2004 from about $36 million in 2003, the increase was the result of a delay until early 2005 in the collection of $22 million in insurance reimbursements that were due in 2004. These reimbursements were collected under one of two important settlements the company reached with certain of its insurers last year. The settlements involved collection of all disputed past due amounts and the commutation of policies remaining with those insurers. Together, the settle-ments brought the company over $50 million in cash and contributed $140 million in cash to establish trusts that will resolve future asbestos claims. The settlement brought asbestos insurance payments up to date, and through the trusts, ensures the coverage due from those insurers will be available and timely paid when due. New claims filed in 2004 declined more than 60% from 2003, and were the lowest number filed in over 10 years. Several factors may have influenced the decline, including state reforms and potential federal reform. We believe it also reflects a decline in the incidence of true asbestos-related diseases, consistent with demographic evidence. Although our asbestos settlement strategy has reduced the effect of asbestos claims on cash flows, it has increased the possibility of claims going to trial. Garlock’s record in court remains strong, but trial activity is increasing, with 17 trials in 2004, six of which resulted in verdicts against Garlock. Though damages awarded in three of the verdicts were small, in the other three, they were significant. Each of the three large verdicts is being appealed, and we are confident Garlock will prevail in the appeals.
Strong Cash Position Creates Opportunity We finished 2004 with $108 million in cash, an increase of $13 million from the end of 2003. This was despite an increase of $14 million in capital expenditures and the delayed collection of the $22 million insurance reimbursement until early 2005.
The sale of our low-margin tool and die businesses in mid-2004 and the sale of buildings made surplus by restructuring, brought us about $10 million in cash, but of equal importance, they helped us move toward our objective of a stronger mix of businesses and more efficient operations. The cash we received essentially offset all of our restructuring expenses in 2004. Our cash balance provides us with the resources to continue to invest in our businesses. In 2005, we will invest in improved equipment and facilities. We’ll also continue to invest in new product development as we seek to expand our technologies into markets that we don’t currently serve. We intend to begin a significant restructuring program at Garlock Sealing Technologies, a company that entered the 21st century with a principal manufacturing facility built for the first half of the 20th century. The alternatives are to modernize Garlock’s Palmyra, New York, facility or to develop a new greenfield site to replace it. We expect to choose one of these alternatives by mid-2005, and to begin the project in the second half of the year. The project is likely to extend over several years and cost many millions of dollars to complete. Finally, our solid cash balances and proven capacity to generate cash will allow us to pursue acquisitions in 2005 that offer us the potential for sustained growth and profitability. as we continue to execute our corporate strategies
Performance for the FutureWe have been an independent public company for nearly three years. In that time, we have established a culture that values discipline, excellence, accountability and achievement. We have set high ethical standards and established a strong framework of corporate governance. We are pleased to see what has been achieved – improved performance by our operations, high marks from independent agencies for our corporate governance practices, and growing returns for our shareholders. These achievements have been both exciting and rewarding. They would not have been possible without the efforts of very dedicated employees, deeply experienced management and a highly accomplished board of directors. Our achievements prepare us for a future in which more can be accomplished – more busi-nesses improved, more opportunities explored, more markets entered, all with the objective of establishing a stronger, more valuable company.
Sincerely,
Ernest F. SchaubPresident and Chief Executive Officer
March 2005

How We Engineer For Performance
Q
A
/ 2004 Annual Report: pages 12 / 13

Is there a common element that brings EnPro’s diverse companies together?
Ernie Schaub: Each of them is a good, sound company. They have excellent brand names and strong market shares. They are good cash generators and we believe they have the capacity to produce superior returns, compared to other companies in their industries. They also give us access to a diverse set of industrial markets – in 2004, we sold products in over 50 different industries, and no single industry accounted for more than 20% of sales. However, I should also remind you these are the businesses we inherited from Goodrich in the spin-off. Even before the spin-off, we took steps to strengthen them – current management had a hand in the acquisition of GGB’s European business, just before the spin. Since the spin-off, we’ve made small acquisitions, especially in the sealing products business, and we’ve divested businesses that we didn’t think made sense for us. Our current mix will change in time, but all of our businesses offer opportunities to support EnPro’s growth into a stronger and larger company.
What is your strategy for growth? Ernie Schaub: Growth can come from internal initiatives, like expansion into new markets and the introduction of new products, or it can come from external
initiatives, such as acquisitions. We intend to pursue both. However, growth isn’t related only to the top line – it’s a bottom line issue as well. We aren’t afraid to reduce the top line when we can improve our profitability. For instance, in 2004, we sold our tool and die businesses, which took away about $20 million of annual sales. The sales were at margins well below our target, and the businesses were not ones we felt we should grow in. We created value with those transactions because, even though we lowered our sales, we improved our profit margins. In addition, the cash from the transactions helped offset restructuring expenses that made other parts of EnPro more competitive.
How big a priority is an acquisition, and how would you fund one?
Bill Dries: Acquisitions will play an impor-tant role in our strategy to improve the mix of our businesses, and we plan to step up our efforts in this regard. Acquisition candidates could have one or more important qualities. They could be synergistic, or complementary, to our core product lines, primarily our sealing and bearing products, or they could provide access to new markets, new technology or new products. In any case, they should offer the potential for sustained growth and segment profit margins that equal or exceed our current levels. Our most likely sources of funding for an acquisition are our substantial cash balances
and the cash flows generated by our existing businesses. In addition, we believe that the company’s strong performance since the spin-off and its improving prospects would enable us to access the capital markets, if the right opportunity were to arise. We’ll be judicious and set the bar high as we evaluate potential candidates because we want to make sure any acquisition has every chance to succeed and to add value.
What are you doing to stimulate growth through new product development?
Unni Varier: We’re rapidly reinvigorating our new product development program to give it more focus, beginning with strengthening engineering and marketing efforts in our businesses. For the first time since our spin-off, all five of our large businesses – Garlock Sealing Technologies, Stemco, Fairbanks Morse Engine, Quincy Compressor and GGB – each have a vice president in charge of engineering and technology. We have also strengthened our marketing effort in each of these operations. Marketing is important because the marketing staff has the greatest contact with the largest number of customers, who ultimately decide which products succeed. In fact, we’ve instituted a “Voice of the Customer” program in several of our businesses, the goal of which is to both understand and anticipate our customers’ needs. Long term, our goal is to generate 20% of our sales each year from products introduced within the previous five years. Ideally, those
Left to right: (front) Ernie Schaub, Bill DriesLeft to right: (back) Unni Varier, Rick Magee, Dick Driscoll
QA

products will compete at the premium end of their markets. We’re short of our goal today, but we’re making progress. For instance, in early 2005, Stemco introduced a line of fleet information systems products that have tremendous potential in the commercial vehicle industry. Quincy Compressor has introduced a line of new, energy-efficient compressors that offer significant savings for Quincy customers. GGB has introduced new bearings products, including lead-free bearings, that are winning acceptance. Garlock is introducing new products for markets as diverse as food processing and other sanitary applications and high-performance race car engines.
How are you attracting and developing the next generation of management?
Dick Driscoll: As part of our annual organizational review process, we identify high-potential employees whom we believe represent the future of our businesses. A formal, university-based program develops the leadership skills of these and other employees. Over a period of 15 months, they meet regularly for classroom instruction and small group collaboration to address real problems faced by EnPro businesses. We kicked off the program in January 2004, and it’s already bringing benefits, including a comprehensive acquisition process, an improved structure for leadership development and ways to
leverage supply chain relationships across the company. We want to develop a strong contingent of internal candidates to fill management roles in the future. However, we also look outside our company to identify and attract candidates with diverse perspectives and experience to compete for key leadership positions. We cross many industries and many cultures. It’s important for us to identify managers who will succeed in this environment and help us achieve a diversity of management that reflects the diversity of our businesses.
How successful is your settlement strategy for asbestos claims against Garlock Sealing Technologies?
Rick Magee: Overall, we feel our settlement strategy has worked very well. We’ve reduced new annual settlement commitments to levels below the amount of insurance we’re entitled to receive each year, and cash payments in excess of insur-ance collections have declined sharply from the peak in 2001. Our goal is to reduce the net cash outflow – the portion of settlement payments, fees and expenses not covered by insurance reimbursements – to as small a number as possible. We’ve made progress every year since 2001 and we’ll make more progress in 2005. One reason for our strategy’s effective-ness is that we are focusing our settlement
dollars on serious-disease cases. In 2000 and 2001, when settlement payments peaked, less than a third went to serious-disease cases. In 2004, more than two-thirds went to pay claims involving serious-disease cases. We know of only about 6,300 serious- disease cases in the 133,000 total pending claims against Garlock, so we think our strategy, coupled with the benefits of legal reform, will continue to produce positive trends for our cash flow.
Does your settlement strategy increase litigation risk?
Rick Magee: Our strategy increases the number of cases that proceed to trial for two reasons. First, we’re holding the line as best we can on the amount paid in settlement. Second, we’re avoiding large inventory settlements, which typically involve significant numbers of non-malig-nant claims. In 2004, we began 17 trials, compared to seven in 2003. Over the two years, seven of the 24 trials resulted in verdicts against Garlock and four of those verdicts were significant. We are appealing the adverse verdicts, and we are confident Garlock will prevail, especially on the issue of punitive damages. Garlock has never paid a punitive damage award. As we’ve pointed out in the past, Garlock has strong defenses, and the plaintiffs’ lawyers generally prefer to settle rather than take on Garlock in the courtroom. We are well
/ 2004 Annual Report: pages 14 / 15

prepared when we do go to court, and we try to understand all the issues that might affect a jury’s decision. However, there are significant risks for a corporate defendant in any trial. The fact is fewer and fewer original asbestos defendants are in trials because so many have declared bankruptcy. Garlock has a long history in the litigation, so it is named as a defendant frequently, regardless of the strength of the plaintiff ’s case. Demands on Garlock to pay more have increased because money from many of the bankrupt companies is unavailable until their bank-ruptcies are resolved. We are very hopeful that federal legislation will address this issue in 2005 by establishing a national trust fund to resolve future asbestos claims on a no-fault basis. We likely would be required to make significant payments to the trust, but they would be regular and predictable.
Why do you maintain such a conservative balance sheet, with relatively little debt and a substantial amount of cash?
Bill Dries: Our capital structure reflects the fact that we are still a relatively new company whose access to capital markets has been somewhat limited, primarily because of concerns about asbestos claims. We’ve also had to make sure we had adequate cash on hand to meet any unexpected demands, such as the bond we posted in February 2005 for the appeal of
an asbestos verdict against Garlock. We are confident that we will win the appeal, but we are required to set aside $34 million in cash as collateral for the bond until the outcome of the appeal is known, which could take as long as three years. Fortunately, we’ve shown that we can produce strong operating results and cash flows, and that we can manage the effect of asbestos claims, so our access to capital markets is improving. As we execute our strategies, we would expect to create a capital structure that’s more typical of a company with our growth objectives.
We’re halfway through the first decade of the 21st century. What kind of company do you expect EnPro to be at the end of the decade?
Ernie Schaub: Our first and foremost objective is to be a company that remains respected equally for its products, for the returns it brings to its shareholders and the manner in which it conducts business. At the end of this decade, I’d expect us to be a significantly larger company in terms of sales, certainly exceeding a billion dollars. We’ll be built around a strong core of high-value businesses that have grown through sound management strategies. The mix of businesses that make up our company most likely will be different, with some of our current businesses and current product lines no longer in the mix and
with the addition of new, more valuable businesses and product lines. We will be operating from very efficient, modern facilities that make new products in anticipation of our customers’ needs. We expect our businesses to remain good generators of cash, producing superior returns on our investments. I hope that we’ll be working in a system that has a more equitable method for dealing with asbestos claims, but even if we aren’t, I expect that our cash flows will be sufficient to resolve a declining number of claims without limiting our ability to reinvest in our businesses. We will continue to work within a framework of honesty, integrity and accountability, and we’ll continue to do what we can to make our businesses good, safe places for our employees to work. EnPro is today a good company, but we’ll encounter many opportunities to make it better in the future. Our job as managers is to make sound decisions about those opportunities that will allow us to improve our performance for many years to come.
QA
How We Engineer For Performance

ENGINEERED PRODUCTS
SEALING PRODUCTS
COMPANY PRODUCTS MARKETS
GGB
Quincy Compressor
Self-lubricating, non-rolling, metal-polymer and fila-ment-wound bearing products, typically used as sleeve bearings or thrust washers; aluminum bushing blocks for high-performance hydraulic gear pumps
Sealing components for reciprocating compressors
Rotary screw and reciprocating air compressors and vacuum pumps from one-third to 500 horsepower
Automotive, pumps and compressors, construction, power generation, machine tools
Pharmaceutical, pulp and paper, automotive, gas transmission, health, construction and petrochemical
Refining, petrochemical, natural gas transmission and general industry
France Compressor Products
ENGINE PRODUCTS AND SERVICES
COMPANY PRODUCTS MARKETS
Heavy-duty diesel, natural gas and dual-fuel engines from 640 to 29,320 horsepower and four to 18 cylinders
Marine propulsion, U.S. Navy, power generation, pump and compressor applications
Fairbanks Morse Engine
COMPANY PRODUCTS MARKETS
Garlock Sealing Technologies
Metallic and non-metallic gasket materials, compression packing, expansion joints, inflatable seals, specialty rubber and hydraulic components
Chemical, petrochemical, pulp and paper, refining, power generation, mineral processing
Garlock Klozure Rotary lip seals, bearing isolators and mechanical seals
Steel mills, mining, pulp and paper processing
High-performance spring-energized and resilient metal seals
Semiconductor fabrication, nuclear power generation, race car engines, gas turbines
Garlock Helicoflex
High-pressure, corrosion-resistant spring-energized seals
Upstream oil and gasPikotek
Hub oil seals, axle fasteners, hub caps, wheel bearings, mileage counters
Commercial vehicles, including heavy-duty trucks and trailers
Stemco
Plastomer Technologies
PTFE specialty tape, formed PTFE products, PTFE sheets and shapes
Aircraft, fluid handling, semi-conductor
Garlock Rubber Technology
Conveyor belts, sheet rubber products Aggregates, bulk hauling, road and bridge construc-tion, building construction, vibration isolation
/ 2004 Annual Report: page 16
ENPRO INDUSTRIES: OUR COMPANIES
UNITED STATESSECURITIES AND EXCHANGE COMMISSION
Washington, D.C. 20549
FORM10-K (Mark One)
ANNUAL REPORT PURSUANT TO SECTION 13 OR 15(d) OF THE SECURITIES EXCHANGE ACT OF 1934 For the fiscal year ended December 31, 2004
TRANSITION REPORT PURSUANT TO SECTION 13 OR 15(d) OF THE SECURITIES EXCHANGE ACT OF 1934
Commission File Number 001-31225
ENPROINDUSTRIES(Exact name of registrant, as specified in its charter)
North Carolina 01-0573945 (State or other jurisdiction of incorporation) (I.R.S. employer identification no.)
5605 Carnegie Boulevard, Suite 500, Charlotte, North Carolina 28209 (Address of principal executive offices) (Zip code)
(704) 731-1500(Registrant’s telephone number, including area code)
Securities registered pursuant to Section 12(b) of the Act:
Title of each class Name of each exchange on which registered
Common stock, $0.01 par value New York Stock Exchange Preferred stock purchase rights New York Stock Exchange
Indicate by check mark whether the registrant (1) has filed all reports required to be filed by Section 13 or 15(d) of the Securities Exchange Act of 1934 during the preceding 12 months (or for such shorter period that the registrant was required to file such reports), and (2) has been subject to such filing requirements for the past 90 days. Yes No
Indicate by check mark if disclosure of delinquent filers pursuant to Item 405 of Regulation S-K is not contained herein, and will not be contained, to the best of the registrant’s knowledge, in definitive proxy or information statements incorporated by reference in Part III of this Form 10-K or any amendment to this Form 10-K.
Indicate by check mark whether the registrant is an accelerated filer (as defined in Rule 12b-2 of the Securities Exchange Act of 1934). Yes No
The aggregate market value of voting and nonvoting common stock of the registrant held by non-affiliates of the registrant as of June 30, 2004 was $469,152,000. As of March 1, 2005, there were 20,869,008 shares of common stock of the registrant outstanding.
DOCUMENTS INCORPORATED BY REFERENCE
Portions of the registrant’s definitive proxy statement, dated March 29, 2005, for the 2005 annual meeting of shareholders to be held on May 10, 2005 are incorporated by reference into Part III.

Table of Contents
PART 1
ITEM 1 Business ...................................................................... 1
ITEM 2 Properties ................................................................. 6
ITEM 3 Legal Proceedings ................................................. 6
ITEM 4 Submission of Matters to a Vote of Security Holders .................................................................................................... 7
Executive Officers of the Registrant .......... 7
PART II
ITEM 5 Registrant’s Common Equity and Related Shareholder Matters ............................................................................ 8
ITEM 6 Selected Consolidated Financial Data .... 9
ITEM 7 Management’s Discussion and Analysis of Financial Condition and Results of
Operations .......................................................... 10
ITEM 7A Quantitative and Qualitative Disclosures About Market Risk .................................................................................. 30
ITEM 8 Financial Statements and Supplemental Data .................................................................................................................... 31
ITEM 9 Changes In and Disagreements with Accountants on Accounting and Financial
Disclosure ............................................................ 31
ITEM 9A Controls and Procedures ............................... 32
ITEM 9B Other Information .............................................. 32
PART III
ITEM 10 Directors and Executive Officers of the Registrant ....................................................................................................... 33
ITEM 11 Executive Compensation ................................ 33
ITEM 12 Security Ownership of Certain Beneficial Owners and Management and
Related Shareholder Matters ................... 33
ITEM 13 Certain Relationships and Related Transactions ............................................................................................................... 33
ITEM 14 Principal Accountant Fees and Services 33
PART IV
ITEM 15 Exhibits and Financial Statement Schedules ........................................................................................................................ 34
Signatures ................................................................. 35
Exhibit Index .......................................................... 36
Reports of Independent Registered Public Accounting Firms ................................................................................. 40
Consolidated Statements of Operations .............................................................................................................................. 42
Consolidated Statements of Cash Flows .............................................................................................................................. 43
Consolidated Balance Sheets ....................... 44
Consolidated Statements of Changes in Shareholders’ Equity ................................................................................ 45
Notes to Consolidated Financial Statements ..................................................................................................................... 46
Schedule II – Valuation and Qualifying Accounts ............................................................................................................. 75
........................................................................................................... .....
/ Form 10-K: pages 00 / 01

............................................................................................................ ..... PART I
ITEM 1. BUSINESS
As used in this report, the terms “we,” “us,” “our,” and “EnPro” mean EnPro Industries, Inc. and its subsidiaries (unless the context indicates another meaning). The term “common stock” means the common stock of EnPro Industries, Inc., par value $0.01 per share.
BACKGROUNDWe were incorporated under the laws of the state of North Carolina on January 11, 2002, as a wholly owned subsidiary of Goodrich Corporation (“Goodrich”) to operate the sealing products and engineered industrial products businesses of Coltec Industries Inc (“Coltec”), which was also a wholly owned subsidiary of Goodrich. As a result, discussions related to histori-cal activities of our business units include time periods when they constituted the former sealing products and engineered industrial products businesses of Coltec. On May 31, 2002, Goodrich distributed all of our outstanding common stock to Goodrich shareholders of record as of May 28, 2002 (the “Distribution”). At the time of the Distribution, Goodrich sharehold-ers retained their Goodrich shares and the preferred stock purchase rights associated with those shares and received one share of our common stock, as well as an associated EnPro preferred stock purchase right, for every five shares of Goodrich common stock they owned as of the record date.
We maintain an Internet website at www.enproindustries.com. We will make this annual report, in addition to our other annual reports on Form 10-K, quarterly reports on Form 10-Q, current reports on Form 8-K and amendments to these reports, available free of charge on our website as soon as reasonably practicable after we electronically file such material with, or furnish it to, the Securities and Exchange Commission. Our Corporate Governance Guidelines and the charters for each of our Board Committees (Audit and Risk Management, Compensation and Human Resources, Executive, and Nominating and Corporate Governance Committees) are also available on our website, and copies of this information are available in print to any shareholder who requests it. Information included in our website is not incorporated by reference into this annual report.
OVERVIEWWe are a leader in the design, development, manufacturing, and marketing of proprietary engineered industrial products that operate in our sealing products, engineered products, and engine products and services segments. We have 29 primary manufacturing facilities located in the United States and eight countries outside the United States.
Our sales by geographic region in 2004, 2003, and 2002 were as follows:
(in millions) 2004 2003 2002
United States $489.1 $438.7 $453.8Europe 211.6 180.2 160.7Other 125.6 111.2 95.9
Total $826.3 $730.1 $710.4
OPERATIONSWe manage our business as three segments, a sealing products segment, which includes our sealing products, heavy-duty wheel end components and polytetrafluorethylene (“PTFE”) products, an engineered products segment, which includes our metal poly-mer bearings, air compressor systems and vacuum pumps, and reciprocating compressor components, and an engine products and services segment, which manufactures heavy-duty, medium-speed diesel and natural gas engines. For information about sales, segment profits and assets for each segment, see Note 15 to our Consolidated Financial Statements.
SEALING PRODUCTS SEGMENT OVERVIEW. Our sealing products segment designs, manufactures and sells sealing products, including sheet gaskets, metallic gaskets, resilient metal seals, compression packing, rotary lip seals, elastomeric seals, hydraulic components, expansion joints and PTFE products. These products are used in a variety of industries, including chemical and petrochemical processing, petroleum extraction and refining, pulp and paper processing, heavy-duty trucking, power generation, food and pharmaceutical processing,

primary metal manufacturing, mining, water and waste treatment and semiconductor fabrication. In many of these industries, performance and durability are vital for safety and environmental protection. Many of our products are used in applications that are highly demanding, e.g., where extreme temperatures, extreme pressures, corrosive environments and/or worn equipment make sealing difficult.
PRODUCTS. The primary product lines in our sealing products segment are described below.
Gasket products are used for sealing flange joints in chemical, petrochemical and pulp and paper processing facilities where high pressures, high temperatures and corrosive chemicals create the need for specialized and highly engineered sealing products. We sell these gasket products under the Garlock®, Gylon®, Blue-Gard®, Stress-Saver®, Edge®, Graphonic® and Flexseal® brand names. These products have a long-standing reputation within the industries we serve for performance and reliability.
Rotary lip seals manufactured by this segment are used in rotating applications to contain the lubricants that protect the bear-ings from excessive friction and heat generation. Because these sealing products are utilized in dynamic applications, they are subject to wear. Durability, performance, and reliability are, therefore, critical requirements of our customers. These rotary lip seals are used in demanding applications in the steel industry, mining and pulp and paper processing under well-known brand names including Klozure® and Model 64®.
Compression packing is used to provide sealing in pressurized, rotating applications such as pumps and valves. Major markets for compression packing products are the pulp and paper and chemical processing industries. Branded products for these markets include EVSP™ and Synthepak®.
Resilient metal seals provide extremely tight sealing performance for highly demanding applications such as semiconductor fab-rication facilities, specific chemical processing applications, nuclear power generation and race car engines. Branded products for these markets include Helicoflex® and Cefilac®.
Our Pikotek business manufactures critical service flange gaskets, seals and electrical flange isolation kits. These products are used in high-pressure wellhead equipment, flowlines, water injection lines, sour hydrocarbon process applications and crude oil and natural gas pipeline/transmission line applications. Pikotek products are sold under the brand names VCS™, Flowlock™ and PGE™.
This segment also manufactures a variety of sealing products used by the heavy-duty trucking industry to improve the per-formance of wheel end systems and reduce fleet maintenance. Products for this market include hub oil seals, axle fasteners, hub caps, wheel bearings and mileage counters. We sell these sealing products under the Stemco®, Grit Guard®, Guardian®, Guardian HP®, Voyager®, Discover®, Pro-Torq®, Sentinel®, and DataTrac® brand names.
In addition, the sealing products segment manufactures PTFE specialty tape, formed PTFE products and PTFE sheets and shapes as well. These PTFE products provide highly specialized and engineered solutions to our customers in the aircraft and fluid handling industries.
CUSTOMERS. Our sealing products segment sells products to industrial agents and distributors, original equipment manufac-turers (“OEMs”), engineering and construction firms and end users worldwide. Sealing products are offered to global custom-ers, with approximately 40% of sales delivered to customers outside North America in 2004. Representative customers include Morgan Construction Company, BASF Corporation, General Electric Company, Georgia-Pacific Corporation, Eastman Chemical Company, Exxon Mobil Corporation, AK Steel Corporation, Volvo Corporation, Wabash National Corporation, Great Dane, Mack Trucks, International Truck and PACCAR. In 2004, no single customer accounted for more than 2% of segment revenues.
COMPETITION. Competition in the sealing markets in which we operate is based on proven product performance and reliability, as well as price, customer service, application expertise, delivery terms, breadth of product offering, reputation for quality and the availability of the product. Our leading brand names, including Garlock® and Stemco®, have been built upon our long-standing reputation for reliability and durability. In addition, the breadth, performance and quality of our product offerings allow us to achieve premium pricing and have made us a preferred supplier among our agents and distributors. We believe that our record of product performance in the major markets in which this segment operates is a significant competitive advantage for us. Major competitors include A.W. Chesterton Company, Richard Klinger Pty, The Flexitallic Group, Inc., SKF USA Inc., Freudenberg-NOK and Federal-Mogul Corporation.
........................................................................................................... .....
/ Form 10-K: pages 02 / 03

............................................................................................................ ..... RAW MATERIALS AND COMPONENTS. Our sealing products segment uses PTFE resins, aramid fibers, specialty elastomers,
elastomeric compounds, graphite and carbon, common and exotic metals, cold-rolled steel, leather, aluminum die castings, nitrile rubber, powdered metal components, and various fibers and resins. We believe that all of these raw materials and components are readily available from various suppliers.
ENGINEERED PRODUCTS SEGMENTOVERVIEW. Our engineered products segment includes operations that design, manufacture and sell self-lubricating, non-rolling, metal polymer bearing products, air compressor systems and vacuum pumps, and reciprocating compressor components. In 2004, we sold our specialized tooling and die businesses.
PRODUCTS. Our engineered products segment includes the product lines described below, which are designed, manufac-tured and sold by GGB, Quincy Compressor and France Compressor Products.
GGB produces self-lubricating, non-rolling, metal polymer and filament wound bearing products. The metal-backed or epoxy-backed bearing surfaces are made of PTFE, or a mixture that includes PTFE, to provide maintenance-free performance and reduced friction. These products typically perform as sleeve bearings or thrust washers under conditions of no lubrication, minimal lubrication or pre-lubrication. These products are used in a wide variety of markets such as the automotive, pump and compressor, construction, power generation and machine tool markets. We have over 20,000 bearing part numbers of different designs and physical dimensions. GGB is a well recognized, leading brand name in this product area. In 2004, GGB established a new facility in Slovakia that manufactures metal-polymer bearings.
Quincy Compressor designs and manufactures rotary screw and reciprocating air compressors and vacuum pumps, ranging from one-third to 500 horsepower, used in a wide range of industrial applications, including the pharmaceutical, pulp and paper, gas transmission, health, construction, petrochemical and automotive industries. Quincy also sells a comprehensive line of air treatment products. In addition, Quincy performs comprehensive compressed air system audits under the Air Science Engineering™ brand name and manufactures a complete line of pneumatic and hydraulic cylinders under the Ortman™ brand name. In 2004, Quincy established a new facility in China that manufactures rotary compressors.
France Compressor Products designs and manufactures components for reciprocating compressors. These components (packing and wiper assemblies and rings, piston and rider rings, compressor valve assemblies and components) are primarily utilized in the refining, petrochemical, natural gas transmission and general industrial markets. France Compressor Products also designs and manufactures the Gar-Seal® family of lined butterfly valves.
CUSTOMERS. Our engineered products segment sells its products to a diverse customer base using a combination of direct sales and independent distribution networks. GGB has customers worldwide in all major industrial sectors, and supplies products both directly to customers through their own local distribution system and indirectly to the market through indepen-dent agents and distributors with their own local network. Quincy Compressor products are sold through a global network of independent agents and distributors that bring air expertise, customer dedication and Quincy Compressor products to their geographic area. Quincy Compressor also sells directly to national accounts, OEMs and climate control houses. France Compressor Products sells its products globally through a network of company salespersons, independent sales representa-tives and distributors.
COMPETITION. GGB has a number of competitors, including Kolbenschmidt Pierburg AG, Norton Company and Federal-Mogul Corporation. However, we believe no single competitor competes with GGB across all of its bearing product lines or offers as complete a portfolio of products as GGB does. In the markets in which GGB competes, competition is based primarily on performance of the product for specific applications, product reliability, delivery and price. Quincy Compressor’s major competitors include Gardner Denver, Inc., Sullair Corporation, Ingersoll-Rand Company, Atlas Copco North America Inc. and Kaeser Compressors, Inc. In the markets in which Quincy Compressor competes, competition generally is based on reliability, quality, delivery times, energy efficiency, service and price. France Compressor Products competes against original equipment manufacturers, such as Dresser Rand, Ingersoll-Rand Company, Cooper Energy Services, Nuovo Pignone and Ariel Compressor and other component manufacturers, such as C. Leek Cook, Compressor Products International and Hoerbiger Corporation. Price, availability, product quality and reliability are the primary competitive drivers in the markets served by France Compressor Products.

............................................................................................................ ..... RAW MATERIALS AND COMPONENTS. GGB’s major raw material purchases include steel coil, bronze powder and PTFE.
GGB sources components from a number of external suppliers. Quincy Compressor’s primary raw materials are iron cast-ings. Components used by Quincy Compressor are motors, coolers and accessories such as air dryers, filters and electronic controls. France Compressor Products’ major raw material purchases include PTFE (Polytetrafluoroethylene), Peek (Polyether-ertherketone), compound additives, cast iron, steel and stainless steel bar stock. We believe that all of these raw materials and components are readily available from various suppliers.
ENGINE PRODUCTS AND SERVICES SEGMENTOVERVIEW. Our engine products and services segment designs, manufactures, sells and services heavy-duty, medium-speed diesel and natural gas engines. We market our products and services under the Fairbanks Morse® brand name.
PRODUCTS. Our engine products and services segment manufactures under license heavy-duty diesel, natural gas and dual-fuel reciprocating engines. The reciprocating engines range in size from 640 to 29,320 horsepower and from four to 18 cylinders. The government and the general industrial market for marine propulsion, power generation, and pump and com-pressor applications use all of these products. We have been building engines for over 110 years under the Fairbanks Morse® brand name and we have a large installed base of engines for which we supply aftermarket parts and service. Additionally, we have been the U.S. Navy’s supplier of choice for medium-speed diesel engines and have supplied engines to the U.S. Navy for over 60 years.
CUSTOMERS. Our engine products and services segment sells its products to customers worldwide, including major shipyards, municipal utilities, institutional and industrial organizations, sewage treatment plants, nuclear power plants and offshore oil and gas platforms. We market our products through a direct sales force of engineers in North America and through independent agents worldwide. Our representative customers include Northrup Grumman, General Dynamics, the U.S. Navy, the U.S. Coast Guard and Exelon. In 2004, the largest customer accounted for approximately 18% of segment revenues.
COMPETITION. Major competitors for our engine products and services segment include Caterpillar Inc. and Wartsila Corporation. Price, delivery time, and engine efficiency relating to fuel consumption and emissions drive competition.
RAW MATERIALS AND COMPONENTS. Our engine products and services segment purchases multiple ferrous and non-fer-rous castings, forgings, plate stock and bar stock for fabrication and machining into engines. In addition, we buy a considerable amount of precision-machined engine components. We believe that all of these raw materials and components are readily available from various suppliers.
RESEARCH AND DEVELOPMENTWe refer to our research and development efforts as our “EnNovation” program. The goal is to balance our product portfo-lios for traditional markets while simultaneously creating distinctive and breakthrough products. “EnNovation” incorporates a process to move product innovations from concept to commercialization, and to identify, analyze, develop and implement new product concepts and opportunities aimed at business growth.
We employ scientists, engineers and technicians throughout our operations to develop, design and test new and improved products. We work closely with our customers to identify issues and develop technical solutions. The majority of our research and development expenditures are directed toward the development of new sealing products for hostile environments, the development of truck and trailer fleet information systems, the development of bearing products and materials with superior friction and wear characteristics, and the extension of our air compressor product line. Prior to introduction, new products are subject to extensive testing at our various facilities and at beta test sites in conjunction with our customers.
BACKLOGAt December 31, 2004, we had a backlog of orders valued at $191.4 million compared with $203.7 million at December 31, 2003. Approximately 18% of the backlog, mainly at Fairbanks Morse Engine, is expected to be filled beyond 2005. For most of our business, backlog is not particularly predictive of future performance because of our short lead times and some seasonality. Backlog represents orders on hand that we believe to be firm. However, there is no certainty that the backlog orders will in fact result in actual sales at the times or in the amounts ordered.
/ Form 10-K: pages 04 / 05

............................................................................................................ ..... QUALITY ASSURANCE
We believe that product quality is among the most important factors in developing and maintaining strong, long-term rela-tionships with our customers. In order to meet the exacting requirements of our customers, we maintain stringent standards of quality control. We routinely employ in-process inspection by using testing equipment as a process aid during all stages of development, design and production to ensure product quality and reliability. These include state-of-the-art CAD/CAM equipment, statistical process control systems, laser tracking devices, failure mode and effect analysis and coordinate measur-ing machines. We are also able to extract numerical quality control data as a statistical measurement of the quality of the parts being manufactured from our CNC machines. In addition, quality control tests are performed on all parts that we outsource. As a result, we are able to significantly reduce the number of defective parts and therefore improve efficiency, quality and reliability.
As of December 31, 2004, 22 of our manufacturing facilities were ISO 9000, QS 9000 and/or TS 16949 certified with the remain-ing facilities working towards obtaining ISO, QS and/or TS certification. Nine of our facilities are ISO 14001 certified. OEMs are increasingly requiring these standards in lieu of individual certification procedures and as a condition of awarding business.
PATENTS, TRADEMARKS AND OTHER INTELLECTUAL PROPERTYWe maintain a number of patents and trademarks issued by the U.S. and other countries relating to the name and design of our products and have granted licenses to some of these trademarks and patents. We routinely evaluate the need to protect new and existing products through the patent and trademark systems in the U.S. and other countries. In addition, we license patented and other proprietary technology and processes from various companies and individuals in order to broaden our product offerings. We also have a pool of proprietary information, consisting of know-how and trade secrets relating to the design, manufacture and operation of our products and their use, that is not patented. We do not consider our business as a whole to be materially dependent upon any particular patent, patent right, trademark, trade secret or license.
In general, we are the owner of the rights to the products that we manufacture and sell. However, we also license patented and other proprietary technology and processes from various companies and individuals in order to broaden our product offerings. We are dependent on the ability of these third parties to diligently protect their intellectual property rights. In several cases, the intellectual property licenses are integral to the manufacture of our products. For example, Fairbanks Morse Engine licenses technology from MAN B&W and S.E.M.T. Pielstick for the four-stroke reciprocating engine, and Quincy Compressor licenses from Svenska Rotor Maskiner AB its rotary screw compressor design and technology. A loss of these licenses or a failure on the part of the third party to protect its own intellectual property could reduce our revenues. Although these licenses are all long-term and subject to renewal, it is possible that we may not successfully renegotiate these licenses or that they could be terminated for a material breach. If this were to occur, our business, financial condition, results of operations and cash flows could be adversely affected.
EMPLOYEES AND LABOR RELATIONSWe currently have approximately 4,200 employees worldwide. Approximately 2,600 employees are located within the U.S. and approximately 1,600 employees are located outside the U.S., primarily in Europe, Canada and Mexico. Approximately 36% of our U.S. employees are members of trade unions covered by collective bargaining agreements. Union agreements relate, among other things, to wages, hours and conditions of employment. The wages and benefits furnished are generally comparable to industry and area practices.
We have collective bargaining agreements in place at five of our facilities. The hourly employees who are unionized are covered by collective bargaining agreements with a number of labor unions and with varying contract termination dates ranging from June 2005 to October 2007. In addition, some of our employees located outside the U.S. are subject to national collective bargaining agreements.

............................................................................................................ ..... ITEM 2. PROPERTIES
We are headquartered in Charlotte, North Carolina and have 29 primary manufacturing facilities in ten states within the U.S. and eight countries outside of the U.S. The following table outlines the location, business segment and size of our largest facilities, along with whether such facilities are owned or leased by us:
Owned/ SizeLocation Segment Leased (Square Feet)
U.S.Palmyra, New York Sealing Products Owned 689,000Longview, Texas Sealing Products Owned 210,000Paragould, Arkansas Sealing Products Owned 142,000Quincy, Illinois Engineered Products Owned 323,000Bay Minette, Alabama Engineered Products Leased 143,000Thorofare, New Jersey Engineered Products Owned 120,000Beloit, Wisconsin Engine Products and Services Owned 433,000
ForeignMexico City, Mexico Sealing Products Owned 131,000Saint Etienne, France Sealing Products Owned 108,000Annecy, France Engineered Products Leased 196,000Heilbronn, Germany Engineered Products Owned 127,000Sucany, Slovakia Engineered Products Owned 109,000
Our manufacturing capabilities are flexible and allow us to customize the manufacturing process to increase performance and value for our customers and meet particular specifications. We also maintain numerous sales offices and warehouse facilities in strategic locations in the U.S., Canada and other countries. We believe that all of our facilities and equipment are in good condition and are well maintained and able to continue to operate at present levels.
ITEM 3. LEGAL PROCEEDINGS
A description of environmental, asbestos and legal matters is included in Item 7 of this annual report under the heading “Management’s Discussion and Analysis of Financial Condition and Results of Operations – Contingencies,” which description is incorporated by reference herein.
In addition to the matters referenced above, we are from time to time subject to, and are presently involved in, other litigation and legal proceedings arising in the ordinary course of business. We believe that the outcome of such other litigation and legal proceedings will not have a material adverse affect on our financial condition, results of operations or cash flows.
/ Form 10-K: pages 06 / 07

............................................................................................................ ..... ITEM 4. SUBMISSION OF MATTERS TO A VOTE
OF SECURITY HOLDERS
No matter was submitted to a vote of security holders during the fourth quarter of the fiscal year covered by this report.
EXECUTIVE OFFICERS OF THE REGISTRANT
Information concerning our executive officers is set forth below:
Name Age Position
Ernest F. Schaub 61 President, Chief Executive Officer and DirectorWilliam Dries 53 Senior Vice President and Chief Financial OfficerRichard C. Driscoll 63 Senior Vice President – Human ResourcesRichard L. Magee 47 Senior Vice President, General Counsel and SecretaryWayne T. Byrne 41 Vice President and ControllerRobert D. Rehley 44 Vice President and Treasurer
Ernest F. Schaub is currently President, Chief Executive Officer and Director and has held this position since May 2002. From 1999 until joining the Company, he was Executive Vice President of Goodrich Corporation and President and Chief Operat-ing Officer of Goodrich’s Engineered Industrial Products Segment. From 1990 to 1999, Mr. Schaub was Group President, Landing Systems of Goodrich. Mr. Schaub joined Goodrich in 1971, and held a variety of engineering, manufacturing and management positions.
William Dries is currently Senior Vice President and Chief Financial Officer and has held this position since May 2002. He served as a consultant to Goodrich Corporation from September 2001 through December 2001 and was an employee of Coltec Industries Inc from January 2002 through April 2002. Prior to that, Mr. Dries was employed by United Dominion Indus-tries, Inc. He was Senior Vice President and Chief Financial Officer of United Dominion from December 1999 until May 2001, having served from 1998 to 1999 as Senior Vice President – Finance, and from 1990 to 1998 as Vice President and Controller. Mr. Dries, a certified public accountant, was with Ernst & Young LLP in New York prior to joining United Dominion in 1985.
Richard C. Driscoll is currently Senior Vice President – Human Resources and has held this position since May 2002. From 1990 until joining the Company, he was Vice President – Human Resources of Goodrich Corporation. Mr. Driscoll joined Goodrich in 1964 and held a number of human resources management positions in several different operations, at the corporate office and with the Aerospace Segment.
Richard L. Magee is currently Senior Vice President, General Counsel and Secretary and has held this position since May 2002. He served as a consultant to Goodrich Corporation from October 2001 through December 2001, and was an employee of Coltec Industries Inc from January 2002 through April 2002. Prior to that, Mr. Magee was Senior Vice President, General Counsel and Secretary of United Dominion Industries, Inc. from April 2000 until July 2001, having served as Vice President since July 1996, Secretary since July 1997 and General Counsel since 1998. Mr. Magee was a partner in the Charlotte, North Carolina law firm Robinson, Bradshaw & Hinson, P.A. prior to joining United Dominion in 1989.
Wayne T. Byrne is currently Vice President and Controller and has held this position since September 2004. He served as Vice President of Finance and Information Technology at our subsidiary, GGB LLC, from 2001 to 2004 for Coltec Industries Inc. Between 1998 and 2001, Mr. Byrne served as Vice President of Finance of Goodrich Corporation’s Quincy Compressor and AMI businesses. From 1996 until 1998, he was Vice President of Finance at Agri-Tech, Inc. Prior to 1996, Mr. Byrne held various management positions at BREED Technologies, Inc. and Harris Corporation.
Robert D. Rehley is currently Vice President and Treasurer and has held this position since May 2002. He was an employee of Coltec Industries Inc from January 2002 through April 2002. Mr. Rehley was Assistant Treasurer of Metaldyne Corporation from October 2001 to January 2002, and was Executive Director – Corporate Tax for Metaldyne from December 2000 until October 2001. Previously, he was Treasurer of Simpson Industries from April 1998 until December 2000. Mr. Rehley was Director – Finance and Business Development for Cummins Engine Company, Inc. from October 1996 until April 1998.

............................................................................................................ ..... PART II
ITEM 5. REGISTRANT’S COMMON EQUITY AND RELATED SHAREHOLDER MATTERS
Our common stock is publicly traded on the New York Stock Exchange (“NYSE”) under the symbol “NPO.” As required by Section 3.03A.12(a) of the NYSE listing standards, EnPro filed with the NYSE the certification of its Chief Executive Officer that he is not aware of any violation by the Company of NYSE corporate governance listing standards.
As of March 1, 2005, there were 6,327 holders of record of our common stock. The price range of our common stock from January 1, 2003 through December 31, 2004 is listed below by quarter:
Low High Sale Price Sale Price
Fiscal 2004: Fourth Quarter $21.65 $30.15 Third Quarter 17.43 25.20 Second Quarter 17.86 23.55 First Quarter 14.05 20.17
Low High Sale Price Sale Price
Fiscal 2003: Fourth Quarter $8.70 $14.50 Third Quarter 9.18 13.70 Second Quarter 3.93 11.05 First Quarter 3.75 4.56
EnPro did not declare any cash dividends to its shareholders during 2004. For a discussion of the restrictions on payment of dividends on our common stock, see “Management’s Discussion and Analysis of Financial Condition and Results of Operations – Liquidity and Capital Resources – Dividends” and Note 10 to our Consolidated Financial Statements.
The following table sets forth all purchases made by or on behalf of EnPro or any “affiliated purchaser,” as defined in Rule 10b-18(a)(3) under the Exchange Act, of shares of our common stock during each month in the fourth quarter of 2004.
Period
(a) Total Number of Shares (or Units)
Purchased (1)
(b) Average Price Paid per Share
(or Unit)
(c) Total Number of Shares (or Units) Purchased as
Part of Publicly Announced Plans or Programs (1)
(d) Maximum Number (or Approximate Dollar
Value) of Shares (or Units) that May Yet Be Purchased Under the Plans or Programs (1)
October 1 – October 31, 2004 -0- – – –November 1 – November 30, 2004 -0- – – –December 1 – December 31, 2004 1,147 (2) – –Total 1,147 (2) – –
(1) Shares were purchased by a rabbi trust that we established in connection with our Deferred Compensation Plan for Non-Employee Directors, pursuant to which non-employee directors may elect to defer directors’ fees into common stock units. The rabbi trust purchased these shares from Coltec Industries Inc (“Coltec”), which is a wholly owned subsidiary of EnPro. We do not consider the purchase of shares from Coltec in this context to be pursuant to a publicly announced plan or program.
(2) Coltec furnished the 1,147 shares to the rabbi trust in exchange for management and other services provided by EnPro. The number of shares was calculated using a price of $29.20, the average price of EnPro’s common stock on January 3, 2005.
/ Form 10-K: pages 08 / 09

............................................................................................................ ..... ITEM 6. SELECTED CONSOLIDATED FINANCIAL DATA
The following historical consolidated financial information as of and for each of the years ended December 31, 2004, 2003 and 2002, has been derived from, and should be read together with, our audited Consolidated Financial Statements and the related notes, which are included elsewhere in this report. The historical consolidated financial information at and for the years ended December 31, 2001 and 2000, has been derived from, and should be read together with, Coltec’s audited consolidated financial statements and the related notes, which have not been included in this report.
During the pre-Distribution periods presented, Coltec completed a number of acquisitions and divestitures, some of which were significant. As a result, Coltec’s and our historical financial results for the periods presented may not be directly compa-rable. The information presented below should also be read together with Item 7, “Management’s Discussion and Analysis of Financial Condition and Results of Operations.”
Year Ended December 31,(in millions, except per share data) 2004 2003 2002 2001 2000
Statement of Operations Data: Sales $ 826.3 $ 730.1 $710.4 $ 629.7 $ 655.5 Income (loss) from continuing operations $ 33.8 $ 33.2 $ (12.6) $ 6.6 $ 36.7
Balance Sheet Data: Total assets $1,181.0 $1,020.7 $955.3 $1,473.0 $1,255.4 Long-term debt (including current portion) (1) $ 164.8 $ 170.2 $ 170.9 $ 314.6 $ 318.0 Mandatorily redeemable convertible preferred securities of trust (“TIDES”) (1) $ – $ – $ – $ 150.0 $ 149.3
Per Common Share Data – Diluted: Income (loss) from continuing operations (2) $ 1.60 $ 1.61 $ (0.62) N/A N/A
(1) The TIDES are convertible primarily into the common stock of another registrant, i.e., Goodrich, and therefore, are no longer deemed to be a convertible preferred security. The TIDES have been classified as long-term debt subsequent to the Distribution.
(2) Because our results were consolidated into the results of Goodrich prior to the Distribution, per share amounts do not apply to periods prior to 2002.

............................................................................................................ ..... ITEM 7. MANAGEMENT’S DISCUSSION AND ANALYSIS
OF FINANCIAL CONDITION AND RESULTS OF OPERATIONS
This report contains certain statements that are “forward-looking statements” as that term is defined under the Private Securities Litigation Reform Act of 1995 (the “Act”) and releases issued by the Securities and Exchange Commission. The words “may,” “hope,” “will,” “should,” “expect,” “plan,” “anticipate,” “intend,” “believe,” “estimate,” “predict,” “potential,” “continue,” and other expressions which are predictions of or indicate future events and trends and which do not relate to historical matters identify forward-looking statements. We believe that it is important to communicate our future expectations to our shareholders, and we therefore make forward-looking statements in reliance upon the safe harbor provisions of the Act. However, there may be events in the future that we are not able to accurately predict or control, and our actual results may differ materially from the expectations we describe in our forward-looking statements. Forward-looking state-ments involve known and unknown risks, uncertainties and other factors, which may cause our actual results, performance or achievements to differ materially from anticipated future results, performance or achievements expressed or implied by such forward-looking statements. We advise you to read further about certain of these and other risk factors set forth under the caption “Certain Risk Factors That May Affect Future Results.” We undertake no obligation to publicly update or revise any forward-looking statement, either as a result of new information, future events or otherwise. Whenever you read or hear any subsequent written or oral forward-looking statements attributed to us or any person acting on our behalf, you should keep in mind the cautionary statements contained or referred to in this section.
The following is management’s discussion and analysis of certain significant factors that have affected our consolidated financial condition and operating results during the periods included in the accompanying audited consolidated financial statements and the related notes. You should read the following discussion in conjunction with our audited consolidated financial statements and the related notes, included elsewhere in this report.
OVERVIEWOVERVIEW. EnPro Industries, Inc. (“EnPro” or the “Company”) was incorporated on January 11, 2002, as a wholly owned subsidiary of the Goodrich Corporation (“Goodrich”) in anticipation of Goodrich’s announced distribution of its Engineered Industrial Products (“EIP”) segment to existing Goodrich shareholders, which took place on May 31, 2002 (the “Distribution”). We are a leader in the design, development, manufacturing and marketing of proprietary engineered industrial products.
We manage our business as three segments, a sealing products segment, which includes our sealing products, heavy-duty wheel end components and PTFE products, an engineered products segment, which includes our metal polymer bearings, air compressor systems and vacuum pumps, and reciprocating compressor components, and an engine products and services segment, which includes heavy-duty, medium-speed diesel and natural gas engines. Prior to this report, we reported our results of operations under two business segments, a sealing products segment and an engineered products segment. Beginning with this report, we will report our results of operations as three business segments, a sealing products segment, an engineered products segment, and an engine products and services segment. Our segment disclosures for prior periods have been reclas-sified to reflect the fact that our former engineered products segment has been broken into two segments, our engineered products segment and our engine products and services segment.
For purposes of our segment disclosures, segment profit is total segment revenue reduced by operating expenses and restructur-ing and new facilities costs identifiable with the segment. Corporate expenses, net interest expense, asbestos-related expenses, gains/losses or impairments related to the sale of assets, income taxes and other expenses not directly attributable to the segments are not included in the computation of segment profit. The accounting policies of the reportable segments are the same as those for EnPro.
Our sealing products segment designs, manufactures and sells sealing products, including sheet gaskets, metallic gaskets, resilient metal seals, compression packing, rotary lip seals, elastomeric seals, hydraulic components, expansion joints and PTFE products. These products are used in a variety of industries, including chemical and petrochemical processing, petroleum extraction and refining, pulp and paper processing, heavy-duty trucking, power generation, food and pharmaceutical processing, primary metal manufacturing, mining, water and waste treatment and semiconductor fabrication.
Our engineered products segment includes operations that design, manufacture and sell self-lubricating, non-rolling, metal polymer bearing products, air compressor systems and vacuum pumps, and reciprocating compressor components. These products are used in a wide range of industrial applications, including the pharmaceutical, pulp and paper, gas transmission, health, construction, petrochemical and automotive industries.
/ Form 10-K: pages 10 / 11

............................................................................................................ ..... Our engine products and services segment designs, manufactures, sells and services heavy-duty, medium-speed diesel and
natural gas engines. The government and general market for marine propulsion, power generation, and pump and compressor applications use these products and services.
Since the Distribution, we have focused on four management initiatives: increasing productivity through our Total Customer Value, or TCV, lean enterprise program; expanding our product offerings and customer base through our EnNovation initiative and new operations in new geographic markets; strengthening the mix of our business by strategic acquisitions and divestitures; and managing the asbestos settlements of our subsidiaries to minimize the impact on cash flows and enhance our liquidity.
The following discusses our consolidated results of operations, cash flows and financial condition after the Distribution and Coltec’s consolidated results of operations, cash flows and financial condition as it operated as a wholly owned subsidiary of Goodrich prior to the Distribution, including the adjustments and allocations necessary for a fair presentation of the business. Prior to the Distribution, Coltec owned the EIP business as well as an aerospace business. The transfer of Coltec’s aerospace business to Goodrich prior to the Distribution constituted the disposal of a segment. Accordingly, Coltec’s aerospace business has been accounted for as a discontinued operation and its revenues, costs and expenses, and cash flows have been segregated in the historical consolidated financial statements included elsewhere in this report. Unless otherwise noted, the following discussion pertains only to continuing operations. Following the Distribution, Coltec became a wholly owned subsidiary of EnPro and Coltec’s former aerospace business continues to be owned by Goodrich.
The following discussion of the consolidated results of operations does not necessarily include all of the expenses that would have been incurred by Coltec prior to the Distribution had it been a separate, stand-alone entity and may not necessarily reflect what Coltec’s consolidated results of operations, cash flows and financial condition would have been had Coltec been a stand-alone entity prior to the Distribution or what our consolidated results of operations, cash flows and financial condition may be in the future.
RESULTS OF OPERATIONS Years Ended December 31,(in millions) 2004 2003 2002
Sales Sealing Products $374.7 $333.0 $315.7 Engineered Products 335.8 304.2 284.9 Engine Products and Services 116.9 94.4 111.6
827.4 731.6 712.2 Intersegment sales (1.1) (1.5) (1.8)
Total sales $826.3 $730.1 $710.4
Segment Profit Sealing Products $ 58.6 $ 48.7 $ 39.3 Engineered Products 32.6 30.9 31.8 Engine Products and Services 0.9 8.0 4.0
Total segment profit 92.1 87.6 75.1
Corporate expenses (26.8) (22.5) (16.1)Asbestos-related expenses (10.4) (9.8) (18.0)Gain (loss) on sale of assets, net (1.8) 2.5 0.6Interest – net (7.1) (7.6) (13.7)Mark-to-market adjustment for call options (0.2) 1.2 (16.7)Other income (expenses), net 5.1 (0.5) (28.0)
Income (loss) before income taxes and distributions on TIDES 50.9 50.9 (16.8)Income tax (expense) benefit (17.1) (17.7) 7.5Distributions on TIDES – – (3.3)
Income (loss) from continuing operations 33.8 33.2 (12.6)Income from discontinued operations, net of taxes – – 24.2
Income before cumulative effect of a change in accounting principle 33.8 33.2 11.6Cumulative effect of a change in accounting principle, net of taxes – – (14.6)
Net income (loss) $ 33.8 $ 33.2 $ (3.0)

............................................................................................................ ..... Segment profit is total segment revenue reduced by operating expenses and restructuring and other costs identifiable with
the segment. Corporate expenses include general corporate administrative costs. Expenses not directly attributable to the segments, corporate expenses, net interest expense, asbestos-related expenses, gains/losses or impairments related to the sale of assets and income taxes are not included in the computation of segment profit. The accounting policies of the reportable segments are the same as those for EnPro.
2004 Compared to 2003Sales increased 13% in 2004 to $826.3 million compared to $730.1 million in 2003. Nearly every operation experienced an increase in volume, with several operations experiencing double-digit percentage increases. The increase in demand and order activity was in line with the markets we serve. In addition to the higher volumes, the increase in the value of the euro, when compared to the dollar, accounted for approximately three percentage points of the increase in sales. This change favorably impacted revenue at the European operations of Garlock Sealing Technologies, GGB and France Compressor Products for the year.
Segment profit was $92.1 million in 2004, which was a 5% improvement over the $87.6 million reported in 2003. Higher volumes at most operations, selected price increases, and the impact of stronger foreign currency rates had a favorable impact on segment profits. These improvements were partially offset by a less favorable product mix, increased raw mate-rials prices, especially in metals, and higher energy costs. The 2004 results also include a loss of $7.5 million for expected cost overruns on engine programs at Fairbanks Morse Engine. Performance issues surrounding the production of new engine models and a weaker dollar, which increased the costs for engine components manufactured outside of the United States, required us to establish this provision. Additionally, we incurred restructuring and other expense of $9.4 million in 2004, compared to $2.6 million in 2003, primarily associated with activities at our France Compressor Products operations in the U.S. and the GGB operations in France. Segment margins were 11.1% in 2004 compared to 12.0% in 2003.
Net income of $33.8 million in 2004 was higher than the reported net income of $33.2 million in 2003. Net income was impacted by the items discussed below:
Corporate expenses increased to $26.8 million in 2004 compared to $22.5 million in 2003. The increase in 2004 was primarily due to the rise in EnPro’s stock price and the effect that had on stock-based compensation.
Asbestos-related expenses were $10.4 million in 2004 compared to $9.8 million in 2003. Higher defense costs associated with an increase in trials and lower recoveries from insolvent insurance carriers in 2004 contributed to the increase.
During 2004, we received approximately $10 million from an insurer to settle our claims for (1) reimbursement of past costs relating to certain environmental matters, and (2) estimated future claims that had previously been reserved by us.
Net interest expense decreased from $7.6 million in 2003 to $7.1 million in 2004 as the result of repayment of variable rate promissory notes and industrial revenue bonds.
Results of operations in 2004 included a $0.2 million loss in the fair value of our call options on Goodrich common stock. The fair value of the call options increased by $1.2 million in 2003. The call options are derivative instruments and are carried at fair value with changes in the fair value reflected in income. Changes in the fair value of the call options do not affect cash flows. We use the call options to protect against the risk that our 5¼% Convertible Preferred Securities – Term Income Deferred Equity Securities (“TIDES”), which under certain circumstances are convertible into Goodrich and EnPro common stock, could exceed their aggregate liquidation value if converted.
In 2004, we recognized a loss of $3.7 million in connection with the divestiture of our Haber Tool and Sterling Die businesses, partially offset by a gain of $1.9 million primarily associated with the sale of a building we no longer needed as a result of our restructuring initiatives.
/ Form 10-K: pages 12 / 13
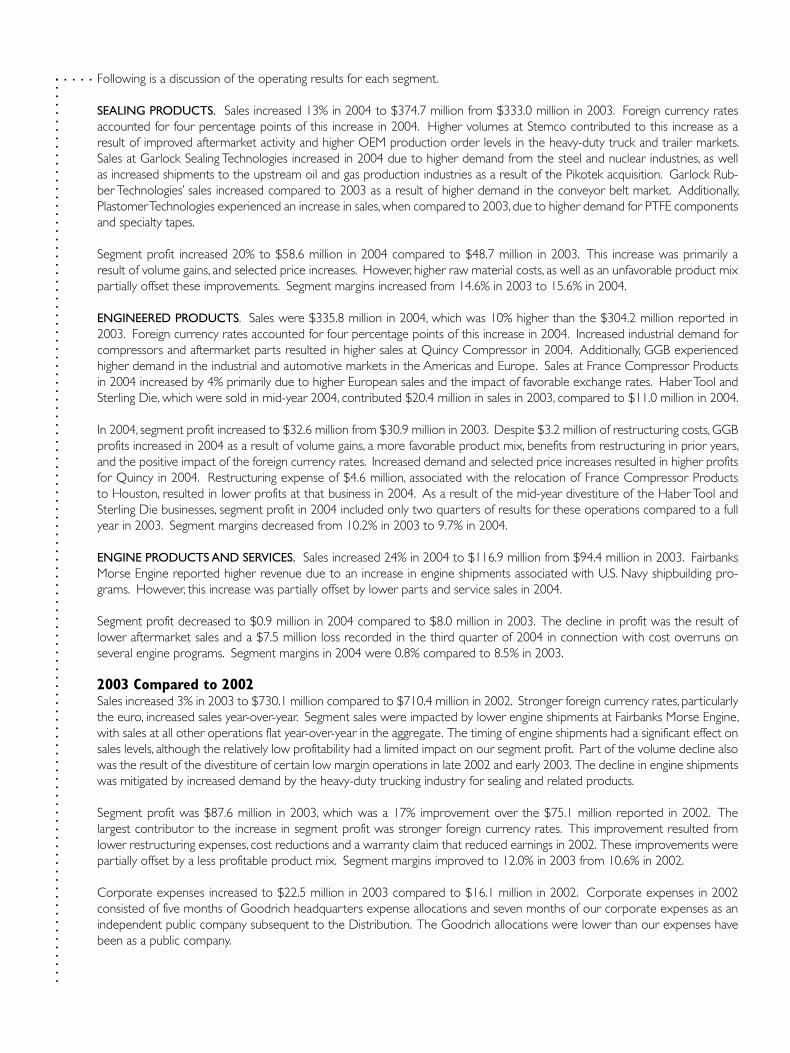
............................................................................................................ ..... Following is a discussion of the operating results for each segment.
SEALING PRODUCTS. Sales increased 13% in 2004 to $374.7 million from $333.0 million in 2003. Foreign currency rates accounted for four percentage points of this increase in 2004. Higher volumes at Stemco contributed to this increase as a result of improved aftermarket activity and higher OEM production order levels in the heavy-duty truck and trailer markets. Sales at Garlock Sealing Technologies increased in 2004 due to higher demand from the steel and nuclear industries, as well as increased shipments to the upstream oil and gas production industries as a result of the Pikotek acquisition. Garlock Rub-ber Technologies’ sales increased compared to 2003 as a result of higher demand in the conveyor belt market. Additionally, Plastomer Technologies experienced an increase in sales, when compared to 2003, due to higher demand for PTFE components and specialty tapes.
Segment profit increased 20% to $58.6 million in 2004 compared to $48.7 million in 2003. This increase was primarily a result of volume gains, and selected price increases. However, higher raw material costs, as well as an unfavorable product mix partially offset these improvements. Segment margins increased from 14.6% in 2003 to 15.6% in 2004.
ENGINEERED PRODUCTS. Sales were $335.8 million in 2004, which was 10% higher than the $304.2 million reported in 2003. Foreign currency rates accounted for four percentage points of this increase in 2004. Increased industrial demand for compressors and aftermarket parts resulted in higher sales at Quincy Compressor in 2004. Additionally, GGB experienced higher demand in the industrial and automotive markets in the Americas and Europe. Sales at France Compressor Products in 2004 increased by 4% primarily due to higher European sales and the impact of favorable exchange rates. Haber Tool and Sterling Die, which were sold in mid-year 2004, contributed $20.4 million in sales in 2003, compared to $11.0 million in 2004.
In 2004, segment profit increased to $32.6 million from $30.9 million in 2003. Despite $3.2 million of restructuring costs, GGB profits increased in 2004 as a result of volume gains, a more favorable product mix, benefits from restructuring in prior years, and the positive impact of the foreign currency rates. Increased demand and selected price increases resulted in higher profits for Quincy in 2004. Restructuring expense of $4.6 million, associated with the relocation of France Compressor Products to Houston, resulted in lower profits at that business in 2004. As a result of the mid-year divestiture of the Haber Tool and Sterling Die businesses, segment profit in 2004 included only two quarters of results for these operations compared to a full year in 2003. Segment margins decreased from 10.2% in 2003 to 9.7% in 2004.
ENGINE PRODUCTS AND SERVICES. Sales increased 24% in 2004 to $116.9 million from $94.4 million in 2003. Fairbanks Morse Engine reported higher revenue due to an increase in engine shipments associated with U.S. Navy shipbuilding pro-grams. However, this increase was partially offset by lower parts and service sales in 2004.
Segment profit decreased to $0.9 million in 2004 compared to $8.0 million in 2003. The decline in profit was the result of lower aftermarket sales and a $7.5 million loss recorded in the third quarter of 2004 in connection with cost overruns on several engine programs. Segment margins in 2004 were 0.8% compared to 8.5% in 2003.
2003 Compared to 2002Sales increased 3% in 2003 to $730.1 million compared to $710.4 million in 2002. Stronger foreign currency rates, particularly the euro, increased sales year-over-year. Segment sales were impacted by lower engine shipments at Fairbanks Morse Engine, with sales at all other operations flat year-over-year in the aggregate. The timing of engine shipments had a significant effect on sales levels, although the relatively low profitability had a limited impact on our segment profit. Part of the volume decline also was the result of the divestiture of certain low margin operations in late 2002 and early 2003. The decline in engine shipments was mitigated by increased demand by the heavy-duty trucking industry for sealing and related products.
Segment profit was $87.6 million in 2003, which was a 17% improvement over the $75.1 million reported in 2002. The largest contributor to the increase in segment profit was stronger foreign currency rates. This improvement resulted from lower restructuring expenses, cost reductions and a warranty claim that reduced earnings in 2002. These improvements were partially offset by a less profitable product mix. Segment margins improved to 12.0% in 2003 from 10.6% in 2002.
Corporate expenses increased to $22.5 million in 2003 compared to $16.1 million in 2002. Corporate expenses in 2002 consisted of five months of Goodrich headquarters expense allocations and seven months of our corporate expenses as an independent public company subsequent to the Distribution. The Goodrich allocations were lower than our expenses have been as a public company.

............................................................................................................ ..... Asbestos-related expenses of $9.8 million in 2003 decreased 46% from $18.0 million in 2002. The expenses in 2002 included
a $6.2 million write-off of an asbestos insurance receivable as a result of a bankruptcy filing by the parent company of one of Garlock’s insurers. The remaining decrease is primarily the result of recoveries from insolvent insurance carriers in 2003.
The total of net interest expense and distributions on TIDES decreased from $17.0 million in 2002 to $7.6 million in 2003. The decrease was primarily the result of the reduction in the 7½% Coltec Senior Notes, which were retained by Goodrich in connection with the Distribution.
In 2002, we purchased call options on Goodrich common stock to provide protection against the risk that the cash required to finance conversions of the TIDES into Goodrich common stock could exceed their liquidation value. The call options are a derivative instrument and are carried at fair value on our Consolidated Balance Sheets. Changes in fair value are reflected in income, but do not affect cash flows. The fair value of the call options increased in 2003 by $1.2 million, compared to a loss of $16.7 million in 2002.
Other expense in 2003 of $0.5 million included the gain on a partial purchase of the TIDES, and a reserve adjustment for environmental matters, offset by amortization of debt issuance costs and charges associated with discontinued operations. In connection with the Distribution, the other expenses in 2002 of $28.0 million included an increase in our environmental liabilities of $12.0 million to reflect an increase in the estimated cost to remediate a number of environmental sites. Addition-ally, in 2002 we revised the estimated costs associated with an adverse court ruling related to severance owed as a result of the closing of a plant in 1982. We increased our retained liabilities of previously owned businesses for this case by $11.0 million. In December 2002, $14.4 million was paid in connection with this liability.
Following is a discussion of the operating results for each segment.
SEALING PRODUCTS. Sales increased 5% in 2003 to $333.0 million from $315.7 million in 2002. Foreign currency rates accounted for four percentage points of this increase in 2003. Stemco contributed to the increase as a result of improved aftermarket activity and OEM production order levels in the heavy-duty truck market, which continues to improve from a low point in 2001. In addition, sales at Garlock Rubber Technologies increased in 2003 due to increased volume. Sales at Garlock Sealing Technologies were flat after excluding the effects of exchange rates. Plastomer Technologies’ sales declined compared to 2002 due to the divestiture of two low margin product lines.
Segment profit increased 24% to $48.7 million in 2003 compared to $39.3 million in 2002. This increase was primarily a result of increased margins at Stemco, cost reductions, and warranty and other unfavorable reserve adjustments in 2002 that did not recur in 2003. Segment margins increased from 12.4% in 2002 to 14.6 % in 2003.
ENGINEERED PRODUCTS. Sales were $304.2 million in 2003, which was 7% higher than the $284.9 million in 2002. Excluding the favorable foreign currency rates, sales at GGB, Quincy Compressor, France Compressor Products and Haber-Sterling were essentially flat year-over-year.
In 2003, segment profit decreased to $30.9 million from $31.8 million in 2002. Excluding the impact of favorable foreign currency rates, segment profit at GGB, Quincy Compressor, France Compressor Products and Haber-Sterling was down due to increased costs compared to 2002. Segment margins decreased from 11.2% in 2002 to 10.2% in 2003.
ENGINE PRODUCTS AND SERVICES. Sales decreased 15% to $94.4 million in 2003 compared to $111.6 million in 2002. This decrease was mainly due to lower engine shipments by Fairbanks Morse Engine to both commercial customers and the U.S. Navy. Field service revenue in 2003 was higher than 2002, partially offset by lower demand for aftermarket parts.
Segment profit increased to $8.0 million in 2003, compared to $4.0 million in 2002. This increase was mainly due to positive events regarding a legal and warranty claim that led to the reduction of related accruals and lower restructuring expense. Segment margin improved to 8.5% in 2003 compared to 3.6% in 2002.
RESTRUCTURING AND OTHER COSTSRestructuring expense was $9.4 million, $2.6 million and $3.9 million for 2004, 2003 and 2002, respectively. The 2004 restructuring expense was primarily related to the relocation and consolidation of facilities for a domestic operation and start-up costs associated with two new foreign facilities. These activities are in support of our management initiatives to increase productivity and expand our product offerings in new geographic markets. See Note 3 in the Consolidated Financial Statements for a discussion of restructuring and other costs in 2004, 2003 and 2002.
/ Form 10-K: pages 14 / 15

............................................................................................................ ..... CRITICAL ACCOUNTING POLICIES AND ESTIMATES
The preparation of our Consolidated Financial Statements, in accordance with accounting principles generally accepted in the United States, requires us to make estimates and judgments that affect the reported amounts of assets, liabilities, revenues and expenses, and related disclosures pertaining to contingent assets and liabilities. Note 1, “Overview, Basis of Presentation and Significant Accounting Policies,” in the Consolidated Financial Statements describes the significant accounting policies used to pre-pare the Consolidated Financial Statements. On an ongoing basis we evaluate our estimates, including, but not limited to, those related to product returns, bad debts, inventories, intangible assets, income taxes, warranty obligations, restructuring, pensions and other post-retirement benefits, and contingencies and litigation. We base our estimates on historical experience and on various other assumptions that we believe to be reasonable under the circumstances. Actual results may differ from these estimates.
We believe that the following accounting policies and estimates are the most critical because some of them involve significant judg-ments and uncertainties and could potentially result in materially different results under different assumptions and conditions.
Revenue RecognitionRevenue is recognized at the time title and risk of product ownership is transferred or when services are rendered. Any shipping costs billed to customers are recognized as revenue.
Asbestos Historically, we recorded an accrual for asbestos-related claims for actions in advanced stages of processing and settled claims only. No accrual was recorded for claims in early procedural stages or for unasserted claims. In 2004, we established an accrual for early-stage and unasserted claims estimated for a future period over which management believes the liability can reasonably be estimated. We have engaged the firm of Bates White, LLC, a recognized expert in the field of estimating asbes-tos-related liabilities, to assist us in estimating the liability. Due to the uncertain nature of the estimated liability, management’s estimate covers a range, and we believe no single amount in the range is a better estimate than any other amount in the range. In accordance with the applicable accounting rules, we recorded a liability for these claims and a corresponding receivable from our insurance carrier, at the lower end of the range of estimated potential liability.
The significant assumptions underlying the material components of the estimated range of liability include: the number and trend of claims to be asserted; the mix of alleged diseases or impairment; the trend in the number of claims for non-malignant cases; the probability that some existing and potential future claims will eventually be dismissed without payment; and the estimated amount to be paid per claim. The actual number of future actions filed per year and the payments made to resolve those claims could exceed those reflected in our past experience and those reflected in our estimate.
With the assistance of Bates White, LLC, we will periodically review the period over which we can make a reasonable estimate, the assumptions underlying our estimate, and the range of reasonably possible potential liabilities, and adjust the liability if necessary. Changing circumstances and new data that may become available could cause a change in the obligation in the future by an amount that cannot currently be reasonably estimated, and that increase could be significant and material. If the amount of the estimated liability ever exceeds the amount of insurance available for asbestos claims, the excess will be charged to earnings.
TIDES, Derivative Instruments and Hedging ActivitiesUpon the adoption of Statement of Financial Accounting Standards No. 133, we elected not to apply the provisions of the statement to embedded derivatives existing before January 1, 1999, as permitted by the transition provisions of the statement. As a result, the feature of the TIDES that allows them to be converted into Goodrich common stock is not accounted for separately as a derivative. We purchased call options on shares of Goodrich common stock with an exercise price of $52.34 per share (the conversion price), in an amount that would be required if all TIDES holders convert. The call options provide for either an adjustment to the exercise price or a cash payment, at our option, if there is a change in the cash dividends paid on Goodrich common stock. The value of the call options as of December 31, 2004 is $2.5 million and is reported in Other Assets on the Consolidated Balance Sheets.
We also have entered into foreign currency forward exchange contracts to hedge forecasted transactions occurring at various dates through December 2005 that are denominated in foreign currencies. These contracts are accounted for as cash flow hedges. As cash flow hedges, the effective portion of the gain or loss on the contracts is reported in other comprehensive income (loss) and the ineffective portion is reported in income. Amounts in accumulated other comprehensive income (loss) are reclassified into income in the period that the hedged transactions affect earnings.

............................................................................................................ ..... Pensions and Post-Retirement Benefits
We and certain of our subsidiaries sponsor domestic and foreign defined benefit pension and other post-retirement plans. Major assumptions used in the accounting for these employee benefit plans include the discount rate, expected return on plan assets, rate of increase in employee compensation levels and assumed health care cost trend rates. Assumptions are determined based on data available to us and appropriate market indicators, and are evaluated each year as of the plans’ measurement date. A change in any of these assumptions could have a material effect on net periodic pension and post-retirement benefit costs reported in the Consolidated Statements of Operations, as well as amounts recognized in the Consolidated Balance Sheets. See Note 12 in the Consolidated Financial Statements for a discussion of pension and post-retirement benefits.
Income TaxesWe use the asset and liability method of accounting for income taxes. Temporary differences arising from the difference between the tax and book basis of an asset or liability are used to compute future tax assets or liabilities. Deferred tax assets and liabilities are measured using enacted tax rates expected to apply to the taxable income (losses) in the years in which those temporary differences are expected to be recovered or settled. The effect on deferred tax assets and liabilities from a change in tax rates is recognized in the period that includes the enactment date.
NEW ACCOUNTING PRONOUNCEMENTSSee Note 1 to the Consolidated Financial Statements for a description of new accounting pronouncements, including the respective expected dates of adoption, and the effects on results of operations, cash flows and financial condition, if any.
LIQUIDITY AND CAPITAL RESOURCESOperating Cash FlowsOperating activities provided $41.1 million and $44.0 million in 2004 and 2003, respectively, and $19.9 million in 2002. This includes a working capital increase of $5.4 million in 2004, compared to a decrease of $1.9 million in 2003 and a decrease of $31.8 million in 2002. The increase in working capital was the result of increased sales and manufacturing activity in 2004, when compared to 2003. Additionally, payments for asbestos-related claims settlements, net of insurance proceeds, during 2004 were $29.9 million compared to $25.7 million in 2003 and $34.4 million in 2002. In 2004 we received a payment of approximately $30 million pertaining to the resolution of the dispute with one of our London based insurance carriers, Equitas, on delinquent asbestos-related insurance receivables. However, net asbestos payments in 2004 were negatively impacted by a dispute between Garlock and its other London market carriers over documentation requirements and settlement standards. This dispute has since been resolved and, as a result, we received payment of $22 million of delinquent proceeds in the first quarter of 2005.
We are currently appealing several significant adverse asbestos verdicts. In some cases, the appeals will require the provision of security in the form of an appeal bond, potentially in amounts greater than the verdicts. We are required to provide collateral to secure the full amount of the bonds, which will restrict the usage of a significant amount of our cash for the entire periods of such appeals. The length of time can vary, and could be as long as two or three years. For example, in Los Angeles, we have posted a bond in the amount of $34.1 million to stay enforcement of a $22.6 million verdict. We are confident that we will prevail in the appeals, particularly on the issue of punitive damages. However, there can be no assurance that any or all of the appeals will be successful. Asbestos-related expenditures and the associated insurance is discussed further under “Contingencies – Asbestos,” included in this Management’s Discussion and Analysis of Financial Condition and Results of Operations.
Investing Cash FlowsWe used $26.8 million, $36.8 million and $33.2 million in investing activities in 2004, 2003 and 2002, respectively. Our recurring investing activities in 2004 primarily relate to capital expenditures of $36.9 million associated with our manufacturing facilities, compared to $22.7 million in 2003 and $19.6 million in 2002. In 2004 we received proceeds of $9.8 million primarily from the sale of a surplus building and the divesture of our Haber Tool and Sterling Die businesses. In 2003, we used $20.5 million of cash to acquire the Pikotek business and a small specialty sealing product line. In 2002, we purchased call options on Goodrich common stock for cash payments totaling $18.2 million to provide protection against the risk that the cash required to finance conversions of the TIDES could exceed the TIDES liquidation value.
The increase in capital expenditures in each year reflects our strategy to increase investments in our operations aimed at improving customer satisfaction, cost reductions and restructuring our operations.
/ Form 10-K: pages 16 / 17

............................................................................................................ ..... Financing Cash Flows
Financing activities used $3.9 million in 2004, compared to net cash provided by financing activities of $0.7 million and $53.0 mil-lion in 2003 and 2002, respectively. Financing cash flows in 2004 were impacted primarily by the repayment of certain industrial revenue bonds. Financing cash flows in 2003 were limited mainly to a partial purchase of the TIDES for approximately $3.5 mil-lion in cash, and a $4.7 million borrowing against a promissory note to purchase life insurance policies in connection with certain pre-retirement death benefits for our executive officers. The borrowing did not involve any cash inflows because we recorded a corresponding increase in cash surrender value that is reflected in operating cash flows. Prior to the Distribution in 2002, our cash disbursements and cash receipts were managed in a corporate cash concentration system. We describe this activity as net transfers (to) from Goodrich in our Consolidated Statements of Cash Flows. Under this process, Goodrich provided $54.3 million of cash in 2002 that was used primarily to fund operating cash requirements, including asbestos-related expenditures, capital expenditures, a portion of the call options paid prior to the Distribution, and to increase our cash balance as of the date of the Distribution.
Capital ResourcesOur primary U.S. subsidiaries executed a credit agreement dated May 16, 2002, for a senior secured revolving credit facility. Borrowings under the senior secured revolving credit facility would be collateralized by receivables, inventories, equipment, intellectual property, insurance receivables and all other personal property assets of EnPro and its U.S. subsidiaries and by a pledge of 65% of the capital stock of their direct foreign subsidiaries. The maximum available amount under the facility is $60 million. We have not borrowed against this credit facility.
Coltec has outstanding approximately $145 million of TIDES due April 15, 2028. The TIDES are convertible at the option of the holder into a combination of 0.955248 of a share of Goodrich common stock and 0.1910496 of a share of EnPro common stock. Should the holders exercise their right to convert the TIDES, Coltec would be required to deliver shares of Goodrich and EnPro common stock to the holders as promptly as practicable after the conversion date. The value of Goodrich and EnPro common stock may increase to a level where Coltec’s cost to acquire shares in a conversion could exceed, with no maximum, the $145 million aggregate liquidation value. Coltec has purchased call options on shares of Goodrich common stock with an exercise price of $52.34 per share (the conversion price), in an amount that would be required if all TIDES holders convert. Until they expire in March 2007, the call options provide protection against the risk that the cash required to finance conversions of the TIDES could exceed the TIDES liquidation value. The call options are derivative instruments and are carried at fair value in the Consolidated Balance Sheets with changes in the fair value reflected currently in our earnings. Such changes may have a material effect on our results of operations in a given period, but will not result in any cash obliga-tion. While we have hedged our exposure to conversion costs in excess of the aggregate liquidation value of the TIDES as described earlier, we cannot assure you that we will have the financial resources to redeem these securities or effectively hedge this exposure beyond the term of the call options.
In 2004, we paid an industrial revenue bond in the face amount of $2.5 million that was collateralized by a building sold in December 2003. Under the terms of the bond agreement, we were required to pay the bond within 180 days of closing the sale.
Goodrich offered to exchange new Goodrich debt securities for outstanding Coltec 7½% senior notes prior to the Distribu-tion. Goodrich acquired $296.9 million of Coltec 7½% senior notes tendered pursuant to the offer. The $3.1 million of Coltec 7½% senior notes that remained outstanding following completion of the exchange offer continue to be obligations of Coltec.
DividendsThe terms of the senior secured revolving credit facility as well as the terms of the TIDES impact directly or indirectly our ability to pay dividends. The senior secured revolving credit facility contains limitations on dividend payments. In connection with the TIDES, Coltec is entitled to withhold interest payments to Coltec Capital Trust for up to 20 quarters. If these interest payments are withheld, Coltec would be unable to pay dividends to EnPro, which could limit our ability to pay dividends to our shareholders during this period.

............................................................................................................ ..... CONTINGENCIES
GeneralVarious claims, lawsuits and administrative proceedings, all arising in the ordinary course of business with respect to commer-cial, product liability, asbestos and environmental matters, are pending or threatened against EnPro or its subsidiaries and seek monetary damages or other remedies. We believe that any liability that may finally be determined with respect to commercial and non-asbestos product liability claims should not have a material effect on our consolidated financial condition or results of operations. From time to time, we and our subsidiaries are also involved as plaintiffs in legal proceedings involving contract, patent protection, environmental and other matters.
EnvironmentalOur facilities and operations are subject to federal, state and local environmental and occupational health and safety require-ments of the U.S. and foreign countries. We take a proactive approach to ensure compliance with all environmental, health and safety laws as they relate to our manufacturing operations and in proposing and implementing any remedial plans that may be necessary. We also conduct comprehensive compliance and management system audits at our facilities to maintain compliance and improve operational efficiency.
Although we believe that past operations were in substantial compliance with the then applicable regulations, we or one of our subsidiaries have been notified that we are, or it is, among the potentially responsible parties for the cost of investigating and, in some cases, remediating contamination at 18 sites at which the costs are expected to exceed $100 thousand at each site. The majority of these sites relate to remediation projects at former operating facilities that were sold or closed and primarily deal with soil and groundwater remediation. Investigations have been completed for 14 sites and are in progress at four sites. The laws governing investigation and remediation of these sites can impose joint and several liability for the associated costs. Liability for these costs can be imposed on present and former owners or operators of the properties or on parties that generated the wastes that contributed to the contamination.
Our policy is to accrue environmental investigation and remediation costs when it is both probable that a liability has been incurred and the amount can be reasonably estimated. The measurement of the liability is based on an evaluation of currently available facts with respect to each individual situation and takes into consideration factors such as existing technology, pres-ently enacted laws and regulations and prior experience in remediation of contaminated sites. Liabilities are established for all sites based on the factors discussed above. As assessments and remediation progress at individual sites, these liabilities are reviewed periodically and adjusted to reflect additional technical data and legal information. As of December 31, 2004 and 2003, we had an accrued liability of $34.0 million and $35.4 million, respectively, for estimated future expenditures relating to environmental contingencies. Of this amount, $15.7 million represents our share of liability as a potentially responsible party at a former industrial property located in Farmingdale, New York. The amounts recorded in the condensed consolidated financial statements have been recorded on an undiscounted basis. Cash outflows for environmental remediation have been less than $2 million during each of the years 2004, 2003 and 2002.
We believe that our reserves are adequate based on currently available information. Actual costs to be incurred for identi-fied situations in future periods may vary from estimates because of the inherent uncertainties in evaluating environmental exposures due to unknown conditions, changing government regulations and legal standards regarding liability. Subject to the imprecision in estimating future environmental costs, we believe that maintaining compliance with current environmental laws and government regulations will not require significant capital expenditures or have a material adverse effect on our financial condition or cash flows, but could be material to our results of operations in a given period.
Colt Firearms and Central MoloneyWe have contingent liabilities related to divested businesses for which certain of our subsidiaries retained liability or are obligated under indemnity agreements. These contingent liabilities include, but are not limited to, potential product liability and associated claims related to Coltec’s former Colt Firearms subsidiary for firearms manufactured prior to its divestiture in 1990 and Coltec’s former Central Moloney subsidiary for electrical transformers manufactured prior to its divestiture in 1994. No material product liability claims are currently pending against Coltec related to Colt Firearms or Central Moloney. Colt Firearms has been named as a defendant in 37 cases filed by municipalities seeking to recover costs arising from gun-related injuries. Many of those cases have been dismissed or are inactive. The current owner of Colt Firearms is seeking indemnification from Coltec for these claims to the extent they involve firearms manufactured prior to March 1990. We have rejected Colt Firearms’ claims for indemnification relating to the municipal gun cases in all instances on various legal grounds. As a result, Colt Firearms has filed a lawsuit in New York State Court seeking reimbursement of costs incurred in defending municipal cases.
/ Form 10-K: pages 18 / 19

............................................................................................................ ..... Coltec also has ongoing obligations, which are included in retained liabilities of previously owned businesses in our condensed
consolidated balance sheets, with regard to workers’ compensation, retiree medical and other retiree benefit matters that relate to Coltec’s periods of ownership of these operations.
Crucible Materials CorporationThrough our Coltec subsidiary, we owned approximately 45% of the outstanding common stock of Crucible Materials Corpo-ration (“Crucible”) up until its sale in October 2004. Crucible, which is engaged primarily in the manufacture and distribution of high technology specialty metal products, was a wholly owned subsidiary of Coltec until 1985. Coltec sold the Crucible common shares that it owned to Crucible, and thus Coltec no longer has any ownership interest in Crucible. No gain or loss was recorded on the sale.
In conjunction with the closure of a Crucible plant in the early 1980s, Coltec was required to fund two irrevocable trusts for retiree medical benefits for union employees at the plant. The first trust (the “Benefits Trust”) pays for these retiree medical benefits on an ongoing basis. Coltec has no continuing connection to the Benefits Trust, and thus the assets and liabilities of this trust are not included in our condensed consolidated balance sheets. Under the terms of the Benefits Trust agreement, the trustees retained an actuary to assess the adequacy of the assets in the Benefits Trust in 1995, and another actuarial report will be required in 2005 and 2015. If, at either or both of the future valuation dates, it is determined that the trust assets are not adequate to fund the payment of future medical benefits, Coltec will be required to contribute additional amounts. Based on preliminary information, an additional contribution in 2005 is not anticipated. In the event there are ever excess assets in the Benefits Trust, those excess assets will not revert to Coltec.
Because of the possibility of future contributions to the Benefits Trust, Coltec was required to establish a second trust (the “Back-Up Trust”) to cover potential shortfalls in the Benefits Trust. The assets and a corresponding liability of the Back-Up Trust are reflected on our Consolidated Balance Sheets in other non-current assets and in retained liabilities of previously owned businesses, respectively, and amounted to $28.5 million each at December 31, 2004. If the actuary determines that there are excess assets in the Back-Up Trust at the Benefits Trust valuation dates in 2005 and 2015, the excess assets will revert to Coltec based on a distribution formula and will be recorded in income upon receipt. Until such time as payments are required or excess assets revert to Coltec, the assets and liability are kept equal to each other.
Coltec also has ongoing obligations, which are included in retained liabilities of previously owned businesses in the condensed consolidated balance sheets, with regard to workers’ compensation, retiree medical and other retiree benefit matters, in addition to those mentioned previously, that relate to its period of ownership of Crucible.
Debt and Capital Lease GuaranteesAs of December 31, 2004, we had contingent liabilities for potential payments on guarantees of certain debt and lease obliga-tions totaling $11.7 million. These guarantees arose from the divestiture of Crucible, Central Moloney and Haber, and expire at various dates through 2010. There is no liability for these guarantees reflected in our condensed consolidated balance sheets. In the event that the other parties do not fulfill their obligations under the debt or lease agreements, we could be responsible for these obligations.
Asbestos HISTORY. Certain of Coltec’s subsidiaries, primarily Garlock Sealing Technologies LLC (“Garlock”) and The Anchor Packing Company (“Anchor”), are among a large number of defendants in actions filed in various states by plaintiffs alleging injury or death as a result of exposure to asbestos fibers. Among the products at issue in these actions are industrial sealing products, predominantly gaskets and packing products. The damages claimed vary from action to action, and in some cases plaintiffs seek both compensatory and punitive damages. To date, neither Garlock nor Anchor has been required to pay any punitive damage awards, although there can be no assurance that they will not be required to do so in the future. Liability for compensatory damages has historically been allocated among all responsible defendants. Since the first asbestos-related lawsuits were filed against Garlock in 1975, Garlock and Anchor have processed more than 600,000 asbestos claims to conclusion (including judgments, settlements and dismissals) and, together with their insurers, have paid more than $1 billion in settlements and judgments and approximately $325 million in fees and expenses.
CLAIMS MIX. Of those claims resolved, approximately 3% have been claims of plaintiffs alleging the disease mesothelioma, approximately 6% have been claims of plaintiffs with lung or other cancers, and more than 90% have been claims of plaintiffs alleging asbestosis, pleural plaques or other impairment of the respiratory system. Out of the 133,000 open cases at December 31, 2004, we are aware of only approximately 6,300 that involve a claimant with mesothelioma, lung cancer or some other cancer.

............................................................................................................ ..... PRODUCT DEFENSES. The asbestos-containing products formerly sold by Garlock and Anchor were encapsulated, which
means the asbestos fibers were incorporated into the product during the manufacturing process and sealed in a binder. They were also nonfriable, which means they could not be crumbled by hand pressure. The U.S. Occupational Safety and Health Administration, which began generally requiring warnings on asbestos-containing products in 1972, has never required that a warning be placed on products such as Garlock’s gaskets. Even though no warning label was required, Garlock included one on all of its asbestos-containing products beginning in 1978. Further, gaskets such as those previously manufactured and sold by Garlock are one of the few asbestos-containing products still permitted to be manufactured under regulations of the Environmental Protection Agency. Garlock discontinued distributing asbestos-containing products in the U.S. during 2000 and worldwide in mid-2001. From the mid-1980s until 2000, U.S. sales of asbestos-containing industrial sealing products were not a material part of Garlock’s sales, and its sales of asbestos-containing products were predominantly to sophisticated purchasers such as the U.S. Navy and large petrochemical facilities. These purchasers generally have extensive health and safety procedures and are familiar with the risks associated with the use and handling of industrial sealing products that contain asbestos.
Garlock’s product defenses have enabled it to be successful at trial, winning defense verdicts in four of five cases tried to verdict in 2003, and receiving defense verdicts in five of eleven cases decided in 2004. In the successful jury trials, the juries determined that Garlock’s products were not defective and that Garlock was not negligent. In the cases decided by judges, the judges determined that the claimant failed to make a sufficient showing of exposure to Garlock’s products.
RECENT TRIAL RESULTS. During 2004, Garlock began seventeen trials involving twenty plaintiffs. Verdicts were rendered against Garlock in six cases. Garlock won defense verdicts with respect to three plaintiffs (in two trials) and the judge directed verdicts in favor of Garlock in two cases. There were two trials started in another case, both of which resulted in mistrials. Seven cases were settled during trial, and another case resulted in a hung jury.
An El Paso, Texas jury awarded a deceased 64-year-old pipe fitter $2.6 million in compensatory damages in April, allocating to Garlock a 25% share, and $1 million in punitive damages. In November, the trial court ruled that Garlock was entitled to a set-off for settlements collected from other defendants. The set-off exceeded the compensatory and punitive damage awards. As a result, the trial judge determined that Garlock owed no money on this award and did not enter a punitive damage judgment.
In May, a Baltimore jury returned a verdict against Garlock and two other defendants, assessing a one-third share to each, in favor of a 52-year-old boiler technician who died from mesothelioma. A judgment of $2.5 million was entered against Garlock.
In October, a Los Angeles jury returned a verdict that included an award of $7.6 million compensatory damages and $15 million punitive damages against Garlock in a case involving a 60-year-old machinist with mesothelioma.
In November, a jury in Niagara Falls, New York returned a verdict of $3.75 million against Garlock and one other defendant in a case involving a 79-year-old maintenance mechanic with mesothelioma. The jury assessed 60% liability against Garlock and 40% against the other defendant. Garlock is entitled to set-offs and, as a result, Garlock’s share of the verdict is approximately $1.8 million.
Garlock’s share of each of the other two verdicts (one in Cass County, Texas, and the other in Newport News, Virginia), after applicable set-offs and credits, will be less than $300,000.
Garlock is appealing each of the significant adverse verdicts against it. In some cases, particularly in respect of the Los Angeles verdict, such appeals will require the provision of security in the form of an appeal bond, potentially in amounts greater than the verdicts. We are required to provide cash collateral to secure the full amount of the bonds, which will restrict the usage of a significant amount of our cash for the entire periods of such appeals. The length of time can vary, and could be as long as two or three years. For example, in Los Angeles we have posted a bond in the amount of $34.1 million to stay enforcement of the $22.6 million verdict. We are confident that Garlock will prevail in the appeals, particularly on the issue of punitive damages. Garlock has a track record of success in a majority of its previous appeals. However, there can be no assurance that any or all of Garlock’s appeals will be successful.
SETTLEMENTS. Garlock settles and disposes of actions on a regular basis. Garlock’s historical settlement strategy has been to try to match the timing of payments with recoveries received from insurance, which are limited by agreement to an annual amount that is currently set at $86.4 million per year ($21.6 million per quarter). That limit increases every three years by 8%, and the next scheduled increase will take effect in the third quarter of 2006. In 1999 and 2000, Garlock implemented a short-term aggressive settlement strategy. The purpose of this short-term strategy was to achieve a permanent reduction in the number of overall asbestos claims through the settlement of a larger than normal number of claims, including some claims not yet filed as lawsuits.
/ Form 10-K: pages 20 / 21

............................................................................................................ ..... Due to this short-term aggressive settlement strategy and a significant overall increase in claims filings, the settlement amounts
paid in each of the years 1999 through 2004 were greater than the amounts paid in any year prior to 1999. In 2001, Garlock resumed its historical settlement strategy. In fact, Garlock reduced new settlement commitments from $180 million in 2000, to $94 million in 2001, $86.1 million in 2002, $85.7 million in 2003, and $83.8 million in 2004. Because many of the commitments made in 1999, 2000 and early 2001 are being paid over a number of years, the settlement amounts that Garlock will pay in 2005 will continue to include some amounts for those settlements, but those amounts will be smaller than in recent years.
Settlements are made without any admission of liability. Settlement amounts vary depending upon a number of factors, includ-ing the jurisdiction where the action was brought, the nature and extent of the disease alleged and the associated medical evidence, the age and occupation of the plaintiff, the presence or absence of other possible causes of the plaintiff ’s alleged illness, the availability of legal defenses, and whether the action is an individual one or part of a group.
Before any payment on a settled claim is made, the claimant is required to submit a medical report acceptable to Garlock sub-stantiating the asbestos-related illness and meeting specific criteria of disability. In addition, sworn testimony or other evidence that the claimant worked with or around Garlock asbestos-containing products is required. The claimant is also required to sign a full and unconditional release of Garlock, its subsidiaries, parent, officers, directors, affiliates and related parties from any liability for asbestos-related injuries or claims.
STATUS OF ANCHOR. Anchor is an inactive and insolvent indirect subsidiary of Coltec. There is no remaining insurance coverage available to Anchor. Anchor has not committed to settle any actions since 1998. As cases reach the trial stage, Anchor is typically dismissed without payment.
INSURANCE COVERAGE. In the second quarter of 2004, we reached agreement with Equitas, the London-based entity responsible for the pre-1993 Lloyds’ of London policies in our insurance block, concerning the settlement of its exposure to our subsidiaries’ asbestos claims. As a result of the settlement, Garlock received $30 million in payment of receivables in the third quarter of 2004, and another $88 million was placed in an independent trust. The funds in the trust are available to pay the Equitas share of future claims and the trust is billed monthly for that share, just as Equitas was billed. As a result of that agreement, the $118 million of payments made by Equitas commuted $158 million of total nominal coverage. The $40 million difference reflects discounting for present value and for the Equitas solvency risk. We expect a portion of the discounted amount to be recoverable from after-tax earnings on the trust assets. At December 31, 2004, the market value of the funds remaining in the trust was approximately $85 million.
In the fourth quarter of 2004, we reached agreement with a group of London market carriers (other than Equitas) and one of our U.S. carriers that has some policies reinsured through the London market. As a result of the settlement, which resolved a pending arbitration among the parties, in January 2005 Garlock received $22 million in payment of receivables and another $54.5 million was placed in an independent trust. As part of the settlement, Garlock received another $1 million from an insol-vent London carrier in February of 2005. The funds in the trust are available to pay the London carriers’ share of future claims and the trust will be billed monthly for that share, just as the carriers were billed. The $77.5 million of payments commuted $112.5 million of total nominal coverage. The $35 million difference reflects discounting for present value and for solvency and litigation risks. As with the Equitas trust, we expect a portion of the discounted amount to be recoverable from after-tax earnings on the trust assets.
The $22 million paid to Garlock in January 2005 by the London market carriers under the settlement agreement consists of approximately $15.6 million of the $86.4 million due under the cap agreement in 2004. As a result, Garlock had higher asbestos cash outflows in 2004 than in 2003. However, had the $22 million been received in 2004, Garlock’s net cash outflow for all asbestos-related claims and expenses would have been significantly less than the $35.5 million net cash outflow in 2003. As of December 31, 2004, after factoring in the amounts placed in trust as a result of the Equitas and London market settle-ments, Garlock had available $662.1 million of insurance and trust coverage that we believe will be available to cover future claim and expense payments. In addition, Garlock classifies $70.1 million of otherwise available insurance as insolvent. We believe Garlock will recover some of the insolvent insurance over time. In fact, Garlock recovered $2.2 million from insolvent carriers during 2004, $5.8 million during 2003, and $2.0 million during 2002.

............................................................................................................ ..... Of the $662 million of collectible insurance and trust assets, we consider $573 million (87%) to be high quality because it
is (a) with U.S.-based carriers whose credit rating by S&P is investment grade (BBB) or better, and whose AM Best rating is excellent (A-) or better ($411.5 million), (b) in the Equitas trust ($85 million), (c) in the London trust ($54.5 million), or (d) London insurance settlement payments ($22 million) already made. We consider $89 million (13%) to be of moderate quality because it is with (a) other solvent U.S. carriers who are unrated or below investment grade ($76 million) or (b) with various other London market carriers ($13 million). Of the $662 million, $218 million is allocated to claims that have been paid by Garlock and submitted to its insurance companies for reimbursement and $228 million is allocated to our estimated liability for future payments. Thus, as of December 31, 2004, $216 million remains available for additional future asbestos-related settlements.
Arrangements with Garlock’s insurance carriers limit the amount of insurance proceeds that it is entitled to receive in any one year. The amount of insurance available to cover asbestos-related payments by Garlock is currently limited to $86.4 million per year ($21.6 million per quarter). Because Garlock from time to time collects some insolvent insurance and because some of Garlock’s carriers pay as if there were no annual limit, Garlock receives amounts in excess of the limit in some periods. Amounts paid by Garlock in excess of insurance recoveries in any year that would be recoverable from insurance if there was no annual limit may be collected from the insurance companies in subsequent years so long as insurance is available, subject to the annual limit available in each subsequent year. To the extent that Garlock pays such amounts in a given year, these payments are recorded as a receivable.
In November 2003, Coltec received a letter and arbitration demand from one of its U.S.-based investment grade insurers claiming that the insurer was relieved of liability on a $40 million Coltec policy in connection with a 1998 settlement and payment in full by a related insurer of a $2 million Anchor policy. That insurer filed suit against Coltec in state court in New York in November 2004, making the same and other claims, and Coltec filed coverage litigation against the insurer in federal court in Pennsylvania in December 2004. Coltec intends to vigorously pursue the insurance coverage. The $40 million policy is included in Garlock’s $662 million remaining collectible coverage.
Insurance coverage for asbestos claims is not available to cover exposures initially occurring on and after July 1, 1984. Garlock and Anchor continue to be named as defendants in new actions, a few of which allege initial exposure after July 1, 1984. To date, no payments have been made with respect to these claims, pursuant to a settlement or otherwise. In addition, Garlock and Anchor believe that they have substantial defenses to these claims and therefore automatically reject them for settlement. However, there can be no assurance that any or all of these defenses will be successful in the future.
QUANTITATIVE CLAIMS INFORMATION. Due to their uncertain nature, management’s estimate of the liability for early-stage and unasserted claims covers a range of possible values, and we believe that no single amount in the range is a better estimate than any other amount in the range. Therefore, in accordance with applicable accounting rules, we recorded a liability at December 31, 2004, for $233.4 million, $90.6 million for advanced-stage cases and settled claims and $142.8 million for early-stage and future claims. We also recorded a corresponding receivable from our insurance carriers. The recorded amount for early-stage and unasserted claims is at the low end of the range of what we believe to be reasonably possible.
Our outside counsel retained the expert claims valuation firm Bates White, LLC, to review Garlock’s product history, histori-cal claims information and settlement experience and to assist and advise in connection with the management of Garlock asbestos claims and our estimation of Garlock’s liability for pending and reasonably estimable unasserted future asbestos claims. We received an opinion from Bates White dated February 17, 2005, to the effect that, “based on the range of events likely to transpire in the future, which are reasonably predicted for Garlock’s non-malignant claims through 2008 and for Garlock’s cancer claims through 2014, the reasonable and probable estimate of Garlock’s obligation for asbestos personal injury claims ranges from $226.5 million to $382.4 million.”
We have adopted the range predicted by our expert; however we note that Bates White also indicated the calculation of other potential estimates of Garlock’s future obligation for the period of the estimation that ranged from $197.2 million to $553.5 million. We caution that points within that broader range remain possible outcomes. Also, while we agree with our expert that “beyond 2008 for Garlock non-malignant claims and beyond 2014 for Garlock cancer claims, there are reasonable scenarios in which the [asbestos] expenditure is de minimus,” we caution that the process of estimating future liabilities is highly uncertain. In the words of the Bates White report, “the reliability of such estimates declines significantly for each year further into the future.” Plausible scenarios exist that could result in a total remaining asbestos liability for Garlock in excess of $1 billion, consistent with the high-end of management’s estimates provided in the previous two quarters.
/ Form 10-K: pages 22 / 23

............................................................................................................ ..... The recording of a liability for early-stage and unasserted claims does not alter our strategy for managing potential asbestos
liabilities and insurance assets and has no impact on the ultimate amount paid for asbestos-related claims against our subsidiar-ies. However, the recording of that liability could, at some time in the future, accelerate the timing of the recognition of charges to income for future asbestos claims. That would happen in the event the amount of the low end of our estimate of the liability for pending and unasserted claims increases to the point where it, when combined with the amount of insurance receivables that we have recorded, exceeds the total remaining amount of insurance we have available for the payment of such claims.
The table below quantitatively depicts the liability described above and the amount that we expect Garlock to recover from insurance related to this liability.
As of and for the Year Ended December 31, 2004 2003 2002
(number of cases)New Actions Filed During the Period (1) 17,400 44,700 41,700Open Actions at Period-End (1) 133,400 141,500 118,800
(dollars in millions at period-end)Estimated Amounts Recoverable from Insurance (2) $ 446.1 $ 324.0 $ 295.9Estimated Liability for Settled Claims and Actions in Advanced Stages of Processing (3) $ 90.6 $ 141.2 $ 138.8Estimated Liability for Early-Stage and Unasserted Cases (4) $ 142.8 $ – $ –
(dollars in millions)Payments (5) $ (122.8) $ (134.6) $ (146.3)Insurance Recoveries (5) 82.5 99.1 93.9
Net Cash Flows $ (40.3) $ (35.5) $ (52.4)
(1) Consists only of actions actually filed with a court of competent jurisdiction. Each action in which both Garlock and Anchor are named as a defendant is shown as a single action. Multiple actions filed by the same plaintiff in more than one jurisdic-tion are also counted as one action. Claims not filed as an action in court that were received and paid as part of inventory settlements (approximately 7,300 in 2004; 10,300 in 2003; and 15,600 in 2002) are not included.
(2) At December 31, 2004, the amount included $218 million representing cumulative payments made for which Garlock has not received a corresponding insurance recovery in part due to the annual limit imposed under Garlock’s insurance agreement and in part due to the dispute with its London market insurers. Also included at December 31, 2004, is $228 million representing amounts recoverable under insurance policies related to the estimated liability for settled claims, actions in advanced stages of processing, and for early-stage and unasserted claims. At December 31, 2004, we classified $109.9 million as a current asset and $336.2 million as a non-current asset in our Consolidated Balance Sheets.
(3) Includes amounts with respect to the estimated liability for settled claims and actions in advanced stages of processing, whether or not an action has actually been filed with a court of competent jurisdiction. At December 31, 2004, we classi-fied $74.0 million as a current liability and $16.6 million as a non-current liability in our Consolidated Balance Sheet.
(4) Includes an estimate of potential liabilities for early-stage cases and unasserted claims likely to be filed against Garlock in the future. The amount reflects the low end of an estimated range of potential liabilities, and we caution that future asbestos liabilities remain highly uncertain. At December 31, 2004, we classified this amount as a non-current liability in our Consolidated Balance Sheet.
(5) Includes amounts with respect to all payments for claims settlements and expenses and recoveries made in the period. At December 31, 2004, 2003 and 2002, we added $29.9 million, $25.7 million and $34.4 million, respectively, of the net cash flows to the asbestos insurance receivable in the condensed consolidated balance sheets, and we recorded $10.4 million, $9.8 mil-lion and $18 million, respectively, as an expense in our Consolidated Statements of Operations. This expense relates primarily to uninsured legal fees and administrative costs net of recoveries from insolvent insurance carriers.

............................................................................................................ ..... NEW FILINGS. As shown in the table, the number of new actions filed against our subsidiaries in 2004 was much lower than the
number in 2003 (17,400 compared to 44,700), and the lowest for any twelve-month period since the early 1990s. In fact, new filings have been significantly lower for the past six quarters than in the previous quarters of 2000 through 2003. Declining incidence of disease is but one possible factor in the decline. Other factors include, but are not limited to, tort reform in some high profile states, especially Mississippi and Texas, actions taken and rulings by some judges and court administrators that have the effect of limiting access to their courts for claimants without sufficient ties to the jurisdiction or claimants with no discernible disease, acceleration of current year claims into past years, and uncertainty about the potential for national asbestos reform legislation.
STRATEGY. Garlock’s current strategy is to focus on trial-listed cases and other cases in advanced stages of processing, to reduce new settlement commitments each year, to carefully manage and maximize insurance collections, and to proactively support legislative and other efforts aimed at asbestos reform. Garlock believes that this strategy should result in the reduction of the negative annual cash flow impact from asbestos claims, as previous settlements work their way through the payment process. Garlock believes that, as predicted in various epidemiological studies that are publicly available, the incidence of asbestos-related disease is in decline and should continue to decline steadily over the next decade and thereafter, so that the level of claims activity against Garlock will eventually decline to a level that can be paid from the cash flow expected from Garlock’s operations if Garlock exhausts its insurance coverage. There can be no assurance that epidemiological predictions about incidence of asbestos-related disease will prove to be accurate, or that, even if they are, there will be a commensurate decline in the number of asbestos-related claims filings.
Considering the foregoing, as well as the experience of Coltec’s subsidiaries and other defendants in asbestos litigation, the likely sharing of judgments among multiple responsible defendants, recent bankruptcies of other defendants, and legislative efforts, and given the amount of insurance coverage that Garlock expects to be available from its solvent carriers, we believe that pending actions against Garlock and Anchor are not likely to have a material adverse effect on our financial condition, but could be material to our results of operations or cash flows in a given period. We anticipate that asbestos-related actions will continue to be filed against Garlock. Because of the uncertainty as to the number and timing of potential future actions, as well as the amount that will have to be paid to settle or satisfy any such actions in the future and the finite amount of insurance available for future payments, those future actions could have a material adverse effect on our financial condition, results of operations and cash flows.
REFORM LEGISLATION. The outlook for federal legislation to provide national asbestos litigation reform continues to be uncertain. We are supportive generally of proposed legislation that would set up a national trust fund as the exclusive means for the recovery of asbestos-related claims. We are not certain as to what contributions we would be required to make to such a fund, although we anticipate that they would be substantial and that they would continue for a significant number of years. While we are cautiously optimistic that reform legislation ultimately will be adopted by the U.S. Congress, there is no assurance that proposed legislation currently under consideration by the Senate or any other asbestos legislation will ultimately become law.
OFF BALANCE SHEET ARRANGEMENTSLease AgreementsWe have several operating leases primarily for real estate, equipment and vehicles. Operating lease arrangements are generally utilized to secure the use of assets from time to time if the terms and conditions of the lease or the nature of the asset makes the lease arrangement more favorable than a purchase. As of December 31, 2004, approximately $43.6 million of future minimum lease payments were outstanding under these agreements. See Note 17, “Commitments and Contingencies – Other Commitments,” in the Consolidated Financial Statements for additional disclosure.
Debt and Capital Lease Guarantees At December 31, 2004, we have outstanding contingent liabilities for guaranteed debt and lease payments of $11.7 million related to previously divested businesses.
/ Form 10-K: pages 24 / 25

............................................................................................................ ..... CONTRACTUAL OBLIGATIONS
A summary of our contractual obligations and commitments at December 31, 2004, is as follows:
Payments Due by Period (in millions)Contractual Less than More thanObligations Total 1 Year 1-3 Years 4-5 Years 5 Years
Long-term debt $164.8 $ 0.2 $ – $12.7 $151.9Operating leases 43.6 8.8 13.9 10.2 10.7Other long-term liabilities 80.7 3.2 7.6 9.7 60.2
Total $289.1 $12.2 $21.5 $32.6 $222.8
Payments for other long-term liabilities are estimates of amounts that will be paid for environmental and retained liabilities of previously-owned businesses included in the Consolidated Balance Sheets at December 31, 2004. These estimated payments are based on information currently known to us. However, it is possible that these estimates will vary from actual results if new information becomes available in the future or if there are changes in the facts and circumstances related to these liabilities. Additional discussion regarding these liabilities is included earlier in this Management’s Discussion and Analysis of Financial Condi-tion and Results of Operations in “Contingencies – Environmental – Other Contingent Liability Matters,” and in Note 17 in the Consolidated Financial Statements.
OUTLOOK We continue to make progress in connection with our strategy to improve operating efficiency through our TCV initiative, to expand our product offerings and customer base, to strengthen the mix of our businesses, and to manage asbestos settlements by our subsidiaries. Our strong liquidity, cash flows and relatively low leverage ratio provide us with a sound financial base upon which we can build a stronger EnPro.
We expect sales to increase in 2005 compared to 2004, mainly due to improved volumes as our markets have shown signs of improvement, price increases and increased market share as a result of new products. Higher sales volumes, the benefits of our TCV lean manufacturing and restructuring initiatives and price increases are expected to result in improved operating margins and increased profitability in 2005. However, we are evaluating options for a substantial investment to upgrade a principal sealing products manufacturing facility that could result in restructuring expense in 2005 and for several years thereafter.
We anticipate that cash flows in 2005 will benefit from lower net asbestos payments and improved operating income. Capital spending in 2005 is expected to be comparable to 2004 levels as a result of continued investments to improve operational efficiency, cost reductions and new product development efforts.
As part of our operating strategy to strengthen our mix of businesses, we will continue to evaluate strategic acquisitions and divestitures in 2005; however, the impact of such acquisitions or divestitures cannot be predicted and therefore is not reflected in this outlook.
CERTAIN RISK FACTORS THAT MAY AFFECT FUTURE RESULTS In addition to the risks stated elsewhere in this annual report, set forth below are certain risk factors that we believe are material to our shareholders. If any of these risks occur, our business, financial condition, results of operations, cash flows and reputation could be harmed. You should also consider these risk factors when you read “forward-looking statements” elsewhere in this report. You can identify forward-looking statements by terms such as “may,” “hope,” “will,” “should,” “expect,” “plan,” “anticipate,” “intend,” “believe,” “estimate,” “predict,” or “continue,” the negative of those terms or other comparable terminology. Those forward-looking statements are only predictions and can be adversely affected if any of these risks occur.

............................................................................................................ ..... RISKS RELATED TO OUR BUSINESS
Certain of our subsidiaries are defendants in asbestos litigation.The historical business operations of certain Coltec subsidiaries, principally Garlock Sealing Technologies LLC and The Anchor Packing Company, have resulted in a substantial volume of asbestos litigation in which plaintiffs have alleged personal injury or death as a result of exposure to asbestos fibers. Those subsidiaries manufactured and/or sold industrial sealing products, predominately gaskets and packing products which contained encapsulated asbestos fibers. Anchor is an inactive and insolvent indirect subsidiary of Coltec. There is no remaining insurance coverage available to Anchor. Our subsidiaries’ exposure to asbestos litigation and their relationships with insurance carriers are actively managed through another Coltec subsidiary, Garrison Litigation Management Group, Ltd. Several risks and uncertainties may result in potential liabilities to us in the future that could have a material adverse effect on our business, financial condition, results of operations and cash flows. Those risks and uncertainties include the following:
• the potential for a large volume of future asbestos claims to the extent such claims are not covered by insurance because insurance coverage is, or will be, depleted;
• the uncertainty of the per claim value of pending and potential future asbestos claims;
• the timing of payout of claims relative to recoveries of amounts covered by insurance from our subsidiaries’ insurance carriers and limitations imposed on the amount that may be recovered in any given year;
• the financial viability of our subsidiaries’ insurance carriers and their reinsurance carriers, and our subsidiaries’ ability to collect on claims from them;
• an increase in litigation or other costs that are not covered by insurance;
• the unavailability of any insurance for claims alleging first exposure to asbestos after July 1, 1984;
• bankruptcies of other defendants; and
• the results of litigation.
Potential liability for asbestos claims may adversely affect our ability to retain and attract customers and quality personnel. To the extent our subsidiaries’ insurance is depleted or the payments required in any given year exceed the annual limitations on insurance recoveries from our subsidiaries’ carriers, our subsidiaries would be required to fund these obligations from available cash, even if such amounts are recoverable under these insurance policies in later years. This could adversely affect our ability to use cash for other purposes, including growth of our business, and adversely affect our financial condition.
In addition, our estimated liability for early-stage and potential future asbestos claims that may be received, which is highly uncertain, is based on subjective assumptions and is at the low end of a range of possible values. The actual liability could vary significantly from the estimate provided.
Our business and some of the markets we serve are cyclical and changes in general market conditions could have a material adverse effect on our business. The markets in which we sell our products, particularly chemical companies, petroleum refineries and the automotive industry, are, to varying degrees, cyclical and have historically experienced periodic downturns. Prior downturns have been character-ized by diminished product demand, excess manufacturing capacity and subsequent erosion of average selling prices in these markets resulting in negative effects on our net sales, gross margins and net income. Economic downturns or other material weakness in demand in any of these markets could have a material adverse effect on our business, financial condition, results of operations and cash flows.
We face intense competition that could have a material adverse effect on our business. We encounter intense competition in almost all areas of our business. Additionally, customers for many of our products are attempting to reduce the number of vendors from which they purchase in order to reduce inventories. To remain competitive, we need to invest continuously in manufacturing, marketing, customer service and support and our distribution networks. We may not have sufficient resources to continue to make such investments or maintain our competitive position. Additionally, some of our competitors are larger than we are and have substantially greater financial resources than we do. As a result, they may be better able to withstand the effects of periodic economic downturns. Pricing and other competitive pressures could adversely affect our business, financial condition, results of operations and cash flows.
/ Form 10-K: pages 26 / 27

............................................................................................................ ..... If we fail to retain the independent agents and distributors upon whom we rely to market our
products, we may be unable to effectively market our products and our revenue and profitability may decline. Our marketing success in the U.S. and abroad depends largely upon our independent agents’ and distributors’ sales and service expertise and relationships with customers in our markets. Many of these agents have developed strong ties to existing and potential customers because of their detailed knowledge of our products. A loss of a significant number of these agents or distributors, or of a particular agent or distributor in a key market or with key customer relationships, could significantly inhibit our ability to effectively market our products, which could have a material adverse effect on our business, financial condition, results of operations and cash flows.
Increased costs for raw materials or the termination of existing supply agreements could have a material adverse effect on our business.Our businesses rely on stable prices for energy, steel and other raw materials, the prices for which increased dramatically in 2004. While we have been successful in passing along a portion of these higher costs, there can be no assurance that we will be able to continue doing so without losing customers. Similarly, the loss of a key supplier could adversely affect our business, financial condition, results of operations and cash flows.
We have exposure to some contingent liabilities relating to discontinued operations, which could have a material adverse effect on our financial condition, results of operations or cash flows in any fiscal period. We have some contingent liabilities related to discontinued operations of our predecessors, including environmental liabilities and liabilities for certain products and other matters. In some instances, we have indemnified others against those liabilities, and in other instances, we have received indemnities from third parties against those liabilities.
Under federal and state environmental laws, Coltec or one of its subsidiaries has been named as a potentially responsible party at 18 sites at each of which the costs to it are expected to exceed $100,000. Investigations have been completed or are near completion for 14 of these sites and are in progress at the other four sites. The majority of these sites relate to remediation projects at former operating facilities that have been sold or closed and primarily deal with soil and groundwater contamination. We believe that any liability incurred for cleanup at these sites will be satisfied over a number of years, and, in some cases, the costs will be shared with other potentially responsible parties.
Claims could arise relating to products or other matters related to our discontinued operations. Some of these claims could seek substantial monetary damages. Specifically, we may potentially be subject to the liabilities related to the firearms manufactured prior to 1990 by Colt Firearms, a former operation of Coltec, and for electrical transformers manufactured prior to 1994 by Central Maloney, another former Coltec operation. Coltec also has ongoing obligations with regard to workers compensation, retiree medical and other retiree benefit matters associated with discontinued operations that relate to Coltec’s periods of ownership of those operations.
We have insurance, reserves and funds held in trust to address these liabilities. However, if our insurance coverage is depleted, our reserves are not adequate or the funds held in trust are insufficient, environmental and other liabilities relating to discon-tinued operations could have a material adverse effect on our financial condition, results of operations and cash flows.
We conduct a significant amount of our sales activities outside of the U.S., which subjects us to additional business risks that may cause our profitability to decline. Because we sell our products in a number of foreign countries, we are subject to risks associated with doing business internationally. In 2004, we derived approximately 41% of our revenues from sales of our products outside of the U.S. Our international operations are, and will continue to be, subject to a number of risks, including:
• unfavorable fluctuations in foreign currency exchange rates;
• adverse changes in foreign tax, legal and regulatory requirements;
• difficulty in protecting intellectual property;
• trade protection measures and import or export licensing requirements;
• differing labor regulations;
• political and economic instability; and
• acts of hostility, terror or war.

............................................................................................................ ..... Any of these factors, individually or together, could have a material adverse effect on our business, financial condition, results
of operations and cash flows.
We intend to continue to pursue international growth opportunities, which could increase our exposure to risks associated with international sales and operations. As we expand our international operations, we may also encounter new risks that could adversely affect our revenues and profitability. For example, as we focus on building our international sales and distribution net-works in new geographic regions, we must continue to develop relationships with qualified local agents, distributors and trading companies. If we are not successful in developing these relationships, we may not be able to increase sales in these regions.
If we are unable to protect our intellectual property rights and knowledge relating to our products, our business and prospects may be negatively impacted. We believe that proprietary products and technology are important to our success. If we are unable to adequately protect our intellectual property and know-how, our business and prospects could be negatively impacted. Our efforts to protect our intellectual property through patents, trademarks, service marks, domain names, trade secrets, copyrights, confidentiality, non-compete and nondisclosure agreements and other measures may not be adequate to protect our proprietary rights. Patents issued to third parties, whether before or after the issue date of our patents, could render our intellectual property less valuable. Questions as to whether our competitors’ products infringe our intellectual property rights or whether our products infringe our competitors’ intellectual property rights may be disputed. In addition, intellectual property rights may be unavailable, limited or difficult to enforce in some jurisdictions, which could make it easier for competitors to capture market share in those jurisdictions.
Our competitors may capture market share from us by selling products that claim to mirror the capabilities of our products or technology without infringing upon our intellectual property rights. Without sufficient protection nationally and internationally for our intellectual property, our competitiveness worldwide could be impaired, which would negatively impact our growth and future revenue. As a result, we may be required to spend significant resources to monitor and police our intellectual property rights.
RISKS RELATED TO OWNERSHIP OF OUR COMMON STOCKThe market price and trading volume of our common stock may be volatile. A relatively small number of shares traded in any one day could have a significant effect on the market price of our common stock. The market price of our common stock could fluctuate significantly for many reasons, including in response to the risks described in this section and elsewhere in this report or for reasons unrelated to our operations, such as reports by industry analysts, investor perceptions or negative announcements by our customers, competitors or suppliers regarding their own performance, as well as industry conditions and general financial, economic and political instability. In particular, reports concerning the possibility of national asbestos litigation reform could cause a significant increase or decrease in the market price of our common stock.
Because our quarterly revenues and operating results may vary significantly in future periods, our stock price may fluctuate. Our revenue and operating results may vary significantly from quarter to quarter. A high proportion of our costs are fixed, due in part to significant selling and manufacturing costs. Small declines in revenues could disproportionately affect operating results in a quarter and the price of our common stock may fall. Other factors that could affect quarterly operating results include, but are not limited to:
• demand for our products;
• the timing and execution of customer contracts;
• the timing of sales of our products;
• payments related to asbestos litigation or annual costs related to asbestos litigation that are not covered by insurance or that exceed the annual limits in place with our insurance;
• the timing of receipt of insurance proceeds;
• changes in the fair value of call options on Goodrich common stock purchased by Coltec to reduce the economic risk of the conversion feature of the TIDES;
• increases in manufacturing costs due to equipment or labor issues;
/ Form 10-K: pages 28 / 29

............................................................................................................ ..... • changes in foreign currency exchange rates;
• unanticipated delays or problems in introducing new products;
• announcements by competitors of new products, services or technological innovations;
• changes in our pricing policies or the pricing policies of our competitors;
• increased expenses, whether related to sales and marketing, raw materials or supplies, product development or administration;
• major changes in the level of economic activity in the U.S., Canada, Europe and other major regions in which we do business;
• costs related to possible future acquisitions of technologies or businesses;
• an increase in the number or magnitude of product liability claims;
• our ability to expand our operations and the amount and timing of expenditures related to expansion of our operations, particularly outside the United States; and
• economic assumptions and market factors used to determine post-retirement benefits and pension liabilities.
Various provisions and laws could delay or prevent a change of control that you may favor. The anti-takeover provisions of our articles of incorporation and bylaws, our shareholder rights plan and provisions of North Carolina law could delay or prevent a change of control that you may favor or may impede the ability of the holders of our common stock to change our management. In particular, our articles of incorporation and bylaws, among other things, will:
• require a supermajority shareholder vote to approve any business combination transaction with an owner of 5% or more of our shares unless the transaction is recommended by disinterested directors;
• divide our board of directors into three classes, with members of each class to be elected for staggered three-year terms, if our board is expanded to nine members;
• limit the right of shareholders to remove directors and fill vacancies;
• regulate how shareholders may present proposals or nominate directors for election at shareholders’ meetings; and
• authorize our board of directors to issue preferred stock in one or more series, without shareholder approval.
Our shareholder rights plan will also make an acquisition of a controlling interest in EnPro in a transaction not approved by our board of directors more difficult.
RISKS RELATED TO OUR CAPITAL STRUCTUREOur debt agreements impose limitations on our operations, which could impede our ability to respond to market conditions, address unanticipated capital investments and/or pursue business opportunities. The agreements relating to the TIDES and the 7½% Coltec Senior Notes impose limitations on our operations. We also have a senior secured revolving credit facility that imposes additional and, in some cases, more restrictive limitations. These limitations could impede our ability to respond to market conditions, address unanticipated capital investment needs and/or pursue business opportunities.
We may not have adequate cash or the ability to finance conversions of the TIDES. Until April 15, 2028, each TIDES is convertible at the option of the holder into a combination of 0.955248 of a share of Goodrich common stock and 0.1910496 of a share of EnPro common stock. Should the holders of the TIDES exercise their right to convert the TIDES, Coltec would be required to deliver shares of Goodrich and EnPro common stock to the hold-ers as promptly as practicable on or after the conversion date and in connection therewith would be required to purchase shares of Goodrich common stock on the open market, directly from Goodrich or by exercising its call options on Goodrich common stock discussed below. Coltec may not have sufficient cash on hand or the ability to finance these transactions in the time period required by the agreements relating to the TIDES. Failure to honor conversion rights would be a default under the TIDES agreements.

............................................................................................................ ..... Further, the value of Goodrich and EnPro common stock may increase to a level where Coltec’s cost to acquire shares in a
conversion could exceed, with no maximum, the aggregate liquidation value of the TIDES of $145 million. Coltec has purchased call options on shares of Goodrich common stock with an exercise price of $52.34 per share (the conversion price), in an amount that would be required if all TIDES holders convert. Until they expire in March 2007, the call options provide protection against the risk that the cash required to finance conversions of the TIDES could exceed their liquidation value. While Coltec has hedged its exposure to conversion costs in excess of the aggregate liquidation value of the TIDES, as described earlier, we cannot be certain that Coltec will have the financial resources to redeem these securities or effectively hedge its exposure to potential conversion costs in excess of the aggregate liquidation value of the TIDES beyond the term of the call options.
EnPro, Goodrich, Coltec and Coltec Capital Trust have entered into an indemnification agreement with respect to the TIDES under which EnPro, Coltec and Coltec Capital Trust will indemnify Goodrich from any costs and liabilities that Goodrich incurs as a result of its earlier guarantee of Coltec and Coltec Capital Trust’s obligations under the TIDES. Such indemnification obligations may result in payments that could have a material adverse effect on our financial condition, results of operations and cash flows.
RISKS RELATED TO OUR SPIN-OFF FROM GOODRICH CORPORATIONColtec’s historical consolidated financial information may not be representative of our historical results as an independent company; therefore, it may not be reliable as an indicator of historical or future results. The historical consolidated financial information of our wholly owned subsidiary Coltec included in this report may not reflect what our financial condition, results of operations and cash flows would have been on a historical basis had we operated the EnPro business as an independent company during the periods presented or what our financial condition, results of operations and cash flows will be in the future. This is because Coltec’s historical consolidated financial statements include allocations for services provided or procured by Goodrich. In addition, we have not made adjustments to Coltec’s historical consolidated financial information to reflect other changes that occurred in our cost structure, financing and operations as a result of the Distribution. Finally, as a result of the Distribution, Goodrich, not EnPro, owns Coltec’s aerospace business which is reflected in Coltec’s historical consolidated financial information as a discontinued operation. Therefore, Coltec’s historical consolidated financial statements may not be indicative of our future performance as an independent company.
ITEM 7A. QUANTITATIVE AND QUALITATIVE DISCLOSURES ABOUT MARKET RISK
We are exposed to certain market risks as part of our ongoing business operations, including risks from changes in interest rates and foreign currency exchange rates that could impact our financial condition, results of operations and cash flows. We plan to manage our exposure to these and other market risks through regular operating and financing activities, and on a limited basis, through the use of derivative financial instruments. We intend to use such derivative financial instruments as risk management tools and not for speculative investment purposes.
Interest Rate RiskWe are exposed to interest rate risk as a result of our outstanding debt obligations. The table below provides information about our debt obligations as of December 31, 2004. The table represents principal cash flows and related weighted average interest rates by expected (contractual) maturity dates.
2005 2006 2007 2008 2009 Thereafter Total Fair Value
Fixed Rate Debt $0.2 $ – $ – $3.1 $9.6 $145.0 $157.9 $152.5 Average Interest Rate 3.4% – – 7.5% 6.5% 5.3% 5.4%Variable Rate Debt $ – $ – $ – $ – $ $ 6.9 $ 6.9 $ 6.9 Average Interest Rate (1) – – – – – 3.1% 3.1%
(1) The average interest rate is based on the actual interest rate as of December 31, 2004.
/ Form 10-K: pages 30 / 31
............................................................................................................ ..... Foreign Currency Risk
We are exposed to foreign currency risks that arise from normal business operations. These risks include the translation of local currency balances of our foreign subsidiaries, intercompany loans with foreign subsidiaries and transactions denominated in foreign currencies. Our objective is to control our exposure to these risks through our normal operating activities and, where appropriate, through foreign currency forward or option contracts. The following table provides information about our outstanding foreign currency forward contracts as of December 31, 2004.
Notional Amount Outstanding in millions of U.S.Transaction Type dollars (USD) Maturity Dates Exchange Rate Ranges
Forward Contracts Buy koruna/sell euro $15.9 Jan 2005 – Dec 2005 38.87 to 39.88 koruna/euro Buy USD/sell Canadian dollar 13.8 Jan 2005 – Dec 2005 1.321 to 1.327 Canadian dollar/USD Buy USD/sell euro 11.6 Jan 2005 – Dec 2005 1.233 to 1.236 USD/euro Buy euro/sell USD 7.3 Jan 2005 – Feb 2005 1.237 to 1.340 USD/euro
$48.6
ITEM 8. FINANCIAL STATEMENTS AND SUPPLEMENTAL DATA
ENPRO INDUSTRIES, INC.
Index to Consolidated Financial Statements Page
Reports of Independent Registered Public Accounting Firms ........................................................................................................... 40
Consolidated Statements of Operations for the Years Ended December 31, 2004, 2003 and 2002 .......................... 42
Consolidated Statements of Cash Flows for the Years Ended December 31, 2004, 2003 and 2002 .......................... 43
Consolidated Balance Sheets as of December 31, 2004 and 2003 ................................................................................................ 44
Consolidated Statements of Changes in Shareholders’ Equity for the Years Ended December 31, 2004, 2003 and 2002 ............................................................................................................................ 45
Notes to Consolidated Financial Statements .............................................................................................................................................. 46
ITEM 9. CHANGES IN AND DISAGREEMENTS WITH ACCOUNTANTS ON ACCOUNTING AND FINANCIAL DISCLOSURE
On March 8, 2004, we filed a report on Form 8-K/A reporting that Ernst & Young LLP completed its engagement as our independent auditors on March 3, 2004, and that PricewaterhouseCoopers LLP had been engaged as our new independent registered public accounting firm for the year beginning January 1, 2004.

............................................................................................................ ..... ITEM 9A. CONTROLS AND PROCEDURES
Disclosure Controls and ProceduresAs of the end of the period covered by this report, we carried out an evaluation, under the supervision and with the participa-tion of our chief executive officer and chief financial officer, of the effectiveness of the design and operation of our disclosure controls and procedures. The purpose of our disclosure controls and procedures is to provide reasonable assurance that information required to be disclosed in our reports filed under the Exchange Act, including this report, is recorded, processed, summarized and reported within the time periods specified, and that such information is accumulated and communicated to our management to allow timely decisions regarding disclosure. Our disclosure controls also include components of our internal control over financial reporting.
Management does not expect that our disclosure controls and procedures or internal controls will prevent all errors and all fraud. A control system, no matter how well conceived or operated, can provide only reasonable, not absolute, assurance that the objectives of the control system are met. Further, the design of a control system must reflect the fact that there are resource constraints, and the benefits of controls must be considered relative to their costs. Because of the inherent limitations in all control systems, no evaluation of controls can provide absolute assurance that all control issues and instances of fraud, if any, within the company have been detected. These inherent limitations include the realities that judgments in decision-making can be faulty and that breakdowns can occur because of a simple error or mistake. Controls can also be circumvented by the individual acts of some persons, by collusion of two or more people, or by management override of the controls. The design of any system of controls is based in part on certain assumptions about the likelihood of future events, and there can be no assurance that any design will succeed in achieving its stated goals under all potential future conditions. Over time, controls may become inadequate because of changes in conditions or deterioration in the degree of compliance with polices or procedures. Because of the inherent limitations in a cost-effective control system, misstatements due to error or fraud may occur and not be detected.
Based on the controls evaluation and subject to the limitations noted above, our chief executive officer and chief financial officer have concluded that our disclosure controls and procedures are effective to reasonably ensure that information required to be disclosed in our reports filed under the Exchange Act is recorded, processed, summarized and reported within the time periods specified, and that management will be timely alerted to material information required to be included in our periodic reports filed with the Securities and Exchange Commission. In addition, no change in our internal control over financial reporting has occurred during, or subsequent to, the period covered by this report that has materially affected, or is reasonably likely to materially affect, our internal control over financial reporting.
Management’s Report on Internal Control over Financial ReportingOur management is responsible for establishing and maintaining adequate internal control over financial reporting, as such term is defined in Rule 13a-15(f) under the Exchange Act. Our internal control system was designed to provide reasonable assur-ance to our management and Board of Directors regarding the reliability of financial reporting and the preparation of financial statements for external purposes in accordance with genarally accepted accounting principles. Because of its inherent limita-tions, internal control over financial reporting may not prevent or detect misstatements. Also, projections of any evaluation of effectiveness to future periods are subject to the risk that controls may become inadequate because of changes in conditions, or that the degree of compliance with policies and procedures may deteriorate. Therefore, even those systems determined to be effective can provide only reasonable assurance with respect to financial statement preparation and presentation.
We carried out an evaluation, under the supervision and with the participation of our chief executive officer and our chief financial officer, of the effectiveness of our internal control over financial reporting as of the end of the period covered by this report. In making this assessment, we used the criteria set forth by the Committee of Sponsoring Organizations of the Treadway Commission (COSO) in Internal Control-Integrated Framework. Based on our assessment, we have concluded that, as of December 31, 2004, our internal control over financial reporting was effective based on those criteria.
Management’s assessment of the effectiveness of EnPro’s internal control over financial reporting as of December 31, 2004 has been audited by PricewaterhouseCoopers LLP, our independent registered public accounting firm, as stated in their report which appears on page 40.
ITEM 9B. OTHER INFORMATION
We disclosed in reports on Form 8-K all information required to be disclosed in such reports during the fourth quarter of 2004.
/ Form 10-K: pages 32 / 33

............................................................................................................ ..... PART III
ITEM 10. DIRECTORS AND EXECUTIVE OFFICERS OF THE REGISTRANT
Information concerning our directors and officers appearing under the captions “Nominees for Election” and “Legal Proceed-ings,” and information under the caption “Section 16(a) Beneficial Ownership Reporting Compliance” in our definitive proxy statement for the 2005 annual meeting of shareholders to be held on May 10, 2005, is incorporated herein by reference. Information regarding our officers included in Part I of this annual report under the heading “Executive Officers of the Regis-trant” is incorporated herein by reference.
We adopted a written Code of Business Conduct that applies to all of our directors, officers and employees, including our principal executive officer, principal financial officer, principal accounting officer and controller. The Code is available on our Internet site at www.enproindustries.com. We intend to disclose on our Internet site any substantive changes to the Code and any waivers granted under the Code to the specified officers.
Information concerning the determination by our Board of Directors that a financial expert serves on our Audit and Risk Management Committee, which appears under the caption “Governance of the Company – Determination With Respect to Audit Committee Financial Expert” in our definitive proxy statement for the 2005 annual meeting of shareholders to be held on May 10, 2005, is incorporated herein by reference.
ITEM 11. EXECUTIVE COMPENSATION
A description of the compensation of our executive officers is set forth under the caption “Executive Compensation” in our definitive proxy statement for the 2005 annual meeting of shareholders to be held on May 10, 2005, and is incorporated herein by reference.
ITEM 12. SECURITY OWNERSHIP OF CERTAIN BENEFICIAL OWNERS AND MANAGEMENT AND RELATED SHAREHOLDER MATTERS
Security ownership data appearing under the captions “Holdings of Company Equity Securities by Directors and Executive Officers” and “Beneficial Ownership of Securities” in our definitive proxy statement for the 2005 annual meeting of sharehold-ers to be held May 10, 2005, is incorporated herein by reference.
ITEM 13. CERTAIN RELATIONSHIPS AND RELATED TRANSACTIONS
We have no relationships or transactions to report under this Item 13.
ITEM 14. PRINCIPAL ACCOUNTANT FEES AND SERVICES
Information appearing under the caption “Independent Auditors” in our definitive proxy statement for the 2005 annual meeting of shareholders to be held on May 10, 2005, is incorporated herein by reference.

............................................................................................................ ..... PART IV
ITEM 15. EXHIBITS AND FINANCIAL STATEMENT SCHEDULES
(a) The following documents are filed as part of this report:
1. Financial Statements
The financial statements filed as part of this report are listed in Part II, Item 8 of this report on the Index to Consolidated Financial Statements.
2. Financial Statement Schedules
Schedule II – Valuation and Qualifying Accounts for the years ended December 31, 2004, 2003 and 2002 appears on page 75.
Other schedules are omitted because of the absence of conditions under which they are required or because the required information is provided in the Consolidated Financial Statements or notes thereto.
3. Exhibits
The exhibits to this report on Form 10-K are listed in the Exhibit Index appearing on pages 36 to 39.
/ Form 10-K: pages 34 / 35

............................................................................................................ ..... SIGNATURES
Pursuant to the requirements of the Securities Exchange Act of 1934, the registrant has duly caused this report to be signed on its behalf by the undersigned, thereunto duly authorized, in the City of Charlotte, North Carolina on this 14th day of March, 2005.
ENPRO INDUSTRIES, INC.
By: /s/ Richard L. Magee Richard L. MageeDate: March 14, 2005 Senior Vice President, General Counsel and Secretary
By: /s/ William Dries William Dries Senior Vice President and Chief Financial Officer (Principal Accounting Officer)
Pursuant to the requirements of the Securities Exchange Act of 1934, this report has been signed below by the following persons, or in their behalf by their duly appointed attorney-in-fact, on behalf of the registrant in the capacities and on the date indicated.
Signatures Title Date
/s/ Ernest F. Schaub President and March 14, 2005Ernest F. Schaub Chief Executive Officer (Principal Executive Officer) and Director
/s/ William Dries Senior Vice President and Chief March 14, 2005William Dries Financial Officer (Principal Accounting Officer)
/s/ William R. Holland Chairman of the Board and Director March 14, 2005William R. Holland*
/s/ J. P. Bolduc Director March 14, 2005J. P. Bolduc* /s/ Peter C. Browning Director March 14, 2005Peter C. Browning* /s/ Joe T. Ford Director March 14, 2005Joe T. Ford* /s/ James H. Hance, Jr. Director March 14, 2005James H. Hance, Jr.* /s/ Gordon D. Harnett Director March 14, 2005Gordon D. Harnett*
* By: /s/ Richard L. MageeRichard L. Magee, Attorney-in-Fact
............................................................................................................ ..... EXHIBIT INDEX
2 Distribution Agreement between Goodrich Corporation, EnPro Industries, Inc. and Coltec Industries Inc (incorporated by reference to Exhibit 2 to the Form 10-Q for the quarter ended June 30, 2002 filed by EnPro Industries, Inc.)
3.1 Restated Articles of Incorporation of EnPro Industries, Inc., as amended (incorporated by reference to Exhibits 4.3 and 4.4 to the Registration Statement on Form S-8 filed by EnPro Industries, Inc., the EnPro Industries, Inc. Retirement Savings Plan for Hourly Workers and the EnPro Industries, Inc. Retirement Savings Plan for Salaried Workers (File No. 333-89576))
3.2 Amended Bylaws of EnPro Industries, Inc. (incorporated by reference to Exhibit 4.5 to the Registration Statement on Form S-8 filed by EnPro Industries, Inc., the EnPro Industries, Inc. Retirement Savings Plan for Hourly Workers and the EnPro Industries, Inc. Retirement Savings Plan for Salaried Workers (File No. 333-89576))
4.1 Form of certificate representing shares of common stock, par value $0.01 per share, of EnPro Industries, Inc. (incorpo-rated by reference to Amendment No. 4 of the Registration Statement on Form 10 of EnPro Industries, Inc. (File No. 001-31225))
4.2 Rights Agreement between EnPro Industries, Inc. and The Bank of New York, as rights agent (incorporated by reference to Exhibit 4.7 to the Registration Statement on Form S-8 filed by EnPro Industries, Inc., the EnPro Industries, Inc. Retire-ment Savings Plan for Hourly Workers and the EnPro Industries, Inc. Retirement Savings Plan for Salaried Workers (File No. 333-89576))
4.3 Certificate of Trust of Coltec Capital Trust (incorporated by reference to Exhibit 4.1 to Coltec Industries Inc’s Registra-tion Statement on Form S-3 (File No. 333-52975))
4.4 Amended and Restated Declaration of Trust of Coltec Capital Trust dated as of April 14, 1998, among Coltec Industries Inc, as Sponsor, The Bank of New York, as Property Trustee, and The Bank of New York (Delaware), as Delaware Trustee and the individuals named therein as Administrative Trustees (incorporated by reference to Exhibit 4.2 to Coltec Industries Inc’s Registration Statement on Form S-3 (File No. 333-52975))
4.5 Form of 5¼% Convertible Preferred Securities (included in Exhibit 4.4 above)
4.6 Indenture dated as of April 14, 1998, between Coltec Industries Inc and The Bank of New York, as Trustee, relating to the 5¼% Convertible Junior Subordinated Deferrable Interest Debentures due 2028 (incorporated by reference to Exhibit 4.3 to Coltec Industries Inc’s Registration Statement on Form S-3 (File No. 333-52975))
4.7 First Supplemental Indenture, dated as of July 12, 1999, between The B.F. Goodrich Company and The Bank of New York, as trustee (incorporated by reference to Amendment No. 1 of the Registration Statement on Form 10 of EnPro Industries, Inc. (File No. 001-31225))
4.8 Form of 5¼% Convertible Junior Subordinated Deferrable Interest Debenture Due 2028 (included in Exhibit 4.6 above)
4.9 Guarantee Agreement, dated as of April 14, 1998, between Coltec Industries Inc and The Bank of New York, as Trustee (incorporated by reference to Exhibit 4.6 to Coltec Industries Inc’s Registration Statement on Form S-3 (No. 333-52975))
4.10 Guarantee Agreement, dated as of July 12, 1999, between The B.F. Goodrich Company and The Bank of New York, as trustee (incorporated by reference to Amendment No. 1 of the Registration Statement on Form 10 of EnPro Industries, Inc. (File No. 001-31225))
4.11 Guarantee Agreement, dated as of May 31, 2002, between EnPro Industries, Inc. and The Bank of New York, as trustee (incorporated by reference to Exhibit 4.11 to the Form 10-K for the year ended December 31, 2002 filed by EnPro Industries, Inc.)
4.12 Second Supplemental Indenture, dated as of May 31, 2002, among Coltec Industries Inc, EnPro Industries, Inc., Goodrich Corporation and The Bank of New York, as trustee (incorporated by reference to Exhibit 4.12 to the Form 10-K for the year ended December 31, 2002 filed by EnPro Industries, Inc.)
4.13 Indenture dated as of April 16, 1998, between Coltec Industries Inc and Bankers Trust Company as Trustee, relating to the Coltec Industries Inc 7½% Senior Notes due 2008 (incorporated by reference to Exhibit 4.1 to Coltec Industries Inc’s Registration Statement on Form S-4 (File No. 333-53005))
4.14 Form of 7½% Senior Note due 2008 (included in Exhibit 4.13 above)
/ Form 10-K: pages 36 / 37

............................................................................................................ ..... 10.1 Tax Matters Arrangements between Goodrich Corporation and EnPro Industries, Inc. (incorporated by reference to
Exhibit 10.1 to the Form 10-Q for the quarter ended June 30, 2002 filed by EnPro Industries, Inc.)
10.2 Indemnification Agreement among Goodrich Corporation, EnPro Industries, Inc., Coltec Industries Inc and Coltec Capital Trust (incorporated by reference to Exhibit 10.4 to the Form 10-Q for the quarter ended June 30, 2002 filed by EnPro Industries, Inc.)
10.3 Form of Indemnification Agreement for directors and officers (incorporated by reference to Exhibit 10.5 to Amend-ment No. 3 of the Registration Statement on Form 10 of EnPro Industries, Inc. (File No. 001-31225))
10.4+ EnPro Industries, Inc. Amended and Restated 2002 Equity Compensation Plan (incorporated by reference to Exhibit 10.8 to the Form 10-K for the year ended December 31, 2002 filed by EnPro Industries, Inc.)
10.5+ EnPro Industries, Inc. Senior Executive Annual Performance Plan (incorporated by reference to Appendix B to the Proxy Statement on Schedule 14A dated March 22, 2004 filed by EnPro Industries, Inc.)
10.6+ EnPro Industries, Inc. Long-Term Incentive Plan (incorporated by reference to Appendix C to the Proxy Statement on Schedule 14A dated March 22, 2004 filed by EnPro Industries, Inc.)
10.7+ Form of EnPro Industries, Inc. Long-Term Incentive Plan Award Grant (incorporated by reference to Exhibit 99.1 to the Form 8-K dated February 22, 2005 filed by EnPro Industries, Inc.)
10.8+ Form of EnPro Industries, Inc. Phantom Share Award Grant for Outside Directors (incorporated by reference to Exhibit 99.2 to the Form 8-K dated February 22, 2005 filed by EnPro Industries, Inc.)
10.9+ EnPro Industries, Inc. Performance Share Deferred Compensation Program (incorporated by reference to Exhibit 10.12 to Amendment No. 4 of the Registration Statement on Form 10 of EnPro Industries, Inc. (File No. 001-31225))
10.10+ EnPro Industries, Inc. Deferred Compensation Plan (incorporated by reference to Exhibit 10.13 to Amendment No. 4 of the Registration Statement on Form 10 of EnPro Industries, Inc. (File No. 001-31225))
10.11+ EnPro Industries, Inc. Deferred Compensation Plan for Non-Employee Directors (as amended and restated effective March 1, 2004) (incorporated by reference to Exhibit 10.9 to the Form 10-K for the year ended December 31, 2003 filed by EnPro Industries, Inc.)
10.12+ EnPro Industries, Inc. Outside Directors’ Phantom Share Plan (incorporated by reference to Exhibit 10.14 to the Form 10-K for the year ended December 31, 2002 filed by EnPro Industries, Inc.)
10.13 Credit Agreement dated as of May 16, 2002, among the financial institutions named therein, Bank of America, N.A., as the agent, Citicorp USA, Inc., as the syndication agent, and Coltec Industries Inc, Coltec Industrial Products LLC, Garlock Sealing Technologies LLC, Garlock Bearings LLC, Haber Tool Company, and Stemco LLC, as the borrowers, and Coltec Industries Inc, as the funds administrator (incorporated by reference to Exhibit 10.14 to Amendment No. 4 of the Registration Statement on Form 10 of EnPro Industries, Inc. (File No. 001-31225))
10.14 Security Agreement dated as of May 16, 2002 between Bank of America, N.A., as agent, and EnPro Industries, Inc., Coltec Industries Inc, Coltec Industrial Products LLC, Garlock Sealing Technologies LLC, Garlock Bearings LLC, Haber Tool Company, Stemco LLC, QFM Sales and Services, Inc., Coltec Technical Services Inc., Coltec International Services Co., Garrison Litigation Management Group, Ltd., Glacier Garlock Bearings, Inc., Garlock International Inc., and Garlock Overseas Corporation (incorporated by reference to Exhibit 10.15 to Amendment No. 4 of the Registration State-ment on Form 10 of EnPro Industries, Inc. (File No. 001-31225))
10.15 Parent Guarantee dated as of May 31, 2002 by EnPro Industries, Inc. in favor of the financial institutions named therein and their successors and permitted assigns, Bank of America, N.A., as letter of credit issuer and Bank of America, N.A., as agent (incorporated by reference to Exhibit 10.14 to the Form 10-Q for the quarter ended June 30, 2002 filed by EnPro Industries, Inc.)
10.16 Pledge Agreement dated as of May 31, 2002 among Bank of America, N.A., as the agent, and EnPro Industries, Inc., Coltec Industries Inc, Garlock Sealing Technologies LLC, Coltec International Services Co., Glacier Garlock Bearings, Inc., Garlock International Inc., and Garlock Overseas Corporation (incorporated by reference to Exhibit 10.15 to the Form 10-Q for the quarter ended June 30, 2002 filed by EnPro Industries, Inc.)

............................................................................................................ ..... 10.17 First Amendment to Loan Documents dated as of December 4, 2002 between Bank of America, N.A., as agent, and
EnPro Industries, Inc., Coltec Industries Inc, Coltec Industrial Products LLC, Garlock Sealing Technologies LLC, Glacier Garlock Bearings LLC, Haber Tool Company, Stemco LLC, QFM Sales and Services, Inc., Coltec Technical Services Inc., Coltec International Services Co., Garrison Litigation Management Group, Ltd., Glacier Garlock Bearings, Inc., Garlock International Inc., and Garlock Overseas Corporation (incorporated by reference to Exhibit 10.19 to the Form 10-K for the year ended December 31, 2002 filed by EnPro Industries, Inc.)
10.18 First Amendment to Credit Agreement dated as of January 29, 2003 between Bank of America, N.A., as agent, and Coltec Industries Inc, Coltec Industrial Products LLC, Garlock Sealing Technologies LLC, Glacier Garlock Bearings LLC, Haber Tool Company Inc and Stemco LLC (incorporated by reference to Exhibit 10.20 to the Form 10-K for the year ended December 31, 2002 filed by EnPro Industries, Inc.)
10.19 Second Amendment to Credit Agreement dated as of November 4, 2003 between Bank of America, N.A., as agent, and Coltec Industries Inc, Coltec Industrial Products LLC, Garlock Sealing Technologies LLC, Glacier Garlock Bearings LLC, Haber Tool Company Inc and Stemco LLC (incorporated by reference to Exhibit 10.1 to the Form 10-Q for the quarter ended September 30, 2003 filed by EnPro Industries, Inc.)
10.20 Third Amendment to Credit Agreement dated as of June 3, 2004 among the financial institutions named therein, Bank of America, N.A., as the agent, and Coltec Industries Inc, Coltec Industrial Products LLC, Garlock Sealing Technologies LLC, GGB LLC, Haber Tool Company Inc., Stemco LLC, and Corrosion Control Corporation (incorporated by refer-ence to Exhibit 10.1 to the Form 10-Q for the quarter ended June 30, 2004 filed by EnPro Industries, Inc.)
10.21 Fourth Amendment to Credit Agreement dated as of July 20, 2004 among the financial institutions named therein, Bank of America, N.A., as the agent, and Coltec Industries Inc, Coltec Industrial Products LLC, Garlock Sealing Technolo-gies LLC, GGB LLC, Haber Tool Company Inc., Stemco LLC, and Corrosion Control Corporation (incorporated by reference to Exhibit 10.2 to the Form 10-Q for the quarter ended June 30, 2004 filed by EnPro Industries, Inc.)
10.22* Fifth Amendment to Credit Agreement dated as of March 11, 2005 among the financial institutions named therein, Bank of America, N.A., as the agent, and Coltec Industries Inc, Coltec Industrial Products LLC, Garlock Sealing Technologies LLC, GGB LLC, Stemco LLC, and Corrosion Control Corporation
10.23+ Management Continuity Agreement dated as of August 1, 2002 between EnPro Industries, Inc. and Ernest F. Schaub (incorporated by reference to Exhibit 10.21 to the Form 10-K for the year ended December 31, 2002 filed by EnPro Industries, Inc.)
10.24+ Management Continuity Agreement dated as of August 1, 2002 between EnPro Industries, Inc. and William Dries (incorporated by reference to Exhibit 10.23 to the Form 10-K for the year ended December 31, 2002 filed by EnPro Industries, Inc.)
10.25+ Management Continuity Agreement dated as of August 1, 2002 between EnPro Industries, Inc. and Richard C. Driscoll (incorporated by reference to Exhibit 10.24 to the Form 10-K for the year ended December 31, 2002 filed by EnPro Industries, Inc.)
10.26+ Management Continuity Agreement dated as of August 1, 2002 between EnPro Industries, Inc. and Richard L. Magee (incorporated by reference to Exhibit 10.25 to the Form 10-K for the year ended December 31, 2002 filed by EnPro Industries, Inc.)
10.27+ Management Continuity Agreement dated as of October 29, 2004 between EnPro Industries, Inc. and Wayne T. Byrne (incorporated by reference to Exhibit 99 to the Form 10-Q for the quarter ended September 30, 2004 filed by EnPro Industries, Inc.)
10.28+ Management Continuity Agreement dated as of August 1, 2002 between EnPro Industries, Inc. and Robert D. Rehley (incorporated by reference to Exhibit 10.28 to the Form 10-K for the year ended December 31, 2002 filed by EnPro Industries, Inc.)
10.29+ Death Benefits Agreement dated as of December 12, 2002 between EnPro Industries, Inc. and Ernest F. Schaub (incorporated by reference to Exhibit 10.29 to the Form 10-K for the year ended December 31, 2002 filed by EnPro Industries, Inc.)
10.30+ Death Benefits Agreement dated as of December 12, 2002 between EnPro Industries, Inc. and William Dries (incorporated by reference to Exhibit 10.31 to the Form 10-K for the year ended December 31, 2002 filed by EnPro Industries, Inc.)
/ Form 10-K: pages 38 / 39
............................................................................................................ ..... 10.31+ Death Benefits Agreement dated as of December 12, 2002 between EnPro Industries, Inc. and Richard C. Driscoll
(incorporated by reference to Exhibit 10.32 to the Form 10-K for the year ended December 31, 2002 filed by EnPro Industries, Inc.)
10.32+ Death Benefits Agreement dated as of December 12, 2002 between EnPro Industries, Inc. and Richard L. Magee (incorporated by reference to Exhibit 10.33 to the Form 10-K for the year ended December 31, 2002 filed by EnPro Industries, Inc.)
10.33+* EnPro Industries, Inc. Defined Benefit Restoration Plan
10.34+* Summary of Executive and Director Compensation Arrangements
14 EnPro Industries, Inc. Code of Business Conduct (incorporated by reference to Exhibit 14 to the Form 10-K for the year ended December 31, 2002 filed by EnPro Industries, Inc.)
21* List of Subsidiaries
23.1* Consent of PricewaterhouseCoopers LLP
23.2* Consent of Ernst & Young LLP
23.3* Consent of Bates White, LLC
24.1* Power of Attorney from J. P. Bolduc
24.2* Power of Attorney from Peter C. Browning
24.3* Power of Attorney from Joe T. Ford
24.4* Power of Attorney from James H. Hance, Jr.
24.5* Power of Attorney from Gordon D. Harnett
24.6* Power of Attorney from William R. Holland
31.1* Certification of Chief Executive Officer pursuant to Rule 13a – 14(a)/15d – 14(a)
31.2* Certification of Chief Financial Officer pursuant to Rule 13a – 14(a)/15d – 14(a)
32* Certification pursuant to Section 1350
* Items marked with an asterisk are filed herewith.
+ Management contract or compensatory plan required to be filed under Item 15(c) of this report and Item 601 of Regula-tion S-K of the Securities and Exchange Commission.

............................................................................................................ ..... REPORT OF INDEPENDENT REGISTERED PUBLIC
ACCOUNTING FIRM
To the Board of Directors and Shareholders of EnPro Industries, Inc.
We have completed an integrated audit of EnPro Industries, Inc.’s 2004 consolidated financial statements and of its internal control over financial reporting as of December 31, 2004 in accordance with the standards of the Public Company Accounting Oversight Board (United States). Our opinions, based on our audits, are presented below.
Consolidated financial statements and financial statement scheduleIn our opinion, the consolidated financial statements listed in the accompanying index present fairly, in all material respects, the financial position of EnPro Industries, Inc. and its subsidiaries (collectively, the “Company”) at December 31, 2004 and the results of its operations and its cash flows for the year ended December 31, 2004 in conformity with accounting principles generally accepted in the United States of America. In addition, in our opinion, the financial statement schedule for the year ended December 31, 2004 listed in the accompanying index presents fairly, in all material respects, the information set forth therein when read in conjunction with the related consolidated financial statements. These financial statements and financial statement schedule are the responsibility of the Company’s management. Our responsibility is to express an opinion on these financial statements and financial statement schedule based on our audit. We conducted our audit of these statements in accordance with the standards of the Public Company Accounting Oversight Board (United States). Those standards require that we plan and perform the audit to obtain reasonable assurance about whether the financial statements are free of material misstatement. An audit of financial statements includes examining, on a test basis, evidence supporting the amounts and disclosures in the financial statements, assessing the accounting principles used and significant estimates made by management, and evaluating the overall financial statement presentation. We believe that our audit provides a reasonable basis for our opinion.
Internal control over financial reportingAlso, in our opinion, management’s assessment, included in Management’s Annual Report on Internal Control over Financial Reporting appearing under Item 9A, that the Company maintained effective internal control over financial reporting as of December 31, 2004, based on criteria established in Internal Control – Integrated Framework issued by the Committee of Sponsoring Organizations of the Treadway Commission (COSO), is fairly stated, in all material respects, based on those criteria. Furthermore, in our opinion, the Company maintained, in all material respects, effective internal control over financial reporting as of December 31, 2004, based on criteria established in Internal Control – Integrated Framework issued by COSO. The Company’s management is responsible for maintaining effective internal control over financial reporting and for its assessment of the effectiveness of internal control over financial reporting. Our responsibility is to express opinions on management’s assess-ment and on the effectiveness of the Company’s internal control over financial reporting based on our audit. We conducted our audit of internal control over financial reporting in accordance with the standards of the Public Company Accounting Oversight Board (United States). Those standards require that we plan and perform the audit to obtain reasonable assurance about whether effective internal control over financial reporting was maintained in all material respects. An audit of internal control over financial reporting includes obtaining an understanding of internal control over financial reporting, evaluating management’s assessment, testing and evaluating the design and operating effectiveness of internal control, and performing such other proce-dures as we consider necessary in the circumstances. We believe that our audit provides a reasonable basis for our opinions.
A company’s internal control over financial reporting is a process designed to provide reasonable assurance regarding the reliability of financial reporting and the preparation of financial statements for external purposes in accordance with generally accepted accounting principles. A company’s internal control over financial reporting includes those policies and procedures that (i) pertain to the maintenance of records that, in reasonable detail, accurately and fairly reflect the transactions and dispositions of the assets of the company; (ii) provide reasonable assurance that transactions are recorded as necessary to permit prepara-tion of financial statements in accordance with generally accepted accounting principles, and that receipts and expenditures of the company are being made only in accordance with authorizations of management and directors of the company; and (iii) provide reasonable assurance regarding prevention or timely detection of unauthorized acquisition, use, or disposition of the company’s assets that could have a material effect on the financial statements.
Because of its inherent limitations, internal control over financial reporting may not prevent or detect misstatements. Also, projections of any evaluation of effectiveness to future periods are subject to the risk that controls may become inadequate because of changes in conditions, or that the degree of compliance with the policies or procedures may deteriorate.
Charlotte, North CarolinaMarch 9, 2005
/ Form 10-K: pages 40 / 41

............................................................................................................ ..... REPORT OF INDEPENDENT AUDITORS
To The Shareholders And Board Of DirectorsEnPro Industries, Inc.We have audited the accompanying consolidated balance sheet of EnPro Industries, Inc. and subsidiaries (the “Company”) (formerly Coltec Industries Inc) as of December 31, 2003, and the related consolidated statements of operations, shareholders’ equity and cash flows for each of the two years in the period ended December 31, 2003. Our audits also included the accompanying financial statement schedule of valuation and qualifying accounts. These financial statements and schedule are the responsibility of the Company’s management. Our responsibility is to express an opinion on these financial statements and schedule based on our audits.
We conducted our audits in accordance with auditing standards generally accepted in the United States. Those standards require that we plan and perform the audit to obtain reasonable assurance about whether the financial statements are free of material misstatement. An audit includes examining, on a test basis, evidence supporting the amounts and disclosures in the financial statements. An audit also includes assessing the accounting principles used and significant estimates made by management as well as evaluating the overall financial statement presentation. We believe that our audits provide a reasonable basis for our opinion.
In our opinion, the financial statements referred to above present fairly, in all material respects, the consolidated financial position of EnPro Industries, Inc. and subsidiaries at December 31, 2003, and the consolidated results of its operations and its cash flows for each of the two years in the period ended December 31, 2003, in conformity with accounting principles generally accepted in the United States. Also, in our opinion, the related financial statement schedule, when considered in relation to the basic consolidated financial statements taken as a whole, presents fairly in all material respects the information set forth therein.
As discussed in Note 9 to the consolidated financial statements, the Company adopted Statement of Financial Accounting Standard No. 142, Goodwill and Other Intangible Assets, effective January 1, 2002.
Charlotte, North CarolinaFebruary 4, 2004

............................................................................................................ ..... Consolidated Statements of Operations
Years Ended December 31, 2004, 2003 and 2002
(in millions, except per share data) 2004 2003 2002
Sales $ 826.3 $ 730.1 $ 710.4
Operating costs and expenses: Cost of sales 572.1 500.0 497.9 Selling, general and administrative expenses 185.2 164.9 153.7 Asbestos-related expenses 10.4 9.8 18.0 Restructuring and other costs 9.4 2.6 3.9 Loss (gain) on sale of assets, net 1.8 (2.5) (0.6)
778.9 674.8 672.9
Operating income 47.4 55.3 37.5Interest expense (9.1) (9.2) (14.9)Interest income 2.0 1.6 1.2Mark-to-market adjustment for call options (0.2) 1.2 (16.7)Other income (expenses) 10.8 2.0 (23.9)
Income (loss) before income taxes and distributions on convertible preferred securities of trust 50.9 50.9 (16.8)Income tax (expense) benefit (17.1) (17.7) 7.5Distributions on convertible preferred securities of trust – – (3.3)
Income (loss) from continuing operations 33.8 33.2 (12.6)Income from discontinued operations, net of taxes – – 24.2
Income before cumulative effect of a change in accounting principle 33.8 33.2 11.6Cumulative effect of a change in accounting principle, net of taxes – – (14.6)
Net income (loss) $ 33.8 $ 33.2 $ (3.0)
Basic earnings per share: Continuing operations $ 1.65 $ 1.64 $ (0.62) Discontinued operations – – 1.20 Cumulative effect of a change in accounting principle – – (0.73)
Net income (loss) $ 1.65 $ 1.64 $ (0.15)
Diluted earnings per share: Continuing operations $ 1.60 $ 1.61 $ (0.62) Discontinued operations – – 1.20 Cumulative effect of a change in accounting principle – – (0.73)
Net income (loss) $ 1.60 $ 1.61 $ (0.15)
See notes to consolidated financial statements.
/ Form 10-K: pages 42 / 43

............................................................................................................ ..... Consolidated Statements of Cash Flows
Years Ended December 31, 2004, 2003 and 2002
(in millions) 2004 2003 2002
OPERATING ACTIVITIES Income (loss) from continuing operations $ 33.8 $ 33.2 $ (12.6) Adjustments to reconcile income (loss) from continuing operations to net cash provided by operating activities of continuing operations: Payments for asbestos-related claims, net of insurance proceeds (29.9) (25.7) (34.4) Depreciation 23.9 23.1 22.3 Amortization 7.7 8.5 7.6 Deferred income taxes 2.8 10.8 (12.2) Mark-to-market adjustment for call options 0.2 (1.2) 16.7 Loss (gain) on sale of assets, net 1.8 (2.5) (0.6) Gain on TIDES repurchase – (1.5) – Change in assets and liabilities, net of effects of acquisitions and divestitures of businesses: Receivables (4.7) (3.5) (6.1) Inventories (8.5) 14.8 21.6 Accounts payable 5.6 0.3 (5.6) Other current assets and liabilities 2.2 (9.7) 21.9 Other non-current assets and liabilities 6.2 (2.6) 1.3
Net cash provided by operating activities of continuing operations 41.1 44.0 19.9
INVESTING ACTIVITIES Purchases of property, plant and equipment (36.9) (22.7) (19.6) Proceeds from sales of assets 9.8 6.4 0.9 Purchase of call options – – (18.2) Receipts (payments) in connection with acquisitions, net of cash acquired 0.3 (20.5) 3.7
Net cash used in investing activities of continuing operations (26.8) (36.8) (33.2)
FINANCING ACTIVITIES Borrowings – 4.7 4.7 Repayments of debt (5.4) (3.9) (2.1) Proceeds from issuance of common stock 1.5 0.5 – Distributions on convertible preferred securities of trust – – (3.9) Net transfers (to) from Goodrich – (0.6) 54.3
Net cash (used in) provided by financing activities of continuing operations (3.9) 0.7 53.0
DISCONTINUED OPERATIONS Net cash provided by discontinued operations – – 13.0
Effect of exchange rate changes on cash and cash equivalents 2.9 5.0 3.2
Net increase in cash and cash equivalents 13.3 12.9 55.9Cash and cash equivalents at beginning of year 94.7 81.8 25.9
Cash and cash equivalents at end of year $ 108.0 $ 94.7 $ 81.8
Supplemental disclosures of cash flow information: Cash paid during the year for : Interest $ 9.2 $ 9.6 $ 16.4 Income taxes $ 12.2 $ 12.5 $ 6.7
See notes to consolidated financial statements.

............................................................................................................ .....
/ Form 10-K: pages 44 / 45
(in millions, except share amounts) 2004 2003
ASSETSCurrent assets Cash and cash equivalents $ 108.0 $ 94.7 Accounts and notes receivable, less allowance for doubtful accounts of $3.6 in 2004 and $3.2 in 2003 115.8 107.4 Asbestos insurance receivable 109.9 104.2 Inventories 58.6 50.6 Other current assets 31.3 26.7
Total current assets 423.6 383.6Property, plant and equipment 146.7 135.8Goodwill 125.7 128.3Intangible assets 67.3 72.8Asbestos insurance receivable 336.2 219.8Other assets 81.5 80.4
Total assets $ 1,181.0 $ 1,020.7
LIABILITIES AND SHAREHOLDERS’ EQUITYCurrent liabilities Current maturities of long-term debt $ 0.2 $ 2.9 Accounts payable 55.5 47.7 Asbestos liability 74.0 99.5 Other accrued expenses 60.5 58.1
Total current liabilities 190.2 208.2Long-term debt 164.6 167.3Deferred income taxes 41.0 32.3Retained liabilities of previously owned businesses 44.9 44.0Environmental liabilities 32.2 33.4Asbestos liability 159.4 41.7Other liabilities 72.2 57.2
Total liabilities 704.5 584.1
Commitments and contingenciesShareholders’ equity Common stock – $.01 par value; 100,000,000 shares authorized; issued 20,811,798 shares at December 31, 2004 and 20,507,982 shares at December 31, 2003 0.2 0.2 Additional paid-in capital 411.6 406.8 Retained earnings 59.3 25.5 Accumulated other comprehensive income 7.0 5.7 Common stock held in treasury, at cost – 240,654 shares at December 31, 2004 and 244,919 shares at December 31, 2003 (1.6) (1.6)
Total shareholders’ equity 476.5 436.6
Total liabilities and shareholders’ equity $ 1,181.0 $ 1,020.7
See notes to consolidated financial statements.
Consolidated Balance SheetsAs of December 31, 2004 and 2003

............................................................................................................ ..... Consolidated Statements of Changes in
Shareholders’ Equity Years Ended December 31, 2004, 2003 and 2002
Retained Accumulated Additional Earnings Other Net Total Common Stock Paid–in (Accumulated Comprehensive Treasury Investment Shareholders’(dollars and shares in millions) Shares Amount Capital Deficit) Income (Loss) Stock by Goodrich Equity
Balance, December 31, 2001 – $ – $ – $ – $(15.6) $ – $ 292.0 $ 276.4
Net income (loss) – – – (7.7) – – 4.7 (3.0)Other comprehensive loss: Cumulative translation adjustment – – – – 7.7 – – 7.7 Minimum pension liability adjustment – – – – (6.1) – – (6.1) Accumulated gain on cash flow hedges – – – – 0.4 – – 0.4
Total comprehensive loss (1.0)Dividend of Coltec Aerospace – – – – – – (279.1) (279.1)Assumption of certain assets and liabilities by Goodrich – – – – 3.3 – 333.6 336.9Net transfers from Goodrich – – – – – – 54.3 54.3Issuance of common stock 20.4 0.2 – – – – (0.2) –Reclassification of remaining net investment by Goodrich – – 405.3 – – – (405.3) –Receipt of treasury shares (0.2) – 1.6 – – (1.6) – –
Balance, December 31, 2002 20.2 0.2 406.9 (7.7) (10.3) (1.6) – 387.5
Net income – – – 33.2 – – – 33.2Other comprehensive income: Cumulative translation adjustment – – – – 14.7 – – 14.7 Minimum pension liability adjustment – – – – 2.4 – – 2.4 Accumulated loss on cash flow hedges – – – – (1.1) – – (1.1)
Total comprehensive income 49.2Exercise of stock options 0.1 – 0.5 – – – – 0.5Transfer to Goodrich – – (0.6) – – – – (0.6)
Balance, December 31, 2003 20.3 0.2 406.8 25.5 5.7 (1.6) – 436.6
Net income – – – 33.8 – – – 33.8Other comprehensive income: Cumulative translation adjustment – – – – 6.0 – – 6.0 Minimum pension liability adjustment – – – – (5.7) – – (5.7) Accumulated gain on cash flow hedges – – – – 1.0 – – 1.0
Total comprehensive income 35.1Exercise of stock options and other incentive plan activity 0.3 – 4.8 – – – – 4.8
Balance, December 31, 2004 20.6 $0.2 $411.6 $59.3 $ 7.0 $(1.6) $ – $ 476.5
See notes to consolidated financial statements.

............................................................................................................ ..... NOTES TO CONSOLIDATED FINANCIAL
STATEMENTS
1. Overview, Basis of Presentation and Significant Accounting PoliciesOVERVIEWEnPro Industries, Inc. (“EnPro” or the “Company”) is a leader in the design, development, manufacturing and marketing of well recognized, proprietary engineered industrial products that include sealing products, metal polymer bearings, air compressors, and heavy-duty diesel and natural gas engines.
On May 31, 2002, Goodrich Corporation (“Goodrich”) completed the tax-free spin-off of its Engineered Industrial Products (“EIP”) business to its shareholders (the “Distribution”). EnPro was incorporated in North Carolina in January 2002 in anticipation of the proposed Distribution. Prior to the Distribution, Coltec Industries Inc. (“Coltec”) was a wholly owned subsidiary of Goodrich and owned the EIP business and an aerospace business (“Coltec Aerospace”). During May 2002, Coltec transferred to Goodrich, by way of a dividend, all of the assets, liabilities and operations of Coltec Aerospace.
Upon the Distribution, Coltec became a wholly owned subsidiary of EnPro. The Distribution was effected through a tax-free distribution to Goodrich shareholders of all of the capital stock of EnPro. Each Goodrich shareholder received one share of EnPro common stock, as well as an associated EnPro preferred stock purchase right, for every five shares of Goodrich common stock owned.
BASIS OF PRESENTATIONThese financial statements present Coltec’s consolidated results of operations and cash flows as it operated as a wholly owned subsidiary of Goodrich prior to the Distribution, including certain adjustments and allocations necessary for a fair presenta-tion of the business, and EnPro’s consolidated results of operations and cash flows after the Distribution. As noted above, Coltec transferred Coltec Aerospace to Goodrich prior to the Distribution. The transfer of Coltec Aerospace to Goodrich constituted the disposal of a segment. Accordingly, Coltec Aerospace was accounted for as a discontinued operation and its revenues, costs and expenses, and cash flows have been segregated in the Company’s Consolidated Statements of Operations and Consolidated Statements of Cash Flows. Unless otherwise noted, disclosures herein pertain to the Company’s continuing operations. There are no operations shown as discontinued operations other than Coltec Aerospace.
Management believes that the assumptions underlying the Consolidated Financial Statements are reasonable. However, the financial information in the accompanying Consolidated Statements of Operations and Consolidated Statements of Cash Flows for the year ended December 31, 2002 does not necessarily include all of the expenses that would have been incurred by Coltec had it been a separate, stand-alone entity prior to the Distribution and may not necessarily reflect what Coltec’s consoli-dated results of operations and cash flows would have been had Coltec been a stand-alone entity prior to the Distribution.
SUMMARY OF SIGNIFICANT ACCOUNTING POLICIESPRINCIPLES OF CONSOLIDATION – The consolidated financial statements reflect the accounts of the Company and its majority-owned and controlled subsidiaries. All significant transactions among the Company’s operations have been eliminated.
REVENUE RECOGNITION – Revenue is recognized at the time title and risk of product ownership is transferred or when services are rendered. Any shipping costs billed to customers are recognized as revenue.
ASBESTOS – Historically, the Company recorded an accrual for asbestos-related claims for actions in advanced stages of processing and settled claims only. No accrual was recorded for claims in early procedural stages or for unasserted claims. In 2004, the Company established an accrual for both asserted claims and unasserted claims estimated for a future period over which management believes the liability can reasonably be estimated. The Company has engaged the firm of Bates White, LLC, a recognized expert in the field of estimating asbestos-related liabilities, to assist it in estimating the liability. Due to the uncertain nature of the estimated liability for early-stage and future claims, management’s estimate covers a range, and the Company believes no single amount in the range is a better estimate than any other amount in the range. In accordance with the applicable accounting rules, the Company records a liability for these claims and a corresponding receivable from its insurance carriers at the lower end of the range of estimated potential liability. Outside litigation expenses associated with settlements are recorded when incurred.
/ Form 10-K: pages 46 / 47

............................................................................................................ ..... The significant assumptions underlying the material components of the estimated range of liability include: the number and
trend of claims to be asserted; the mix of alleged diseases or impairment; the trend in the number of claims for non-malignant cases; the probability that some existing and potential future claims will eventually be dismissed without payment; and the estimated amount to be paid per claim. The number of future actions filed per year and the payments made to resolve those claims could exceed those reflected in the Company’s past experience and those reflected in its estimate.
With the assistance of Bates White, LLC, the Company will periodically review the period over which it can make a reasonable estimate, the assumptions underlying its estimate, and the range of reasonably possible potential liabilities, and adjust the liability if necessary. Changing circumstances that could arise in the future and new data that may become available could cause an increase in the obligation in the future by an amount that cannot currently be reasonably estimated, and that increase could be significant and material. If the amount of the estimated liability ever exceeds the amount of insurance available for asbestos claims, the excess would be charged to earnings.
USE OF ESTIMATES – The preparation of financial statements in conformity with generally accepted accounting principles requires management to make estimates and assumptions that affect the amounts reported in the financial statements and accompanying notes. Actual results could differ from those estimates.
CASH EQUIVALENTS – Cash equivalents consist of highly liquid investments with a maturity of three months or less at the time of purchase.
RECEIVABLES – Accounts receivable are stated at the historical carrying amount net of write-offs and allowance for doubtful accounts. The Company establishes an allowance for doubtful accounts receivable based on historical experience and any specific customer collection issues that the Company has identified. Doubtful accounts receivable are written off when a settlement is reached for an amount that is less than the outstanding historical balance or when the Company has determined the balance will not be collected.
The balances billed but not paid by customers pursuant to retainage provisions in long-term contracts and programs will be due upon completion of the contracts and acceptance by the owner. At December 31, 2004, the Company had $1.3 million of retentions expected to be collected in 2005 recorded in accounts and notes receivable and $3.9 million of retentions expected to be collected at various times in 2006 to 2008 recorded in other non-current assets in the Consolidated Balance Sheets. At December 31, 2003, the Company had $1.7 million of current retentions and $2.7 million of non-current retentions recorded in the Consolidated Balance Sheets.
INVENTORIES – Certain domestic inventories are valued by the last-in, first-out (“LIFO”) cost method. Inventories not valued by the LIFO method, other than inventoried costs relating to long-term contracts and programs, are valued using the first-in, first-out (“FIFO”) cost method, and are recorded at the lower of cost or market.
Inventoried costs relating to long-term contracts and programs are stated at the actual production cost, including factory overhead, incurred to date. Progress payments related to long-term contracts and programs are shown as a reduction of inventories. Initial program start-up costs and other nonrecurring costs are expensed as incurred. Inventoried costs relating to long-term contracts and programs are reduced by charging any amounts in excess of estimated realizable value to cost of sales.
PROPERTY, PLANT AND EQUIPMENT – Property, plant and equipment are recorded at cost. Major renewals and better-ments are capitalized; whereas, maintenance and repairs are expensed as incurred. The cost of property sold or otherwise disposed and related accumulated depreciation are removed from the accounts at the time of disposal, and any resulting gain or loss is included in income. Depreciation of plant and equipment is determined on the straight-line method over the follow-ing estimated useful lives of the assets: buildings and improvements, 3 to 40 years; machinery and equipment, 3 to 20 years.
GOODWILL AND INTANGIBLE ASSETS – Goodwill represents the excess of the purchase price over the fair value of the net assets of acquired businesses. Goodwill is subject to annual impairment testing conducted each year as of October 1, although interim tests may be required if an event occurs or circumstances change that would more likely than not reduce the fair value of a reporting unit below its carrying amount.

............................................................................................................ ..... Intangible assets are recorded at cost, or when acquired as a part of a business combination, at estimated fair value. These
assets include customer relationships, patents and other technology agreements, trademarks, licenses and non-compete agree-ments. Intangible assets that have definite lives are amortized using a method that reflects the pattern in which the economic benefits of the assets are consumed or the straight-line method over estimated useful lives of 3 to 25 years. Intangible assets with indefinite lives are subject to at least annual impairment testing, which compares the fair value of the intangible asset with its carrying amount.
INCOME TAXES – The Company uses the asset and liability method of accounting for income taxes. Temporary differences arising from the difference between the tax basis of an asset or liability and its carrying amount on the Consolidated Bal-ance Sheets are used to calculate future income tax assets or liabilities. This method also requires the recognition of future tax benefits, such as net operating loss carryforwards, to the extent that realization of such benefits is more likely than not. Deferred tax assets and liabilities are measured using enacted tax rates expected to apply to taxable income (losses) in the years in which those temporary differences are expected to be recovered or settled. The effect on deferred tax assets and liabilities of a change in tax rates is recognized in income in the period that includes the enactment date.
STOCK-BASED COMPENSATION – The Company accounts for stock-based compensation plans using the intrinsic value method as allowed by APB Opinion No. 25, “Accounting for Stock Issued to Employees,” (“APB 25”). Required pro forma information regarding net income and earnings per share has been determined as if the Company had accounted for its employee stock-based compensation plans under the fair value method. The Company issued stock options in 2003 and 2002, but not in 2004. The fair value for the Company’s stock options was estimated at the date of grant using a Black-Scholes option pricing model with the following assumptions:
2003 2002
Risk-free interest rate 3.0% 4.2%Dividend yield 0.0% 0.0%Volatility factor 73.2% 65.0%Expected life of the options 5.0 years 7.0 years
The option valuation model requires the input of highly subjective assumptions, primarily stock price volatility, changes in which can materially affect the fair value estimate. The fair value of stock options granted during 2003 and 2002 was $2.53 and $3.66 per share, respectively.
For purposes of the required pro forma disclosures, the estimated fair value of the options is amortized to expense over the vesting period of the options. The Company’s pro forma information is as follows:
(in millions, except per share amounts) 2004 2003 2002
Net income (loss): As reported $33.8 $33.2 $ (3.0) Add: stock-based employee compensation expense included in reported net income, net of tax 1.2 – – Deduct: stock-based employee compensation expense determined under fair value method, net of tax (1.2) (1.6) (1.3)
Pro forma $33.8 $31.6 $ (4.3)
Basic earnings per share: As reported $1.65 $1.64 $(0.15) Pro forma 1.65 $1.56 $(0.21)
Diluted earnings per share: As reported $1.60 $1.61 $(0.15) Pro forma $1.60 $1.53 $(0.21)
FAIR VALUE – Because of their short maturity, the carrying value of cash and cash equivalents, accounts and notes receivable, the current asbestos insurance receivable, accounts payable and short-term bank debt approximates fair value. Fair value of long-term investments is based on quoted market prices.
/ Form 10-K: pages 48 / 49

............................................................................................................ ..... RESEARCH AND DEVELOPMENT EXPENSE – Costs related to research and development activities are expensed as incurred.
The Company performs research and development under Company-funded programs for commercial products. Total research and development expenditures in 2004, 2003 and 2002 were $10.8 million, $11.0 million and $12.9 million, respectively.
DERIVATIVE INSTRUMENTS – Statement of Financial Accounting Standards No. 133, “Accounting for Derivative Instruments and Hedging Activities,” as amended, requires that all derivative instruments be reported in the Consolidated Balance Sheets at fair value and that changes in a derivative’s fair value be recognized currently in earnings unless specific hedge criteria are met. Coltec purchased call options in 2002 to mitigate the financial exposure created by the conversion feature of the 5¼% Convertible Preferred Securities – Term Income Deferred Equity Securities (the “TIDES”). The call options are derivative instruments and are carried at fair value with changes reflected in income. During the year ended December 31, 2003, the Company recorded a $1.2 million non-cash increase in the fair value of these call options. The fair value of the call options declined by $0.2 million and $16.7 million during the years ended December 31, 2004 and 2002, respectively, resulting in non-cash charges to earnings.
The Company also has entered into foreign currency forward contracts to hedge forecasted transactions occurring at various dates through December 2005, that are denominated in foreign currencies. These contracts are accounted for as cash flow hedges. As cash flow hedges, the effective portion of the gain or loss on the contracts is reported in other comprehensive income and the ineffective portion is reported in income. Amounts in accumulated other comprehensive income are reclassi-fied into income in the period that the hedged transactions affect earnings. It is anticipated that all amounts within accumulated other comprehensive income at December 31, 2004, will be reclassified into income within the next twelve months.
FOREIGN CURRENCY TRANSLATION – The financial statements of those operations whose functional currency is a foreign currency are translated into U.S. dollars using the current rate method. Under this method, all assets and liabilities are translated into U.S. dollars using current exchange rates, and income statement items are translated using weighted-average exchange rates. The translation adjustment is included in accumulated other comprehensive income; whereas, gains and losses on foreign currency transactions are included in operating income. Foreign currency transaction gains (losses) totaled $(2.8) million, $2.5 million and $(0.4) million for 2004, 2003 and 2002, respectively.
EARNINGS PER SHARE – The computation of basic and diluted earnings per share is as follows:
(in millions, except per share amounts) 2004 2003 2002
Numerator (basic and diluted): Net income (loss) $33.8 $33.2 $ (3.0)
Denominator: Weighted-average shares – basic 20.5 20.2 20.2 Employee stock options 0.7 0.4 –
Weighted-average shares – diluted 21.2 20.6 20.2
Earnings per share: Basic $1.65 $1.64 $(0.15)
Diluted $1.60 $1.61 $(0.15)
RECLASSIFICATIONS – Certain prior year amounts in the financial statements have been reclassified to conform to the current year presentation.
NEW ACCOUNTING PRONOUNCEMENTS – In December 2004, the Financial Accounting Standards Board (“FASB”) issued Statement of Financial Accounting Standards No. 123 (revised 2004), “Share-Based Payment” (“SFAS 123R”). The statement requires that the compensation cost relating to share-based payment transactions be recognized in the financial statements and that cost be measured based on the fair value of the equity or liability instruments issued. SFAS 123R replaces Statement of Financial Accounting Standards No. 123, “Accounting for Stock-Based Compensation” (“SFAS 123”), and supersedes APB 25. This statement is effective as of the first interim or annual reporting period that begins after June 15, 2005, however, the Company plans to adopt it as of January 1, 2005.

............................................................................................................ ..... The Company will adopt the provisions of SFAS 123R using a modified prospective application. Under modified prospective
application, SFAS 123R will apply to new awards and to any awards that are outstanding on the effective date which are subsequently modified or cancelled. Compensation expense for outstanding awards for which the requisite service had not been rendered as of the effective date will be recognized over the remaining service period using the compensation cost currently calculated for pro forma disclosure purposes under SFAS 123.
In November 2004, the FASB issued Statement of Financial Accounting Standards No. 151, “Inventory Costs – an amendment of ARB No. 43, Chapter 4.” This statement clarifies that abnormal amounts of idle facility expense, freight, handling costs and spoilage should be recognized as current-period charges and requires the allocation of fixed production overheads to inven-tory based on the normal capacity of production facilities.
The guidance is effective for inventory costs incurred during fiscal years beginning after June 15, 2005. The Company does not anticipate that the adoption of this statement will have a significant impact on its results.
In December 2004, the FASB issued FASB Staff Position 109-2, “Accounting and Disclosure Guidance for the Foreign Earnings Repatriation Provision within the American Jobs Creation Act of 2004” (“FSP 109-2”). Under the guidance of FSP 109-2, an enterprise is allowed time beyond the financial reporting period of enactment to evaluate the effect of the American Jobs Creation Act of 2004 on its plan for reinvestment or repatriation of foreign earnings for purposes of applying Statement of Financial Accounting Standards No. 109, “Accounting for Income Taxes.” The American Jobs Creation Act of 2004 (“Act”) creates a temporary incentive for U.S. corporations to repatriate accumulated income earned abroad by providing an 85 % dividends received deduction for certain dividends from controlled foreign corporations. Although the deduction is subject to a number of limitations and, as of today, significant uncertainty remains as to how to interpret the numerous provisions in the Act, the Company believes that it has the information necessary to make an informed decision on the impact of the Act on its repatriation plans. The Company does not currently plan to repatriate any dividends under this Act.
2. Acquisitions
During 2004, the Company received $0.3 million in satisfaction of final post-closing settlements of a previously consummated acquisition. This transaction was recorded as an adjustment to the goodwill associated with this acquisition.
In October 2003, the Company acquired Pikotek, a privately held manufacturer of insulating seals used in high pressure, cor-rosive applications. Pikotek is included in the Company’s Sealing Products segment. Also during 2003, the Company purchased a small product line, and paid an amount under earn-out provisions of a previously consummated acquisition. The cost of these acquisitions totaled $20.5 million and resulted in an increase in working capital of $1.0 million, an increase in property, plant and equipment of $0.4 million, an increase in goodwill of $4.6 million, an increase in other intangible assets of $16.1 million and an increase in other non-current liabilities of $1.6 million.
During 2002, the Company received $4.8 million in satisfaction of post-closing settlements and paid $1.1 million under earn-out provisions of previously consummated acquisitions, which was also recorded as an adjustment to goodwill.
/ Form 10-K: pages 50 / 51

............................................................................................................ ..... 3. Restructuring and Other Costs
During the year ended December 31, 2004, the Company incurred $9.4 million of restructuring and new facilities costs. These primarily related to the relocation and consolidation of facilities for a domestic operation and start-up costs associated with two new foreign facilities. Personnel-related costs amounted to $6.6 million and related primarily to severance, pension charges, and relocation costs. Facility consolidation and new facilities costs amounted to $2.8 million and consisted primarily of clean-up and closure, equipment relocation and start-up costs. Workforce reductions announced in 2004 totaled 67 positions, primarily salaried administrative and production personnel. Thirty-four of these employees were terminated by December 31, 2004. Virtually all of these restructuring programs were completed during 2004. There will only be negligible costs in 2005 related to these activities. Restructuring reserves at December 31, 2004, as well as activity during the year, consisted of:
Balance Direct Balance December 31, Credits to December 31,(in millions) 2003 Provision Payments Pension Accruals 2004
Personnel related costs $0.2 $6.6 $(2.5) $(3.3) $1.0Facility consolidation and new facilities costs – 2.8 (2.8) – –
$0.2 $9.4 $(5.3) $(3.3) $1.0
During 2003, the Company incurred $1.4 million of restructuring costs, which included $0.2 million of personnel-related costs associated with workforce reductions at several operating units and $1.2 million related to facility closures and consolidations. Workforce reductions announced in 2003 totaled 59 positions, primarily production personnel. Seven of these employees were terminated by December 31, 2003, and the balance were terminated by December 31, 2004. Restructuring reserves at December 31, 2003, as well as activity during the year, consisted of:
Balance Balance December 31, December 31,(in millions) 2002 Provision Payments 2003
Personnel related costs $0.9 $0.2 $(0.9) $0.2Facility consolidation costs 0.1 1.2 (1.3) –
$1.0 $1.4 $(2.2) $0.2
During 2003, the Company incurred $1.3 million of asset impairment charges related to a product line within the Sealing Products segment, which was included primarily in restructuring and other costs in the Consolidated Statements of Operations.
During 2002, the Company relocated or consolidated several of its manufacturing facilities and transitioned the manufacturing of several product lines to different sites. Workforce reductions announced in 2002 totaled approximately 240, primarily production positions of which 182 were terminated by December 31, 2002, and the balance were terminated by December 31, 2003.
The Company incurred $3.9 million of restructuring costs related to these initiatives during the year ended December 31, 2002. The restructuring costs included $2.9 million for facility consolidations and equipment relocations and $1.0 million for termination benefits. Restructuring reserves at December 31, 2002, as well as activity during the year ended December 31, 2002, consisted of:
Balance Balance December 31, December 31,(in millions) 2001 Provision Payments 2002
Personnel related costs $2.1 $1.0 $(2.2) $0.9Facility consolidation costs 1.1 2.9 (3.9) 0.1
$3.2 $3.9 $(6.1) $1.0

............................................................................................................ ..... Restructuring, impairment, and new facilities costs by reportable segment are as follows:
Years Ended December 31,(in millions) 2004 2003 2002
Sealing Products $0.2 $1.3 $1.3Engineered Products 8.5 1.4 1.4Engine Products and Services 0.7 – 1.2
$9.4 $2.7 $3.9
4. Loss (Gain) on Sale of Assets, Net
During 2004, the Company recorded a pre-tax loss of $3.7 million in connection with the sale of substantially all of the assets and transfer of certain liabilities of the Sterling Die operation and a goodwill impairment charge and expenses related to the sale of the Haber Tool operation. These operations were included in the Engineered Products segment. Proceeds from these sales totaled $7.7 million, which included a note receivable from one of the purchasers for $1.1 million.
Also during 2004, the Company sold a building for $3.0 million, resulting in a pre-tax gain of $1.5 million. This related to the relocation and consolidation of facilities for an operation in the Engineered Products segment.
During 2003, the Company sold two surplus buildings for $4.1 million, resulting in a pre-tax gain of $2.5 million.
During 2002, the Company sold a surplus building for $0.6 million, resulting in a pre-tax gain of $0.6 million.
5. Other Income (Expenses)
In 2004, the Company received and recognized as other income approximately $10 million from one of its insurers to settle the Company’s claims for (1) reimbursement of past costs relating to certain environmental matters including fees incurred in pursuing the claim, and (2) estimated future claims that had previously been reserved by the Company. Additionally, the Company recorded a $0.8 million reserve adjustment based on a favorable legal settlement related to a previously divested business.
In 2003, the Company recorded pre-tax income of $1.5 million resulting from the Company purchase and retirement of 100,000 TIDES with a carrying value of $5.0 million. Additionally, the Company recorded a $0.5 million reduction to environ-mental reserves based on new facts at two specific sites.
In 2002, in connection with the Distribution, the Company conducted a review of its process for managing and estimating envi-ronmental liabilities. As a result of changes in the Company’s strategies growing out of this review, and in light of developments at a number of environmental sites associated with previously divested businesses, the Company increased its environmental reserves and recorded a pre-tax charge of approximately $12 million to reflect an increase in the estimated costs to remediate these sites. In addition, based on new information regarding an adverse court ruling related to severance owed as a result of the closing of a plant, the Company increased the reserve for this case and recorded a pre-tax charge of approximately $11 million. In December 2002, $14.4 million was paid in connection with this liability.
/ Form 10-K: pages 52 / 53

............................................................................................................ ..... 6. Income Taxes
Income (loss) from continuing operations before income taxes as shown in the Consolidated Statements of Operations consists of the following:
Years Ended December 31,(in millions) 2004 2003 2002
Domestic $23.2 $30.5 $(29.6)Foreign 27.7 20.4 12.8
Total $50.9 $50.9 $(16.8)
A summary of income tax (expense) benefit from continuing operations in the Consolidated Statements of Operations is as follows:
Years Ended December 31,(in millions) 2004 2003 2002
Current: Federal $ (3.5) $ 1.0 $ 0.7 Foreign (10.5) (7.8) (5.4) State (0.3) (0.1) –
(14.3) (6.9) (4.7)
Deferred: Federal (2.8) (9.4) 10.6 Foreign 0.2 (0.7) 0.8 State (0.2) (0.7) 0.8
(2.8) (10.8) 12.2
Total $(17.1) $(17.7) $ 7.5
Significant components of deferred income tax assets and liabilities at December 31, 2004 and 2003, are as follows:
(in millions) 2004 2003
Deferred income tax assets: Accrual for post-retirement benefits other than pensions $ 1.8 $ 1.9 Environmental reserves 16.9 17.3 Retained liabilities of previously owned businesses 15.1 16.9 Call options 6.5 6.0 Pensions 4.9 6.1 Accruals and reserves 23.2 16.5
Total deferred income tax assets 68.4 64.7
Deferred income tax liabilities: Inventories (2.9) (4.7) Tax depreciation in excess of book (10.9) (13.5) Payments in excess of insurance recoveries (74.4) (61.1) Other (4.3) (3.7)
Total deferred income tax liabilities (92.5) (83.0)
Net deferred income taxes $(24.1) $(18.3)

............................................................................................................ ..... Management’s analysis indicates that the turnaround periods for certain of these assets are for long periods of time or are
indefinite. In addition, management has determined, based on the Company’s history of prior earnings and its expectations for the future, that taxable income of the Company will more likely than not be sufficient to fully recognize any remaining deferred tax assets.
The effective income tax rate from continuing operations varied from the statutory federal income tax rate as follows:
Percent of Pretax Income Years Ended December 31, 2004 2003 2002
Statutory federal income tax rate 35.0% 35.0% 35.0%Credits (0.8) (3.1) –State and local taxes 1.0 1.4 4.8Trust distributions – – 6.9Extraterritorial income exclusion benefit (1.8) (1.4) –Foreign rate variations 4.3 4.5 (1.0)Foreign accrual adjustment (2.9) – –Other items (1.1) (1.6) (0.8)
Effective income tax rate 33.7% 34.8% 44.9%
The effective tax rate in 2002 was a benefit as a result of the pre-tax loss.
At December 31, 2004, the Company has undistributed earnings of approximately $42.5 million from subsidiaries in Australia, Canada and Mexico. Based on current income tax rates, the Company believes the tax effect on any distribution will be immaterial due to the Company’s foreign tax credit position. As such, no deferred taxes have been provided for these undistributed foreign earnings.
The Company has not provided for the federal and foreign withholding taxes on $63.8 million of the remaining foreign subsidiaries’ undistributed earnings as of December 31, 2004, because such earnings are intended to be reinvested indefinitely. On repatriation, certain foreign countries impose withholding taxes. The amount of withholding tax that would be payable on remittance of the entire amount would approximate $7.0 million. Based on current income tax rates, the Company believes the tax effect on any distribution will be immaterial due to the Company’s foreign tax credit position.
/ Form 10-K: pages 54 / 55
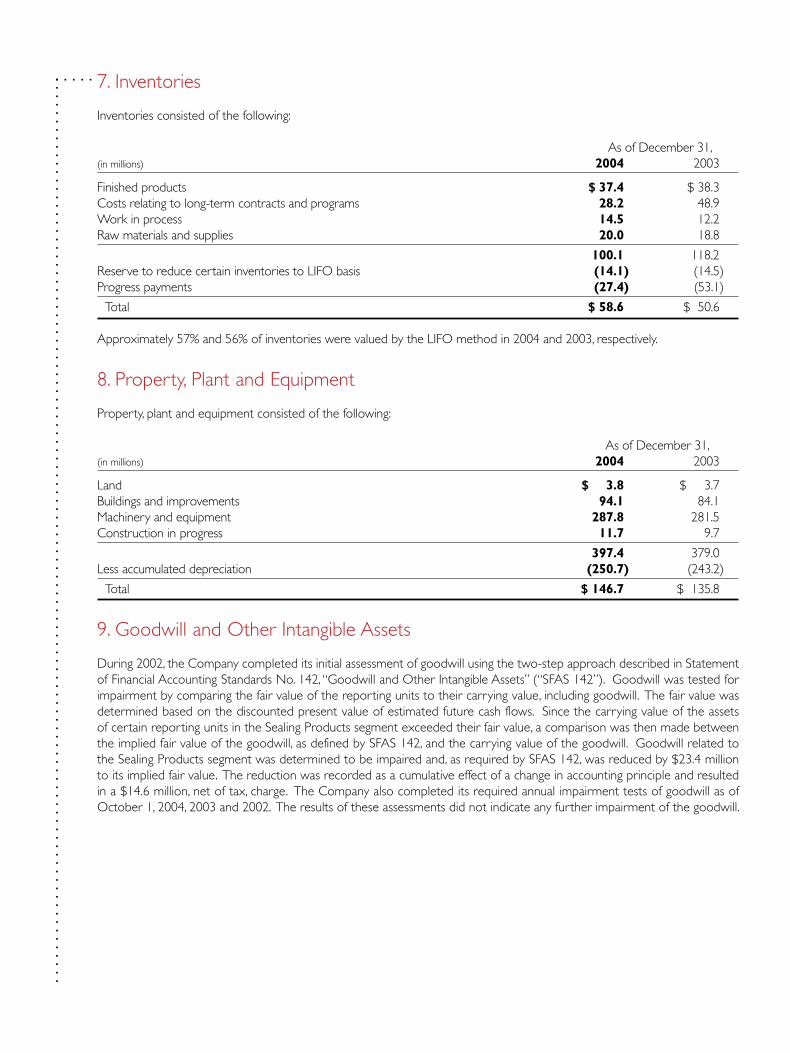
............................................................................................................ ..... 7. Inventories
Inventories consisted of the following:
As of December 31,(in millions) 2004 2003
Finished products $ 37.4 $ 38.3Costs relating to long-term contracts and programs 28.2 48.9Work in process 14.5 12.2Raw materials and supplies 20.0 18.8
100.1 118.2Reserve to reduce certain inventories to LIFO basis (14.1) (14.5)Progress payments (27.4) (53.1)
Total $ 58.6 $ 50.6
Approximately 57% and 56% of inventories were valued by the LIFO method in 2004 and 2003, respectively.
8. Property, Plant and Equipment
Property, plant and equipment consisted of the following:
As of December 31,(in millions) 2004 2003
Land $ 3.8 $ 3.7Buildings and improvements 94.1 84.1Machinery and equipment 287.8 281.5Construction in progress 11.7 9.7
397.4 379.0Less accumulated depreciation (250.7) (243.2)
Total $ 146.7 $ 135.8
9. Goodwill and Other Intangible Assets
During 2002, the Company completed its initial assessment of goodwill using the two-step approach described in Statement of Financial Accounting Standards No. 142, “Goodwill and Other Intangible Assets” (“SFAS 142”). Goodwill was tested for impairment by comparing the fair value of the reporting units to their carrying value, including goodwill. The fair value was determined based on the discounted present value of estimated future cash flows. Since the carrying value of the assets of certain reporting units in the Sealing Products segment exceeded their fair value, a comparison was then made between the implied fair value of the goodwill, as defined by SFAS 142, and the carrying value of the goodwill. Goodwill related to the Sealing Products segment was determined to be impaired and, as required by SFAS 142, was reduced by $23.4 million to its implied fair value. The reduction was recorded as a cumulative effect of a change in accounting principle and resulted in a $14.6 million, net of tax, charge. The Company also completed its required annual impairment tests of goodwill as of October 1, 2004, 2003 and 2002. The results of these assessments did not indicate any further impairment of the goodwill.

............................................................................................................ ..... The changes in the net carrying value of goodwill by reportable segments for the years ended December 31, 2004 and 2003,
are as follows:
Engine Sealing Engineered Products and Products Products Services Total
Goodwill, net as of December 31, 2002 $37.1 $79.5 $7.1 $123.7
Acquisitions 4.2 – – 4.2Post acquisition adjustment – 0.4 – 0.4
Goodwill, net as of December 31, 2003 41.3 79.9 7.1 128.3
Post-acquisition adjustment – (0.3) – (0.3)Sale of business – (2.3) – (2.3)
Goodwill, net as of December 31, 2004 $41.3 $77.3 $7.1 $125.7
The gross carrying amount and accumulated amortization of identifiable intangible assets is as follows:
As of December 31, 2004 As of December 31, 2003 Gross Gross Carrying Accumulated Carrying Accumulated(in millions) Amount Amortization Amount Amortization
Customer relationships $32.7 $ 9.3 $32.7 $ 6.3Existing technology 16.5 1.8 16.5 1.2Trademarks 24.5 2.5 24.5 2.1Other 10.6 3.4 11.6 2.9
$84.3 $17.0 $85.3 $12.5
Amortization expense for the years ended December 31, 2004, 2003 and 2002, was $5.5 million, $4.6 million and $4.1 mil-lion, respectively. Amortization expense for these intangible assets for 2005 through 2009 is estimated to be approximately $5 million per year. The Company had approximately $16 million of trademarks with indefinite lives as of December 31, 2004 and 2003. The Company has completed the required impairment testing of its indefinite-lived intangible assets and no impairment was indicated.
10. Long-Term Debt
The Company’s long-term debt at December 31, 2004 and 2003, is summarized as follows:
(in millions) 2004 2003
TIDES $145.0 $145.0Coltec Senior Notes 3.1 3.1Promissory notes 6.9 9.4Industrial revenue bonds 9.6 12.1Other notes payable, interest rates from 3.0% to 8.7% 0.2 0.6
164.8 170.2Less current maturities of long-term debt 0.2 2.9
$164.6 $167.3
/ Form 10-K: pages 56 / 57

............................................................................................................ ..... The Company’s primary operating subsidiaries executed a credit agreement dated May 16, 2002, as amended, for a senior
secured revolving credit facility with a group of banks. This agreement gives the Company the ability to borrow up to $60 million through May 2006. Borrowings are available at LIBOR plus a margin of 1.50% to 2.50%. The Company paid a $3.1 million commitment fee in 2002, which is being amortized over the life of the agreement. The Company pays an annual unused line fee ranging from 0.25% to 0.75% depending on the amount of utilization. The Company also pays an annual collateral management fee of 0.0125%.
There have been no borrowings under this credit facility since its inception. Borrowings under the credit facility would be collateralized by receivables, inventories, equipment, intellectual property, insurance receivables and all other personal property assets of EnPro and its U.S. subsidiaries and by a pledge of 65% of the capital stock of foreign subsidiaries. The credit facility contains customary restrictions, covenants and events of default for financings of this type, including without limitation, restric-tions on the ability to pay dividends, to repurchase shares, to incur additional debt and to acquire new businesses.
As of December 31, 2004, Coltec had outstanding $145 million of 5¼% TIDES due April 15, 2028. The TIDES are convertible at the option of the holder into a combination of 0.955248 of a share of Goodrich common stock and 0.1910496 of a share of EnPro common stock, subject to adjustment. Should the holders exercise their right to convert the TIDES, Coltec would be required to deliver shares of Goodrich and EnPro common stock to the holders as promptly as practicable after the conversion date and in connection therewith would be required to purchase shares of Goodrich common stock in the open market, directly from Goodrich or by exercising its call options on Goodrich common stock discussed below. A conversion of the TIDES is anti-dilutive and therefore is not included in the diluted share calculation. Failure to honor conversion rights would be a default under those agreements. Further, the value of Goodrich and EnPro common stock may increase to a level where Coltec’s cost to acquire shares in a conversion could exceed, with no maximum, the $145 million aggregate liquidation value of the TIDES. Coltec has purchased call options on shares of Goodrich common stock with an exercise price of $52.34 per share (the conversion price). Until they expire in March 2007, the call options provide protection against the risk that the cash required to finance conversions of the TIDES could exceed the TIDES liquidation value. The value of the call options as of December 31, 2004, is $2.5 million and is reported in other non-current assets on the Consolidated Balance Sheets.
The 7½% Coltec Senior Notes are payable in full in 2008. The industrial revenue bonds are payable in full in 2009 and bear interest rates of 6.4% to 6.55%. The Company executed variable rate promissory notes dated April 4, 2003, and December 11, 2002, with principal amounts of $4.7 million each, in connection with the purchase of life insurance policies to fund certain pre-retirement death benefits for the Company’s executive officers. The Company recorded a corresponding asset equivalent to the cash surrender value of these policies. The promissory notes are collateralized by the life insurance policies and bear interest at LIBOR plus a margin of 1.75%, which was 3.12% as of December 31, 2004, and is adjusted annually. The promissory notes are payable at the earliest of termination of the policies, death of persons insured under the policies, or sixty days prior to the expiration of the policies. During 2004, the policies related to a former executive were terminated and accordingly, $2.5 million of the notes and a corresponding amount of the cash surrender values were reduced.
Future principal payments on long-term debt are as follows:
(in millions)
2005 $ 0.22006 –2007 –2008 3.12009 9.6Thereafter 151.9
$164.8

............................................................................................................ ..... 11. Fair Values of Financial Instruments
The Company’s accounting policies with respect to financial instruments are described in Note 1. The carrying values of the Company’s significant financial instruments reflected in the Consolidated Balance Sheets approximate their respective fair values at December 31, 2004 and 2003, except for the following instruments:
2004 2003
Carrying Fair Carrying Fair(in millions) Value Value Value Value
Long-term debt $164.8 $159.4 $170.2 $151.0
The fair values for long-term debt are based on quoted market prices or on rates available to the Company for debt with similar terms and maturities.
12. Pensions and Post-Retirement Benefits
The Company and its subsidiaries have several non-contributory defined benefit pension plans covering eligible employees in the United States, Canada, Mexico and several European countries. Salaried employees’ benefit payments are generally determined using a formula that is based on an employee’s compensation and length of service. Hourly employees’ benefit payments are generally determined using stated amounts for each year of service. The Company’s employees also participate in voluntary contributory retirement savings plans for salaried and hourly employees maintained by the Company and its subsidiaries. Under provisions of these plans, eligible employees can receive matching contributions up to the first 6% of their eligible earnings. Expenses recorded in 2004, 2003 and 2002 for matching contributions under these plans were $4.6 million, $4.6 million and $4.1 million, respectively. The Company provides, through non-qualified plans, supplemental pension benefits to a limited number of employees. The Company uses a December 31 measurement date for its defined benefit and non-qualified plans.
The Company’s general funding policy for qualified defined benefit pension plans is to contribute amounts that are at least sufficient to satisfy regulatory funding standards. In 2004 and 2003, the Company contributed discretionary amounts of $10.0 million and $8.0 million, respectively, to the U.S. pension plans. The Company anticipates that there will be no required funding in 2005, and has not determined whether it will make a discretionary contribution in 2005 to the U.S. pension plans. The Company expects to make total contributions of approximately $2 million in 2005 to the foreign pension plans. The projected benefit obligation, accumulated benefit obligation and fair value of plan assets for the defined benefit pension plans with accumulated benefit obligations in excess of plan assets were $148.5 million, $135.9 million and $109.0 million at December 31, 2004, and $122.0 million, $109.4 million and $92.3 million at December 31, 2003, respectively.
The Company amortizes prior service cost and unrecognized gains and losses using the straight-line basis over the average future service life of active participants.
In 2004, $0.5 million of the curtailment loss for the U.S. pension plans and $2.8 million of the special termination benefits for the foreign pension plans are included in restructuring and other costs, and $0.6 million of the curtailment loss for the U.S. pension plans is included in loss (gain) on sale of assets, net in the Consolidated Statements of Operations.
Certain of the Company’s subsidiaries also sponsor unfunded defined benefit post-retirement plans that provide certain health-care and life insurance benefits to eligible employees. The health-care plans are contributory, with retiree contributions adjusted periodically, and contain other cost-sharing features, such as deductibles and coinsurance. The life insurance plans are generally noncontributory.
/ Form 10-K: pages 58 / 59

............................................................................................................ ..... The following table sets forth the change in projected benefit obligations, change in plan assets, funded status and accumulated
benefit obligations of the Company’s U.S. defined benefit pension and other post-retirement plans as of and for the years ended December 31, 2004 and 2003.
Pension Benefits Other Benefits(in millions) 2004 2003 2004 2003
Change in Projected Benefit Obligations Projected benefit obligations at beginning of year $114.7 $ 96.7 $ 9.0 $ 8.0 Service cost 5.9 5.3 0.7 0.7 Interest cost 7.5 6.7 0.5 0.6 Actuarial loss (gain) 11.3 7.3 0.3 (0.8) Amendments 1.4 0.6 (0.2) 1.8 Curtailment and settlement (1.0) – – – Benefits paid (2.4) (1.9) (0.7) (0.6) Other – – – (0.7)
Projected benefit obligations at end of year 137.4 114.7 9.6 9.0
Change in Plan Assets Fair value of plan assets at beginning of year 92.0 70.3 Actual return on plan assets 9.1 15.4 Amount transferred from Goodrich – 0.2 Company contributions 10.0 8.0 Benefits paid (2.4) (1.9)
Fair value of plan assets at end of year 108.7 92.0
Funded Status Funded status (28.7) (22.7) (9.6) (9.0) Unrecognized actuarial loss 24.9 16.7 1.9 1.7 Unrecognized prior service cost 11.3 13.6 0.9 1.0
Net amount recognized $ 7.5 $ 7.6 $(6.8) $(6.3)
Amounts Recognized in the Consolidated Balance Sheets Prepaid benefit cost $ 7.5 $ 7.6 $ – $ – Accrued benefit cost – – (6.8) (6.3) Additional liability (24.8) (18.6) – – Intangible asset 11.3 13.6 – – Accumulated other comprehensive income 13.5 5.0 – –
Net amount recognized $ 7.5 $ 7.6 $(6.8) $(6.3)
Accumulated Benefit Obligations $126.0 $103.0
The additional liability is included in other non-current liabilities and the intangible asset and prepaid benefit cost are included in the other non-current assets in the Consolidated Balance Sheets.

............................................................................................................ ..... Pension Benefits Other Benefits
(in millions) 2004 2003 2004 2003
Components of Net Periodic Benefit Cost Service cost $ 5.9 $ 5.3 $ 0.7 $ 0.7 Interest cost 7.5 6.7 0.5 0.6 Expected return on plan assets (7.7) (6.1) – – Amortization of prior service cost 2.5 2.6 (0.2) (0.1) Recognized net actuarial loss 0.7 0.9 0.1 – Curtailment loss 1.1 – – –
Net periodic benefit cost $10.0 $ 9.4 $ 1.1 $ 1.2
Weighted-Average Assumptions Used to Determine Benefit Obligations at December 31 Discount rate 6.0% 6.5% 6.0% 6.5% Rate of compensation increase 4.0% 4.0% 4.0% 4.0%
Weighted-Average Assumptions Used to Determine Net Periodic Benefit Cost for Years Ended December 31 Discount rate 6.5% 7.0% 6.5% 7.0% Expected long-term return on plan assets 8.5% 8.5% – – Rate of compensation increase 4.0% 4.0% 4.0% 4.0%
The discount rate reflects the current rate at which the pension liabilities could be effectively settled at the end of the year. The discount rate was determined by matching the Company’s expected benefit payments, taking into account the plans’ demographics, to payments from a stream of AA or higher bonds available in the marketplace. This produced a discount rate of 6.0% at December 31, 2004. There are no known or anticipated changes in our discount rate assumption that will impact our pension expense in 2005. A 25 basis point decrease (increase) in our discount rate, holding constant our expected long-term return on plan assets and other assumptions, would increase (decrease) pension expense by approximately $0.6 million per year.
The overall expected long-term rate of return on assets was determined based upon weighted-average historical returns over an extended period of time for the asset classes in which the plans invest according to the Company’s current investment policy.
Assumed Health Care Cost Trend Rates at December 31 2004 2003
Health care cost trend rate assumed for next year 9.0% 10.0% Rate to which the cost trend rate is assumed to decline (the ultimate rate) 4.8% 4.8% Year that the rate reaches the ultimate trend rate 2011 2011
A one percentage point change in the assumed health-care cost trend rate would not have an impact of greater than $0.1 million on net periodic benefit cost and $0.5 million on benefit obligations.
/ Form 10-K: pages 60 / 61
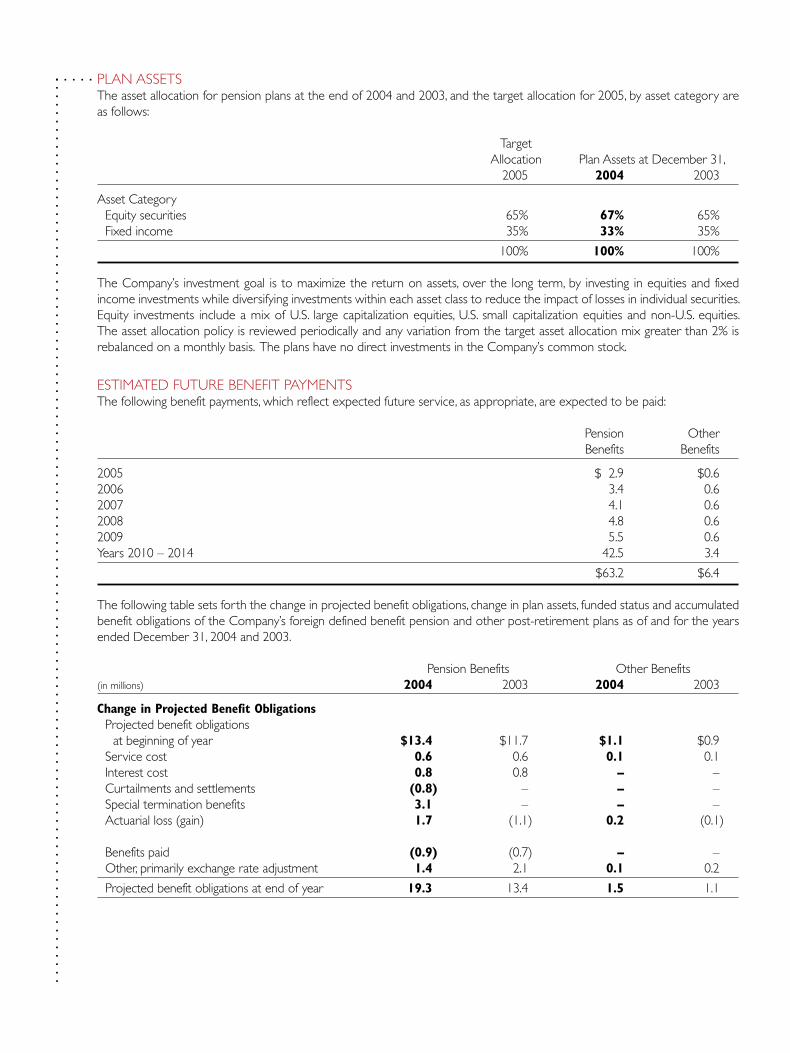
............................................................................................................ ..... PLAN ASSETS
The asset allocation for pension plans at the end of 2004 and 2003, and the target allocation for 2005, by asset category are as follows:
Target Allocation Plan Assets at December 31, 2005 2004 2003
Asset Category Equity securities 65% 67% 65% Fixed income 35% 33% 35%
100% 100% 100%
The Company’s investment goal is to maximize the return on assets, over the long term, by investing in equities and fixed income investments while diversifying investments within each asset class to reduce the impact of losses in individual securities. Equity investments include a mix of U.S. large capitalization equities, U.S. small capitalization equities and non-U.S. equities. The asset allocation policy is reviewed periodically and any variation from the target asset allocation mix greater than 2% is rebalanced on a monthly basis. The plans have no direct investments in the Company’s common stock.
ESTIMATED FUTURE BENEFIT PAYMENTSThe following benefit payments, which reflect expected future service, as appropriate, are expected to be paid:
Pension Other Benefits Benefits
2005 $ 2.9 $0.62006 3.4 0.62007 4.1 0.62008 4.8 0.62009 5.5 0.6Years 2010 – 2014 42.5 3.4
$63.2 $6.4
The following table sets forth the change in projected benefit obligations, change in plan assets, funded status and accumulated benefit obligations of the Company’s foreign defined benefit pension and other post-retirement plans as of and for the years ended December 31, 2004 and 2003.
Pension Benefits Other Benefits(in millions) 2004 2003 2004 2003
Change in Projected Benefit Obligations Projected benefit obligations at beginning of year $13.4 $11.7 $1.1 $0.9 Service cost 0.6 0.6 0.1 0.1 Interest cost 0.8 0.8 – – Curtailments and settlements (0.8) – – – Special termination benefits 3.1 – – – Actuarial loss (gain) 1.7 (1.1) 0.2 (0.1)
Benefits paid (0.9) (0.7) – – Other, primarily exchange rate adjustment 1.4 2.1 0.1 0.2
Projected benefit obligations at end of year 19.3 13.4 1.5 1.1

............................................................................................................ ..... Pension Benefits Other Benefits
(in millions) 2004 2003 2004 2003
Change in Plan Assets Fair value of plan assets at beginning of year 7.6 6.3 Actual return on plan assets 0.5 0.9 Company contributions 1.2 0.3 Benefits paid (0.9) (0.7) Other 0.2 0.8
Fair value of plan assets at end of year 8.6 7.6
Funded Status Funded status (10.7) (5.8) (1.5) (1.1) Unrecognized actuarial loss (gain) 2.4 0.6 0.1 (0.1) Unrecognized prior service cost – – 1.0 1.0 Unrecognized net transition obligation (0.3) (0.4) – –
Accrued benefit cost $ (8.6) $ (5.6) $(0.4) $(0.2)
Amounts Recognized in the Consolidated Balance Sheets Prepaid benefit cost $ 2.1 $ 1.7 $ – $ – Accrued benefit cost (11.4) (7.8) (0.4) (0.2) Accumulated other comprehensive income 0.7 0.5 – –
Net amount recognized $ (8.6) $ (5.6) $(0.4) $(0.2)
Accumulated Benefit Obligations $ 16.3 $11.8
Components of Net Periodic Benefit Cost Service cost $ 0.6 $ 0.6 $ 0.1 $ 0.1 Interest cost 0.8 0.8 – – Expected return on assets (0.5) (0.6) – – Amortization of prior service cost – – 0.1 0.1 Recognized net actuarial loss 0.1 0.3 – – Curtailment loss (0.6) – – – Special termination benefits 3.1 – – –
Net periodic benefit cost $ 3.5 $ 1.1 $ 0.2 $ 0.2
Weighted-Average Assumptions Used to Determine Benefit Obligations at December 31 Discount rate 5.3% 6.0% 4.5% 5.3% Rate of compensation increase 3.1% 3.1% 3.0% 3.0%
Weighted-Average Assumptions Used to Determine Net Periodic Benefit Cost for Years Ended December 31 Discount rate 6.0% 6.3% 5.3% 5.3% Expected long-term return on plan assets 7.7% 8.6% – – Rate of compensation increase 3.1% 3.5% 3.0% 3.0%
/ Form 10-K: pages 62 / 63

............................................................................................................ ..... ASSUMED HEALTH CARE COST TREND RATES
The assumed health care cost trend rate at December 31, 2004 and 2003 was a flat 4%.
A one percentage point change in the assumed health-care cost trend rate would not have an impact of greater than $0.1 million on net periodic benefit cost and $0.2 million on benefit obligations.
PLAN ASSETSThe asset allocation for the Canadian pension plan at the end of 2004 and 2003 and the target allocation for 2005 is 60% equity securities, 35% fixed income, and 5% other. The asset allocation for the Mexican pension plan at the end of 2004 and 2003 and the target allocation for 2005 is 100% fixed income. The European plans are generally unfunded.
ESTIMATED FUTURE BENEFIT PAYMENTSThe following benefit payments, which reflect expected future service, as appropriate, are expected to be paid:
Pension Other Benefits Benefits
2005 $ 1.8 $ –2006 2.2 –2007 2.2 –2008 2.1 –2009 1.1 0.1Years 2010 – 2014 7.1 0.3
$16.5 $0.4
13. Accumulated Other Comprehensive Income (Loss)
Accumulated other comprehensive income (loss) consisted of the following:
As of December 31,(in millions) 2004 2003
Unrealized translation adjustments $16.1 $10.1Minimum pension liability (9.4) (3.7)Accumulated net gain (loss) on cash flow hedges 0.3 (0.7)
Accumulated other comprehensive income $ 7.0 $ 5.7
The minimum pension liability amounts are net of deferred taxes of $4.8 million and $1.8 million, in 2004 and 2003, respec-tively. The accumulated net gain (loss) on cash flow hedges amounts are net of deferred taxes of $0.1 million and $0.3 million, in 2004 and 2003, respectively.
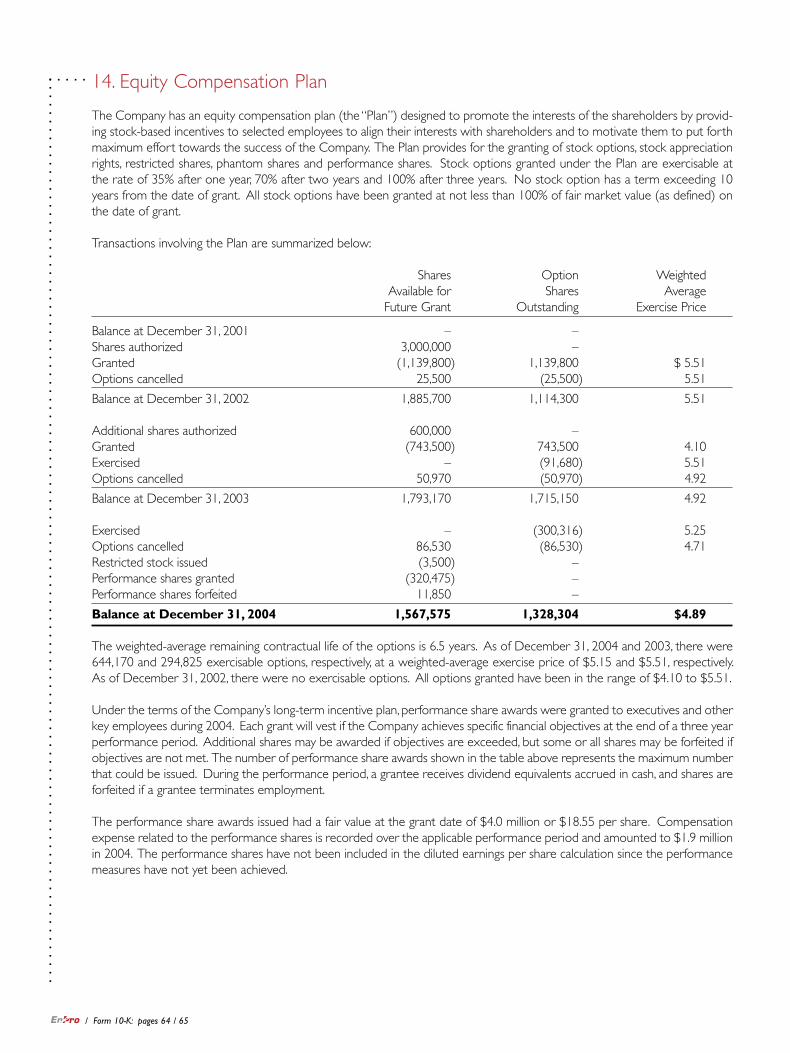
............................................................................................................ ..... 14. Equity Compensation Plan
The Company has an equity compensation plan (the “Plan”) designed to promote the interests of the shareholders by provid-ing stock-based incentives to selected employees to align their interests with shareholders and to motivate them to put forth maximum effort towards the success of the Company. The Plan provides for the granting of stock options, stock appreciation rights, restricted shares, phantom shares and performance shares. Stock options granted under the Plan are exercisable at the rate of 35% after one year, 70% after two years and 100% after three years. No stock option has a term exceeding 10 years from the date of grant. All stock options have been granted at not less than 100% of fair market value (as defined) on the date of grant.
Transactions involving the Plan are summarized below:
Shares Option Weighted Available for Shares Average Future Grant Outstanding Exercise Price
Balance at December 31, 2001 – –Shares authorized 3,000,000 –Granted (1,139,800) 1,139,800 $ 5.51Options cancelled 25,500 (25,500) 5.51
Balance at December 31, 2002 1,885,700 1,114,300 5.51
Additional shares authorized 600,000 –Granted (743,500) 743,500 4.10Exercised – (91,680) 5.51Options cancelled 50,970 (50,970) 4.92
Balance at December 31, 2003 1,793,170 1,715,150 4.92
Exercised – (300,316) 5.25Options cancelled 86,530 (86,530) 4.71Restricted stock issued (3,500) –Performance shares granted (320,475) –Performance shares forfeited 11,850 –
Balance at December 31, 2004 1,567,575 1,328,304 $4.89
The weighted-average remaining contractual life of the options is 6.5 years. As of December 31, 2004 and 2003, there were 644,170 and 294,825 exercisable options, respectively, at a weighted-average exercise price of $5.15 and $5.51, respectively. As of December 31, 2002, there were no exercisable options. All options granted have been in the range of $4.10 to $5.51.
Under the terms of the Company’s long-term incentive plan, performance share awards were granted to executives and other key employees during 2004. Each grant will vest if the Company achieves specific financial objectives at the end of a three year performance period. Additional shares may be awarded if objectives are exceeded, but some or all shares may be forfeited if objectives are not met. The number of performance share awards shown in the table above represents the maximum number that could be issued. During the performance period, a grantee receives dividend equivalents accrued in cash, and shares are forfeited if a grantee terminates employment.
The performance share awards issued had a fair value at the grant date of $4.0 million or $18.55 per share. Compensation expense related to the performance shares is recorded over the applicable performance period and amounted to $1.9 million in 2004. The performance shares have not been included in the diluted earnings per share calculation since the performance measures have not yet been achieved.
/ Form 10-K: pages 64 / 65

............................................................................................................ ..... 15. Business Segment Information
The Company has three reportable segments. The Sealing Products segment manufactures sealing and PTFE products. The Engineered Products segment manufactures metal polymer bearings, air compressor systems and vacuum pumps, and reciprocat-ing compressor components. The Engine Products and Services Segment manufactures and services heavy-duty, medium-speed diesel and natural gas engines. The Company’s reportable segments are managed separately based on differences in their products and services and their end-customers. Segment profit is total segment revenue reduced by operating expenses and restructuring and other costs identifiable with the segment. Corporate expenses include general corporate administrative costs. Expenses not directly attributable to the segments, corporate expenses, net interest expense, asbestos-related expenses, gains/losses or impairments related to the sale of assets and income taxes are not included in the computation of segment profit. The accounting policies of the reportable segments are the same as those for the Company.
Years Ended December 31,(in millions) 2004 2003 2002
Sales Sealing Products $374.7 $333.0 $315.7 Engineered Products 335.8 304.2 284.9 Engine Products and Services 116.9 94.4 111.6
827.4 731.6 712.2 Intersegment sales (1.1) (1.5) (1.8)
Total sales $826.3 $730.1 $710.4
Segment Profit Sealing Products $ 58.6 $ 48.7 $ 39.3 Engineered Products 32.6 30.9 31.8 Engine Products and Services 0.9 8.0 4.0
Total segment profit 92.1 87.6 75.1
Corporate expenses (26.8) (22.5) (16.1)Asbestos related expenses (10.4) (9.8) (18.0)Gain (loss) on sale of assets, net (1.8) 2.5 0.6Interest – net (7.1) (7.6) (13.7)Mark-to-market adjustment for call options (0.2) 1.2 (16.7)Other income (expenses), net 5.1 (0.5) (28.0)
Income (loss) before income taxes and distributions on TIDES $ 50.9 $ 50.9 $ (16.8)
No customer accounted for 10% or more of net sales in 2004, 2003 or 2002.

............................................................................................................ ..... Years Ended December 31,
(in millions) 2004 2003 2002
Capital Expenditures Sealing Products $ 8.4 $ 8.3 $ 6.7 Engineered Products 24.0 9.7 7.4 Engine Products and Services 3.5 4.5 3.8 Corporate 1.0 0.2 1.7
Total capital expenditures $ 36.9 $ 22.7 $ 19.6
Depreciation and Amortization Expense Sealing Products $ 11.1 $ 10.7 $ 10.5 Engineered Products 15.9 15.0 14.4 Engine Products and Services 3.9 5.1 4.4 Corporate 0.7 0.8 0.6
Total depreciation and amortization $31.6 $ 31.6 $ 29.9
Geographic Areas Net Sales United States $489.1 $438.7 $453.8 Europe 211.6 180.2 160.7 Other Foreign 125.6 111.2 95.9
Total $826.3 $730.1 $710.4
Net sales are attributed to countries based on location of the customer.
As of December 31,(in millions) 2004 2003
Assets Sealing Products $ 183.1 $ 175.9 Engineered Products 289.8 279.1 Engine Products and Services 61.8 59.2 Corporate 646.3 506.5
$1,181.0 $1,020.7
Long-Lived Assets United States $ 163.4 $ 173.7 Germany 75.6 76.2 France 64.1 62.4 Other Foreign 36.6 24.6
Total $ 339.7 $ 336.9
Long-lived assets consist of property, plant and equipment, goodwill and other intangible assets.
/ Form 10-K: pages 66 / 67

............................................................................................................ ..... 16. Discontinued Operations
Prior to the Distribution, Coltec transferred Coltec Aerospace to Goodrich by way of a dividend. The transfer of Coltec Aero-space to Goodrich represented the disposal of a segment. Accordingly, Coltec Aerospace was accounted for as a discontinued operation through the Distribution date and its revenues, costs and expenses, and cash flows have been segregated in the Company’s Consolidated Statements of Operations and Consolidated Statements of Cash Flows.
The following summarizes the results of discontinued operations, which consist solely of the results of Coltec Aerospace:
Year Ended(in millions) December 31, 2002
Sales $ 292.9
Pretax income $ 36.1Income tax expense 11.9
Income from discontinued operations $ 24.2
17. Commitments and Contingencies
GENERALVarious claims, lawsuits and administrative proceedings, all arising in the ordinary course of business with respect to commer-cial, product liability, asbestos and environmental matters, are pending or threatened against the Company or its subsidiaries and seek monetary damages or other remedies. The Company believes that any liability that may finally be determined with respect to commercial and non-asbestos product liability claims should not have a material effect on the Company’s consoli-dated financial condition or results of operations. From time to time, the Company and its subsidiaries are also involved as plaintiffs in legal proceedings involving contract, patent protection, environmental and other matters.
ENVIRONMENTALThe Company’s facilities and operations are subject to federal, state and local environmental and occupational health and safety requirements of the U.S. and foreign countries. The Company takes a proactive approach to ensure compliance with all environmental, health and safety laws as they relate to its manufacturing operations and in proposing and implementing any remedial plans that may be necessary. The Company also conducts comprehensive compliance and management system audits at its facilities to maintain compliance and improve operational efficiency.
Although the Company believes past operations were in substantial compliance with the then applicable regulations, the Company or one of its subsidiaries has been notified that it is among the potentially responsible parties for the cost of inves-tigating and, in some cases, remediating contamination at 18 sites at which the costs are expected to exceed $100 thousand at each site. The majority of these sites relate to remediation projects at former operating facilities that were sold or closed and primarily deal with soil and groundwater remediation. Investigations have been completed for 14 sites and are in progress at four sites. The laws governing investigation and remediation of these sites can impose joint and several liability for the associated costs. Liability for these costs can be imposed on present and former owners or operators of the properties or on parties that generated the wastes that contributed to the contamination.
The Company’s policy is to accrue environmental investigation and remediation costs when it is both probable that a liability has been incurred and the amount can be reasonably estimated. The measurement of the liability is based on an evaluation of currently available facts with respect to each individual situation and takes into consideration factors such as existing technology, presently enacted laws and regulations and prior experience in remediation of contaminated sites. Liabilities are established for all sites based on the factors discussed above. As assessments and remediation progress at individual sites, these liabilities are reviewed periodically and adjusted to reflect additional technical data and legal information. As of December 31, 2004 and 2003, EnPro had an accrued liability of $34.0 million and $35.4 million, respectively, for estimated future expenditures relating to environmental contingencies. Of this amount, $15.7 million represents the Company’s share of liability as a potentially responsible party at a former industrial property located in Farmingdale, New York. The amounts recorded in the consolidated financial statements have been recorded on an undiscounted basis. Cash outflows for environmental remediation have been less than $2 million during each of the years 2004, 2003 and 2002.

............................................................................................................ ..... The Company believes that its reserves are adequate based on currently available information. Actual costs to be incurred
for identified situations in future periods may vary from estimates because of the inherent uncertainties in evaluating environ-mental exposures due to unknown conditions, changing government regulations and legal standards regarding liability. Subject to the imprecision in estimating future environmental costs, the Company believes that maintaining compliance with current environmental laws and government regulations will not require significant capital expenditures or have a material adverse effect on its financial condition or cash flows, but could be material to its results of operations in a given period.
COLT FIREARMS AND CENTRAL MOLONEYThe Company has contingent liabilities related to divested businesses for which certain of its subsidiaries retained liability or are obligated under indemnity agreements. These contingent liabilities include, but are not limited to, potential product liability and associated claims related to the Company’s former Colt Firearms subsidiary for firearms manufactured prior to its divestiture in 1990 and the Company’s former Central Moloney subsidiary for electrical transformers manufactured prior to its divestiture in 1994. No material product liability claims are currently pending against the Company related to Colt Firearms or Central Moloney. Colt Firearms has been named as a defendant in 37 cases filed by municipalities seeking to recover costs arising from gun-related injuries. Many of these cases have been dismissed or are inactive. The current owner of Colt Firearms is seeking indemnification from the Company’s subsidiary, Coltec, for these claims to the extent they involve firearms manufactured prior to March 1990. The Company has rejected Colt Firearms’ claims for indemnification relating to the municipal gun cases in all instances on various legal grounds. As a result, Colt Firearms has filed a lawsuit in New York State Court seeking reimbursement of costs incurred in defending municipal cases.
The Company also has ongoing obligations, which are included in retained liabilities of previously owned businesses in the Consolidated Balance Sheets, with regard to workers’ compensation, retiree medical and other retiree benefit matters that relate to the Company’s periods of ownership of these operations.
CRUCIBLE MATERIALS CORPORATIONThrough its Coltec subsidiary, the Company owned approximately 45% of the outstanding common stock of Crucible Materi-als Corporation (“Crucible”) up until its sale in October 2004. Crucible, which is engaged primarily in the manufacture and distribution of high technology specialty metal products, was a wholly owned subsidiary of Coltec until 1985. Coltec sold the Crucible common shares that it owned to Crucible, and thus Coltec no longer has any ownership interest in Crucible. No gain or loss was recorded on the sale.
In conjunction with the closure of a Crucible plant in the early 1980s, Coltec was required to fund two irrevocable trusts for retiree medical benefits for union employees at the plant. The first trust (the “Benefits Trust”) pays for these retiree medical benefits on an ongoing basis. Coltec has no continuing connection to the Benefits Trust, and thus the assets and liabilities of this trust are not included in the Company’s Consolidated Balance Sheets. Under the terms of the Benefits Trust agreement, the trustees retained an actuary to assess the adequacy of the assets in the Benefits Trust in 1995, and another actuarial report will be required in 2005 and 2015. If, at either or both of the future valuation dates, it is determined that the trust assets are not adequate to fund the payment of future medical benefits, Coltec will be required to contribute additional amounts. Based on preliminary information, an additional contribution in 2005 is not anticipated. In the event there are ever excess assets in the Benefits Trust, those excess assets will not revert to Coltec.
Because of the possibility of future contributions to the Benefits Trust, Coltec was required to establish a second trust (the “Back-Up Trust”) to cover potential shortfalls in the Benefits Trust. The assets and a corresponding liability of the Back-Up Trust are reflected in the Company’s Consolidated Balance Sheets in other non-current assets and in retained liabilities of previously owned businesses, respectively, and amounted to $28.5 million each at December 31, 2004. If the actuary determines that there are excess assets in the Back-Up Trust at the Benefits Trust valuation dates in 2005 and 2015, the excess assets will revert to Coltec based on a distribution formula and will be recorded in income upon receipt. Until such time as payments are required or excess assets revert to the Company, the assets and liability are kept equal to each other.
The Company also has ongoing obligations, which are included in retained liabilities of previously owned businesses in the Consolidated Balance Sheets, with regard to workers’ compensation, retiree medical and other retiree benefit matters, in addition to those mentioned previously, that relate to the Company’s period of ownership of this operation.
/ Form 10-K: pages 68 / 69

............................................................................................................ ..... DEBT AND CAPITAL LEASE GUARANTEES
As of December 31, 2004, the Company had contingent liabilities for potential payments on guarantees of certain debt and lease obligations totaling $11.7 million. These guarantees arose from the divestitures of Crucible, Central Moloney and Haber, and expire at various dates through 2010. There is no liability for these guarantees reflected in the Company’s Consolidated Balance Sheets. In the event that the other parties do not fulfill their obligations under the debt or lease agreements, the Company could be responsible for these obligations.
OTHER CONTINGENT LIABILITY MATTERSThe Company provides warranties on many of its products. The specific terms and conditions of these warranties vary depending on the product and the market in which the product is sold. The Company records a liability based upon estimates of the costs that may be incurred under its warranties after a review of historical warranty experience and information about specific warranty claims. Adjustments are made to the liability as claims data and historical experience warrant.
Changes in the carrying amount of the product warranty liability for the years ended December 31, 2004 and 2003 are as follows:
(in millions) 2004 2003
Balance at beginning of year $ 5.0 $ 5.7Charge to expense 0.2 1.2Charges to the accrual (1.8) (1.9)
Balance at end of year $ 3.4 $ 5.0
ASBESTOS HISTORY. Certain of the Company’s subsidiaries, primarily Garlock Sealing Technologies LLC (“Garlock”) and The Anchor Packing Company (“Anchor”), are among a large number of defendants in actions filed in various states by plaintiffs alleging injury or death as a result of exposure to asbestos fibers. Among the products at issue in these actions are industrial sealing products, predominantly gaskets and packing products. The damages claimed vary from action to action, and in some cases plaintiffs seek both compensatory and punitive damages. To date, neither Garlock nor Anchor has been required to pay any punitive damage awards, although there can be no assurance that they will not be required to do so in the future. Liability for compensatory damages has historically been allocated among all responsible defendants. Since the first asbestos-related lawsuits were filed against Garlock in 1975, Garlock and Anchor have processed more than 600,000 asbestos claims to conclusion (including judgments, settlements and dismissals) and, together with their insurers, have paid more than $1 billion in settlements and judgments and approximately $325 million in fees and expenses.
CLAIMS MIX. Of those claims resolved, approximately 3% have been claims of plaintiffs alleging the disease mesothelioma, approximately 6% have been claims of plaintiffs with lung or other cancers, and more than 90% have been claims of plaintiffs alleging asbestosis, pleural plaques or other impairment of the respiratory system. Out of the 133,000 open cases at Decem-ber 31, 2004, the Company is aware of only approximately 6,300 that involve a claimant with mesothelioma, lung cancer or some other cancer.
PRODUCT DEFENSES. The asbestos-containing products formerly sold by Garlock and Anchor were encapsulated, which means the asbestos fibers were incorporated into the product during the manufacturing process and sealed in a binder. They were also nonfriable, which means they could not be crumbled by hand pressure. The U.S. Occupational Safety and Health Administration, which began generally requiring warnings on asbestos-containing products in 1972, has never required that a warning be placed on products such as Garlock’s gaskets. Even though no warning label was required, Garlock included one on all of its asbestos-containing products beginning in 1978. Further, gaskets such as those previously manufactured and sold by Garlock are one of the few asbestos-containing products still permitted to be manufactured under regulations of the Environmental Protection Agency. Garlock discontinued distributing asbestos-containing products in the U.S. during 2000 and worldwide in mid-2001. From the mid-1980s until 2000, U.S. sales of asbestos-containing industrial sealing products were not a material part of Garlock’s sales, and its sales of asbestos-containing products were predominantly to sophisticated purchasers such as the U.S. Navy and large petrochemical facilities. These purchasers generally have extensive health and safety procedures and are familiar with the risks associated with the use and handling of industrial sealing products that contain asbestos.

............................................................................................................ ..... Garlock’s product defenses have enabled it to be successful at trial, winning defense verdicts in four of five cases that it tried
to verdict in 2003, and receiving defense verdicts in five of eleven cases decided in 2004. In the successful jury trials, the juries determined that Garlock’s products were not defective and that Garlock was not negligent. In the cases decided by judges, the judges determined that the claimant failed to make a sufficient showing of exposure to Garlock’s products.
RECENT TRIAL RESULTS. During 2004, Garlock began seventeen trials involving twenty plaintiffs. Verdicts were rendered against Garlock in six cases. Garlock won defense verdicts with respect to three plaintiffs (in two trials) and the judge directed verdicts in favor of Garlock in two cases. There were two trials started in another case, both of which resulted in mistrials. Seven cases were settled during trial, and another case resulted in a hung jury.
An El Paso, Texas jury awarded a deceased 64-year-old pipe fitter $2.6 million in compensatory damages in April, allocating to Garlock a 25% share, and $1 million in punitive damages. In November, the trial court ruled that Garlock was entitled to a set-off for settlements collected from other defendants. The set-off exceeded the compensatory and punitive damage awards. As a result, the trial judge determined that Garlock owed no money on this award and did not enter a punitive damage judgment.
In May, a Baltimore jury returned a verdict against Garlock and two other defendants, assessing a one-third share to each, in favor of a 52-year-old boiler technician who died from mesothelioma. A judgment of $2.5 million was entered against Garlock.
In October, a Los Angeles jury returned a verdict that included an award of $7.6 million compensatory damages and $15 million punitive damages against Garlock in a case involving a 60-year-old machinist with mesothelioma.
In November, a jury in Niagara Falls, New York, returned a verdict of $3.75 million against Garlock and one other defendant in a case involving a 79-year-old maintenance mechanic with mesothelioma. The jury assessed 60% liability against Garlock and 40% against the other defendant. Garlock is entitled to set-offs and, as a result, Garlock’s share of the verdict is approximately $1.8 million.
Garlock’s share of each of the other two verdicts (one in Cass County, Texas, and the other in Newport News, Virginia), after applicable set-offs and credits, will be less than $300,000.
Garlock is appealing each of the significant adverse verdicts against it. In some cases, particularly in respect of the Los Angeles verdict, such appeals will require the provision of security in the form of an appeal bond, potentially in amounts greater than the verdicts. The Company is required to provide cash collateral to secure the full amount of the bonds, which will restrict the usage of a significant amount of the Company’s cash for the entire periods of such appeals. The length of time for appeals can vary, and could be as long as two or three years. For example, in Los Angeles the Company has posted a bond in the amount of $34.1 million to stay enforcement of the $22.6 million verdict. The Company is confident that Garlock will prevail in the appeals, particularly on the issue of punitive damages. Garlock has a track record of success in a majority of its previous appeals. However, there can be no assurance that any or all of Garlock’s appeals will be successful.
SETTLEMENTS. Garlock settles and disposes of actions on a regular basis. Garlock’s historical settlement strategy has been to try to match the timing of payments with recoveries received from insurance, which are limited by agreement to an annual amount that is currently set at $86.4 million per year ($21.6 million per quarter). That limit increases every three years by 8%, and the next scheduled increase will take effect in the third quarter of 2006. In 1999 and 2000, Garlock implemented a short-term aggressive settlement strategy. The purpose of this short-term strategy was to achieve a permanent reduction in the number of overall asbestos claims through the settlement of a larger than normal number of claims, including some claims not yet filed as lawsuits. Due to this short-term aggressive settlement strategy, and a significant overall increase in claims filings, the settlement amounts paid in each of the years 1999 through 2004 were greater than the amounts paid in any year prior to 1999. In 2001 Garlock resumed its historical settlement strategy. In fact, Garlock reduced new settlement commitments from $180 million in 2000 to $94 million in 2001, $86.1 million in 2002, $85.7 million in 2003, and $83.8 million in 2004. Because many of the commitments made in 1999, 2000, and early 2001 are being paid over a number of years, the settlement amounts that Garlock will pay in 2005 will continue to include some amounts for those settlements, but those amounts will be smaller than in recent years.
/ Form 10-K: pages 70 / 71

............................................................................................................ ..... Settlements are made without any admission of liability. Settlement amounts vary depending upon a number of factors,
including the jurisdiction where the action was brought, the nature and extent of the disease alleged and the associated medical evidence, the age and occupation of the plaintiff, the presence or absence of other possible causes of the plaintiff ’s alleged illness, the availability of legal defenses, and whether the action is an individual one or part of a group.
Before any payment on a settled claim is made, the claimant is required to submit a medical report acceptable to Garlock sub-stantiating the asbestos-related illness and meeting specific criteria of disability. In addition, sworn testimony or other evidence that the claimant worked with or around Garlock asbestos-containing products is required. The claimant is also required to sign a full and unconditional release of Garlock, its subsidiaries, parent, officers, directors, affiliates and related parties from any liability for asbestos-related injuries or claims.
STATUS OF ANCHOR. Anchor is an inactive and insolvent indirect subsidiary of Coltec. There is no remaining insurance coverage available to Anchor. Anchor has not committed to settle any actions since 1998. As cases reach the trial stage, Anchor is typically dismissed without payment.
INSURANCE COVERAGE. In the second quarter of 2004, the Company reached agreement with Equitas, the London-based entity responsible for the pre-1993 Lloyds’ of London policies in the Company’s insurance block, concerning the settlement of its exposure to the Company’s subsidiaries’ asbestos claims. As a result of the settlement, Garlock received $30 million in payment of receivables in the third quarter of 2004, and another $88 million was placed in an independent trust. The funds in the trust are available to pay the Equitas share of future claims and the trust is billed monthly for that share, just as Equitas was billed. As a result of that agreement, the $118 million of payments made by Equitas commuted $158 million of total nominal coverage. The $40 million difference reflects discounting for present value and for the Equitas solvency risk. The Company expects a portion of the discounted amount to be recoverable from after-tax earnings on the trust assets. At December 31, 2004, the market value of the funds remaining in the trust was approximately $85 million.
In the fourth quarter of 2004, the Company reached agreement with a group of London market carriers (other than Equitas) and one of its U.S. carriers that has some policies reinsured through the London market. As a result of the settlement, which resolved a pending arbitration among the parties, in January 2005, Garlock received $22 million in payment of receivables and another $54.5 million was placed in an independent trust. As part of the settlement, Garlock received another $1 million from an insolvent London carrier in February of 2005. The funds in the trust are available to pay the London carriers’ share of future claims and the trust will be billed monthly for that share, just as the carriers were billed. The $77.5 million of payments commuted $112.5 million of total nominal coverage. The $35 million difference reflects discounting for present value and for solvency and litigation risks. As with the Equitas trust, the Company expects a portion of the discounted amount to be recover-able from after-tax earnings on the trust assets.
The $22 million paid to Garlock in January 2005 by the London market carriers under the settlement agreement consists of approximately $15.6 million of the $86.4 million due under the cap agreement in 2004. As a result, Garlock had higher asbes-tos cash outflows in 2004 than in 2003. However, had the $22 million been received in 2004, Garlock’s net cash outflow for all asbestos-related claims and expenses would have been significantly less than the $35.5 million net cash outflow in 2003.
As of December 31, 2004, after factoring in the amounts placed in trust as a result of the Equitas and London market settle-ments, Garlock had available $662.1 million of insurance and trust coverage that the Company believes will be available to cover future claim and expense payments. In addition, Garlock classifies $70.1 million of otherwise available insurance as insolvent. The Company believes that Garlock will recover some of the insolvent insurance over time. In fact, Garlock recovered $2.2 million from insolvent carriers during 2004, $5.8 million during 2003, and $2.0 million during 2002.
Of the $662 million of collectible insurance and trust assets, the Company considers $573 million (87%) to be high quality because it is (a) with US-based carriers whose credit rating by S&P is investment grade (BBB) or better, and whose AM Best rating is excellent (A-) or better ($411.5 million), (b) in the Equitas trust ($85 million), (c) in the London trust ($54.5 million), or (d) London insurance settlement payments ($22 million) already made. The Company considers $89 million (13%) to be of moderate quality because it is with (a) other solvent US carriers who are unrated or below investment grade ($76 million) or (b) with various other London market carriers ($13 million). Of the $662 million, $218 million is allocated to claims that have been paid by Garlock and submitted to its insurance companies for reimbursement and $228 million is allocated to the Company’s estimated liability for future payments. Thus, as of December 31, 2004, $216 million remains available for additional future asbestos-related settlements.

............................................................................................................ ..... Arrangements with Garlock’s insurance carriers limit the amount of insurance proceeds that it is entitled to receive in any one
year. The amount of insurance available to cover asbestos-related payments by Garlock is currently limited to $86.4 million per year ($21.6 million per quarter). Because Garlock from time to time collects some insolvent insurance and because some of Garlock’s carriers pay as if there were no annual limit, Garlock receives amounts in excess of the limit in some periods. Amounts paid by Garlock in excess of insurance recoveries in any year that would be recoverable from insurance if there was no annual limit may be collected from the insurance companies in subsequent years so long as insurance is available, subject to the annual limit available in each subsequent year. To the extent that Garlock pays such amounts in a given year, these payments are recorded as a receivable.
In November 2003, Coltec received a letter and arbitration demand from one of its U.S.-based investment grade insurers claiming that the insurer was relieved of liability on a $40 million Coltec policy in connection with a 1998 settlement and payment in full by a related insurer of a $2 million Anchor policy. That insurer filed suit against Coltec in state court in New York in November 2004, making the same and other claims, and Coltec filed coverage litigation against the insurer in federal court in Pennsylvania in December 2004. Coltec intends to vigorously pursue the insurance coverage. The $40 million policy is included in Garlock’s $662 million remaining collectible coverage.
Insurance coverage for asbestos claims is not available to cover exposures initially occurring on and after July 1, 1984. Garlock and Anchor continue to be named as defendants in new actions, a few of which allege initial exposure after July 1, 1984. To date, no payments have been made with respect to these claims, pursuant to a settlement or otherwise. In addition, Garlock and Anchor believe that they have substantial defenses to these claims and therefore automatically reject them for settlement. However, there can be no assurance that any or all of these defenses will be successful in the future.
QUANTITATIVE CLAIMS INFORMATION. Due to their uncertain nature, management’s estimate of the liability for early-stage and unasserted claims covers a range of possible values, and the Company believes that no single amount in the range is a better estimate than any other amount in the range. Therefore, in accordance with applicable accounting rules, the Company recorded a liability at December 31, 2004, for $233.4 million, $90.6 million for advanced-stage cases and settled claims and $142.8 million for early-stage and future claims. The Company also recorded a corresponding receivable from its insurance carriers. The recorded amount for early-stage and unasserted claims is at the low end of the range of what the Company believes to be reasonably possible.
The Company’s outside counsel retained the expert claims valuation firm Bates White, LLC, to review Garlock’s product history, historical claims information and settlement experience and to assist and advise in connection with the management of Garlock asbestos claims and its estimation of Garlock’s liability for pending and reasonably estimable unasserted future asbestos claims. The Company received an opinion from Bates White dated February 17, 2005, to the effect that, “[b]ased on the range of events likely to transpire in the future, which are reasonably predicted for Garlock’s non-malignant claims through 2008 and for Garlock’s cancer claims through 2014, the reasonable and probable estimate of Garlock’s obligation for asbestos personal injury claims ranges from $226.5 million to $382.4 million.”
The Company has adopted the range predicted by its expert; however, it notes that Bates White also indicated the calculation of other potential estimates of Garlock’s future obligation for the period of the estimation that ranged from $197.2 million to $553.5 million. The Company cautions that points within that broader range remain possible outcomes. Also, while the Com-pany agrees with its expert that “beyond 2008 for Garlock non-malignant claims and beyond 2014 for Garlock cancer claims, there are reasonable scenarios in which the [asbestos] expenditure is de minimus,” it cautions that the process of estimating future liabilities is highly uncertain. In the words of the Bates White report, “the reliability of such estimates declines significantly for each year further into the future.” Plausible scenarios exist that could result in a total remaining asbestos liability for Garlock in excess of $1 billion, consistent with the high-end of management’s estimates provided in the previous two quarters.
The recording of a liability for early-stage and unasserted claims does not alter the Company’s strategy for managing its potential asbestos liabilities and insurance assets and has no impact on the ultimate amount paid for asbestos-related claims against its subsidiaries. However, the recording of that liability could, at some time in the future, accelerate the timing of the recognition of charges to income for future asbestos claims. That would happen in the event the amount of the low end of our estimate of the liability for pending and unasserted claims increases to the point where it, when combined with the amount of insurance receivables that we have recorded, exceeds the total remaining amount of insurance we have available for the payment of such claims.
/ Form 10-K: pages 72 / 73

............................................................................................................ ..... The table below quantitatively depicts the liability described above and the amount that the Company expects Garlock to
recover from insurance related to this liability.
As of and for the Year Ended December 31, 2004 2003 2002
(number of cases) New Actions Filed During the Period (1) 17,400 44,700 41,700 Open Actions at Period-End (1) 133,400 141,500 118,800(dollars in millions at period-end) Estimated Amounts Recoverable from Insurance (2) $ 446.1 $ 324.0 $ 295.9 Estimated Liability for Settled Claims and Actions in Advanced Stages of Processing (3) $ 90.6 $ 141.2 $ 138.8 Estimated Liability for Early-Stage and Unasserted Cases (4) $ 142.8 $ – $ –(dollars in millions) Payments (5) $ (122.8) $ (134.6) $ (146.3) Insurance Recoveries (5) 82.5 99.1 93.9
Net Cash Flows $ (40.3) $ (35.5) $ (52.4)
(1) Consists only of actions actually filed with a court of competent jurisdiction. Each action in which both Garlock and Anchor are named as a defendant is shown as a single action. Multiple actions filed by the same plaintiff in more than one jurisdiction are also counted as one action. Claims not filed as an action in court that were received and paid as part of inventory settlements (approximately 7,300 in 2004; 10,300 in 2003; and 15,600 in 2002) are not included.
(2) At December 31, 2004, the amount included $218 million representing cumulative payments made for which Garlock has not received a corresponding insurance recovery in part due to the annual limit imposed under Garlock’s insurance agreement, and in part due to the dispute with its London market insurers. Also included at December 31, 2004, is $228 million representing amounts recoverable under insurance policies related to the estimated liability for settled claims, actions in advanced stages of processing, and for early-stage and unasserted claims. At December 31, 2004, the Company classified $109.9 million as a current asset and $336.2 million as a non-current asset in its Consolidated Balance Sheet.
(3) Includes amounts with respect to the estimated liability for settled claims and actions in advanced stages of processing, whether or not an action has actually been filed with a court of competent jurisdiction. At December 31, 2004, the Company classified $74.0 million as a current liability and $16.6 million as a non-current liability in its Consolidated Bal-ance Sheet.
(4) Includes an estimate of potential liabilities for early-stage cases and unasserted claims likely to be filed against Garlock in the future. The amount reflects the low end of an estimated range of potential liabilities, and the Company cautions that future asbestos liabilities remain highly uncertain. At December 31, 2004, the Company classified this amount as a non-current liability in its Consolidated Balance Sheet.
(5) Includes amounts with respect to all payments for claims settlements and expenses and recoveries made in the period. At December 31, 2004, 2003, and 2002, the Company added $29.9 million, $25.7 million, and $34.4 million, respectively, of the net cash flows to the asbestos insurance receivable in the Consolidated Balance Sheets, and the Company recorded $10.4 million, $9.8 million, and $18 million, respectively, as an expense in its Consolidated Statements of Opera-tions. This expense relates primarily to uninsured legal fees and administrative costs net of recoveries from insolvent insurance carriers.
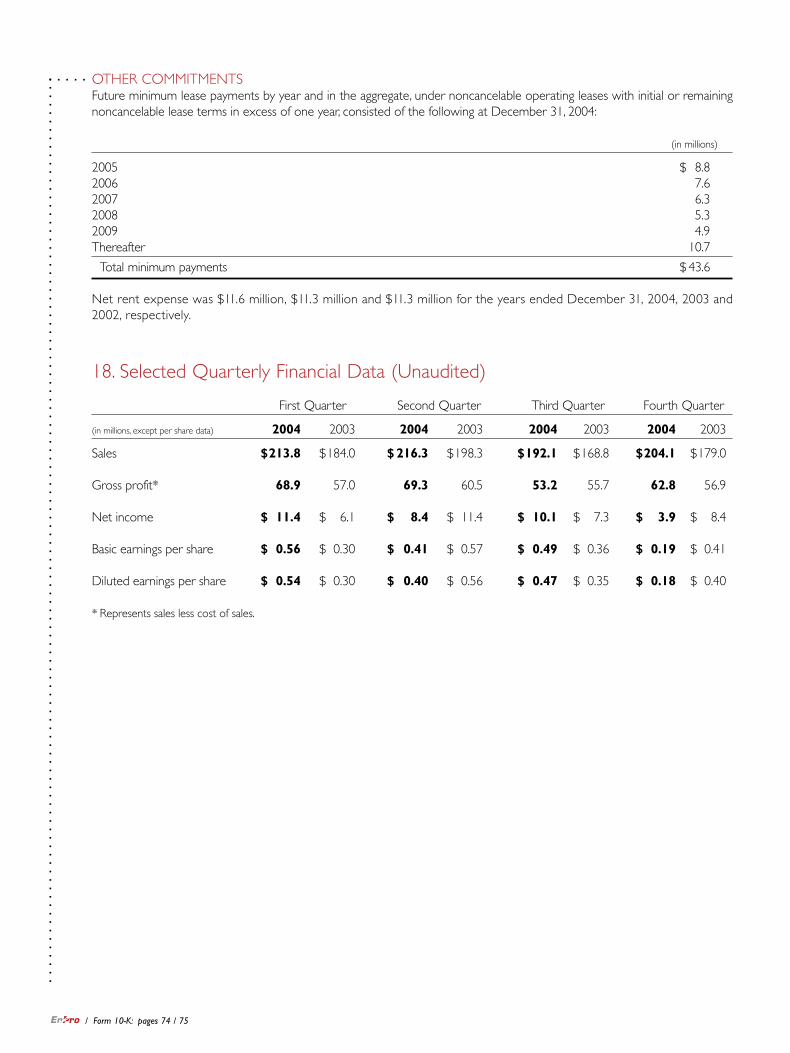
............................................................................................................ ..... OTHER COMMITMENTS
Future minimum lease payments by year and in the aggregate, under noncancelable operating leases with initial or remaining noncancelable lease terms in excess of one year, consisted of the following at December 31, 2004:
(in millions)
2005 $ 8.82006 7.62007 6.32008 5.32009 4.9Thereafter 10.7
Total minimum payments $ 43.6
Net rent expense was $11.6 million, $11.3 million and $11.3 million for the years ended December 31, 2004, 2003 and 2002, respectively.
18. Selected Quarterly Financial Data (Unaudited)
First Quarter Second Quarter Third Quarter Fourth Quarter
(in millions, except per share data) 2004 2003 2004 2003 2004 2003 2004 2003
Sales $ 213.8 $ 184.0 $ 216.3 $ 198.3 $ 192.1 $ 168.8 $ 204.1 $ 179.0
Gross profit* 68.9 57.0 69.3 60.5 53.2 55.7 62.8 56.9
Net income $ 11.4 $ 6.1 $ 8.4 $ 11.4 $ 10.1 $ 7.3 $ 3.9 $ 8.4
Basic earnings per share $ 0.56 $ 0.30 $ 0.41 $ 0.57 $ 0.49 $ 0.36 $ 0.19 $ 0.41
Diluted earnings per share $ 0.54 $ 0.30 $ 0.40 $ 0.56 $ 0.47 $ 0.35 $ 0.18 $ 0.40
* Represents sales less cost of sales.
/ Form 10-K: pages 74 / 75

............................................................................................................ ..... SCHEDULE II
Valuation and Qualifying AccountsFor the Years Ended December 31, 2004, 2003 and 2002
ALLOWANCE FOR DOUBTFUL ACCOUNTS
Balance, Beginning Charge/(Credit) Write-off of Balance,(in millions) of Year to Expense Receivables Other (1) End of Year
2004 $3.2 $0.9 $(0.5) $ – $3.6
2003 $3.8 $0.5 $(1.2) $0.1 $3.2
2002 $2.7 $1.5 $(0.5) $0.1 $3.8
(1) Consists primarily of acquisitions and the effect of changes in currency rates.

............................................................................................................ .....
/ Form 10-K: page 76
DIRECTORS, OFFICERS AND OPERATING MANAGEMENT
BOARD OF DIRECTORS
William R. Holland 1, 3, 4
Non-Executive Chairman of the Board,EnPro Industries, Inc. Former Chairman and Chief Executive Officer,United Dominion Industries Limited
Ernest F. Schaub 1
President and Chief Executive Officer,EnPro Industries, Inc.
J.P. Bolduc 1, 3, 4
Chairman of the Board and Chief Executive Officer,JPB Enterprises, Inc.
Peter C. Browning 3, 4
Dean, McColl School of Business,Queens UniversityNon-Executive Chairman,Nucor Corporation
Joe T. Ford 2, 4
Chairman, ALLTEL Corporation
James H. Hance, Jr. 1, 2, 4
Former Vice Chairman and Chief Financial Officer,Bank of America Corporation
Gordon D. Harnett 2, 4
President, Chief Executive Officer and Chairman of the Board,Brush Engineered Materials Inc.
COMMITTEES OF THE BOARD OF DIRECTORS
1 Executive Committee
2 Audit and Risk Management Committee
3 Compensation and Human Resources
Committee
4 Nominating and Corporate Governance
Committee
CORPORATE OFFICERS
Ernest F. SchaubPresident and Chief Executive Officer
William DriesSenior Vice President and Chief Financial Officer
Richard C. DriscollSenior Vice President, Human Resources andAdministration
Richard L. MageeSenior Vice President,General Counsel and Secretary
Wayne T. ByrneVice President and Controller
Robert D. RehleyVice President and Treasurer
OPERATING MANAGEMENT
Richard F. AndrewsDivision President, Stemco
Paul G. BaldettiDivision President, Garlock SealingTechnologies
Bernd FischerDivision President, GGB
James B. FisherDivision President, Fairbanks Morse Engine
John C. ThompsonDivision President, Quincy Compressor
Unni VarierVice President, Operational Support andTechnology

SHAREHOLDER INFORMATION............................................................................................................ .....
COMPANY HEADQUARTERSEnPro Industries, Inc.5605 Carnegie Boulevard, Suite 500Charlotte, North Carolina 28209-4674Telephone: 704-731-1500For additional information, please visit our website, www.enproindustries.com.
STOCK EXCHANGE LISTINGEnPro Industries common stock is listed on the New York Stock Exchange.Symbol: NPO
ANNUAL MEETINGThe Annual Meeting of Shareholders of EnPro Industries, Inc. will be held at the Hyatt Charlotte at SouthPark, 5501 Carnegie Boulevard, Charlotte, North Carolina, on Tuesday, May 10, 2005, at 11:00 a.m.
AUDITORSPricewaterhouseCoopers LLP 214 North Tryon Street Suite 3700 Charlotte, North Carolina 28202
SHAREHOLDER SERVICESQuestions about shareholder accounts, including lost certificates and other related items, should be addressed to our transfer agent and registrar :
Wachovia Bank, N.A. Shareholder Services Group – NC1153 1525 West W. T. Harris Blvd., 3C3 Charlotte, NC 28288-1153 Toll Free: 800-829-8432 Local: 704-590-0394 Fax: 704-590-7618 E-mail: [email protected] Website: www.wachovia.com/equityservices
To access your shareholder account directly, please visit www.wachovia.com/firstlink.
INVESTOR AND MEDIA INQUIRIESAnalysts, investors, media and others seeking financial or general information about EnPro should contact:
Don WashingtonDirector, Investor Relations and Corporate CommunicationsEnPro Industries, Inc.5605 Carnegie Boulevard, Suite 500Charlotte, NC 28209Telephone: 704-731-1527E-mail: investor. [email protected]
Copies of our Annual Report, Form 10-K, Form 10-Q, proxy statement or quarterly earnings announcements can be obtained free of charge by visiting our website, www.enproindustries.com, or by calling 704-731-1522.
Des
igne
d an
d pr
oduc
ed b
y C
orpo
rate
Rep
orts
Inc.
/Atla
nta
w
ww
.cor
pora
tere
port
.com
������������ ���������������� �
�����������������������
. . . . . . . . . . . . . . . . . . . . . . . . . . . . . . . . . . . .
. . . . . . . . . . . . . . . . . . . . . . . . . . . . . . . . . . . .
. . . . . . . . . . . . . . . . . . . . . . . . . . . . . . . . . . . .
. . . . . . . . . . . . . . . . . . . . . . . . . . . . . . . . . . . .
. . . . . . . . . . . . . . . . . . . . . . . . . . . . . . . . . . . .
����� ������������
������
��������
����������
�������������
���� � � ��� � � � ��
�����
���� � � ��� � � � ��
����
���
���
���
���
��������
����
���
���
���
������������� �������������
�
�
�
�
�
����
��
��
��
��
���
���
���
���
���
���
��
��
��
��
��
���
�
�
�
�
�
�
�����
������� Shares of EnPro Industries, Inc. (NYSE: NPO) began regular trading on June 3, 2002. The chart above shows the relative performance of EnPro shares to the Russell 2000® Index of
small cap companies, which includes EnPro, from June 3, 2002 to December 31, 2004.
OURPERFORMANCE

2004 Annual Report
ENGINEERED FORPERFORMANCE
EnPro Industries, Inc.5605 Carnegie Boulevard, Suite 500Charlotte, North Carolina 28209-4674www.enproindustries.com
. . . . . . . . . . . . . . . . . . . . . . . . . ..............................
EN
PR
O IN
DU
ST
RIE
S, IN
C. 2004 A
NN
UA
L R
EP
OR
T