Embed Size (px)
Citation preview

Engineering & Construction
Panel Discussion, June 19, 2015
Beyond Borders: Opportunities and
Challenges in New Markets

Speakers
Copyright © 2015 Deloitte Development LLC. All rights reserved.
2
Vivien Wang
Partner, International Tax
National Tax Leader,
Chinese Services Group
Deloitte Tax LLP
Mark Stephenson
International Tax Partner
UK Manufacturing Industry Leader
Deloitte LLP
2
Jean-Paul Loozen
Partner, Deloitte Real Estate
EMEA Real Estate Advisory Services
Special Guest
Daryl Sands, Stuart Olson Inc.
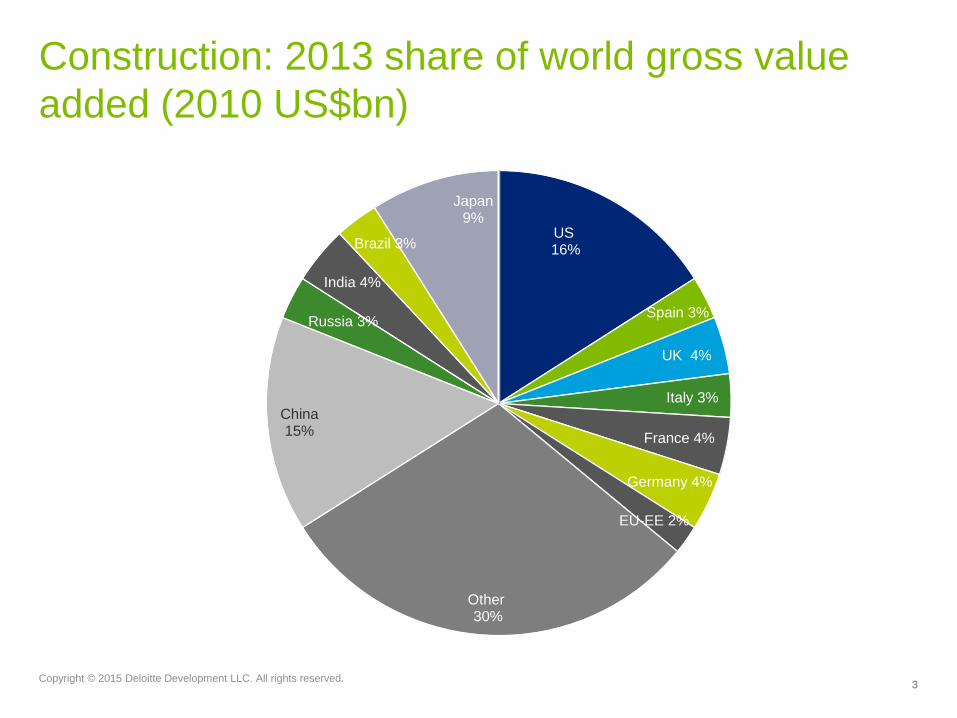
Construction: 2013 share of world gross value
added (2010 US$bn)
Copyright © 2015 Deloitte Development LLC. All rights reserved.
3 3
US 16%
Spain 3%
UK 4%
Italy 3%
France 4%
Germany 4%
EU-EE 2%
Other 30%
China 15%
Russia 3%
India 4%
Brazil 3%
Japan 9%

Internationalisation of Construction Companies
4
Market Size
The world has an enormous need for investment in infrastructure in order to address its growing population and
the tendency towards urban concentration. Average forecast annual investment in infrastructure (2005-2030):
USD 1.6 trillion (USD 374 billion in transport). BRICS countries represent 40% of the world's population, 15% of
the world's economy and 61% of the forecasted investment in infrastructure.
Average annual investment at international level EUR 1,349,000
million (estimate 2005-2030)
Brazil, Russia, India and China represent 61% of the total
estimated investment in infrastructure for the coming years
Latin America
• Annual investment in
infrastructure): EUR 232,000
• GDP: 7.2 trillion
• GDP growth in 2014 1.4%
• Population: approximately 577
million.
North America
• Annual investment in
infrastructure): EUR 200,000
• GDP: 16.1 trillion
• Growth in GDP in 2014 2.2%
• Population: approximately 480
million
European Union
• Annual investment in
infrastructure): EUR 282,000
• GDP: 15.9 trillion
• GDP growth in 2014 1.4%
• Population: approximately
492 million
Asia and Oceania
• Annual investment in
infrastructure): EUR 491,000
• Estimated GDP growth in
2014 Asia 5.8%
• Population: approximately
3,913 million.
Australia. Population 21 million
GDP: 1.2 trillion + [3%-3.5%]
Africa
• Annual investment in
infrastructure: EUR 60,000
• GDP:1.5 trillion
• GDP growth in 2015: N/A
• Population: approximately
1,000 million.
Middle East
• Annual investment in
infrastructure): EUR 84,000
• GDP: 3.58 trillion
• GDP growth in 2014 4%
• Population: approximately
404 million.
© 2015 by Deloitte University EMEA IVZW.

Trends in Construction
sector EMEA Region

Strategy of the main construction companies Internationalisation
6
If an in-depth analysis of the opportunities and risks of each market is performed, the map of the potentially
attractive countries and areas for infrastructure companies is significantly different.
NORTH AMERICA AND OLDER MEMBERS OF
THE EU
Opportunities:
Enormous need for investment in certain
countries (USA/Canada) and a pipeline of
projects
Macroeconomic stability
Political and social stability
Legal certainty
Risks:
High level of competition
Increased costs
Potential industrial disputes between states
Latin America
Opportunities:
Growing demand
Shared culture
Spanish companies and products
are viewed favourably
Risks:
Regular economic crises
Political instability
Poverty and social issues
Legal framework and legal certainty
Corruption
Competition: Brazilian construction
companies
AFRICA
Opportunities:
Growing demand
French-speaking and English-speaking
areas with the presence of French and
international construction companies.
Portuguese presence in some countries
(Mozambique, Angola, Namibia)
Risks:
Political instability
Poverty and social issues
Legal framework and legal certainty
Corruption
Competition: presence of Chinese
construction companies
ASIA AND OCEANIA
Opportunities:
Growing demand and economic growth
Potential of market share and trade margin
Insufficient infrastructure
The Australian market is growing and has
legal certainty
Risks:
Cultural differences
Corruption
China: The market is closed to foreign
construction companies
India: Corruption, industrial practices
MIDDLE EAST
Opportunities:
Growing demand
Insufficient infrastructure
Financially solvent customers
Established Anglo-Saxon law.
Risks:
Cultural differences
Legal framework and legal
certainty
Corruption
“Doing business in ME”
NEW MEMBERS OF THE EU
Opportunities:
Growing demand
Insufficient infrastructure
Risks:
Macroeconomic situation
Cultural differences
Legal framework and legal
certainty
Business
opportunity
© 2015 by Deloitte University EMEA IVZW.

Strategy of the main construction companies Outlook for the construction industry
7
A characteristic of construction activity is that it is particularly cyclical, as it is influenced by business and
consumer confidence, interest rates and government programmes.
Business and consumer confidence started to decline in 2008 and now, after falling for a few years,
construction investment is projected to return to growth in 2014 and to accelerate further in 2015
Source: Eurostat.
© 2015 by Deloitte University EMEA IVZW.

Strategy of the main construction companies Outlook for the construction industry
8
There seems to be a direct correlation
between the construction Investment/GDP
ratios and GDP per capita.
Those countries that recorded construction
investment / GDP ratios above 9% in the last
years obtained an average GDP per capita of
higher than the GDP per capita recorded by
countries with lower construction investment
ratios.
Total construction investment in the European Union in 2014, 2013 and
2012 amounted to €1.37 trillion, €1.27 trillion and € 1.33 trillion,
respectively, indicating that European construction has fallen below levels
last seen in the mid-1990s.
As in previous years, the three largest construction markets in Europe
are Germany, France and the United Kingdom. Additionally, the Top 5,
which also includes Italy and Spain, represented 72% of total construction
investment in the European Union in 2014. In the aforementioned markets,
construction investment represents between 8% and 12% of total GDP.
Construction investment in smaller countries such as Finland or Romania
is significantly lower but in relative terms it represents more than 12% of
total GDP.
Source: Ameco, February 2015
4% 6% 8% 10% 12% 14%
Construction Investment/GDP%** Source: * International Monetary Fund.
** Ameco.
10.000
15.000
20.000
25.000
30.000
35.000
40.000
45.000
GD
P P
ER
CA
PIT
A (€
)*
GRE
IRL
DEN
POR
NL SWE
UK
ITA SPA
SVK SLO
HUN
CZ
GER
AUS
BEL
FRA
FIN
ROM
© 2015 by Deloitte University EMEA IVZW.

In 2014 the international sales of the 20
leading European construction companies
accounted for, on average, 52% (56% in
2013) of their revenue while diversification
(non-construction sales) accounted for
26% (23% in 2013)
9 © 2015 by Deloitte University EMEA IVZW.

Strategy of the main construction companies
10
Internationalisation is producing disparate results. There appears to be an inverse correlation between the
level of internationalisation and the margins of the main European construction companies.
Source: Deloitte Analysis.
© 2015 by Deloitte University EMEA IVZW.

Strategy of the main construction companies Diversification
11
The diversification of the European construction companies follows a similar pattern.
Company Construction
Real Estate
Development Concessions
Industrial &
Services
Environment
& Water Energy Telecom Other
Activities
VINCI SA
ACTIV. DE CONSTR. Y SERV. SA (ACS)
BOUYGUES SA
SKANSKA AB
EIFFAGE SA
STRABAG SE
BALFOUR BEATTY PLC
BILFINGER SE
FERROVIAL SA
KONINKLIJKE BAM GROEP NV
FOMENTO DE CONSTR. Y CONTRATAS SA (FCC)
NCC AB
ACCIONA SA
PEAB AB
ENKA INSAAT VE SANAYI AS
CARILLION PLC
OBRASCON HUARTE LAIN SA (OHL)
BARRATT DEVELOPMENTS
Sales over €1,000 million Sales below €1,000 million Relevant presence through equity investments No presence or residual presence
© 2015 by Deloitte University EMEA IVZW.

Strategy of the main construction companies Diversification
12
The cyclical nature of construction activity causes many companies signficant financial dificulties in times
of recession. In order to offset the negative effects of the economic and financial situation, most of the
EPoC pursued diversification strategies aimed at both achieving sustainable growth and increasing the low
margins typical of construction activities.
Source: Deloitte Analysis.
© 2015 by Deloitte University EMEA IVZW.

E&C Industry Trends in UK

Key trends in Engineering & Construction
Outlook for the sector
The new market situation provides a reference framework for companies which differs from that prior to
the crisis.
Until 2008 2008-2013
Cycle/Vision
Financial model
Territoriality
Tactical variables
Strategic variables
Expansion Slowdown
Cash generators (for the
business and for the rest of
the Group –diversification
activities-)
Seekers of financing
and working capital
management.
Refinancing and restructuring
Distribution (opening of
branches)
Commercial and
operational: fulfilment of the
commitments acquired
Diversification -
Internationalisation
Concentration (optimisation
of operational deployment)
Financing and cost
management: minimisation of
structures
Internationalisation
Divestment of residual
businesses and search for new
avenues for financing in capital
markets
2014-???
Stabilisation and selective growth
Debt restructuring,
diversification of funding
sources, alliances with
institutional investors (funds)
Without significant changes
Financing and growth. Risk and
reputation control (CSR)
Internationalisation
Selective diversification
Financial flexibility
14

Key trends in Engineering & Construction
Outlook for the EU & UK
85.0
90.0
95.0
100.0
105.0
110.0
115.0
120.0
125.0
Q1
-200
6
Q3
-200
6
Q1
-200
7
Q3
-200
7
Q1
-200
8
Q3
-200
8
Q1
-200
9
Q3
-200
9
Q1
-201
0
Q3
-201
0
Q1
-201
1
Q3
-201
1
Q1
-201
2
Q3
-201
2
Q1
-201
3
Q3
-201
3
Q1
-201
4
Q3
-201
4
Production in the construction sector - UK only
Construction output - EU Construction output - UK
15

E&C Industry Trends in
Canada

E&C Industry Trends in
China

Construction Market in China 2011-2014
($ billions)
Source: Technavia Research 18
Copyright © 2015 Deloitte Development LLC. All rights reserved.
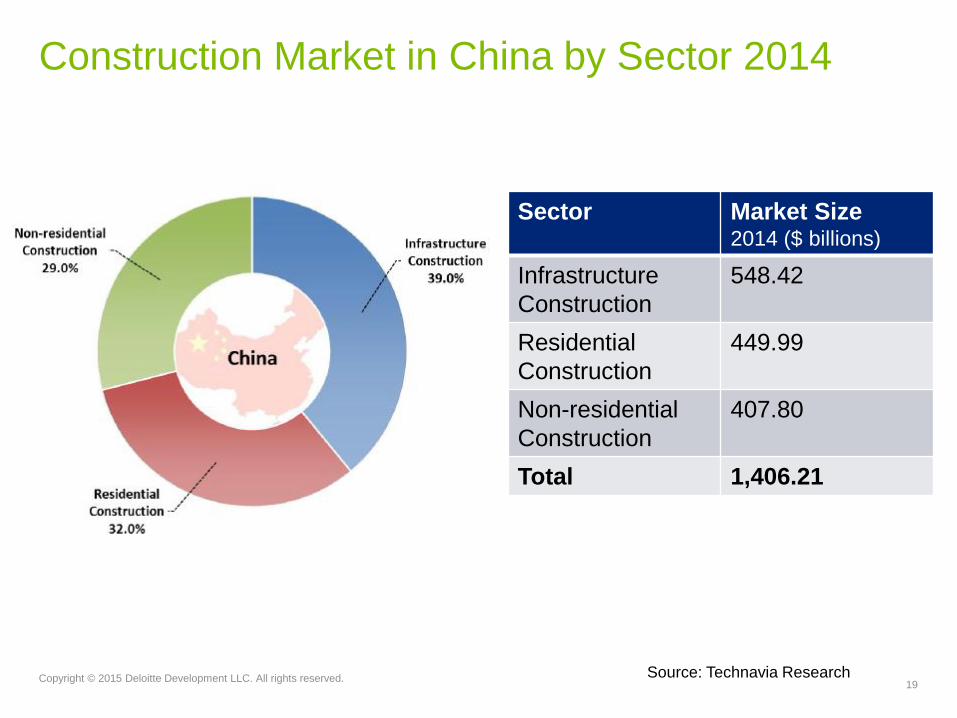
Construction Market in China by Sector 2014
Sector Market Size 2014 ($ billions)
Infrastructure
Construction
548.42
Residential
Construction
449.99
Non-residential
Construction
407.80
Total 1,406.21
Source: Technavia Research 19
Copyright © 2015 Deloitte Development LLC. All rights reserved.

Construction Market Size in China 2014-2019 ($
billions)
Source: Technavia Research 20
Copyright © 2015 Deloitte Development LLC. All rights reserved.

Key Market Trends
Copyright © 2015 Deloitte Development LLC. All rights reserved.
21 21
Market Drivers
• Government Initiatives
• Shift from Rural to Urban Development
• Investment in Construction Sectors
Market Trends
• Increase in Sustainable Buildings
• Adoption of Labor-saving System
Market Weakness
• Weak Regulatory Framework
• Low Infrastucture Quality
• Lack of Quality Management System

Trend to watch:
Chinese investment in US
real estate and construction

Chinese Cross Border Capital into U.S. CRE – Top
Markets by Destination
Source: Real Capital Analytics, Cross Border Capital Tracker. February 23, 2015
*Other markets include: Jacksonville, Atlanta, Inland Empire, East Bay, Detroit, Dallas, SW Florida, Memphis, and Toledo.
Chinese Cross Border Capital into
U.S. CRE by Market Destination –
last 3 years
Market Total Vol. ($ mil.)
Manhattan $4,058.9
Los Angeles 1,322.2
NYC Boroughs 543.1
San Francisco 511.1
Chicago 458.1
Houston 374.5
San Jose 139.8
No New Jersey 139.6
Seattle 102.3
Other* 638.0
Total $8,287.7

Chinese direct capital focused on prime assets
Recent Significant Chinese deals:
Waldorf Astoria Hotel
301 Park Ave., New York, NY/ US
Buyer: Anbang Insurance Group
Seller: Hilton Worldwide Holdings
Price: $1.95 bil. Anbang is paying
$1.37 mil. per unit
Baccarat Hotel Plaza
20 W 53rd St. New York, NY/ US
Buyer: Sunshine Insurance
Group
Seller: Starwood Capital Group
Price: $230.5 mil.
Source: Real Capital Analytics, February 23, 2015
Acquisitions By Chinese Investors, Last 12 Months
First and Mission sites
San Francisco, CA/ US
Buyer: Oceanwide RE Group
Seller: TMG Partners JV
Price: $296 mil. Total: 104,690 sf.
part of 4 property portfolio
Robinsons-May Store (former)
9900 Wilshire Blvd. Beverly Hills,
CA/ US
Buyer: Dalian Wanda Group
Seller: CBRE Group JV
Price: $420 mil.
24
Copyright © 2015 Deloitte Development LLC. All rights reserved.

Key tax themes in EMEA

Key tax themes in EMEA
26
Base Erosion & Profit
Shifting (BEPS)
EU State Aid
Unilateral measures
(e.g. UK DPT)
Euro uncertainty

European Tax Survey 2014
Key findings
27
70%
69%
The Netherlands and the UK were seen as the most attractive of the large
jurisdictions from a tax perspective. Italy seen as most challenging
of respondents had experienced a tax audit in prior 3 years.
Only half of respondents thought that BEPS was important and 69% had not
started planning for the likely impact
ETR was not the most important measure of success – compliance and close
collaboration with the business and its strategy were more important
56% More than half of respondents (56%) thought there has been an increased
level of discussion and scrutiny around corporate tax strategy
27

The BEPS project
Key themes
Widening the tax base
Interest expense
Taxable presence
Profit allocation:
• Intangibles
• Methods
Compliance
Transfer pricing
documentation
Enforcement
Disclosure obligations
GAAR
Mutual agreement
Harmful tax practices
Data collection
Digital business
Coherence Restoring international standards Transparency and certainty
28

The BEPS project
Agreed timeframes • We are now positioned a considerable distance along the agreed OECD BEPS timeline, with the
majority of the published discussion drafts for each of the actions setting clear direction.
• Digital economy
• Hybrid mismatches
• Treaty abuse
• Transfer pricing documentation
• Transfer pricing of intangibles (1)
• Harmful tax practices
• Multilateral instrument
• CFC rules
• Permanent establishments
• Transfer pricing of intangibles (2),
risks and capital, other
• Disclosure of aggressive tax
planning
• Dispute resolution
• Data collection and analysis
measuring BEPS
• Interest deductions
• Harmful tax practices
• Multilateral instrument to
address BEPS
G20 Leaders meet
OECD released
“Addressing Base
Erosion and Profit
Shifting”
European Council
Meeting
Forum of
Administration
meeting
G8 Summit
OECD’s Committee
on Fiscal Affairs to
agree action plan
OECD’s Action Plan
delivered to G20 Finance
Ministers
November 2012
February 2013
May 2013 June 2013 July 2013 Action plan
working groups
September 2014 September 2015 December 2015
29

BEPS Survey – May 2015
Key findings
75%
58%
Major impact on compliance burden – 90% expecting compliance burden to
increase (mainly country-by-country reporting)
Concern over unilateral action – 75% are anticipating double taxation as a
result of BEPS
Greater impact on business – 58% feel that the BEPS project will have a
greater impact on their organization than they originally thought
91% Greater scrutiny by tax authorities – 91% agree that tax structures are
under greater scrutiny by local tax authorities than a year ago
90%
Significant change is fully expected – BEPS is highly likely to have a
significant impact on many businesses and may take time to implement.
30

Key tax and regulatory
challenges in China

Typical business arrangement
• Under a typical contract project, there are the
following 4 components:
a) Off shore engineering and design
b) Onshore engineering and design
c) Offshore purchase of materials
d) Onshore purchase of materials
e) Onshore construction
f) Onshore project management
• In a turkey project, the payment term is usually
based on milestone progress of a project
Overseas
Service Flow
Cash Flow
Foreign Contractor
PRC
Chinese Client
Service a), b),
c), d), e), f)
Payment

Tax and regulatory issues
• Each payment may cover different components as discussed above
• Each payment needs to be cleared with the tax authorities before the bank can process foreign exchange
remittance out of China to overseas bank account
• Each component has different PRC tax implications, which involve the following aspects:
a) Onshore and offshore claim or split
b) PE issue
c) Corporate income tax (“CIT”)
d) Deemed profit rate
e) VAT issue and deduction of VAT by the project owner
f) Deduction of sub-contract payments for computing CIT and VAT liability for foreign company
g) Registration of the contract with the local administration of industry and commerce and tax authority
h) Tax clearance with the local tax authority
i) Preparation of sound documentation to minimize Chinese tax cost
• In practice, the commercial team may not pay too much attention to the above issues when they negotiate
contract terms related to payment and tax clauses in the contract with their Chinese clients
• In addition, more and more Chinese clients prefer using Rmb instead of foreign currency in order to avoid
burdensome document and procedural requirements for foreign exchange payment

How to deal with those challenges
• In a real-life case, a client of ours did not receive payment of USD 19 million for almost a year from its Chinese
client as the client claimed that there is no sufficient documentation to provide to the local tax authority for tax
clearance. Later we helped the client with the following:
a) Registered the contract with the relevant authority and the tax authority
b) Broke down payment amount into the 6 categories of service nature as discussed above
c) Discussed with the tax authority on tax position on each category
d) File the required tax returns and settle the tax liabitiies
e) Obtain tax clearance document from the tax authority
f) Assist in communicating with the bank and get the bank process the remittance
• Get your tax advisor involved in review of a contract on payment term and tax clauses before finalizing the
contract with your Chinese client
• Prepare all the required documents and information immediately after the project is started based on the service
nature
• Register the contract with the local tax authority within 30 days after the contract is executed
• Prepare technical discussion paper on tax position all the service components covered in the contract with the
local tax authority as early as possible before the first payment is due
• Keep good records of all the documents and information
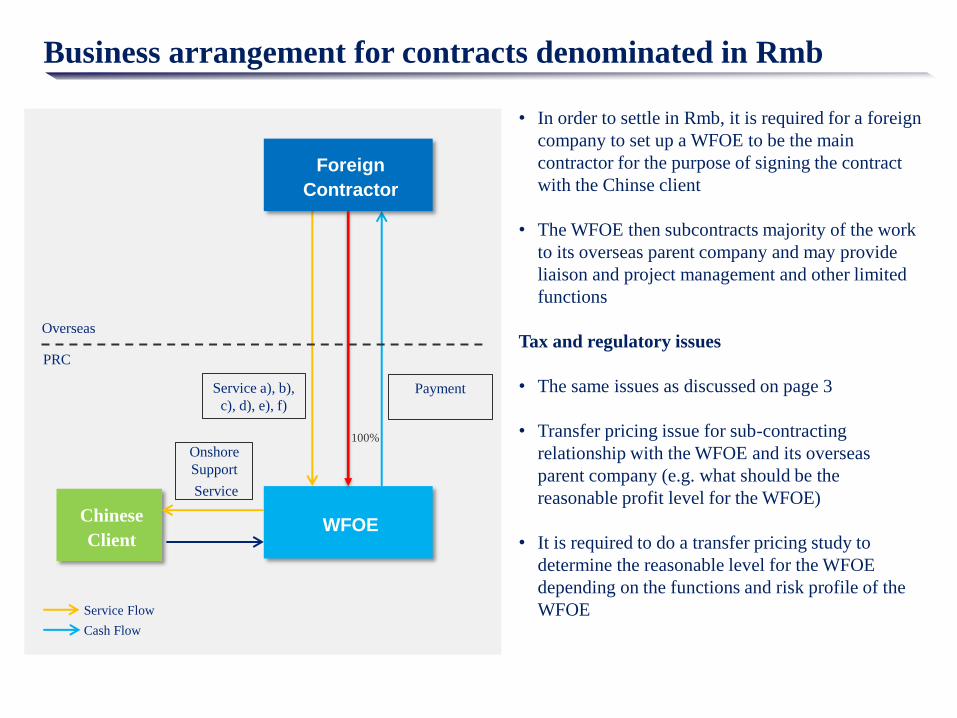
Business arrangement for contracts denominated in Rmb
• In order to settle in Rmb, it is required for a foreign
company to set up a WFOE to be the main
contractor for the purpose of signing the contract
with the Chinse client
• The WFOE then subcontracts majority of the work
to its overseas parent company and may provide
liaison and project management and other limited
functions
Tax and regulatory issues
• The same issues as discussed on page 3
• Transfer pricing issue for sub-contracting
relationship with the WFOE and its overseas
parent company (e.g. what should be the
reasonable profit level for the WFOE)
• It is required to do a transfer pricing study to
determine the reasonable level for the WFOE
depending on the functions and risk profile of the
WFOE
Service Flow
Cash Flow
Foreign
Contractor
Chinese
Client WFOE
Onshore
Support
Service
Service a), b),
c), d), e), f)
Payment
Overseas
PRC
100%

Questions?

A copy of this presentation may be downloaded from the conference website.
To access this presentation – and all other presentations from this conference,
please use the following url:
www2.deloitte.com/us/2015ECConference
You may also access all presentations and thoughtware through our conference
app
Conference Resources
37 Copyright © 2014 Deloitte Development LLC. All rights reserved.

About Deloitte Deloitte refers to one or more of Deloitte Touche Tohmatsu Limited, a UK private company limited by guarantee, and its network of member firms, each of which is a legally separate and independent entity. Please see www.deloitte.com/about for a detailed description of the legal structure of Deloitte Touche Tohmatsu Limited and its member firms. Please see www.deloitte.com/us/about for a detailed description of the legal structure of Deloitte LLP and its subsidiaries. Certain services may not be available to attest clients under the rules and regulations of public accounting. Copyright © 2015 Deloitte Development LLC. All rights reserved. Member of Deloitte Touche Tohmatsu Limited