Embed Size (px)
Citation preview
The INL is a U.S. Department of Energy National Laboratory operated by Battelle Energy Alliance
INL/EXT-10-18297Rev. 1
Engineering Database of Liquid Salt Thermophysical and Thermochemical Properties
Manohar S. Sohal Matthias A. Ebner Piyush Sabharwall Phil Sharpe
June 2013
INL/EXT-10-18297 Rev. 1
Engineering Database of Liquid Salt Thermophysical and Thermochemical Properties
Manohar S. Sohal Matthias A. Ebner Piyush Sabharwall
Phil Sharpe
June 2013
Idaho National Laboratory Idaho Falls, Idaho 83415
http://www.inl.gov
Prepared for the U.S. Department of Energy Office of Nuclear Energy
Under DOE Idaho Operations Office Contract DE-AC07-05ID14517
DISCLAIMER This information was prepared as an account of work sponsored by an
agency of the U.S. Government. Neither the U.S. Government nor any agency thereof, nor any of their employees, makes any warranty, expressed or implied, or assumes any legal liability or responsibility for the accuracy, completeness, or usefulness, of any information, apparatus, product, or process disclosed, or represents that its use would not infringe privately owned rights. References herein to any specific commercial product, process, or service by trade name, trade mark, manufacturer, or otherwise, does not necessarily constitute or imply its endorsement, recommendation, or favoring by the U.S. Government or any agency thereof. The views and opinions of authors expressed herein do not necessarily state or reflect those of the U.S. Government or any agency thereof.

iii
ABSTRACT
The purpose of this report is to provide a review of thermophysical properties and thermochemical characteristics of candidate molten salt coolants, which may be used as a primary coolant within a nuclear reactor or heat transport medium from the Very High Temperature Reactor (VHTR) to a processing plant; for example, a hydrogen-production plant. Thermodynamic properties of four types of molten salts, including LiF-BeF2 (67 and 33 mol%, respectively; also known as FLiBe), LiF-NaF-KF (46.5, 11.5, and 52 mol%, also known as FLiNaK), and KCl-MgCl2 (67 and 33 mol%), and sodium nitrate-sodium nitrite-potassium nitrate (NaNO3–NaNO2–KNO3, 7-49-44 mol%, also known as Hitec® salt) have been investigated. Limitations of existing correlations to predict density, viscosity, specific heat capacity, surface tension, and thermal conductivity were identified. The impact of thermodynamic properties on the heat transfer, especially the Nusselt number, was also discussed.
Stability of the molten salts with structural alloys and their compatibility with the structural alloys was studied. Nickel and high temperature alloys with dense Ni coatings are effectively inert to corrosion in fluorides, but not so in chlorides. Of the chromium containing alloys, Hastelloy N appears to have the best corrosion resistance in fluorides, while Haynes 230 was the most resistant in chloride. In general, alloys with increasing carbon and chromium content are increasingly subject to corrosion by the fluoride salts FLiBe and FLiNaK due to attack and dissolution of the intergranular chromium carbide. Future research to obtain needed information was identified.

iv
v
CONTENTS
ABSTRACT ................................................................................................................................................. iii
NOMENCLATURE .................................................................................................................................... ix
ACRONYMS ................................................................................................................................................ x
1. INTRODUCTION .............................................................................................................................. 1
2. THERMOPHYSICAL PROPERTIES ............................................................................................... 3
2.1 Overview of Thermophysical Properties and Respective Correlations .................................... 3
2.1.1 Lithium Fluoride - Sodium Fluoride - Potassium Fluoride (LiF- NaF- KF) ............... 32.1.2 Lithium Fluoride - Beryllium Fluoride (LiF – BeF2) .................................................. 62.1.3 Potassium Chloride-Magnesium Chloride (KCl – MgCl2) ....................................... 102.1.4 Sodium Nitrate-Sodium Nitrite-Potassium Nitrate (NaNO3–NaNO2–KNO3) .......... 13
2.2 Effect of Uncertainty in Thermophysical Properties on the Nusselt Number ........................ 16
2.3 Summary of Thermophysical Properties Characteristics ....................................................... 17
3. HEAT TRANSFER CHARACTERISTICS ..................................................................................... 18
4. MOLTEN SALT THERMOCHEMICAL STABILITY AND ALLOY CORROSION IN MOLTEN SALT SYSTEMS ........................................................................................................... 24
4.1 Radiolytic and Thermal Stability of Molten Salts .................................................................. 24
4.2 Corrosion Mechanisms .......................................................................................................... 26
4.2.1 Fluoride and Chloride Salts ....................................................................................... 27
4.2.2 Nitrate-Nitrite Salts ................................................................................................... 32
4.3 Molten Salt Purification Methods .......................................................................................... 33
4.4 Review of Molten Salt Corrosion Data .................................................................................. 35
4.4.1 FLiNaK ..................................................................................................................... 354.4.2 FLiBe ........................................................................................................................ 394.4.3 KCl-MgCl2 ................................................................................................................ 424.4.4 NaNO3-NaNO2-KNO3 ............................................................................................... 45
4.5 Summary of Thermochemical Characteristics ....................................................................... 48
5. CONCLUSIONS AND RECOMMENDATIONS FOR FUTURE RESEARCH ............................ 51
5.1 Molten Salt Thermophysical Properties ................................................................................. 51
5.2 Molten Salt Themochemical Behavior ................................................................................... 52
vi
6. REFERENCES ................................................................................................................................. 53
7. APPENDIX A— SUMMARY OF ALLOY NOMINAL COMPOSITIONS .................................. 58
FIGURES
Figure 2.1. Plots of density and viscosity correlations for FLiNaK molten salt. .................................. 4
Figure 2.2. Plots of surface tension and specific heat capacity correlations for FLiNaK salt. .............. 5
Figure 2.3. Plots of thermal conductivity correlation and Nusselt number calculations for FLiNaK salt. ........................................................................................................................ 6
Figure 2.4. Plots of density and viscosity correlations for FLiBe molten salt. ..................................... 8
Figure 2.5. Surface tension and specific heat capacity plots for FLiBe salt. ......................................... 9
Figure 2.6. Plots of thermal conductivity correlation and Nusselt number calculation for FLiBe. ............................................................................................................................... 10
Figure 2.7. Plots of density and viscosity correlations for chloride salt. ............................................. 11
Figure 2.8. Plots of surface tension correlation and specific heat capacity values for chloride salt. .................................................................................................................................... 12
Figure 2.9. Plots of thermal conductivity correlation and Nusselt number calculations for chloride salt. ...................................................................................................................... 13
Figure 2.10. Plots of density and viscosity correlations for nitrate salts. .............................................. 14
Figure 2.11. Plots of specific heat capacity and surface tension correlations for nitrate salts. ............. 15
Figure 3.1. Comparison of FLiNaK convective heat transfer experimental data of Vriesema [1979] with Dittus-Boelter correlation; Ambrosek et al. [2009]. ..................................... 18
Figure 3.2. Comparison of FLiNaK convective heat transfer experimental data of Grele and Gdeon [1954] and Hoffman and Lones [1955] with Dittus-Boelter correlation, Ambrosek et al. [2009]. .................................................................................................... 19
Figure 3.3. FLiNaK experimental data of Hoffman and Lones [1955], Grele and Gedeon [1954], and Vriesema [1979] in Inconel-based tubes were reanalyzed using the thermal conductivity measured by Smirnov et al. [1987]. ................................................ 19
Figure 3.4. Comparison of Liu et al. [2009] molten salt data (a) their correlation, Equation (3.5), and (b) with Sieder-Tate correlation, Equation (3.2). ............................................. 21
Figure 3.5. Correlation of Lu et al. [2009] molten salt data with Equation (3.6), Wu et al. [2009]. ............................................................................................................................... 22
vii
Figure 3.6. Correlation of Lu et al. [2009] molten salt data with Gnielinski Equation (3.4), Wu et al. [2009]. ............................................................................................................... 22
Figure 3.7. Correlation of Lu et al. [2009] molten salt data with Hausen, Equation (3.3), Wu et al. [2009]. ...................................................................................................................... 23
TABLES
Table 1.1. Some thermophysical properties of molten salts of interest and a few others for reference. ............................................................................................................................. 2
Table 2.1. Uncertainty in the Nusselt number. .................................................................................. 16
Table 2.2. Worst case scenario for uncertainty in the Nusselt number. ............................................. 17
Table 4.1. Free energy of formation at 1000 K of some alkali fluorides and transition metal fluorides. ........................................................................................................................... 28
Table 4.2. Comparison of the free energies of some chloride and fluoride components of molten salts and the transition metal analogs [Williams et al. 2006]. ............................... 29
Table 4.3. Solubility of chromium fluoride in FLiBe and FLiNaK fuel salts [Williams et al. 2006]. ................................................................................................................................ 31
Table 4.4. Corrosion rates of ferritic steel JLF-1 in purified FLiNaK at 600°C for 1000 hours, in a JLF-1, Ni, and Nb crucible [Kondo et al. 2009a]. ........................................... 36
Table 4.5. Corrosion rates of various alloys in purified molten LiF-NaF-KF at 850°C [Olson 2009, Olson et al. 2000, Sridharan et al. 2008, Sridharan 2009]. ..................................... 36
Table 4.6. Correlation of corrosion rates and dissolved chromium content in FLiNaK with carbon and chromium content of alloys [Olson 2009, Sridharan et al. 2008]. ................. 38
Table 4.7. Summary of ORNL loop corrosion tests in pure FLiNaK with an imposed solubility gradient corrosion mechanism [Williams et al. 2006, Williams and Toth 2005, Sridharan et al. 2008]. .................................................................................... 38
Table 4.8. Corrosion rates of various alloys in purified FLiBe at 600°C, and the corresponding increase in dissolved Cr and Fe content of the salt [Kondo et al. 2009a, Kondo et al. 2009b, Kondo et al. 2009c]. ............................................................. 40
Table 4.9. Summary of ORNL loop corrosion tests involving the binary LiF-BeF2 and some ternary salts that did not contain UF4 [Williams et al. 2006, DeVan 1984]. .................... 41
Table 4.10. Corrosion of several alloys in KCl-MgCl2 at 850°C for 100 hours in quartz crucibles. [Ambrosek 2010, Olson 2009, Sridharan 2009, Anderson and Sridharan 2010]. ................................................................................................................ 42
Table 4.11. Comparison of corrosion rates of various alloys at 850°C in FLiNaK and in KCl-MgCl2 [Ambrosek 2010, Olson 2009, Sridharan 2009, Anderson and Sridharan 2010]. ................................................................................................................................ 43
viii
Table 4.12. Corrosion rates of several high chromium steels in chloride salts in ORNL loop tests [Williams 2006]. ....................................................................................................... 44
Table 4.13. Corrosion rates of various alloys in various chloride baths. ............................................. 45
Table 4.14. Corrosion rates of various alloys in Hitec salt. ................................................................. 47
Table 4.15. Corrosion rates of several alloy types in KNO3-Mg(NO3)2 at 250°C [Niiger et al. 1982]. ................................................................................................................................ 48
ix
NOMENCLATURE C1 constant Cp specific heat capacity, J/kg·K d diameter of a tube, m k thermal conductivity, W/m·K l conduit length, m M sodium, potassium, or lithium Nu Nusselt number Pr Prandtl number, Cp μ/k Re Reynolds number, d v/μ T temperature, K v velocity, m/s density, kg/m3 μ dynamic viscosity, Pa·s surface tension, N/m
Subscripts b bulk fluid w wall
x
ACRONYMS ARE Aircraft Reactor Experiment
FLiNaK lithium fluoride-sodium fluoride-potassium fluoride
FLiBe lithium fluoride - beryllium fluoride
INL Idaho National Laboratory
MSBR Molten Salt Breeder Reactor
MSRE Molten Salt Reactor Experiment
NGNP Next Generation Nuclear Plant
ORNL Oak Ridge National Laboratory
VHTR Very High Temperature Reactor
1
Engineering Database of Liquid Salt Thermophysical and Thermochemical Properties
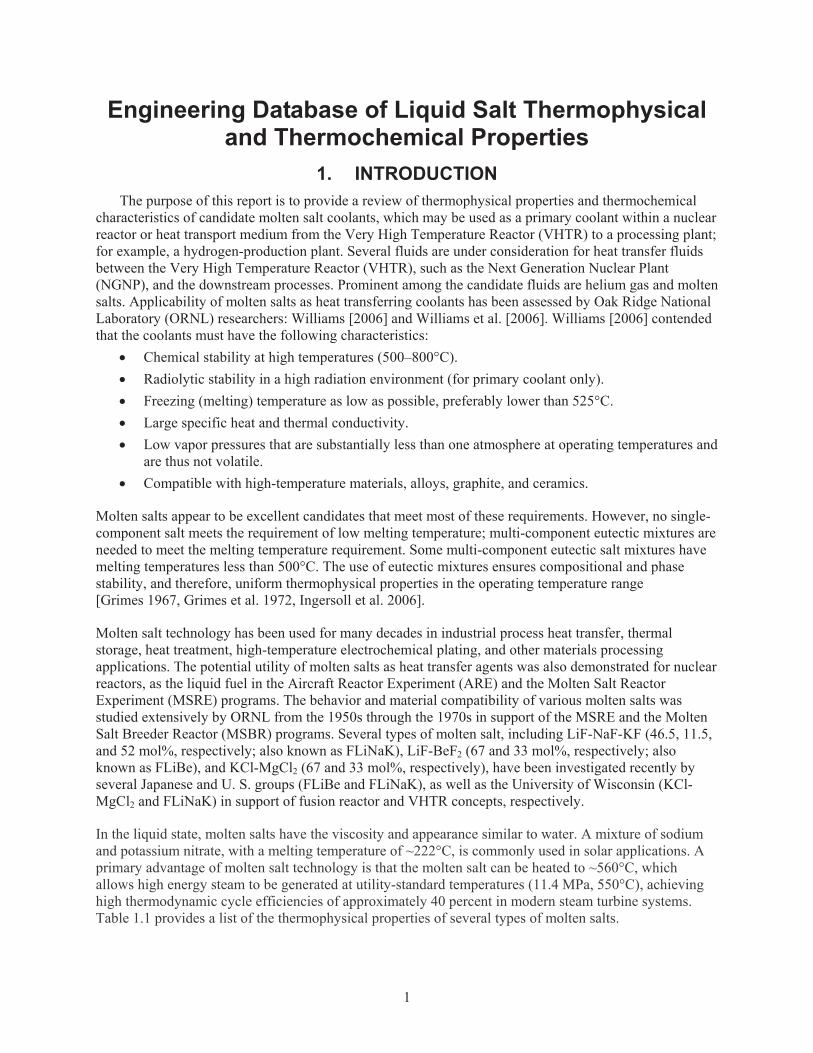
1. INTRODUCTION The purpose of this report is to provide a review of thermophysical properties and thermochemical
characteristics of candidate molten salt coolants, which may be used as a primary coolant within a nuclear reactor or heat transport medium from the Very High Temperature Reactor (VHTR) to a processing plant; for example, a hydrogen-production plant. Several fluids are under consideration for heat transfer fluids between the Very High Temperature Reactor (VHTR), such as the Next Generation Nuclear Plant (NGNP), and the downstream processes. Prominent among the candidate fluids are helium gas and molten salts. Applicability of molten salts as heat transferring coolants has been assessed by Oak Ridge National Laboratory (ORNL) researchers: Williams [2006] and Williams et al. [2006]. Williams [2006] contended that the coolants must have the following characteristics:
Chemical stability at high temperatures (500–800°C). Radiolytic stability in a high radiation environment (for primary coolant only). Freezing (melting) temperature as low as possible, preferably lower than 525°C. Large specific heat and thermal conductivity. Low vapor pressures that are substantially less than one atmosphere at operating temperatures and
are thus not volatile. Compatible with high-temperature materials, alloys, graphite, and ceramics.
Molten salts appear to be excellent candidates that meet most of these requirements. However, no single-component salt meets the requirement of low melting temperature; multi-component eutectic mixtures are needed to meet the melting temperature requirement. Some multi-component eutectic salt mixtures have melting temperatures less than 500°C. The use of eutectic mixtures ensures compositional and phase stability, and therefore, uniform thermophysical properties in the operating temperature range [Grimes 1967, Grimes et al. 1972, Ingersoll et al. 2006].
Molten salt technology has been used for many decades in industrial process heat transfer, thermal storage, heat treatment, high-temperature electrochemical plating, and other materials processing applications. The potential utility of molten salts as heat transfer agents was also demonstrated for nuclear reactors, as the liquid fuel in the Aircraft Reactor Experiment (ARE) and the Molten Salt Reactor Experiment (MSRE) programs. The behavior and material compatibility of various molten salts was studied extensively by ORNL from the 1950s through the 1970s in support of the MSRE and the Molten Salt Breeder Reactor (MSBR) programs. Several types of molten salt, including LiF-NaF-KF (46.5, 11.5, and 52 mol%, respectively; also known as FLiNaK), LiF-BeF2 (67 and 33 mol%, respectively; also known as FLiBe), and KCl-MgCl2 (67 and 33 mol%, respectively), have been investigated recently by several Japanese and U. S. groups (FLiBe and FLiNaK), as well as the University of Wisconsin (KCl-MgCl2 and FLiNaK) in support of fusion reactor and VHTR concepts, respectively.
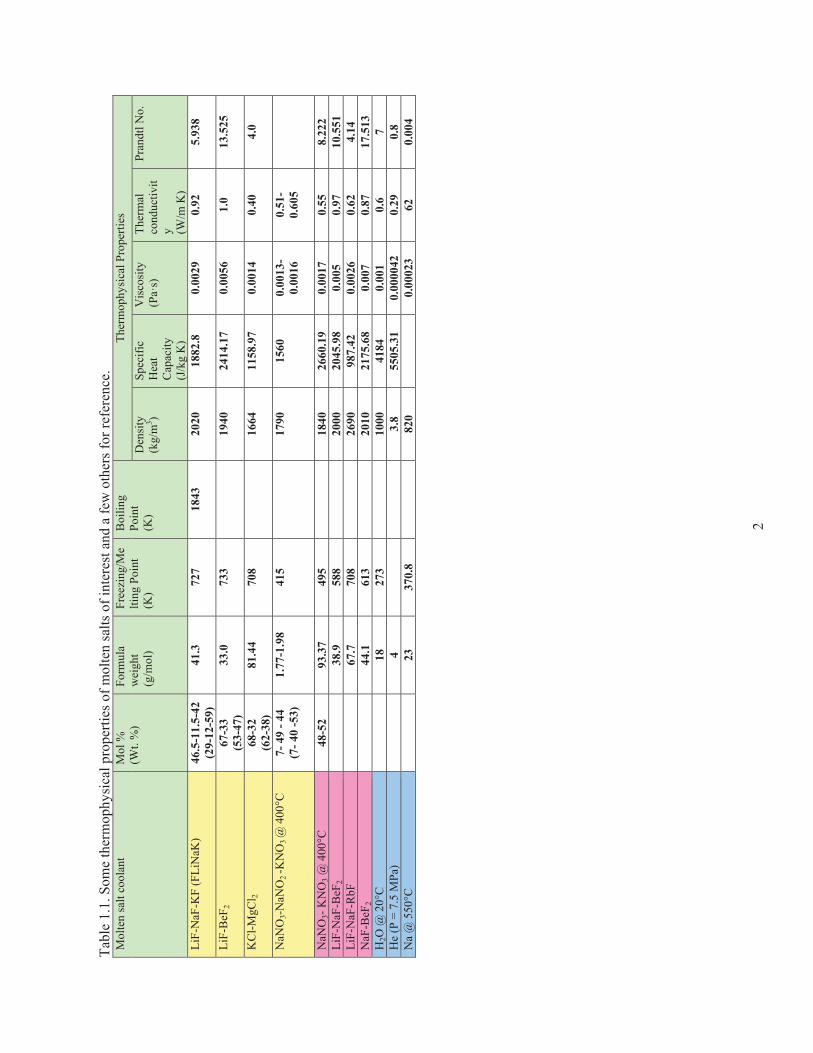
In the liquid state, molten salts have the viscosity and appearance similar to water. A mixture of sodium and potassium nitrate, with a melting temperature of ~222°C, is commonly used in solar applications. A primary advantage of molten salt technology is that the molten salt can be heated to ~560°C, which allows high energy steam to be generated at utility-standard temperatures (11.4 MPa, 550°C), achieving high thermodynamic cycle efficiencies of approximately 40 percent in modern steam turbine systems. Table 1.1 provides a list of the thermophysical properties of several types of molten salts.
2
Tabl
e 1.
1. S
ome
ther
mop
hysi
cal p
rope
rties
of m
olte
n sa
lts o
f int
eres
t and
a fe
w o
ther
s for
refe
renc
e.
Mol
ten
salt
cool
ant
Mol
%
(Wt.
%)
Form
ula
wei
ght
(g/m
ol)
Free
zing
/Me
lting
Poi
nt
(K)
Boi
ling
Poin
t (K
)
Ther
mop
hysi
cal P
rope
rties
D
ensi
ty
(kg/
m3 )
Spec
ific
Hea
t C
apac
ity
(J/k
g K
)
Vis
cosi
ty
(Pa·
s)
Ther
mal
co
nduc
tivit
y (W/m
K)
Pran
dtl N
o.
LiF-
NaF
-KF
(FLi
NaK
) 46
.5-1
1.5-
42
(29-
12-5
9)
41.3
72
7 18
43
2020
18
82.8
0.
0029
0.
92
5.93
8
LiF-
BeF
2 67
-33
(53-
47)
33.0
73
3
1940
24
14.1
7 0.
0056
1.
0 13
.525
KC
l-MgC
l 2 68
-32
(62-
38)
81.4
4 70
8
1664
11
58.9
7 0.
0014
0.
40
4.0
NaN
O3-
NaN
O2 -K
NO
3 @
400
°C
7- 4
9 - 4
4 (7
- 40
-53)
1.77
-1.9
8 41
5
1790
15
60
0.00
13-
0.00
16
0.51
- 0.
605
NaN
O3-
KN
O3 @
400
°C
48-5
2 93
.37
495
18
40
2660
.19
0.00
17
0.55
8.
222
LiF-
NaF
-BeF
2
38.9
58
8
2000
20
45.9
8 0.
005
0.97
10
.551
Li
F-N
aF-R
bF
67
.7
708
26
90
987.
42
0.00
26
0.62
4.
14
NaF
-BeF
2
44.1
61
3
2010
21
75.6
8 0.
007
0.87
17
.513
H
2O @
20°
C
18
27
3
1000
41
84
0.00
1 0.
6 7
He
(P =
7.5
MPa
)
4
3.
8 55
05.3
1 0.
0000
42
0.29
0.
8 N
a @
550
°C
23
37
0.8
82
0
0.00
023
62
0.00
4
3
2. THERMOPHYSICAL PROPERTIES Because the interest in molten salt arises from its application for transporting heat from a nuclear reactor, as well as the transport of process heat from a reactor to a heat sink, four salts (FLiNaK, FLiBe, KCl-MgCl2, and NaNO3-NaNO2-KNO3) have been identified for such an application and studied in this report. Their exact composition can vary depending on several factors: commercially available compounds, desired characteristics, and the manufacturing process. However, some common compositions are given in Table 1.1.
2.1 Overview of Thermophysical Properties and Respective Correlations
In this section, commonly accepted correlations, values, and corresponding sources for molten salt thermophysical properties are summarized. As a general rule, the molten salt properties will be needed in the temperature range of the nuclear reactor operation and process plant application. Based on this thought, most of the properties may be needed in the temperature range of 700–1450 K. A simple examination of the completeness of these data will be done by checking their applicable temperature range. Their applicability and reasonableness to calculate heat transfer related parameters (such as the Nusselt number, pressure drop, etc.) will also be presented. Overall, only four salts (FLiNaK, FLiBe, KCl-MgCl2, and NaNO3-NaNO2-KNO3) were considered. Therefore, the subsections below are organized under these four salt types. For convenience, symbols and units of these properties are listed below (besides being listed in the Nomenclature section).
Temperature, T, is in K, density, , is in kg/m3, specific heat capacity, Cp, is in J/kg·K, viscosity, , is in Pa·s, surface tension, , is in N/m, and thermal conductivity, k, is in W/m·K.
2.1.1 Lithium Fluoride - Sodium Fluoride - Potassium Fluoride (LiF- NaF- KF) One of the salts considered is lithium fluoride-sodium fluoride-potassium fluoride, also called FLiNaK, with a molar composition of 46.5-11.5-42%. Some thermophysical properties of this salt are listed below. Density, : Three correlations for density from literature are given below:
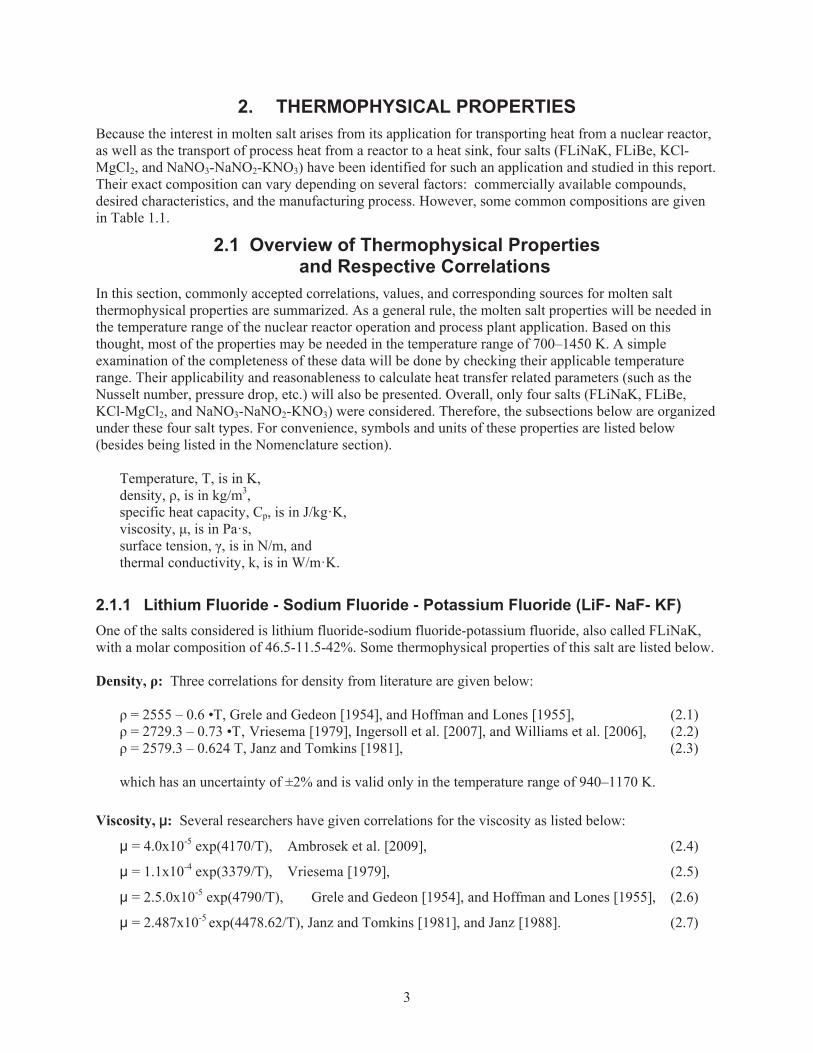
= 2555 – 0.6 •T, Grele and Gedeon [1954], and Hoffman and Lones [1955], (2.1) = 2729.3 – 0.73 •T‚ Vriesema [1979], Ingersoll et al. [2007], and Williams et al. [2006], (2.2) = 2579.3 – 0.624 T, Janz and Tomkins [1981], (2.3)
which has an uncertainty of ±2% and is valid only in the temperature range of 940–1170 K.
Viscosity, : Several researchers have given correlations for the viscosity as listed below:
= 4.0x10⁻⁵ exp(4170/T), Ambrosek et al. [2009], (2.4)
= 1.1x10⁻⁴ exp(3379/T), Vriesema [1979], (2.5)
= 2.5.0x10-5 exp(4790/T), Grele and Gedeon [1954], and Hoffman and Lones [1955], (2.6)
= 2.487x10⁻⁵ exp(4478.62/T), Janz and Tomkins [1981], and Janz [1988]. (2.7)
4
Correlations (2.6) and (2.7) are nearly the same. Correlation (2.7) is applicable in the temperature range of 770–970 K and has an uncertainty of ±2%. From the correlations for density and viscosity, two representative correlations are plotted in Figure 2.1. It should be noted that a solid line shows the property in the applicable temperature range, whereas a dashed line shows the property extrapolated outside the applicable temperature range. These plots show the need for experimental data in the extrapolated temperature range.
Figure 2.1. Plots of density and viscosity correlations for FLiNaK molten salt.
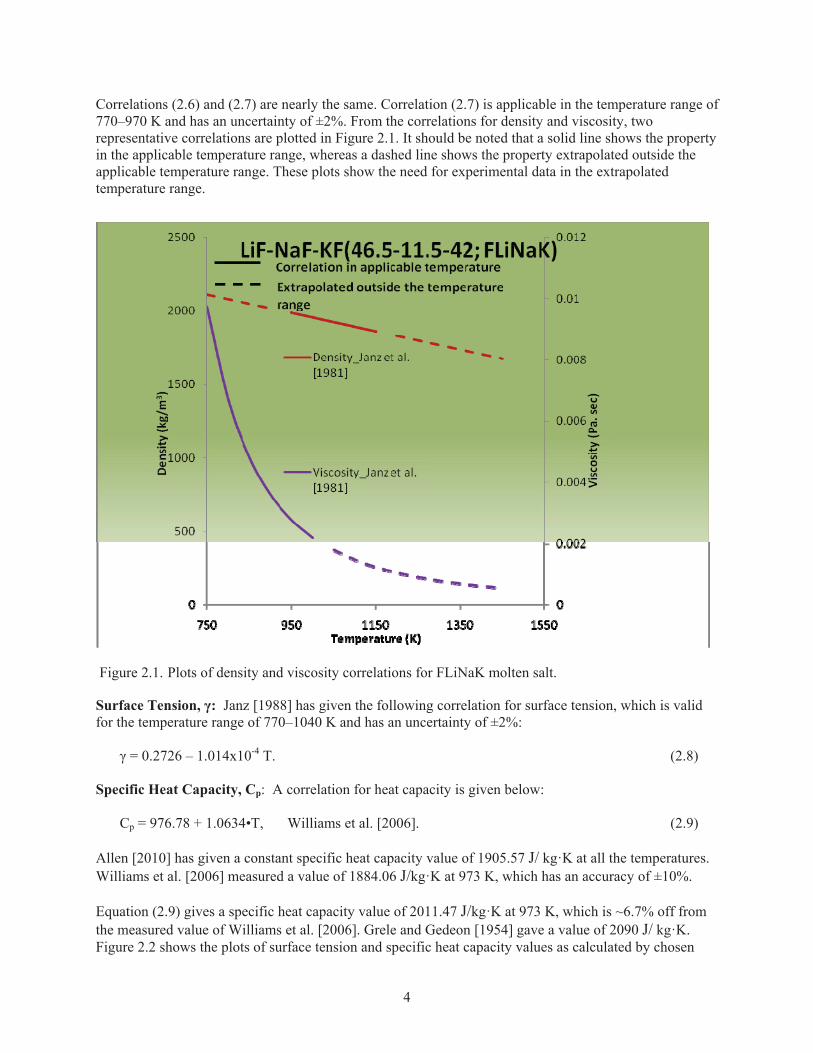
Surface Tension, : Janz [1988] has given the following correlation for surface tension, which is valid for the temperature range of 770–1040 K and has an uncertainty of ±2%: = 0.2726 – 1.014x10⁻⁴ T. (2.8) Specific Heat Capacity, Cp: A correlation for heat capacity is given below: Cp = 976.78 + 1.0634•T, Williams et al. [2006]. (2.9) Allen [2010] has given a constant specific heat capacity value of 1905.57 J/ kg·K at all the temperatures. Williams et al. [2006] measured a value of 1884.06 J/kg·K at 973 K, which has an accuracy of ±10%. Equation (2.9) gives a specific heat capacity value of 2011.47 J/kg·K at 973 K, which is ~6.7% off from the measured value of Williams et al. [2006]. Grele and Gedeon [1954] gave a value of 2090 J/ kg·K. Figure 2.2 shows the plots of surface tension and specific heat capacity values as calculated by chosen
5
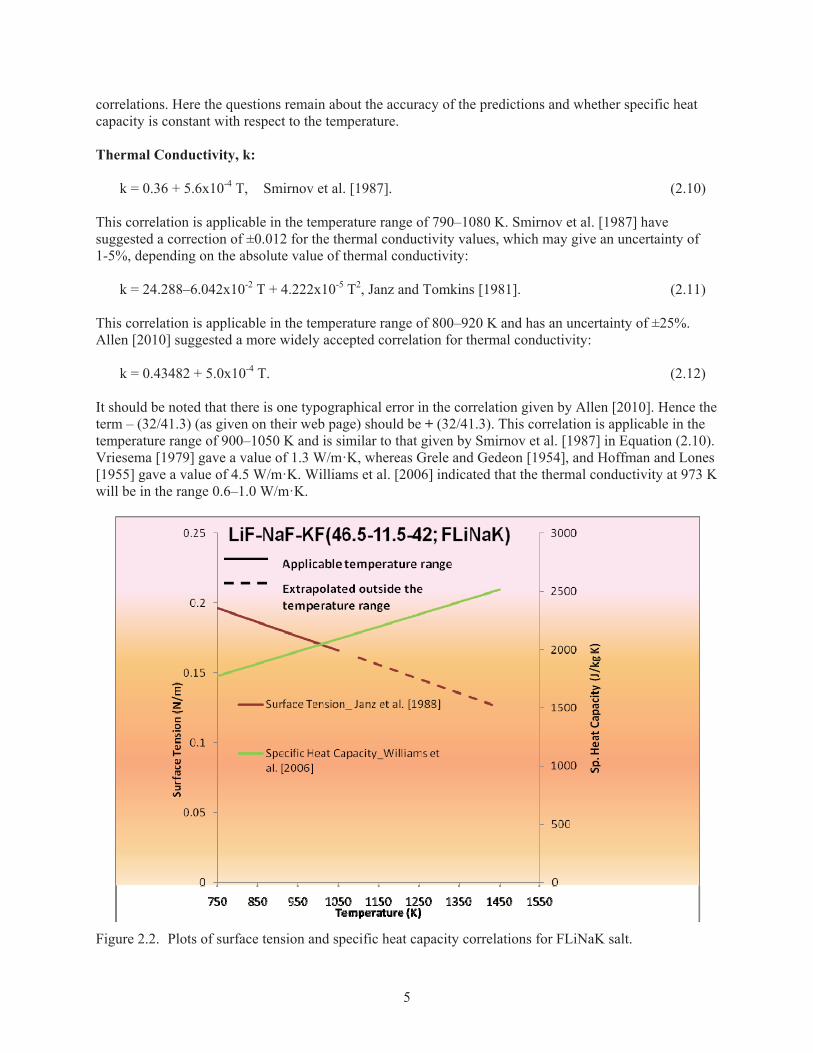
correlations. Here the questions remain about the accuracy of the predictions and whether specific heat capacity is constant with respect to the temperature. Thermal Conductivity, k: k = 0.36 + 5.6x10⁻⁴ T, Smirnov et al. [1987]. (2.10) This correlation is applicable in the temperature range of 790–1080 K. Smirnov et al. [1987] have suggested a correction of ±0.012 for the thermal conductivity values, which may give an uncertainty of 1-5%, depending on the absolute value of thermal conductivity:
k = 24.288–6.042x10⁻² T + 4.222x10⁻⁵ T2, Janz and Tomkins [1981]. (2.11) This correlation is applicable in the temperature range of 800–920 K and has an uncertainty of ±25%. Allen [2010] suggested a more widely accepted correlation for thermal conductivity:
k = 0.43482 + 5.0x10⁻⁴ T. (2.12) It should be noted that there is one typographical error in the correlation given by Allen [2010]. Hence the term – (32/41.3) (as given on their web page) should be + (32/41.3). This correlation is applicable in the temperature range of 900–1050 K and is similar to that given by Smirnov et al. [1987] in Equation (2.10). Vriesema [1979] gave a value of 1.3 W/m·K, whereas Grele and Gedeon [1954], and Hoffman and Lones [1955] gave a value of 4.5 W/m·K. Williams et al. [2006] indicated that the thermal conductivity at 973 K will be in the range 0.6–1.0 W/m·K.
Figure 2.2. Plots of surface tension and specific heat capacity correlations for FLiNaK salt.
6
Figure 2.3. Plots of thermal conductivity correlation and Nusselt number calculations for FLiNaK salt.
Figure 2.3 shows the plot of correlation for thermal conductivity from Smirnov et al. [1987] given in Equation (2.10). In order to have a qualitative examination of the Nusselt number, the following assumptions were made:
Dittus-Boelter correlation: Nu = 0.023 Re0.8 Pr0.4 Flow velocity = 0.1 m/s Flow conduit diameter = 0.1 m.
These values were chosen arbitrarily and are assumed to be the same for all of the salts and may be far from correct practical values. The objective is to make a performance comparison of various salts. Based on the thermophysical properties, Figure 2.3 shows the variation of Nusselt number with respect to temperature.
2.1.2 Lithium Fluoride - Beryllium Fluoride (LiF – BeF2) Lithium fluoride - beryllium fluoride (LiF-BeF2, or 2LiF-BeF2) with 67-33 mol% composition, commonly known as FLiBe, is another molten salt that was considered for heat transport applications. Density, : Several correlations for density from literature are given below:
= 2413–0.488•T, Janz et al. [1974], Janz [1988]. (2.13) This correlation is applicable in the temperature range of 800–1080 K.
7
Zaghloul et al. [2003] fitted the Janz et al. [1974] data with some values at critical conditons to obtain the correlation for densty, which is applicable for the entire temperature range (melting point to critical point of 732.2–4498.8 K): = 2415.6 - 0.49072•T. (2.14) Ignat’ev et al. [2006] noted non-linear behavior of density in the 943–1003 K range, which may be because of gas bubbles formation. To correct this problem, Ignat’ev et al. [2006] developed the following two correlations for density: = (2163±2.3) – A(T- 874.4), where (2.15) A = (0.406±0.029), for T<973 K and A = (0.687±0.096), for T>973 K. Neglecting the uncertainties in the density measurements (± values of A), the density correlation of Equation (2.15) can be simplified as follows:
= 2518 – 0.406 T, for T<973 K, (2.16) = 2763.7 – 0.0.687 T, for T>973 K. (2.17)
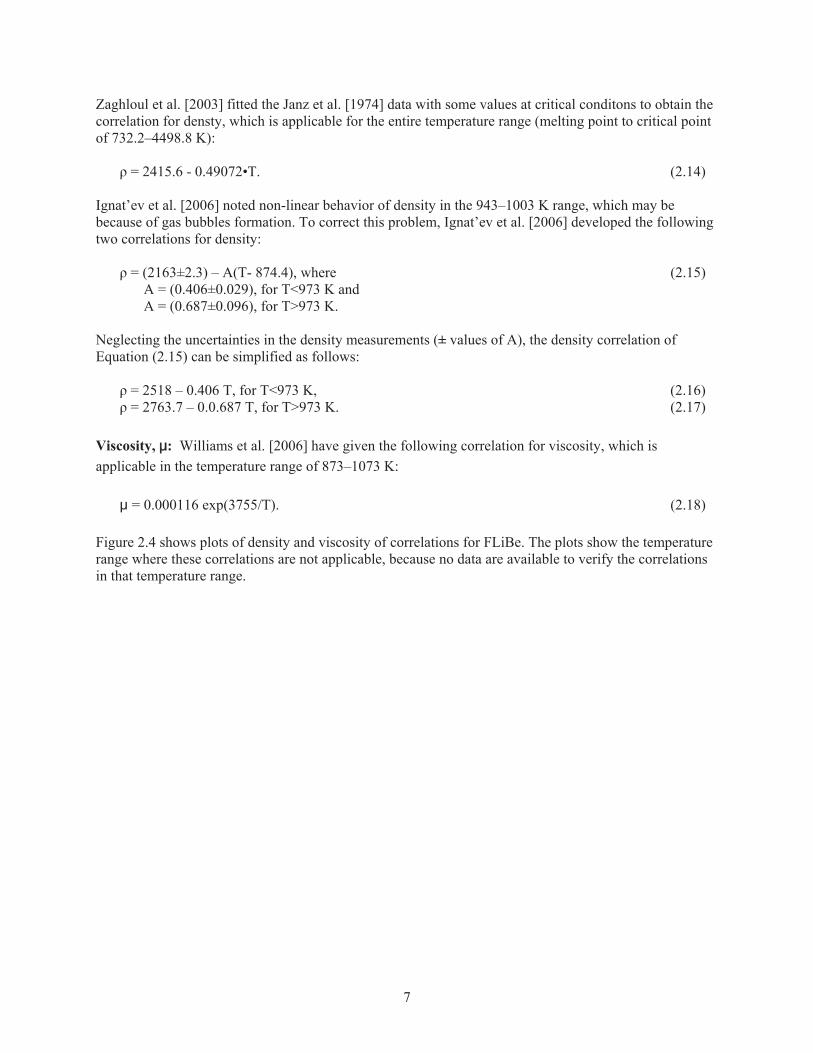
Viscosity, : Williams et al. [2006] have given the following correlation for viscosity, which is applicable in the temperature range of 873–1073 K: = 0.000116 exp(3755/T). (2.18) Figure 2.4 shows plots of density and viscosity of correlations for FLiBe. The plots show the temperature range where these correlations are not applicable, because no data are available to verify the correlations in that temperature range.
8
Figure 2.4. Plots of density and viscosity correlations for FLiBe molten salt.
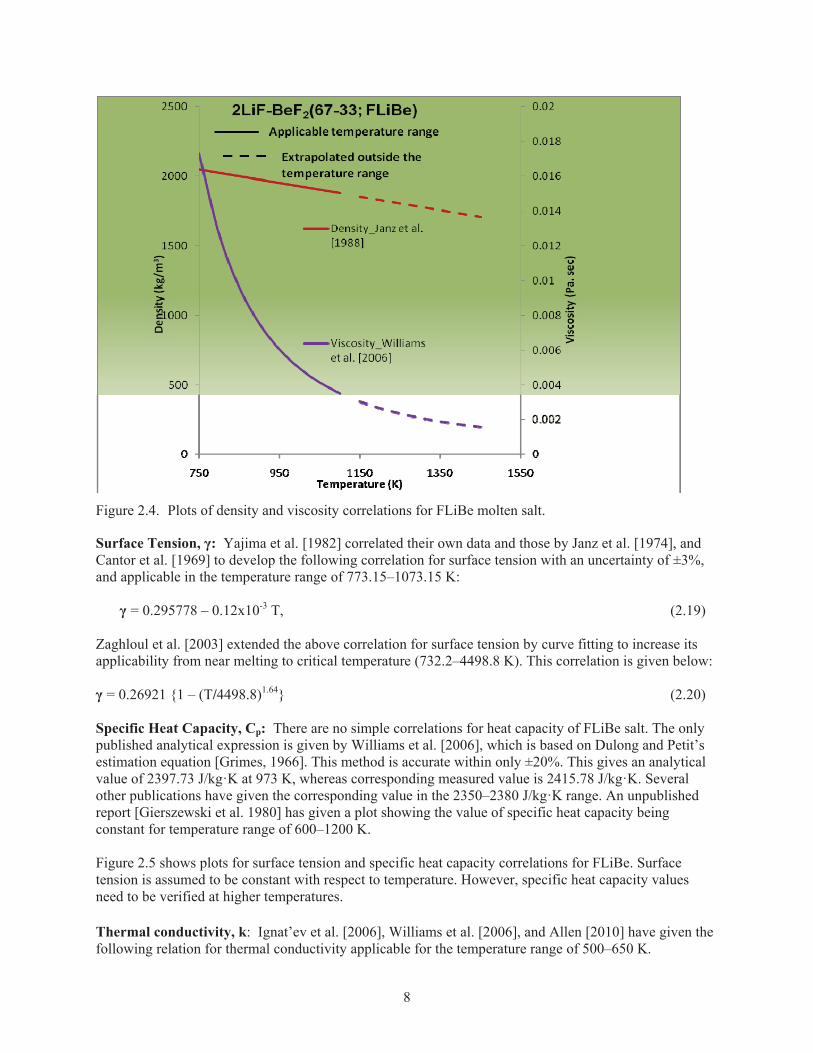
Surface Tension, : Yajima et al. [1982] correlated their own data and those by Janz et al. [1974], and Cantor et al. [1969] to develop the following correlation for surface tension with an uncertainty of ±3%, and applicable in the temperature range of 773.15–1073.15 K: = 0.295778 – 0.12x10⁻³ T, (2.19) Zaghloul et al. [2003] extended the above correlation for surface tension by curve fitting to increase its applicability from near melting to critical temperature (732.2–4498.8 K). This correlation is given below:
= 0.26921 {1 – (T/4498.8)1.64} (2.20) Specific Heat Capacity, Cp: There are no simple correlations for heat capacity of FLiBe salt. The only published analytical expression is given by Williams et al. [2006], which is based on Dulong and Petit’s estimation equation [Grimes, 1966]. This method is accurate within only ±20%. This gives an analytical value of 2397.73 J/kg·K at 973 K, whereas corresponding measured value is 2415.78 J/kg·K. Several other publications have given the corresponding value in the 2350–2380 J/kg·K range. An unpublished report [Gierszewski et al. 1980] has given a plot showing the value of specific heat capacity being constant for temperature range of 600–1200 K. Figure 2.5 shows plots for surface tension and specific heat capacity correlations for FLiBe. Surface tension is assumed to be constant with respect to temperature. However, specific heat capacity values need to be verified at higher temperatures.
Thermal conductivity, k: Ignat’ev et al. [2006], Williams et al. [2006], and Allen [2010] have given the following relation for thermal conductivity applicable for the temperature range of 500–650 K.
9
k = 32/(molecular mass in g/mole) – 0.34 + 0.0005•T,
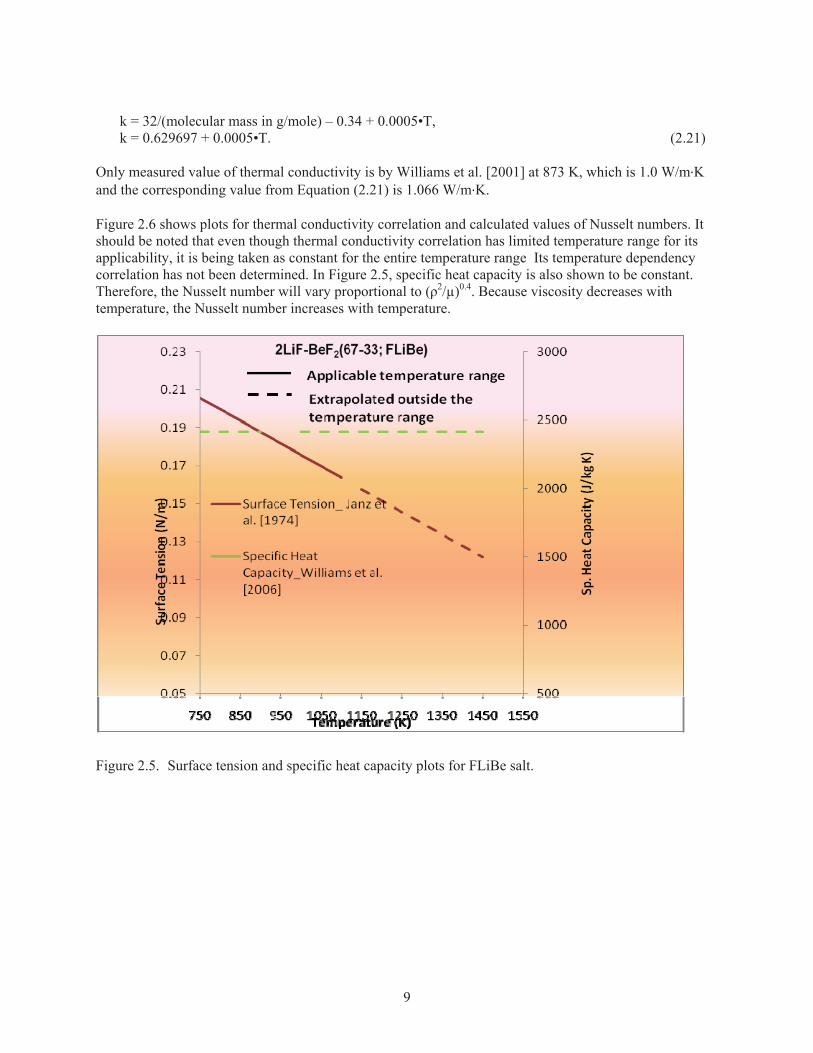
k = 0.629697 + 0.0005•T. (2.21) Only measured value of thermal conductivity is by Williams et al. [2001] at 873 K, which is 1.0 W/m K and the corresponding value from Equation (2.21) is 1.066 W/m K. Figure 2.6 shows plots for thermal conductivity correlation and calculated values of Nusselt numbers. It should be noted that even though thermal conductivity correlation has limited temperature range for its applicability, it is being taken as constant for the entire temperature range Its temperature dependency correlation has not been determined. In Figure 2.5, specific heat capacity is also shown to be constant. Therefore, the Nusselt number will vary proportional to ( 2/μ)0.4. Because viscosity decreases with temperature, the Nusselt number increases with temperature.
Figure 2.5. Surface tension and specific heat capacity plots for FLiBe salt.
10
Figure 2.6. Plots of thermal conductivity correlation and Nusselt number calculation for FLiBe.
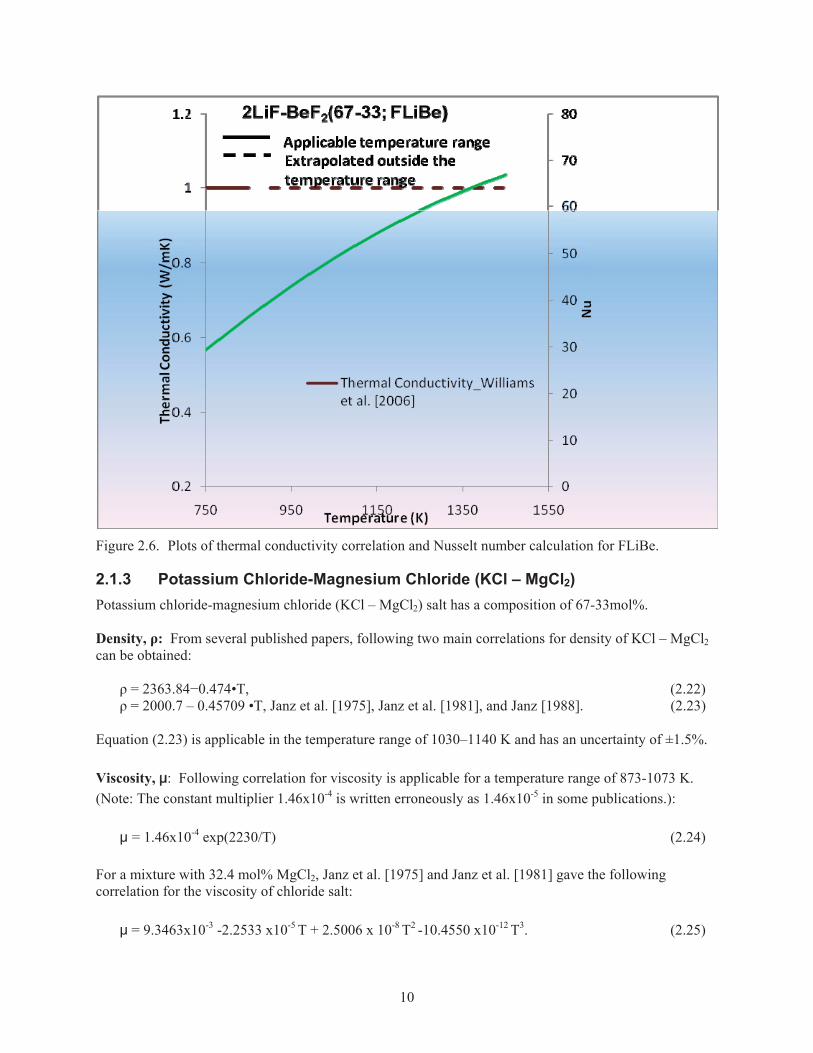
2.1.3 Potassium Chloride-Magnesium Chloride (KCl – MgCl2) Potassium chloride-magnesium chloride (KCl – MgCl2) salt has a composition of 67-33mol%. Density, : From several published papers, following two main correlations for density of KCl – MgCl2 can be obtained: = 2363.84 0.474•T, (2.22) = 2000.7 – 0.45709 •T, Janz et al. [1975], Janz et al. [1981], and Janz [1988]. (2.23) Equation (2.23) is applicable in the temperature range of 1030–1140 K and has an uncertainty of ±1.5%. Viscosity, : Following correlation for viscosity is applicable for a temperature range of 873-1073 K. (Note: The constant multiplier 1.46x10⁻⁴ is written erroneously as 1.46x10⁻⁵ in some publications.): = 1.46x10⁻⁴ exp(2230/T) (2.24) For a mixture with 32.4 mol% MgCl2, Janz et al. [1975] and Janz et al. [1981] gave the following correlation for the viscosity of chloride salt: = 9.3463x10⁻³ -2.2533 x10⁻⁵ T + 2.5006 x 10⁻⁸ T2 -10.4550 x10⁻¹² T3. (2.25)
11
For a mixture with 34.3 mol% MgCl2, Janz et al. [1975] and Janz et al. [1981], gave the following correlation:
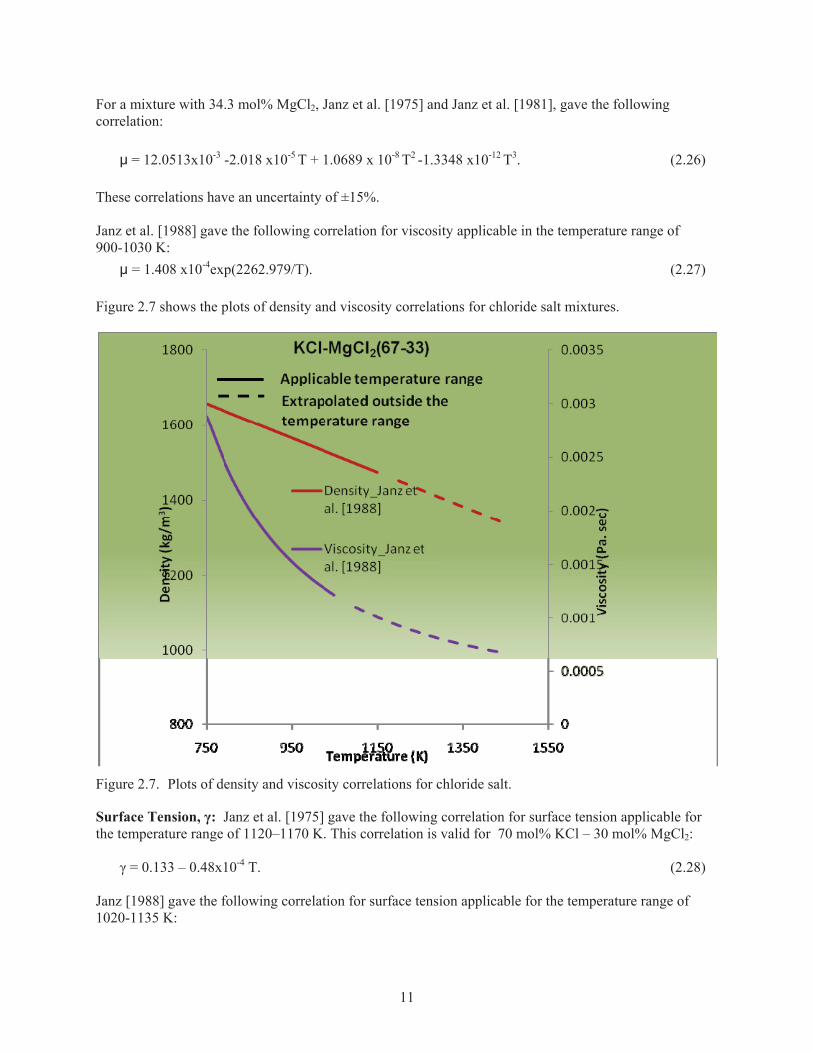
= 12.0513x10⁻³ -2.018 x10⁻⁵ T + 1.0689 x 10⁻⁸ T2 -1.3348 x10⁻¹² T3. (2.26) These correlations have an uncertainty of ±15%. Janz et al. [1988] gave the following correlation for viscosity applicable in the temperature range of 900-1030 K: = 1.408 x10⁻⁴exp(2262.979/T). (2.27) Figure 2.7 shows the plots of density and viscosity correlations for chloride salt mixtures.
Figure 2.7. Plots of density and viscosity correlations for chloride salt.
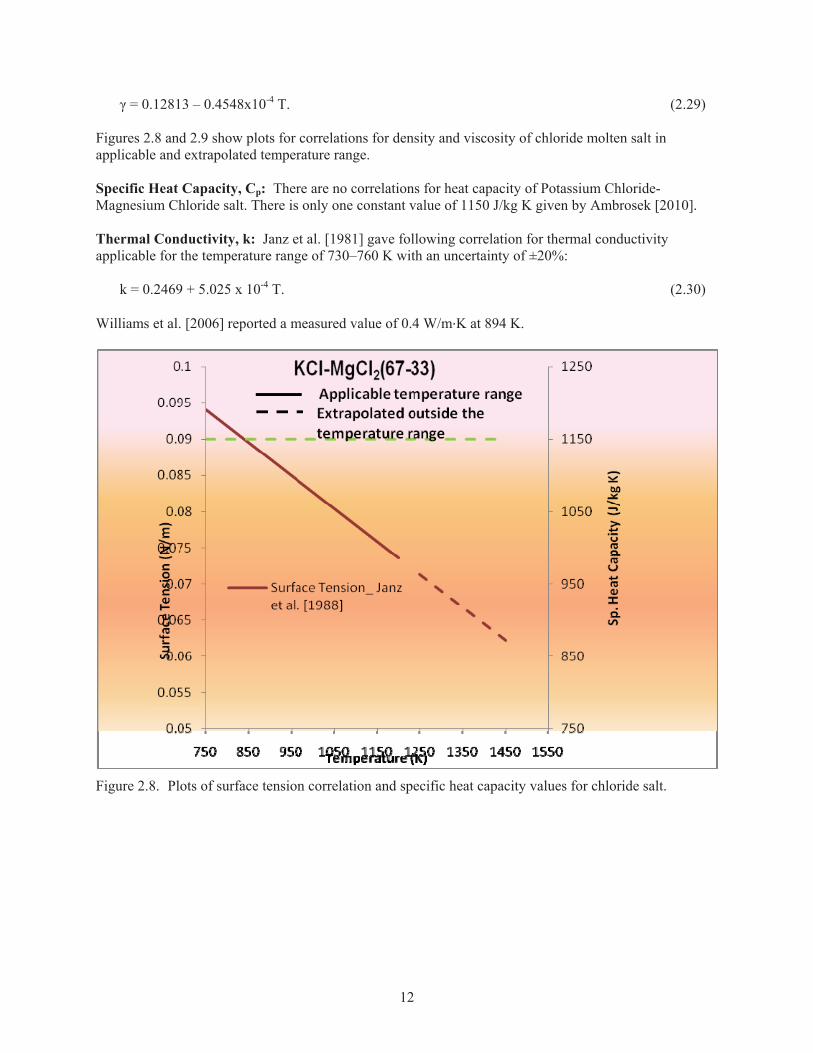
Surface Tension, : Janz et al. [1975] gave the following correlation for surface tension applicable for the temperature range of 1120–1170 K. This correlation is valid for 70 mol% KCl – 30 mol% MgCl2: = 0.133 – 0.48x10⁻⁴ T. (2.28) Janz [1988] gave the following correlation for surface tension applicable for the temperature range of 1020-1135 K:
12
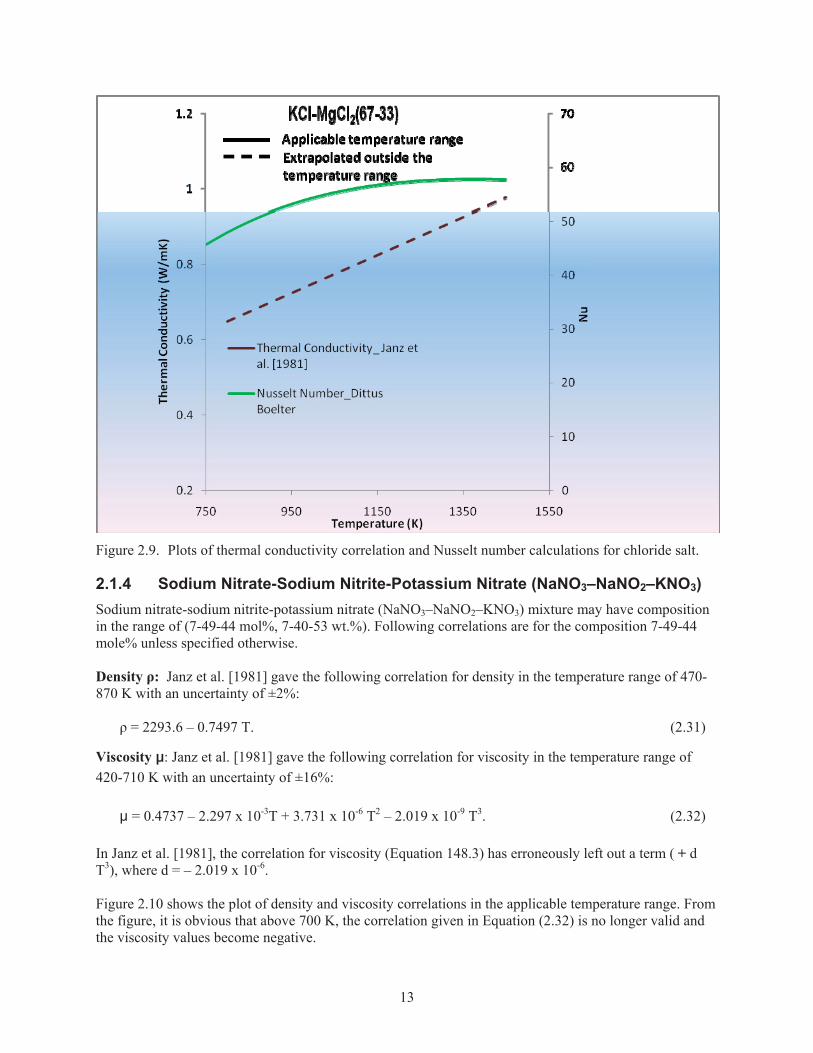
= 0.12813 – 0.4548x10⁻⁴ T. (2.29) Figures 2.8 and 2.9 show plots for correlations for density and viscosity of chloride molten salt in applicable and extrapolated temperature range. Specific Heat Capacity, Cp: There are no correlations for heat capacity of Potassium Chloride-Magnesium Chloride salt. There is only one constant value of 1150 J/kg K given by Ambrosek [2010]. Thermal Conductivity, k: Janz et al. [1981] gave following correlation for thermal conductivity applicable for the temperature range of 730–760 K with an uncertainty of ±20%: k = 0.2469 + 5.025 x 10⁻⁴ T. (2.30) Williams et al. [2006] reported a measured value of 0.4 W/m K at 894 K.
Figure 2.8. Plots of surface tension correlation and specific heat capacity values for chloride salt.
13
Figure 2.9. Plots of thermal conductivity correlation and Nusselt number calculations for chloride salt.
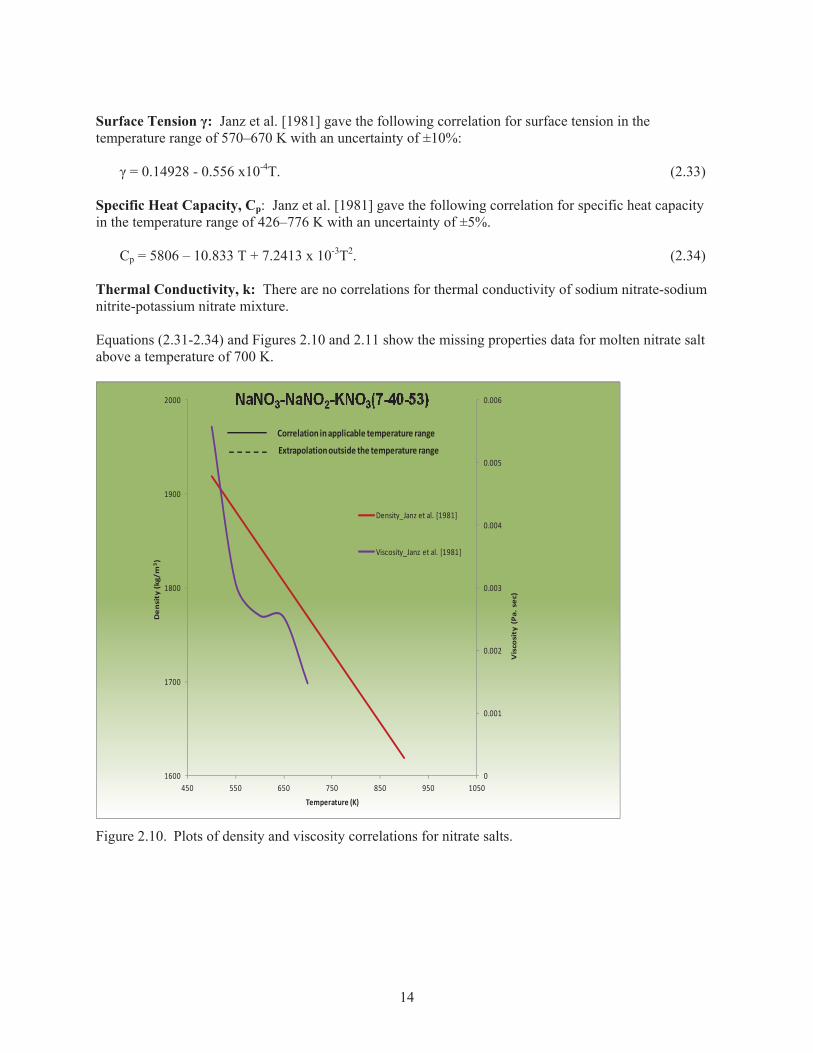
2.1.4 Sodium Nitrate-Sodium Nitrite-Potassium Nitrate (NaNO3–NaNO2–KNO3) Sodium nitrate-sodium nitrite-potassium nitrate (NaNO3–NaNO2–KNO3) mixture may have composition in the range of (7-49-44 mol%, 7-40-53 wt.%). Following correlations are for the composition 7-49-44 mole% unless specified otherwise. Density : Janz et al. [1981] gave the following correlation for density in the temperature range of 470-870 K with an uncertainty of ±2%: = 2293.6 – 0.7497 T. (2.31)
Viscosity : Janz et al. [1981] gave the following correlation for viscosity in the temperature range of 420-710 K with an uncertainty of ±16%: = 0.4737 – 2.297 x 10⁻³T + 3.731 x 10⁻⁶ T2 – 2.019 x 10⁻⁹ T3. (2.32) In Janz et al. [1981], the correlation for viscosity (Equation 148.3) has erroneously left out a term ( + d T3), where d = – 2.019 x 10⁻⁶. Figure 2.10 shows the plot of density and viscosity correlations in the applicable temperature range. From the figure, it is obvious that above 700 K, the correlation given in Equation (2.32) is no longer valid and the viscosity values become negative.
14
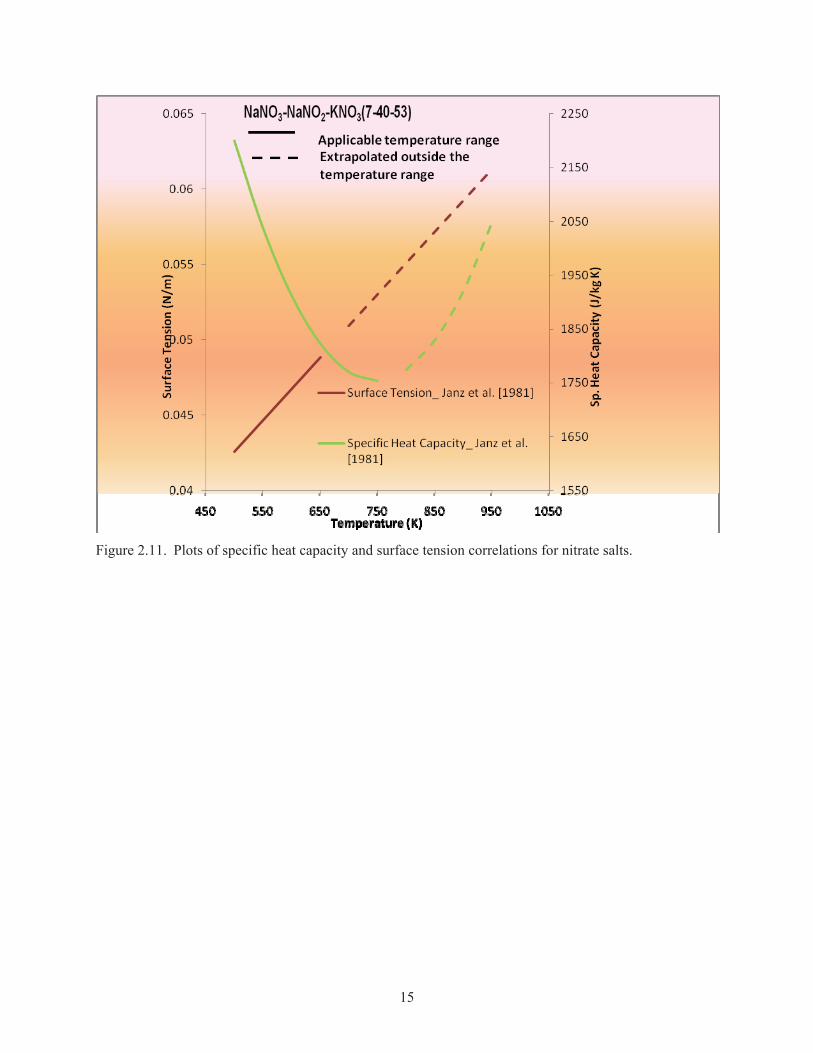
Surface Tension : Janz et al. [1981] gave the following correlation for surface tension in the temperature range of 570–670 K with an uncertainty of ±10%: = 0.14928 - 0.556 x10⁻⁴T. (2.33) Specific Heat Capacity, Cp: Janz et al. [1981] gave the following correlation for specific heat capacity in the temperature range of 426–776 K with an uncertainty of ±5%. Cp = 5806 – 10.833 T + 7.2413 x 10⁻³T2. (2.34) Thermal Conductivity, k: There are no correlations for thermal conductivity of sodium nitrate-sodium nitrite-potassium nitrate mixture. Equations (2.31-2.34) and Figures 2.10 and 2.11 show the missing properties data for molten nitrate salt above a temperature of 700 K.
0
0.001
0.002
0.003
0.004
0.005
0.006
1600
1700
1800
1900
2000
450 550 650 750 850 950 1050
Viscosity
(Pa.sec)
Den
sity
(kg/m
3)
Temperature (K)
Density_Janz et al. [1981]
Viscosity_Janz et al. [1981]
Correlation inapplicable temperature range
Extrapolationoutside the temperature range
Figure 2.10. Plots of density and viscosity correlations for nitrate salts.
15
Figure 2.11. Plots of specific heat capacity and surface tension correlations for nitrate salts.
16
2.2 Effect of Uncertainty in Thermophysical Properties on the Nusselt Number
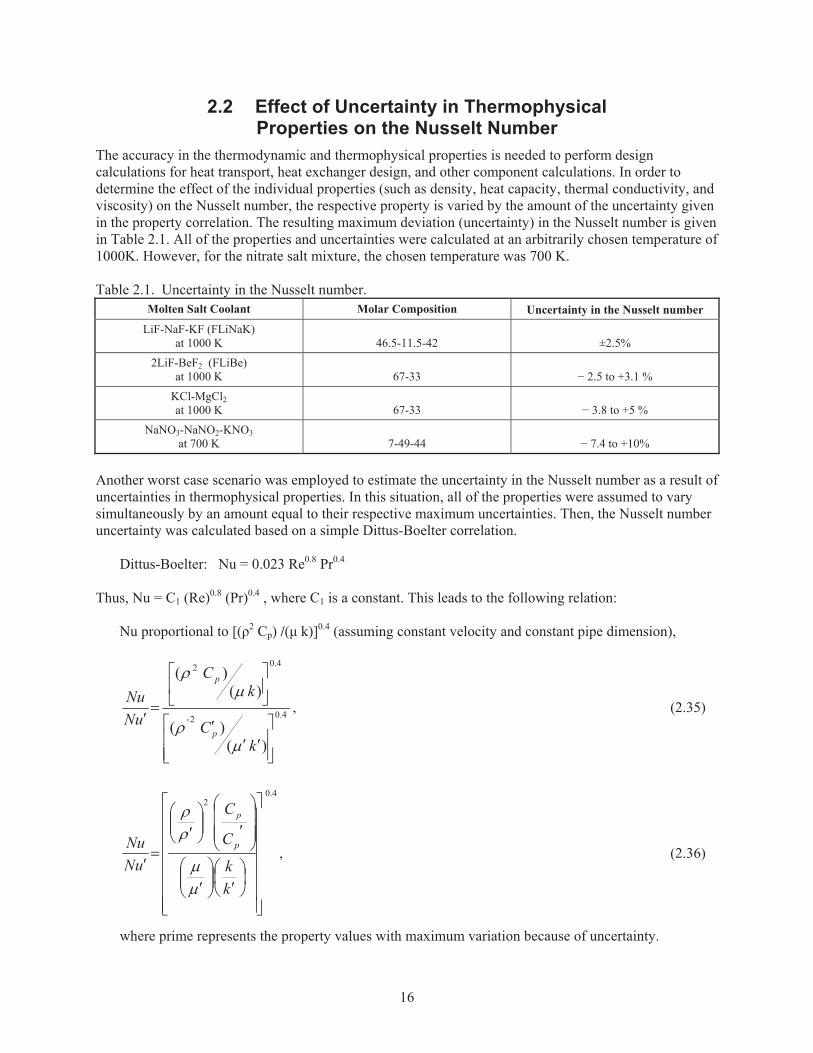
The accuracy in the thermodynamic and thermophysical properties is needed to perform design calculations for heat transport, heat exchanger design, and other component calculations. In order to determine the effect of the individual properties (such as density, heat capacity, thermal conductivity, and viscosity) on the Nusselt number, the respective property is varied by the amount of the uncertainty given in the property correlation. The resulting maximum deviation (uncertainty) in the Nusselt number is given in Table 2.1. All of the properties and uncertainties were calculated at an arbitrarily chosen temperature of 1000K. However, for the nitrate salt mixture, the chosen temperature was 700 K. Table 2.1. Uncertainty in the Nusselt number.
Molten Salt Coolant Molar Composition Uncertainty in the Nusselt number LiF-NaF-KF (FLiNaK)
at 1000 K 46.5-11.5-42 ±2.5%
2LiF-BeF2 (FLiBe) at 1000 K 67-33 2.5 to +3.1 %
KCl-MgCl2 at 1000 K 67-33 3.8 to +5 %
NaNO3-NaNO2-KNO3 at 700 K 7-49-44 7.4 to +10%
Another worst case scenario was employed to estimate the uncertainty in the Nusselt number as a result of uncertainties in thermophysical properties. In this situation, all of the properties were assumed to vary simultaneously by an amount equal to their respective maximum uncertainties. Then, the Nusselt number uncertainty was calculated based on a simple Dittus-Boelter correlation. Dittus-Boelter: Nu = 0.023 Re0.8 Pr0.4 Thus, Nu = C1 (Re)0.8 (Pr)0.4 , where C1 is a constant. This leads to the following relation:
Nu proportional to [( 2 Cp) /( k)]0.4 (assuming constant velocity and constant pipe dimension),
4.02'
4.02
)()(
)()(
kC
kC
uNNu
p
p
, (2.35)
4.0
2
kk
C
C
uNNu p
p
, (2.36)
where prime represents the property values with maximum variation because of uncertainty.
17
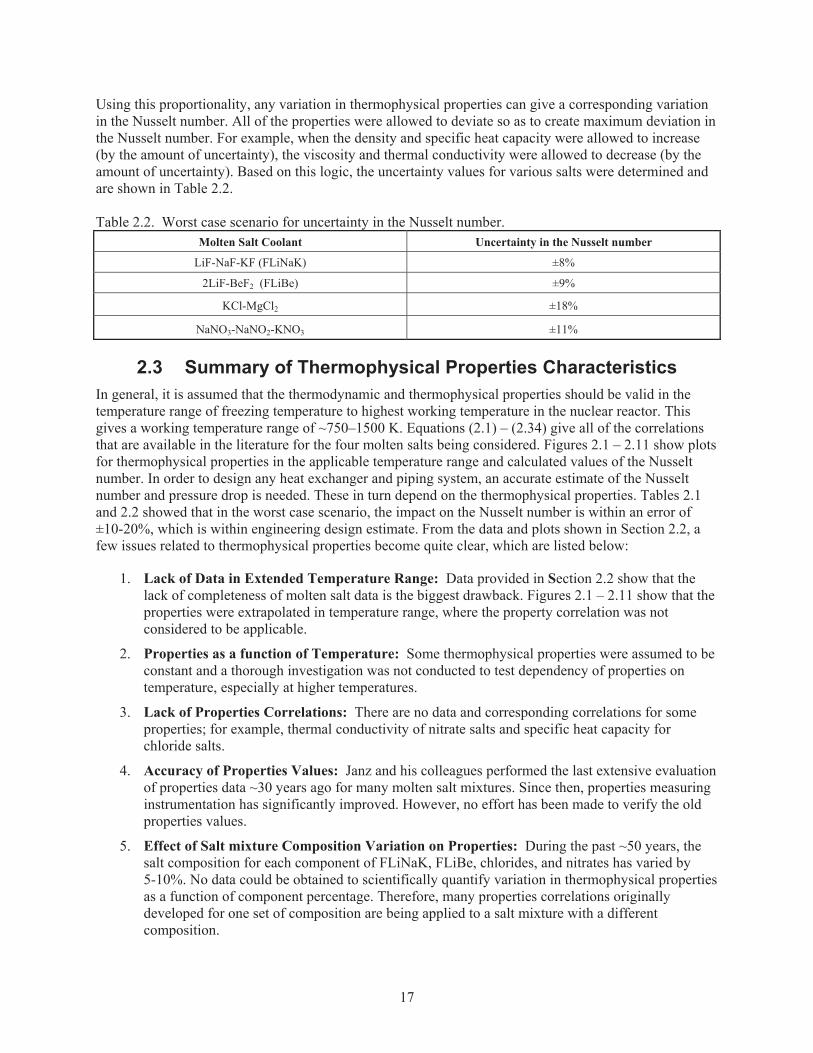
Using this proportionality, any variation in thermophysical properties can give a corresponding variation in the Nusselt number. All of the properties were allowed to deviate so as to create maximum deviation in the Nusselt number. For example, when the density and specific heat capacity were allowed to increase (by the amount of uncertainty), the viscosity and thermal conductivity were allowed to decrease (by the amount of uncertainty). Based on this logic, the uncertainty values for various salts were determined and are shown in Table 2.2. Table 2.2. Worst case scenario for uncertainty in the Nusselt number.
Molten Salt Coolant Uncertainty in the Nusselt number
LiF-NaF-KF (FLiNaK) ±8%
2LiF-BeF2 (FLiBe) ±9%
KCl-MgCl2 ±18%
NaNO3-NaNO2-KNO3 ±11%
2.3 Summary of Thermophysical Properties Characteristics In general, it is assumed that the thermodynamic and thermophysical properties should be valid in the temperature range of freezing temperature to highest working temperature in the nuclear reactor. This gives a working temperature range of ~750–1500 K. Equations (2.1) – (2.34) give all of the correlations that are available in the literature for the four molten salts being considered. Figures 2.1 – 2.11 show plots for thermophysical properties in the applicable temperature range and calculated values of the Nusselt number. In order to design any heat exchanger and piping system, an accurate estimate of the Nusselt number and pressure drop is needed. These in turn depend on the thermophysical properties. Tables 2.1 and 2.2 showed that in the worst case scenario, the impact on the Nusselt number is within an error of ±10-20%, which is within engineering design estimate. From the data and plots shown in Section 2.2, a few issues related to thermophysical properties become quite clear, which are listed below:
1. Lack of Data in Extended Temperature Range: Data provided in Section 2.2 show that the lack of completeness of molten salt data is the biggest drawback. Figures 2.1 – 2.11 show that the properties were extrapolated in temperature range, where the property correlation was not considered to be applicable.
2. Properties as a function of Temperature: Some thermophysical properties were assumed to be constant and a thorough investigation was not conducted to test dependency of properties on temperature, especially at higher temperatures.
3. Lack of Properties Correlations: There are no data and corresponding correlations for some properties; for example, thermal conductivity of nitrate salts and specific heat capacity for chloride salts.
4. Accuracy of Properties Values: Janz and his colleagues performed the last extensive evaluation of properties data ~30 years ago for many molten salt mixtures. Since then, properties measuring instrumentation has significantly improved. However, no effort has been made to verify the old properties values.
5. Effect of Salt mixture Composition Variation on Properties: During the past ~50 years, the salt composition for each component of FLiNaK, FLiBe, chlorides, and nitrates has varied by 5-10%. No data could be obtained to scientifically quantify variation in thermophysical properties as a function of component percentage. Therefore, many properties correlations originally developed for one set of composition are being applied to a salt mixture with a different composition.
18
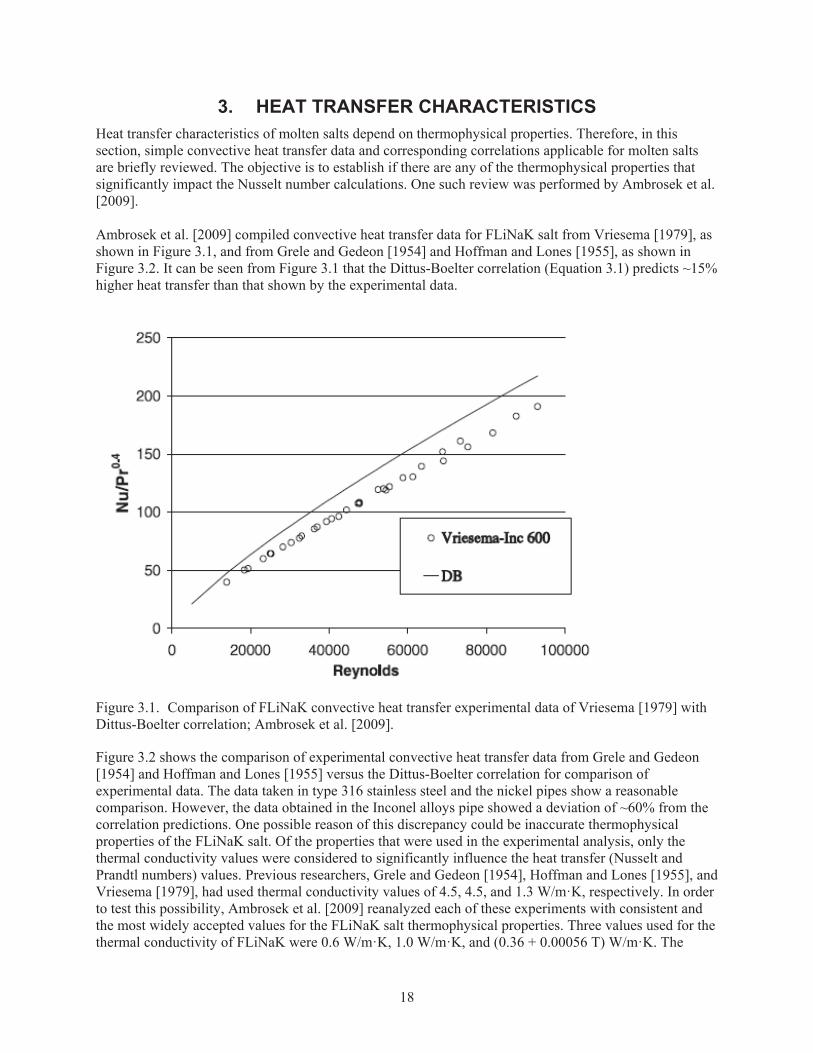
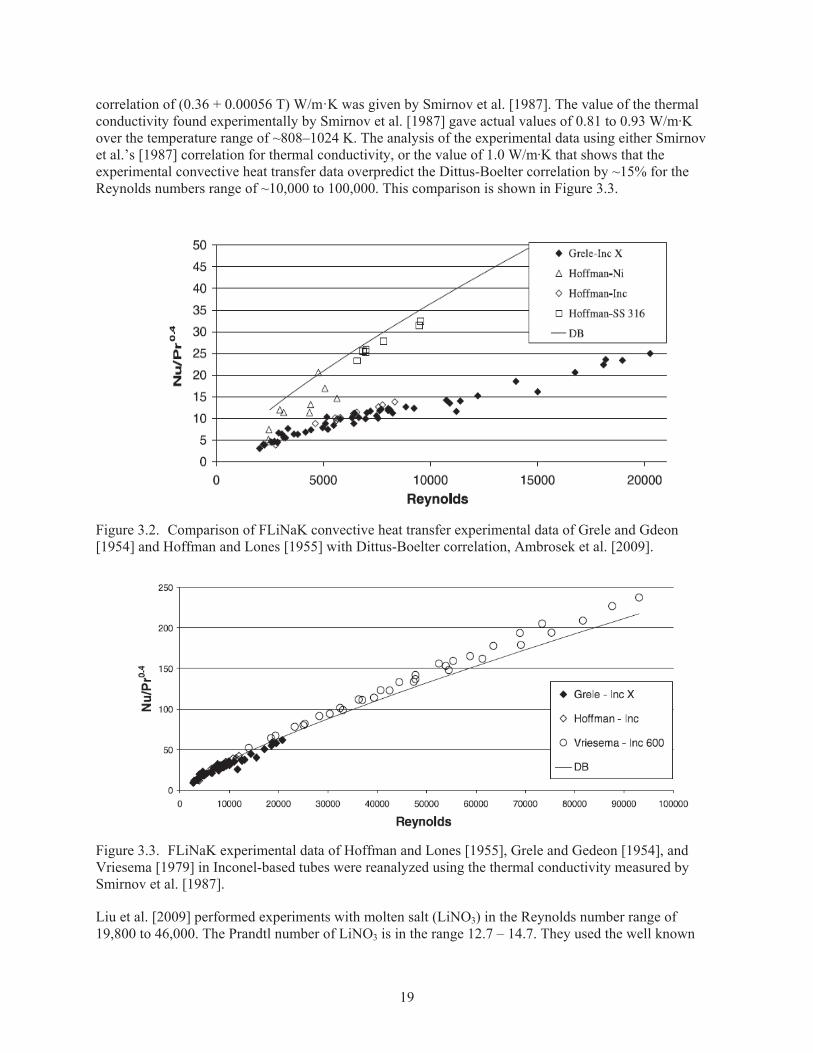
3. HEAT TRANSFER CHARACTERISTICS Heat transfer characteristics of molten salts depend on thermophysical properties. Therefore, in this section, simple convective heat transfer data and corresponding correlations applicable for molten salts are briefly reviewed. The objective is to establish if there are any of the thermophysical properties that significantly impact the Nusselt number calculations. One such review was performed by Ambrosek et al. [2009]. Ambrosek et al. [2009] compiled convective heat transfer data for FLiNaK salt from Vriesema [1979], as shown in Figure 3.1, and from Grele and Gedeon [1954] and Hoffman and Lones [1955], as shown in Figure 3.2. It can be seen from Figure 3.1 that the Dittus-Boelter correlation (Equation 3.1) predicts ~15% higher heat transfer than that shown by the experimental data.
Figure 3.1. Comparison of FLiNaK convective heat transfer experimental data of Vriesema [1979] with Dittus-Boelter correlation; Ambrosek et al. [2009].
Figure 3.2 shows the comparison of experimental convective heat transfer data from Grele and Gedeon [1954] and Hoffman and Lones [1955] versus the Dittus-Boelter correlation for comparison of experimental data. The data taken in type 316 stainless steel and the nickel pipes show a reasonable comparison. However, the data obtained in the Inconel alloys pipe showed a deviation of ~60% from the correlation predictions. One possible reason of this discrepancy could be inaccurate thermophysical properties of the FLiNaK salt. Of the properties that were used in the experimental analysis, only the thermal conductivity values were considered to significantly influence the heat transfer (Nusselt and Prandtl numbers) values. Previous researchers, Grele and Gedeon [1954], Hoffman and Lones [1955], and Vriesema [1979], had used thermal conductivity values of 4.5, 4.5, and 1.3 W/m·K, respectively. In order to test this possibility, Ambrosek et al. [2009] reanalyzed each of these experiments with consistent and the most widely accepted values for the FLiNaK salt thermophysical properties. Three values used for the thermal conductivity of FLiNaK were 0.6 W/m·K, 1.0 W/m·K, and (0.36 + 0.00056 T) W/m·K. The
19
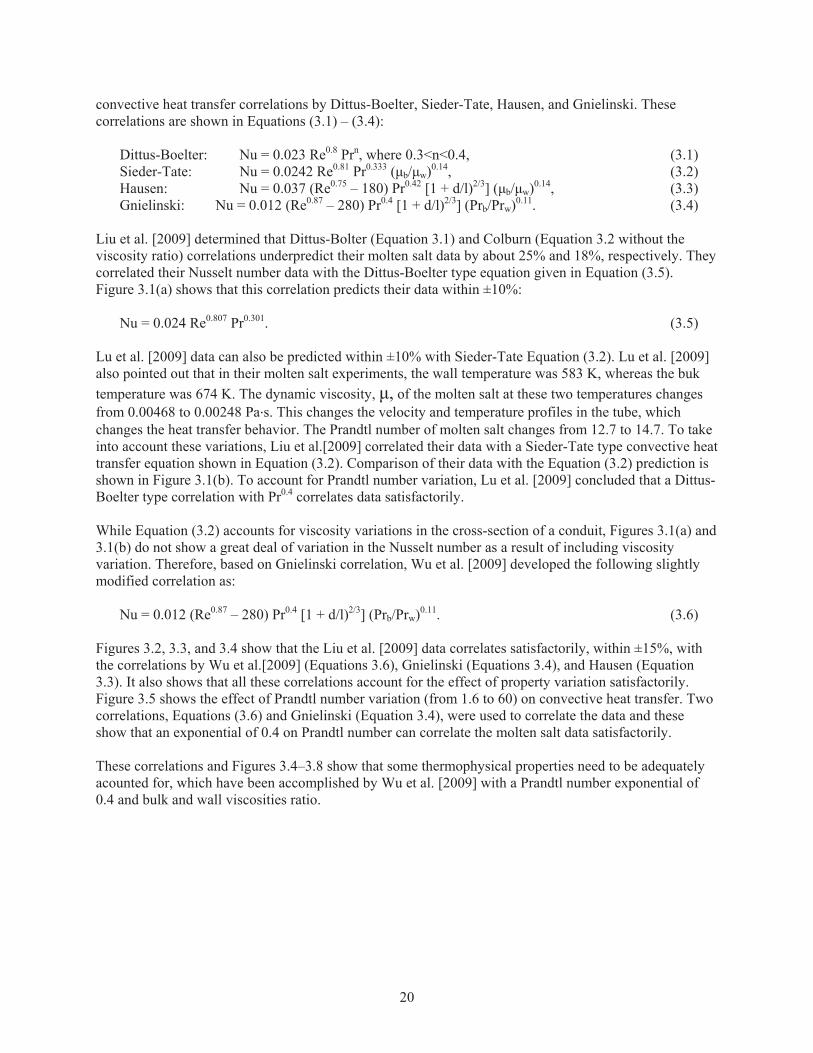
correlation of (0.36 + 0.00056 T) W/m·K was given by Smirnov et al. [1987]. The value of the thermal conductivity found experimentally by Smirnov et al. [1987] gave actual values of 0.81 to 0.93 W/m K over the temperature range of ~808–1024 K. The analysis of the experimental data using either Smirnov et al.’s [1987] correlation for thermal conductivity, or the value of 1.0 W/m K that shows that the experimental convective heat transfer data overpredict the Dittus-Boelter correlation by ~15% for the Reynolds numbers range of ~10,000 to 100,000. This comparison is shown in Figure 3.3.
Figure 3.2. Comparison of FLiNaK convective heat transfer experimental data of Grele and Gdeon [1954] and Hoffman and Lones [1955] with Dittus-Boelter correlation, Ambrosek et al. [2009].
Figure 3.3. FLiNaK experimental data of Hoffman and Lones [1955], Grele and Gedeon [1954], and Vriesema [1979] in Inconel-based tubes were reanalyzed using the thermal conductivity measured by Smirnov et al. [1987].
Liu et al. [2009] performed experiments with molten salt (LiNO3) in the Reynolds number range of 19,800 to 46,000. The Prandtl number of LiNO3 is in the range 12.7 – 14.7. They used the well known
20
convective heat transfer correlations by Dittus-Boelter, Sieder-Tate, Hausen, and Gnielinski. These correlations are shown in Equations (3.1) – (3.4):
Dittus-Boelter: Nu = 0.023 Re0.8 Prn, where 0.3<n<0.4, (3.1) Sieder-Tate: Nu = 0.0242 Re0.81 Pr0.333 ( b/ w)0.14, (3.2) Hausen: Nu = 0.037 (Re0.75 – 180) Pr0.42 [1 + d/l)2/3] ( b/ w)0.14, (3.3) Gnielinski: Nu = 0.012 (Re0.87 – 280) Pr0.4 [1 + d/l)2/3] (Prb/Prw)0.11. (3.4)
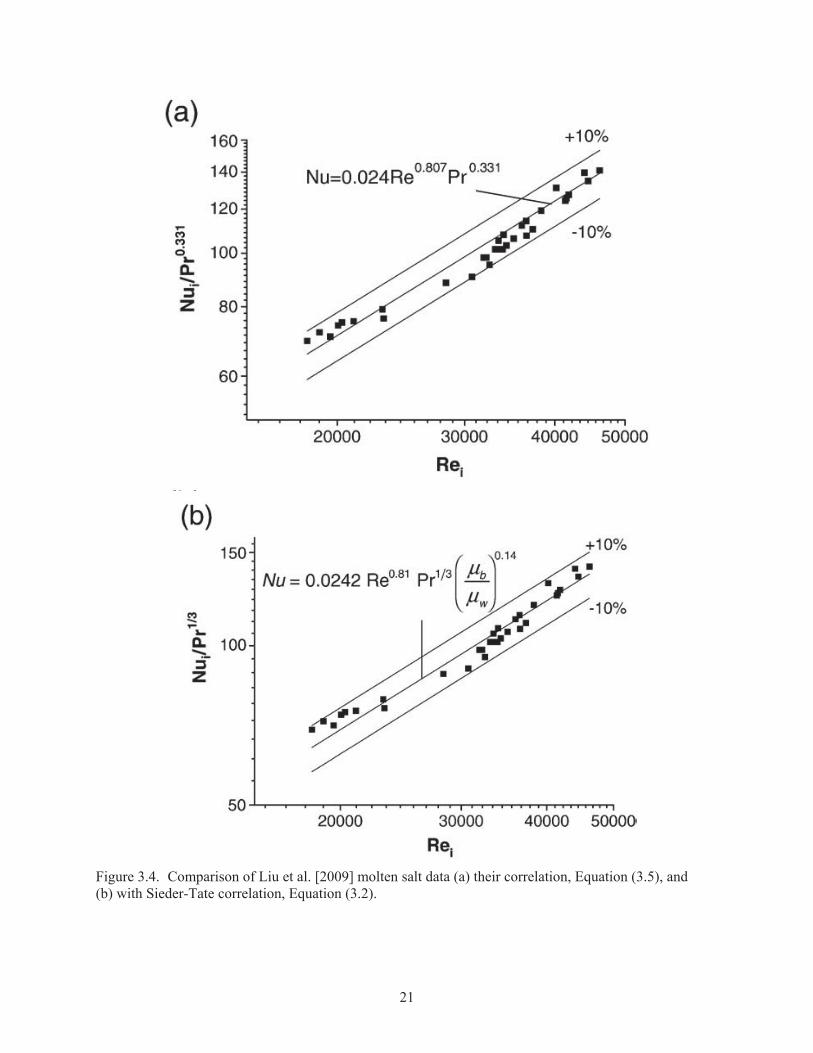
Liu et al. [2009] determined that Dittus-Bolter (Equation 3.1) and Colburn (Equation 3.2 without the viscosity ratio) correlations underpredict their molten salt data by about 25% and 18%, respectively. They correlated their Nusselt number data with the Dittus-Boelter type equation given in Equation (3.5). Figure 3.1(a) shows that this correlation predicts their data within ±10%:
Nu = 0.024 Re0.807 Pr0.301. (3.5)
Lu et al. [2009] data can also be predicted within ±10% with Sieder-Tate Equation (3.2). Lu et al. [2009] also pointed out that in their molten salt experiments, the wall temperature was 583 K, whereas the buk temperature was 674 K. The dynamic viscosity, , of the molten salt at these two temperatures changes from 0.00468 to 0.00248 Pa s. This changes the velocity and temperature profiles in the tube, which changes the heat transfer behavior. The Prandtl number of molten salt changes from 12.7 to 14.7. To take into account these variations, Liu et al.[2009] correlated their data with a Sieder-Tate type convective heat transfer equation shown in Equation (3.2). Comparison of their data with the Equation (3.2) prediction is shown in Figure 3.1(b). To account for Prandtl number variation, Lu et al. [2009] concluded that a Dittus-Boelter type correlation with Pr0.4 correlates data satisfactorily. While Equation (3.2) accounts for viscosity variations in the cross-section of a conduit, Figures 3.1(a) and 3.1(b) do not show a great deal of variation in the Nusselt number as a result of including viscosity variation. Therefore, based on Gnielinski correlation, Wu et al. [2009] developed the following slightly modified correlation as:
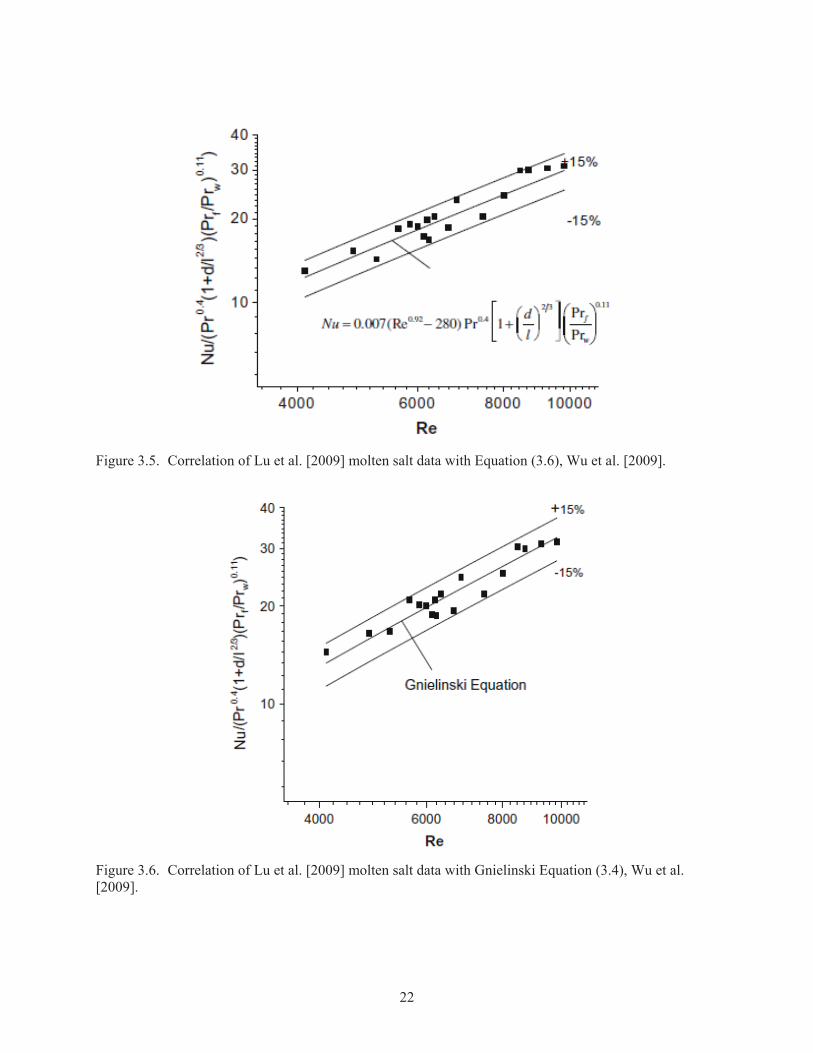
Nu = 0.012 (Re0.87 – 280) Pr0.4 [1 + d/l)2/3] (Prb/Prw)0.11. (3.6)
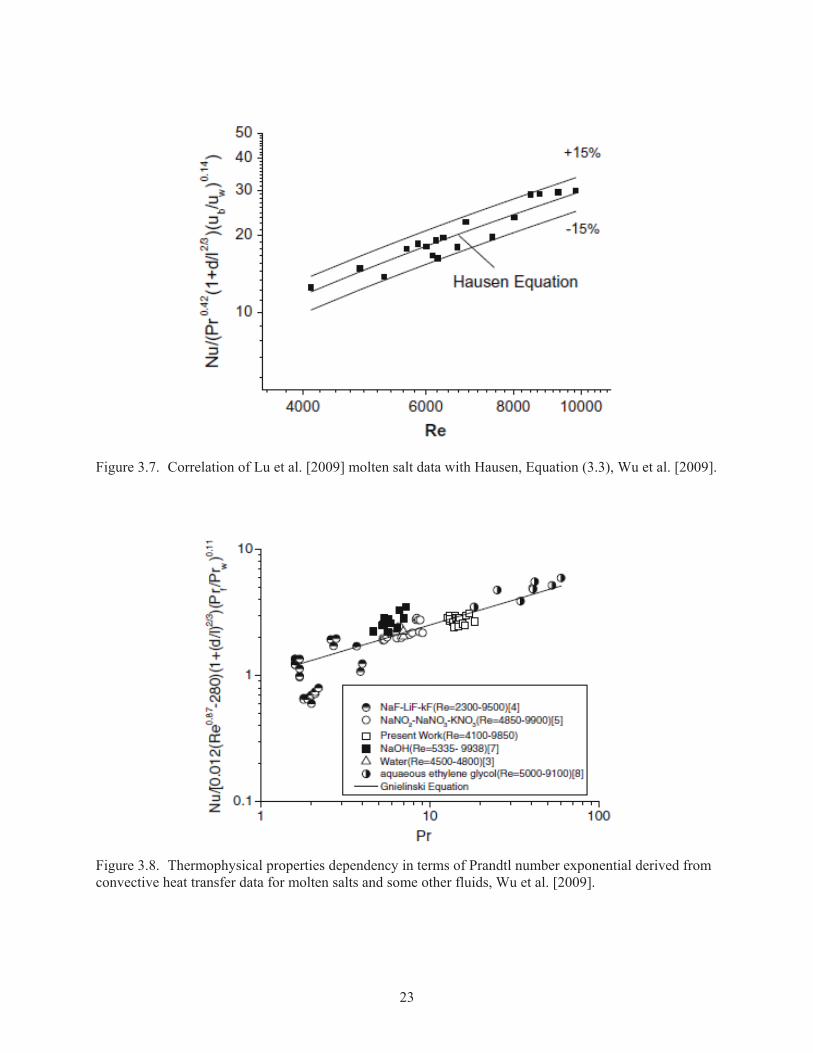
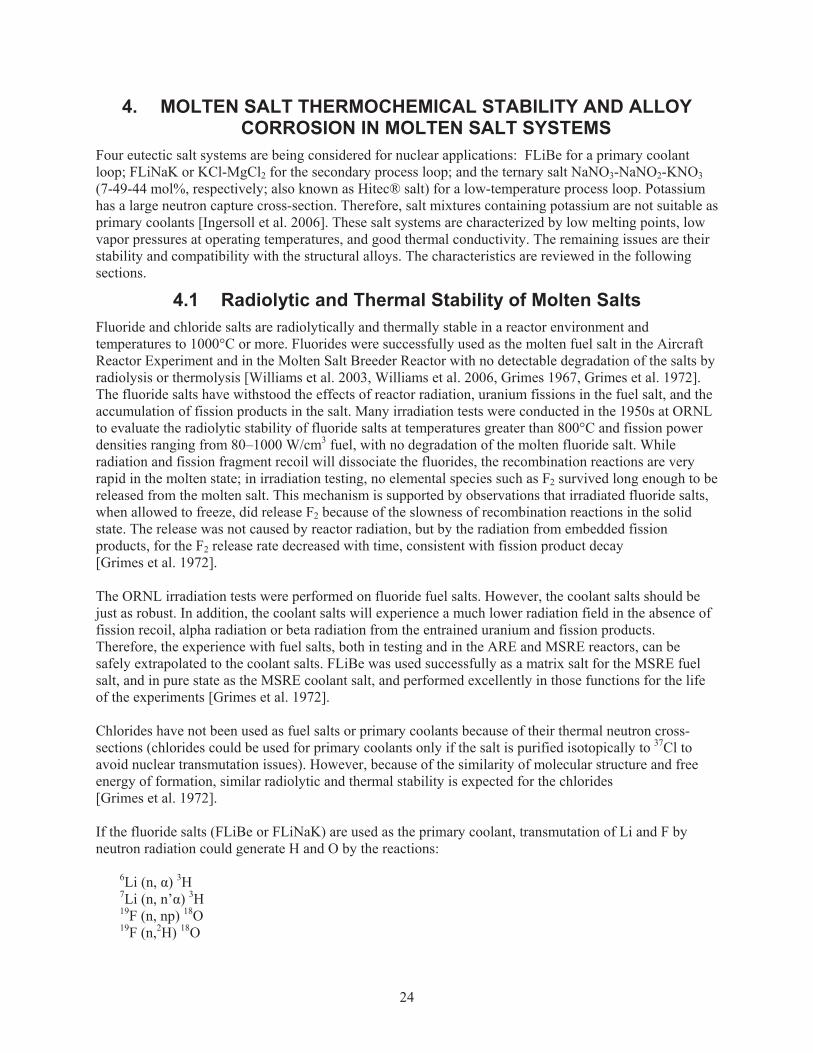
Figures 3.2, 3.3, and 3.4 show that the Liu et al. [2009] data correlates satisfactorily, within ±15%, with the correlations by Wu et al.[2009] (Equations 3.6), Gnielinski (Equations 3.4), and Hausen (Equation 3.3). It also shows that all these correlations account for the effect of property variation satisfactorily. Figure 3.5 shows the effect of Prandtl number variation (from 1.6 to 60) on convective heat transfer. Two correlations, Equations (3.6) and Gnielinski (Equation 3.4), were used to correlate the data and these show that an exponential of 0.4 on Prandtl number can correlate the molten salt data satisfactorily. These correlations and Figures 3.4–3.8 show that some thermophysical properties need to be adequately acounted for, which have been accomplished by Wu et al. [2009] with a Prandtl number exponential of 0.4 and bulk and wall viscosities ratio.
21
Figure 3.4. Comparison of Liu et al. [2009] molten salt data (a) their correlation, Equation (3.5), and (b) with Sieder-Tate correlation, Equation (3.2).
22
Figure 3.5. Correlation of Lu et al. [2009] molten salt data with Equation (3.6), Wu et al. [2009].
Figure 3.6. Correlation of Lu et al. [2009] molten salt data with Gnielinski Equation (3.4), Wu et al. [2009].
23
Figure 3.7. Correlation of Lu et al. [2009] molten salt data with Hausen, Equation (3.3), Wu et al. [2009].
Figure 3.8. Thermophysical properties dependency in terms of Prandtl number exponential derived from convective heat transfer data for molten salts and some other fluids, Wu et al. [2009].
24
4. MOLTEN SALT THERMOCHEMICAL STABILITY AND ALLOY CORROSION IN MOLTEN SALT SYSTEMS
Four eutectic salt systems are being considered for nuclear applications: FLiBe for a primary coolant loop; FLiNaK or KCl-MgCl2 for the secondary process loop; and the ternary salt NaNO3-NaNO2-KNO3 (7-49-44 mol%, respectively; also known as Hitec® salt) for a low-temperature process loop. Potassium has a large neutron capture cross-section. Therefore, salt mixtures containing potassium are not suitable as primary coolants [Ingersoll et al. 2006]. These salt systems are characterized by low melting points, low vapor pressures at operating temperatures, and good thermal conductivity. The remaining issues are their stability and compatibility with the structural alloys. The characteristics are reviewed in the following sections.
4.1 Radiolytic and Thermal Stability of Molten Salts Fluoride and chloride salts are radiolytically and thermally stable in a reactor environment and temperatures to 1000°C or more. Fluorides were successfully used as the molten fuel salt in the Aircraft Reactor Experiment and in the Molten Salt Breeder Reactor with no detectable degradation of the salts by radiolysis or thermolysis [Williams et al. 2003, Williams et al. 2006, Grimes 1967, Grimes et al. 1972]. The fluoride salts have withstood the effects of reactor radiation, uranium fissions in the fuel salt, and the accumulation of fission products in the salt. Many irradiation tests were conducted in the 1950s at ORNL to evaluate the radiolytic stability of fluoride salts at temperatures greater than 800°C and fission power densities ranging from 80–1000 W/cm3 fuel, with no degradation of the molten fluoride salt. While radiation and fission fragment recoil will dissociate the fluorides, the recombination reactions are very rapid in the molten state; in irradiation testing, no elemental species such as F2 survived long enough to be released from the molten salt. This mechanism is supported by observations that irradiated fluoride salts, when allowed to freeze, did release F2 because of the slowness of recombination reactions in the solid state. The release was not caused by reactor radiation, but by the radiation from embedded fission products, for the F2 release rate decreased with time, consistent with fission product decay [Grimes et al. 1972]. The ORNL irradiation tests were performed on fluoride fuel salts. However, the coolant salts should be just as robust. In addition, the coolant salts will experience a much lower radiation field in the absence of fission recoil, alpha radiation or beta radiation from the entrained uranium and fission products. Therefore, the experience with fuel salts, both in testing and in the ARE and MSRE reactors, can be safely extrapolated to the coolant salts. FLiBe was used successfully as a matrix salt for the MSRE fuel salt, and in pure state as the MSRE coolant salt, and performed excellently in those functions for the life of the experiments [Grimes et al. 1972]. Chlorides have not been used as fuel salts or primary coolants because of their thermal neutron cross-sections (chlorides could be used for primary coolants only if the salt is purified isotopically to 37Cl to avoid nuclear transmutation issues). However, because of the similarity of molecular structure and free energy of formation, similar radiolytic and thermal stability is expected for the chlorides [Grimes et al. 1972]. If the fluoride salts (FLiBe or FLiNaK) are used as the primary coolant, transmutation of Li and F by neutron radiation could generate H and O by the reactions: 6Li (n, ) 3H 7Li (n, n’ ) 3H 19F (n, np) 18O 19F (n,2H) 18O
25
19F (n, 3H) 17O 19F (n, n3H) 16O 9Be ( n, 2n ) 9Be ( n, 2n) 8Be 2 These transmutations could gradually produce O2, H2O, and HF from the salt, thereby increasing the fluoride potential (i.e., oxidation potential) of the salt [Terai et al. 2001, Yamanishi et al. 1998, Calderoni et al. 2009]. The radiolytic stability of nitrate-nitrite salts, such as the Hitec mixture, is not as well defined. Nitrates may be radiolytically stable enough in a reactor environment, but have not been tested because of the thermal instability of the salts at primary coolant temperatures [Grimes et al. 1972]. Breon et al. [1980] irradiated Hitec salt with Co-60 gamma radiation to a total dose of 8x10⁸ R with no detectable deterioration of the salt. NaNO3-KNO3 mixture (Draw Temp 430ºC, 50 wt%-50%, respectively) performed similarly [Breon et al. 1980]. The radiation stability may be a moot issue for Hitec salt because of the inherent thermal instability of the mixture at primary coolant temperatures. Hitec heat transfer salt is thermally stable up to 454°C; the maximum recommended operating temperature is only 538°C, although the salt has been used for short times at temperatures above 550°C. The nitrate components of the Hitec mixture are thermally unstable, decomposing to the nitrite and oxygen by the reaction [Carling and Bradshaw 1986, DeVan and Tortorelli 1980]: MNO3 MNO2 + ½ O2 (4.1) where M is Na, K, or Li. The characteristic decomposition temperatures are about 600°C in air [Carling and Bradshaw 1986]. However, above 454°C under inert gas, the nitrite in the Hitec salt begins to decompose to the nitrate and oxide by several routes, depending on specific conditions of temperature and impurities [Coastal 2009, Singh et al. 1985, Carling and Bradshaw 1986, Keiser et al.1979]: 5MNO2 3 MNO3 + M2O + N2, (4.2) 2MNO2 M2O + NO2 + NO, (4.3) 2MNO2 M2O + 3/2 O2 + N2. (4.4) Above 800°C, the reaction is so rapid that the molten salt appears to boil due to the evolution of N2 and NOx (Coastal 2009). The ultimate products of the decomposition process are the peroxides and super-oxides, both potent oxidizers, which are formed by the reaction of nitrate and oxides produced by nitrite decomposition [Singh 2002, Singh et al. 1985, Brashaw and Siegel 2008, Heine et al. 1982]: M2O + MNO3
M2O2 + MNO2. (4.5) M2O2 + 2MNO3 2MO2 + 2MNO2. (4.6) The effect of these decomposition reactions is important, for metal per- and super-oxides tend to be quite corrosive at high temperatures. When molten Hitec salt is exposed to air, the nitrite is slowly oxidized to nitrate by oxygen [Coastal 2009, Bradshaw and Siegel 2008]: 2NaNO2 + O2 2NaNO3. (4.7)
26
The equilibrium nitrite salt concentration in the above reaction is less than 1 wt% for temperatures less than 600°C. Therefore, Hitec salt must be protected from air exposure to prevent the oxidation of the nitrite to nitrate, the reverse of the nitrate decomposition reaction [Bradshaw and Siegel 2008]. Finally, Hitec salt is chemically unstable if exposed to ambient air for prolonged periods. Hitec salt can absorb carbon dioxide from ambient air forming the corresponding carbonates which precipitate from the salt. Furthermore, Hitec also absorbs moisture from air, which can slowly hydrolyze the salt and form alkali hydroxides [Carling and Bradshaw 1986, Bradshaw and Siegel 2008]. As with the thermal decomposition reactions, the reactions with CO2 and H2O will gradually change the salt composition to the oxides and carbonates, increase the melting temperature, increase the corrosion potential, and change the thermal characteristics of the salt mixture.
4.2 Corrosion Mechanisms Corrosion of metals is an electrochemical reaction that involves oxidation of the less noble anodic material and reduction of the more noble cathodic material in an oxidation-reduction (redox) couple. For metals exposed to air, water, or acids, the process generally results in the formation of oxides or salts. Corrosion of some metals or alloys in air or water can form adherent oxide layers that progressively retard the diffusion of oxidant to the reaction interface at the alloy surface, and thereby protect or ‘passivate’ the alloy surface. Such alloys generally contain significant levels of chromium, aluminum, or several other elements that form adherent oxides (such as Cr2O3 or Al2O3). Compatibility of molten salts with structural metals centers on the potential for oxidation of the structural metal to the corresponding fluorides or chlorides. Pre-existing protective oxide layers might not protect the alloy from further molten salt corrosion. Unlike corrosion in air or water, corrosion in fluoride molten salts results in the destruction of passivating oxide layers on metals, and the dissolution of the salts formed by the process. In contrast, protective oxide layers tend to be stable in chloride and in nitrate/nitirite molten salts. Molten salts are ionic and form electrically conducting fluids in the molten state. They are good solvents for metal salts, and can support corrosion, an electrochemical process. In general, the laws of electrochemistry and mechanisms of corrosion are comparable for aqueous solutions and molten salts. Consequently, the corrosion mechanisms that are commonly seen in aqueous environments, including uniform surface corrosion, pitting corrosion, crevice corrosion, and intergranular corrosion, are also pertinent to molten salts [Lovering and Gale 1983, Heine et al. 1982, Kane 2003]. The molten salt literature has identified several corrosion mechanisms, including:
Intrinsic Corrosion: The intrinsic corrosion mechanism is driven by the difference in free energy of formation between the salt constituents and the most susceptible transition metal corrosion product (the more negative the free energy of reaction, the more likely is the reaction). As discussed in the following sections, this mechanism pertains to nitrate/nitrite molten salts, which are oxidizing media, and form oxides on most transition metal alloys. For fluorides and chlorides, the salt constituents have much lower free energy of formation and are intrinsically more stable than the corresponding transition metal salts, so that reaction is unlikely.
Corrosion by Oxidizing Contaminants: Some oxidizing contaminants in the molten salts, such as HF, HCl, H2O, residual oxides of metals, or easily reducible ions, especially some polyvalent metal ions can also cause corrosion. In this case, corrosion of alloy components is possible because the free energy of formation of contaminants such as HF, HCl, and H2O is comparable to or more positive than those of the transition metal corrosion products. However, with purified salts in a closed system, this mechanism may be short-lived, limited, and insignificant compared to persistent, continuous corrosion mechanisms. The corrosion kinetics for low-level
27
contaminants is expected to be very slow, and once the low-level contaminants are consumed by the reaction, corrosion ceases.
Differential Solubility: Differential solubility due to thermal gradients in the molten salt system, with formation of a metal ion concentration cell can also drive corrosion. Because the saturation solubility of transition metal halides in the molten salts is a strong function of temperature, a temperature gradient in the molten salt can form a concentration gradient of dissolved metals, and consequently an electromotive potential difference between the hot leg and cold leg in the molten salt. This means that the electrochemical potential at the hot leg of the gradient will oxidize and dissolve alloy components, and redeposit them at the more cathodic cold leg.
Galvanic Corrosion: The metals or materials with differing electromotive potentials are maintained in electrical contact by the molten salt, driving the oxidation of the anodic material. The mechanism is sensitive to physical factors, such as anode to cathode area ratio. If the anodic material has small surface area relative to the cathode, corrosion at the anode will be much more aggressive than for the converse configuration.
These mechanisms are discussed further by salt type in the following sections.
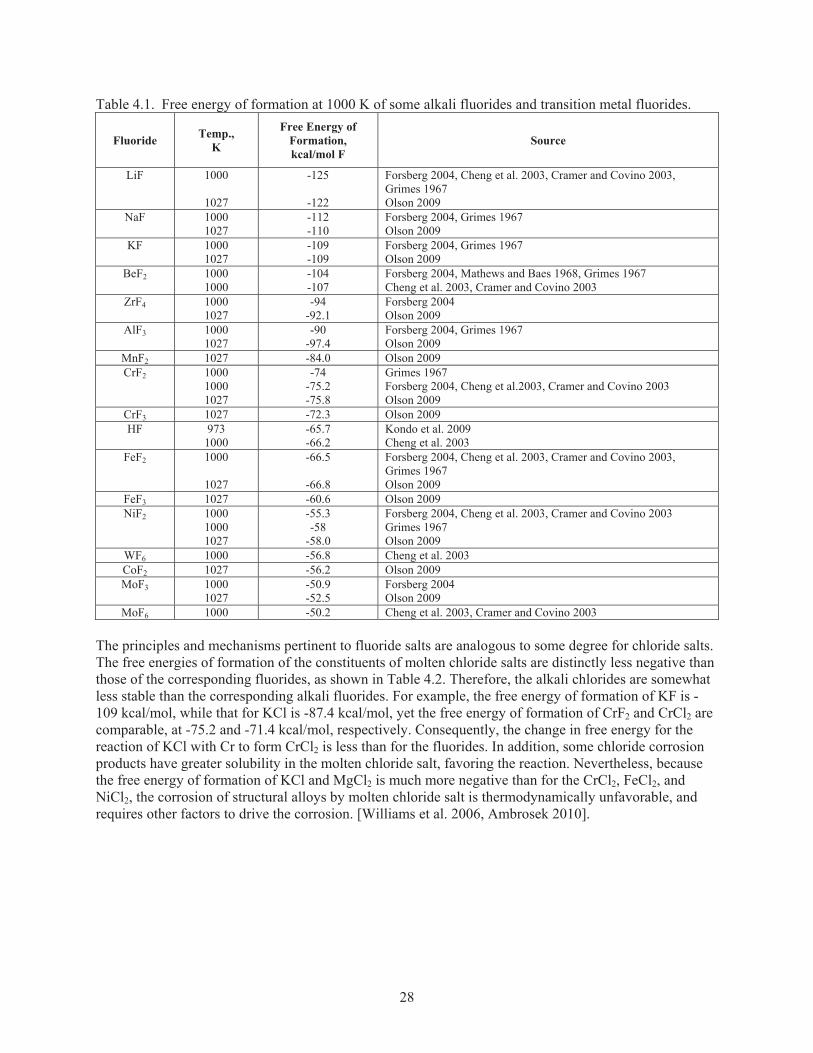
4.2.1 Fluoride and Chloride Salts In most corrosion and oxidation processes, alloys derive their resistance to corrosion from thin but dense, adherent protective oxide layers that passivate the surface. These generally are chromium, aluminum or silicon oxide, which limit the diffusion of oxidants to the reactive surface. Molten fluorides are excellent fluxes and will convert the metal oxide to the corresponding fluorides, which often are soluble in the molten salt [Kane 2003, Lovering and Gale 1983]. The process removes the passivating film, and exposes the surface to corrosion that is driven by the thermodynamic dissolution of chemically active components of the alloy. Once the protective oxide is destroyed, further corrosion generally proceeds by attack of the least noble metal constituent in structural alloys, which generally is Cr, forming the corresponding fluoride [Keiser 1977, Williams et al. 2006, Olson 2009, Olson et al. 2009]. In molten halides, corrosion can be minimized if thermodynamic equilibrium can be established between the alloy and the molten salt, such that the free energy of formation of the halides of the exposed alloy constituents is comparable or less than the free energy of formation of the molten salt, or that the solubility of the product halide in the salt is low [Ingersoll et al. 2006, Grimes et al. 1972, Williams et al. 2006, Cramer and Covino 2003, Nishimura et al. 2001]. Corrosion by the Molten Salt: The relative stability of fluoride compounds correlates approximately with the free energy of formation per mole fluoride, with thermodynamic stability increasing with decreasing (more negative) free energy. The free energies of formation of the fluoride constituents of the molten salt are more negative than -100 kcal/mol F while those of the common transition metals range between -50 to -100 kcal/mol F as shown in Table 4.1. Because of their negative free energy, alkali and alkaline earth fluorides are some of the weakest oxidizers of metals [Ozeryanaya 1985]. The components of the molten salts FLiBe and FLiNaK are much more thermodynamically stable than the fluorides of the transition metals that comprise containment alloys; of the transition metal components, only chromium would be susceptible to reaction. There is no appreciable thermodynamic driver for corrosion of the alloys by molten fluorides to any significant extent. Therefore, pure molten fluoride salts will not react with the components of containment alloys [Grimes 1967, Sridharan et al. 2008, Olson 2009, Haubenreich and Engel 1970, Kondo et al. 2009a, Kondo et al. 2009b, Petti et al. 2006, Baes 1974].
28
Table 4.1. Free energy of formation at 1000 K of some alkali fluorides and transition metal fluorides.
Fluoride Temp., K
Free Energy of Formation, kcal/mol F
Source
LiF 1000
1027
-125
-122
Forsberg 2004, Cheng et al. 2003, Cramer and Covino 2003, Grimes 1967 Olson 2009
NaF 1000 1027
-112 -110
Forsberg 2004, Grimes 1967 Olson 2009
KF 1000 1027
-109 -109
Forsberg 2004, Grimes 1967 Olson 2009
BeF2 1000 1000
-104 -107
Forsberg 2004, Mathews and Baes 1968, Grimes 1967 Cheng et al. 2003, Cramer and Covino 2003
ZrF4 1000 1027
-94 -92.1
Forsberg 2004 Olson 2009
AlF3 1000 1027
-90 -97.4
Forsberg 2004, Grimes 1967 Olson 2009
MnF2 1027 -84.0 Olson 2009 CrF2 1000
1000 1027
-74 -75.2 -75.8
Grimes 1967 Forsberg 2004, Cheng et al.2003, Cramer and Covino 2003 Olson 2009
CrF3 1027 -72.3 Olson 2009 HF 973
1000 -65.7 -66.2
Kondo et al. 2009 Cheng et al. 2003
FeF2 1000
1027
-66.5
-66.8
Forsberg 2004, Cheng et al. 2003, Cramer and Covino 2003, Grimes 1967 Olson 2009
FeF3 1027 -60.6 Olson 2009
NiF2 1000 1000 1027
-55.3 -58
-58.0
Forsberg 2004, Cheng et al. 2003, Cramer and Covino 2003 Grimes 1967 Olson 2009
WF6 1000 -56.8 Cheng et al. 2003 CoF2 1027 -56.2 Olson 2009 MoF3 1000
1027 -50.9 -52.5
Forsberg 2004 Olson 2009
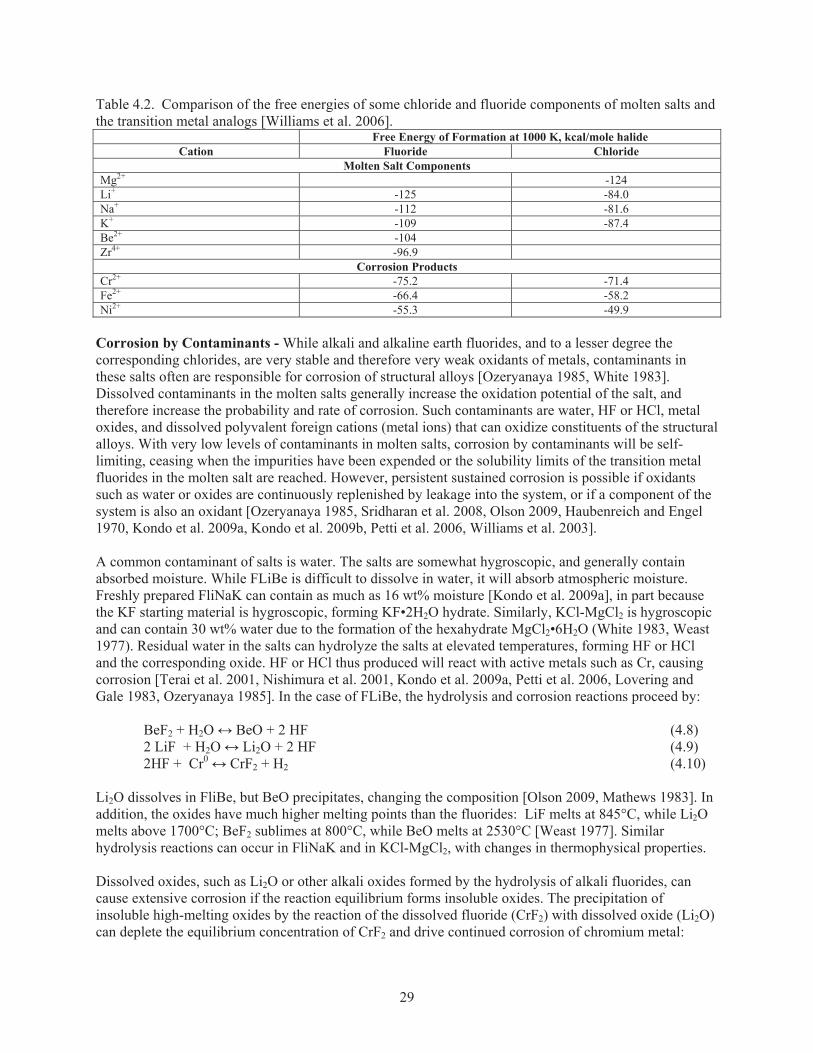
MoF6 1000 -50.2 Cheng et al. 2003, Cramer and Covino 2003 The principles and mechanisms pertinent to fluoride salts are analogous to some degree for chloride salts. The free energies of formation of the constituents of molten chloride salts are distinctly less negative than those of the corresponding fluorides, as shown in Table 4.2. Therefore, the alkali chlorides are somewhat less stable than the corresponding alkali fluorides. For example, the free energy of formation of KF is -109 kcal/mol, while that for KCl is -87.4 kcal/mol, yet the free energy of formation of CrF2 and CrCl2 are comparable, at -75.2 and -71.4 kcal/mol, respectively. Consequently, the change in free energy for the reaction of KCl with Cr to form CrCl2 is less than for the fluorides. In addition, some chloride corrosion products have greater solubility in the molten chloride salt, favoring the reaction. Nevertheless, because the free energy of formation of KCl and MgCl2 is much more negative than for the CrCl2, FeCl2, and NiCl2, the corrosion of structural alloys by molten chloride salt is thermodynamically unfavorable, and requires other factors to drive the corrosion. [Williams et al. 2006, Ambrosek 2010].
29
Table 4.2. Comparison of the free energies of some chloride and fluoride components of molten salts and the transition metal analogs [Williams et al. 2006].
Free Energy of Formation at 1000 K, kcal/mole halide Cation Fluoride Chloride
Molten Salt Components Mg2+ -124 Li+ -125 -84.0 Na+ -112 -81.6 K+ -109 -87.4 Be2+ -104 Zr4+ -96.9
Corrosion Products Cr2+ -75.2 -71.4 Fe2+ -66.4 -58.2 Ni2+ -55.3 -49.9
Corrosion by Contaminants - While alkali and alkaline earth fluorides, and to a lesser degree the corresponding chlorides, are very stable and therefore very weak oxidants of metals, contaminants in these salts often are responsible for corrosion of structural alloys [Ozeryanaya 1985, White 1983]. Dissolved contaminants in the molten salts generally increase the oxidation potential of the salt, and therefore increase the probability and rate of corrosion. Such contaminants are water, HF or HCl, metal oxides, and dissolved polyvalent foreign cations (metal ions) that can oxidize constituents of the structural alloys. With very low levels of contaminants in molten salts, corrosion by contaminants will be self-limiting, ceasing when the impurities have been expended or the solubility limits of the transition metal fluorides in the molten salt are reached. However, persistent sustained corrosion is possible if oxidants such as water or oxides are continuously replenished by leakage into the system, or if a component of the system is also an oxidant [Ozeryanaya 1985, Sridharan et al. 2008, Olson 2009, Haubenreich and Engel 1970, Kondo et al. 2009a, Kondo et al. 2009b, Petti et al. 2006, Williams et al. 2003]. A common contaminant of salts is water. The salts are somewhat hygroscopic, and generally contain absorbed moisture. While FLiBe is difficult to dissolve in water, it will absorb atmospheric moisture. Freshly prepared FliNaK can contain as much as 16 wt% moisture [Kondo et al. 2009a], in part because the KF starting material is hygroscopic, forming KF•2H2O hydrate. Similarly, KCl-MgCl2 is hygroscopic and can contain 30 wt% water due to the formation of the hexahydrate MgCl2•6H2O (White 1983, Weast 1977). Residual water in the salts can hydrolyze the salts at elevated temperatures, forming HF or HCl and the corresponding oxide. HF or HCl thus produced will react with active metals such as Cr, causing corrosion [Terai et al. 2001, Nishimura et al. 2001, Kondo et al. 2009a, Petti et al. 2006, Lovering and Gale 1983, Ozeryanaya 1985]. In the case of FLiBe, the hydrolysis and corrosion reactions proceed by: BeF2 + H2O BeO + 2 HF (4.8) 2 LiF + H2O Li2O + 2 HF (4.9) 2HF + Cr0 CrF2 + H2 (4.10) Li2O dissolves in FliBe, but BeO precipitates, changing the composition [Olson 2009, Mathews 1983]. In addition, the oxides have much higher melting points than the fluorides: LiF melts at 845°C, while Li2O melts above 1700°C; BeF2 sublimes at 800°C, while BeO melts at 2530°C [Weast 1977]. Similar hydrolysis reactions can occur in FliNaK and in KCl-MgCl2, with changes in thermophysical properties. Dissolved oxides, such as Li2O or other alkali oxides formed by the hydrolysis of alkali fluorides, can cause extensive corrosion if the reaction equilibrium forms insoluble oxides. The precipitation of insoluble high-melting oxides by the reaction of the dissolved fluoride (CrF2) with dissolved oxide (Li2O) can deplete the equilibrium concentration of CrF2 and drive continued corrosion of chromium metal:
30
2HF (d) + Cr0 CrF2 (d) + H2, (4.11) CrF2 (d) + Li2O (d) 2LiF (d) + CrO (s). (4.12) where d denotes the dissolved state, and s denotes the solid state. In general, the solubility of the oxides in the fluoride molten salt decreases with increasing ratio of the square of the ion charge to ion radius (z2/r). Therefore, while the alkali oxides have some solubility in the molten fluoride (and chloride) salts, the transition metals oxides are insoluble in the fluoride molten salts [Baes 1974, Williams, and Toth 2005]. Residual HF and HCl produced by the hydrolysis of molten salts corrode containment alloys by attacking and dissolving the most chemically active constituents in alloys, generally Cr and possibly Fe. Unlike reaction with alkali halides, reaction of Cr and to a lesser degree Fe with HF or HCl is favored thermodynamically, for the halide salts have a more negative free energy of formation than the HF or HCl (see Table 4.1), and are therefore more stable. Chromium, iron, and nickel are the most common metals in alloys, and of the three, Cr is most active and susceptible to attack by HF or HCl, while Fe and Ni are increasingly inert. The result of corrosion by HF is the selective dissolution and depletion of Cr metal and Cr carbides (e.g. Cr7C3) from the grain boundaries of the alloys by the reaction [Williams et al. 2006, Grimes et al. 1972, Keiser 1977, Williams et al. 2003, Kane 2003]: 2 HF + Cr CrF2 + H2. (4.13) The oxidation of Cr, Fe, and Ni by HF in the above reaction has equilibrium constants of 2 x 10⁵, 7.7, and 6x10⁻⁵ for Cr, Fe, and Ni, respectively, indicating that Cr is very susceptible to attack by residual HF, while Ni is noble (Baes). The chemical activity of the common alloy constituents, as ranked by the free energy of formation their fluorides, decreases in the order [Olson 2009]: Al > Zr > Ti > Mn > Cr > Nb > Fe > Co > Ni > Mo > W. Similarly, the activity of metals in chloride salt decreased in the order [Ambrosek 2010]: Cr > Fe > Co > Ni > Mo. Metal fluoride or chloride contaminants in the molten salt, such as NiF2 or FeF2, having a free energy of formation higher (more positive) than chromium fluoride can oxidize Cr metal by the reaction [Keiser 1977, Williams and Toth 2005]: NiF2 + Cr CrF2 + Ni. (4.14) High-valency cations of polyvalent transition metals, such as Fe3+and Cr3+, are potent oxidizers that can cause intense oxidation of metals, and can corrode their own base metal, as is the case with chromium. As indicated in Table 1, CrF3 has a slightly more positive free energy than CrF2. While only CrF2 is soluble in FLiBe, both CrF2 and CrF3 are soluble in FLiNaK. In FLiNaK, CrF3 contaminants in solution can corrode Cr metal by the reaction [Williams et al. 2006, Williams et al. 2003, Ingersoll et al. 2006]: 2Cr3+ + Cr0 3Cr2+. (4.15) Because FLiNaK can stabilize both valence states of the polyvalent cations in solution, FLiNaK is regarded as a more aggressive corrosion medium than FLiBe. Differential Solubility: The corrosion of soluble fluorides and chlorides may be limited by the saturation solubility of the transition metal ions in a static, isothermal salt. On the other hand, in a system with significant temperature gradients, differential solubility of corrosion products in the salt can drive
31
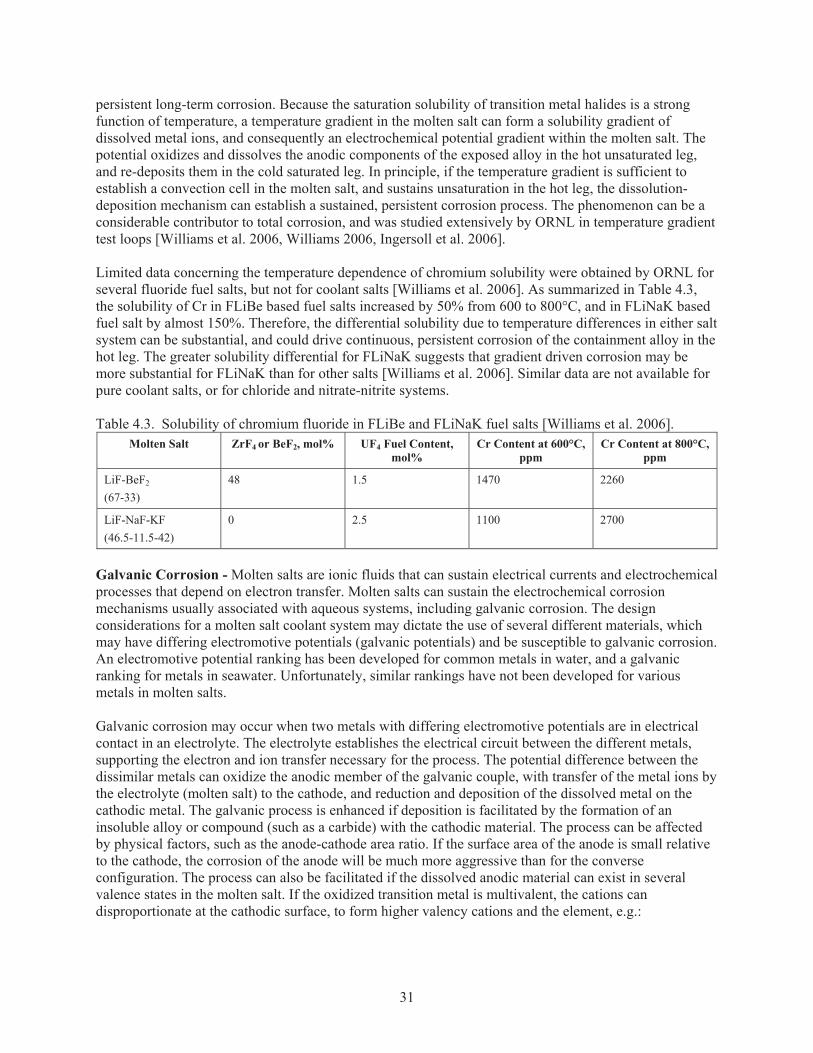
persistent long-term corrosion. Because the saturation solubility of transition metal halides is a strong function of temperature, a temperature gradient in the molten salt can form a solubility gradient of dissolved metal ions, and consequently an electrochemical potential gradient within the molten salt. The potential oxidizes and dissolves the anodic components of the exposed alloy in the hot unsaturated leg, and re-deposits them in the cold saturated leg. In principle, if the temperature gradient is sufficient to establish a convection cell in the molten salt, and sustains unsaturation in the hot leg, the dissolution-deposition mechanism can establish a sustained, persistent corrosion process. The phenomenon can be a considerable contributor to total corrosion, and was studied extensively by ORNL in temperature gradient test loops [Williams et al. 2006, Williams 2006, Ingersoll et al. 2006]. Limited data concerning the temperature dependence of chromium solubility were obtained by ORNL for several fluoride fuel salts, but not for coolant salts [Williams et al. 2006]. As summarized in Table 4.3, the solubility of Cr in FLiBe based fuel salts increased by 50% from 600 to 800°C, and in FLiNaK based fuel salt by almost 150%. Therefore, the differential solubility due to temperature differences in either salt system can be substantial, and could drive continuous, persistent corrosion of the containment alloy in the hot leg. The greater solubility differential for FLiNaK suggests that gradient driven corrosion may be more substantial for FLiNaK than for other salts [Williams et al. 2006]. Similar data are not available for pure coolant salts, or for chloride and nitrate-nitrite systems. Table 4.3. Solubility of chromium fluoride in FLiBe and FLiNaK fuel salts [Williams et al. 2006].
Molten Salt ZrF4 or BeF2, mol% UF4 Fuel Content,
mol% Cr Content at 600°C,
ppm Cr Content at 800°C,
ppm
LiF-BeF2 (67-33)
48 1.5 1470 2260
LiF-NaF-KF (46.5-11.5-42)
0 2.5 1100 2700
Galvanic Corrosion - Molten salts are ionic fluids that can sustain electrical currents and electrochemical processes that depend on electron transfer. Molten salts can sustain the electrochemical corrosion mechanisms usually associated with aqueous systems, including galvanic corrosion. The design considerations for a molten salt coolant system may dictate the use of several different materials, which may have differing electromotive potentials (galvanic potentials) and be susceptible to galvanic corrosion. An electromotive potential ranking has been developed for common metals in water, and a galvanic ranking for metals in seawater. Unfortunately, similar rankings have not been developed for various metals in molten salts. Galvanic corrosion may occur when two metals with differing electromotive potentials are in electrical contact in an electrolyte. The electrolyte establishes the electrical circuit between the different metals, supporting the electron and ion transfer necessary for the process. The potential difference between the dissimilar metals can oxidize the anodic member of the galvanic couple, with transfer of the metal ions by the electrolyte (molten salt) to the cathode, and reduction and deposition of the dissolved metal on the cathodic metal. The galvanic process is enhanced if deposition is facilitated by the formation of an insoluble alloy or compound (such as a carbide) with the cathodic material. The process can be affected by physical factors, such as the anode-cathode area ratio. If the surface area of the anode is small relative to the cathode, the corrosion of the anode will be much more aggressive than for the converse configuration. The process can also be facilitated if the dissolved anodic material can exist in several valence states in the molten salt. If the oxidized transition metal is multivalent, the cations can disproportionate at the cathodic surface, to form higher valency cations and the element, e.g.:
32
Oxidation at the anode: Cr0 Cr2+ +2e,- (4.16) Disproportionation at the cathode: 3Cr2+ + Mcathode 2Cr3+ + Cr0(M)alloy, (4.17) Oxidation at the anode: 2Cr3+ + Cr0 3Cr2+. (4.18) In this process, the disproportionation product, Cr3+, can augment the oxidation of the structural alloy and thereby accelerate corrosion. For example, the corrosion rate of a chromium-containing alloy can be accelerated more than 30 times by switching from an inert crucible to one comprised of a more reactive metal such as iron [Ozeryanaya1985]. The process has been observed in corrosion of Incoloy 800H in FLiNaK, in which the corrosion rate was greater by 20 times in a graphite crucible compared to an Incoloy 800H crucible [Olson 2009, Sridharan et al. 2008]. It was also observed in the corrosion of JLF-1 steel (see the appendix for composition) in crucibles made of JLF-1 and nickel, in which the nickel crucible caused a three-fold increase in corrosion rate over the JLF-1 crucible [Kondo et al. 2009a]. Galvanic corrosion can occur as a macroscopic and as a microscopic process. The galvanic effect is usually associated with macroscopic components of dissimilar metals in contact with an electrolyte such as a molten salt. However, the effect can also occur microscopically in material of nominally uniform composition. It is possible to have such an effect in welded areas in which the weld bead has a slightly higher content of the anodic material, or in which the heat affected zone is rendered more anodic at the microstructural level.
4.2.2 Nitrate-Nitrite Salts Ternary nitrate-nitrite salts, such as Hitec heat transfer salt, as well as ternary, binary, and single-component nitrate salts have long been used as high-temperature non-aqueous heat transfer media. These are generally regarded as oxidizing media. Evidence is growing that in Hitec salt and in pure nitrates, which inevitably contain nitrite as a thermal decomposition product, oxidation is dominated by the nitrite component. In salts with equal proportions of nitrate and nitrite, chromium compounds react largely with the nitrite. This suggests that in pure nitrate melts, the reactivity is governed by the nitrite that is in thermal equilibrium with the nitrate [Eweka and Kerridge 1996]. Exposure to molten nitrate-nitrite salts forms a protective complex oxide layer on metals. Initially, mild steel forms a thin adherent Fe2O3 layer on the surface, which is not very protective and can be conducive to pitting corrosion [Abdel-Hakim et al. 2002]. As oxidation progresses, the oxide layer transforms to a duplex or more complex structure, with an Fe2O3 outer layer in contact with the salt, and a protective Fe3O4 inner layer in contact with the metal [Abdel-Hakim et al. 2002, Baraka et al. 1976, Niiger et al. 1982]. Generally the duplex oxide layer is adherent, and the oxidation reaction follows a parabolic reaction rate law due to the growth of the oxide layer. The growing oxide layer increasingly retards diffusion of oxidant to the metal interface, and eventually becomes self-limiting [Baraka et al. 1976]. The chromium steel and nickel-chromium alloys form more complex corrosion products that are much more corrosion resistant than simple iron oxides. Upon exposure to molten nitrates, chromium steels form the mixed oxide (Cr,Fe)2O3, which is more protective than the simple iron oxide Fe3O4. Austenitic steels form a Ni(Cr,Fe)2O4 spinel type structure with high corrosion resistance [Niiger et al. 1982]. Incoloy 800 forms a multi-layer, highly protective oxide structure. The sequence of oxide layers from the metal interface to the salt interface is (Ni,Cr)N, (Cr,Fe)2O3, Fe(Fe,Cr)2O4, Fe3O4, and Fe2O3 [Carling and Bradshaw 1986].
33
4.3 Molten Salt Purification Methods The available data indicate that contaminants increase the oxidation potential of the molten salt and thereby can contribute to corrosion of structural alloys. To control the oxidation potential of fluoride and chloride coolant salts requires maintaining a high level of purity in the salts and protecting the molten salt from atmospheric contamination [Ingersoll et al. 2006]. Purification of fluoride and chloride salts generally requires the removal of water, oxides, HF, sulfates and sulfides, and foreign metal oxides and fluorides. Of these contaminants, water has received the most attention, for while FLiBe usually does not contain much water, FLiNaK and KCl-MgCl2 can contain a significant amount of water, up to 15 and 30 wt% water, respectively, due to the hygroscopic nature of their components [Kondo et al. 2009a, Weast 1977]. There are several physical and chemical methods for purification, and for best effect multiple methods should be used:
Controlled heating to vaporize water, although this may risk hydrolysis of the salt [White 1983]
Vacuum drying to 10-3 mm Hg pressure [White 1983]
Isopiestic chemical drying agents, such as P2O5 [White 1983]
Sparging the molten mixture with HF/H2 [Ingersoll et al. 2006, Williams et al.2006, Williams 2006, Olson 2009, Olander 2002]
Treatment with ammonium bifluoride, NH4F•HF [White 1983]
Addition of chemically active elements (alkali metals, Be, Zr), which are reducing agents, to control the redox potential by removing oxidizers such as HF and water [Ambrosek 2010, Williams et al. 2003, Ingersoll et al. 2006, Olson 2009, Petti et al. 2006, Olander 2002, Fukada et al. 2007, Yamanishi et al. 1998]
Physical filtration to remove solids [Grimes et al. 1972, Ingersoll et al. 2006, Williams et al. 2006].
Finally, to preserve the purity and physical properties of the melt, fluoride and chloride melts must be handled under a dry argon, helium or nitrogen gas environment (<1ppm H2O and O2), with provisions to strip residual oxygen and water vapor from the gas purge flow [Williams et al. 2003, White 1983]. Kondo et al. found that they could reduce the water content in the FLiNaK to less than 10 ppm with controlled heating at 300°C. By comparison, they could not reduce the moisture content in FLiBe below 180 ppm with the HF/H2 sparge (Kondo et al. 2009a) Nevertheless, sparging the molten fluorides with a stream of HF/H2 gas is widely considered to be a highly effective method of removal of a number of impurities in addition to residual water. The HF/H2 sparge converts the oxides in the melt to the corresponding fluorides, effectively reversing the water hydrolysis reaction of the fluoride salt mixture: 2 HF (g) + Li2O (d) 2 LiF (d) + H2O (g), (4.19) 2 HF (g) + BeO (s) BeF2 (d) + H2O (g). (4.20) The H2 flow is required to suppress corrosion of the containment alloy by HF during the sparging process [White 1983]. Nevertheless, the process is best performed in a carbon crucible at 600°C to minimize reactions with metals and contamination by transition metal fluorides [Sannier and Santarini 1983, Williams et al. 2003]. The process can reduce the oxide levels in molten FLiBe salt to approximately 60 ppm [Baes, Olson 2009]. At the same time, the HF/H2 flow physically purges the salt of its residual water and water produced by the hydrofluorination reactions. The HF/H2 sparge also reduces the sulfates to sulfides, which are purged from the salt as H2S, and removes chlorides as HCl. A separate H2 sparge reduces some of the transition metal fluorides to corresponding elements, which can be filtered from the
34
melt [Grimes et al. 1972]. The HF/H2 sparge can reduce the metal impurities to <200 ppm Fe, < 100 ppm Cu, < 20 ppm Ni, and < 20 ppm Cr, although levels as low as 70 ppm Fe and 5 ppm Cr have been reported [Mathews and Baes 1983, Kondo et al. 2009b, Kondo et al. 2009c]. Finally, the additions of an active metal, such as beryllium, to control the oxidation potential of the salt can reduce the HF level to less than 0.02 ppb [Petti et al. 2006, Simpson et al. 2006, Calderoni et al. 2009]. Another method is treatment with ammonium bifluoride. This treatment is chemically comparable to the HF/H2 sparge method, for the ammonium bifluoride thermally decomposes to release HF within the melt. This method requires H2 purge flow to disperse the HF gas within the melt, and to remove the byproducts water vapor and ammonia, and excess HF and NH4F [White 1983]. The sparging method used by ORNL for purification of FLiBe involved sparging with HF/H2 mixture to convert the oxides and sulfides to the fluorides; addition of metallic Be to scavenge HF and to reduce metallic impurities to their elemental state; sparging with H2 to remove elemental carbon and to reduce the transition metal fluorides (Cr, Fe, Ni) to the metals; sparging with He to remove remaining HF; and filtration though a sintered Ni filter to remove suspended solids [Grimes et al. 1972, Ingersoll et al. 2006, Williams et al. 2006]. In addition to the above methods, chloride salts have been purified by the following methods:
Dry argon gas sparge [Ambrosek 2010, Sridharan et al. 2008] Dry HCl or Cl2 sparge [Ambrosek 2010, Sridharan et al. 2008, White 1983] CCl4 sparge [Ambrosek 2010, Sridharan et al. 2008] Addition of NH4Cl [Ozeryanaya 1985] Addition of NH4Cl•HCl [White 1983].
Purification of chloride salts is more difficult than fluoride salts. Molten chloride salts are much more sensitive than fluorides to hydrolysis, so that vaporization by heating runs a high risk of degrading the chloride salt [White 1983, Ozeryanaya 1985]. Controlled vacuum drying, a dry inert gas sparge, or chemical drying are preferred to remove the bulk of the water [White 1983], although these methods are not as effective as for the fluorides. Purification of chloride salts by sparging with dry HCl is considerably less effective than HF sparging of fluoride salts, for displacement of oxygen from metal oxide impurities is much more difficult with HCl than with HF [Williams 2006]. This is corroborated by the purification tests of Sridharan et al., who found HCl sparging to be much less effective than reaction with CCl4 or active metals such as Mg metal [Ambrosek 2010, Sridharan et al.2008]. The addition of NH4Cl•HCl and NH4Cl at high temperature has also been reported, but because both decompose to release HCl in situ, they are probably no more effective than a HCl sparge [Ozeryanaya 1985]. In addition, because of the high solubility of HCl in the chloride salt, use of either ammonium chloride salt requires substantial inert gas sparging, vacuum pumping, or reaction with active metal such as potassium or magnesium metal to remove excess HCl, which is very reactive to structural alloys. For best effect, chloride purification requires a series of treatments, starting with low temperature vacuum drying of the salt, extended dry HCl sparge, followed by an inert gas sparge to remove excess HCl. The use of CCl4 treatment may be an effective alternative to the HCl sparge. The CCl4 is reported to reduce oxides to 3 ppm [Williams 2006]. Sridharan et al. [2008] found that the CCl4 treatment and Mg metal treatment to be most effective for maintaining minimum levels of dissolved Fe and Cr, with the Mg metal treatment slightly more effective [Ambrosek 2010, Sridharan et al. 2008]. Nitrates and nitrites are much less sensitive to hydrolysis and oxygen contamination than the fluorides and chlorides. In fact, water dissolved in nitrates does not hydrolyze the nitrates even at elevated
35
temperatures, and can be removed at temperatures up to 600°C with no evidence of hydrolysis [Carling and Bradshaw 1986]. Therefore, Hitec salt can be dehydrated by vacuum drying at 250°C for 10 hours, to a final pressure of 10-2 mm Hg. Alternatively, the molten nitrate-nitrite mixtures can be dehydrated slowly at 150 to 350°C under a dry nitrogen or argon purge to a final water content on the order of 200 ppm [Niiger et al. 1982, Bradshaw and Siegel 2008, Baraka et al. 1976]. Purification with active metals (such as Na or K) is not possible, causing reaction of the nitrate and nitrite components to corresponding oxides [Keiser et al. 1979].
4.4 Review of Molten Salt Corrosion Data 4.4.1 FLiNaK Based on thermodynamic principles, neither FLiBe nor FLiNaK can corrode to any significant degree the transition metal components of structural alloys. However, arguments have been made that FLiNaK is inherently more corrosive to structural metals than FLiBe, based on Lewis acid-base arguments [William et al. 2006, Ingersoll et al. 2006]. As is the case with FLiBe, the corrosion database for FLiNaK coolant salts is insufficient and needs further development for reliable selection of compatible alloys. The data for alloy corrosion by pure FLiNaK are limited. As part of the molten salt fuel development program, ORNL has tested FLiNaK coolant salts in thermal gradient loop systems to determine the long-term persistent corrosion by FLiNaK due to the differential solubility mechanism. In addition, recent work has begun to address the intrinsic reactivity of several alloys in FLiNaK, as well as the galvanic corrosion potential due to carbon and dissimilar metals in contact with the FLiNaK. The recent work employed static, isothermal test configurations. The objective of these tests was to screen the activity of various alloys in FLiNaK, presumably because of residual contaminants in the as-purified or as-received salts. None of the tests monitored the corrosion rate as a function of contaminant type or concentration [Kondo et al. 2009a, Olson 2009, Sridharan et al. 2008]. Kondo et al. have recently published results on the corrosion of JLF-1, a ferritic steel (see Appendix 1 for alloy composition), in FLiNaK [Kondo et al. 2009a]. Their corrosion tests were conducted at 600°C for 1000 hour durations, in a static isothermal configuration. Their tests were conducted in a JLF-1 crucible to avoid galvanic corrosion effects, and then in nickel and niobium crucibles to test for galvanic effects. The results are summarized in Table 4.4, which also gives the initial and final dissolved HF and Cr ion impurity contents of the tests. The intrinsic corrosion rate of JLF-1 in FLiNaK is 10 times greater than for FLiBe (see Table 4.4), despite the lower initial concentration of HF in the FLiNaK (< 10 ppm HF, compared to 180 ppm HF in FLiBe). Use of a Ni crucible induced a galvanic effect that increased the rate of corrosion three-fold, and decreased the dissolved Cr and Fe due to deposition on the Ni cathode. Use of a Nb crucible also induced a galvanic effect, but with dissolution of the more anodic Nb and deposition on the more cathodic JLF-1. In this test, the concentrations of dissolved Cr and Fe were minimal, at 11 and 27 ppm respectively, while dissolved Nb was 940 ppm. In the static isothermal conditions, contaminants in the molten salts, such as residual HF, H2O, and dissolved transition metal fluorides, are usually the cause of corrosion, and corrosion will cease when the contaminants are consumed. In these tests, however, the residual HF increased during the course of the tests. It is probable that the increased HF levels were caused by significant residual H2O levels in the FLiNaK, which were not controlled or monitored in the tests [Kondo et al. 2009a].
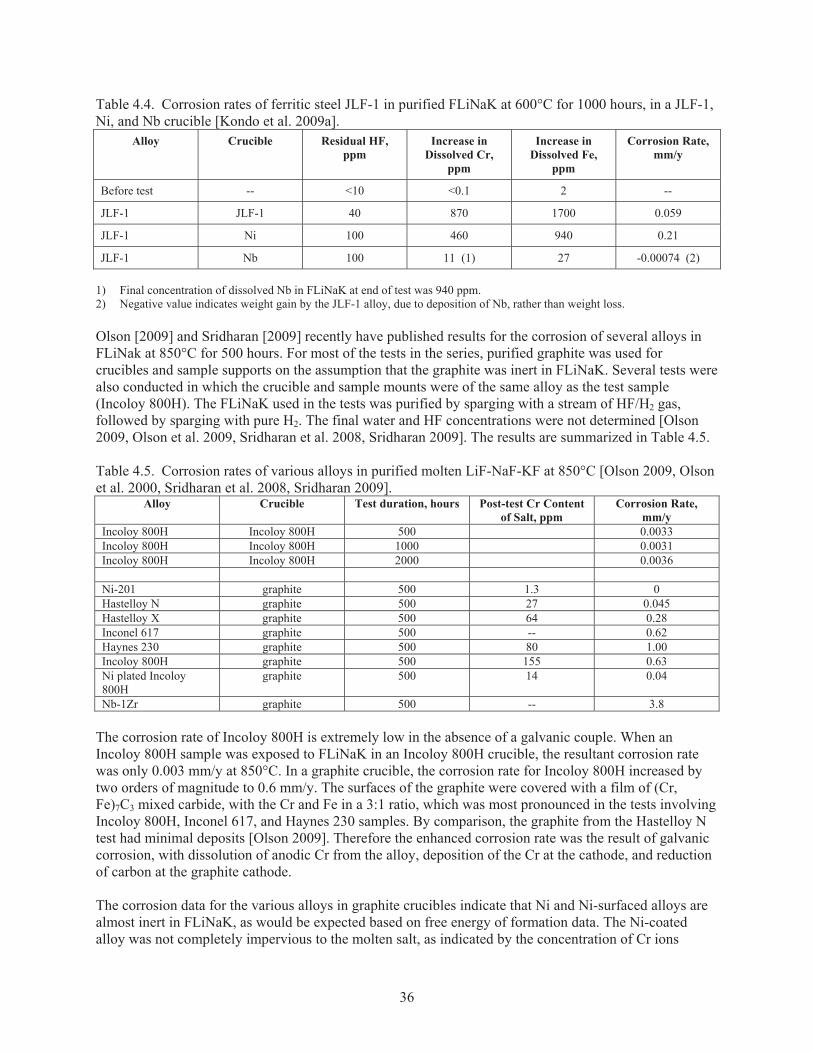
36
Table 4.4. Corrosion rates of ferritic steel JLF-1 in purified FLiNaK at 600°C for 1000 hours, in a JLF-1, Ni, and Nb crucible [Kondo et al. 2009a].
Alloy Crucible Residual HF, ppm
Increase in Dissolved Cr,
ppm
Increase in Dissolved Fe,
ppm
Corrosion Rate, mm/y
Before test -- <10 <0.1 2 --
JLF-1 JLF-1 40 870 1700 0.059
JLF-1 Ni 100 460 940 0.21
JLF-1 Nb 100 11 (1) 27 -0.00074 (2) 1) Final concentration of dissolved Nb in FLiNaK at end of test was 940 ppm. 2) Negative value indicates weight gain by the JLF-1 alloy, due to deposition of Nb, rather than weight loss. Olson [2009] and Sridharan [2009] recently have published results for the corrosion of several alloys in FLiNak at 850°C for 500 hours. For most of the tests in the series, purified graphite was used for crucibles and sample supports on the assumption that the graphite was inert in FLiNaK. Several tests were also conducted in which the crucible and sample mounts were of the same alloy as the test sample (Incoloy 800H). The FLiNaK used in the tests was purified by sparging with a stream of HF/H2 gas, followed by sparging with pure H2. The final water and HF concentrations were not determined [Olson 2009, Olson et al. 2009, Sridharan et al. 2008, Sridharan 2009]. The results are summarized in Table 4.5. Table 4.5. Corrosion rates of various alloys in purified molten LiF-NaF-KF at 850°C [Olson 2009, Olson et al. 2000, Sridharan et al. 2008, Sridharan 2009].
Alloy Crucible Test duration, hours Post-test Cr Content of Salt, ppm
Corrosion Rate, mm/y
Incoloy 800H Incoloy 800H 500 0.0033 Incoloy 800H Incoloy 800H 1000 0.0031 Incoloy 800H Incoloy 800H 2000 0.0036 Ni-201 graphite 500 1.3 0 Hastelloy N graphite 500 27 0.045 Hastelloy X graphite 500 64 0.28 Inconel 617 graphite 500 -- 0.62 Haynes 230 graphite 500 80 1.00 Incoloy 800H graphite 500 155 0.63 Ni plated Incoloy 800H
graphite 500 14 0.04
Nb-1Zr graphite 500 -- 3.8 The corrosion rate of Incoloy 800H is extremely low in the absence of a galvanic couple. When an Incoloy 800H sample was exposed to FLiNaK in an Incoloy 800H crucible, the resultant corrosion rate was only 0.003 mm/y at 850°C. In a graphite crucible, the corrosion rate for Incoloy 800H increased by two orders of magnitude to 0.6 mm/y. The surfaces of the graphite were covered with a film of (Cr, Fe)7C3 mixed carbide, with the Cr and Fe in a 3:1 ratio, which was most pronounced in the tests involving Incoloy 800H, Inconel 617, and Haynes 230 samples. By comparison, the graphite from the Hastelloy N test had minimal deposits [Olson 2009]. Therefore the enhanced corrosion rate was the result of galvanic corrosion, with dissolution of anodic Cr from the alloy, deposition of the Cr at the cathode, and reduction of carbon at the graphite cathode. The corrosion data for the various alloys in graphite crucibles indicate that Ni and Ni-surfaced alloys are almost inert in FLiNaK, as would be expected based on free energy of formation data. The Ni-coated alloy was not completely impervious to the molten salt, as indicated by the concentration of Cr ions
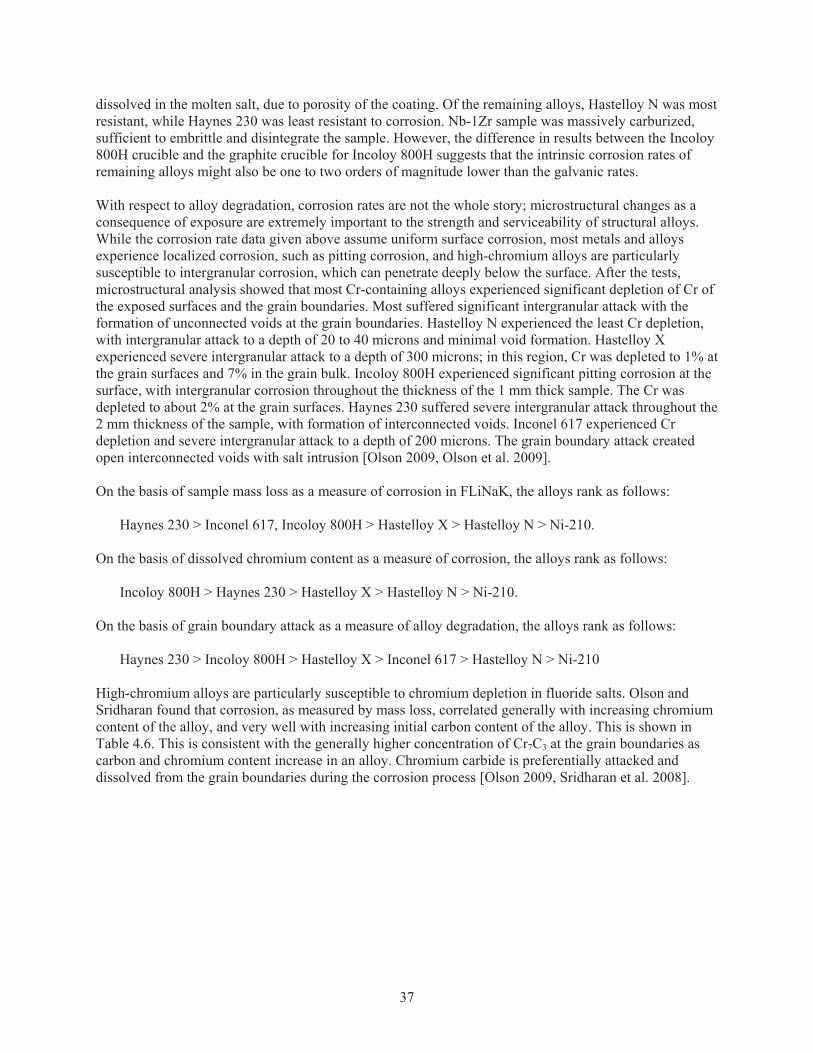
37
dissolved in the molten salt, due to porosity of the coating. Of the remaining alloys, Hastelloy N was most resistant, while Haynes 230 was least resistant to corrosion. Nb-1Zr sample was massively carburized, sufficient to embrittle and disintegrate the sample. However, the difference in results between the Incoloy 800H crucible and the graphite crucible for Incoloy 800H suggests that the intrinsic corrosion rates of remaining alloys might also be one to two orders of magnitude lower than the galvanic rates. With respect to alloy degradation, corrosion rates are not the whole story; microstructural changes as a consequence of exposure are extremely important to the strength and serviceability of structural alloys. While the corrosion rate data given above assume uniform surface corrosion, most metals and alloys experience localized corrosion, such as pitting corrosion, and high-chromium alloys are particularly susceptible to intergranular corrosion, which can penetrate deeply below the surface. After the tests, microstructural analysis showed that most Cr-containing alloys experienced significant depletion of Cr of the exposed surfaces and the grain boundaries. Most suffered significant intergranular attack with the formation of unconnected voids at the grain boundaries. Hastelloy N experienced the least Cr depletion, with intergranular attack to a depth of 20 to 40 microns and minimal void formation. Hastelloy X experienced severe intergranular attack to a depth of 300 microns; in this region, Cr was depleted to 1% at the grain surfaces and 7% in the grain bulk. Incoloy 800H experienced significant pitting corrosion at the surface, with intergranular corrosion throughout the thickness of the 1 mm thick sample. The Cr was depleted to about 2% at the grain surfaces. Haynes 230 suffered severe intergranular attack throughout the 2 mm thickness of the sample, with formation of interconnected voids. Inconel 617 experienced Cr depletion and severe intergranular attack to a depth of 200 microns. The grain boundary attack created open interconnected voids with salt intrusion [Olson 2009, Olson et al. 2009]. On the basis of sample mass loss as a measure of corrosion in FLiNaK, the alloys rank as follows: Haynes 230 > Inconel 617, Incoloy 800H > Hastelloy X > Hastelloy N > Ni-210. On the basis of dissolved chromium content as a measure of corrosion, the alloys rank as follows: Incoloy 800H > Haynes 230 > Hastelloy X > Hastelloy N > Ni-210. On the basis of grain boundary attack as a measure of alloy degradation, the alloys rank as follows: Haynes 230 > Incoloy 800H > Hastelloy X > Inconel 617 > Hastelloy N > Ni-210 High-chromium alloys are particularly susceptible to chromium depletion in fluoride salts. Olson and Sridharan found that corrosion, as measured by mass loss, correlated generally with increasing chromium content of the alloy, and very well with increasing initial carbon content of the alloy. This is shown in Table 4.6. This is consistent with the generally higher concentration of Cr7C3 at the grain boundaries as carbon and chromium content increase in an alloy. Chromium carbide is preferentially attacked and dissolved from the grain boundaries during the corrosion process [Olson 2009, Sridharan et al. 2008].
38
Table 4.6. Correlation of corrosion rates and dissolved chromium content in FLiNaK with carbon and chromium content of alloys [Olson 2009, Sridharan et al. 2008].
Alloy Carbon Content, wt%
Chromium Content, wt%
Corrosion Rate, mm/y
Cr in Salt, ppm
Hastelloy N 0.03 6.31 0.045 27
Hastelloy X 0.059 21.3 0.28 64
Incoloy 800H 0.069 20.4 0.63 155
Inconel 617 0.08 22.1 0.62 --
Haynes 230 0.1 22.5 1.0 80
The tests by Olson and Sridharan generated galvanic corrosion rates for various alloys in FLiNaK, in which the rates were dependent on the specific configuration of the tests. ORNL loop tests in the 1950s through 1970s generated corrosion data for Hastelloy N, Inconel 600, and stainless steel 316 in FliNaK, driven by the thermal gradient-differential solubility mechanism. In these tests, the loops were designed with a thermal gradient of 100-150°C, sufficient to support mass transport by thermal convection flow in the molten salt. The ORNL corrosion rate data for pure FLiNaK (without UF4, but with an imposed differential solubility mechanism) are summarized in Table 4.7 [Williams et al. 2006, Williams and Toth 2005, Sridharan et al. 2008]. Table 4.7. Summary of ORNL loop corrosion tests in pure FLiNaK with an imposed solubility gradient corrosion mechanism [Williams et al. 2006, Williams and Toth 2005, Sridharan et al. 2008].
Alloy Test Duration, h Maximum Temp,°C Corrosion Depth, mil Corrosion Rate, mm/y
SS 316 500 815 4 1.8
Hastelloy N 3048 815 0.1 0.007
Hastelloy N 8760 677 1 0.025
Hastelloy N 1340 677 0 <0.025
Hastelloy N 1000 607 0 <0.025
Inconel 600 1000 815 13 2.9
Inconel 600 500 815 7 3
Inconel 600 4673 677 13 0.62
Inconel 600 8760 649 8 0.2
Inconel 600 8735 649 8 0.2
Inconel 600 1000 607 1 0.2
The ORNL loop tests for pure FLiBe (Table 4.3) and FLiNaK (Table4.7) salts are too limited in number and temperature correspondence to permit confident comparisons of the corrosion rates of FLiBe and FLiNaK. However, based on the 650°C data for Hastelloy N in FLiBe and the 677°C data in FLiNaK, the two salts seem to support comparable corrosion rates. For Inconel 600, the data at 677°C indicate that FLiNaK may support corrosion rates about three times faster than FLiBe. As was the case in FLiBe, Hastelloy N has superior performance in FLiNaK compared to Inconel 600 or stainless steel 316.
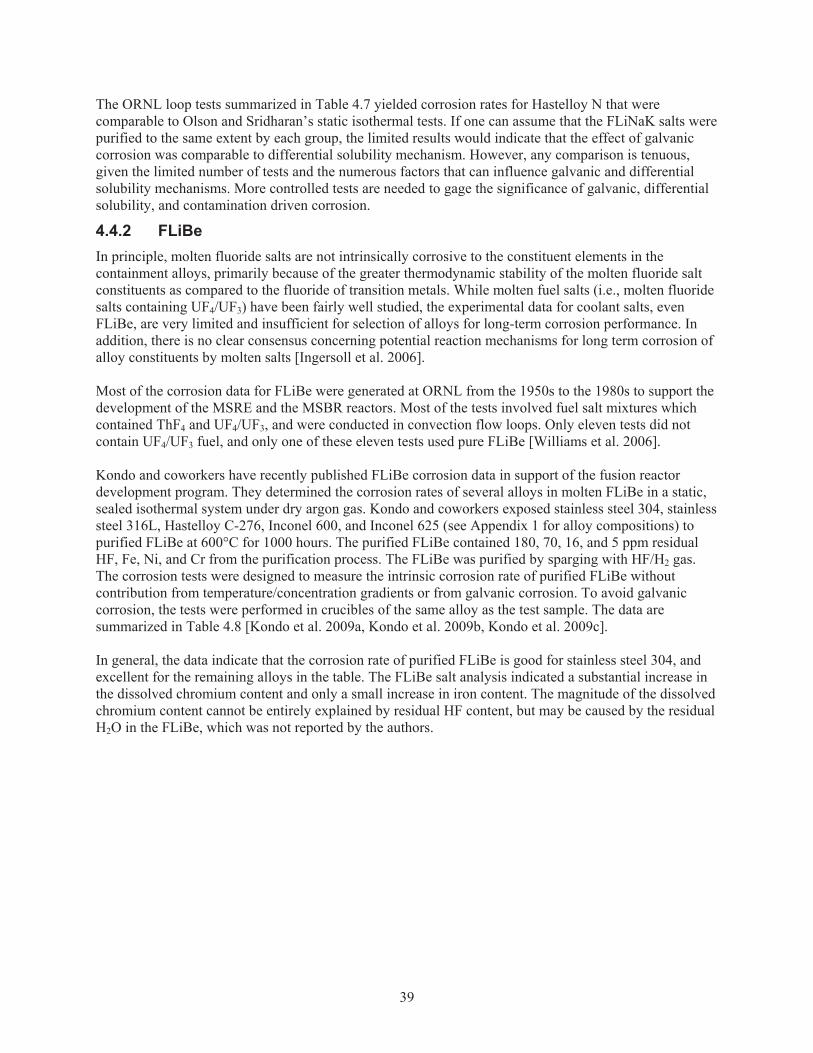
39
The ORNL loop tests summarized in Table 4.7 yielded corrosion rates for Hastelloy N that were comparable to Olson and Sridharan’s static isothermal tests. If one can assume that the FLiNaK salts were purified to the same extent by each group, the limited results would indicate that the effect of galvanic corrosion was comparable to differential solubility mechanism. However, any comparison is tenuous, given the limited number of tests and the numerous factors that can influence galvanic and differential solubility mechanisms. More controlled tests are needed to gage the significance of galvanic, differential solubility, and contamination driven corrosion.
4.4.2 FLiBe In principle, molten fluoride salts are not intrinsically corrosive to the constituent elements in the containment alloys, primarily because of the greater thermodynamic stability of the molten fluoride salt constituents as compared to the fluoride of transition metals. While molten fuel salts (i.e., molten fluoride salts containing UF4/UF3) have been fairly well studied, the experimental data for coolant salts, even FLiBe, are very limited and insufficient for selection of alloys for long-term corrosion performance. In addition, there is no clear consensus concerning potential reaction mechanisms for long term corrosion of alloy constituents by molten salts [Ingersoll et al. 2006]. Most of the corrosion data for FLiBe were generated at ORNL from the 1950s to the 1980s to support the development of the MSRE and the MSBR reactors. Most of the tests involved fuel salt mixtures which contained ThF4 and UF4/UF3, and were conducted in convection flow loops. Only eleven tests did not contain UF4/UF3 fuel, and only one of these eleven tests used pure FLiBe [Williams et al. 2006]. Kondo and coworkers have recently published FLiBe corrosion data in support of the fusion reactor development program. They determined the corrosion rates of several alloys in molten FLiBe in a static, sealed isothermal system under dry argon gas. Kondo and coworkers exposed stainless steel 304, stainless steel 316L, Hastelloy C-276, Inconel 600, and Inconel 625 (see Appendix 1 for alloy compositions) to purified FLiBe at 600°C for 1000 hours. The purified FLiBe contained 180, 70, 16, and 5 ppm residual HF, Fe, Ni, and Cr from the purification process. The FLiBe was purified by sparging with HF/H2 gas. The corrosion tests were designed to measure the intrinsic corrosion rate of purified FLiBe without contribution from temperature/concentration gradients or from galvanic corrosion. To avoid galvanic corrosion, the tests were performed in crucibles of the same alloy as the test sample. The data are summarized in Table 4.8 [Kondo et al. 2009a, Kondo et al. 2009b, Kondo et al. 2009c]. In general, the data indicate that the corrosion rate of purified FLiBe is good for stainless steel 304, and excellent for the remaining alloys in the table. The FLiBe salt analysis indicated a substantial increase in the dissolved chromium content and only a small increase in iron content. The magnitude of the dissolved chromium content cannot be entirely explained by residual HF content, but may be caused by the residual H2O in the FLiBe, which was not reported by the authors.
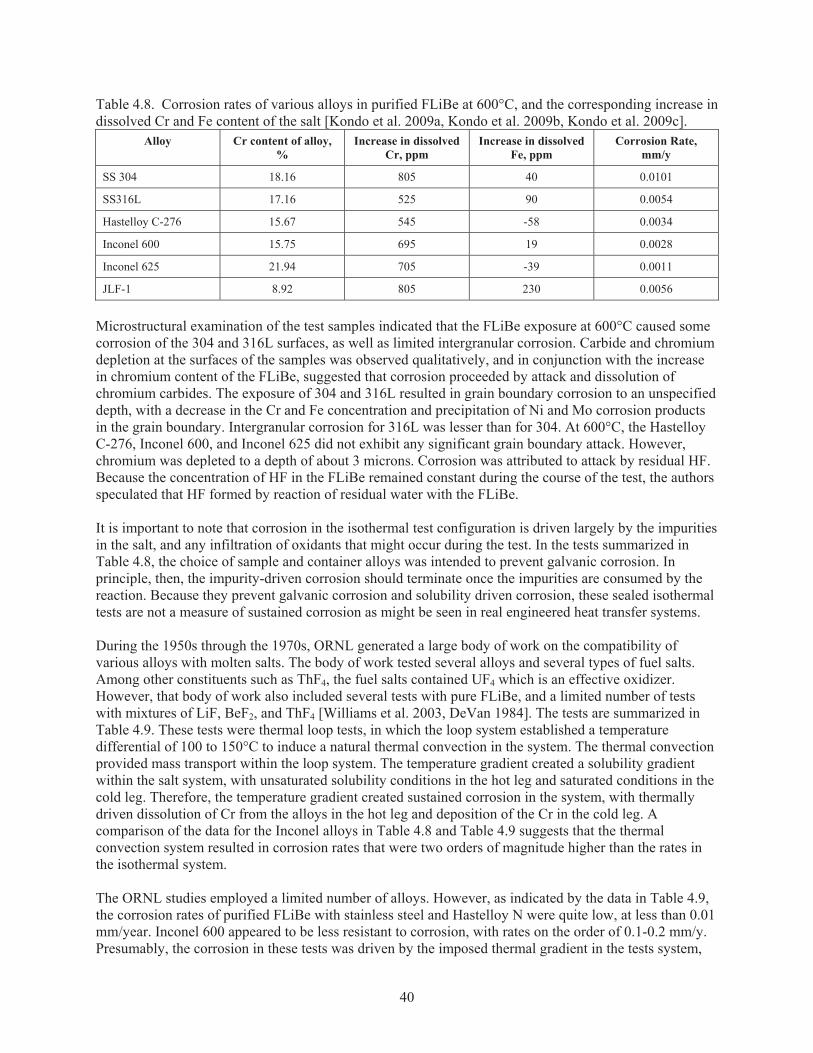
40
Table 4.8. Corrosion rates of various alloys in purified FLiBe at 600°C, and the corresponding increase in dissolved Cr and Fe content of the salt [Kondo et al. 2009a, Kondo et al. 2009b, Kondo et al. 2009c].
Alloy Cr content of alloy, %
Increase in dissolved Cr, ppm
Increase in dissolved Fe, ppm
Corrosion Rate, mm/y
SS 304 18.16 805 40 0.0101
SS316L 17.16 525 90 0.0054
Hastelloy C-276 15.67 545 -58 0.0034
Inconel 600 15.75 695 19 0.0028
Inconel 625 21.94 705 -39 0.0011
JLF-1 8.92 805 230 0.0056
Microstructural examination of the test samples indicated that the FLiBe exposure at 600°C caused some corrosion of the 304 and 316L surfaces, as well as limited intergranular corrosion. Carbide and chromium depletion at the surfaces of the samples was observed qualitatively, and in conjunction with the increase in chromium content of the FLiBe, suggested that corrosion proceeded by attack and dissolution of chromium carbides. The exposure of 304 and 316L resulted in grain boundary corrosion to an unspecified depth, with a decrease in the Cr and Fe concentration and precipitation of Ni and Mo corrosion products in the grain boundary. Intergranular corrosion for 316L was lesser than for 304. At 600°C, the Hastelloy C-276, Inconel 600, and Inconel 625 did not exhibit any significant grain boundary attack. However, chromium was depleted to a depth of about 3 microns. Corrosion was attributed to attack by residual HF. Because the concentration of HF in the FLiBe remained constant during the course of the test, the authors speculated that HF formed by reaction of residual water with the FLiBe. It is important to note that corrosion in the isothermal test configuration is driven largely by the impurities in the salt, and any infiltration of oxidants that might occur during the test. In the tests summarized in Table 4.8, the choice of sample and container alloys was intended to prevent galvanic corrosion. In principle, then, the impurity-driven corrosion should terminate once the impurities are consumed by the reaction. Because they prevent galvanic corrosion and solubility driven corrosion, these sealed isothermal tests are not a measure of sustained corrosion as might be seen in real engineered heat transfer systems. During the 1950s through the 1970s, ORNL generated a large body of work on the compatibility of various alloys with molten salts. The body of work tested several alloys and several types of fuel salts. Among other constituents such as ThF4, the fuel salts contained UF4 which is an effective oxidizer. However, that body of work also included several tests with pure FLiBe, and a limited number of tests with mixtures of LiF, BeF2, and ThF4 [Williams et al. 2003, DeVan 1984]. The tests are summarized in Table 4.9. These tests were thermal loop tests, in which the loop system established a temperature differential of 100 to 150°C to induce a natural thermal convection in the system. The thermal convection provided mass transport within the loop system. The temperature gradient created a solubility gradient within the salt system, with unsaturated solubility conditions in the hot leg and saturated conditions in the cold leg. Therefore, the temperature gradient created sustained corrosion in the system, with thermally driven dissolution of Cr from the alloys in the hot leg and deposition of the Cr in the cold leg. A comparison of the data for the Inconel alloys in Table 4.8 and Table 4.9 suggests that the thermal convection system resulted in corrosion rates that were two orders of magnitude higher than the rates in the isothermal system. The ORNL studies employed a limited number of alloys. However, as indicated by the data in Table 4.9, the corrosion rates of purified FLiBe with stainless steel and Hastelloy N were quite low, at less than 0.01 mm/year. Inconel 600 appeared to be less resistant to corrosion, with rates on the order of 0.1-0.2 mm/y. Presumably, the corrosion in these tests was driven by the imposed thermal gradient in the tests system,
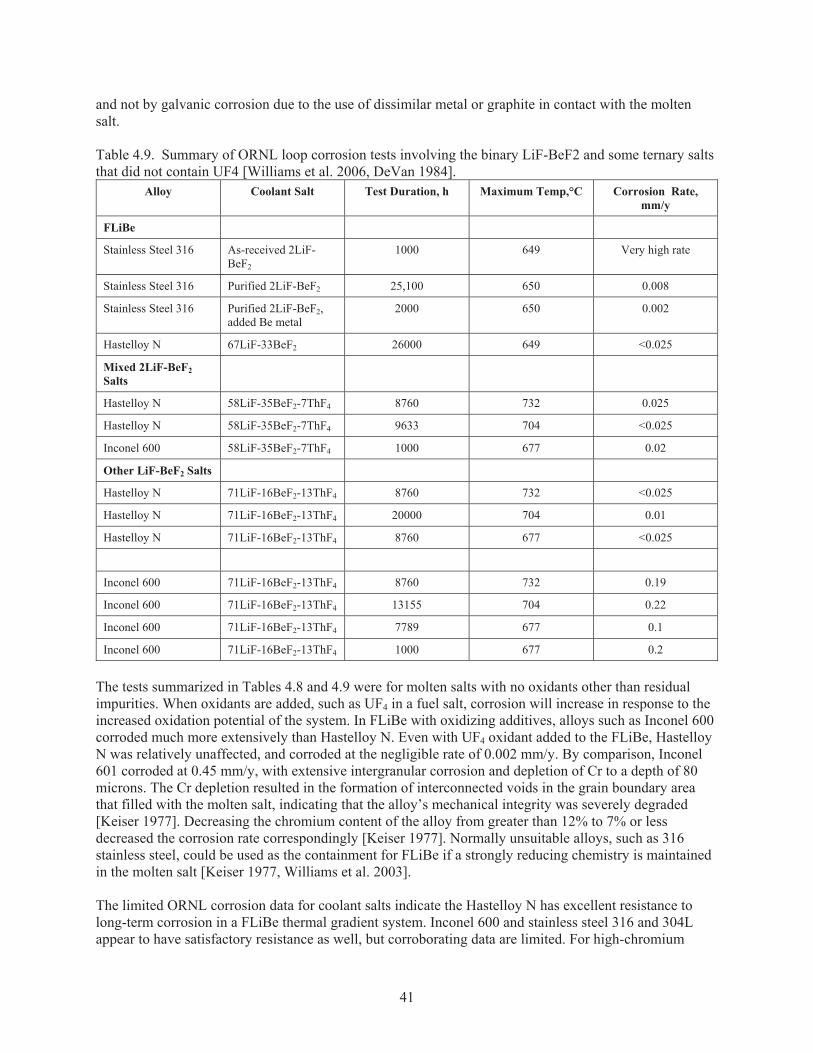
41
and not by galvanic corrosion due to the use of dissimilar metal or graphite in contact with the molten salt. Table 4.9. Summary of ORNL loop corrosion tests involving the binary LiF-BeF2 and some ternary salts that did not contain UF4 [Williams et al. 2006, DeVan 1984].
Alloy Coolant Salt Test Duration, h Maximum Temp,°C Corrosion Rate, mm/y
FLiBe
Stainless Steel 316 As-received 2LiF-BeF2
1000 649 Very high rate
Stainless Steel 316 Purified 2LiF-BeF2 25,100 650 0.008
Stainless Steel 316 Purified 2LiF-BeF2, added Be metal
2000 650 0.002
Hastelloy N 67LiF-33BeF2 26000 649 <0.025
Mixed 2LiF-BeF2 Salts
Hastelloy N 58LiF-35BeF2-7ThF4 8760 732 0.025
Hastelloy N 58LiF-35BeF2-7ThF4 9633 704 <0.025
Inconel 600 58LiF-35BeF2-7ThF4 1000 677 0.02
Other LiF-BeF2 Salts
Hastelloy N 71LiF-16BeF2-13ThF4 8760 732 <0.025
Hastelloy N 71LiF-16BeF2-13ThF4 20000 704 0.01
Hastelloy N 71LiF-16BeF2-13ThF4 8760 677 <0.025
Inconel 600 71LiF-16BeF2-13ThF4 8760 732 0.19
Inconel 600 71LiF-16BeF2-13ThF4 13155 704 0.22
Inconel 600 71LiF-16BeF2-13ThF4 7789 677 0.1
Inconel 600 71LiF-16BeF2-13ThF4 1000 677 0.2
The tests summarized in Tables 4.8 and 4.9 were for molten salts with no oxidants other than residual impurities. When oxidants are added, such as UF4 in a fuel salt, corrosion will increase in response to the increased oxidation potential of the system. In FLiBe with oxidizing additives, alloys such as Inconel 600 corroded much more extensively than Hastelloy N. Even with UF4 oxidant added to the FLiBe, Hastelloy N was relatively unaffected, and corroded at the negligible rate of 0.002 mm/y. By comparison, Inconel 601 corroded at 0.45 mm/y, with extensive intergranular corrosion and depletion of Cr to a depth of 80 microns. The Cr depletion resulted in the formation of interconnected voids in the grain boundary area that filled with the molten salt, indicating that the alloy’s mechanical integrity was severely degraded [Keiser 1977]. Decreasing the chromium content of the alloy from greater than 12% to 7% or less decreased the corrosion rate correspondingly [Keiser 1977]. Normally unsuitable alloys, such as 316 stainless steel, could be used as the containment for FLiBe if a strongly reducing chemistry is maintained in the molten salt [Keiser 1977, Williams et al. 2003]. The limited ORNL corrosion data for coolant salts indicate the Hastelloy N has excellent resistance to long-term corrosion in a FLiBe thermal gradient system. Inconel 600 and stainless steel 316 and 304L appear to have satisfactory resistance as well, but corroborating data are limited. For high-chromium
42
alloys, such as Inconel alloys or stainless steel, some redox control, such as the addition of metallic Be, may be required to minimize corrosion in the system [Ingersoll et al. 2006]. Hastelloy N is sufficiently resistant to corrosion in FLiBe at temperatures less than 700°C that redox control is not necessary in a coolant salt system. However, the existing data are insufficient to project reliably the performance at temperatures greater than 750°C. While some of the redox control strategies used for fuel salts may work for coolant salts, the database is insufficient for a reliable and defensible selection for long term operation at high temperatures [Ingersoll et al. 2006].
4.4.3 KCl-MgCl2 Molten chloride salts have long been applied by industry for heat transfer, heat treatments, high-temperature electrochemical coatings, and other processes. The corrosion characteristics have been studied for some common structural alloys in a variety of salts, but few data have been generated for eutectic KCl-MgCl2. Limited data have been published Sridharan and co-workers for some high-nickel alloys [Ambrosek 2010, Olson 2009, Sridharan 2009, Anderson and Sridharan 2010]. These tests were static, isothermal tests conducted at 850°C for 500 hours in quartz crucibles, plus one test with Incoloy 800H in a graphite crucible. Their data are summarized in Table 4.10. Table 4.10. Corrosion of several alloys in KCl-MgCl2 at 850°C for 100 hours in quartz crucibles. [Ambrosek 2010, Olson 2009, Sridharan 2009, Anderson and Sridharan 2010].
Alloy Crucible Corrosion Rate, mm/y Comments
Haynes 230 quartz 0.67 Good resistance to intergranular attack
316 Stainless Steel quartz 1.0 Deepest intergranular attack (300 μ deep), worst Cr depletion
Hastelloy X quartz 1.1
Hastelloy N quartz 1.1 Least intergranular attack, least Cr depletion
Inconel 718 quartz 1.2
Inconel 617 quartz 1.3
Incoloy 800H quartz 1.4
Incoloy 800H-GBE* quartz 0.89 Good resistance to intergranular attack
Incoloy 800H graphite 0.24
Ni-210 quartz 1.3 Least intergranular attack
Inconel 625 quartz 1.5
Inconel 600 quartz 1.5 *GBE = grain boundary engineered Of the various alloys, Haynes 230 exhibited the least mass loss from the exposure to molten KCl-MgCl2, while Hastelloy N exhibited the least grain boundary attack and chromium dissolution. Despite moderate mass loss, SS-316 exhibited the worst grain boundary attack, with chromium depletion to 300 microns depth in the 100 hour exposure. A direct, side-by-side comparison of the corrosion rate data generated by Ambrosek, Olson, and Sridharan for the various alloys in FLiNaK and in KCl-MgCl2 may not be valid, given the differences in
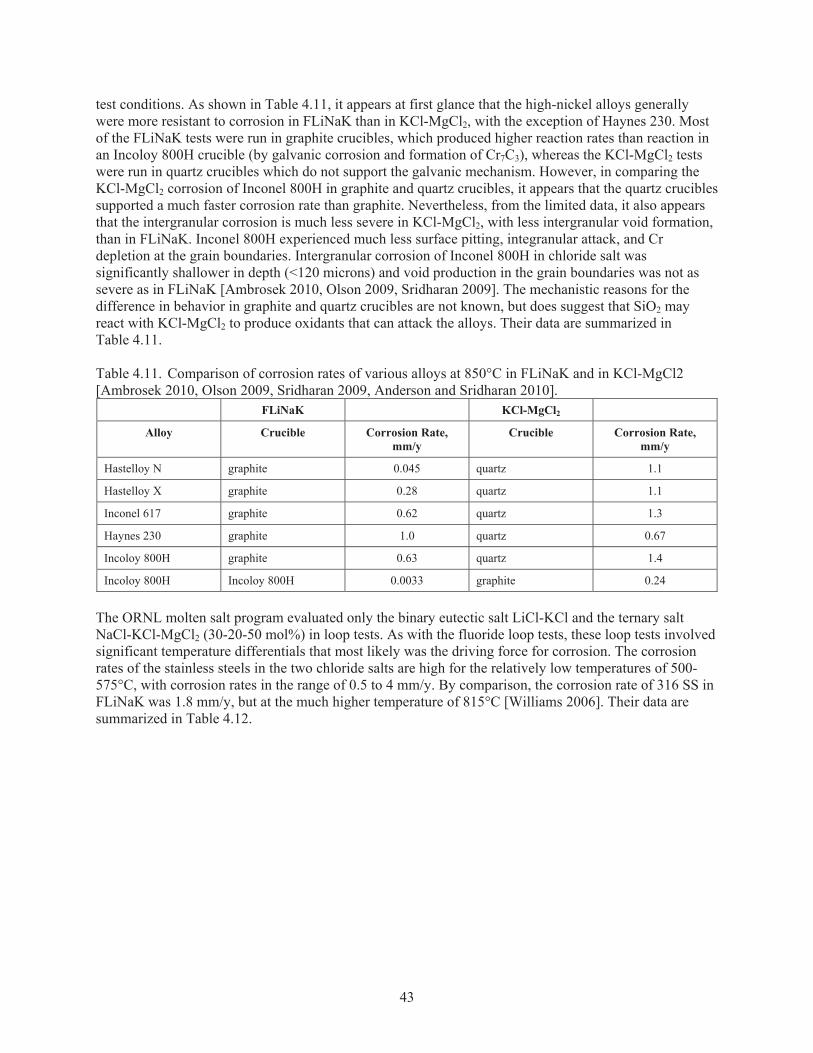
43
test conditions. As shown in Table 4.11, it appears at first glance that the high-nickel alloys generally were more resistant to corrosion in FLiNaK than in KCl-MgCl2, with the exception of Haynes 230. Most of the FLiNaK tests were run in graphite crucibles, which produced higher reaction rates than reaction in an Incoloy 800H crucible (by galvanic corrosion and formation of Cr7C3), whereas the KCl-MgCl2 tests were run in quartz crucibles which do not support the galvanic mechanism. However, in comparing the KCl-MgCl2 corrosion of Inconel 800H in graphite and quartz crucibles, it appears that the quartz crucibles supported a much faster corrosion rate than graphite. Nevertheless, from the limited data, it also appears that the intergranular corrosion is much less severe in KCl-MgCl2, with less intergranular void formation, than in FLiNaK. Inconel 800H experienced much less surface pitting, integranular attack, and Cr depletion at the grain boundaries. Intergranular corrosion of Inconel 800H in chloride salt was significantly shallower in depth (<120 microns) and void production in the grain boundaries was not as severe as in FLiNaK [Ambrosek 2010, Olson 2009, Sridharan 2009]. The mechanistic reasons for the difference in behavior in graphite and quartz crucibles are not known, but does suggest that SiO2 may react with KCl-MgCl2 to produce oxidants that can attack the alloys. Their data are summarized in Table 4.11. Table 4.11. Comparison of corrosion rates of various alloys at 850°C in FLiNaK and in KCl-MgCl2 [Ambrosek 2010, Olson 2009, Sridharan 2009, Anderson and Sridharan 2010].
FLiNaK KCl-MgCl2
Alloy Crucible Corrosion Rate, mm/y
Crucible Corrosion Rate, mm/y
Hastelloy N graphite 0.045 quartz 1.1
Hastelloy X graphite 0.28 quartz 1.1
Inconel 617 graphite 0.62 quartz 1.3
Haynes 230 graphite 1.0 quartz 0.67
Incoloy 800H graphite 0.63 quartz 1.4
Incoloy 800H Incoloy 800H 0.0033 graphite 0.24
The ORNL molten salt program evaluated only the binary eutectic salt LiCl-KCl and the ternary salt NaCl-KCl-MgCl2 (30-20-50 mol%) in loop tests. As with the fluoride loop tests, these loop tests involved significant temperature differentials that most likely was the driving force for corrosion. The corrosion rates of the stainless steels in the two chloride salts are high for the relatively low temperatures of 500-575°C, with corrosion rates in the range of 0.5 to 4 mm/y. By comparison, the corrosion rate of 316 SS in FLiNaK was 1.8 mm/y, but at the much higher temperature of 815°C [Williams 2006]. Their data are summarized in Table 4.12.
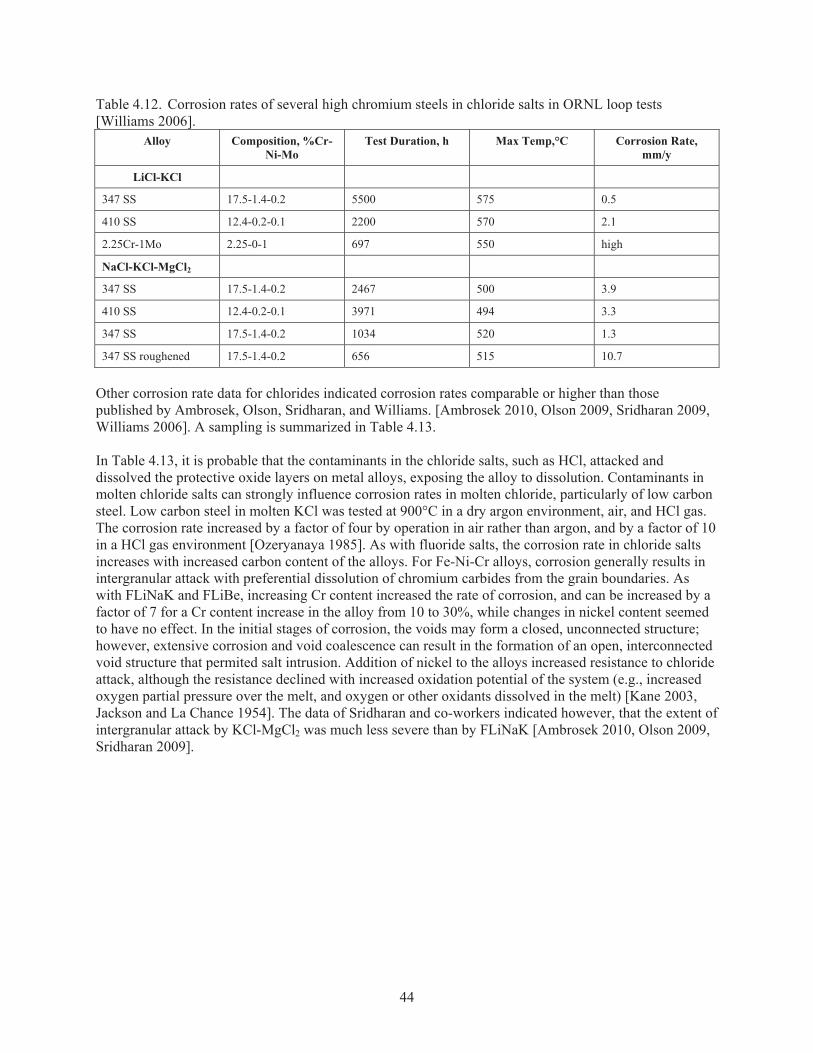
44
Table 4.12. Corrosion rates of several high chromium steels in chloride salts in ORNL loop tests [Williams 2006].
Alloy Composition, %Cr-Ni-Mo
Test Duration, h Max Temp,°C Corrosion Rate, mm/y
LiCl-KCl
347 SS 17.5-1.4-0.2 5500 575 0.5
410 SS 12.4-0.2-0.1 2200 570 2.1
2.25Cr-1Mo 2.25-0-1 697 550 high
NaCl-KCl-MgCl2
347 SS 17.5-1.4-0.2 2467 500 3.9
410 SS 12.4-0.2-0.1 3971 494 3.3
347 SS 17.5-1.4-0.2 1034 520 1.3
347 SS roughened 17.5-1.4-0.2 656 515 10.7
Other corrosion rate data for chlorides indicated corrosion rates comparable or higher than those published by Ambrosek, Olson, Sridharan, and Williams. [Ambrosek 2010, Olson 2009, Sridharan 2009, Williams 2006]. A sampling is summarized in Table 4.13. In Table 4.13, it is probable that the contaminants in the chloride salts, such as HCl, attacked and dissolved the protective oxide layers on metal alloys, exposing the alloy to dissolution. Contaminants in molten chloride salts can strongly influence corrosion rates in molten chloride, particularly of low carbon steel. Low carbon steel in molten KCl was tested at 900°C in a dry argon environment, air, and HCl gas. The corrosion rate increased by a factor of four by operation in air rather than argon, and by a factor of 10 in a HCl gas environment [Ozeryanaya 1985]. As with fluoride salts, the corrosion rate in chloride salts increases with increased carbon content of the alloys. For Fe-Ni-Cr alloys, corrosion generally results in intergranular attack with preferential dissolution of chromium carbides from the grain boundaries. As with FLiNaK and FLiBe, increasing Cr content increased the rate of corrosion, and can be increased by a factor of 7 for a Cr content increase in the alloy from 10 to 30%, while changes in nickel content seemed to have no effect. In the initial stages of corrosion, the voids may form a closed, unconnected structure; however, extensive corrosion and void coalescence can result in the formation of an open, interconnected void structure that permited salt intrusion. Addition of nickel to the alloys increased resistance to chloride attack, although the resistance declined with increased oxidation potential of the system (e.g., increased oxygen partial pressure over the melt, and oxygen or other oxidants dissolved in the melt) [Kane 2003, Jackson and La Chance 1954]. The data of Sridharan and co-workers indicated however, that the extent of intergranular attack by KCl-MgCl2 was much less severe than by FLiNaK [Ambrosek 2010, Olson 2009, Sridharan 2009].
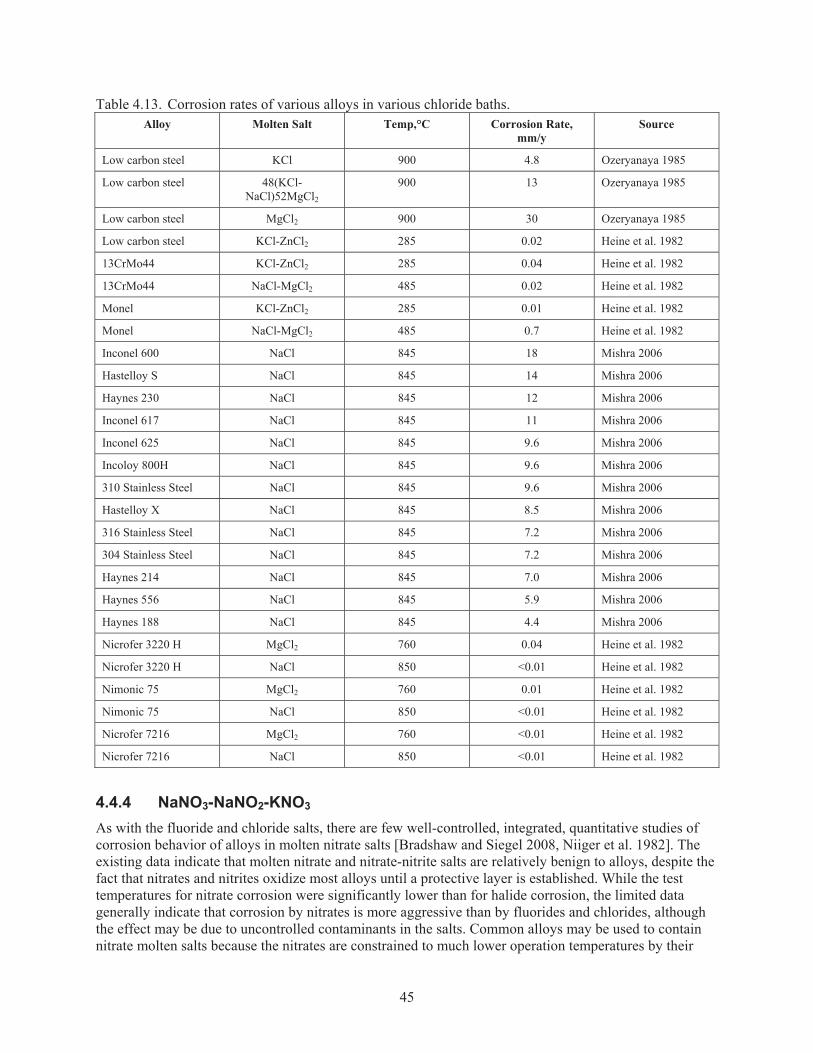
45
Table 4.13. Corrosion rates of various alloys in various chloride baths. Alloy Molten Salt Temp,°C Corrosion Rate,
mm/y Source
Low carbon steel KCl 900 4.8 Ozeryanaya 1985
Low carbon steel 48(KCl-NaCl)52MgCl2
900 13 Ozeryanaya 1985
Low carbon steel MgCl2 900 30 Ozeryanaya 1985
Low carbon steel KCl-ZnCl2 285 0.02 Heine et al. 1982
13CrMo44 KCl-ZnCl2 285 0.04 Heine et al. 1982
13CrMo44 NaCl-MgCl2 485 0.02 Heine et al. 1982
Monel KCl-ZnCl2 285 0.01 Heine et al. 1982
Monel NaCl-MgCl2 485 0.7 Heine et al. 1982
Inconel 600 NaCl 845 18 Mishra 2006
Hastelloy S NaCl 845 14 Mishra 2006
Haynes 230 NaCl 845 12 Mishra 2006
Inconel 617 NaCl 845 11 Mishra 2006
Inconel 625 NaCl 845 9.6 Mishra 2006
Incoloy 800H NaCl 845 9.6 Mishra 2006
310 Stainless Steel NaCl 845 9.6 Mishra 2006
Hastelloy X NaCl 845 8.5 Mishra 2006
316 Stainless Steel NaCl 845 7.2 Mishra 2006
304 Stainless Steel NaCl 845 7.2 Mishra 2006
Haynes 214 NaCl 845 7.0 Mishra 2006
Haynes 556 NaCl 845 5.9 Mishra 2006
Haynes 188 NaCl 845 4.4 Mishra 2006
Nicrofer 3220 H MgCl2 760 0.04 Heine et al. 1982
Nicrofer 3220 H NaCl 850 <0.01 Heine et al. 1982
Nimonic 75 MgCl2 760 0.01 Heine et al. 1982
Nimonic 75 NaCl 850 <0.01 Heine et al. 1982
Nicrofer 7216 MgCl2 760 <0.01 Heine et al. 1982
Nicrofer 7216 NaCl 850 <0.01 Heine et al. 1982
4.4.4 NaNO3-NaNO2-KNO3 As with the fluoride and chloride salts, there are few well-controlled, integrated, quantitative studies of corrosion behavior of alloys in molten nitrate salts [Bradshaw and Siegel 2008, Niiger et al. 1982]. The existing data indicate that molten nitrate and nitrate-nitrite salts are relatively benign to alloys, despite the fact that nitrates and nitrites oxidize most alloys until a protective layer is established. While the test temperatures for nitrate corrosion were significantly lower than for halide corrosion, the limited data generally indicate that corrosion by nitrates is more aggressive than by fluorides and chlorides, although the effect may be due to uncontrolled contaminants in the salts. Common alloys may be used to contain nitrate molten salts because the nitrates are constrained to much lower operation temperatures by their
46
thermal instability than fluoride or chloride salts, and the resultant corrosion rates at the lower temperatures may be economically acceptable. Nitrate and nitrite-nitrate molten salts have a long history of use, and have been used widely for many applications. Various steel alloys, including carbon steel and low-alloy steels, can be used to contain nitrates, because of the basicity and strong oxidizing characteristics nitrate melts that stabilize the passive oxide layer and prevent corrosion of iron, chromium, and other alloy components. Chromium content increases the corrosion resistance of the alloy [Kane 2003, Cramer and Covino 2003]. Generally, soft iron, low carbon steel, and iron-based alloys form a passivating oxide when immersed in nitrate or in nitrite melts at 240 to 320°C, consisting of Fe3O4. The Fe3O4 oxidizes further to Fe2O3 at the molten salt interface. Molten nitrites produce a similar protective Fe3O4 film. The oxide layers are protective to about 500°C [Cramer and Covino 2003, Kane 2003]. Nickel or austenitic stainless steels must be used for higher temperatures or long-term operation. These alloys form protective Cr2O3 and NiO films in addition to the iron oxide. Exposure of Incoloy 800, and stainless steel 304, 304L, and 316 to thermal convection of KNO3-NaNO3 draw salt at 375 to 600°C under argon resulted in thin oxide films on all of the alloys, and some dissolution of Cr from the alloys. The mode of corrosion was general surface corrosion, with dissolution of the chromium oxide film (as the chromate ion) into the melt; nickel and iron oxides were insoluble. There was no evidence of grain boundary attack [Cramer and Covino 2003, Carling and Bradshaw 1986, Niiger et al. 1982]. Carbon and Cr-Mo steels have been used satisfactorily to contain Hitec salt at temperatures up to 450°C [Cramer and Covino 2003, Carling and Bradshaw 1986, Coastal 2009]. Table 4.14 summarizes the corrosion rates of various alloys in the Hitec salt mixture, as reported by the manufacturer and others [Coastal 2009, Keiser et al. 1979]. In general, the Cr-Ni stainless steel alloys have adequate corrosion resistance to Hitec even at the upper temperature range for use of the salt.
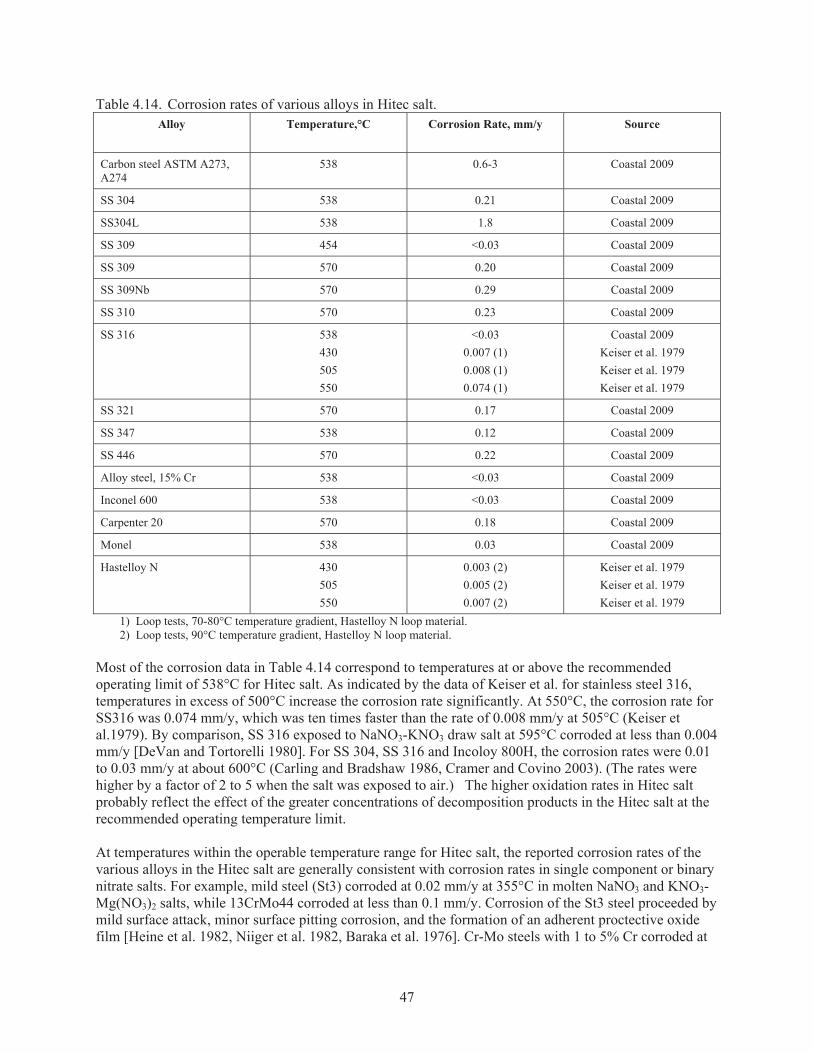
47
Table 4.14. Corrosion rates of various alloys in Hitec salt. Alloy Temperature,°C Corrosion Rate, mm/y
Source
Carbon steel ASTM A273, A274
538 0.6-3 Coastal 2009
SS 304 538 0.21 Coastal 2009
SS304L 538 1.8 Coastal 2009
SS 309 454 <0.03 Coastal 2009
SS 309 570 0.20 Coastal 2009
SS 309Nb 570 0.29 Coastal 2009
SS 310 570 0.23 Coastal 2009
SS 316 538 430 505 550
<0.03 0.007 (1) 0.008 (1) 0.074 (1)
Coastal 2009 Keiser et al. 1979 Keiser et al. 1979 Keiser et al. 1979
SS 321 570 0.17 Coastal 2009
SS 347 538 0.12 Coastal 2009
SS 446 570 0.22 Coastal 2009
Alloy steel, 15% Cr 538 <0.03 Coastal 2009
Inconel 600 538 <0.03 Coastal 2009
Carpenter 20 570 0.18 Coastal 2009
Monel 538 0.03 Coastal 2009
Hastelloy N 430 505 550
0.003 (2) 0.005 (2) 0.007 (2)
Keiser et al. 1979 Keiser et al. 1979 Keiser et al. 1979
1) Loop tests, 70-80°C temperature gradient, Hastelloy N loop material. 2) Loop tests, 90°C temperature gradient, Hastelloy N loop material. Most of the corrosion data in Table 4.14 correspond to temperatures at or above the recommended operating limit of 538°C for Hitec salt. As indicated by the data of Keiser et al. for stainless steel 316, temperatures in excess of 500°C increase the corrosion rate significantly. At 550°C, the corrosion rate for SS316 was 0.074 mm/y, which was ten times faster than the rate of 0.008 mm/y at 505°C (Keiser et al.1979). By comparison, SS 316 exposed to NaNO3-KNO3 draw salt at 595°C corroded at less than 0.004 mm/y [DeVan and Tortorelli 1980]. For SS 304, SS 316 and Incoloy 800H, the corrosion rates were 0.01 to 0.03 mm/y at about 600°C (Carling and Bradshaw 1986, Cramer and Covino 2003). (The rates were higher by a factor of 2 to 5 when the salt was exposed to air.) The higher oxidation rates in Hitec salt probably reflect the effect of the greater concentrations of decomposition products in the Hitec salt at the recommended operating temperature limit. At temperatures within the operable temperature range for Hitec salt, the reported corrosion rates of the various alloys in the Hitec salt are generally consistent with corrosion rates in single component or binary nitrate salts. For example, mild steel (St3) corroded at 0.02 mm/y at 355°C in molten NaNO3 and KNO3-Mg(NO3)2 salts, while 13CrMo44 corroded at less than 0.1 mm/y. Corrosion of the St3 steel proceeded by mild surface attack, minor surface pitting corrosion, and the formation of an adherent proctective oxide film [Heine et al. 1982, Niiger et al. 1982, Baraka et al. 1976]. Cr-Mo steels with 1 to 5% Cr corroded at
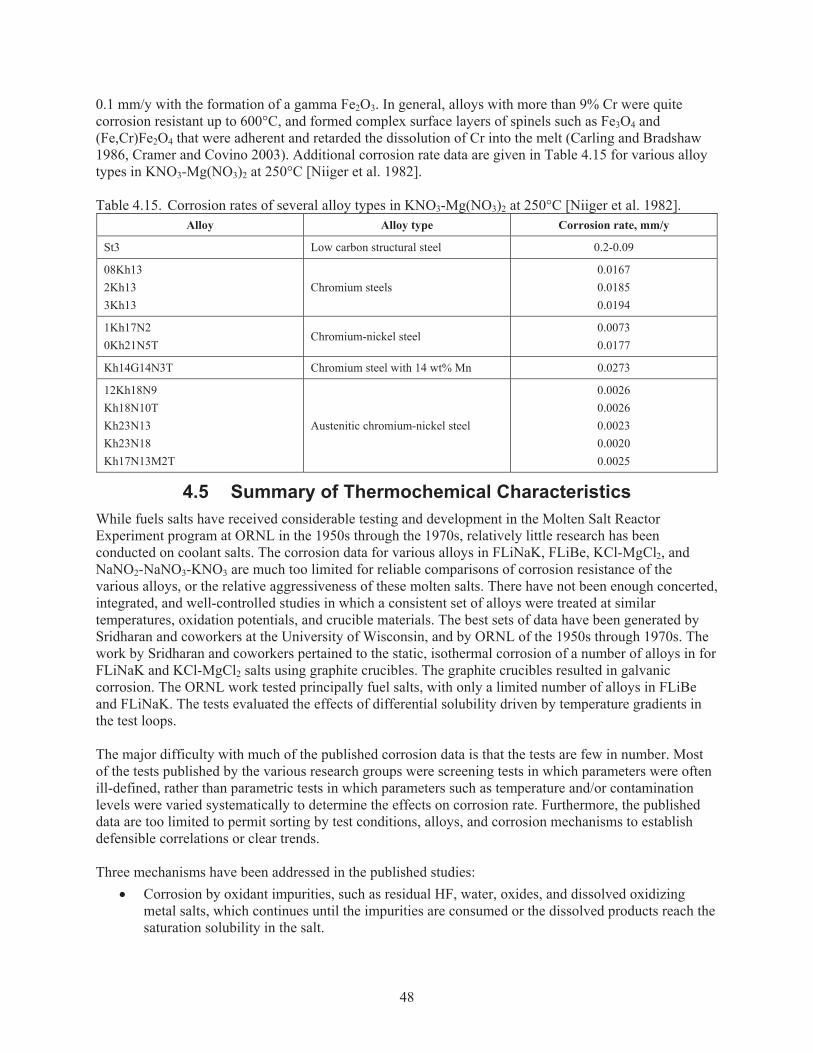
48
0.1 mm/y with the formation of a gamma Fe2O3. In general, alloys with more than 9% Cr were quite corrosion resistant up to 600°C, and formed complex surface layers of spinels such as Fe3O4 and (Fe,Cr)Fe2O4 that were adherent and retarded the dissolution of Cr into the melt (Carling and Bradshaw 1986, Cramer and Covino 2003). Additional corrosion rate data are given in Table 4.15 for various alloy types in KNO3-Mg(NO3)2 at 250°C [Niiger et al. 1982]. Table 4.15. Corrosion rates of several alloy types in KNO3-Mg(NO3)2 at 250°C [Niiger et al. 1982].
Alloy Alloy type Corrosion rate, mm/y
St3 Low carbon structural steel 0.2-0.09
08Kh13 2Kh13 3Kh13
Chromium steels 0.0167 0.0185 0.0194
1Kh17N2 0Kh21N5T
Chromium-nickel steel 0.0073 0.0177
Kh14G14N3T Chromium steel with 14 wt% Mn 0.0273
12Kh18N9 Kh18N10T Kh23N13 Kh23N18 Kh17N13M2T
Austenitic chromium-nickel steel
0.0026 0.0026 0.0023 0.0020 0.0025
4.5 Summary of Thermochemical Characteristics While fuels salts have received considerable testing and development in the Molten Salt Reactor Experiment program at ORNL in the 1950s through the 1970s, relatively little research has been conducted on coolant salts. The corrosion data for various alloys in FLiNaK, FLiBe, KCl-MgCl2, and NaNO2-NaNO3-KNO3 are much too limited for reliable comparisons of corrosion resistance of the various alloys, or the relative aggressiveness of these molten salts. There have not been enough concerted, integrated, and well-controlled studies in which a consistent set of alloys were treated at similar temperatures, oxidation potentials, and crucible materials. The best sets of data have been generated by Sridharan and coworkers at the University of Wisconsin, and by ORNL of the 1950s through 1970s. The work by Sridharan and coworkers pertained to the static, isothermal corrosion of a number of alloys in for FLiNaK and KCl-MgCl2 salts using graphite crucibles. The graphite crucibles resulted in galvanic corrosion. The ORNL work tested principally fuel salts, with only a limited number of alloys in FLiBe and FLiNaK. The tests evaluated the effects of differential solubility driven by temperature gradients in the test loops. The major difficulty with much of the published corrosion data is that the tests are few in number. Most of the tests published by the various research groups were screening tests in which parameters were often ill-defined, rather than parametric tests in which parameters such as temperature and/or contamination levels were varied systematically to determine the effects on corrosion rate. Furthermore, the published data are too limited to permit sorting by test conditions, alloys, and corrosion mechanisms to establish defensible correlations or clear trends. Three mechanisms have been addressed in the published studies:
Corrosion by oxidant impurities, such as residual HF, water, oxides, and dissolved oxidizing metal salts, which continues until the impurities are consumed or the dissolved products reach the saturation solubility in the salt.
49
Differential solubility and deposition, due to temperature gradients in the test system, such as loops. Corrosion is driven by the higher saturation solubility and consequently dissolution of an oxidizable alloy component in the hot zone, and a lower saturation solubility with precipitation or deposition in the cold zone.
Galvanic corrosion, caused by materials of differing composition and electromotive potential in electrical contact in the molten salt, resulting in oxidation and dissolution of the anodic material, and reduction and deposition of the dissolved material at the cathode. The deposition may be enhanced by alloying with the cathode, or by chemical reaction with the cathode (such as carbide formation on carbon).
In principle, corrosion by impurities is a short-term process that should steadily decrease in rate as the impurity concentration decreases and thus the oxidation potential of the salt system decreases. This mechanism would be important only if the molten salt were exposed intermittently or continuously to ambient air or a source of oxidant that maintained the corrosion potential of the system. Of greater pertinence and importance in a compatibility assessment are the remaining mechanisms, which lead to persistent, continuous corrosion. These two mechanisms are also expected to operate in coolant systems, where significant temperature gradients and dissimilar materials may exist. The static isothermal tests of Sridharan and co-workers employed a good selection of alloys, which experienced galvanic corrosion in those tests with graphite crucibles and enhanced oxidation in those tests with quartz crucibles. The ORNL loop tests addressed the differential solubility mechanism, but were conducted primarily with fuel salts, with only a very limited number of tests with oxidant-free FLiBe and FLiNaK salts. Furthermore, they tested only a limited selection of alloys, chiefly Hastelloy N, Inconel 600, and stainless steel 316. Finally, the maximum temperatures employed in the ORNL loops tests were nominally 815°C; most tests were 700°C or less, whereas the temperatures of a VHTR may be as high as 850°C. A few general observations can be drawn from the existing but limited data. Nickel and alloys with dense Ni coatings are effectively inert to corrosion in fluorides but not so in chlorides. Of the chromium containing alloys, Hastelloy N appears to have the best corrosion resistance in fluorides, while Haynes 230 was most resistant in chloride. In general, alloys with increasing carbon and chromium content are increasingly subject to corrosion by the fluoride salts FLiBe and FLiNaK, due to attack and dissolution of the intergranular chromium carbide. Such a trend was not as prevalent in KCl-MgCl2 or in the Hitec data. In fact, chromium-nickel steels are much more resistant to corrosion in nitrate salts than low carbon steel, while chromium steels are intermediate. In general, FLiNaK caused extensive intergranular corrosion in most of the alloys, producing substantial void structure at the grain boundaries that developed rapidly and extended deeply in susceptible alloys. In some cases, intergranular corrosion progressed to open, connected porosity with salt intrusion into the degraded alloy. FLiBe caused more moderate intergranular corrosion, KCl-MgCl2 caused limited intergranular corrosion, while the nitrate-nitrite mixture did not cause any significant intergranular corrosion. Based on single-test JLF-1 from Kondo [Kondo 2009a] and and Incoloy 800H data from Olson [Olson 2009a, Sridharan 2009], FLiNaK appears to be much more corrosive than FLiBe and KCl-MgCl2, respectively. Finally, thermal gradients and galvanic couples in the molten salts can enhance corrosion rates by one to two orders of magnitude relative to corrosion by residual contaminants in the molten salts. There is a potential for similar corrosion enhancement if a significant mass of oxidants exists in molten salts, either as high levels of dissolved oxidizers or as large components in contact with the salt. By comparison,
50
contaminant corrosion seems a minor mechanism, but correlations of corrosion rate as a function of contaminant type, concentration, and temperature are not available for a quantitative comparison. The existing data as a whole are insufficient to serve as a basis for reliable selection of containment materials for compatibility with molten salts. The corrosion studies involving FLiBe, FLiNaK, KCl-MgCl2 and Hitec salt are extremely limited and were not controlled well enough to avoid intermixing of corrosion mechanisms and therefore of misinterpretation of the data. The existing corrosion data are flawed because of the following issues:
1. Limited Data: Too few data exist for the interaction of the coolant salts of interests with alloys, and the number of alloys tested thoroughly in the specific coolant molten salts of interest are too few to serve as a basis for a substantive ranking and selection of compatible alloys. Of the available data, only the work at ORNL and by Sridharan and co-workers are well-controlled integrated studies. Unfortunately, the ORNL work was focused largely on fuel salts. Very few of the loop tests were conducted with additive-free coolant salts, and those tests were limited to three alloys.
2. Lack of Parameteric Study: With the exception of the ORNL loop tests with fuel salts, none of the studies on coolant salts have studied corrosion parametrically, as a function of contaminant concentration (oxidation potential), of contaminant type, of galvanic potential, or of temperature.
3. Studies on Intrinsic Solubilities: Intrinsic solubilities of various transition metals, which can drive corrosion, have been measured as a function of two temperatures only for chromium in fuel salts, but not in the coolant salts of interest. There may be a significant difference in solubility of metal halides in coolant versus fuel salts, in that the oxidant in fuel salts is expected to more readily dissolve and stabilize metal ions in the salt.
4. Lack of Comprehensive Corrosion Quantifying Data: Mass loss might not represent a realistic measure of the effects of corrosion, because intergranular corrosion could severely degrade the mechanical characteristics and cause premature failure in alloys even at low mass loss values. Comprehensive integrated corrosion studies, which analyzed corrosion in terms of severity of intergranular attack in addition to mass loss (or gain), are limited to the work of Sridharan and co-workers and the ORNL loop tests, and are available primarily for FLiNaK.
5. Differentiation of Various Corrosion Mechanisms: The studies were generally not done well enough to isolate or exclude various contributing corrosion mechanisms, so that the reported effects may be the result of more than one mechanism, in which the parameters probably were not sufficiently controlled.
The number of corrosion studies in pure FLiBe, without added ThF4 or oxidants such as UF4, consists basically of the recent studies by Kondo, which were limited to the ferritic alloy JLF-1, and the earlier loop tests at ORNL, which were limited to one FLiBe test (as a binary eutectic coolant salt) and several tests with FLiBe-based ternary mixtures. The ternary fuel salts are not appropriate for extrapolating corrosion rates for FLiBe coolant, because the intrinsic solubility of the various transition metal fluorides, as well as contaminants, may be significantly different than for the binary FLiBe. In addition, these loop tests studied only three alloys. Furthermore, because they were loop tests, the ORNL tests did not measure the contaminant corrosion rate of FLiBe; rather, they measured the enhanced corrosion due to differential solubility mechanism. The available FLiNaK studies are limited to the recent work of Kondo et al., of Sridharan and co-workers at the University of Wisconsin, and the loop tests at ORNL. Again, the Kondo tests were limited to the ferritic alloy JLF-1. The work of Sridharan and co-workers involved a good selection of alloys, but all but one test were performed in carbon crucibles, which enhanced the corrosion rate substantially by galvanic
51
corrosion or by a dissolution/ deposition mechanism that involved carburization. The earlier ORNL tests were loop tests, which involved only three alloys and measured the corrosion due to the differential solubility mechanism. The data for corrosion by KCl-MgCl2 salt are limited to tests conducted by Sridharan and co-workers in quartz crucibles (except for one test), which enhanced the corrosion even more than carbon. While there is a substantial body of industrial data on alloy corrosion in a large variety of single-component, binary and ternary chloride salts, most of those studies are not sufficiently controlled or comprehensive for use other than as indicators of general trends. Because the molten salt composition is probably a key factor in corrosion kinetics and grain boundary attack, it is not clear how well data from dissimilar salts can be extrapolated to the KCl-MgCl2 molten salt system.
5. CONCLUSIONS AND RECOMMENDATIONS FOR FUTURE RESEARCH
5.1 Molten Salt Thermophysical Properties A brief review of thermophysical properties of four molten salts was performed. These salts are,
lithium fluoride-sodium fluoride-potassium fluoride (FLiNaK), lithium fluoride - beryllium fluoride (FLiBe), potassium chloride-magnesium chloride (KCl – MgCl2), and sodium nitrate-sodium nitrite-potassium nitrate (NaNO3–NaNO2–KNO3). Mainly five thermophysical properties were reviewed. These being, density, viscosity, surface tension, specific heat capacity, and thermal conductivity. Mainly correlations to predict these properties were identified. Usually one reasonable correlation for each property was selected (if more than one were available) and its applicability temperature range was identified. Based on these thermophysical properties,the Nusselt number was calculated for each salt. The plots in Figures 2.1-2.11 showed the adequacy and shortcomings of the thermophysical correlations. Uncertainty in Nusselt number calculations was also determined. Some literature was reviewed that showed that inaccurate determination of some thermophysical properties (specifically, thermal condutivity) leads to inaccurate determination of heat transfer for molten salts. However, such information is not available for all the salts being considered. Limited effort for a few salts has been made to accurately model Nusselt number correlations as a function of varying thermophysical properties.
From the data and plots shown in Section 2.2, future research topics related to thermophysical properties are listed below.
1. Lack of Data in Extended Temperature Range: Molten salt data are extremely limited especially at higher temperatures. Figures 2.1–2.11 show that the temperature range where the property correlation was not considered to be applicable. Thus many properties correlations need to be extended to a wider temperature range.
2. Properties as a function of Temperature: Some thermophysical properties were assumed to be constant for the entire temperature range. Therefore, a thorough investigation needs to be conducted to test dependency of properties on temperature, especially at higher temperatures.
3. Lack of Properties Correlations: Experimental data and corresponding correlations for some properties need to be developed, for example, thermal conductivity of nitrate salts and specific heat capacity of chloride salts.
4. Accuracy of Properties Values: A renewed effort has to be made to test the accuracy of properties data for many molten salt mixtures with improved, more accurate measuring instrumentation.
5. Effect of Salt mixture Composition Variation on Thermophysical Properties: There is a need to evaluate the impact of variation in mixture composition on thermophysical properties.
52
5.2 Molten Salt Themochemical Behavior Effect of Salt mixture Composition Variation on Corrosion Characteristics: More studies are needed to probe potential mechanisms that affect corrosion. Therefore, the following topics are recommended for further development:
1. Determine the saturation solubility as a function of temperatures for several key transition metals in the four salt systems of interest.
2. Correlate the effect of the magnitude of saturation solubility gradients in a system with extent of corrosion, by testing a selected set of chromium alloys in a temperature gradient system (loop) as a function of temperature gradient.
3. Develop galvanic potential rankings for various alloy constituent metals in the salts of interest, selecting potential candidate materials that would be used in a cooling system. For efficiency, such a study could be based on the galvanic series in seawater, testing a few selected elements from that series in molten salts to see if the series rankings are parallel (qualitatively) for predictive purposes.
4. Test a series of welded high-chromium alloy coupons with variations in the severity of the heat-affected zone (and concentration of chromium carbide precipitates), to determine whether localized variations in alloy composition and carbide formation can induce localized galvanic corrosion in the weld area that could impact the physical integrity of the alloy.
5. Determine the corrosion rates as a function of contaminant type (e.g., free fluorine, HF, water, metal oxide, dissolved transition metals) and concentration for selected alloys in FLiBe, FLiNaK, KCl-MgCl2, and Hitec salts, independent of galvanic and differential solubility effects. Most of the available ‘intrinsic’ corrosion rate data are effectively single-concentration data, for which the concentrations often were not determined. From the limited available corrosion studies, it is not clear that highly pure salts mixtures are absolutely necessary for optimum corrosion resistance, or whether there is a threshold concentration (oxidation potential) in the various salts above which corrosion becomes problematic.
6. Determine the corrosion rates as a function of alloy composition with respect to chromium and carbon in FLiBe and KCl-MgCl2, to define better the optimum value of Cr and C content, independent of galvanic or differential solubility effects.
7. Test selected alloys for resistance to intergranular corrosion to determine the relative aggressiveness of the four salts of interest (particularly FLiBe and KCl-MgCl2) as well as to identify more closely additional alloys that are resistant to the mechanism.
53
6. REFERENCES Abdel-Hakim, H. A., Attia, A. A., and Baraka, A. M. (2002). “Dissolution Susceptibility of the Oxide
Species Formed on Mild Steel During Its Oxidation in Molten NaNO3-KNO3 Eutectic Mixture,” Journal of Materials Engineering and Performance, 11 (3), 301-305.
Allen, T. (2010), Molten Salt Database, http://allen.neep.wisc.edu/shell/index.php/salts, Nuclear Engineering and Engineering Physics Department, University of Wisconsin.
Ambrosek, J., Anderson, M., Sridharan, K., and Allen, T. (2009). “Current Status of Knowledge of the Fluoride Salt (FLINaK) Heat Transfer,” Nuclear Technology, 165(2), 166-173.
Ambrosek, J. (2010). “Molten Chloride Salts for Heat Transfer in Nuclear Systems,” Preliminary Proposal for Ph.D. Dissertation, University of Wisconsin, Madison, WI.
Anderson M. and Sridharan K. (2010). “Liquid Salt Heat Exchanger Technology for VHTR-based Applications,” University of Wisconsin-Madison Quarterly Progress Report, January 31, 2010.
Attia, A. A., Al-Masri, A. N., and Baraka, A. M. (2003). Corrosion Prevention & Control, 50 (4), 188-200.
Baes, C. F. Jr., (1974). “The Chemistry and Thermodynamics of Molten Salt Reactor Fuels,” Journal of Nuclear Materials, 51 (1), 149-162.
Baraka, A., Abdel-Rohman, A. I., and El Hosary, A. A. (1976). “Corrosion of Mild Steel in Molten Sodium Nitrate-Potassium Nitrate Eutectic,” British Corrosion Journal, 11(1), 43-46.
Bonilla, C. F., (1958). “Comparison of Coolants,” Sec.9-3, Chapter 6.5, in Nuclear Engineering Handbook Edited by H. Etherington, McGraw Hill, NY.
Bradshaw R. W. and Siegel, N. P. (2008). “Molten nitrate salt development for thermal energy storage in parabolic trough solar power systems,” Proceedings of ES2008, Energy Sustainability 2008, August 10-14, 2008, Jacksonville, FL, pp 1-7.
Breon, S. R., Chellew, N. R., Clemmer, R. G., and Hoh, J. C. (1980). Gamma Irradiation of Nitrate-Based Salts, ANL/FPP/TM-129, Argonne National Laboratory, Argonne, IL, March 1980.
Calderoni, P., Sharpe, P., Nishimura, H., and Terai, T. (2009). “Control of molten salt corrosion of fusion structural materials by metallic beryllium,” Journal of Nuclear Materials, 386-388, 1102-1108.
Cantor, S., Ward, W. T., and Moynihan, C. T. (1969). “Viscosity and Density in Molten LiF-BeF2 Solutions,” Journal of Chemical Physics, 50(7), 2874.
Carling R. W. and Bradshaw R. W. (1986). “Review of the characterization of the molten nitrate salt for solar central receiver applications,” Proceedings of the 21st Intersociety Energy Conversion Engineering Conference, Vol. 2, 21st Intersociety Energy Conversion Engineering Conference: Advancing toward Technology Breakout in Energy Conversion, San Diego, CA, pp 834-838.
Cheng, E. T., Merrill, B. J., and Sze, D.-K. (2003). “Nuclear Aspects of Molten Blankets,” Fusion Engineering and Design, 69, 205-213.
Coastal Chemical Company, L. L. C., (2009). Brenntag Company, Houston TX, coastalchem.com/PDFs/HITECSALT/HITEC%20Transfer%20Salt.pdf.
Cramer, S. and Covino, B., editors (2003). ASM Handbook: Corrosion – Fundamentals, Testing, and Protection, Vol 13A, ASM International, Ohio, 2003, pp 216-219.
DeVan, J. H. (2004). “Section: 4. Materials Compatibility Considerations for a Molten Salt Fusion Breeder,” American Nuclear Society-Transactions, Vol. 46, pp. 210-211, 1984.
54
DeVan, J. H. and Tortorelli, P. F. (1980). “Mass-Transfer Characteristics of Nitrate-Based Salt Mixtures,” CONF-8010554, Annual Thermal Storage Meeting, McLean, VA, October 10, 1980.
Eweka, E. I. and Kerridge, D. H. (1996). “Molten sodium nitrite-sodium nitrate-potassium nitrate eutectic: The reactions and spectra of iron(III), cobalt(II), nickel(II) and copper(II) compounds,” Thermochimica Acta, 290, 133-138.
Forsberg, C. W. (2004). Reactors with Molten Salts: Options and Missions, Frederick Joliot & Otto Hahn Summer School on Nuclear Reactors, Physics and Fuels Systems, Cadarache, France, August 25-September 3, 2004.
Fukada, S., Katayama, K., Terai, T., and Sagara, A. (2007). “Recovery of Tritium from FLiBe Blanket in Fusion Reactor,” Fusion Science and Technology, 52, 677-681
Gierszewski, P., Mikic, B., and Todreas, N. (1980). “Property, Correlations for Lithium, Sodium, Helium, Flibe, and Water in Fusion Reactor Applications,” MIT Report No. PFC-RR-80-12.
Grele, M. D. and Gedeon, L. (1954). “Forced-Convection Heat-Transfer Characteristics of Molten FLiNaK Flowing in an Inconel X System,” National Advisory Committee for Aeronautics Report NACA RM E53L18.
Grimes, W. R. (1966). “Annual Progress Report of Reactor Chemistry Division for Period ending December 31, 1965,” Oak Ridge National Laboratory Report ORNL-3913.
Grimes, W. R. (1967). “Chemical Research and Development for Molten-Salt Breeder Reactors,” Oak Ridge National Laboratory Report ORNL-TM-1853.
Grimes, W. R. Grimes, Bohlmann, E. G., Meyer, A. S., and Dale, J. M. (1972). “Fuel can Coolant Chemistry,” Chapter 5 in M. W. Rosenthal, P. N. Haubenreich, and R. B. Briggs, The Development Status of Molten-Salt Breeder Reactors, Oak Ridge National Laboratory Report ORNL-4812.
Haubenreich, P. N. and Engel, J. R. (1970). “Experience with the Molten-Salt Reactor Experiment,” Nuclear Applications & Technology, 8, 118-136.
Heine, D., Heess, F., and Steiner, D. (1982). Investigation of Latent Heat Storage Materials in the Medium and High Temperature Range, PB82-259896, Commission of European Communities, Luxembourg, Institut fur Kerntechnik and Energieumwandlung, Stuttgart, Germany, August 1982; translated from the German, Untersuchung von Mittel- und Hochtemperatur-Latentwaermespeicher-Materielen, BMFT-FB-T 81-149, EUR 7062 DE, August 1981.
Hoffman, H. W. and Jones L. (1955). “Fused Salt Heat Transfer Part II: Forced Convection Heat Transfer in Circular Tubes Containing NaF-KF-LiF Eutectic,” Oak Ridge National Laboratory Report ORNL-1977.
Ingersoll, D. T., Forsberg, C. W., and MacDonald, P. E. (2007). “Trade Studies on the Liquid-Salt-Cooled Very High-Temperature Reactor: Fiscal Year 2006 Progress Report,” Oak Ridge National Laboratory Report ORNL/TM-2006/140.
Ignat’ev, V. V.,Keronovskii, Surenkov, A. I., Shcherbanyuk, O. P., Manchkha, S. P., and Smirnov, Yu. B. (1984). “Heat Exchange during the Flow of a Melt of LiF-NaF-KF Fluoride Salts in a Circular Tube,” Atomic Energy (Atomnaya Énergiya), 57(2), 560-562.
Ignat’ev, V. V., Merzlyakov, A. V., Subbotin, V. G., Panov, A. V., and Golovatov, Yu. V. (2006). “Experimental Investigation of the Physical Properties of Salt Melts containing Sodium and Lithium Fluorides and Beryllium,” Atomic Energy (Atomnaya Énergiya), 101(5), 822-829.
Jackson, J. and La Chance, M. (1954). “Resistance of cast Fe-Ni-Cr alloys to corrosion in molten neutral heat treating salts,” Transactions of the ASM, 46, 157-183.
55
Janz, G. J., Gardner, G. L., Krebs, U., and Tomkins, R. P. T. (1974). “Molten Salts: Properties of Fluorides and Mixtures, Vol. 4, Part 2, Edited by Lide, D. R., Journal of Physical and Chemical Reference Data, 3 (1), 1-151.
Janz, G. J., Tomkins, R. P. T., Allen, C. B., Gardner, G. L., Krebs, U., and Singer, S. K. (1975). “Molten Salts: Properties of Fluorides and Mixtures,” Vol. 4, Part 2. Edited by Lide, D. R., Journal of Physical and Chemical Reference Data, 4(4), 871-1178.
Janz, G. J. and Tomkins, R. P. T. (1981). “Physical Properties Data Compilations Relevant to Energy Storage: IV Molten Salts: Data on Additional Single and Multi-Component Salt Systems,” National Standard Reference Data System, National Bureau of Standards Report NSRDS-NBS 61 Part IV.
Janz, G. J. and Tomkins, R. P. T. (1983). “Molten Salts: Additional Single and Multi-Component Salt Systems,” Vol. 5, Part 2. Electrical Conductance, Density, Viscosity, and Surface Tension Data,” Journal of Physical and Chemical Reference Data, 12(3), 591-815.
Janz, G. J. (1988). “Thermodynamic and Transport Properties for Molten Salts: Correlation Equations for Critically Evaluated Density, Surface Tension, Electrical Conductance, and Viscosity Data,” J. Physical and Chemical Reference Data, 17(2), 1.
Kane, R. (2003). “Molten Salt Corrosion,” in ASM Handbook: Corrosion – Fundamentals, Testing, and Protection, Vol 13A, S. Cramer and B. Covino, editors, ASM International, 2003, pp 216-219.
Keiser, J. R. (1977). Compatibility Studies of Potential Molten-Salt Breeder Reactor Materials in Molten Fluoride Salts, ORNL/TM-5783, Oak Ridge National Laboratory, Oak Ridge, TN, May 1977.
Keiser, J. R., DeVan, J. H., and Lawrence, E. J. (1979). “Compatibility of Molten Salts with Type 316 Stainless Steel and Lithium,” Journal of Nuclear Materials, 85-86, 295-298.
Kondo, M., et al. (2009a). “Corrosion Characteristics of Reduced Activation Ferritic Steel, JLF-1 (8.92Cr-2W) in Molten Salts Flibe and Flinak,” Fusion Engineering and Design, 84, 1081-1085.
Kondo, M., et al. (2009b). “Metallurgical study on corrosion of austenitic steels in molten salt LiF-BeF2 (Flibe),” Journal of Nuclear Materials, 386-388, 685-688.
Kondo, M., et al. (2009c). “High Preformance Corrosion Resistance of Nickel-Based Alloys in Molten Salt Flibe,” Fusion Science and Technology, 56, 190-194.
Liu, B., Wu, Y.-T., Ma, C.-F., Ye, M., and Guo, H. (2009). “Turbulent Convective Heat Transfer with Molten Salt in Circular Pipe,” Int. Commun. Heat Mass Transfer, 36, 912-916.
Lovering, D. G. and Gale, R. J. (1983). Molten Salt Techniques, Volume 1, Plenum Press, New York, Chapter 1.
Mathews, A. L. and Baes, C. F., Jr. (1968). “Oxide Chemistry and Thermodynamics of Molten LiF-BeF2 Solutions,” Inorganic Chemistry, 7 (2), 373-382.
Mishra, B. (2006). “Corrosion of Metal Processing Equipment,” in ASM Handbook: Corrosion-Environments and Industries, Vol 13C, ASM International, Metals Park, OH, pp 1067-1075.
Niiger, F. V., Ozeryanaya, I. N., Bezhenar, V. P., and Marusyak, R. A. (1982). “Corrosion resistance of steels and titanium in a eutectic melt of potassium and magnesium nitrates,” Protection of Metals, 18 (1), 56-58.
Nishimura, H., et al. (2001). H. “Chemical behavior of Li2BeF4 molten salt as a liquid tritium breeder,” Fusion Engineering and Design, 58-59, 667-672.
Olander, D. (2002). “Redox condition in molten fluoride salts: Definition and control,” Journal of Nuclear Materials, 300, 270-272.
56
Olson, L. C. (2009). Material Corrosion in Molten LiF-NaF-KF Eutectic Salt, Ph.D. dissertation, University of Wisconsin, Madison, WI.
Olson, L. C., Ambrosek, J. W., Sridharan, K., Anderson, M. H., and Allen, T. R. (2009). “Materials corrosion in molten LiF-NaF-KF salt,” Journal of Fluorine Chemistry, 130, 67-73.
Ozeryanaya, I. N. (1985). “Corrosion of Metals by Molten Salts in Heat-Treatment Processes,” Metal Science and Heat Treatment, 27 (3), 184-188.
Petti, D. A., et al. (2006). “JUPITER-II molten salt Flibe research: An update on tritium, mobilization, and redox chemistry experiments,” Fusion Engineering and Design, 81, 1439-1449.
Sanders, J. P. (1971). “A Review of Possible Choices for Secondary Coolants for Molten Salt Reactors,” Oak Ridge National Laboratory Report ORNL/CF-71-8-10.
Sannier, J. and Santarini, G. (1983). “Studies of materials for molten salt nuclear applications,” CEA-CONF-6698, CONF-830427-4, International Symposium on Molten Salt Chemistry and Technology, Kyoto, Japan, April 20-22, 1983.
Simpson, M. F., et al. (2006). “Quantitative measurement of beryllium-controlled redox of hydrogen fluoride in molten Flibe,” Fusion Engineering and Design, 81, 541-547.
Singh, N. B. (2002). “Preparation of Metal Oxides and Chemistry of Oxides Ions in Nitrate Eutectic Melt,” Progress in Crystal Growth and Characterization of Materials, 44, 183-188.
Singh, N. B., et al. (1985). “Reactivity of Metal Salts in Eutectic Melts,” Journal of Scientific and Industrial Research, 44, 533-543.
Smirnov, M. V., Khoklov, V. A., and Filatov, E. S. (1987). “Thermal Conductivity of Molten Alkali Halides and their Mixtures,” Electrochimica Acta, 32(7) 1019-1026.
Sridharan, K., et al. (2008). Molten Salt Heat Transport Loop: Materials Corrosion and Heat Transfer Phenomena, Final Report, Nuclear Energy Research Initiative (NERI), University of Wisconsin, Madison, WI, July 9, 2008.
Sridharan, K. (2009). Liquid Salts as Media for Process Heat Transfer from VHTRs: Forced Convective Channel Flow Thermal Hydraulics, Materials, and Coatings, NERI 07-030, NERI Project Review, Panel No. 3, University of Wisconsin, April 11, 2009.
Terai, T., et al. (2001). “Compatibility of Structural Materials with Li2BeF4 Molten Salt Breeder,” Fusion Technology, 39, 784-788.
Vriesema, I. B. (1979). “Aspects of Molten Fluorides as Heat Transfer Agents for Power Generation,” Delft University of Technology, Delft, The Netherlands report WTHD No. 112.
Weast, R. C., editor (1977). Handbook of Chemistry and Physics, 57th edition, CRC Press, Cleveland, OH.
Williams, D. F. et al. (2001). “The Influence of Lewis Acid/Base Chemistry on the Removal of Gallium by Volatality from Weapons Grade Plutonium Dissolved in Molten Chlorides,” Nuclear Technology, 136, 367.
Williams, D. F., et al. (2003). “Research on Molten Fluorides as High Temperature Heat Transfer Agents,” Proceedings of GLOBAL 2003, New Orleans, LA, November 16-20, 2003, pp2135-2140.
Williams, D. F. and Toth, L. M. (2005). Chemical Considerations for the Selection of the Coolant for the Advanced High-Temperature Reactor, ORNL/GEN4/LTR-05-011, Oak Ridge National Laboratory, Oak Ridge, TN, September 2005.
57
Williams, D. F. (2006a). “Assessment of Candidate Molten Salt Coolants for the NGNP/NHI Heat-Transfer Loop,” Oak Ridge National Laboratory Report ORNL/TM-2006/69.
Williams, D. F., Toth, L. M., and Clarno, K. T. (2006b). Assessment of Candidate Molten Salt Coolants for the Advanced High-Temperature Reactor (AHTR), ORNL/TM-2006/12, Oak Ridge National Laboratory, Oak Ridge, TN, March 2006.
White, S. H. (1983). “Halides,” in D. G. Lovering and R. J. Gale, editors, Molten Salt Techniques, Volume 1, Chapter 2, Plenum Press, New York, 1983.
Wu, Y-T., Liu, B.,Ma, C.-F., and Guo, H. (2009). “Convective Heat Transfer in Laminar-turbulent Transition Region with Molten Salt,” Experimental Thermal and Fluid Science, 33, 1128-1132.
Yajima, K., Moriyama, H., Oishi, J., and Tominaga, Y. (1982). “Surface Tension of Lithium Fluoride and Beryllium Fluoride Binary Melt,” J. Physical Chemistry, 86, 4193.
Yamanishi, H., et al. (1998). “Design studies on nuclear properties of the Flibe blanket for helical-type fusion reactor FFHR,” Fusion Engineering and Design, 583-588.
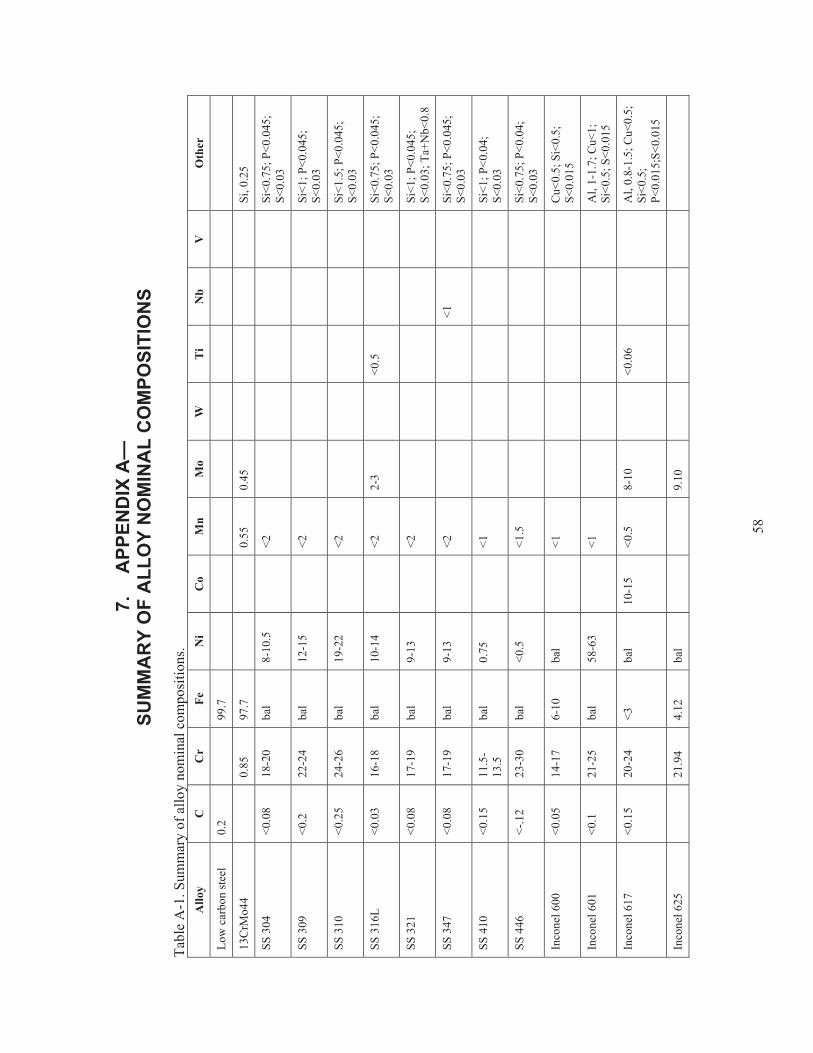
58
7.
APP
END
IX A
—
SUM
MA
RY
OF
ALL
OY
NO
MIN
AL
CO
MPO
SITI
ON
S
Tabl
e A
-1. S
umm
ary
of a
lloy
nom
inal
com
posi
tions
. A
lloy
C
Cr
Fe
Ni
Co
Mn
Mo
W
Ti
Nb
V
Oth
er
Low
car
bon
stee
l 0.
2
99.7
13C
rMo4
4
0.85
97
.7
0.55
0.
45
Si, 0
.25
SS 3
04
<0.0
8 18
-20
bal
8-10
.5
<2
Si<0
.75;
P<0
.045
; S<
0.03
SS 3
09
<0.2
22
-24
bal
12-1
5
<2
Si
<1; P
<0.0
45;
S<0.
03
SS 3
10
<0.2
5 24
-26
bal
19-2
2
<2
Si
<1.5
; P<0
.045
; S<
0.03
SS 3
16L
<0.0
3 16
-18
bal
10-1
4
<2
2-3
<0
.5
Si<0
.75;
P<0
.045
; S<
0.03
SS 3
21
<0.0
8 17
-19
bal
9-13
<2
Si
<1; P
<0.0
45;
S<0.
03; T
a+N
b<0.
8
SS 3
47
<0.0
8 17
-19
bal
9-13
<2
<1
Si<0
.75;
P<0
.045
; S<
0.03
SS 4
10
<0.1
5 11
.5-
13.5
ba
l 0.
75
<1
Si<1
; P<0
.04;
S<
0.03
SS 4
46
<-.1
2 23
-30
bal
<0.5
<1.5
Si<0
.75;
P<0
.04;
S<
0.03
Inco
nel 6
00
<0.0
5 14
-17
6-10
ba
l
<1
C
u<0.
5; S
i<0.
5;
S<0.
015
Inco
nel 6
01
<0.1
21
-25
bal
58-6
3
<1
A
l, 1-
1.7;
Cu<
1;
Si<0
.5; S
<0.0
15
Inco
nel 6
17
<0.1
5 20
-24
<3
bal
10-1
5 <0
.5
8-10
<0.0
6
A
l, 0.
8-1.
5; C
u<0.
5;
Si<0
.5;
P<0.
015;
S<0.
015
Inco
nel 6
25
21
.94
4.12
ba
l
9.
10
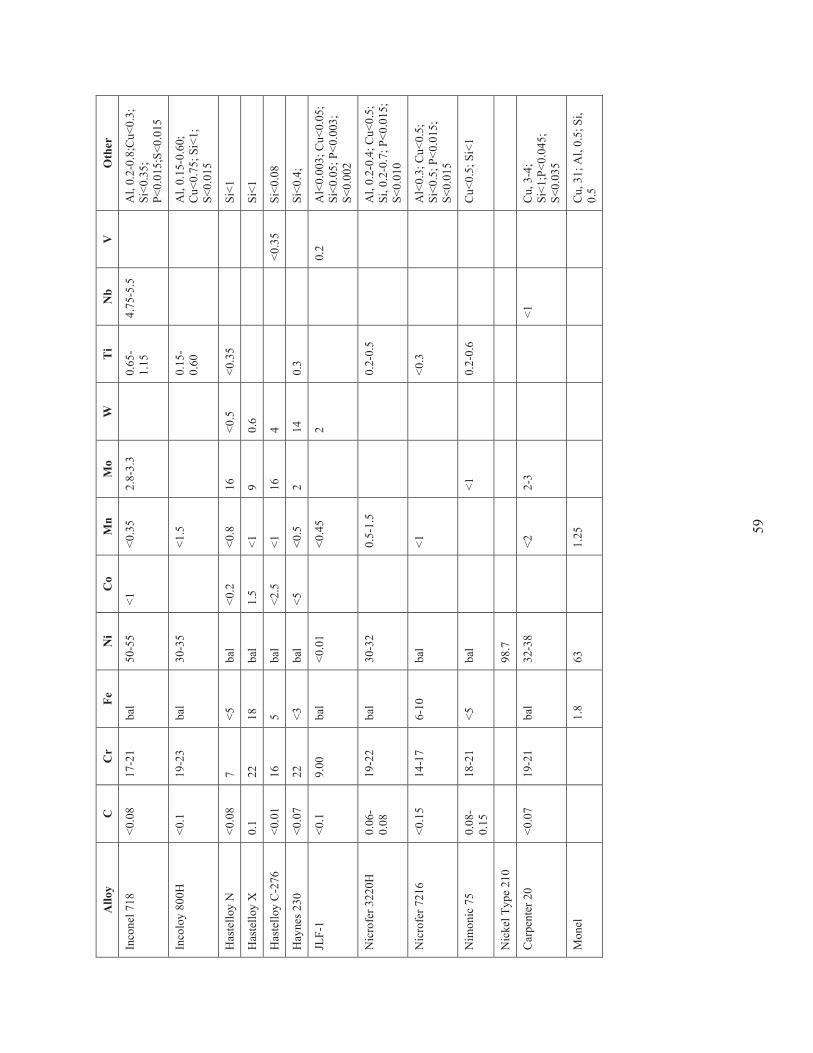
59
Allo
y C
C
r Fe
N
i C
o M
n M
o W
T
i N
b V
O
ther
Inco
nel 7
18
<0.0
8 17
-21
bal
50-5
5 <1
<0
.35
2.8-
3.3
0.
65-
1.15
4.
75-5
.5
A
l, 0.
2-0.
8;C
u<0.
3;
Si<0
.35;
P<
0.01
5;S<
0.01
5
Inco
loy
800H
<0
.1
19-2
3 ba
l 30
-35
<1
.5
0.15
-0.
60
Al,
0.15
-0.6
0;
Cu<
0.75
; Si<
1;
S<0.
015
Has
tello
y N
<0
.08
7 <5
ba
l <0
.2
<0.8
16
<0
.5
<0.3
5
Si
<1
Has
tello
y X
0.
1 22
18
ba
l 1.
5 <1
9
0.6
Si
<1
Has
tello
y C
-276
<0
.01
16
5 ba
l <2
.5
<1
16
4
<0
.35
Si<0
.08
Hay
nes 2
30
<0.0
7 22
<3
ba
l <5
<0
.5
2 14
0.
3
Si
<0.4
;
JLF-
1 <0
.1
9.00
ba
l <0
.01
<0
.45
2
0.2
Al<
0.00
3; C
u<0.
05;
Si<0
.05;
P<0
.003
; S<
0.00
2
Nic
rofe
r 322
0H
0.06
-0.
08
19-2
2 ba
l 30
-32
0.
5-1.
5
0.
2-0.
5
A
l, 0.
2-0.
4; C
u<0.
5;
Si, 0
.2-0
.7; P
<0.0
15;
S<0.
010
Nic
rofe
r 721
6 <0
.15
14-1
7 6-
10
bal
<1
<0
.3
Al<
0.3;
Cu<
0.5;
Si
<0.5
; P<0
.015
; S<
0.01
5
Nim
onic
75
0.08
-0.
15
18-2
1 <5
ba
l
<1
0.2-
0.6
Cu<
0.5;
Si<
1
Nic
kel T
ype
210
98
.7
Car
pent
er 2
0 <0
.07
19-2
1 ba
l 32
-38
<2
2-
3
<1
Cu,
3-4
; Si
<1;P
<0.0
45;
S<0.
035
Mon
el
1.8
63
1.
25
C
u, 3
1; A
l, 0.
5; S
i, 0.
5