Embed Size (px)
Citation preview

911127 Revision 0
Engineering Services for the Next Generation Nuclear Plant (NGNP) with Hydrogen Production
NGNP Parametric Fuel and Reactor Pressure Vessel Temperature Calculations
Prepared by General Atomics for the Battelle Energy Alliance, LLC
Subcontract No. 00075309 Uniform Filing Code UFC:820-3.1.2
GA Project 30302
CM Aprvd
RELEASED 2008/09/11

GA 1485 (REV. 08/06E) ISSUE/RELEASE SUMMARY
R & D DV&S DESIGN
APPVL LEVEL
DISC
QA LEVEL
SYS DOC. TYPE
PROJECT
DOCUMENT NO. REV
T&E NA 5 N I N/A RGE 30302 911127 0
TITLE: NGNP Parametric Fuel and Reactor Pressure Vessel Temperature Calculations
APPROVAL(S)
CM APPROVAL/ DATE
REV
PREPARED
BY
ENGINEERING
QA
PROJECT
REVISION DESCRIPTION/
W.O. NO.
0
M. Richards
H. Choi
A. Shenoy
K. Partain
J. Saurwein
Initial Issue A30283-0370
NEXT INDENTURED DOCUMENT(S)
N/A
CONTINUE ON GA FORM 1485-1 * See list of effective pages
COMPUTER PROGRAM PIN(S)
N/A
GA PROPRIETARY INFORMATION THIS DOCUMENT IS THE PROPERTY OF GENERAL ATOMICS. ANY TRANSMITTAL OF THIS DOCUMENT OUTSIDE GA WILL BE
IN CONFIDENCE. EXCEPT WITH THE WRITTEN CONSENT OF GA, (1) THIS DOCUMENT MAY NOT BE COPIED IN WHOLE OR IN PART AND WILL BE RETURNED UPON REQUEST OR WHEN NO LONGER NEEDED BY RECIPIENT AND (2) INFORMATION CONTAINED HEREIN MAY NOT BE COMMUNICATED TO OTHERS AND MAY BE USED BY RECIPIENT ONLY FOR THE PURPOSE FOR WHICH IT WAS TRANSMITTED.
NO GA PROPRIETARY INFORMATION
PAGE ii OF *

NGNP Parametric Fuel and Reactor Pressure Vessel Temperature Calculations 911127/0
iii
LIST OF EFFECTIVE PAGES
Page Number Page Count Revision
Cover page 1 0
ii through vi 5 0
1 through 19 19 0
Back page 1 0
Total Pages 26

NGNP Parametric Fuel and Reactor Pressure Vessel Temperature Calculations 911127/0
iv
TABLE OF CONTENTS ACRONYMS AND ABBREVIATIONS........................................................................................ vi 1. SUMMARY...........................................................................................................................1 2. CALCULATIONS FOR NORMAL OPERATING CONDITIONS ...........................................6 3. CALCULATIONS FOR ACCIDENT CONDITIONS............................................................. 10 4. REFERENCES ................................................................................................................... 19
LIST OF FIGURES
Figure 1-1. Effect of Coolant Inlet Temperature on Peak Fuel Temperature ...............................2 Figure 2-1. POKE Unit Cell Used for Thermal Analysis ..............................................................6 Figure 2-2. Axial Power Distribution Used for POKE Analyses ...................................................7 Figure 2-3. Sensitivity of Peak Fuel Temperature to Thermal Power Level (Normal Operation,
490°C inlet temperature)..................................................................................................8 Figure 2-4. Sensitivity of Peak Fuel Temperature to Thermal Power Level (Normal Operation,
590°C inlet temperature)..................................................................................................9 Figure 2-5. Sensitivity of Peak Fuel Temperature to Coolant Outlet Temperature (Normal
Operation, 490°C inlet temperature) ................................................................................9 Figure 2-6. Sensitivity of Peak Fuel Temperature to Coolant Outlet Temperature (Normal
Operation, 590°C inlet temperature) .............................................................................. 10 Figure 3-1. Sensitivity of Peak Fuel Temperature to Thermal Power Level (LPCC Event, 490°C
inlet temperature)........................................................................................................... 11 Figure 3-2. Sensitivity of Peak Fuel Temperature to Thermal Power Level (LPCC Event, 590°C
inlet temperature)........................................................................................................... 12 Figure 3-3. Sensitivity of Peak Vessel Temperature to Thermal Power Level (LPCC Event,
490°C inlet temperature)................................................................................................ 12 Figure 3-4. Sensitivity of Peak Vessel Temperature to Thermal Power Level (LPCC Event,
590°C inlet temperature)................................................................................................ 13 Figure 3-5. Sensitivity of Peak Fuel Temperature to Coolant Outlet Temperature (LPCC Event,
490°C inlet temperature)................................................................................................ 13 Figure 3-6. Sensitivity of Peak Fuel Temperature to Coolant Outlet Temperature (LPCC Event,
590°C inlet temperature)................................................................................................ 14 Figure 3-7. Sensitivity of Peak Vessel Temperature to Coolant Outlet Temperature (LPCC Event,
490°C inlet temperature)................................................................................................ 14 Figure 3-8. Sensitivity of Peak Vessel Temperature to Coolant Outlet Temperature (LPCC Event,
590°C inlet temperature)................................................................................................ 15 Figure 3-9. Transient Plot - Sensitivity of Peak Fuel Temperature to Thermal Power Level
(LPCC Event, 490°C inlet temperature) ......................................................................... 15 Figure 3-10. Transient Plot - Sensitivity of Peak Fuel Temperature to Coolant Outlet
Temperature (LPCC Event, 490°C inlet temperature) .................................................... 16 Figure 3-11. Transient Plot - Sensitivity of Peak Fuel Temperature to Thermal Power Level
(LPCC Event, 590°C inlet temperature) ......................................................................... 16 Figure 3-12. Transient Plot - Sensitivity of Peak Fuel Temperature to Coolant Outlet
Temperature (LPCC Event, 590°C inlet temperature) .................................................... 17 Figure 3-13. Transient Plot - Sensitivity of Peak Vessel Temperature to Thermal Power Level
(LPCC Event, 490°C inlet temperature) ......................................................................... 17
NGNP Parametric Fuel and Reactor Pressure Vessel Temperature Calculations 911127/0
v
Figure 3-14. Transient Plot - Sensitivity of Peak Vessel Temperature to Coolant Outlet Temperature (LPCC Event, 490°C inlet temperature) .................................................... 18
Figure 3-15. Transient Plot - Sensitivity of Peak Vessel Temperature to Thermal Power Level (LPCC Event, 590°C inlet temperature) ......................................................................... 18
Figure 3-16. Transient Plot - Sensitivity of Vessel Fuel Temperature to Coolant Outlet Temperature (LPCC Event, 590°C inlet temperature) .................................................... 19
LIST OF TABLES
Table 1-1. Parametric Calculations Results Summary - 490°C Inlet Temperature ......................4
Table 1-2. Parametric Calculations Results Summary - 590°C Inlet Temperature ......................5

NGNP Parametric Fuel and Reactor Pressure Vessel Temperature Calculations 911127/0
vi
ACRONYMS AND ABBREVIATIONS
GA General Atomics
GT-MHR Gas Turbine Modular Helium Reactor
LPCC Low Pressure Conduction Cooldown
MHR Modular Helium Reactor
NGNP Next Generation Nuclear Plant
RCCS Reactor Cavity Cooling System

NGNP Parametric Fuel and Reactor Pressure Vessel Temperature Calculations 911127/0
1
1. SUMMARY
The Next Generation Nuclear Plant (NGNP) prototype design developed by the General
Atomics (GA) team is designed to operate with a thermal power level of 600 MW and a coolant
outlet temperature up to 950°C [GA 2007]. During the initial phase of NGNP operation, it may
be desirable to operate the NGNP at less than rated power and/or with a reduced helium outlet
temperature for extended periods, in order to monitor performance of the fuel, reactor vessel,
and vessel internals before operation at full rated conditions.
This report describes parametric calculations of fuel and vessel temperatures for both normal
operation and Low Pressure Conduction Cooldown (LPCC) events. The following parametric
calculations were performed:
• For a fixed coolant outlet temperature of 950°C, the reactor thermal power was varied
from 250 MW to 600 MW in increments of 50 MW.
• For a fixed reactor thermal power level of 600 MW, the coolant outlet temperature was
varied from 750°C to 950°C in increments of 50°C.
Sensitivity to Coolant Inlet Temperature
For the GA NGNP design, coolant inlet temperatures ranging from 490°C to 590°C are being
considered. In the absence of active vessel cooling, the vessel operating temperatures are
determined in large measure by the design point selected for coolant inlet temperature
[Richards 2008]. To avoid significant risks to the NGNP schedule, it is desirable for the NGNP
reactor vessel to operate at peak temperatures below approximately 350°C, which would allow
use of SA-508/533 steel for the reactor pressure vessel [Richards 2008]. This material has
been used extensively for light water reactor pressure vessels. As discussed in [GA 2008],
operation with an inlet temperature of 490°C and inlet flow routed through risers in the
permanent side reflector offers the potential to reduce vessel operating temperatures to
approximately 350°C without active vessel cooling.
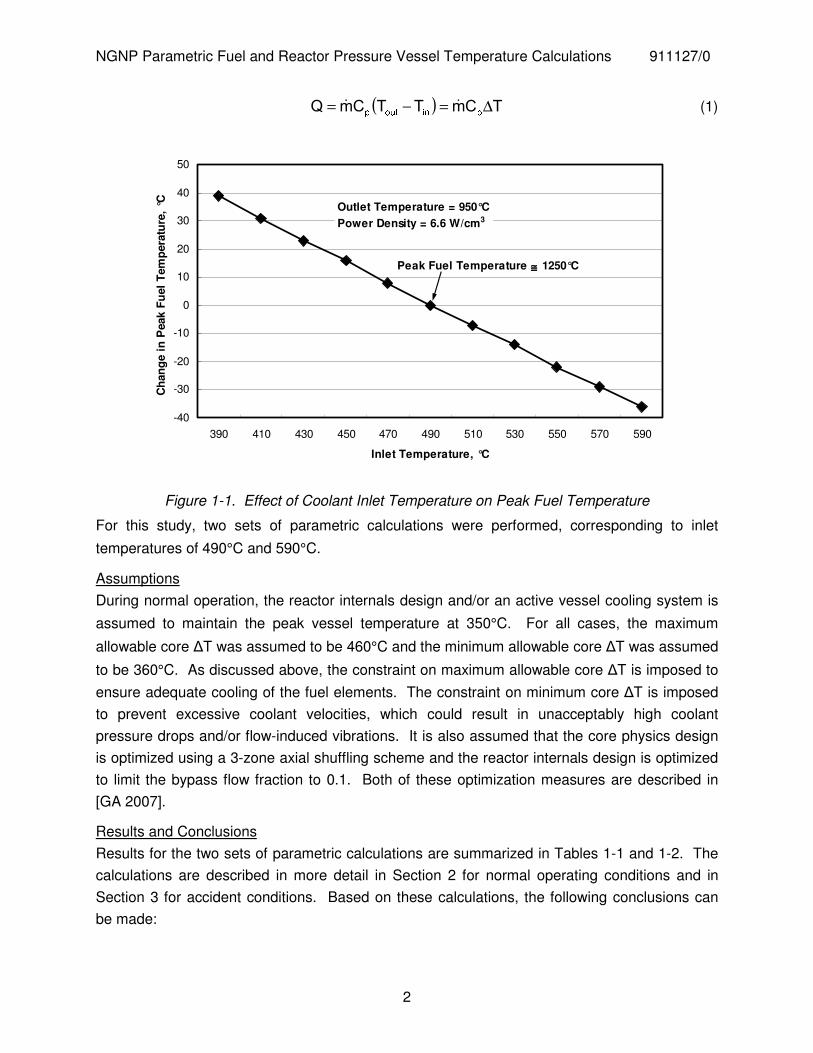
As indicated in Eq. (1), for a fixed thermal power level Q, the product of core �T and total
coolant mass flow rate � � is constant. For NGNP, the outlet temperature is expected to be a
fixed design requirement, and a decrease in inlet temperature will increase core �T and
reduce� � . As indicated in Fig. 1-1, a 100°C decrease in inlet temperature results in an
approximately 40°C increase in peak fuel temperature. Hence, one of the constraints on the
inlet temperature is ensuring adequate coolant mass flow to maintain fuel operating
temperatures at acceptable levels. The impact of higher core �T and lower � � on peak fuel
temperatures can be reduced if the core physics design is optimized to minimize power peaking
factors, which helps to flatten the distribution of flow among the fuel columns [GA 2007]. In
addition, the reactor internals design can be optimized to reduce bypass flow, which also helps
to reduce fuel temperatures during normal operation [GA 2007].
NGNP Parametric Fuel and Reactor Pressure Vessel Temperature Calculations 911127/0
2
( ) �������� �� �� � �� Δ=−= �� (1)
-40
-30
-20
-10
0
10
20
30
40
50
390 410 430 450 470 490 510 530 550 570 590
Inlet Temperature, °C
Ch
ang
e in
Pea
k F
uel
Tem
per
atu
re,
°C Outlet Temperature = 950°CPower Density = 6.6 W/cm3
Peak Fuel Temperature ≅≅≅≅ 1250°C
Figure 1-1. Effect of Coolant Inlet Temperature on Peak Fuel Temperature
For this study, two sets of parametric calculations were performed, corresponding to inlet
temperatures of 490°C and 590°C.
Assumptions
During normal operation, the reactor internals design and/or an active vessel cooling system is
assumed to maintain the peak vessel temperature at 350°C. For all cases, the maximum
allowable core �T was assumed to be 460°C and the minimum allowable core �T was assumed
to be 360°C. As discussed above, the constraint on maximum allowable core �T is imposed to
ensure adequate cooling of the fuel elements. The constraint on minimum core �T is imposed
to prevent excessive coolant velocities, which could result in unacceptably high coolant
pressure drops and/or flow-induced vibrations. It is also assumed that the core physics design
is optimized using a 3-zone axial shuffling scheme and the reactor internals design is optimized
to limit the bypass flow fraction to 0.1. Both of these optimization measures are described in
[GA 2007].
Results and Conclusions
Results for the two sets of parametric calculations are summarized in Tables 1-1 and 1-2. The
calculations are described in more detail in Section 2 for normal operating conditions and in
Section 3 for accident conditions. Based on these calculations, the following conclusions can
be made:

NGNP Parametric Fuel and Reactor Pressure Vessel Temperature Calculations 911127/0
3
1. For operation with a fixed core �T, the power-to-flow-rate ratio is constant [see Eq. (1)], and
lowering the thermal power level results in only a modest reduction in peak fuel
temperatures during normal operation. Peak fuel temperatures are reduced by about 85°C
to 90°C as the thermal power level is dropped from 600 MW to 250 MW. This modest
reduction results primarily from the slightly nonlinear relationship between the coolant
velocity and local heat-transfer coefficient.1
2. Because the decay heat rate is proportional to thermal power level during normal operation,
lowering the thermal power level results in a significant reduction in peak fuel temperatures
during a LPCC event. Peak fuel temperatures are reduced by about 460°C to 470°C as the
thermal power level is dropped from 600 MW to 250 MW.
3. For a fixed thermal power level, lowering the coolant outlet temperature by a given amount
results in nearly the same reduction in peak fuel temperature during normal operation (e.g.,
lowering the coolant outlet temperature by 200°C results in lowering the peak fuel
temperature by about 200°C.) This nearly one-to-one relationship results from peak fuel
temperatures occurring near the bottom of the core during normal operation, where the
coolant temperatures are the highest.
4. Lowering the coolant outlet temperature during normal operation results in only a small
reduction in peak fuel temperatures during LPCC events, primarily because peak fuel
temperatures occur near the axial midplane of the core during an LPCC event.
5. During LPCC events, vessel temperatures are determined largely by heat transfer to the
Reactor Cavity Cooling System (RCCS), which occurs primarily by thermal radiation.
Lowering the thermal power level or lowering the coolant outlet temperature results in only a
small reduction in peak vessel temperature during these events.
1 For turbulent flow, the Nusselt number is proportional to Reynolds number to the 0.8 power.

NGNP Parametric Fuel and Reactor Pressure Vessel Temperature Calculations 911127/0
4
Table 1-1. Parametric Calculations Results Summary - 490°°°°C Inlet Temperature
Case 1 Case 2 Case 3 Case 4 Case 5 Case 6 Case 7 Case 8 Case 9 Case 10 Case 11 Case 12
Reactor Power Level
(MWt) 600 550 500 450 400 350 300 250 600 600 600 600
Refueling Scheme
3-Zone Axial
Shuffling
3-Zone Axial
Shuffling
3-Zone Axial
Shuffling
3-Zone Axial
Shuffling
3-Zone Axial
Shuffling
3-Zone Axial
Shuffling
3-Zone Axial
Shuffling
3-Zone Axial
Shuffling
3-Zone Axial
Shuffling
3-Zone Axial
Shuffling
3-Zone Axial
Shuffling
3-Zone Axial
Shuffling
Coolant Flow Rate (kg/s) 250.4 229.5 208.7 187.8 166.9 146.1 125.2 104.3 280.9 320 320 320
Bypass Flow Fraction 0.1 0.1 0.1 0.1 0.1 0.1 0.1 0.1 0.1 0.1 0.1 0.1
Core Inlet Temp. (°C) 490 490 490 490 490 490 490 490 490 490 440 390Core Outlet Temp. (°C) 950 950 950 950 950 950 950 950 900 850 800 750
Avg. Outlet Temp. Fueled
Region (°C) 983 983 983 983 983 983 983 983 930 876 826 776
Outlet Temp. Bypass Flow
(°C) 649 649 649 649 649 649 649 649 631 614 564 514
Max. Coolant Temp. (°C) 1080 1080 1080 1080 1080 1080 1080 1080 1014 949 899 850Max. Flow Fraction 1.05 1.05 1.05 1.05 1.05 1.05 1.05 1.05 1.04 1.04 1.04 1.04
Min. Flow Fraction 0.87 0.87 0.87 0.87 0.87 0.87 0.87 0.87 0.87 0.88 0.88 0.87
Max. Graphite
Temp. (°C) 1158 1154 1149 1144 1138 1134 1130 1125 1091 1023 974 926Avg.
Graphite Temp. (°C) 833 830 827 824 821 818 816 811 799 765 716 666Max. Fuel Temp. (°C) 1247 1235 1223 1210 1198 1185 1172 1158 1181 1114 1067 1019Avg. Fuel Temp. (°C) 878 873 866 859 852 845 838 830 846 812 764 716
Max. Vessel Temp. (°C) 350 350 350 350 350 350 350 350 350 350 350 350Core Inlet Pressure
(psia) 1025 1025 1025 1025 1025 1025 1025 1025 1025 1025 1025 1025Core
Pressure Drop (psid) 5.3 4.5 3.7 3 2.4 1.8 1.35 0.94 6.4 7.96 7.52 7.09
Max. Fuel Temp. (°C) 1571 1497 1421 1344 1263 1181 1121 1111 1564 1558 1545 1533
Max. Vessel Temp. (°C) 516 497 492 492 492 492 492 492 513 511 505 500
Inlet temperature determined by constraint on minimum allowable core �T of 360°C.Max. vessel temperature during normal operation limited to 350°C through internals design and/or active vessel cooling.
Accident Conditions (TAC2D Results)
Normal Operation (Poke Results)

NGNP Parametric Fuel and Reactor Pressure Vessel Temperature Calculations 911127/0
5
Table 1-2. Parametric Calculations Results Summary - 590°°°°C Inlet Temperature
Case 1 Case 2 Case 3 Case 4 Case 5 Case 6 Case 7 Case 8 Case 9 Case 10 Case 11 Case 12
Reactor Power Level
(MWt) 600 550 500 450 400 350 300 250 600 600 600 600
Refueling Scheme
3-Zone Axial
Shuffling
3-Zone Axial
Shuffling
3-Zone Axial
Shuffling
3-Zone Axial
Shuffling
3-Zone Axial
Shuffling
3-Zone Axial
Shuffling
3-Zone Axial
Shuffling
3-Zone Axial
Shuffling
3-Zone Axial
Shuffling
3-Zone Axial
Shuffling
3-Zone Axial
Shuffling
3-Zone Axial
Shuffling
Coolant Flow Rate (kg/s) 320 293.3 266.7 240 213.3 186.7 160 133.3 320 320 320 320
Bypass Flow Fraction 0.1 0.1 0.1 0.1 0.1 0.1 0.1 0.1 0.1 0.1 0.1 0.1
Core Inlet Temp. (°C) 590 590 590 590 590 590 590 590 540 490 440 390Core Outlet Temp. (°C) 950 950 950 950 950 950 950 950 900 850 800 750
Avg. Outlet Temp. Fueled
Region (°C) 976 976 976 976 976 976 976 976 926 876 826 776
Outlet Temp. Bypass Flow
(°C) 714 714 714 714 714 714 714 714 664 614 564 514
Max. Coolant Temp. (°C) 1048 1048 1048 1048 1048 1048 1048 1048 998 949 899 850Max. Flow Fraction 1.04 1.04 1.04 1.04 1.04 1.04 1.04 1.04 1.04 1.04 1.04 1.04
Min. Flow Fraction 0.88 0.88 0.88 0.88 0.88 0.88 0.88 0.88 0.88 0.88 0.88 0.87
Max. Graphite
Temp. (°C) 1121 1117 1112 1108 1103 1098 1092 1088 1072 1023 974 926Avg.
Graphite Temp. (°C) 864 862 859 857 854 851 848 845 815 765 716 666Max. Fuel Temp. (°C) 1210 1199 1187 1175 1163 1150 1138 1124 1162 1114 1067 1019Avg. Fuel Temp. (°C) 910 904 897 891 885 878 871 864 861 812 764 716
Max. Vessel Temp. (°C) 350 350 350 350 350 350 350 350 350 350 350 350Core Inlet Pressure
(psia) 1025 1025 1025 1025 1025 1025 1025 1025 1025 1025 1025 1025Core
Pressure Drop (psid) 8.8 7.5 6.2 5.1 4 3.1 2.3 1.6 8.4 7.96 7.52 7.09
Max. Fuel Temp. (°C) 1584 1511 1436 1360 1281 1201 1119 1112 1571 1558 1545 1533
Max. Vessel Temp. (°C) 522 503 502 502 502 502 502 502 516 511 505 500
Inlet temperature determined by constraint on minimum allowable core �T of 360°C.Max. vessel temperature during normal operation limited to 350°C through internals design and/or active vessel cooling.
Accident Conditions (TAC2D Results)
Normal Operation (Poke Results)

NGNP Parametric Fuel and Reactor Pressure Vessel Temperature Calculations 911127/0
6
2. CALCULATIONS FOR NORMAL OPERATING CONDITIONS
Flow and temperature distributions were calculated using the POKE computer code [Kapernick
1993]. POKE performs a simplified thermal hydraulic analysis for a reactor configuration
consisting of a number of regions, each containing parallel coolant channels that are connected
to common inlet and outlet plenums. For the present analysis, individual columns were
modeled as regions. Each column consists of an upper reflector, a fueled section, and a lower
reflector. The code user specifies the number of axial nodes in the active core. For each
region, POKE models an average coolant channel that is coupled to an adiabatic unit cell.
Using the coolant-channel temperature as a boundary condition for convective heat transfer,
two-dimensional heat-transfer calculations are performed at each axial location in each region to
determine the moderator (graphite) and fuel temperatures. For the prismatic fuel block, the unit
cell is a right-triangular element containing one-third of the area of a fuel compact and one-sixth
the area of a coolant hole (see Figure 2-1). As indicated in Fig. 2-1, a small gap is modeled
between the fuel compact and graphite moderator. Both conduction and radiation are assumed
to occur across the gap.
Figure 2-1. POKE Unit Cell Used for Thermal Analysis
NGNP Parametric Fuel and Reactor Pressure Vessel Temperature Calculations 911127/0
7
Using calculated power distributions as input, POKE was used to calculate the flow distribution
among the columns, and the temperatures of the coolant, graphite, and fuel at each axial
location for each column. The coolant inlet temperature is assumed to persist over the length of
the upper reflector and the column outlet temperature is assumed to persist over the length of
the lower reflector. POKE also calculates the axial pressure distribution in each column and the
overall pressure drop across the core.
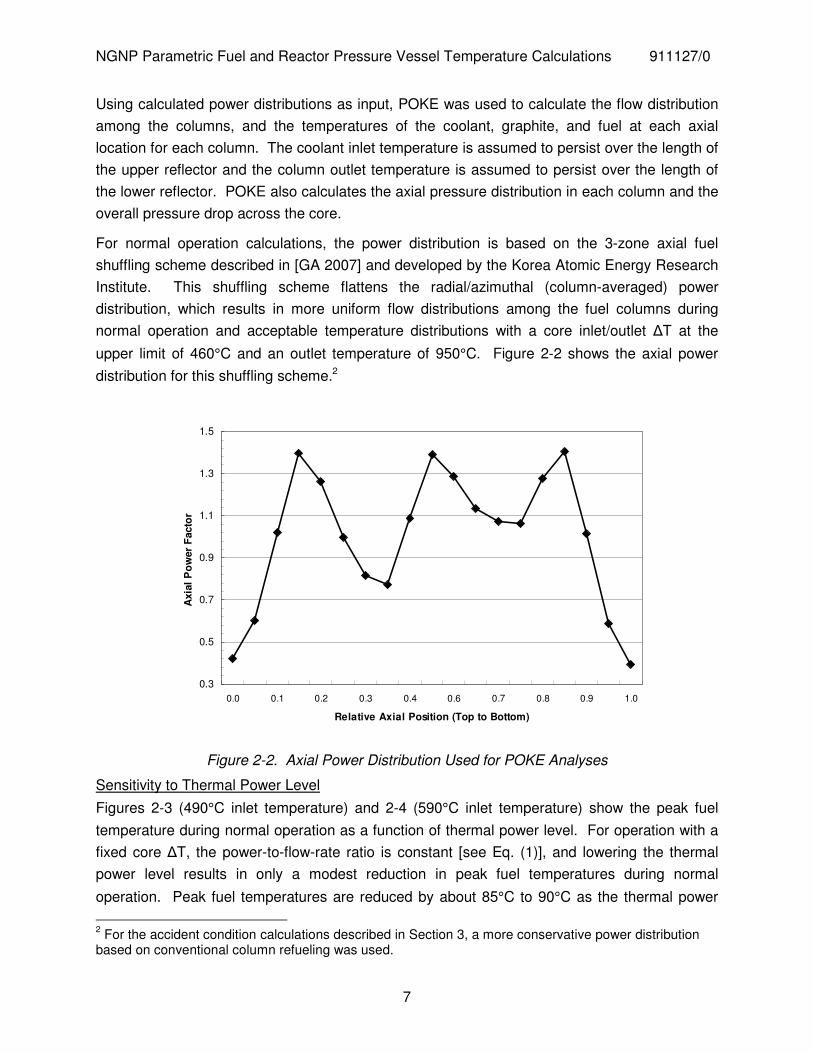
For normal operation calculations, the power distribution is based on the 3-zone axial fuel
shuffling scheme described in [GA 2007] and developed by the Korea Atomic Energy Research
Institute. This shuffling scheme flattens the radial/azimuthal (column-averaged) power
distribution, which results in more uniform flow distributions among the fuel columns during
normal operation and acceptable temperature distributions with a core inlet/outlet �T at the
upper limit of 460°C and an outlet temperature of 950°C. Figure 2-2 shows the axial power
distribution for this shuffling scheme.2
0.3
0.5
0.7
0.9
1.1
1.3
1.5
0.0 0.1 0.2 0.3 0.4 0.6 0.7 0.8 0.9 1.0
Relative Axial Position (Top to Bottom)
Axi
al P
ow
er F
acto
r
Figure 2-2. Axial Power Distribution Used for POKE Analyses
Sensitivity to Thermal Power Level
Figures 2-3 (490°C inlet temperature) and 2-4 (590°C inlet temperature) show the peak fuel
temperature during normal operation as a function of thermal power level. For operation with a
fixed core �T, the power-to-flow-rate ratio is constant [see Eq. (1)], and lowering the thermal
power level results in only a modest reduction in peak fuel temperatures during normal
operation. Peak fuel temperatures are reduced by about 85°C to 90°C as the thermal power
2 For the accident condition calculations described in Section 3, a more conservative power distribution based on conventional column refueling was used.

NGNP Parametric Fuel and Reactor Pressure Vessel Temperature Calculations 911127/0
8
level is dropped from 600 MW to 250 MW. This modest reduction results primarily from the
slightly nonlinear relationship between the coolant velocity and local heat-transfer coefficient.
As discussed in Section 1, the maximum vessel temperature during normal operation is
assumed to be limited to 350°C by means of reactor internals design and/or use of active vessel
cooling.
1140
1160
1180
1200
1220
1240
1260
250 300 350 400 450 500 550 600
Module Thermal Power, MW
Pea
k F
uel
Tem
per
atu
re,
°C
Inlet Temperature = 490°COutlet Temperature = 950°CBypass Flow Fraction = 0.1
Normal Operation
Figure 2-3. Sensitivity of Peak Fuel Temperature to Thermal Power Level (Normal Operation, 490°C inlet temperature)
Sensitivity to Coolant Outlet Temperature
Figures 2-5 (490°C inlet temperature) and 2-6 (590°C inlet temperature) show the peak fuel
temperature during normal operation as a function of coolant outlet temperature at a fixed
thermal power level of 600 MW. For a fixed thermal power level, lowering the coolant outlet
temperature by a given amount results in nearly the same reduction in peak fuel temperature
during normal operation, e.g., lowering the coolant outlet temperature by 200°C results in
lowering the peak fuel temperature by about 200°C. This nearly one-to-one relationship results
from peak fuel temperatures occurring near the bottom of the core during normal operation,
where the coolant temperatures are the highest.

NGNP Parametric Fuel and Reactor Pressure Vessel Temperature Calculations 911127/0
9
1120
1130
1140
1150
1160
1170
1180
1190
1200
1210
1220
250 300 350 400 450 500 550 600
Module Thermal Power, MW
Pea
k F
uel
Tem
per
atu
re,
°C
Inlet Temperature = 590°COutlet Temperature = 950°CBypass Flow Fraction = 0.1
Normal Operation
Figure 2-4. Sensitivity of Peak Fuel Temperature to Thermal Power Level (Normal Operation, 590°C inlet temperature)
950
1000
1050
1100
1150
1200
1250
1300
750 800 850 900 950
Coolant Outlet Temperature, °C
Pea
k F
uel
Tem
per
atu
re,
°C
Module Thermal Power = 600 MWBypass Flow Fraction = 0.1
Normal Operation
Coolant Inlet Temperature, °C
390 440 490 490 490
Figure 2-5. Sensitivity of Peak Fuel Temperature to Coolant Outlet Temperature (Normal Operation, 490°C inlet temperature)

NGNP Parametric Fuel and Reactor Pressure Vessel Temperature Calculations 911127/0
10
950
1000
1050
1100
1150
1200
1250
750 800 850 900 950
Coolant Outlet Temperature, °C
Pea
k F
uel
Tem
per
atu
re,
°C
Module Thermal Power = 600 MWBypass Flow Fraction = 0.1
Normal Operation
Coolant Inlet Temperature, °C
390 440 490 540 590
Figure 2-6. Sensitivity of Peak Fuel Temperature to Coolant Outlet Temperature (Normal Operation, 590°C inlet temperature)
3. CALCULATIONS FOR ACCIDENT CONDITIONS
Calculations for the LPCC events were performed using the TAC2D code [Boonstra 1976].
TAC2D is a legacy GA computer code that has been used for a wide variety of thermal analyses,
including safety analyses to support Modular Helium Reactor (MHR) designs. For these
calculations, a previous TAC2D model for the 600 MWt Gas Turbine Modular Helium Reactor
(GT-MHR) design was used, with appropriate modifications to input parameters and initial
conditions for the various parametric cases.
The baseline GT-MHR model includes the following features:
• 2-dimensional R-Z geometry model of the GT-MHR
• Thermal property data of all the internal materials including a thermal annealing model
for graphite thermal conductivity
• Radial and axial power shape factors for the active core
• Fast neutron fluence data
• Decay heat data
• Steady-state temperature distribution for a GT-MHR operating with a reactor inlet/outlet
temperatures of 490°C/850°C
• RCCS model with multi-dimensional radiation heat transfer

NGNP Parametric Fuel and Reactor Pressure Vessel Temperature Calculations 911127/0
11
The R-Z model of the GT-MHR is composed of 91 radial and 153 axial grid lines, ranging from 0
to 23.4 m in the radial direction and 0 to 49.7 m in the axial direction. A total of 228 blocks were
defined to specify the material types of for all components, including the reactor vessel, reactor
internals, structural concrete, and surrounding earth. The geometry data and material
properties of the GT-MHR were used without any modification for these parametric calculations.
Other input parameters, including fast neutron fluence, decay heat, and initial temperature
distribution were adjusted depending on the reactor power level, reactor inlet/outlet
temperatures, and the results of POKE calculations for active core temperatures during normal
operation.
Sensitivity to Thermal Power Level
Figures 3-1 (490°C inlet temperature) and 3-2 (590°C inlet temperature) show the peak fuel
temperature during an LPCC event as a function of thermal power level. Because the decay
heat rate is proportional to thermal power level during normal operation, lowering the thermal
power level results in a significant reduction in peak fuel temperatures during a LPCC event.
Peak fuel temperatures are reduced by about 460°C to 470°C as the thermal power level is
dropped from 600 MW to 250 MW. The change in slope below a power level of 300 MWt is
probably the result of reduced annealing of the graphite thermal conductivity at lower
temperatures.
1100
1200
1300
1400
1500
1600
250 300 350 400 450 500 550 600
Module Thermal Power, MW
Pea
k F
uel
Tem
per
atu
re,
°C
Inlet Temperature = 490°COutlet Temperature = 950°C
Low Pressure Conduction Cooldown
Figure 3-1. Sensitivity of Peak Fuel Temperature to Thermal Power Level (LPCC Event, 490°C inlet temperature)

NGNP Parametric Fuel and Reactor Pressure Vessel Temperature Calculations 911127/0
12
1100
1200
1300
1400
1500
1600
250 300 350 400 450 500 550 600
Module Thermal Power, MW
Pea
k F
uel
Tem
per
atu
re,
°C
Inlet Temperature = 590°COutlet Temperature = 950°C
Low Pressure Conduction Cooldown
Figure 3-2. Sensitivity of Peak Fuel Temperature to Thermal Power Level (LPCC Event, 590°C inlet temperature)
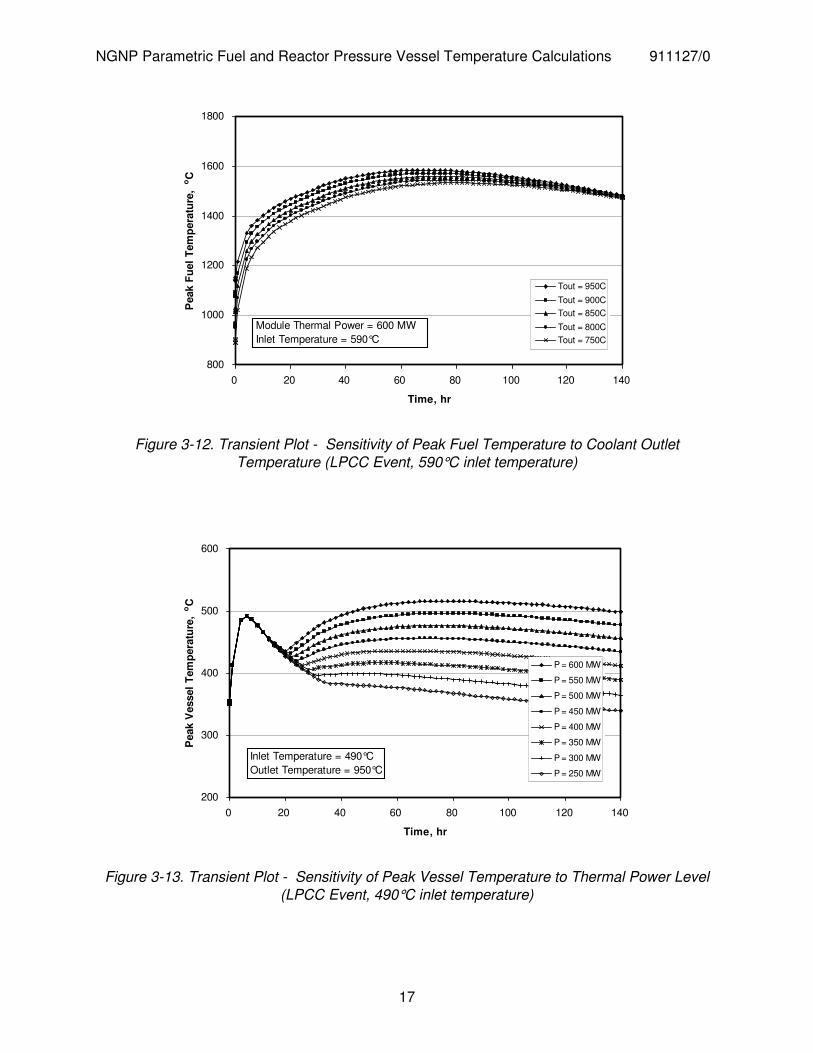
Figures 3-3 (490°C inlet temperature) and 3-4 (590°C inlet temperature) show the peak vessel
temperature during an LPCC event as a function of thermal power level. During LPCC events,
vessel temperatures are determined largely by heat transfer to the Reactor Cavity Cooling
System (RCCS), which occurs primarily by thermal radiation. Lowering the thermal power level
results in only a relatively small reduction in peak vessel temperature during these events. At
power levels below about 500 MWt, the peak vessel temperatures occur early in the transient
and are approximately the same (see Figs. 3-13 and 3-15).
480
490
500
510
520
530
540
250 300 350 400 450 500 550 600
Module Thermal Power, MW
Pea
k V
esse
l T
emp
erat
ure
, °C
Inlet Temperature = 490°COutlet Temperature = 950°C
Low Pressure Conduction Cooldown
Figure 3-3. Sensitivity of Peak Vessel Temperature to Thermal Power Level (LPCC Event, 490°C inlet temperature)

NGNP Parametric Fuel and Reactor Pressure Vessel Temperature Calculations 911127/0
13
480
490
500
510
520
530
540
250 300 350 400 450 500 550 600
Module Thermal Power, MW
Pea
k V
esse
l T
emp
erat
ure
, °C
Inlet Temperature = 590°COutlet Temperature = 950°C
Low Pressure Conduction Cooldown
Figure 3-4. Sensitivity of Peak Vessel Temperature to Thermal Power Level (LPCC Event, 590°C inlet temperature)
Sensitivity to Coolant Outlet Temperature
Figures 3-5 (490°C inlet temperature) and 3-6 (590°C inlet temperature) show the peak fuel
temperature during an LPCC event as a function of coolant outlet temperature at a fixed thermal
power level of 600 MW. Lowering the coolant outlet temperature during normal operation
results in only a small reduction in peak fuel temperatures during LPCC events, primarily
because peak fuel temperatures occur near the axial midplane of the core during an LPCC
event.
1520
1530
1540
1550
1560
1570
1580
750 800 850 900 950
Coolant Outlet Temperature, °C
Pea
k F
uel
Tem
per
atu
re,
°C
Module Thermal Power = 600 MW
Low Pressure Conduction Cooldown
Coolant Inlet Temperature, °C
390 440 490 490 490
Figure 3-5. Sensitivity of Peak Fuel Temperature to Coolant Outlet Temperature (LPCC Event, 490°C inlet temperature)
NGNP Parametric Fuel and Reactor Pressure Vessel Temperature Calculations 911127/0
14
1520
1530
1540
1550
1560
1570
1580
1590
750 800 850 900 950
Coolant Outlet Temperature, °C
Pea
k F
uel
Tem
per
atu
re,
°C
Module Thermal Power = 600 MW
Low Pressure Conduction Cooldown
Coolant Inlet Temperature, °C
390 440 490 540 590
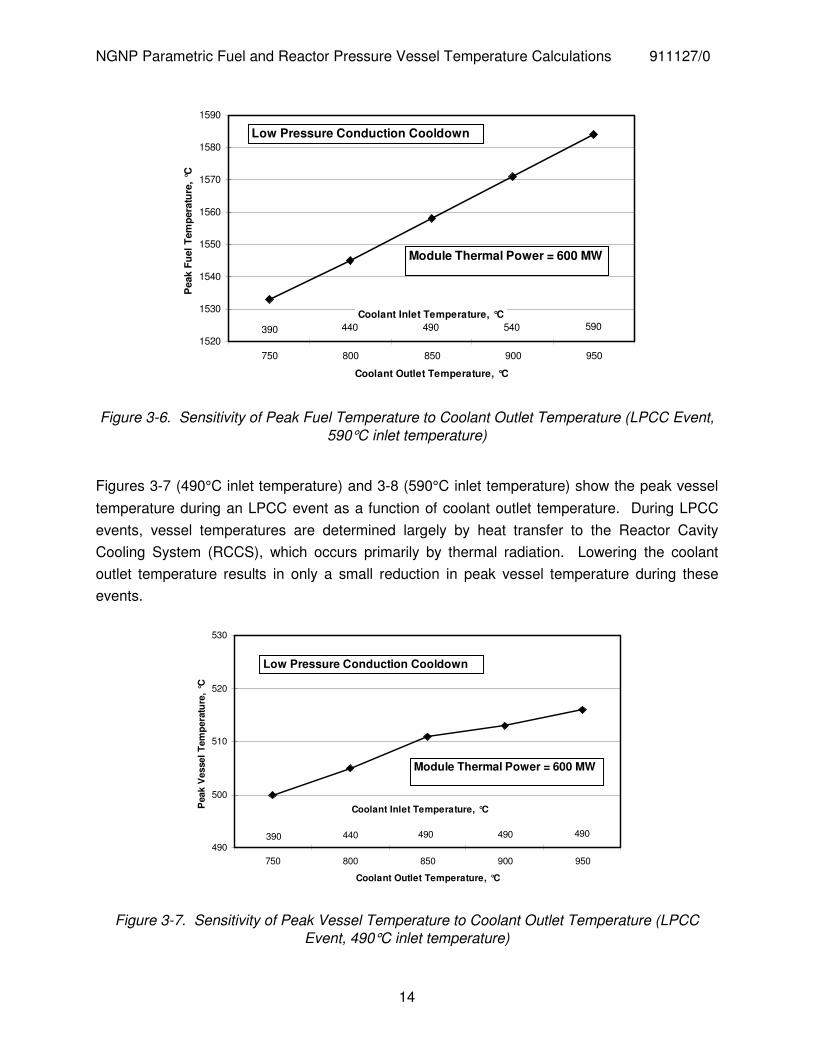
Figure 3-6. Sensitivity of Peak Fuel Temperature to Coolant Outlet Temperature (LPCC Event, 590°C inlet temperature)
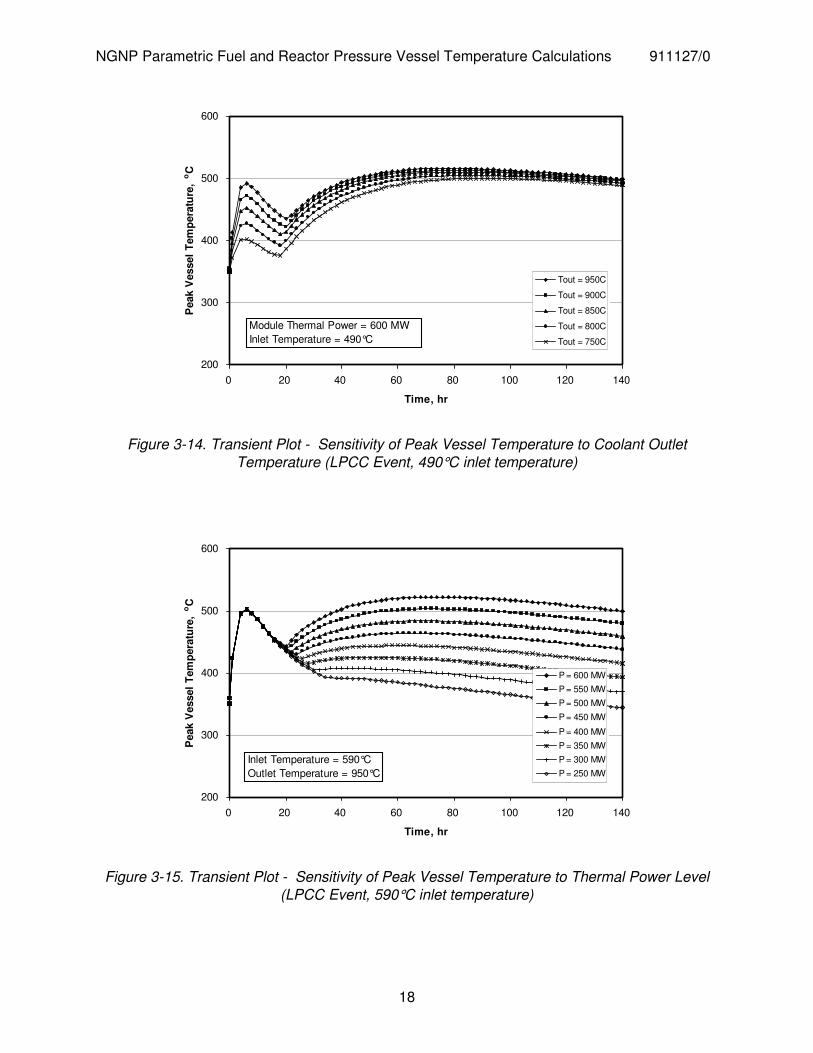
Figures 3-7 (490°C inlet temperature) and 3-8 (590°C inlet temperature) show the peak vessel
temperature during an LPCC event as a function of coolant outlet temperature. During LPCC
events, vessel temperatures are determined largely by heat transfer to the Reactor Cavity
Cooling System (RCCS), which occurs primarily by thermal radiation. Lowering the coolant
outlet temperature results in only a small reduction in peak vessel temperature during these
events.
490
500
510
520
530
750 800 850 900 950
Coolant Outlet Temperature, °C
Pea
k V
esse
l T
emp
erat
ure
, °C
Module Thermal Power = 600 MW
Low Pressure Conduction Cooldown
Coolant Inlet Temperature, °C
390 440 490 490 490
Figure 3-7. Sensitivity of Peak Vessel Temperature to Coolant Outlet Temperature (LPCC Event, 490°C inlet temperature)

NGNP Parametric Fuel and Reactor Pressure Vessel Temperature Calculations 911127/0
15
490
500
510
520
530
750 800 850 900 950
Coolant Outlet Temperature, °C
Pea
k V
esse
l T
emp
erat
ure
, °C
Module Thermal Power = 600 MW
Low Pressure Conduction Cooldown
Coolant Inlet Temperature, °C
390 440 490 540 590
Figure 3-8. Sensitivity of Peak Vessel Temperature to Coolant Outlet Temperature (LPCC Event, 590°C inlet temperature)
Transient Plots
Transient plots for the parametric cases are shown in Figs. 3-9 through 3-16.
800
1000
1200
1400
1600
1800
0 20 40 60 80 100 120 140
Time, hr
Pea
k F
uel
Tem
per
atu
re,
oC
P = 600 MW
P = 550 MW
P = 500 MW
P = 450 MW
P = 400 MW
P = 350 MW
P = 300 MW
P = 250 MW
Inlet Temperature = 490°COutlet Temperature = 950°C
Figure 3-9. Transient Plot - Sensitivity of Peak Fuel Temperature to Thermal Power Level (LPCC Event, 490°C inlet temperature)

NGNP Parametric Fuel and Reactor Pressure Vessel Temperature Calculations 911127/0
16
800
1000
1200
1400
1600
1800
0 20 40 60 80 100 120 140
Time, hr
Pea
k F
uel
Tem
per
atu
re,
oC
Tout = 950C
Tout = 900C
Tout = 850CTout = 800C
Tout = 750C
Module Thermal Power = 600 MWInlet Temperature = 490°C
Figure 3-10. Transient Plot - Sensitivity of Peak Fuel Temperature to Coolant Outlet Temperature (LPCC Event, 490°C inlet temperature)
800
1000
1200
1400
1600
1800
0 20 40 60 80 100 120 140
Time, hr
Pea
k F
uel
Tem
per
atu
re,
oC
P = 600 MW
P = 550 MW
P = 500 MW
P = 450 MW
P = 400 MW
P = 350 MW
P = 300 MW
P = 250 MW
Inlet Temperature = 590°COutlet Temperature = 950°C
Figure 3-11. Transient Plot - Sensitivity of Peak Fuel Temperature to Thermal Power Level (LPCC Event, 590°C inlet temperature)
NGNP Parametric Fuel and Reactor Pressure Vessel Temperature Calculations 911127/0
17
800
1000
1200
1400
1600
1800
0 20 40 60 80 100 120 140
Time, hr
Pea
k F
uel
Tem
per
atu
re,
oC
Tout = 950C
Tout = 900C
Tout = 850C
Tout = 800C
Tout = 750C
Module Thermal Power = 600 MWInlet Temperature = 590°C
Figure 3-12. Transient Plot - Sensitivity of Peak Fuel Temperature to Coolant Outlet Temperature (LPCC Event, 590°C inlet temperature)
200
300
400
500
600
0 20 40 60 80 100 120 140
Time, hr
Pea
k V
esse
l T
emp
erat
ure
,oC
P = 600 MW
P = 550 MW
P = 500 MW
P = 450 MW
P = 400 MW
P = 350 MW
P = 300 MW
P = 250 MW
Inlet Temperature = 490°COutlet Temperature = 950°C
Figure 3-13. Transient Plot - Sensitivity of Peak Vessel Temperature to Thermal Power Level (LPCC Event, 490°C inlet temperature)
NGNP Parametric Fuel and Reactor Pressure Vessel Temperature Calculations 911127/0
18
200
300
400
500
600
0 20 40 60 80 100 120 140
Time, hr
Pea
k V
esse
l T
emp
erat
ure
,oC
Tout = 950C
Tout = 900C
Tout = 850C
Tout = 800C
Tout = 750C
Module Thermal Power = 600 MWInlet Temperature = 490°C
Figure 3-14. Transient Plot - Sensitivity of Peak Vessel Temperature to Coolant Outlet Temperature (LPCC Event, 490°C inlet temperature)
200
300
400
500
600
0 20 40 60 80 100 120 140
Time, hr
Pea
k V
esse
l T
emp
erat
ure
,oC
P = 600 MW
P = 550 MW
P = 500 MW
P = 450 MW
P = 400 MW
P = 350 MW
P = 300 MW
P = 250 MW
Inlet Temperature = 590°COutlet Temperature = 950°C
Figure 3-15. Transient Plot - Sensitivity of Peak Vessel Temperature to Thermal Power Level (LPCC Event, 590°C inlet temperature)

NGNP Parametric Fuel and Reactor Pressure Vessel Temperature Calculations 911127/0
19
200
300
400
500
600
0 20 40 60 80 100 120 140
Time, hr
Pea
k V
esse
l T
emp
erat
ure
,oC
Tout = 950C
Tout = 900C
Tout = 850C
Tout = 800C
Tout = 750C
Module Thermal Power = 600 MWInlet Temperature = 590°C
Figure 3-16. Transient Plot - Sensitivity of Vessel Fuel Temperature to Coolant Outlet Temperature (LPCC Event, 590°C inlet temperature)
4. REFERENCES
[Boonstra 1976] R. Boonstra, “TAC2D – A General Purpose Two-Dimensional Heat
Transfer Computer Code,” GA-A14032, General Atomics, San Diego, CA, July 1976.
[GA 2007] “NGNP and Hydrogen Production Preconceptual Design Studies Report,”
RGE 911107, Rev. 0, General Atomics, San Diego, CA, July 2007. [GA 2008] “RPV and IHX Pressure Vessel Alternatives Study Report,” RGE 911118,
Rev. 0, General Atomics, San Diego, CA, April 2008. [Kapernick 1993] R. Kapernick, “POKE User’s Manual,” CEGA-002928, General Atomics,
San Diego, CA, November 1993. [Richards 2008] “White Paper – Characterizing the Effect of NGNP Operating Conditions
on the Uncertainty of Meeting Project Cost and Schedule Objectives,” PC-000566, Rev. 0, General Atomics, San Diego, CA, April 2008.

P.O. BOX 85608 SAN DIEGO, CA 92186-5608 (858) 455-3000