Embed Size (px)
Citation preview

English/US
Application GuideVolume 3 - Cardiac Imaging
Achieva / Panorama Release 3.2 series

PHILIPS MR 0-1
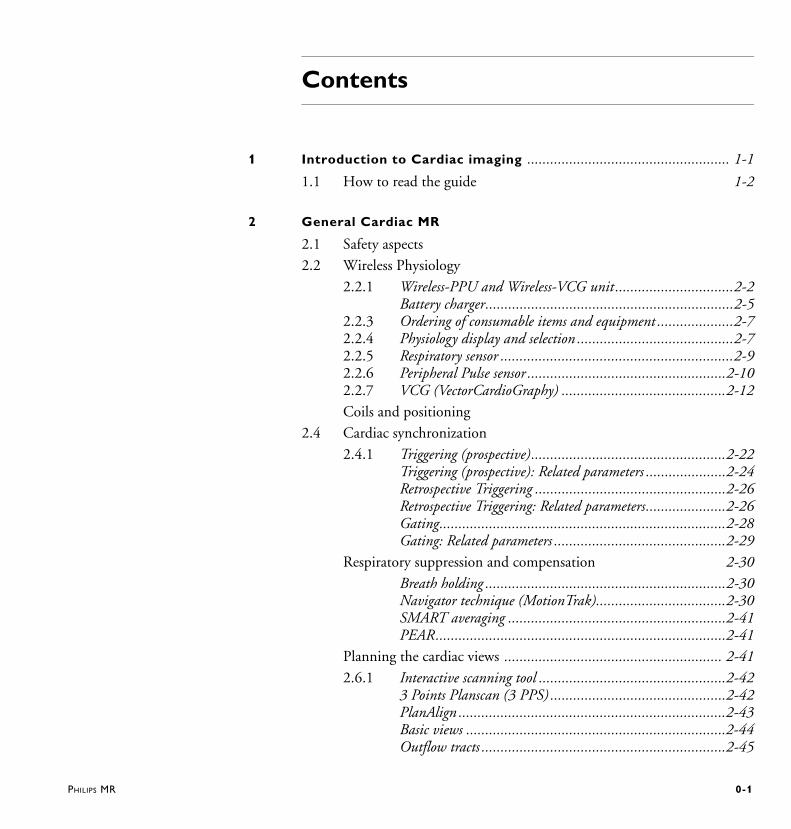
Contents
1 Introduction to Cardiac imaging ..................................................... 1-1
1.1 How to read the guide 1-2
2 General Cardiac MR
2.1 Safety aspects2.2 Wireless Physiology
2.2.1 Wireless-PPU and Wireless-VCG unit...............................2-2Battery charger.................................................................2-5
2.2.3 Ordering of consumable items and equipment ....................2-72.2.4 Physiology display and selection .........................................2-72.2.5 Respiratory sensor .............................................................2-92.2.6 Peripheral Pulse sensor ....................................................2-102.2.7 VCG (VectorCardioGraphy) ...........................................2-12Coils and positioning
2.4 Cardiac synchronization2.4.1 Triggering (prospective)...................................................2-22
Triggering (prospective): Related parameters .....................2-24Retrospective Triggering ..................................................2-26Retrospective Triggering: Related parameters.....................2-26Gating...........................................................................2-28Gating: Related parameters .............................................2-29
Respiratory suppression and compensation 2-30Breath holding ...............................................................2-30Navigator technique (MotionTrak)..................................2-30SMART averaging .........................................................2-41PEAR............................................................................2-41
Planning the cardiac views ......................................................... 2-412.6.1 Interactive scanning tool .................................................2-42
3 Points Planscan (3 PPS) ..............................................2-42PlanAlign ......................................................................2-43Basic views ....................................................................2-44Outflow tracts ................................................................2-45
0-2
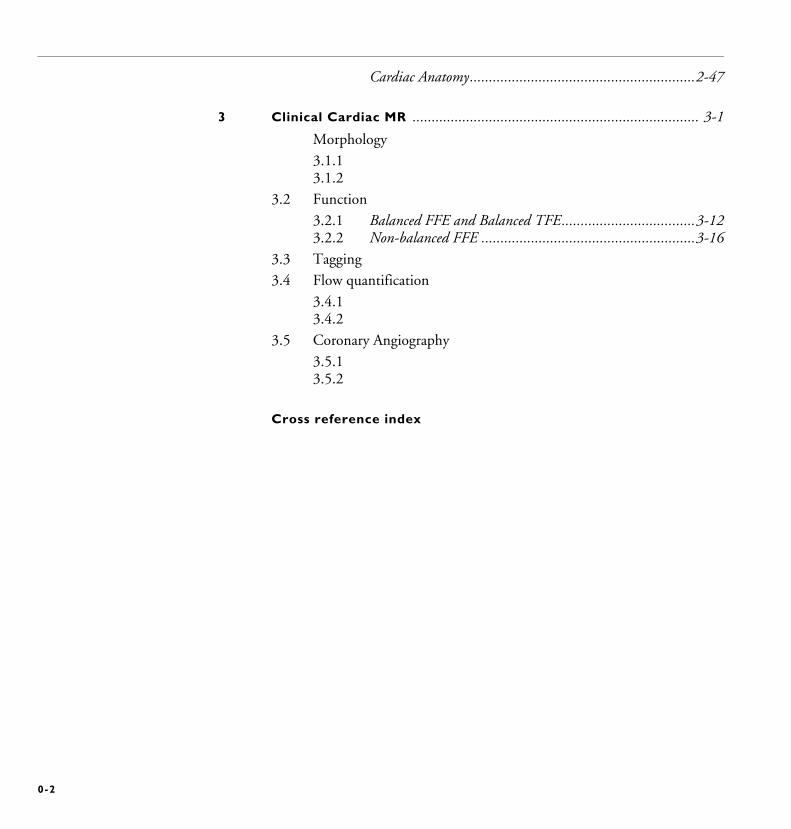
Cardiac Anatomy...........................................................2-47
3 Clinical Cardiac MR ........................................................................... 3-1
Morphology3.1.13.1.2
3.2 Function3.2.1 Balanced FFE and Balanced TFE...................................3-123.2.2 Non-balanced FFE ........................................................3-16
3.3 Tagging3.4 Flow quantification
3.4.13.4.2
3.5 Coronary Angiography3.5.13.5.2
Cross reference index
PHILIPS MR
Cardiac Imaging
1 Introduction to Cardiac imaging
This guide provides information about general cardiac MR and different types of Clinical Cardiac MR examinations.Users of MR imaging systems are confronted with a multitude of parameters and methods. The purpose of this Application Guide is to assist users in optimizing the use of their Intera Achieva system for their specific demands. The set-up of this guide is described in the section: How to read the Guide.
WA R N I N G Before using the system, it is essential that you read and familiarize yourself with all
Warnings and Cautions given in chapter 2, General safety, of the Instructions for Use
of your system release.
If you have ideas, comments, proposals etc. to improve the quality of subsequent editions of this guide, you are kindly invited to send us your remarks. This information can be given to your Application Specialist or directly to:
Copies can only be obtained from your Sales, Service or Application representatives.
Philips Medical Systems
MR Product Application
Att: Application Guide
P.O. Box 10000
5680 DA Best
The Netherlands
or for the USA only:
22100 Bothell Everett Highway
P.O. Box 3003
Bothell, Washington 98041-3003

PHILIPS MR
1.1 How to read the guideThe Application Guide has been made to provide information to users on different levels of complexity and consists of:• Volume 1: Basics
Volume 2: Scan methodsVolume 3: Cardiac ImagingVolume 4: MR Spectroscopy.
Basic MR physics and information which can be found in general textbooks are not dealt with in this guide.
2 General Cardiac MR
2.1 Safety aspects
WA R N I N G Before you start using any of the coils, refer to the ’Instructions for Use’ for full
information on safety aspects.
Do not use the VCG signal for monitoring or diagnostic purposes.
Only use MR safe ECG electrodes.
The use of other types of ECG electrodes may cause heating of the skin. Ask your local appliation representative for MR safe ECG electrodes.
For best results, it is recommended to use the Philips M2202A radio translucent foam monitoring electrode. (http://shop.medical.philips.com
Do not use ECG electrodes after they have reached their expiration date.
Old electrodes can be dried out, which will result in bad electrical contact.
Never reposition or reuse ECG electrodes. Always use new electrodes.
Do not use pediatric ECG electrodes on adults and vice versa.
Do not place the VCG battery module (VCG or PPU unit) directly on the patient’s
skin.
Direct contact may cause heating of the skin. Keep a distance to the patient’s skin of at least 1 cm using pads of the standard accessory set.
This may cause image artifacts.
Proper patient preparation is essential for the prevention of skin burns. Low
resistance of the electrodes must be guaranteed. The instructions must be followed
carefully.
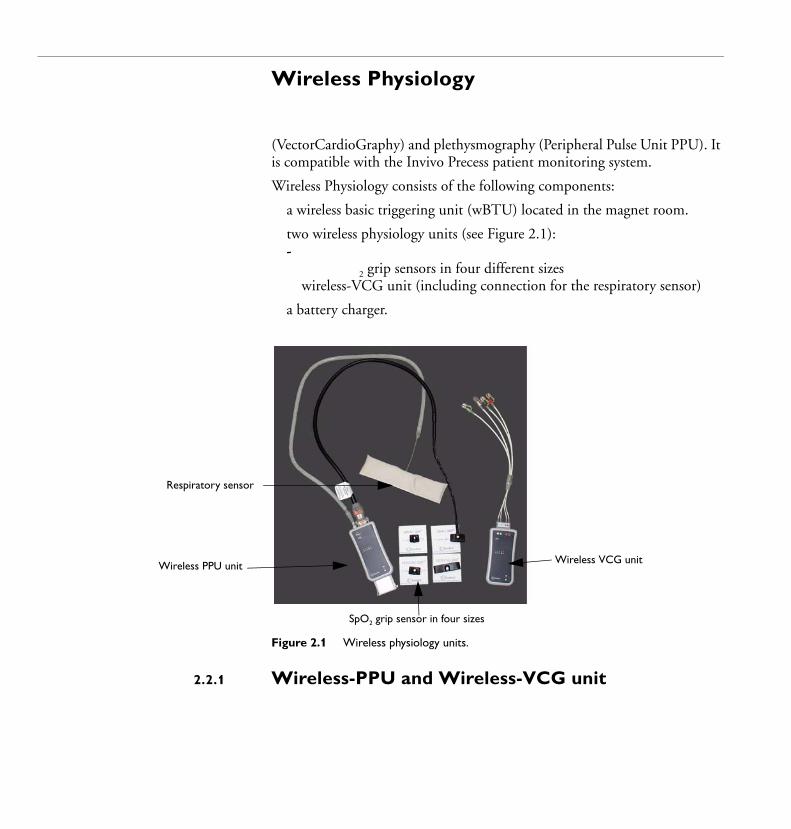
Wireless Physiology
(VectorCardioGraphy) and plethysmography (Peripheral Pulse Unit PPU). It is compatible with the Invivo Precess patient monitoring system.
Wireless Physiology consists of the following components:
a wireless basic triggering unit (wBTU) located in the magnet room.
two wireless physiology units (see Figure 2.1):-
2 grip sensors in four different sizeswireless-VCG unit (including connection for the respiratory sensor)
a battery charger.
Figure 2.1 Wireless physiology units.
2.2.1 Wireless-PPU and Wireless-VCG unit
Wireless PPU unit Wireless VCG unit
Respiratory sensor
SpO2 grip sensor in four sizes
PHILIPS MR 2-3
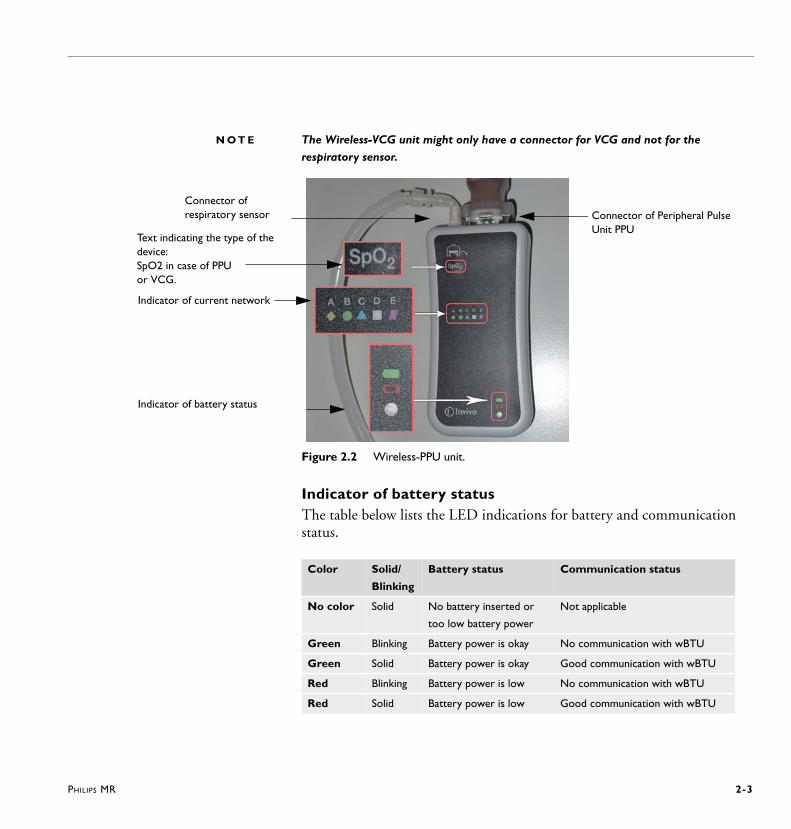
N O T E The Wireless-VCG unit might only have a connector for VCG and not for the
respiratory sensor.
Figure 2.2 Wireless-PPU unit.
Indicator of battery statusThe table below lists the LED indications for battery and communication status.
Connector of Peripheral Pulse Unit PPU
Connector of respiratory sensor
Indicator of current network
Indicator of battery status
Text indicating the type of the device: SpO2 in case of PPU or VCG.
Color Solid/
Blinking
Battery status Communication status
No color Solid No battery inserted or
too low battery power
Not applicable
Green Blinking Battery power is okay No communication with wBTU
Green Solid Battery power is okay Good communication with wBTU
Red Blinking Battery power is low No communication with wBTU
Red Solid Battery power is low Good communication with wBTU

2-4 PHILIPS MR
Exchanging battery1
2
Figure 2.3 Left: Pressing on battery levers and sliding battery out of wireless unit.
Right: Wireless unit from the back with battery removed.
N O T E
network A, B, C, D or E as adjusted in the wBTU so that wireless communication is
enabled. The procedure is described in the paragraph below.
Selecting wireless network
N O T E S The network on the wireless device has to be selected only once by service people
during device installation.
The network selection is persistent.
The network has to be selected in the Physiology Properties window on the MR
console, see Figure 2.6.
1
2
3
4
5
PHILIPS MR 2-5
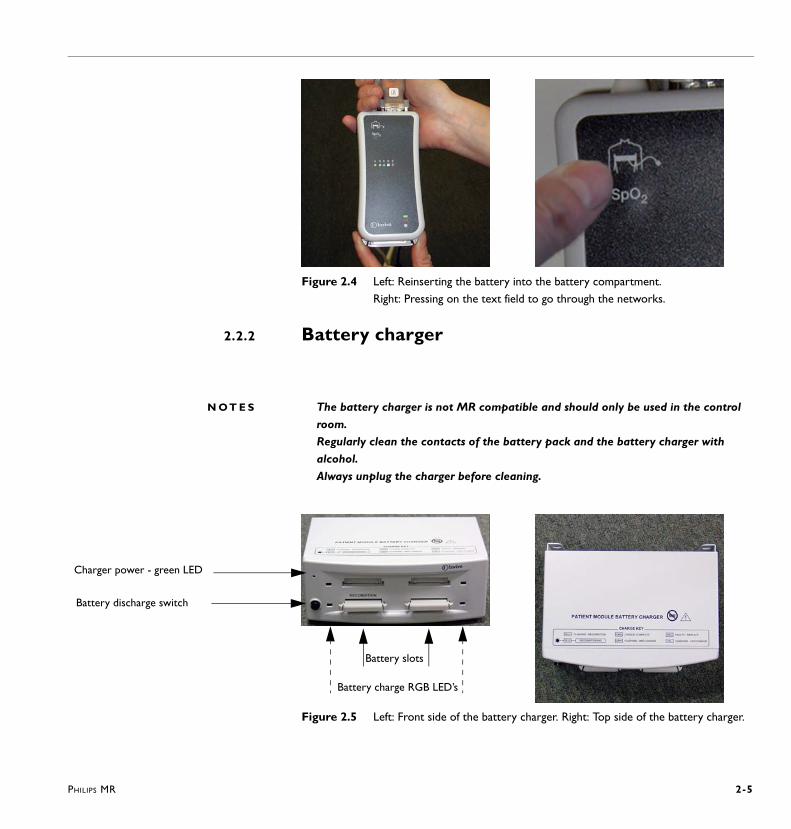
Figure 2.4 Left: Reinserting the battery into the battery compartment.
Right: Pressing on the text field to go through the networks.
2.2.2 Battery charger
N O T E S The battery charger is not MR compatible and should only be used in the control
room.
Regularly clean the contacts of the battery pack and the battery charger with
alcohol.
Always unplug the charger before cleaning.
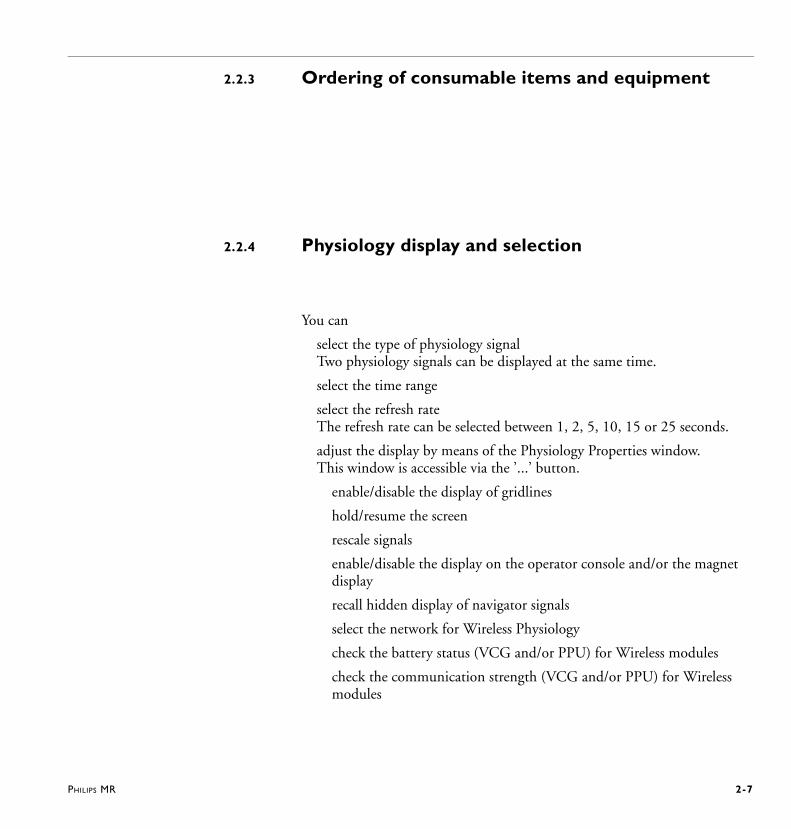
Figure 2.5 Left: Front side of the battery charger. Right: Top side of the battery charger.
Charger power - green LED
Battery discharge switch
Battery slots
Battery charge RGB LED’s

2-6 PHILIPS MR
Charger power (green LED)The charger power indicates when +24Vdc input from the AC adapter is present.
Battery discharge switch
Battery slots
Battery charge RGB LED’s
Battery charging timeRecharging a complete empty battery takes about 8 hours maximum.
It is advised to put the batteries on the charger when not in use.
RGB LED display Status
Solid green
Flashing green
Flashing yellow
Solid red
Solid blue
Flashing blue The associated battery requires reconditioning. This battery
must be inserted into the lower left-hand battery slot to be
reconditioned.
Extinguished No battery is inserted in the associated battery slot.
PHILIPS MR 2-7
2.2.3 Ordering of consumable items and equipment
2.2.4 Physiology display and selection
You can
select the type of physiology signal Two physiology signals can be displayed at the same time.
select the time range
select the refresh rate The refresh rate can be selected between 1, 2, 5, 10, 15 or 25 seconds.
adjust the display by means of the Physiology Properties window. This window is accessible via the ’...’ button.
enable/disable the display of gridlines
hold/resume the screen
rescale signals
enable/disable the display on the operator console and/or the magnet display
recall hidden display of navigator signals
select the network for Wireless Physiology
check the battery status (VCG and/or PPU) for Wireless modules
check the communication strength (VCG and/or PPU) for Wireless modules
2-8
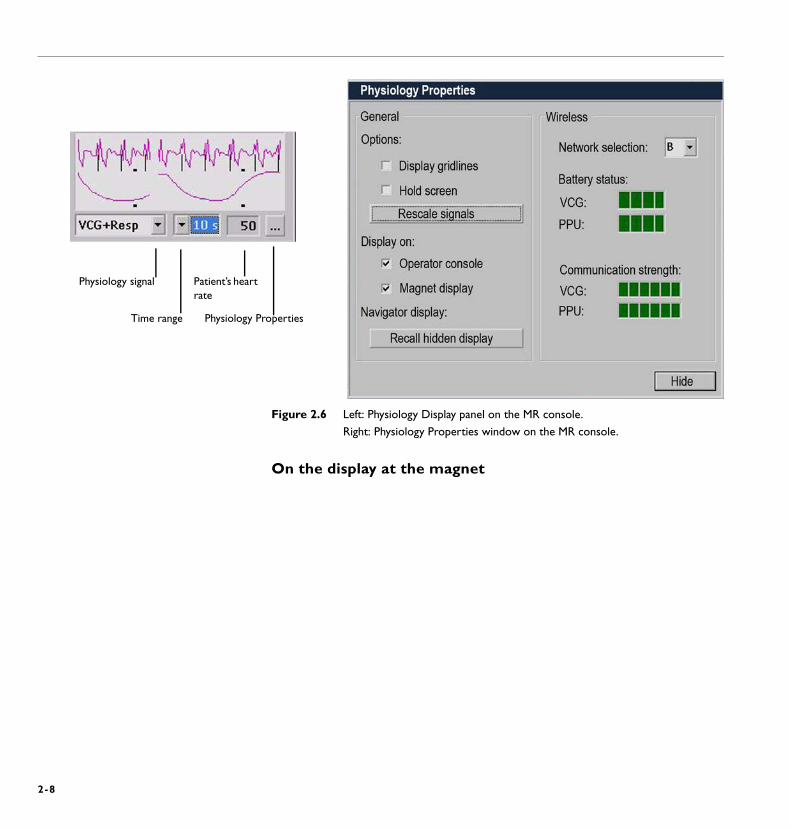
Figure 2.6 Left: Physiology Display panel on the MR console.
Right: Physiology Properties window on the MR console.
On the display at the magnet
Physiology signal
Time range
Patient’s heart rate
Physiology Properties
PHILIPS MR 2-9
2.2.5 Respiratory sensor
Positioning of the respiratory sensor
1
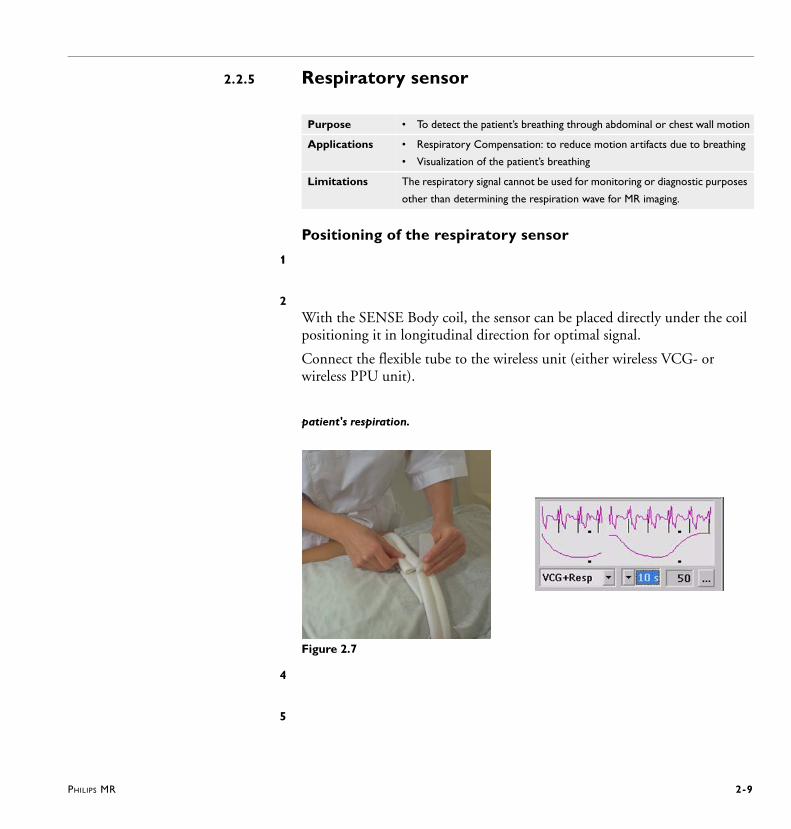
2With the SENSE Body coil, the sensor can be placed directly under the coil positioning it in longitudinal direction for optimal signal.
Connect the flexible tube to the wireless unit (either wireless VCG- or wireless PPU unit).
patient's respiration.
Figure 2.7
4
5
Purpose • To detect the patient’s breathing through abdominal or chest wall motion
Applications • Respiratory Compensation: to reduce motion artifacts due to breathing
• Visualization of the patient’s breathing
Limitations The respiratory signal cannot be used for monitoring or diagnostic purposes
other than determining the respiration wave for MR imaging.
2-10 PHILIPS MR
If the respiratory signal appears to weaken
Related parameters
2.2.6 Peripheral Pulse sensor
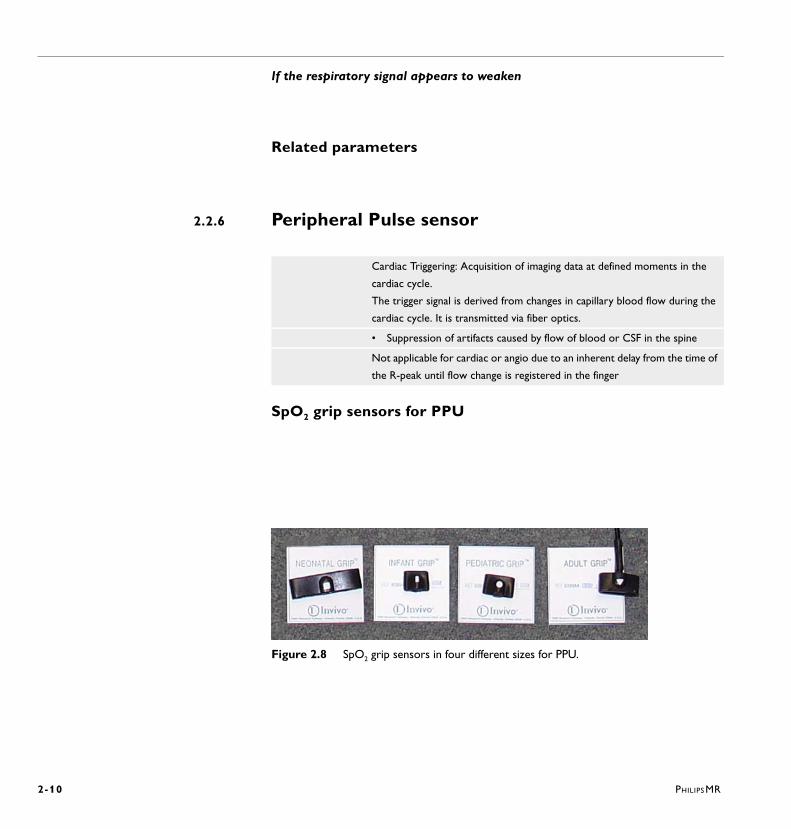
SpO2 grip sensors for PPU
Figure 2.8 SpO2 grip sensors in four different sizes for PPU.
Cardiac Triggering: Acquisition of imaging data at defined moments in the
cardiac cycle.
The trigger signal is derived from changes in capillary blood flow during the
cardiac cycle. It is transmitted via fiber optics.
• Suppression of artifacts caused by flow of blood or CSF in the spine
Not applicable for cardiac or angio due to an inherent delay from the time of
the R-peak until flow change is registered in the finger
PHILIPS MR
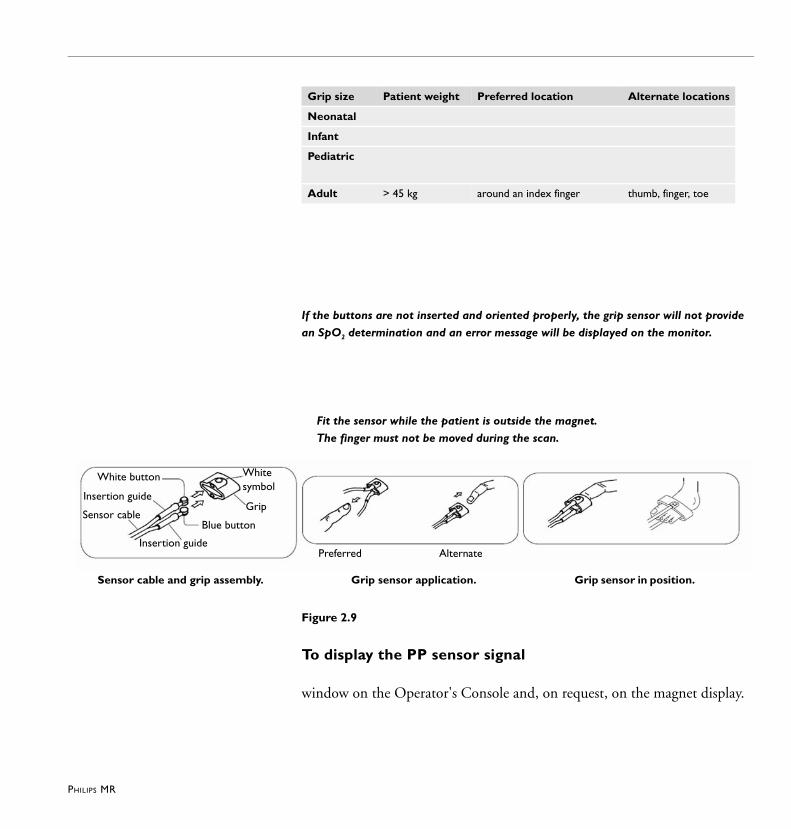
If the buttons are not inserted and oriented properly, the grip sensor will not provide
an SpO2 determination and an error message will be displayed on the monitor.
Fit the sensor while the patient is outside the magnet.
The finger must not be moved during the scan.
Figure 2.9
To display the PP sensor signal
window on the Operator's Console and, on request, on the magnet display.
Grip size Patient weight Preferred location Alternate locations
Neonatal
Infant
Pediatric
Adult > 45 kg around an index finger thumb, finger, toe
Preferred Alternate
Whitesymbol
Grip
Insertion guide
Blue button Sensor cable
Insertion guide
White button
Sensor cable and grip assembly. Grip sensor application. Grip sensor in position.

2-12
2.2.7 VCG (VectorCardioGraphy)
describing the different cycles of the electrical activity of the heart: P-, QRS- and T-loop. Thus, using spatial information of the ECG the QRS-loop can be differentiated from the loops of the artifacts.
WA R N I N G
The VCG signal is distorted when the patient is inside the magnet. It can only be used as a trigger signal for cardiac triggered imaging.
The use of other types of ECG electrodes may cause heating of the skin. Ask your local appliation representative for MR safe ECG electrodes.
For best results, it is recommended to use the Philips M2202A radio translucent foam monitoring electrode. (http://shop.medical.philips.com
Old electrodes can be dried out, which will result in bad electrical contact.
Repositioning or reuse may result in a heating effect, as a result of high skin resistance. Always use new electrodes.
Purpose
Applications
Limitation

2-13
This may result in skin burns.
Direct contact may cause heating of the skin. Keep a distance to the patient’s skin of at least 1 cm using pads of the standard accessory set.
This may cause image artifacts.
Patient preparation
WA R N I N G
N O T E
Position the VCG electrodes
4 electrodes. Three leads are measured: {RA-LA}, {LA-LL}, {RA-LL}, but only the first two of these are sent to the scanner. The battery isolated device amplifies and filters the VCG signals and digitizes the signal.
Position the electrodes as shown in Figure 2.10.Position the first electrode (for green lead) approximately 1 cm left of the xiphoid.Position the second and third electrode in such a way that they form a triangle around the nipple. The distance between the electrodes should be approximately 15 cm.Position the fourth electrode to the left of the top electrode, near the axilla.
Connect the green, white, red and black leads to the VCG electrodes (see Figure 2.10).
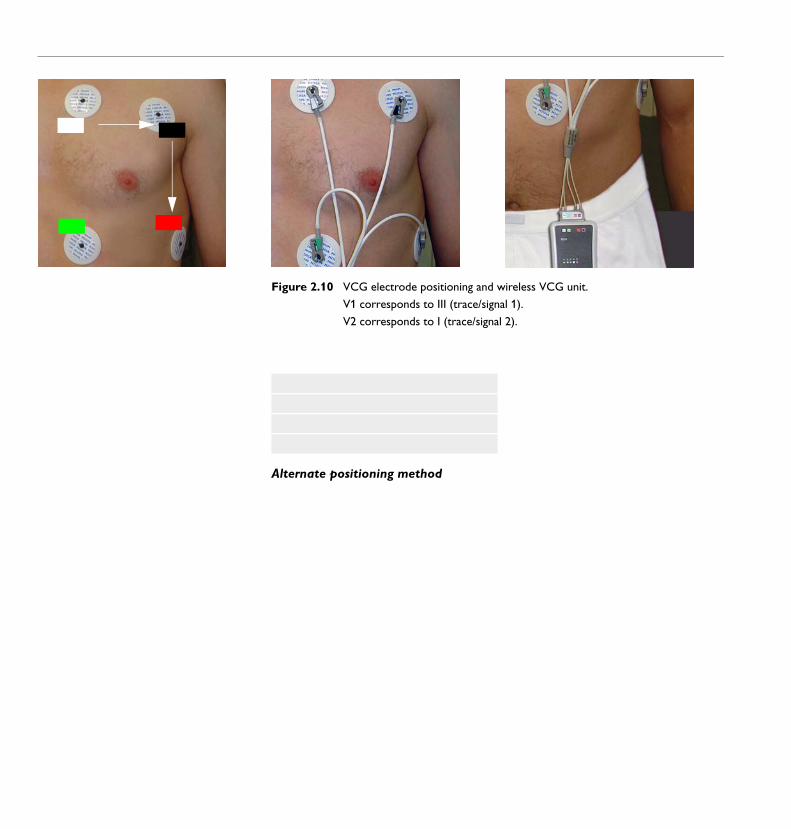
Figure 2.10 VCG electrode positioning and wireless VCG unit.
V1 corresponds to III (trace/signal 1).
V2 corresponds to I (trace/signal 2).
Alternate positioning method
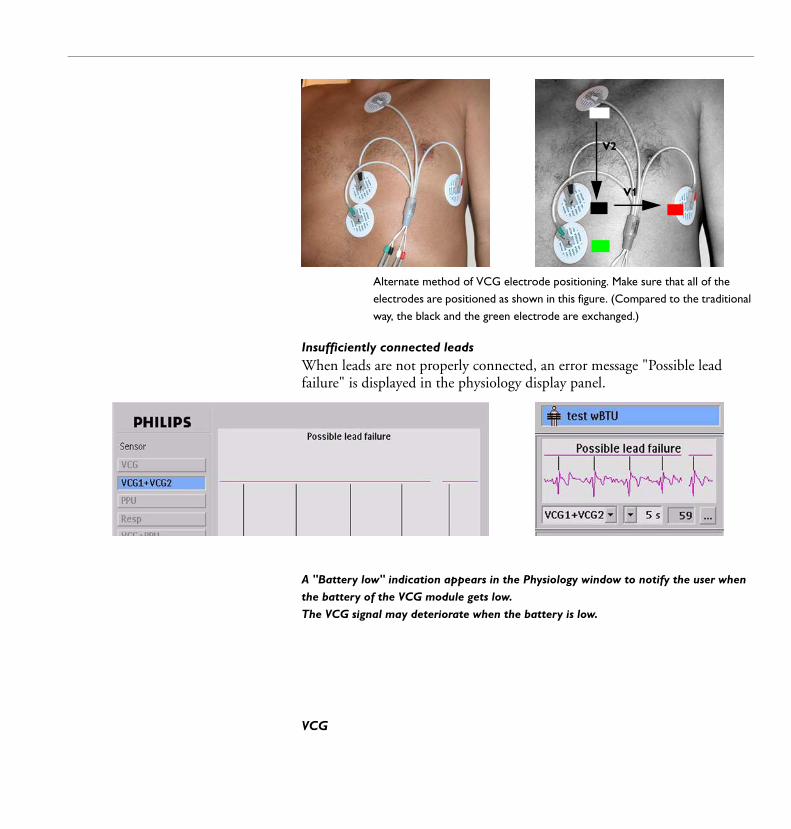
Alternate method of VCG electrode positioning. Make sure that all of the
electrodes are positioned as shown in this figure. (Compared to the traditional
way, the black and the green electrode are exchanged.)
Insufficiently connected leadsWhen leads are not properly connected, an error message "Possible lead failure" is displayed in the physiology display panel.
A "Battery low" indication appears in the Physiology window to notify the user when
the battery of the VCG module gets low.
The VCG signal may deteriorate when the battery is low.
VCG
V2
V1

2-16
VCG1+VCG2
N O T E The most important issue is whether you see R-peak markers on the signal, not the
strength of the R-peak.
Reposition electrodes
WA R N I N G Never reposition or reuse ECG electrodes. Always use new electrodes.
2-17
2.3 Coils and positioning
N O T E Electrodes and respiratory belt must be applied before putting on the top section.
Coils for cardiac imaging
On 1.5T Achieva and Intera systems
On 3.0T systems
On Panorama systems ST Body/Spine M and ST Body/Spine XL coil
SENSE Torso/Cardiac coil1 Place the housing mattress with the posterior coil part embedded on the
tabletop.
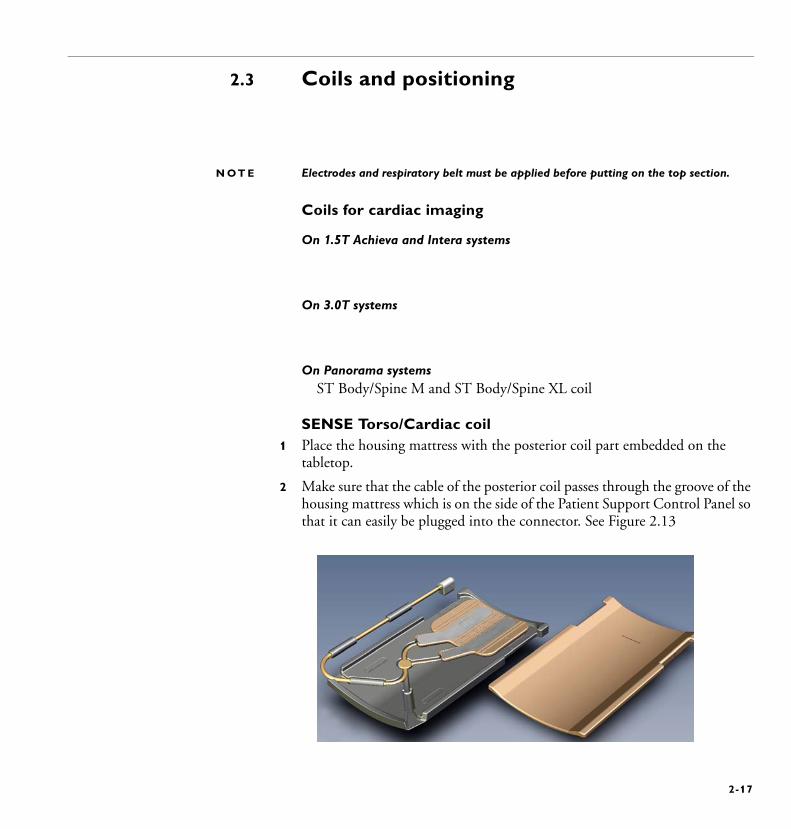
2 Make sure that the cable of the posterior coil passes through the groove of the housing mattress which is on the side of the Patient Support Control Panel so that it can easily be plugged into the connector. See Figure 2.13
2-18
Figure 2.13
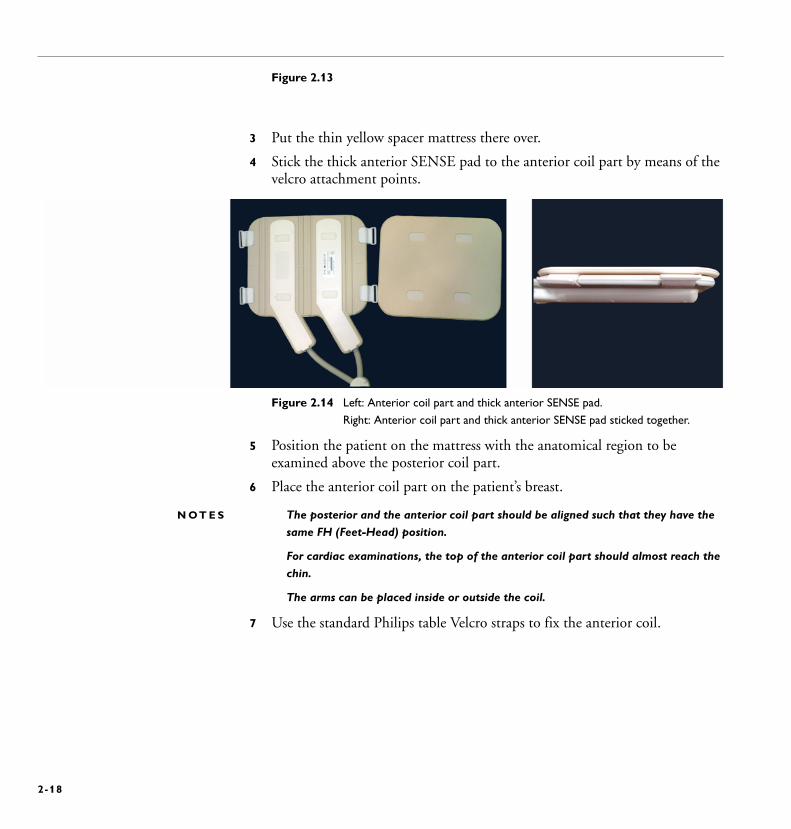
3 Put the thin yellow spacer mattress there over.
4 Stick the thick anterior SENSE pad to the anterior coil part by means of the velcro attachment points.
Figure 2.14 Left: Anterior coil part and thick anterior SENSE pad.
Right: Anterior coil part and thick anterior SENSE pad sticked together.
5 Position the patient on the mattress with the anatomical region to be examined above the posterior coil part.
6 Place the anterior coil part on the patient’s breast.
N O T E S The posterior and the anterior coil part should be aligned such that they have the
same FH (Feet-Head) position.
For cardiac examinations, the top of the anterior coil part should almost reach the
chin.
The arms can be placed inside or outside the coil.
7 Use the standard Philips table Velcro straps to fix the anterior coil.
PHILIPS MR 2-19
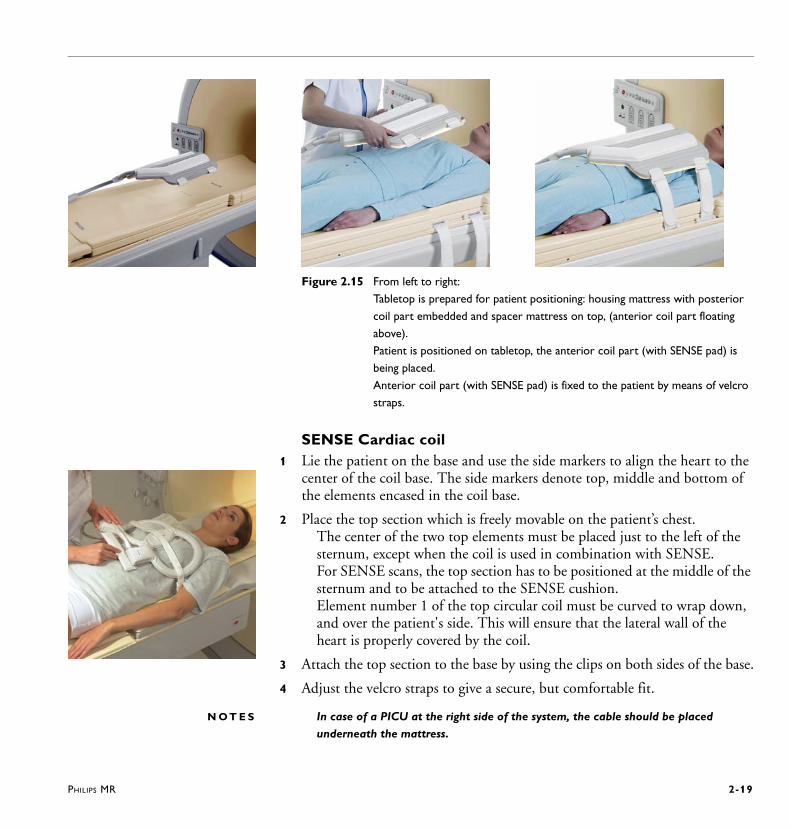
Figure 2.15 From left to right:
Tabletop is prepared for patient positioning: housing mattress with posterior
coil part embedded and spacer mattress on top, (anterior coil part floating
above).
Patient is positioned on tabletop, the anterior coil part (with SENSE pad) is
being placed.
Anterior coil part (with SENSE pad) is fixed to the patient by means of velcro
straps.
SENSE Cardiac coil1 Lie the patient on the base and use the side markers to align the heart to the
center of the coil base. The side markers denote top, middle and bottom of the elements encased in the coil base.
2 Place the top section which is freely movable on the patient’s chest. The center of the two top elements must be placed just to the left of the sternum, except when the coil is used in combination with SENSE. For SENSE scans, the top section has to be positioned at the middle of the sternum and to be attached to the SENSE cushion. Element number 1 of the top circular coil must be curved to wrap down, and over the patient's side. This will ensure that the lateral wall of the heart is properly covered by the coil.
3 Attach the top section to the base by using the clips on both sides of the base.
4 Adjust the velcro straps to give a secure, but comfortable fit.
N O T E S In case of a PICU at the right side of the system, the cable should be placed
underneath the mattress.

2-20 PHILIPS MR
The coil top may also be positioned more toward center or right side, if the heart is
not in the normal location. If the top of the coil is not 3 fingers underneath the
clavicle, the patient is positioned wrong on the base of the coil.
SafetyUse the SENSE cushion for the SENSE Cardiac coil.
SENSE Cardiac coil (3.0T)Position the posterior coil part on the tabletop.Position the mattress on the coil for patient comfort and to ensure a distance between patient and coil.Position the patient on the posterior coil part.Apply electrodes and respiratory belt if necessary.Place the anterior section on the patient’s chest directly above the posterior part. If SENSE is to be used, the SENSE mattress must be attached to the coil to create a small distance between patient and coil.Strap the coil tightly around the patient, if necessary with the respiratory sensor and electrodes in between patient and coil.
ST Body/Spine M and ST Body/Spine XL coilPlace the coil base on the tabletop with the cable outlet in head direction. Place the coil bridge on the tabletop. Place the mattress on the tabletop.Place the patient on the tabletop.Connect the peripheral devices (VCG, respiratory belt) to the patient.Attach the top part of the coil.
Figure 2.16 Base, bridge, mattress.
N O T E Be aware that the top part of the coil matches only in one way on the coil base.
Coil base
Mattress
Coil bridge
PHILIPS MR 2-21
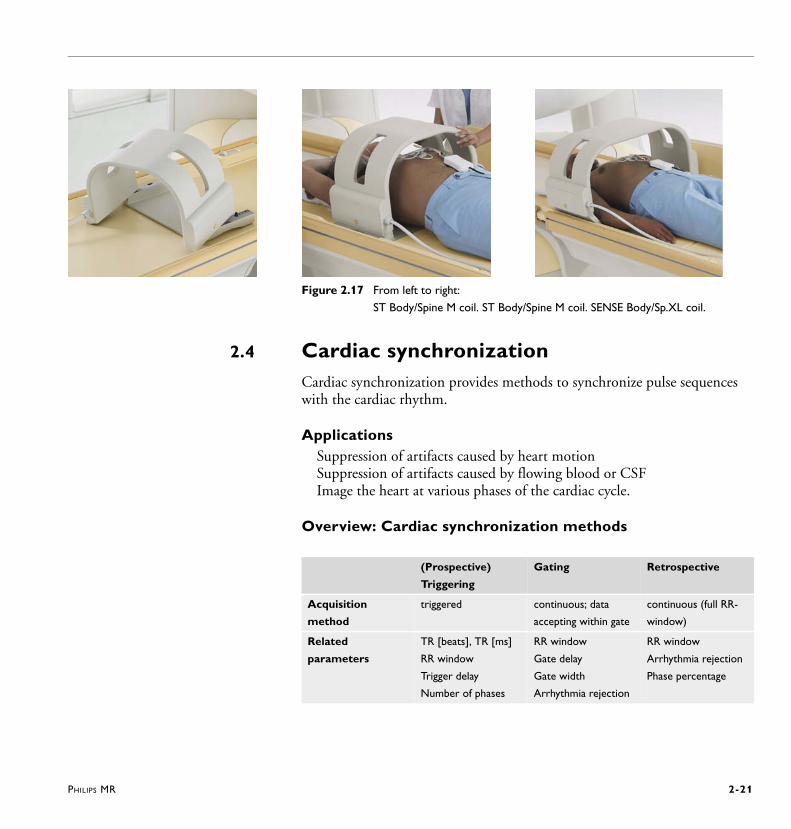
Figure 2.17 From left to right:
ST Body/Spine M coil. ST Body/Spine M coil. SENSE Body/Sp.XL coil.
2.4 Cardiac synchronizationCardiac synchronization provides methods to synchronize pulse sequences with the cardiac rhythm.
Applications Suppression of artifacts caused by heart motionSuppression of artifacts caused by flowing blood or CSFImage the heart at various phases of the cardiac cycle.
Overview: Cardiac synchronization methods
(Prospective)
Triggering
Gating Retrospective
Acquisition
method
triggered continuous; data
accepting within gate
continuous (full RR-
window)
Related
parameters
TR [beats], TR [ms]
RR window
Trigger delay
Number of phases
RR window
Gate delay
Gate width
Arrhythmia rejection
RR window
Arrhythmia rejection
Phase percentage
2-22 PHILIPS MR
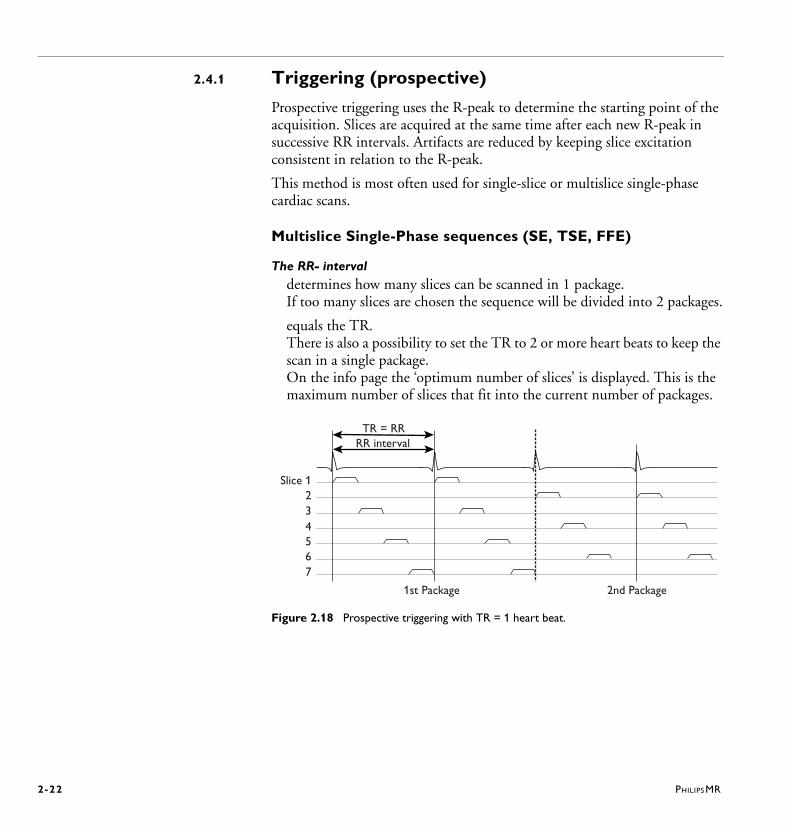
2.4.1 Triggering (prospective)
Prospective triggering uses the R-peak to determine the starting point of the acquisition. Slices are acquired at the same time after each new R-peak in successive RR intervals. Artifacts are reduced by keeping slice excitation consistent in relation to the R-peak.
This method is most often used for single-slice or multislice single-phase cardiac scans.
Multislice Single-Phase sequences (SE, TSE, FFE)
The RR- intervaldetermines how many slices can be scanned in 1 package. If too many slices are chosen the sequence will be divided into 2 packages.
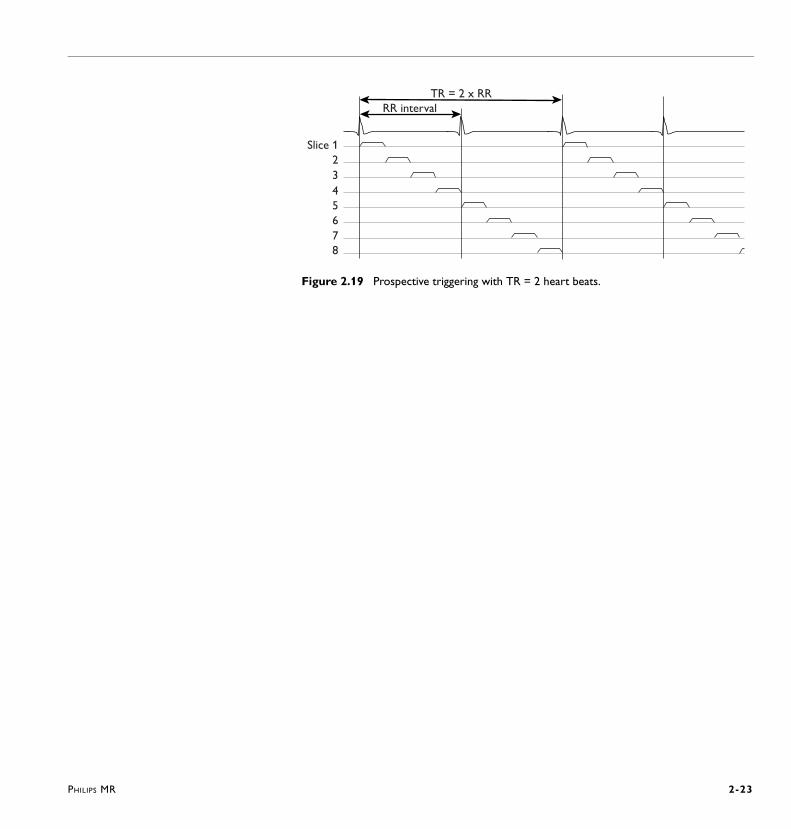
equals the TR. There is also a possibility to set the TR to 2 or more heart beats to keep the scan in a single package. On the info page the ‘optimum number of slices’ is displayed. This is the maximum number of slices that fit into the current number of packages.
Figure 2.18 Prospective triggering with TR = 1 heart beat.
7
56
4
23
Slice 1
RR intervalTR = RR
2nd Package1st Package
PHILIPS MR 2-23
Figure 2.19 Prospective triggering with TR = 2 heart beats.
RR intervalTR = 2 x RR
7
56
4
23
Slice 1
8
2-24 PHILIPS MR
2.4.2 Triggering (prospective): Related parametersFor more information on all parameters, refer to the Help system which includes the parameter help texts.
Cardiac Frequency • is displayed and should be entered in ‘beats per minute’. • determines the length of the RR interval.
TR (beats): 1,2....10 • The repetition time is entered in heart beats.
- A heart rate of 60 corresponds to an RR interval of 1000 ms in multislice mode. With a TR of 1 beat, the TR is 1000 ms. With a TR of 2 beats, the TR is 2000 ms.
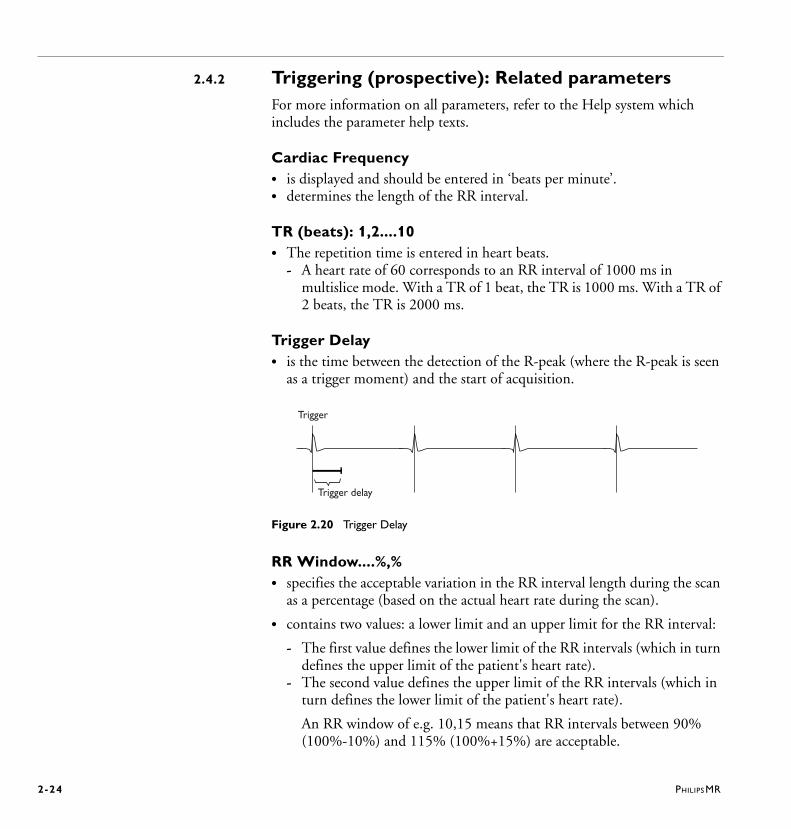
Trigger Delay• is the time between the detection of the R-peak (where the R-peak is seen
as a trigger moment) and the start of acquisition.
Figure 2.20 Trigger Delay
RR Window....%,% • specifies the acceptable variation in the RR interval length during the scan
as a percentage (based on the actual heart rate during the scan).
• contains two values: a lower limit and an upper limit for the RR interval:
- The first value defines the lower limit of the RR intervals (which in turn defines the upper limit of the patient's heart rate).
- The second value defines the upper limit of the RR intervals (which in turn defines the lower limit of the patient's heart rate).
An RR window of e.g. 10,15 means that RR intervals between 90% (100%-10%) and 115% (100%+15%) are acceptable.
Trigger delay
Trigger
PHILIPS MR 2-25
The ’RR window %’ parameter is used for two purposes, depending on arrhythmia rejection and what type of cardiac synchronization is used:
1 When arrhythmia rejection is used (this is optional for triggering and gating, and mandatory for retrospective), the ’RR window %’ parameter defines the acceptance window for arrhythmia rejection; all RR intervals within this window are accepted, all RR intervals outside this window are rejected.
N O T E A narrow window may lead to a situation in which arrhythmia events occur
continuously.
2 For prospectively gated and triggered scans, the first value of the ’RR window %’ parameter defines the so-called ’No Trigger Period’. In these scans, the second percentage parameter is futile if arrhythmia rejection is not enabled.. The 'No Trigger Period' is the effective time available for acquisition within the RR interval: from the R-peak until the first RR window. It is the time during which no new triggers will be recognized. This means that electrical signals occurring in the middle of the RR interval will not be seen as an R-peak or new trigger.
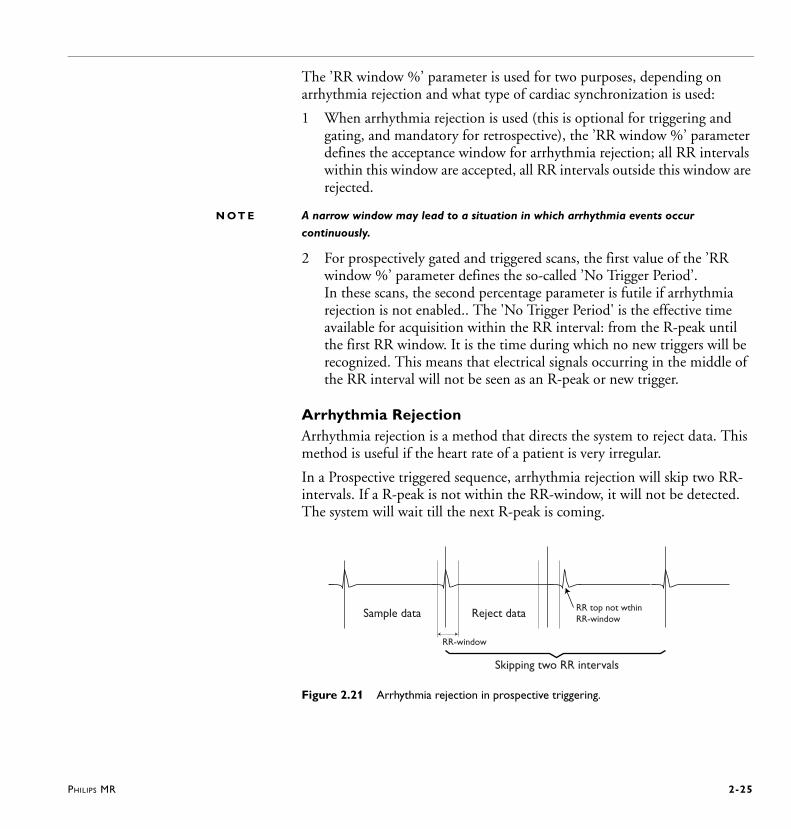
Arrhythmia RejectionArrhythmia rejection is a method that directs the system to reject data. This method is useful if the heart rate of a patient is very irregular.
In a Prospective triggered sequence, arrhythmia rejection will skip two RR-intervals. If a R-peak is not within the RR-window, it will not be detected. The system will wait till the next R-peak is coming.
Figure 2.21 Arrhythmia rejection in prospective triggering.
Sample data Reject data RR top not wthinRR-window
RR-window
Skipping two RR intervals
2-26 PHILIPS MR
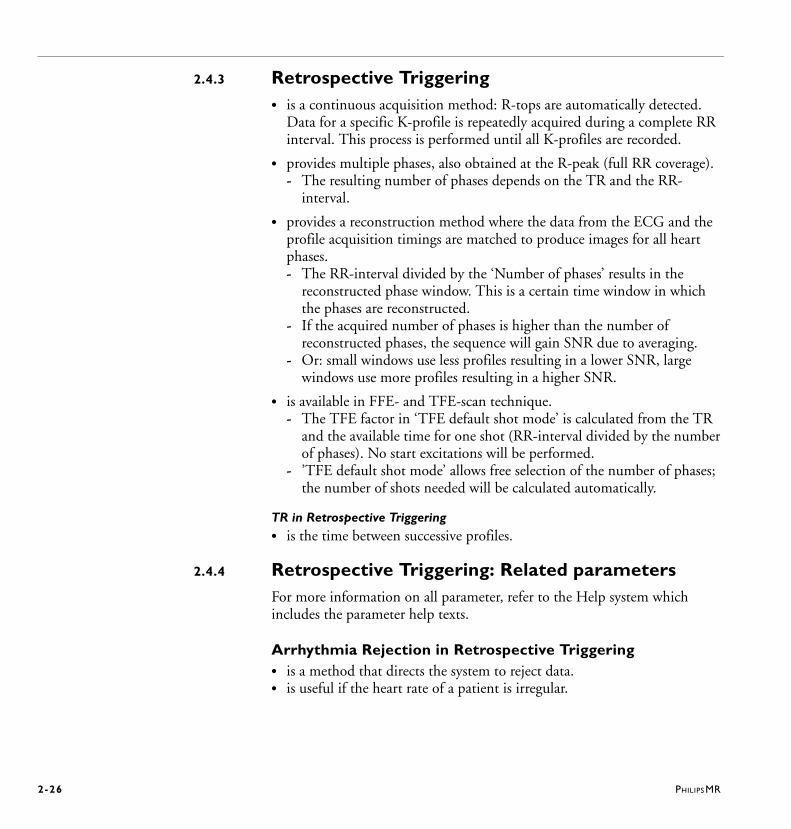
2.4.3 Retrospective Triggering• is a continuous acquisition method: R-tops are automatically detected.
Data for a specific K-profile is repeatedly acquired during a complete RR interval. This process is performed until all K-profiles are recorded.
• provides multiple phases, also obtained at the R-peak (full RR coverage). - The resulting number of phases depends on the TR and the RR-
interval.
• provides a reconstruction method where the data from the ECG and the profile acquisition timings are matched to produce images for all heart phases.- The RR-interval divided by the ‘Number of phases’ results in the
reconstructed phase window. This is a certain time window in which the phases are reconstructed.
- If the acquired number of phases is higher than the number of reconstructed phases, the sequence will gain SNR due to averaging.
- Or: small windows use less profiles resulting in a lower SNR, large windows use more profiles resulting in a higher SNR.
• is available in FFE- and TFE-scan technique.- The TFE factor in ‘TFE default shot mode’ is calculated from the TR
and the available time for one shot (RR-interval divided by the number of phases). No start excitations will be performed.
- ’TFE default shot mode’ allows free selection of the number of phases; the number of shots needed will be calculated automatically.
TR in Retrospective Triggering• is the time between successive profiles.
2.4.4 Retrospective Triggering: Related parametersFor more information on all parameter, refer to the Help system which includes the parameter help texts.
Arrhythmia Rejection in Retrospective Triggering• is a method that directs the system to reject data. • is useful if the heart rate of a patient is irregular.
PHILIPS MR 2-27
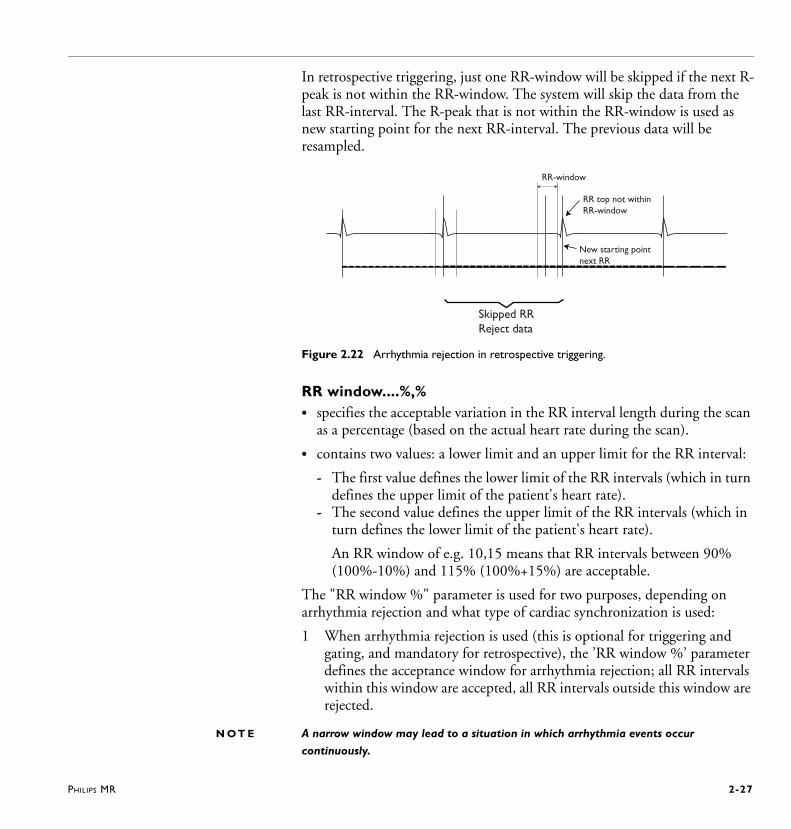
In retrospective triggering, just one RR-window will be skipped if the next R-peak is not within the RR-window. The system will skip the data from the last RR-interval. The R-peak that is not within the RR-window is used as new starting point for the next RR-interval. The previous data will be resampled.
Figure 2.22 Arrhythmia rejection in retrospective triggering.
RR window....%,% • specifies the acceptable variation in the RR interval length during the scan
as a percentage (based on the actual heart rate during the scan).
• contains two values: a lower limit and an upper limit for the RR interval:
- The first value defines the lower limit of the RR intervals (which in turn defines the upper limit of the patient's heart rate).
- The second value defines the upper limit of the RR intervals (which in turn defines the lower limit of the patient's heart rate).
An RR window of e.g. 10,15 means that RR intervals between 90% (100%-10%) and 115% (100%+15%) are acceptable.
The "RR window %" parameter is used for two purposes, depending on arrhythmia rejection and what type of cardiac synchronization is used:
1 When arrhythmia rejection is used (this is optional for triggering and gating, and mandatory for retrospective), the ’RR window %’ parameter defines the acceptance window for arrhythmia rejection; all RR intervals within this window are accepted, all RR intervals outside this window are rejected.
N O T E A narrow window may lead to a situation in which arrhythmia events occur
continuously.
RR top not withinRR-window
Skipped RRReject data
New starting pointnext RR
RR-window
2-28 PHILIPS MR
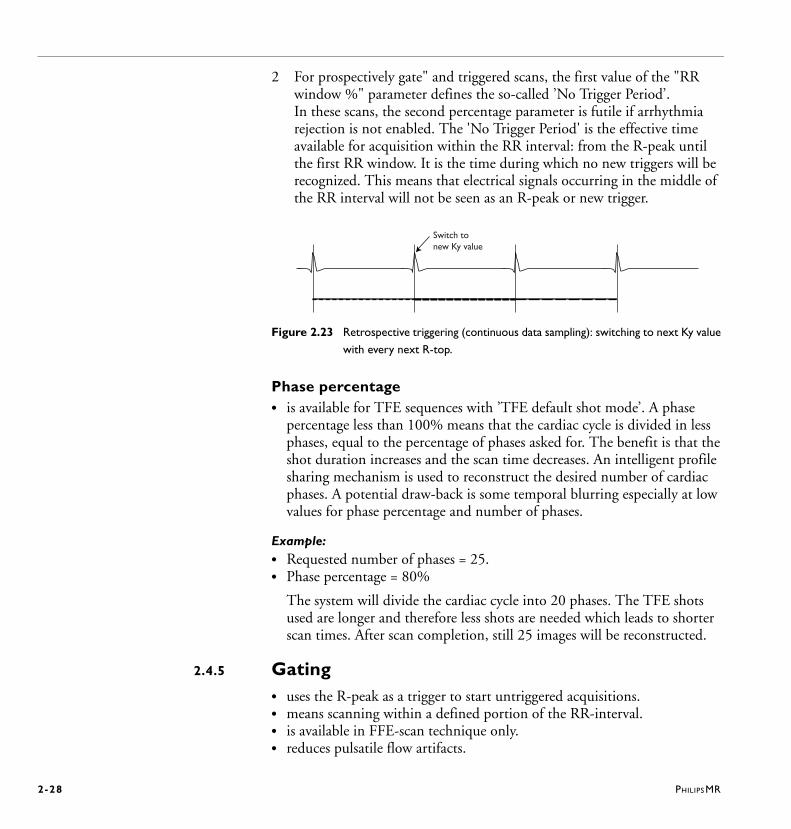
2 For prospectively gate" and triggered scans, the first value of the "RR window %" parameter defines the so-called ’No Trigger Period’. In these scans, the second percentage parameter is futile if arrhythmia rejection is not enabled. The 'No Trigger Period' is the effective time available for acquisition within the RR interval: from the R-peak until the first RR window. It is the time during which no new triggers will be recognized. This means that electrical signals occurring in the middle of the RR interval will not be seen as an R-peak or new trigger.
Figure 2.23 Retrospective triggering (continuous data sampling): switching to next Ky value
with every next R-top.
Phase percentage• is available for TFE sequences with ’TFE default shot mode’. A phase
percentage less than 100% means that the cardiac cycle is divided in less phases, equal to the percentage of phases asked for. The benefit is that the shot duration increases and the scan time decreases. An intelligent profile sharing mechanism is used to reconstruct the desired number of cardiac phases. A potential draw-back is some temporal blurring especially at low values for phase percentage and number of phases.
Example:• Requested number of phases = 25. • Phase percentage = 80%
The system will divide the cardiac cycle into 20 phases. The TFE shots used are longer and therefore less shots are needed which leads to shorter scan times. After scan completion, still 25 images will be reconstructed.
2.4.5 Gating• uses the R-peak as a trigger to start untriggered acquisitions.• means scanning within a defined portion of the RR-interval.• is available in FFE-scan technique only. • reduces pulsatile flow artifacts.
Switch tonew Ky value

PHILIPS MR 2-29
Figure 2.24 Gating.
2.4.6 Gating: Related parametersFor more information on all parameter, refer to the Help system which includes the parameter help texts.
Gate Delay [ms]• can be set to start the acquisition at a user defined time after the R-peak.
Gate Width [ms] • determines the duration of the acquisition. The longer the gate width (gate
window), the shorter the total scan time, but the higher the artifact level, especially in case of heart rate variations.
Phase Interval [%]• is available in a multiphase scan.• is the time between successive gates.• can be set to
- Shortest: the interval is equal to the gate width.- Longest: the gates are evenly distributed over the available part of the
cardiac cycle.- User defined: the phase interval must be at least as big as the gate width.
Figure 2.25 Multiphase Gating.
Gate widthGate delay
Continuous sampling
Phase interval
Gate delay
2-30 PHILIPS MR
2.5 Respiratory suppression and compensationThere are several techniques for the suppression and compensation of respiratory artifacts.
2.5.1 Breath holdingReproducible anatomical positioning is best achieved in expiration. When the patient is in inspiration there is a greater tendency for the diaphragm position to move and therefore anatomical position changes.
Before placing the patient into the system, practice the following sequence with the patient so that the patient understands the breath-hold sequence:
1 Tell the patient to breathe in, not deeply but fairly long.2 Tell the patient to breathe out and then to stop breathing for 15 seconds.
N O T E • It is important at this stage to have the patient notice the amount of air that is
exhaled and try to exhale the same amount for each breath-hold event.
• The diaphragm position is a significant factor in anatomical position reproducibility.
2.5.2 Navigator technique (MotionTrak)The comprehensive navigator technique is referred to as MotionTrak.
MotionTrak • is used to compensate for respiratory motion during cardiac and
abdominal imaging.Motion of the diaphragm affects the heart location, and therefore the heart and heart vessel position as well as the position of the liver. This motion would lead to inconsistent image quality, because the same anatomical position is not properly found for each sampled k-space point.
• increases the accuracy of reproducible anatomical positions.
• can be combined with ECG/VCG triggering. The ECG/VCG triggering is used to scan during diastole, or the quiet period of cardiac motion and the MotionTrak method is used to compensate for respiratory motion.
• can be combined with SPIR and/or SPAIR, see Figure 2.26 and Figure 2.27.

PHILIPS MR 2-31
Figure 2.26 Schematic drawing of SPIR fat suppression techniques with navigator.
Figure 2.27 Schematic drawing of SPAIR fat suppression techniques with navigator.
Trigger Delay Mid Diastole
MotionTracking
Contrast preparation
Motion detection and tracking
Imaging
T2-Prepulse SPIR Nav SPIR 2 REST Startup 3D-(B)TFE
Trigger Delay Mid Diastole
MotionTracking
SPAIR T2-Prepulse Nav 2 REST Startup 3D-(B)TFE
Contrast preparation Motion detection and tracking
Imaging
2-32 PHILIPS MR
MotionTrak
• utilizes the following:- Navigator echo technique - Real-time gating - Triggering - Tracking - Tracking anatomy and variable scale factors - Leading and trailing navigators - Navigator beam positioning - Free running navigator - MotionTrak Display Tool
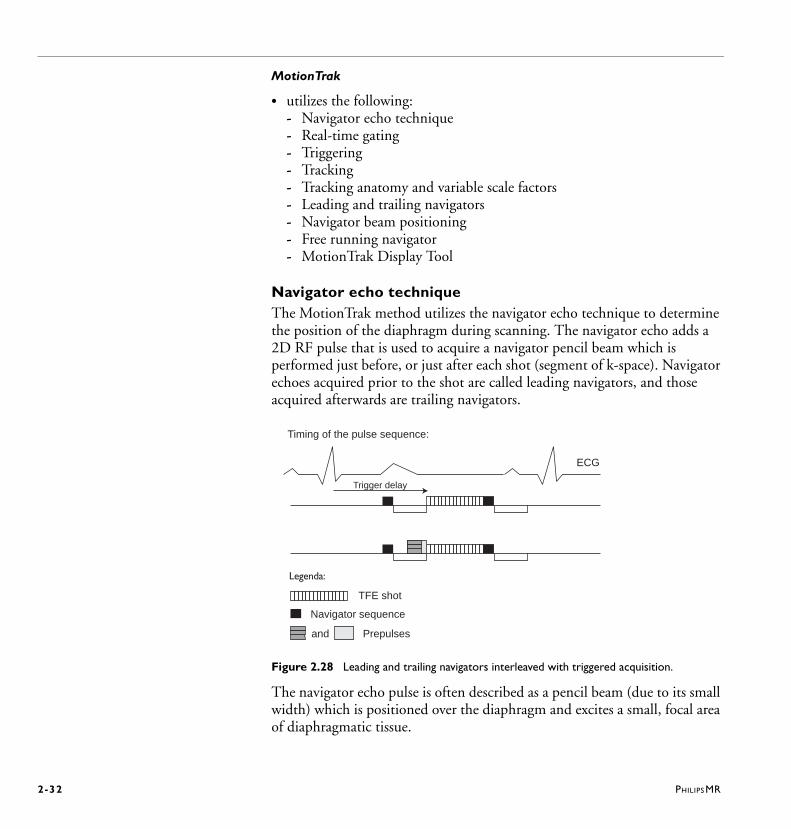
Navigator echo techniqueThe MotionTrak method utilizes the navigator echo technique to determine the position of the diaphragm during scanning. The navigator echo adds a 2D RF pulse that is used to acquire a navigator pencil beam which is performed just before, or just after each shot (segment of k-space). Navigator echoes acquired prior to the shot are called leading navigators, and those acquired afterwards are trailing navigators.
Figure 2.28 Leading and trailing navigators interleaved with triggered acquisition.
The navigator echo pulse is often described as a pencil beam (due to its small width) which is positioned over the diaphragm and excites a small, focal area of diaphragmatic tissue.
�
�
Legenda:
Prepulses
TFE shot
Navigator sequence
and
Timing of the pulse sequence:
Trigger delay
ECG
PHILIPS MR 2-33
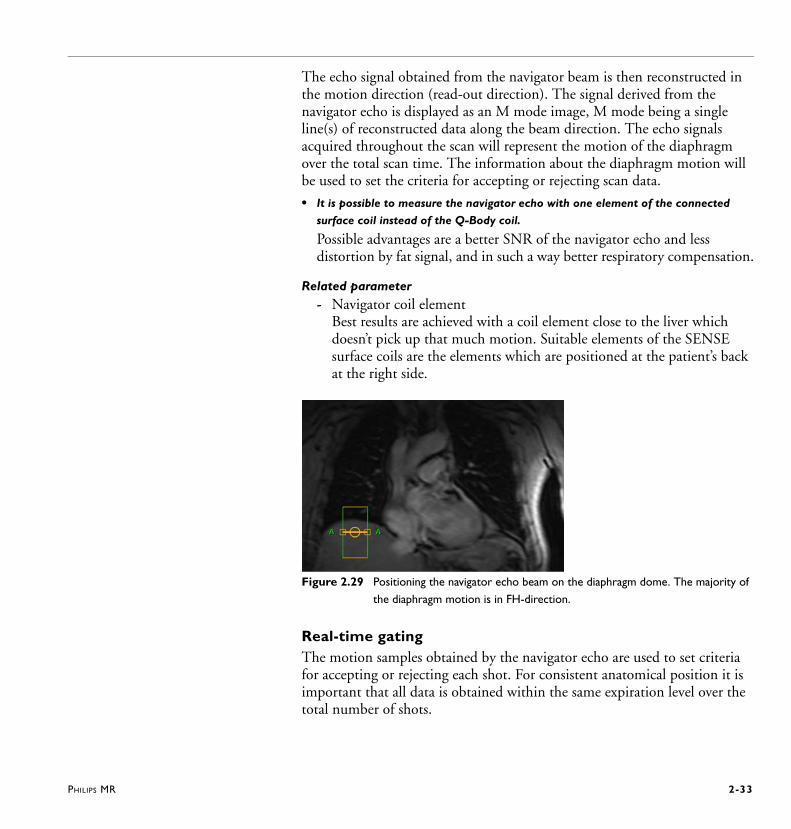
The echo signal obtained from the navigator beam is then reconstructed in the motion direction (read-out direction). The signal derived from the navigator echo is displayed as an M mode image, M mode being a single line(s) of reconstructed data along the beam direction. The echo signals acquired throughout the scan will represent the motion of the diaphragm over the total scan time. The information about the diaphragm motion will be used to set the criteria for accepting or rejecting scan data.
• It is possible to measure the navigator echo with one element of the connected
surface coil instead of the Q-Body coil.
Possible advantages are a better SNR of the navigator echo and less distortion by fat signal, and in such a way better respiratory compensation.
Related parameter- Navigator coil element
Best results are achieved with a coil element close to the liver which doesn’t pick up that much motion. Suitable elements of the SENSE surface coils are the elements which are positioned at the patient’s back at the right side.
Figure 2.29 Positioning the navigator echo beam on the diaphragm dome. The majority of
the diaphragm motion is in FH-direction.
Real-time gatingThe motion samples obtained by the navigator echo are used to set criteria for accepting or rejecting each shot. For consistent anatomical position it is important that all data is obtained within the same expiration level over the total number of shots.
2-34 PHILIPS MR
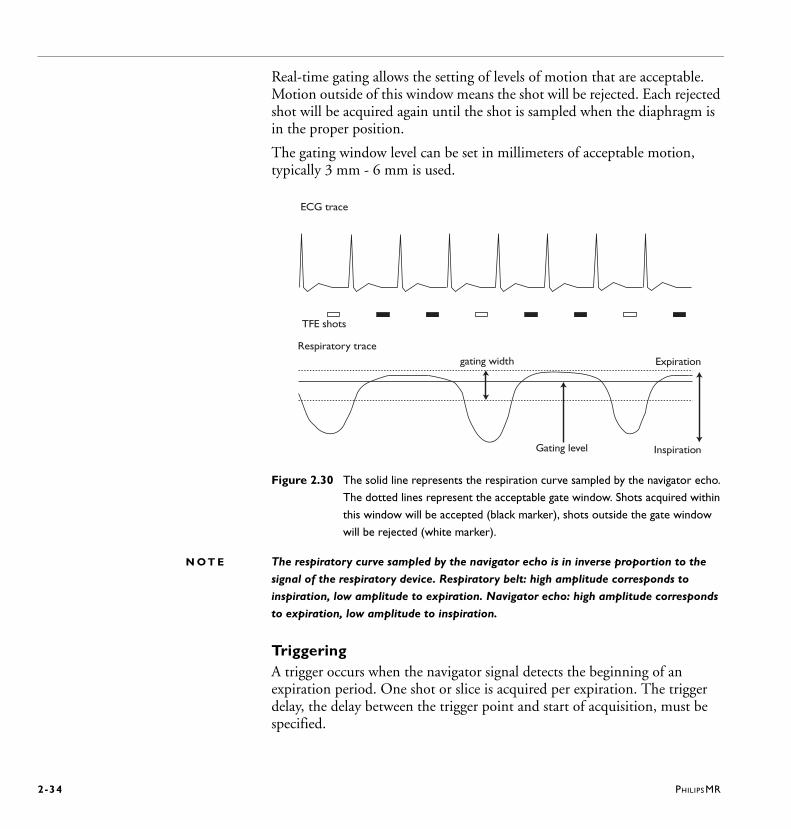
Real-time gating allows the setting of levels of motion that are acceptable. Motion outside of this window means the shot will be rejected. Each rejected shot will be acquired again until the shot is sampled when the diaphragm is in the proper position.
The gating window level can be set in millimeters of acceptable motion, typically 3 mm - 6 mm is used.
Figure 2.30 The solid line represents the respiration curve sampled by the navigator echo.
The dotted lines represent the acceptable gate window. Shots acquired within
this window will be accepted (black marker), shots outside the gate window
will be rejected (white marker).
N O T E The respiratory curve sampled by the navigator echo is in inverse proportion to the
signal of the respiratory device. Respiratory belt: high amplitude corresponds to
inspiration, low amplitude to expiration. Navigator echo: high amplitude corresponds
to expiration, low amplitude to inspiration.
TriggeringA trigger occurs when the navigator signal detects the beginning of an expiration period. One shot or slice is acquired per expiration. The trigger delay, the delay between the trigger point and start of acquisition, must be specified.
ECG trace
TFE shots
gating width
Gating level
Respiratory trace
Expiration
Inspiration
PHILIPS MR 2-35
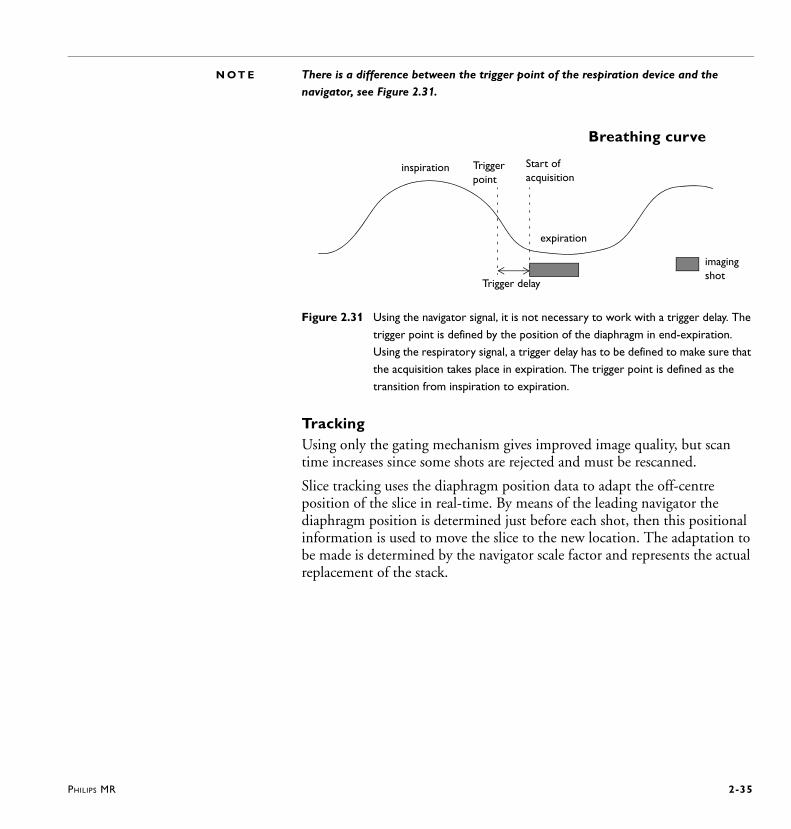
N O T E There is a difference between the trigger point of the respiration device and the
navigator, see Figure 2.31.
Figure 2.31 Using the navigator signal, it is not necessary to work with a trigger delay. The
trigger point is defined by the position of the diaphragm in end-expiration.
Using the respiratory signal, a trigger delay has to be defined to make sure that
the acquisition takes place in expiration. The trigger point is defined as the
transition from inspiration to expiration.
TrackingUsing only the gating mechanism gives improved image quality, but scan time increases since some shots are rejected and must be rescanned.
Slice tracking uses the diaphragm position data to adapt the off-centre position of the slice in real-time. By means of the leading navigator the diaphragm position is determined just before each shot, then this positional information is used to move the slice to the new location. The adaptation to be made is determined by the navigator scale factor and represents the actual replacement of the stack.
inspiration
expiration
Trigger point
Start of acquisition
Breathing curve
Trigger delay
imagingshot
2-36 PHILIPS MR
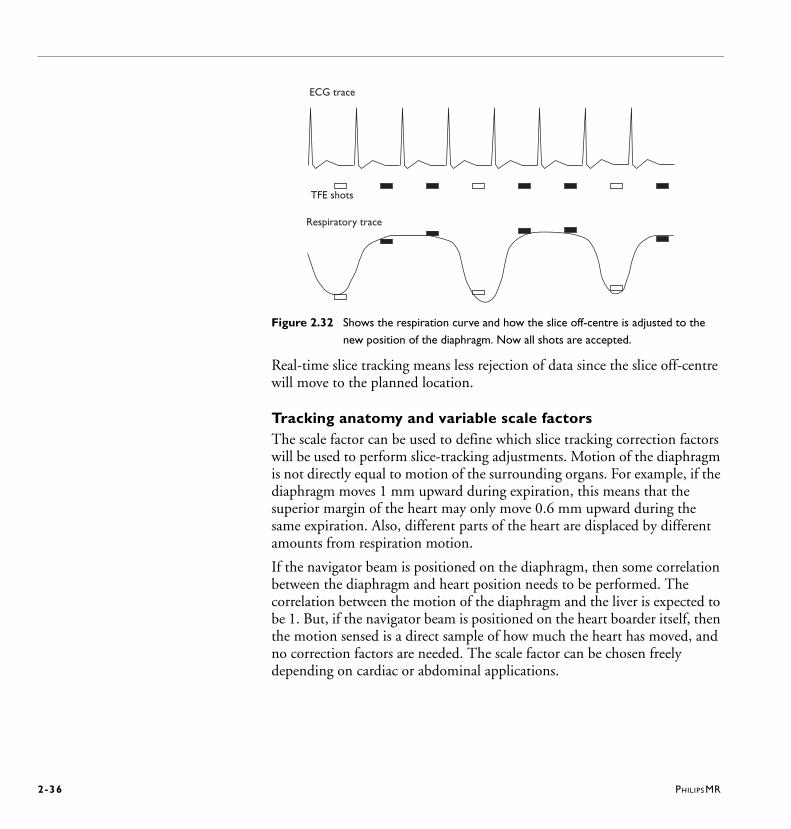
Figure 2.32 Shows the respiration curve and how the slice off-centre is adjusted to the
new position of the diaphragm. Now all shots are accepted.
Real-time slice tracking means less rejection of data since the slice off-centre will move to the planned location.
Tracking anatomy and variable scale factorsThe scale factor can be used to define which slice tracking correction factors will be used to perform slice-tracking adjustments. Motion of the diaphragm is not directly equal to motion of the surrounding organs. For example, if the diaphragm moves 1 mm upward during expiration, this means that the superior margin of the heart may only move 0.6 mm upward during the same expiration. Also, different parts of the heart are displaced by different amounts from respiration motion.
If the navigator beam is positioned on the diaphragm, then some correlation between the diaphragm and heart position needs to be performed. The correlation between the motion of the diaphragm and the liver is expected to be 1. But, if the navigator beam is positioned on the heart boarder itself, then the motion sensed is a direct sample of how much the heart has moved, and no correction factors are needed. The scale factor can be chosen freely depending on cardiac or abdominal applications.
ECG trace
TFE shots
Respiratory trace
PHILIPS MR 2-37
Navigator through diaphragm
Navigator through HeartA scale factor of 1.0 is used.
Leading and trailing navigatorsThe leading navigator echo will occur before the shot and the trailing navigator will occur after the shot. The leading navigator is always needed to perform MotionTrak method, the trailing navigator is optional. The trailing navigator adds an additional constraint on the amount of accepted data, but can ensure that no unusual respiration or motion occurred during the shot. When using both leading and trailing navigators both samples must fall within the gate window in order for the shot to be accepted.
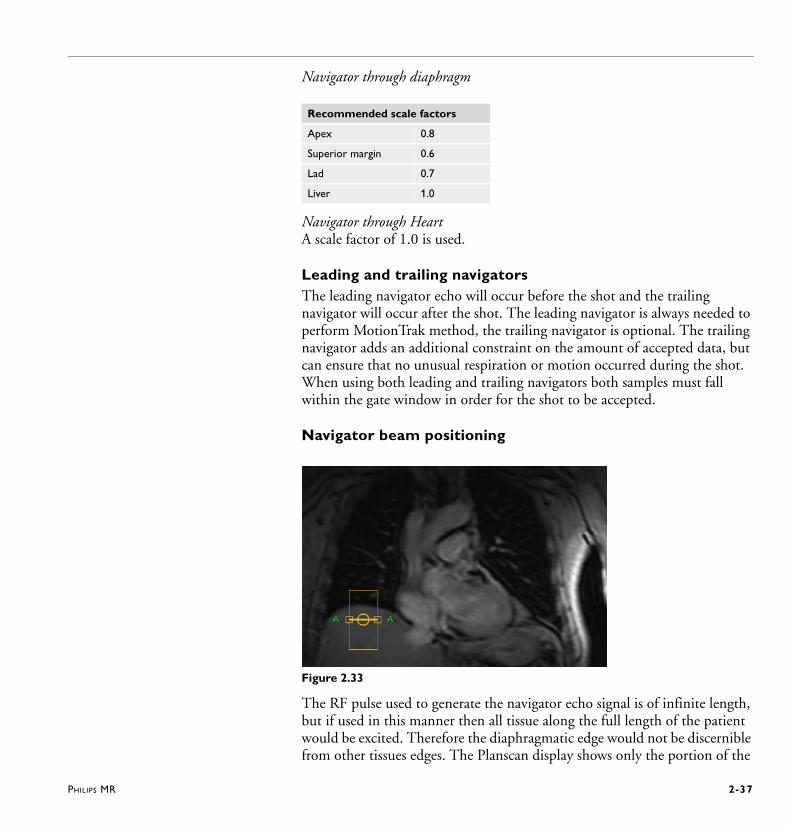
Navigator beam positioning
Figure 2.33
The RF pulse used to generate the navigator echo signal is of infinite length, but if used in this manner then all tissue along the full length of the patient would be excited. Therefore the diaphragmatic edge would not be discernible from other tissues edges. The Planscan display shows only the portion of the
Recommended scale factors
Apex 0.8
Superior margin 0.6
Lad 0.7
Liver 1.0
2-38 PHILIPS MR
navigator beam which will be used to sense motion. The length of the navigator beam is variable and should be adapted to the stroke of the breathing. The length is indicated by the green lines (navigator beam height lines) in the navigator window. The beam should be placed so that 2/3 of it lies within the diaphragm and 1/3 on the lung, in the middle of the right diaphragm.
If during the initial scan, the navigator efficiency is low, then the navigator beam may also be centered at the diaphragm edge.
N O T E The diaphragm moves low-high-low in left-right position, but also from anterior to
posterior. Make sure that the mid-coronal slice is selected.
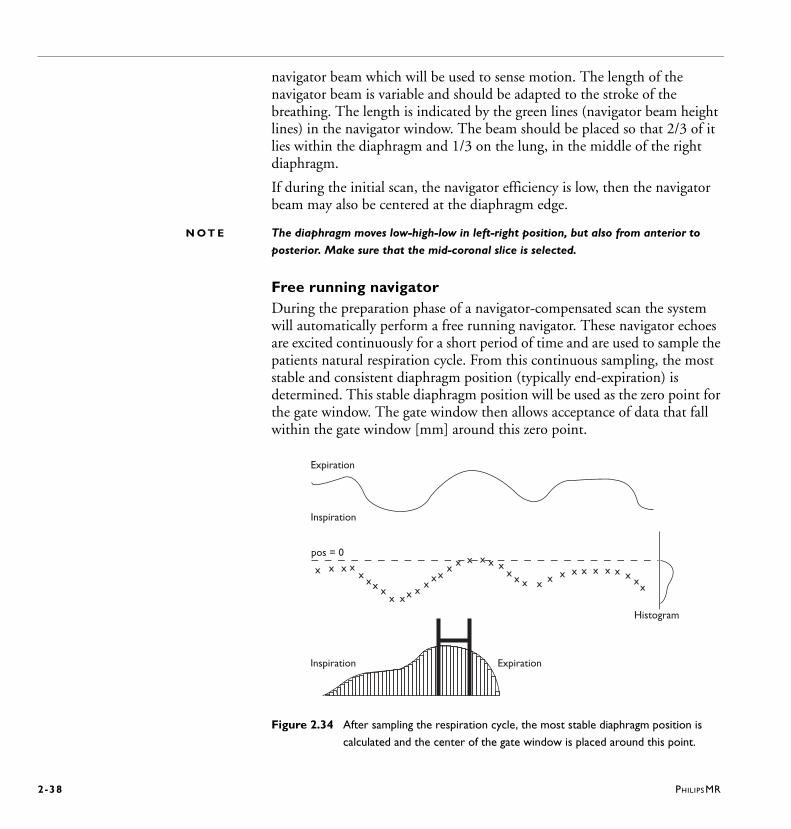
Free running navigatorDuring the preparation phase of a navigator-compensated scan the system will automatically perform a free running navigator. These navigator echoes are excited continuously for a short period of time and are used to sample the patients natural respiration cycle. From this continuous sampling, the most stable and consistent diaphragm position (typically end-expiration) is determined. This stable diaphragm position will be used as the zero point for the gate window. The gate window then allows acceptance of data that fall within the gate window [mm] around this zero point.
Figure 2.34 After sampling the respiration cycle, the most stable diaphragm position is
calculated and the center of the gate window is placed around this point.
x x x xx
xx xx xx x
xxx
x x x x x xx x x x x x x x x x x x x
x
Expiration
Inspiration
pos = 0
Histogram
Inspiration Expiration
PHILIPS MR 2-39
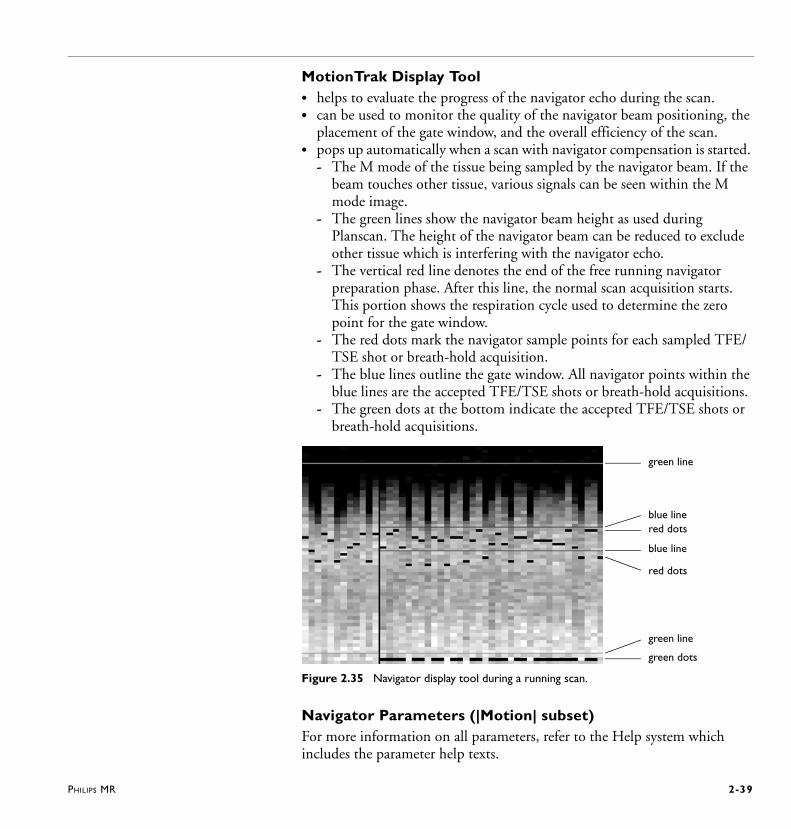
MotionTrak Display Tool• helps to evaluate the progress of the navigator echo during the scan. • can be used to monitor the quality of the navigator beam positioning, the
placement of the gate window, and the overall efficiency of the scan.• pops up automatically when a scan with navigator compensation is started.
- The M mode of the tissue being sampled by the navigator beam. If the beam touches other tissue, various signals can be seen within the M mode image.
- The green lines show the navigator beam height as used during Planscan. The height of the navigator beam can be reduced to exclude other tissue which is interfering with the navigator echo.
- The vertical red line denotes the end of the free running navigator preparation phase. After this line, the normal scan acquisition starts. This portion shows the respiration cycle used to determine the zero point for the gate window.
- The red dots mark the navigator sample points for each sampled TFE/TSE shot or breath-hold acquisition.
- The blue lines outline the gate window. All navigator points within the blue lines are the accepted TFE/TSE shots or breath-hold acquisitions.
- The green dots at the bottom indicate the accepted TFE/TSE shots or breath-hold acquisitions.
Figure 2.35 Navigator display tool during a running scan.
Navigator Parameters (|Motion| subset)For more information on all parameters, refer to the Help system which includes the parameter help texts.
green line
blue linered dots
blue line
red dots
green line
green dots

2-40 PHILIPS MR
Navigator respiratory compensationThis parameter enables or disables the navigator echo technique: • Gate: data is acquired during expiration; the respiratory status is derived
from the navigators.• Track: the position of the stack is dynamically updated to the actual
position of the diaphragm; possible with breath-hold acquisitions. • Gate and track: this is the combination of gating and tracking. • Trigger: one shot or slice is acquired per expiration after trigger signal
which indicates beginning of an expiraion period. • Trigger and track: this is the combination of trigger and tracking. It is
advised to use this combination for free breathe or respiratory triggered acquisitions.
N O T E The ’Gate and Track’ option is only available in cardiac-triggered navigator scans.
Navigator typeA respiratory navigator can be applied, either:• Leading: before the acquisition (e.g. a TFE/TSE shot)• Trailing: after the acquisition• Leading and trailing: before and after the acquisition.
Navigator gating window (for gating only)• specifies a window in mm of the respiratory cycle in which imaging data
will be accepted for image reconstruction. All data acquired outside this window is discarded and measured again. The window is defined around the expiration level (gating level) which is automatically detected at the start of the scan.
Navigator gating level drift (for gating only)With the navigator gating technique, the gating level is automatically detected at the start of the scan. However, during the scan the gating level might change. If it changes too much, the respiratory cycle will not lie within the navigator gating window and no data will be acquired anymore. Setting this parameter to ’continuous’ helps avoiding this effect as the gating level is slowly updated during the scan.
Trigger delay (for triggering only)• specifies the time between the trigger point and the start of acquisition.
PHILIPS MR 2-41
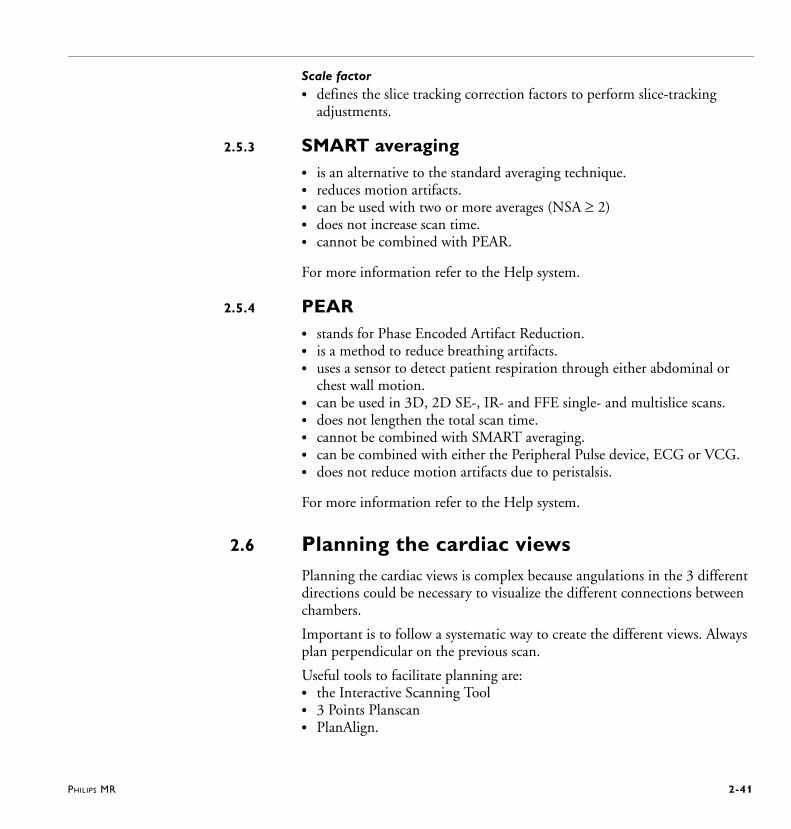
Scale factor• defines the slice tracking correction factors to perform slice-tracking
adjustments.
2.5.3 SMART averaging• is an alternative to the standard averaging technique.• reduces motion artifacts.• can be used with two or more averages (NSA 2) • does not increase scan time. • cannot be combined with PEAR.
For more information refer to the Help system.
2.5.4 PEAR • stands for Phase Encoded Artifact Reduction.• is a method to reduce breathing artifacts. • uses a sensor to detect patient respiration through either abdominal or
chest wall motion. • can be used in 3D, 2D SE-, IR- and FFE single- and multislice scans.• does not lengthen the total scan time.• cannot be combined with SMART averaging. • can be combined with either the Peripheral Pulse device, ECG or VCG.• does not reduce motion artifacts due to peristalsis.
For more information refer to the Help system.
2.6 Planning the cardiac viewsPlanning the cardiac views is complex because angulations in the 3 different directions could be necessary to visualize the different connections between chambers.
Important is to follow a systematic way to create the different views. Always plan perpendicular on the previous scan.
Useful tools to facilitate planning are:• the Interactive Scanning Tool• 3 Points Planscan • PlanAlign.
2-42 PHILIPS MR
2.6.1 Interactive scanning toolThis tool is described in ‘Interactive scan’ (System Help / AGvol2).
Interactive scanning is especially useful for cardiac imaging, because the required geometry angulations can be found in real time for the different cardiac views.
An interactive scan has to fulfil the following prerequisites:• One slice only• Scan mode 2D, M2D or MS• Cardiac triggering possible• One heart phase only• No dynamic scan• Any scan technique as SE, FFE, Balanced (FFE,TFE), TSE, GraSE or EPI.
When the correct planes have been found and saved in the interactive scan:• |Next scan| has to be clicked in order to start the next scan in the scan list
which is the diagnostic scan (e.g. a breath-hold scan). The geometry parameters are automatically taken over.
• |Stop Scan| has to be clicked to plan the next scans with use geometry (the stored geometry parameters within interactive).
For cardiac applications, interactive scanning should be performed in continuous mode which is also referred to as real-time mode.
N O T E S • TSE is not used due to saturation effects using continuous mode.
• 3 Points Planscan can also be used during interactive scanning.
• Interactive scanning can be combined with SENSE. Use phase oversampling (P os
factor) to avoid SENSE backfolding.
2.6.2 3 Points Planscan (3 PPS) 3 PPS is a tool which helps to define an irregular plane which is determined by the placement of three points on one or more images of different orientations.It can be used in any application, however it is especially useful in planning aortic arch and coronary arteries.
Workflow1 In the Planscan window, click |3PPS|.
The 3 PPS window is overlaid.
PHILIPS MR 2-43
2 Place the three points on any of the three images selected in the Planscan view port.
3 To restart or change the positioning of the points click |Off|.
4 Click |Compute plane| to perform the 3 Points Planscan.
5 Click |3PPS| again to close the 3PPS window.
6 The angulations from the 3 PPS are taken over and displayed. Proceed with routine planning.
2.6.3 PlanAlignPlanAlign is developed for applications where double oblique scans are made with large angulations in e.g. cardiac scanning. It is a powerful tool to avoid in-plane rotation and to avoid SENSE artifacts. When switched to yes, any modification of the angulations will result in a recalculation of the angulations such that the resulting images show no in-plane angulation.
• Transverse scans are aligned such that the horizontal image direction (RL) is in a non-angulated coronal plane.
• Sagittal scans are aligned such that the vertical image direction (FH) is in a non-angulated coronal plane.
• Coronal scans are aligned such that the vertical image direction (FH) is in a non-angulated sagittal plane.
• Double angulated coronal scans tending to sagittal are aligned like sagittal scans. This means that the scans are aligned such that the vertical image direction (FH) is in a non-angulated coronal plane.
N O T E When the geometry has been planned using InterActive scanning, PlanAlign will be set
to ’No’.
2-44 PHILIPS MR
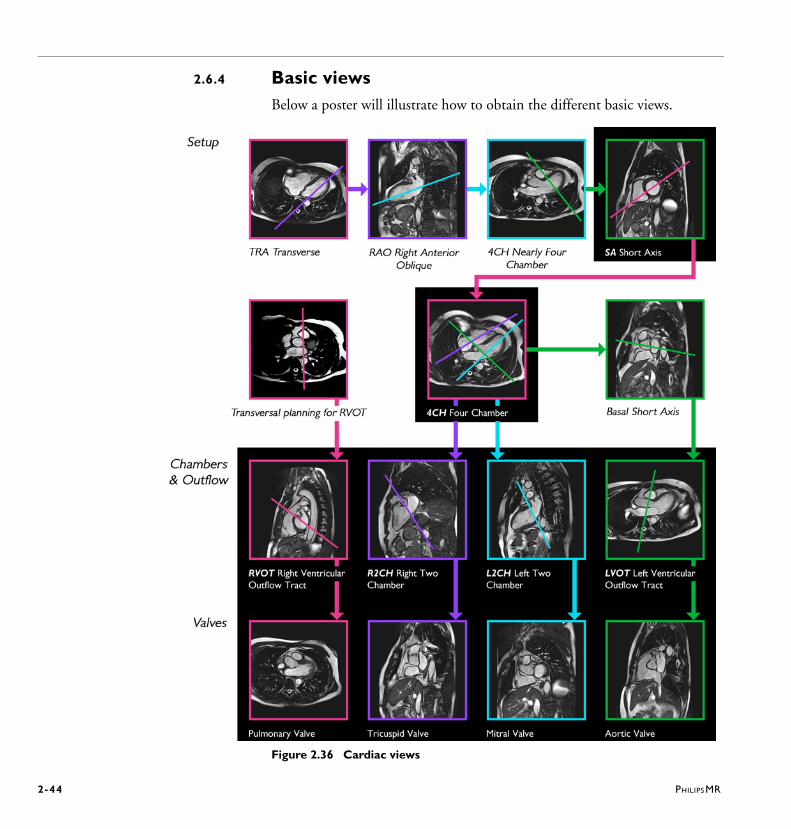
2.6.4 Basic viewsBelow a poster will illustrate how to obtain the different basic views.
Figure 2.36 Cardiac views

PHILIPS MR 2-45
1 Start with a transverse image through the left ventricle.
2 Define the RAO (Right Anterior Oblique) view on the transverse image by selecting a line through apex and centre of mitral valve.
3 Define an approximate Four Chamber view on the RAO by defining a line through the apex and centre of the mitral valve.
4 Define the Short Axis view, three methods are available:• Place a line orthogonal to the (long axis) line through the apex and the
centre of the mitral valve (this is the most accurate method)• Place a line parallel to the mitral valve (this method makes it easier to
decide whether to include the basal slice/s during post-processing)• Place a line orthogonal to the septum (this is the best method for Right
Ventricle view)
5 From the Short Axis view, the true Four Chamber view can be defined by placing a line through the centre of the Left Ventricular Cavity and the inferior margin of the right ventricle
2.6.5 Outflow tracts
Right Two Chamber (R2CH) view • can be derived from the true Four Chamber view.• can be defined by placing a line through the tricuspid valve parallel to the
septum.
Left Two Chamber (L2CH) view• can be derived from the true Four Chamber view.• can be defined by placing a line through the apex and the center of the
mitral valve.
Left Ventricular Outflow Tract (LVOT)• can be derived from the true Four Chamber view.• An additional basal short axis scan can be defined which is used to plan the
Left Ventricular Outflow Tract (LVOT) by placing a line through the Left Ventricle and Aorta.
Right Ventricular Outflow Tract (RVOT)• is best planned on a transverse view that shows the pulmonary artery
valves.

2-46 PHILIPS MR
Pulmonary valves • are planned on the RVOT by placing a line through the pulmonary valve
seen already on the RVOT view.
Tricuspid valves • are planned on the R2CH by placing a line through the tricuspid valves
seen on the R2CH view.
Mitral valves • are planned on the L2CH by placing a line through the mitral valves
already seen on the L2CH view.
Aortic valves • are planned on the LVOT by placing a line through the aortic valves
already seen on the LVOT.
PHILIPS MR 2-47
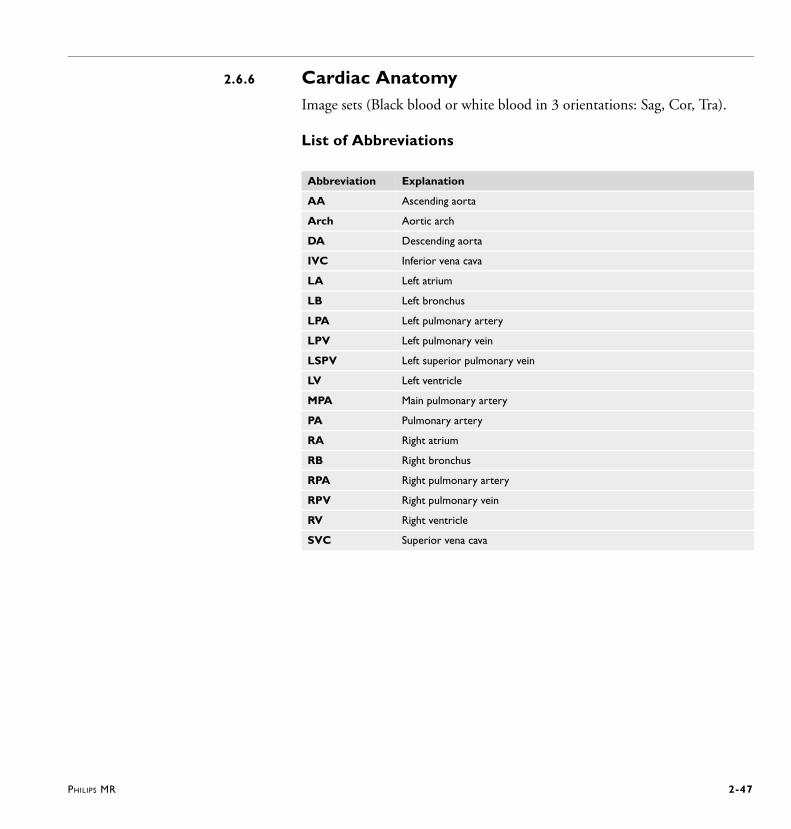
2.6.6 Cardiac AnatomyImage sets (Black blood or white blood in 3 orientations: Sag, Cor, Tra).
List of Abbreviations
Abbreviation Explanation
AA Ascending aorta
Arch Aortic arch
DA Descending aorta
IVC Inferior vena cava
LA Left atrium
LB Left bronchus
LPA Left pulmonary artery
LPV Left pulmonary vein
LSPV Left superior pulmonary vein
LV Left ventricle
MPA Main pulmonary artery
PA Pulmonary artery
RA Right atrium
RB Right bronchus
RPA Right pulmonary artery
RPV Right pulmonary vein
RV Right ventricle
SVC Superior vena cava

2-48 PHILIPS MR
PHILIPS MR 3-1
3 Clinical Cardiac MR
This chapter describes clinical cardiac MR and its various applications. Click on a link to go to the corresponding description:
• Morphology• Function• Tagging• Flow quantification• Perfusion (Temporal Enhancement) (not available in the U.S.)• Late Enhancement (Spatial Enhancement) (not available in the U.S.)• Coronary Angiography
k-t BLASTThe scan method k-t BLAST can be implemented in all kind of cine scans and in dynamic scans. For more information refer to Application Guide volume 2, chapter Scan Methods.
3.1 MorphologyFor Black Blood imaging basically two principles can be used.
Outflow• The first principle uses the outflow effect in Spin Echo based methods.
Blood that only experiences the 90º excitation pulse and not the 180º refocusing pulse does not give any signal, and appears as black in the image.
Cancellation• The other principle is to null the blood using an inversion pulse.
3-2 PHILIPS MR
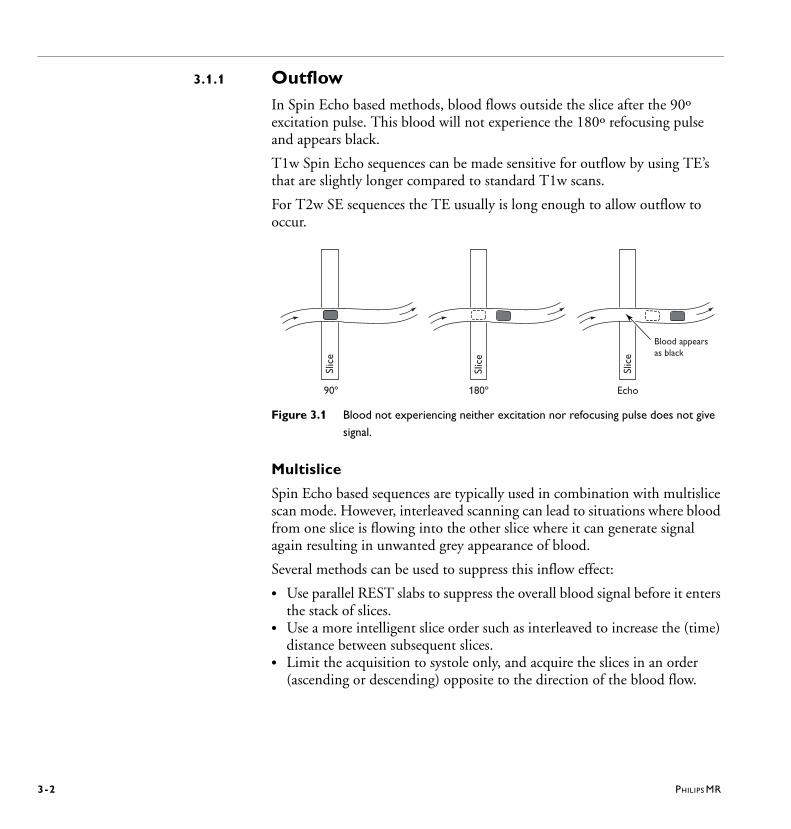
3.1.1 OutflowIn Spin Echo based methods, blood flows outside the slice after the 90º excitation pulse. This blood will not experience the 180º refocusing pulse and appears black.
T1w Spin Echo sequences can be made sensitive for outflow by using TE’s that are slightly longer compared to standard T1w scans.
For T2w SE sequences the TE usually is long enough to allow outflow to occur.
Figure 3.1 Blood not experiencing neither excitation nor refocusing pulse does not give
signal.
Multislice
Spin Echo based sequences are typically used in combination with multislice scan mode. However, interleaved scanning can lead to situations where blood from one slice is flowing into the other slice where it can generate signal again resulting in unwanted grey appearance of blood.
Several methods can be used to suppress this inflow effect:
• Use parallel REST slabs to suppress the overall blood signal before it enters the stack of slices.
• Use a more intelligent slice order such as interleaved to increase the (time) distance between subsequent slices.
• Limit the acquisition to systole only, and acquire the slices in an order (ascending or descending) opposite to the direction of the blood flow.
Slic
e
Slic
e
Slic
e
90º Echo180º
Blood appearsas black
PHILIPS MR 3-3
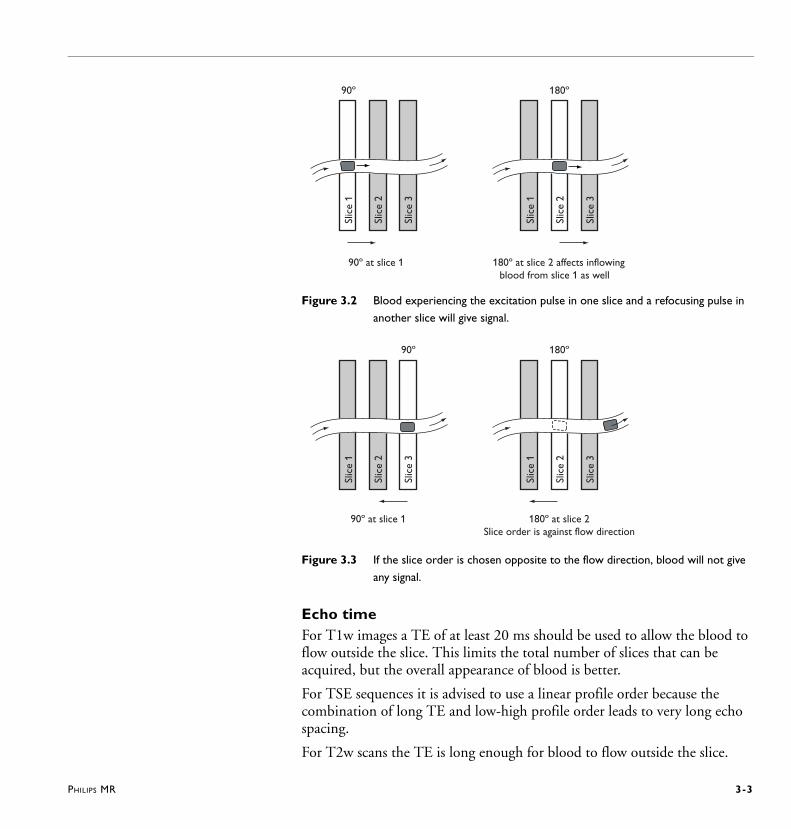
Figure 3.2 Blood experiencing the excitation pulse in one slice and a refocusing pulse in
another slice will give signal.
Figure 3.3 If the slice order is chosen opposite to the flow direction, blood will not give
any signal.
Echo timeFor T1w images a TE of at least 20 ms should be used to allow the blood to flow outside the slice. This limits the total number of slices that can be acquired, but the overall appearance of blood is better.
For TSE sequences it is advised to use a linear profile order because the combination of long TE and low-high profile order leads to very long echo spacing.
For T2w scans the TE is long enough for blood to flow outside the slice.
Slic
e 1
90º
Slic
e 2
Slic
e 3
Slic
e 1
180º
Slic
e 2
Slic
e 3
90º at slice 1 180º at slice 2 affects inflowingblood from slice 1 as well
90ºSl
ice
1
Slic
e 2
Slic
e 3
180º
Slic
e 1
Slic
e 2
Slic
e 3
90º at slice 1 180º at slice 2Slice order is against flow direction
3-4 PHILIPS MR
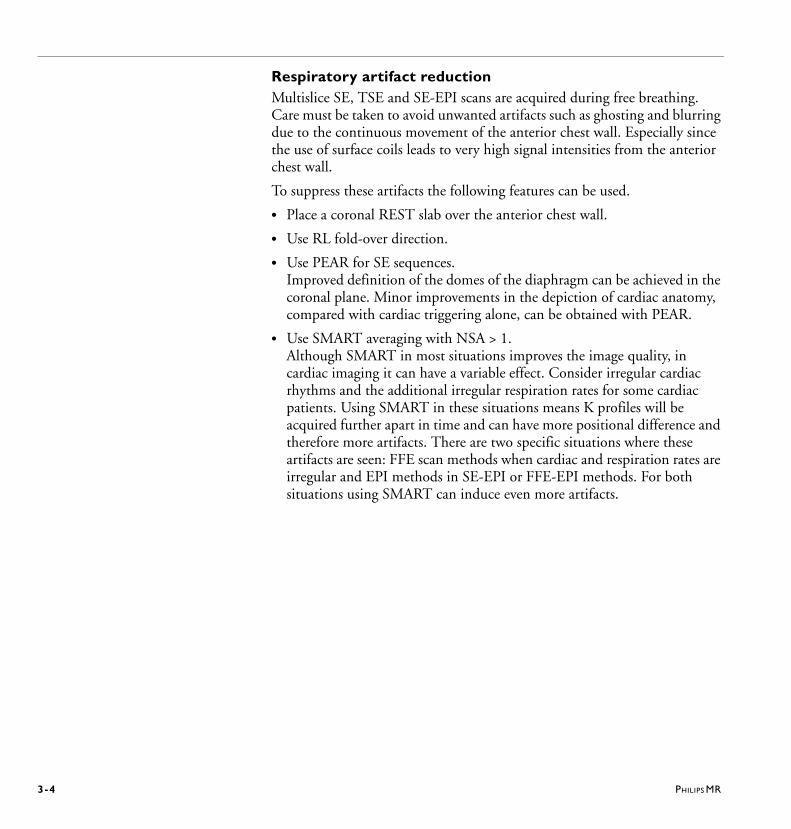
Respiratory artifact reductionMultislice SE, TSE and SE-EPI scans are acquired during free breathing. Care must be taken to avoid unwanted artifacts such as ghosting and blurring due to the continuous movement of the anterior chest wall. Especially since the use of surface coils leads to very high signal intensities from the anterior chest wall.
To suppress these artifacts the following features can be used.
• Place a coronal REST slab over the anterior chest wall.
• Use RL fold-over direction.
• Use PEAR for SE sequences. Improved definition of the domes of the diaphragm can be achieved in the coronal plane. Minor improvements in the depiction of cardiac anatomy, compared with cardiac triggering alone, can be obtained with PEAR.
• Use SMART averaging with NSA > 1.Although SMART in most situations improves the image quality, in cardiac imaging it can have a variable effect. Consider irregular cardiac rhythms and the additional irregular respiration rates for some cardiac patients. Using SMART in these situations means K profiles will be acquired further apart in time and can have more positional difference and therefore more artifacts. There are two specific situations where these artifacts are seen: FFE scan methods when cardiac and respiration rates are irregular and EPI methods in SE-EPI or FFE-EPI methods. For both situations using SMART can induce even more artifacts.
PHILIPS MR 3-5
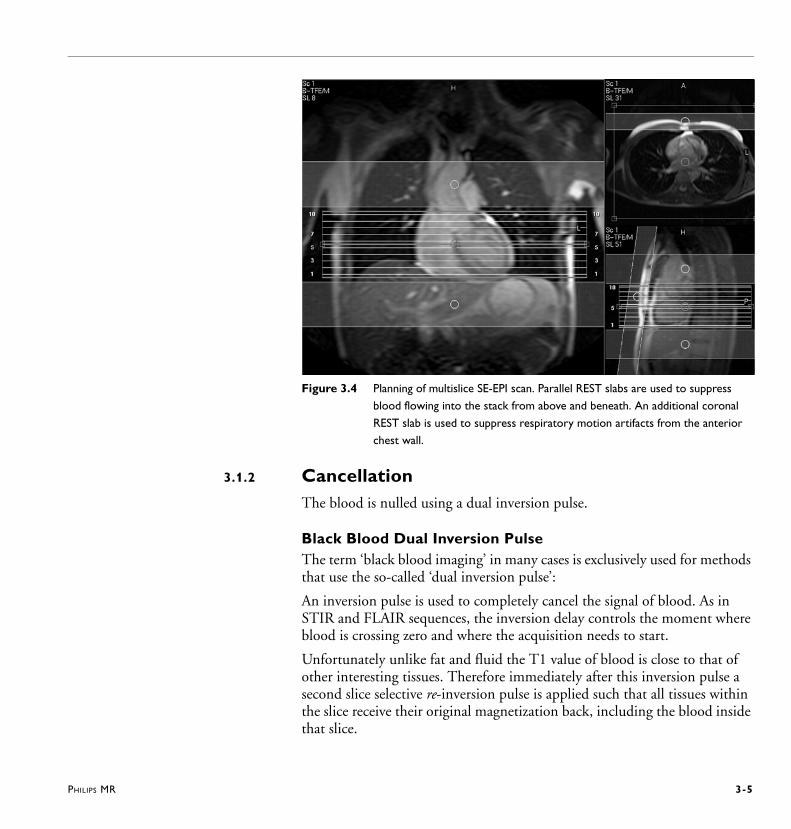
Figure 3.4 Planning of multislice SE-EPI scan. Parallel REST slabs are used to suppress
blood flowing into the stack from above and beneath. An additional coronal
REST slab is used to suppress respiratory motion artifacts from the anterior
chest wall.
3.1.2 CancellationThe blood is nulled using a dual inversion pulse.
Black Blood Dual Inversion PulseThe term ‘black blood imaging’ in many cases is exclusively used for methods that use the so-called ‘dual inversion pulse’:
An inversion pulse is used to completely cancel the signal of blood. As in STIR and FLAIR sequences, the inversion delay controls the moment where blood is crossing zero and where the acquisition needs to start.
Unfortunately unlike fat and fluid the T1 value of blood is close to that of other interesting tissues. Therefore immediately after this inversion pulse a second slice selective re-inversion pulse is applied such that all tissues within the slice receive their original magnetization back, including the blood inside that slice.
3-6 PHILIPS MR
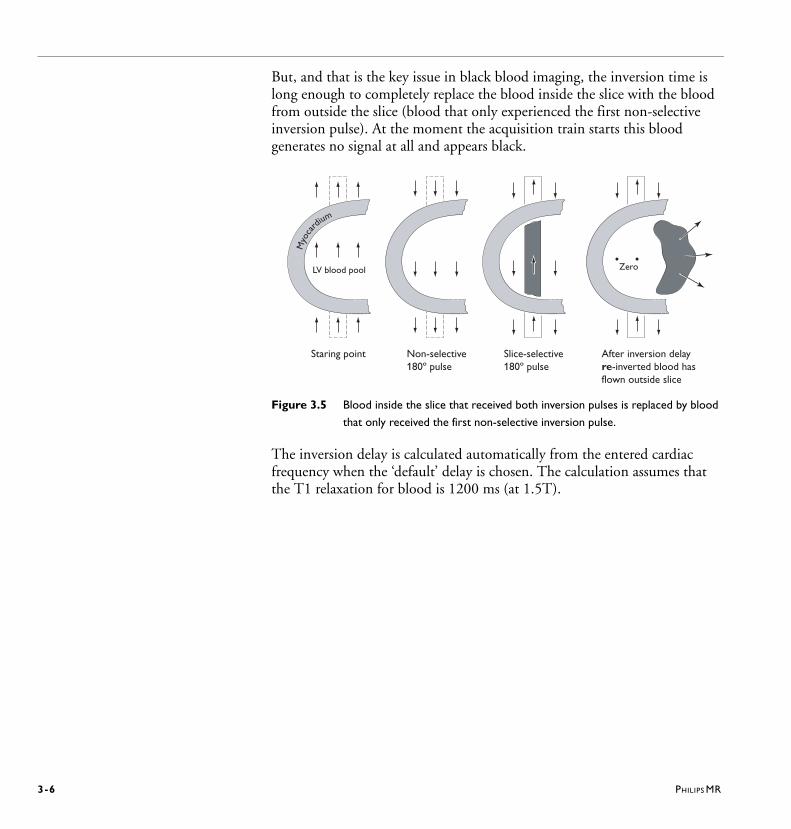
But, and that is the key issue in black blood imaging, the inversion time is long enough to completely replace the blood inside the slice with the blood from outside the slice (blood that only experienced the first non-selective inversion pulse). At the moment the acquisition train starts this blood generates no signal at all and appears black.
Figure 3.5 Blood inside the slice that received both inversion pulses is replaced by blood
that only received the first non-selective inversion pulse.
The inversion delay is calculated automatically from the entered cardiac frequency when the ‘default’ delay is chosen. The calculation assumes that the T1 relaxation for blood is 1200 ms (at 1.5T).
Myo
ca
rdium
LV blood pool
Staring point Non-selective180º pulse
Slice-selective180º pulse
After inversion delayre-inverted blood hasflown outside slice
Zero

PHILIPS MR 3-7
Figure 3.6 At the moment that blood from outside the slice crosses zero, the acquisition
train is started.
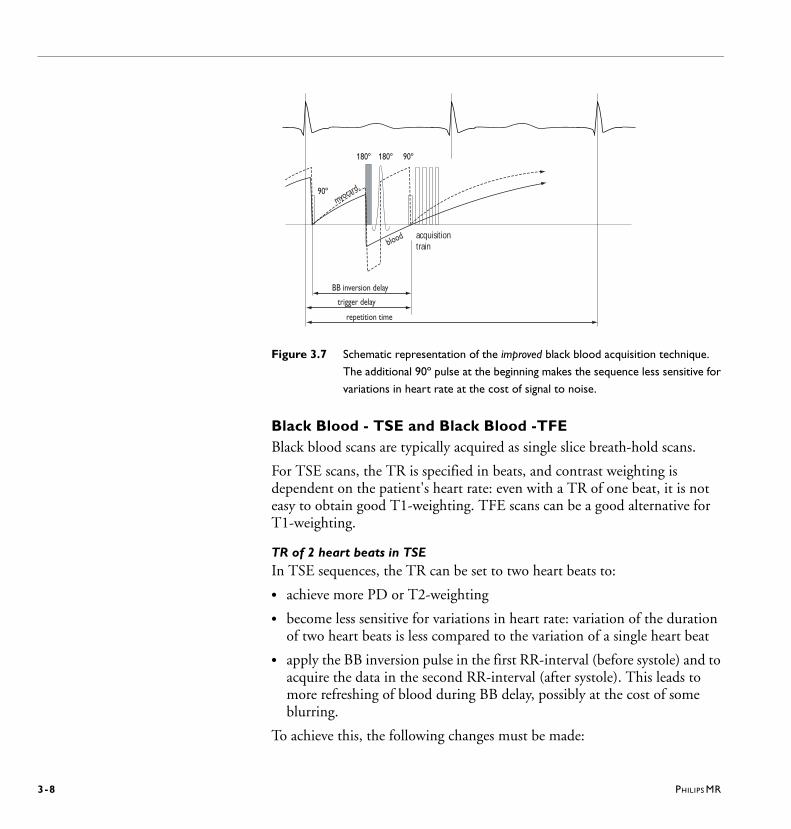
An irregular heart beat leads to variations in the R-R interval. This can lead to unsuccessful blackening of the blood because the calculation of the inversion time assumes a steady R-R interval. The black blood pulse can be made insensitive for R-R variations by selecting the ‘improved’ version of the black blood pulse. The improved black blood pulse applies an additional 90º saturation pulse. The time between this 90º pulse and the acquisition train is used to calculate the inversion delay. The disadvantage is that the overall amount of signal decreases due to the applied saturation pulse.
180º 180º 90º
acquisitiontrain
myocardium
blood
BB inversion delay
trigger delay
repetition time
3-8 PHILIPS MR
Figure 3.7 Schematic representation of the improved black blood acquisition technique.
The additional 90º pulse at the beginning makes the sequence less sensitive for
variations in heart rate at the cost of signal to noise.
Black Blood - TSE and Black Blood -TFEBlack blood scans are typically acquired as single slice breath-hold scans.
For TSE scans, the TR is specified in beats, and contrast weighting is dependent on the patient's heart rate: even with a TR of one beat, it is not easy to obtain good T1-weighting. TFE scans can be a good alternative for T1-weighting.
TR of 2 heart beats in TSEIn TSE sequences, the TR can be set to two heart beats to:
• achieve more PD or T2-weighting
• become less sensitive for variations in heart rate: variation of the duration of two heart beats is less compared to the variation of a single heart beat
• apply the BB inversion pulse in the first RR-interval (before systole) and to acquire the data in the second RR-interval (after systole). This leads to more refreshing of blood during BB delay, possibly at the cost of some blurring.
To achieve this, the following changes must be made:
180º 180º 90º
acquisitiontrain
myocard.
blood
BB inversion delay
trigger delay
repetition time
90º

PHILIPS MR 3-9
1 Set the ’No Trigger Period [beats]’ to 2 heart beats. The info page shows the actual ’No Trigger Period’ (2 x RR interval minus 2 x RR window) and the BB inversion delay.
2 Set the trigger delay to ’user defined’ in such a way that the trigger occurs in the 2nd RR interval prior to the shot, and the BB pulse in the 1st RR interval. For example, a RR interval of 1000 ms with a RR window of 10% results in a No Trigger Period of 1800 ms. With a BB inversion delay of 650 ms, set the trigger delay to approximately 1400 ms.
TR of 2 heart beats in TFEThe TR in TFE is specified as the time between excitations, and is always short. To achieve reduced sensitivity for heart rate variations, the following change can be made:
• Set the 'TFE shot interval" to user defined and then to a value of 2 beats. This will not change the effectiveness of the black blood prepulse, however, the SNR will increase and the scan will be less sensitive to heart rate variations (but the scan will take longer)
For TSE and TFEIt is important that the slice on which the BB pulse is given is more or less the same as for the acquisition train. Therefore both the black blood pulse as well as the acquisition train should be acquired in comparable phases of the cardiac cycle: before systole and after systole.
To ensure that the black blood pulse is given on the acquisition slice the ‘black blood slice thickness’ parameter is set to a value that is approximately two or three times that of the acquisition slice.
3-10 PHILIPS MR
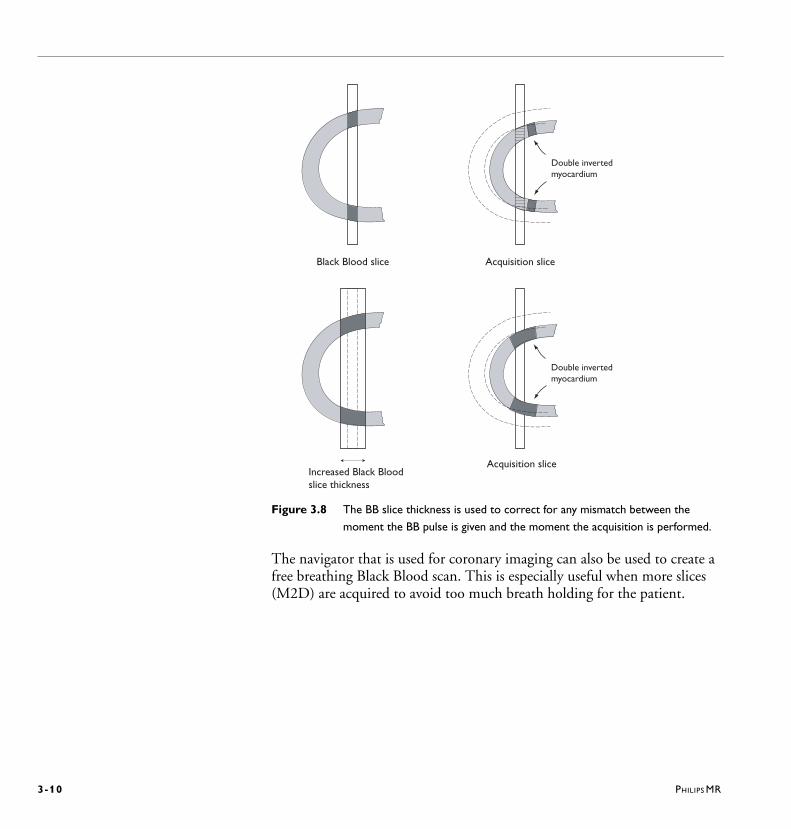
Figure 3.8 The BB slice thickness is used to correct for any mismatch between the
moment the BB pulse is given and the moment the acquisition is performed.
The navigator that is used for coronary imaging can also be used to create a free breathing Black Blood scan. This is especially useful when more slices (M2D) are acquired to avoid too much breath holding for the patient.
Black Blood slice Acquisition slice
Double invertedmyocardium
Increased Black Bloodslice thickness
Acquisition slice
Double invertedmyocardium
PHILIPS MR 3-11
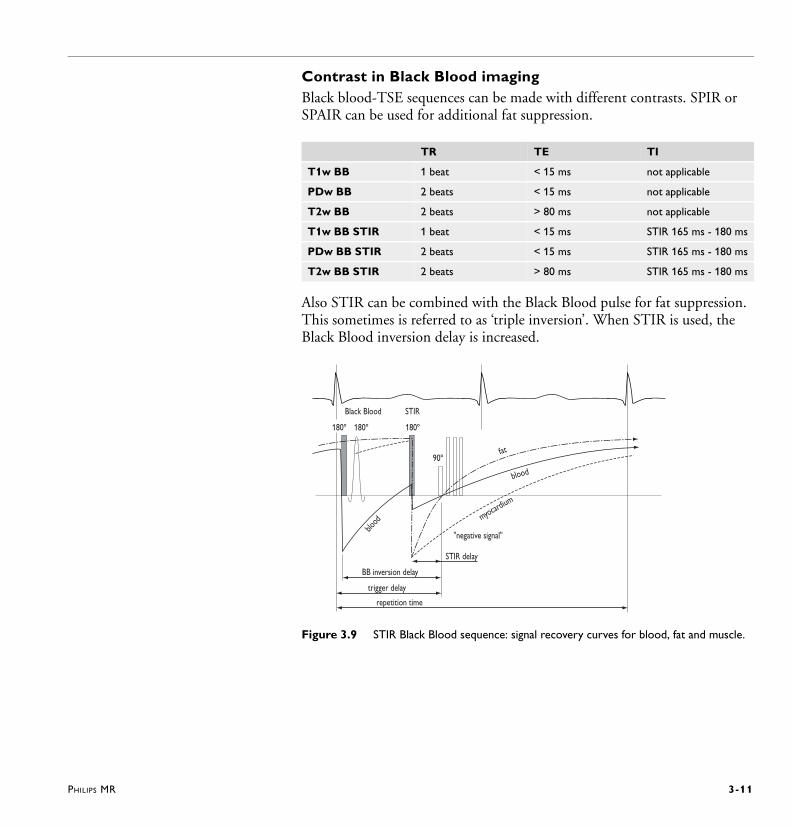
Contrast in Black Blood imagingBlack blood-TSE sequences can be made with different contrasts. SPIR or SPAIR can be used for additional fat suppression.
Also STIR can be combined with the Black Blood pulse for fat suppression. This sometimes is referred to as ‘triple inversion’. When STIR is used, the Black Blood inversion delay is increased.
Figure 3.9 STIR Black Blood sequence: signal recovery curves for blood, fat and muscle.
TR TE TI
T1w BB 1 beat < 15 ms not applicable
PDw BB 2 beats < 15 ms not applicable
T2w BB 2 beats > 80 ms not applicable
T1w BB STIR 1 beat < 15 ms STIR 165 ms - 180 ms
PDw BB STIR 2 beats < 15 ms STIR 165 ms - 180 ms
T2w BB STIR 2 beats > 80 ms STIR 165 ms - 180 ms
180º 180º
90º
blood
repetition time
blood
fat
myocardium
180º
Black Blood STIR
"negative signal"
BB inversion delay
trigger delay
STIR delay
3-12 PHILIPS MR
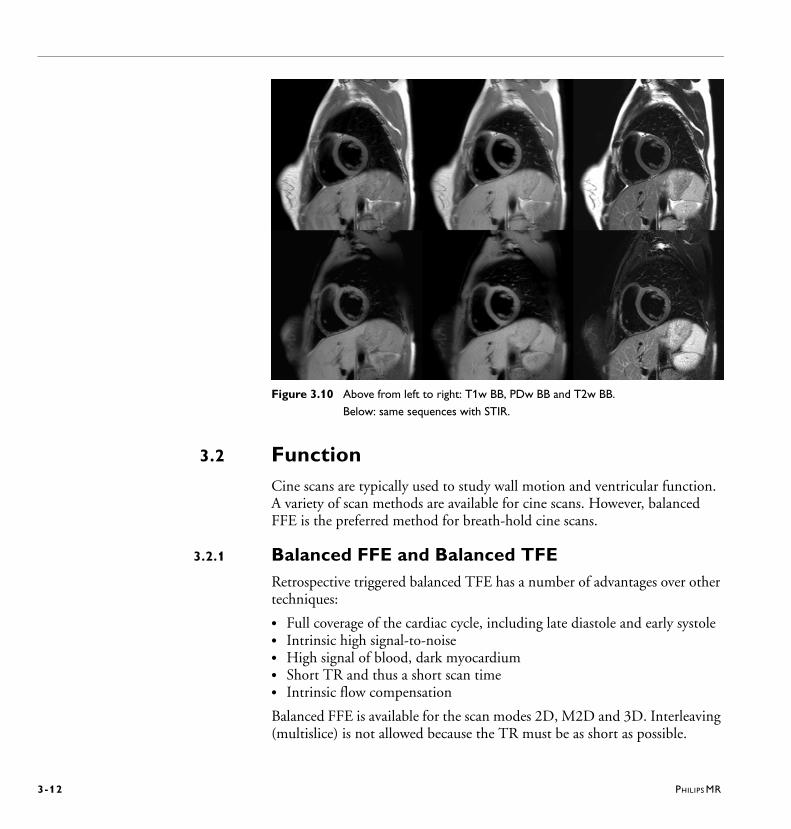
Figure 3.10 Above from left to right: T1w BB, PDw BB and T2w BB.
Below: same sequences with STIR.
3.2 FunctionCine scans are typically used to study wall motion and ventricular function. A variety of scan methods are available for cine scans. However, balanced FFE is the preferred method for breath-hold cine scans.
3.2.1 Balanced FFE and Balanced TFERetrospective triggered balanced TFE has a number of advantages over other techniques:
• Full coverage of the cardiac cycle, including late diastole and early systole• Intrinsic high signal-to-noise• High signal of blood, dark myocardium• Short TR and thus a short scan time• Intrinsic flow compensation
Balanced FFE is available for the scan modes 2D, M2D and 3D. Interleaving (multislice) is not allowed because the TR must be as short as possible.
PHILIPS MR 3-13
Contrast in b-FFE• Very high signal for tissues with a high T2/T1 ratio independent of the
absolute value of T1 and T2 itself and independent of the TR.
• Excellent fluid-tissue contrast with very short TR’s and large flip angles.Typical values are: TR of 4 ms and flip angle of 50o to 90o.
• Table: Signal appearance of tissue in a steady-state balanced scan.
Artifact level
b-FFE• is rather flow-insensitive. The large steady state signal of fluids with T2/T1
ratio is hardly deteriorated by flow. The maximum intrinsic flow compensation is achieved when the TE is half the TR.
• is sensitive to B0 inhomogeneities represented by zebra stripe artifacts in the images. - Severity of the artifacts will scale linearly with B0 and TR. - Volume shim or auto shim is mandatory.
N O T E S • Ghost artifacts can appear when there is high accelerating flow originating from
larger vessels such as aorta or pulmonary artery.
• The shim volume is best positioned over the area of the great vessels and the
ventricles. Placing a shim volume directly over the problematic areas will
significantly reduce these artifacts.
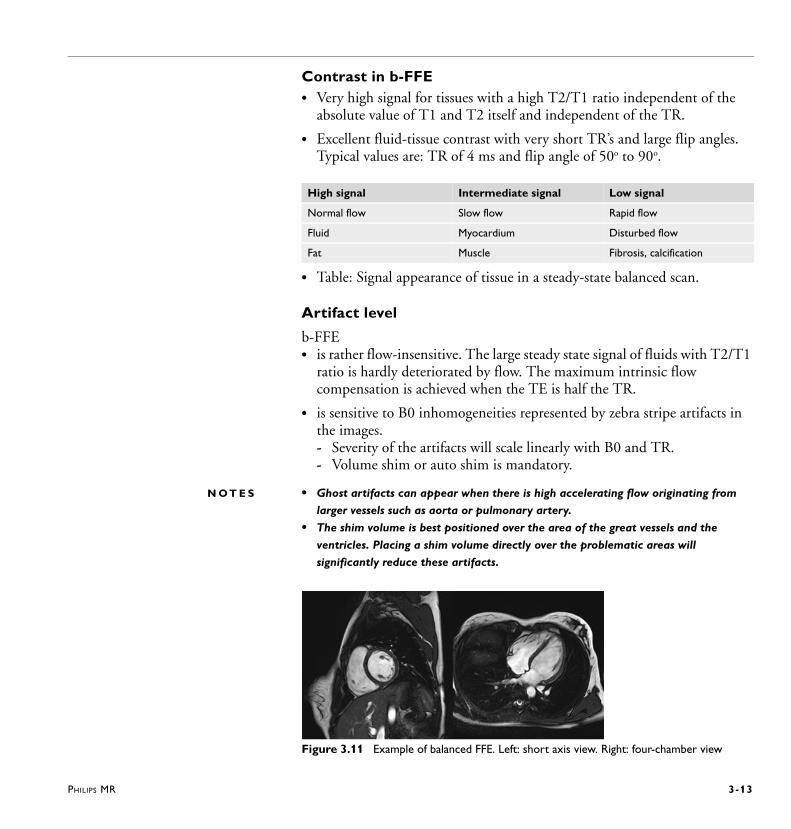
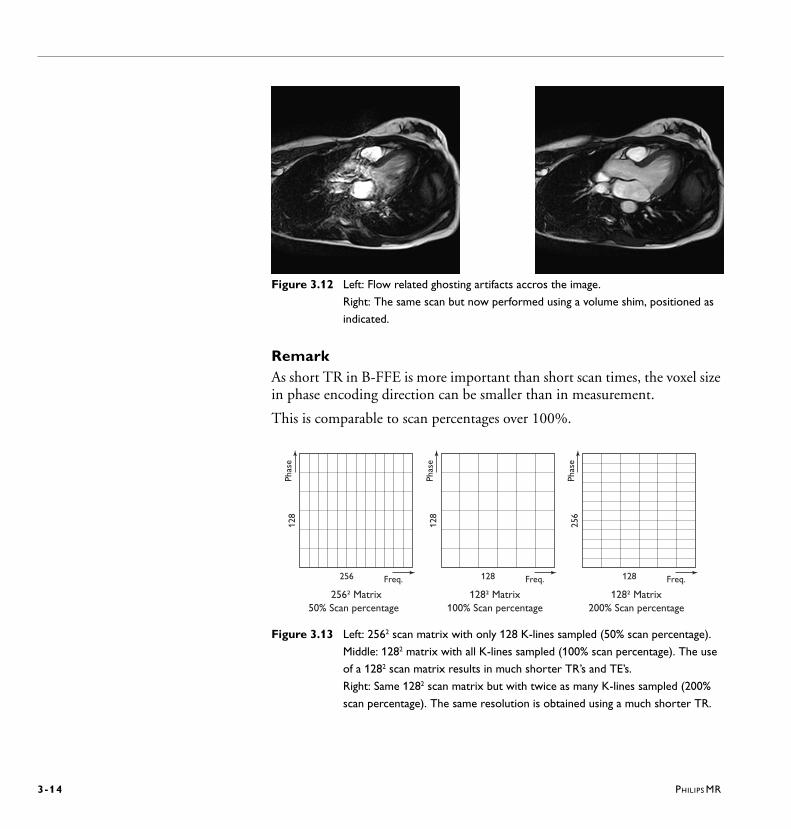
Figure 3.11 Example of balanced FFE. Left: short axis view. Right: four-chamber view
High signal Intermediate signal Low signal
Normal flow Slow flow Rapid flow
Fluid Myocardium Disturbed flow
Fat Muscle Fibrosis, calcification
3-14 PHILIPS MR
Figure 3.12 Left: Flow related ghosting artifacts accros the image.
Right: The same scan but now performed using a volume shim, positioned as
indicated.
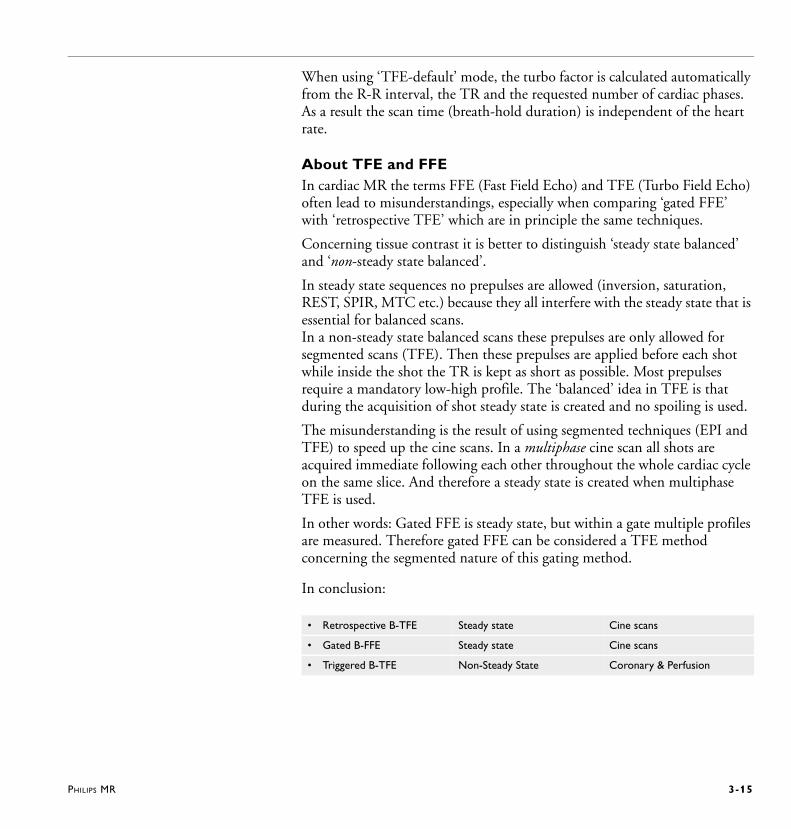
RemarkAs short TR in B-FFE is more important than short scan times, the voxel size in phase encoding direction can be smaller than in measurement.
This is comparable to scan percentages over 100%.
Figure 3.13 Left: 2562 scan matrix with only 128 K-lines sampled (50% scan percentage).
Middle: 1282 matrix with all K-lines sampled (100% scan percentage). The use
of a 1282 scan matrix results in much shorter TR’s and TE’s.
Right: Same 1282 scan matrix but with twice as many K-lines sampled (200%
scan percentage). The same resolution is obtained using a much shorter TR.
Phas
e
Freq.256
128
256² Matrix50% Scan percentage
Phas
eFreq.128
256
128² Matrix200% Scan percentage
Phas
e
Freq.128
128
128² Matrix100% Scan percentage
PHILIPS MR 3-15
When using ‘TFE-default’ mode, the turbo factor is calculated automatically from the R-R interval, the TR and the requested number of cardiac phases. As a result the scan time (breath-hold duration) is independent of the heart rate.
About TFE and FFEIn cardiac MR the terms FFE (Fast Field Echo) and TFE (Turbo Field Echo) often lead to misunderstandings, especially when comparing ‘gated FFE’ with ‘retrospective TFE’ which are in principle the same techniques.
Concerning tissue contrast it is better to distinguish ‘steady state balanced’ and ‘non-steady state balanced’.
In steady state sequences no prepulses are allowed (inversion, saturation, REST, SPIR, MTC etc.) because they all interfere with the steady state that is essential for balanced scans. In a non-steady state balanced scans these prepulses are only allowed for segmented scans (TFE). Then these prepulses are applied before each shot while inside the shot the TR is kept as short as possible. Most prepulses require a mandatory low-high profile. The ‘balanced’ idea in TFE is that during the acquisition of shot steady state is created and no spoiling is used.
The misunderstanding is the result of using segmented techniques (EPI and TFE) to speed up the cine scans. In a multiphase cine scan all shots are acquired immediate following each other throughout the whole cardiac cycle on the same slice. And therefore a steady state is created when multiphase TFE is used.
In other words: Gated FFE is steady state, but within a gate multiple profiles are measured. Therefore gated FFE can be considered a TFE method concerning the segmented nature of this gating method.
In conclusion:
• Retrospective B-TFE Steady state Cine scans
• Gated B-FFE Steady state Cine scans
• Triggered B-TFE Non-Steady State Coronary & Perfusion
3-16 PHILIPS MR
3.2.2 Non-balanced FFERefer to the Help system for more information on the non-balanced scan techniques Turbo Field Echo (TFE), FFE-EPI and Free breathing FFE.
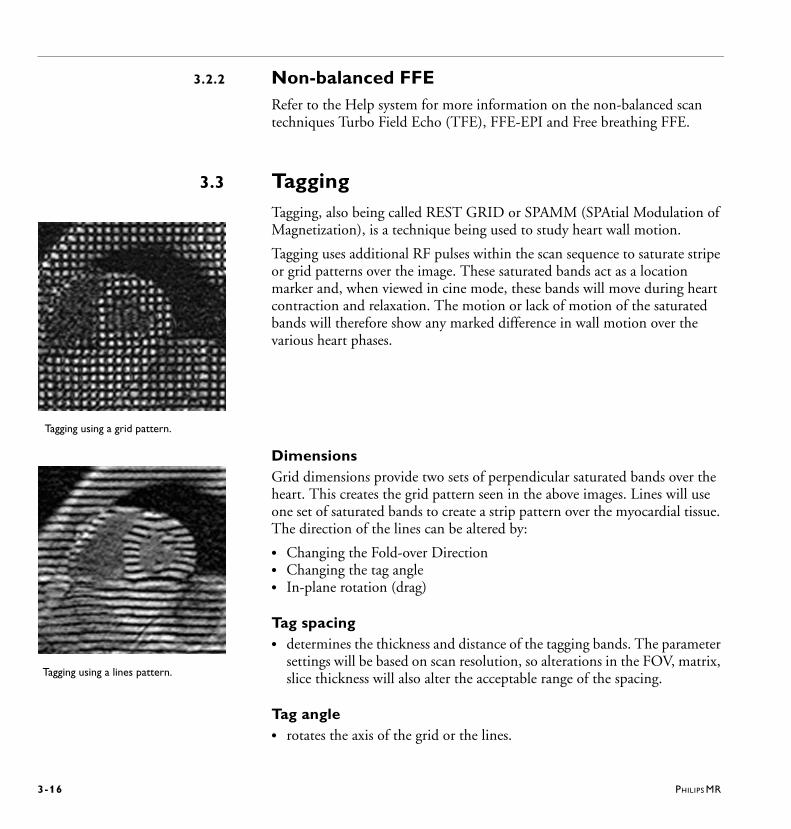
3.3 TaggingTagging, also being called REST GRID or SPAMM (SPAtial Modulation of Magnetization), is a technique being used to study heart wall motion.
Tagging uses additional RF pulses within the scan sequence to saturate stripe or grid patterns over the image. These saturated bands act as a location marker and, when viewed in cine mode, these bands will move during heart contraction and relaxation. The motion or lack of motion of the saturated bands will therefore show any marked difference in wall motion over the various heart phases.
DimensionsGrid dimensions provide two sets of perpendicular saturated bands over the heart. This creates the grid pattern seen in the above images. Lines will use one set of saturated bands to create a strip pattern over the myocardial tissue. The direction of the lines can be altered by:
• Changing the Fold-over Direction• Changing the tag angle• In-plane rotation (drag)
Tag spacing• determines the thickness and distance of the tagging bands. The parameter
settings will be based on scan resolution, so alterations in the FOV, matrix, slice thickness will also alter the acceptable range of the spacing.
Tag angle• rotates the axis of the grid or the lines.
Tagging using a grid pattern.
Tagging using a lines pattern.
PHILIPS MR 3-17
0o provide a normal upright orientation of the grid, whereas 45o provide a diagonal grid.
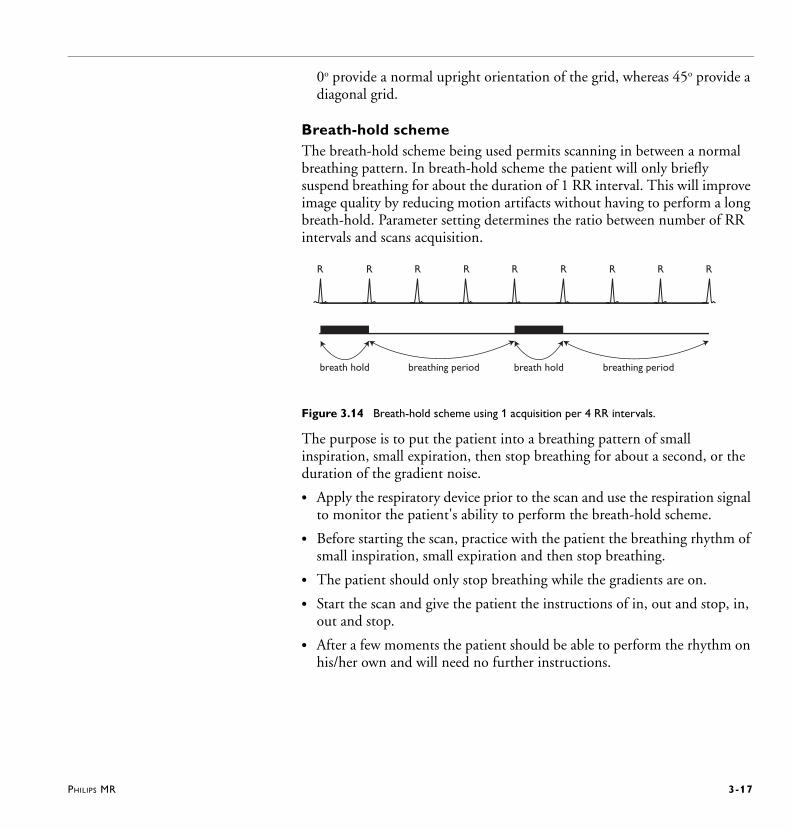
Breath-hold schemeThe breath-hold scheme being used permits scanning in between a normal breathing pattern. In breath-hold scheme the patient will only briefly suspend breathing for about the duration of 1 RR interval. This will improve image quality by reducing motion artifacts without having to perform a long breath-hold. Parameter setting determines the ratio between number of RR intervals and scans acquisition.
Figure 3.14 Breath-hold scheme using 1 acquisition per 4 RR intervals.
The purpose is to put the patient into a breathing pattern of small inspiration, small expiration, then stop breathing for about a second, or the duration of the gradient noise.
• Apply the respiratory device prior to the scan and use the respiration signal to monitor the patient's ability to perform the breath-hold scheme.
• Before starting the scan, practice with the patient the breathing rhythm of small inspiration, small expiration and then stop breathing.
• The patient should only stop breathing while the gradients are on.
• Start the scan and give the patient the instructions of in, out and stop, in, out and stop.
• After a few moments the patient should be able to perform the rhythm on his/her own and will need no further instructions.
breath hold breath holdbreathing period breathing period
R R R R R R R R R
3-18 PHILIPS MR
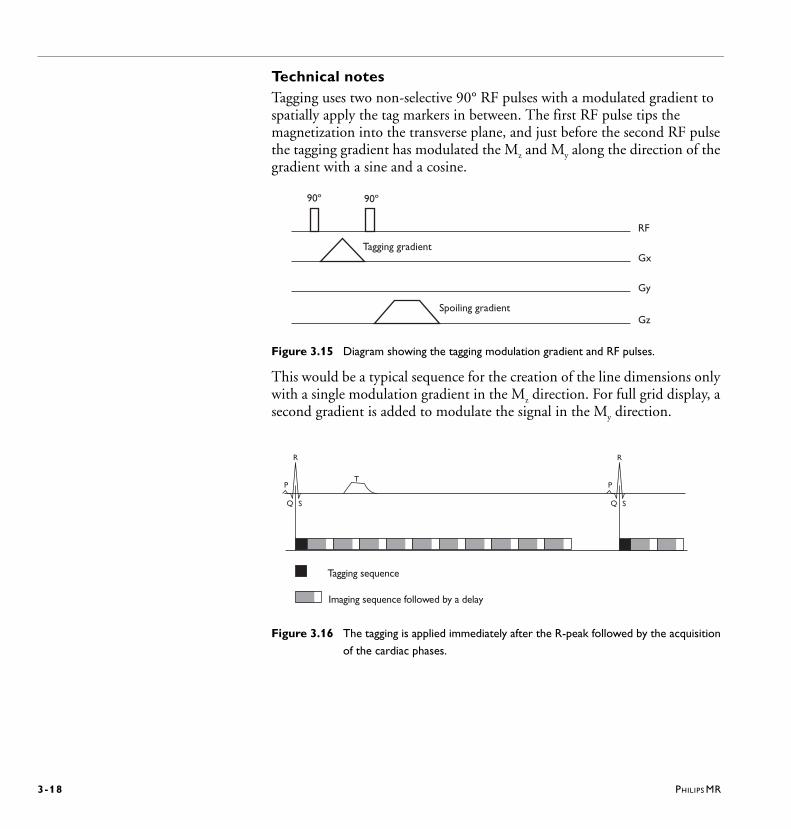
Technical notesTagging uses two non-selective 90° RF pulses with a modulated gradient to spatially apply the tag markers in between. The first RF pulse tips the magnetization into the transverse plane, and just before the second RF pulse the tagging gradient has modulated the Mz and My along the direction of the gradient with a sine and a cosine.
Figure 3.15 Diagram showing the tagging modulation gradient and RF pulses.
This would be a typical sequence for the creation of the line dimensions only with a single modulation gradient in the Mz direction. For full grid display, a second gradient is added to modulate the signal in the My direction.
Figure 3.16 The tagging is applied immediately after the R-peak followed by the acquisition
of the cardiac phases.
RF
Gx
Gy
Gz
90º 90º
Tagging gradient
Spoiling gradient
P
R
Q S
P
R
Q S
T
Tagging sequence
Imaging sequence followed by a delay

PHILIPS MR 3-19
3.4 Flow quantificationQuantification of blood flow is done using phase contrast angiography (PCA). This section addresses both the acquisition method and the interpretation of quantitative flow data.
3.4.1 Phase Contrast Angiography (PCA)The technical principles behind PCA are explained in more detail in ‘Phase Contrast Angiography (PCA)’ (System Help / AGvol2). Basically flow quantification is performed using two measurements (in a single scan) with opposite flow encoding directions. The assumption is that the phase of stationary tissue is the same in both measurements and that areas that represent flow (or motion) have different phases in both measurements. The subtraction of both measurements result in phase images (PCA/P) were the phase of stationary tissue is zero and the phase of flow and motion is linearly related to the velocity.
Figure 3.17 Two measurements are used to create phase difference images that represent
flow or motion.
Phase correctionIn practice the phase difference of the signal is not only the result of flow and motion. B0 and B1 inhomogeneities (and susceptibility) result in phase differences that are not related to flow. However, subtraction of the two measurements compensates for this.
More difficult are phase errors induced by Eddy Currents that cannot be compensated for using subtraction. Because the severity of those errors is different, a local phase correction is applied (LPC filter), assuming that the
+
-
PCA/M PCA/P
Bipolar gradient Static spins Moving spins PCA/M=Complex differencePCA/P=Phase difference
3-20 PHILIPS MR
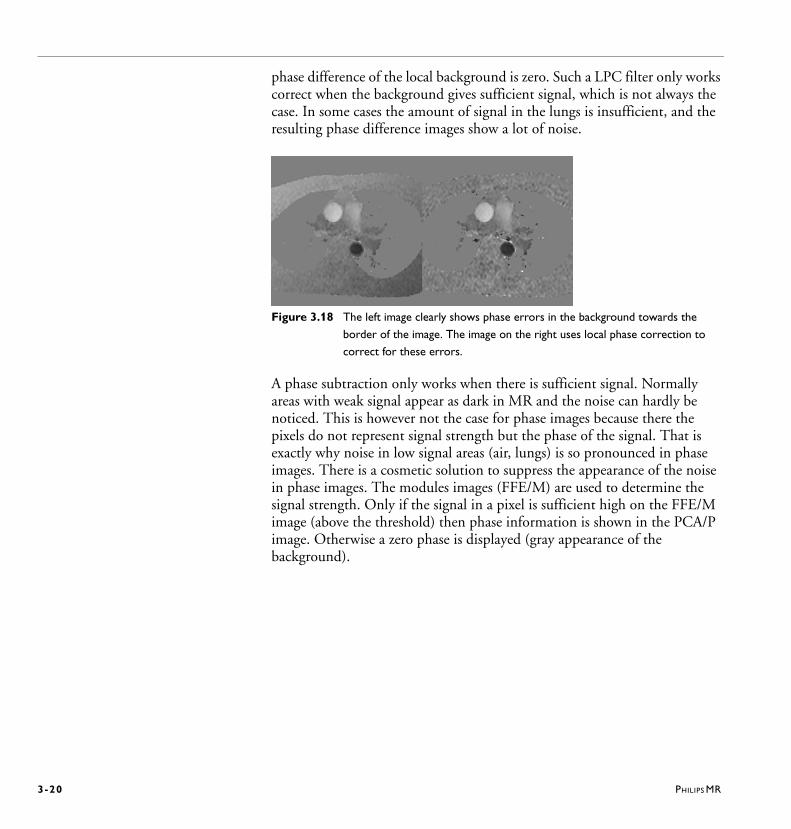
phase difference of the local background is zero. Such a LPC filter only works correct when the background gives sufficient signal, which is not always the case. In some cases the amount of signal in the lungs is insufficient, and the resulting phase difference images show a lot of noise.
Figure 3.18 The left image clearly shows phase errors in the background towards the
border of the image. The image on the right uses local phase correction to
correct for these errors.
A phase subtraction only works when there is sufficient signal. Normally areas with weak signal appear as dark in MR and the noise can hardly be noticed. This is however not the case for phase images because there the pixels do not represent signal strength but the phase of the signal. That is exactly why noise in low signal areas (air, lungs) is so pronounced in phase images. There is a cosmetic solution to suppress the appearance of the noise in phase images. The modules images (FFE/M) are used to determine the signal strength. Only if the signal in a pixel is sufficient high on the FFE/M image (above the threshold) then phase information is shown in the PCA/P image. Otherwise a zero phase is displayed (gray appearance of the background).
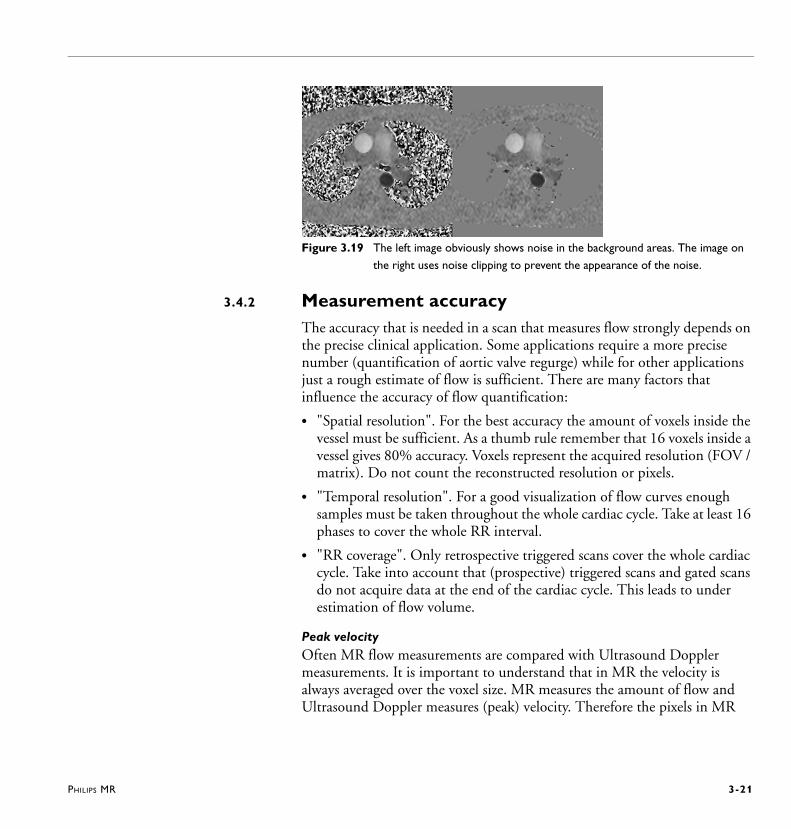
PHILIPS MR 3-21
Figure 3.19 The left image obviously shows noise in the background areas. The image on
the right uses noise clipping to prevent the appearance of the noise.
3.4.2 Measurement accuracyThe accuracy that is needed in a scan that measures flow strongly depends on the precise clinical application. Some applications require a more precise number (quantification of aortic valve regurge) while for other applications just a rough estimate of flow is sufficient. There are many factors that influence the accuracy of flow quantification:
• "Spatial resolution". For the best accuracy the amount of voxels inside the vessel must be sufficient. As a thumb rule remember that 16 voxels inside a vessel gives 80% accuracy. Voxels represent the acquired resolution (FOV / matrix). Do not count the reconstructed resolution or pixels.
• "Temporal resolution". For a good visualization of flow curves enough samples must be taken throughout the whole cardiac cycle. Take at least 16 phases to cover the whole RR interval.
• "RR coverage". Only retrospective triggered scans cover the whole cardiac cycle. Take into account that (prospective) triggered scans and gated scans do not acquire data at the end of the cardiac cycle. This leads to under estimation of flow volume.
Peak velocityOften MR flow measurements are compared with Ultrasound Doppler measurements. It is important to understand that in MR the velocity is always averaged over the voxel size. MR measures the amount of flow and Ultrasound Doppler measures (peak) velocity. Therefore the pixels in MR
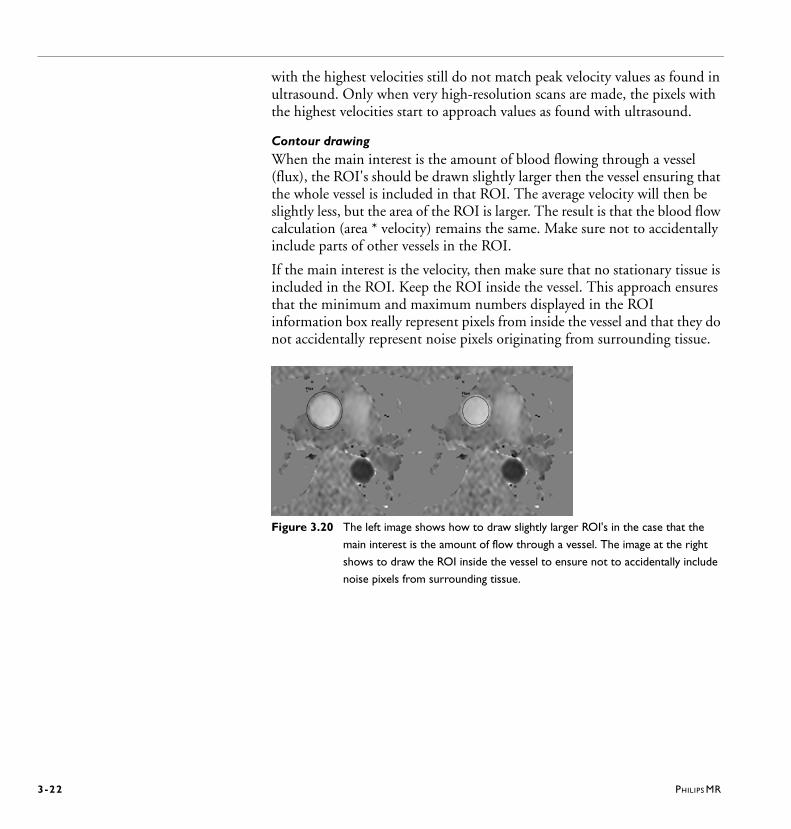
3-22 PHILIPS MR
with the highest velocities still do not match peak velocity values as found in ultrasound. Only when very high-resolution scans are made, the pixels with the highest velocities start to approach values as found with ultrasound.
Contour drawingWhen the main interest is the amount of blood flowing through a vessel (flux), the ROI's should be drawn slightly larger then the vessel ensuring that the whole vessel is included in that ROI. The average velocity will then be slightly less, but the area of the ROI is larger. The result is that the blood flow calculation (area * velocity) remains the same. Make sure not to accidentally include parts of other vessels in the ROI.
If the main interest is the velocity, then make sure that no stationary tissue is included in the ROI. Keep the ROI inside the vessel. This approach ensures that the minimum and maximum numbers displayed in the ROI information box really represent pixels from inside the vessel and that they do not accidentally represent noise pixels originating from surrounding tissue.
Figure 3.20 The left image shows how to draw slightly larger ROI's in the case that the
main interest is the amount of flow through a vessel. The image at the right
shows to draw the ROI inside the vessel to ensure not to accidentally include
noise pixels from surrounding tissue.

PHILIPS MR 3-23
3.5 Coronary AngiographyMRI of the coronary arteries, with the advent of the MotionTrak method is now feasible in a clinical setting.
This chapter will introduce the various aspects needed to perform a successful coronary examination. Covered here will be the utilization of MR methods, scan parameters, a recommended clinical scan procedure and angulation techniques.
3.5.1 About Coronary AngiographyCoronary scans can be made with a variety of techniques:
Balanced TFE is the most frequently used method because it is fast due to the very short TR’s that are used and it gives a nice strong signal from blood. Other methods include TFE and Black Blood TSE.
Breath holding could be used for respiratory motion reduction, but the total breath-hold time available is not sufficient to achieve good quality images. Another problem for breath-hold approaches is the high risk of unwanted movement of the diaphragm during breath holding.
The best way to acquire high-resolution images is to correct for any respiratory motion using navigators. Navigators correct for sub-millimeter motion and allow for longer scan times, more data acquisition and thus a higher spatial resolution. In the past these scans could easily exceed 10 minutes of scanning, but good results can be obtained in scans that last for a more practical 3 to 5 minutes of effective scan time.
There are two different approaches: the whole heart approach and the targeted approach where typically one scan is needed to catch the right coronary artery (RCA) in one scan, and a second scan is needed to catch the left coronary artery (LCA) and circumflex (LCX) together.
RemarkThe most frequently made mistake is to determine the spatial resolution of coronary scan from the voxel size only (FOV and scan matrix), totally ignoring the influences of respiratory motion to the resolution. In other words, decreasing the acquisition resolution from 0.7 mm to 0.5 mm does not improve the resolution if the total amount of respiratory blurring is more

3-24 PHILIPS MR
then 0.7 mm. Try not to focus too much on the voxel size alone. Focussing on patient comfort is more important, reducing the risk of patient motion gives much better results!
3.5.2 WorkflowThe best results are achieved when the patient is not moving at all since very small vessels are to be imaged. The slightest movement of the patient during scanning results in blurred images. It is therefore important to make sure that the patient lays very comfortable inside the magnet. Music through the head phones can help to create a more relaxed atmosphere. Explain to the patient the importance of keeping still during the whole examination.
ProcedureThis procedure describes the targeted approach for the coronary arteries and the whole heart examination.
1 Multistack survey• can best be performed in a breath hold (expiration).
This allows for better planning of the navigator beam that is used for respiratory gating and motion tracking.
2 Reference scan• is made to allow for CLEAR homogeneity correction. • consists of 4 breath-hold instructions of which only 2 actually must be
performed during inspiration (during the other 2 the patient may breathe freely).
3 High Temp Cine scan• is a b-FFE cine scan with a sufficient number of phases (40 or more) to
allow the precise determination of the trigger delay and shot duration.
Position the scan in transverse orientation through the left and right ventricle. The idea is that this scan shows the motion of RCA and thus the precise moment that diastole starts and early systole begins.
Acquire this scan in free breathe as breath-hold might affect the patient's heart rate. It is important to define the precise start of diastole during free breathe since the actual coronary scan is acquired in free breathe too (navigator).
4 Coronary survey (only needed for the targeted appraoch)• is a high-resolution survey scan that covers the whole heart and that is
needed for planning of the coronary scans.
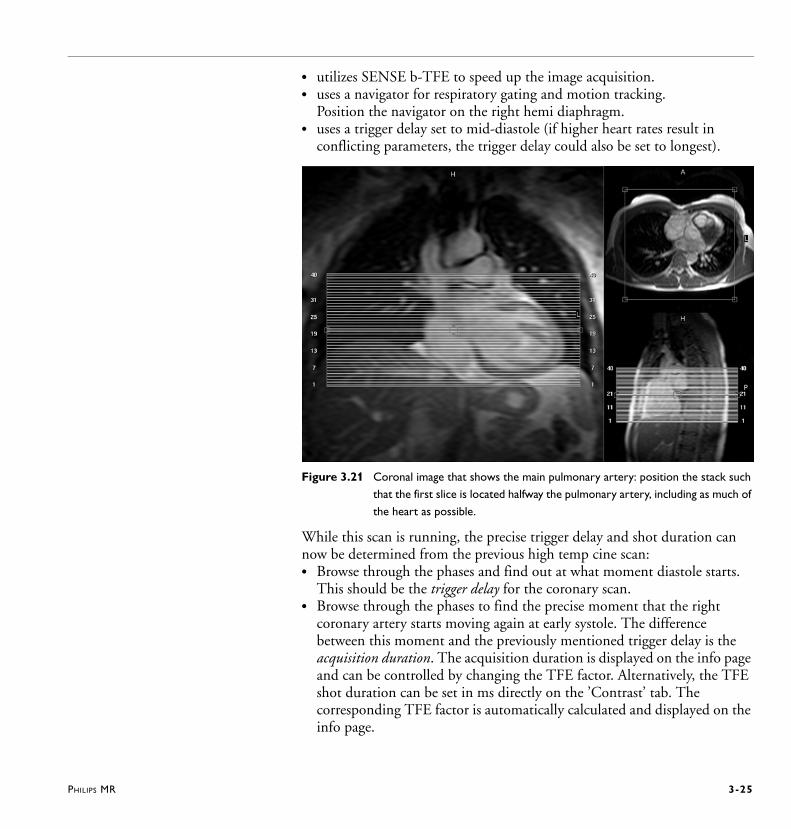
PHILIPS MR 3-25
• utilizes SENSE b-TFE to speed up the image acquisition. • uses a navigator for respiratory gating and motion tracking.
Position the navigator on the right hemi diaphragm. • uses a trigger delay set to mid-diastole (if higher heart rates result in
conflicting parameters, the trigger delay could also be set to longest).
Figure 3.21 Coronal image that shows the main pulmonary artery: position the stack such
that the first slice is located halfway the pulmonary artery, including as much of
the heart as possible.
While this scan is running, the precise trigger delay and shot duration can now be determined from the previous high temp cine scan: • Browse through the phases and find out at what moment diastole starts.
This should be the trigger delay for the coronary scan. • Browse through the phases to find the precise moment that the right
coronary artery starts moving again at early systole. The difference between this moment and the previously mentioned trigger delay is the acquisition duration. The acquisition duration is displayed on the info page and can be controlled by changing the TFE factor. Alternatively, the TFE shot duration can be set in ms directly on the ’Contrast’ tab. The corresponding TFE factor is automatically calculated and displayed on the info page.
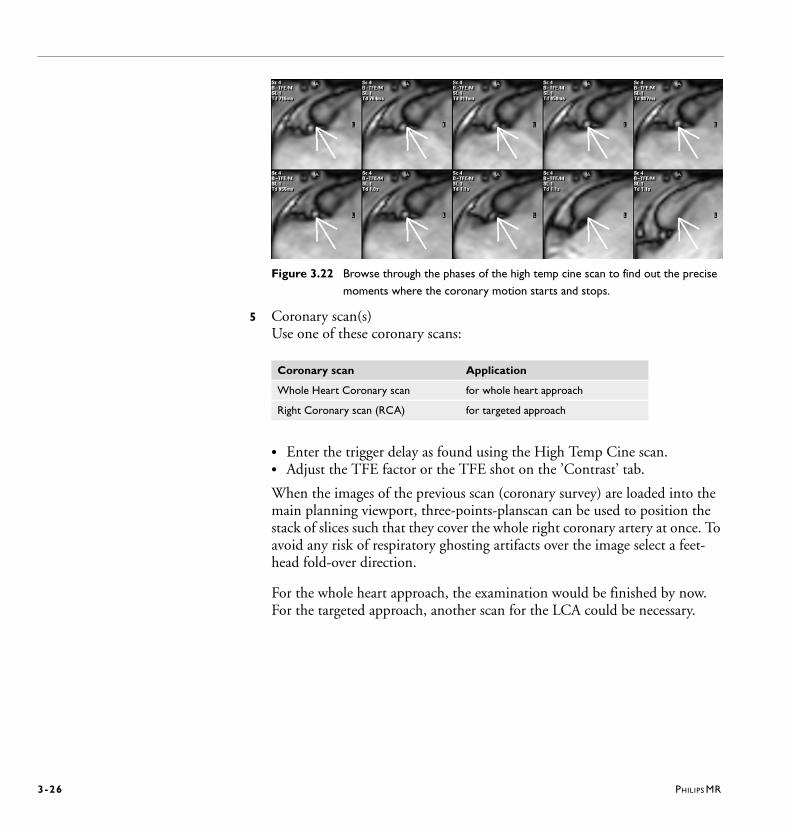
3-26 PHILIPS MR
Figure 3.22 Browse through the phases of the high temp cine scan to find out the precise
moments where the coronary motion starts and stops.
5 Coronary scan(s)Use one of these coronary scans:
• Enter the trigger delay as found using the High Temp Cine scan.• Adjust the TFE factor or the TFE shot on the ’Contrast’ tab.
When the images of the previous scan (coronary survey) are loaded into the main planning viewport, three-points-planscan can be used to position the stack of slices such that they cover the whole right coronary artery at once. To avoid any risk of respiratory ghosting artifacts over the image select a feet-head fold-over direction.
For the whole heart approach, the examination would be finished by now. For the targeted approach, another scan for the LCA could be necessary.
Coronary scan Application
Whole Heart Coronary scan for whole heart approach
Right Coronary scan (RCA) for targeted approach
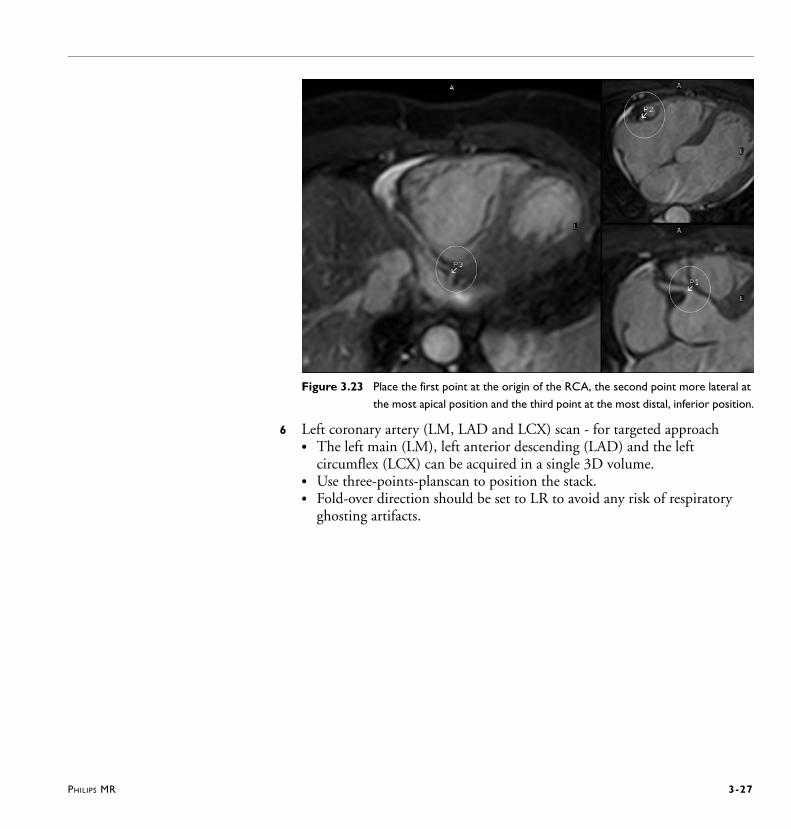
PHILIPS MR 3-27
Figure 3.23 Place the first point at the origin of the RCA, the second point more lateral at
the most apical position and the third point at the most distal, inferior position.
6 Left coronary artery (LM, LAD and LCX) scan - for targeted approach• The left main (LM), left anterior descending (LAD) and the left
circumflex (LCX) can be acquired in a single 3D volume.• Use three-points-planscan to position the stack. • Fold-over direction should be set to LR to avoid any risk of respiratory
ghosting artifacts.
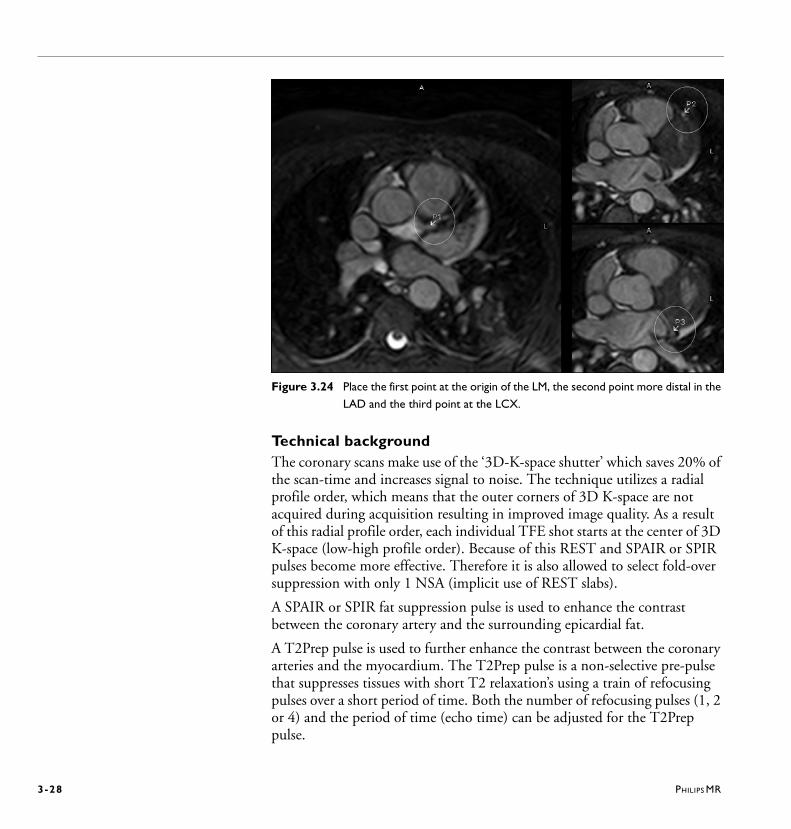
3-28 PHILIPS MR
Figure 3.24 Place the first point at the origin of the LM, the second point more distal in the
LAD and the third point at the LCX.
Technical backgroundThe coronary scans make use of the ‘3D-K-space shutter’ which saves 20% of the scan-time and increases signal to noise. The technique utilizes a radial profile order, which means that the outer corners of 3D K-space are not acquired during acquisition resulting in improved image quality. As a result of this radial profile order, each individual TFE shot starts at the center of 3D K-space (low-high profile order). Because of this REST and SPAIR or SPIR pulses become more effective. Therefore it is also allowed to select fold-over suppression with only 1 NSA (implicit use of REST slabs).
A SPAIR or SPIR fat suppression pulse is used to enhance the contrast between the coronary artery and the surrounding epicardial fat.
A T2Prep pulse is used to further enhance the contrast between the coronary arteries and the myocardium. The T2Prep pulse is a non-selective pre-pulse that suppresses tissues with short T2 relaxation’s using a train of refocusing pulses over a short period of time. Both the number of refocusing pulses (1, 2 or 4) and the period of time (echo time) can be adjusted for the T2Prep pulse.
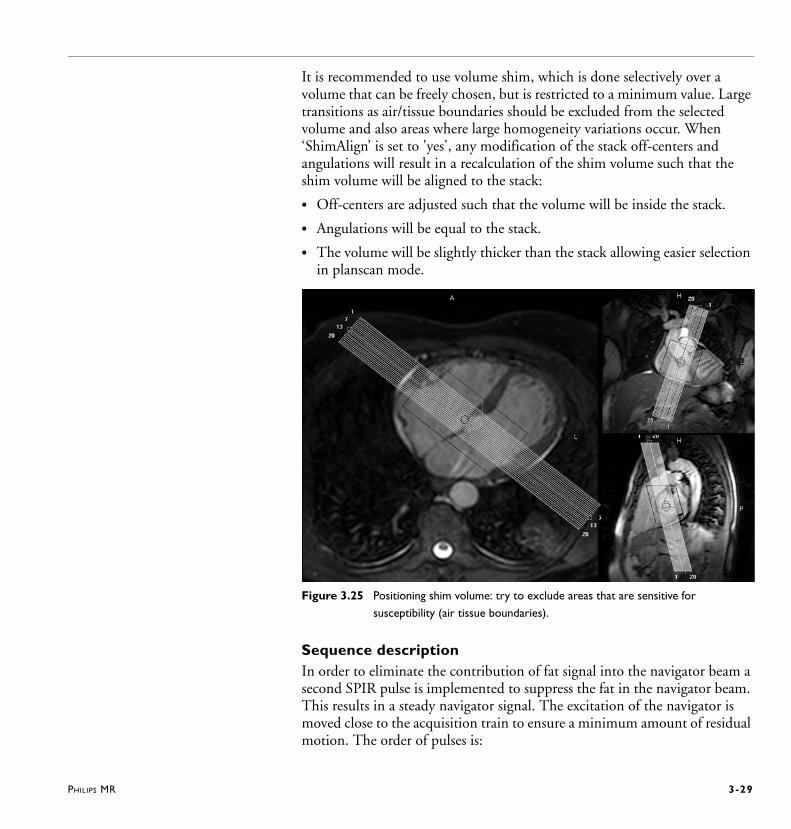
PHILIPS MR 3-29
It is recommended to use volume shim, which is done selectively over a volume that can be freely chosen, but is restricted to a minimum value. Large transitions as air/tissue boundaries should be excluded from the selected volume and also areas where large homogeneity variations occur. When ‘ShimAlign’ is set to 'yes', any modification of the stack off-centers and angulations will result in a recalculation of the shim volume such that the shim volume will be aligned to the stack:
• Off-centers are adjusted such that the volume will be inside the stack.
• Angulations will be equal to the stack.
• The volume will be slightly thicker than the stack allowing easier selection in planscan mode.
Figure 3.25 Positioning shim volume: try to exclude areas that are sensitive for
susceptibility (air tissue boundaries).
Sequence descriptionIn order to eliminate the contribution of fat signal into the navigator beam a second SPIR pulse is implemented to suppress the fat in the navigator beam. This results in a steady navigator signal. The excitation of the navigator is moved close to the acquisition train to ensure a minimum amount of residual motion. The order of pulses is:

3-30 PHILIPS MR
• T2 prep pulse• SPIR for navigator• Navigator• SPIR for image acquisition• Implicit REST for fold-over suppression• Acquisition train (Balanced TFE, TFE or TFE-EPI)
Figure 3.26 Navigator coronary sequence.
trigger delay
SPIR
SPIR
NA
V
RES
T
T2
prep (B) TFE
MotionTrack
50 20 20 20 15 70 ms
PHILIPS MR I-1
Cross reference index
Numerics3 Points Planscan 2-423D-K-space shutter 3-28
AAortic Valves 2-46Arrhythmia rejection in prospective triggering
2-25Arrhythmia Rejection, Retrospective Triggering
2-26Artifact level, b-FFE/b-TFE 3-13
BBalanced FFE 3-12Balanced TFE 3-12, 3-23Basic views 2-44Battery charger (physiology) 2-2, 2-5BB pulse 3-9BB slice thickness 3-10Black Blood - TSE 3-8Black Blood Dual Inversion Pulse 3-5Black Blood inversion delay 3-11Black Blood pulse 3-11Black Blood -TFE 3-8Breath-hold cine scans 3-12Breath-hold scheme 3-17
CCancellation 3-5Cardiac frequency (parameter) 2-24Cardiac synchronization 2-21Cardiac views 2-44
Cardiac views, Planning 2-41Cine scans 3-12Coronary angiography 3-23Coronary Survey 3-24
EEcho time 3-3Expiration level 2-40
FFFE 3-15Flow quantification 3-19Four Chamber view 2-45Free running navigator 2-38
GGate Delay (parameter) 2-29Gate Width (parameter) 2-29Gating 2-28Gating level 2-40Grid dimensions 3-16
HHigh Temp Cine scan 3-24
IInteractive scanning tool 2-42
I -2 PHILIPS MR
LLeading navigators 2-37Left coronary artery (LM, LAD and LCX) scan
3-27Left Ventricle Outflow Tract (LVOT) 2-45Left Ventricular Outflow Tract (LVOT) 2-45
MMitral Valves 2-46MotionTrak 2-30, 2-32MotionTrak Display Tool 2-39MotionTrak method 3-23Multislice scan mode 3-2
NNavigator beam positioning 2-37Navigator echo beam 2-33Navigator echo technique 2-32Navigator gating level drift 2-40Navigator gating window 2-40Navigator respiratory compensation 2-40Navigator technique 2-30Navigator type 2-40Navigators 3-23Non-balanced FFE 3-16Non-steady state balanced scans 3-15
PPEAR 2-9, 2-41, 3-4Peripheral Pulse 2-10Phase Encoded Artifact Reduction 2-41Phase Interval 2-29Phase percentage 2-28PlanAlign 2-43Planning cardiac views 2-41Prospective triggering 2-22
Pulmonary Valves 2-46
RRAO (Right Anterior Oblique) view 2-45Real-time gating 2-33Reconstructed phase window 2-26Reference scan, CLEAR 3-24Respiratory artifact reduction 3-4Respiratory sensor 2-2REST Grid 3-16Retrospective triggering 2-26Right Two Chamber (R2CH) 2-45Right Ventricular Outflow Tract (RVOT) 2-45RR window 2-24, 2-27
SScale factor, navigator 2-41Scan percentage, b-FFE/b-TFE 3-14SENSE Torso/Cardiac coil 2-17Short Axis view 2-45Slice order 3-2SMART 3-4SMART averaging 2-41SPAMM 3-16SPAtial Modulation of Magnetization 3-16SPIR 3-28Steady state sequences 3-15STIR 3-11STIR Black Blood sequence 3-11
TT2Prep pulse 3-28Tag angle 3-16Tag spacing 3-16Tagging 3-16TFE 3-15TFE default shot mode 2-26

PHILIPS MR I-3
TR in beats (parameter) 2-24Tracking 2-35Tracking anatomy 2-36Trailing navigators 2-37Tricuspid Valves 2-46Triggering 2-22
VVCG electrode positioning 2-14Ventricular function 3-12
WWall motion 3-12Wireless Physiology 2-2Wireless-PPU unit 2-2Wireless-VCG unit 2-2Workflow, Coronary arteries 3-24

I -4 PHILIPS MR

Philips Healthcare is part of
Royal Philips Electronics
www.philips.com/healthcare
Manufacturing address
Philips Medical Systems Nederland B.V.
Veenpluis 4-6
5684 PC Best
The Netherlands
This Medical Device meets the provisions of the transposition of
the Medical Device Directive 93/42/EEC within the country of
origin of the Notified Body concerned with the device.
Philips Medical Systems Nederland B.V. reserves the right to
make changes to both this Instructions for Use and to the
product it describes. Product specifications are subject to change
without notice. Nothing contained within this Instructions for
Use is intended as an offer, warranty, promise or contractual
condition, and must not be taken as such
Copyrights and all other proprietary rights in any software and
related documentation (“Software”) made available to you rest
exclusively with Philips or its licensors. No title or ownership in
the Software is conferred to you. Use of the Software is subject
to the end user license conditions as are available on request.
© Koninklijke Philips Electronics N.V. 2011/07
All rights are reserved. Reproduction or transmission in whole or in part, in any form or by any means, electronic,
mechanical or otherwise, is prohibited without the prior written consent of the copyright owner.
4598 000 35381 * 2011/07