Embed Size (px)
Citation preview

ENHANCING AN ALREADY STRONG
PERFORMANCE CULTURE
RADAR Change Management Project
Frank Dixon – CEO
Marianne Di Giallonardo – Director Corporate Services
Dianne Vrahnas – Manager Human Resources
OVERVIEW
Overview of Council / Culture
Workforce Demographics
Need for Change
Change Management Process and
Challenges
Workforce Planning data

OVERVIEW OF CULTURE

RADARREVIEW, ACKNOWLEDGEMENT, DEVELOPMENT & RECOGNITION
Maroondah 2025
Individual Performance & Development Review
Service Delivery Plan
Council Plan
Review, Acknowledgement, Development and Recognition
RADAR

OVERVIEW OF THE MAROONDAH
COMMUNITY
Maroondah City Council
• is located 25 kms from
the CBD
• covers an area of 61.4
sq km
• has a population of
102,432
• has 6000 businesses
including manufacturing
and light industry
• has 3 Wards, with each
ward represented by
three Councillors

OVERVIEW OF THE MAROONDAH
CITY COUNCIL
Maroondah City Council
• Undertakes 44,000 rate
assessments annually
• Has an annual budget of
$97m (operating and
capital)
• Manages $1.2b of
infrastructure asset
• Has $40m of
investments

WORKFORCE DEMOGRAPHICS
Total Employees 1059
EFT 449.10
Contract positions 25
Banded positions 958
Leadership positions:
• Level 1 – 1
• Level 2 – 4
• Level 3 – 18
• Level 4 – 55
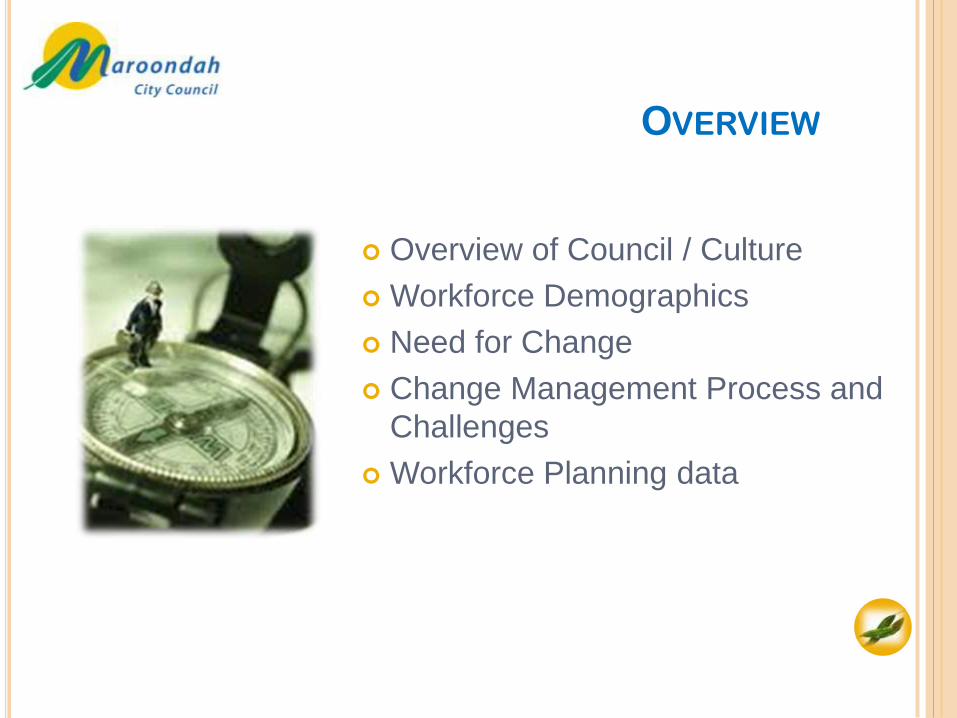
AGE DEMOGRAPHICS
7%
14%14%
18%
24%
11%
6% 6%
0%
5%
10%
15%
20%
25%
30%
15-19 20-24 25-34 35-44 45-54 55-59 60-64 >65

GENDER BREAKDOWN AT
MAROONDAH CITY COUNCIL
34%
66%
0%
10%
20%
30%
40%
50%
60%
70%
Males Femals

EMPLOYMENT CATEGORIES BY GENDER
15%
7%
12%10%
31%
25%
0%
5%
10%
15%
20%
25%
30%
35%
Full Time Part Time Casual
Males
Females
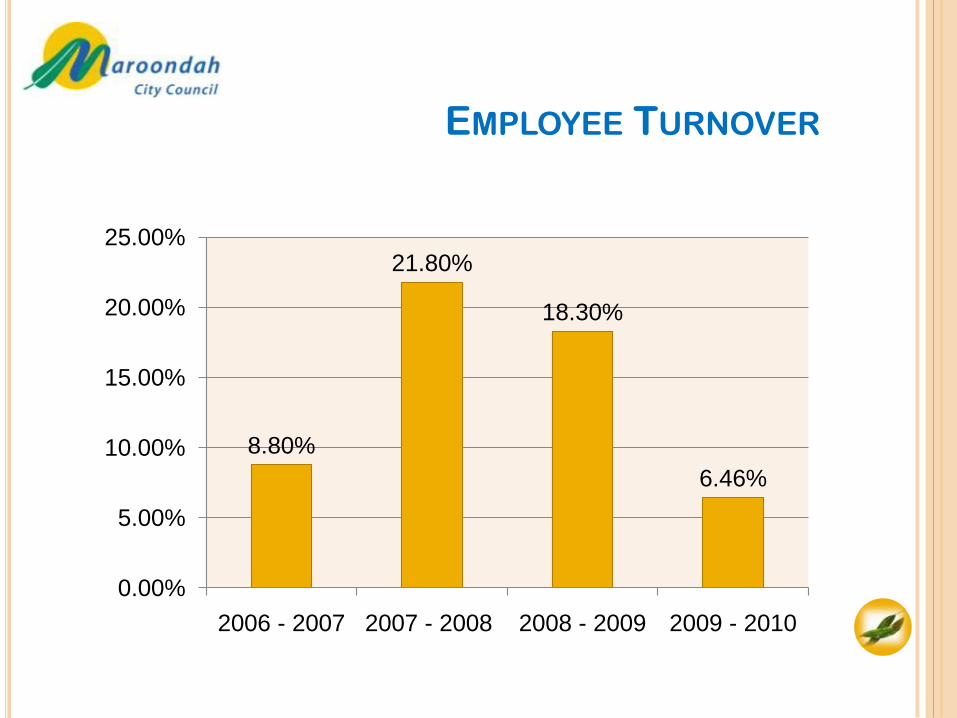
EMPLOYEE TURNOVER
8.80%
21.80%
18.30%
6.46%
0.00%
5.00%
10.00%
15.00%
20.00%
25.00%
2006 - 2007 2007 - 2008 2008 - 2009 2009 - 2010

REASONS EMPLOYEE’S LEAVE
38%
1%
2%0%20%2%
6%0%
1%
22%
1%7%
Careers Advancement (i.e Promotion or Salary Increase)
Dissatisfaction with Job
Dissatisfaction with Supervisor
Dissatisfaction with Team
Lifestyle Change
Organisational Re-structure (i.e. Job Eliminated)
Personal Reasons
Recognition / Appreciation
Redundancy
Retirement
Retrenchment
Other

LENGTH OF SERVICE
17%
42%
20%
9%5% 5% 2%
0%
5%
10%
15%
20%
25%
30%
35%
40%
45%
0 to 1 1 to 4 5 to 9 10 to 14 15 to 19 20 to 24 25 +
Years of Service

PRE-RADAR
Strong Policy Context
Organisationally including 35 –
HR Policies
PDR –Performance,
Development and Review
process
RARP – Reward and Recognition
Process

THE NEED FOR CHANGE
We needed to understand:
what employees thought of the different processes
the current systems and how they worked
what other organisations were doing
how a new system could look and work
How we were going to measure success

EMPLOYEES INPUT
What employees thought of the different
processes
They loved the REV program and felt it should
continue
They wanted a more consistent process
between PDR and RARP
They wanted the RARP payment retained with
consistency in how performance was evaluated
They didn’t want two separate processes
running 3 months apart
They wanted the performance evaluation and
reward aligned to commercial outcomes

PROCESS MAPPING
The current systems and how they worked
Understand all the different processes
How they worked
Where the linkages where
Understand who got what and when

RESEARCH
What other organisations were doing
Research different models
Benchmarked best practice
Identified constraints
Organisational Linkages

ORGANISATIONAL LINKAGES
Obje
ctives

PROCESS DESIGN

WHAT WE WANTED
Consistent Recognition and Reward Process
A process that links performance to rewards
More appreciative culture
Feedback
Management accountability
Linking organisational and individual objectives
Consistent feedback
Identified, nurtured and retain high performing employees
Training in performance reviews and feedback

WHAT WE WANTED
Consistency
Simplified and streamlined process
Link performance with rewards in one process
Role clarity
Compliance
Simple and user friendly
Fair and transparent system
Sell the benefits of performance appraisals
Formal communication
Full participation

PROCESS ANALYSIS
Gen Y – wanted to participate
Baby Boomers not interested

Culture
PeopleProcesses
MANAGING THE CHANGE
Thoughtful planning and sensitive implementation
Consultation and involvement
Identifying key changes
Involvement of senior managers, to drive the
process and manage the resistance

CHANGE MANAGEMENT CHALLENGES
Too many changes
Understanding the importance of Performance
Reviews
Supervisory training to ensure process
understanding
Recognising the organisational right to expect good
performance
CHANGE MANAGEMENT OPPORTUNITIES
Solutions:
Job families with consistent KRA’s for routine positions
Education on conducting a performance review
Selling benefits to supervisory level staff, including
1. RADAR is only one form
2. Performance Review and RARP now one process
3. Only one formal meeting annually
4. Only certain sections of the completed form to be sent to HR

RADAR CYCLE

PROCESS REVIEW AND EVALUATION
Measure of Success
Increased employee participation
Next Steps
project review and refinements
View to further streamlining the process for
increased ease and efficiency using an online
Performance Development and Planning Tool.
Stats on completion rates before and after RADAR
Ability to link with Succession, Mentoring Programs
etc

COMPLETION RATES
Maroondah City Council (RADAR V's PDR Completion Rate)
93%
46%
0%
10%
20%
30%
40%
50%
60%
70%
80%
90%
100%
No. RADAR Forms Complete (09-10) No. PDR Forms Complete (08-09)

JOB SATISFACTION
Maroondah City Council Job Satisfaction Level 2010
6%
0% 0% 0%
9%
12%
6%
47%
12%
9%
0%
5%
10%
15%
20%
25%
30%
35%
40%
45%
50%
1 2 3 4 5 6 7 8 9 10

TEAM SATISFACTION
Maroondah City Council Team Satisfaction Level 2010
3% 3% 3% 3%
0% 0%
29%
26%
21%
12%
0%
5%
10%
15%
20%
25%
30%
35%
1 2 3 4 5 6 7 8 9 10

ORGANISATION SATISFACTION
Maroondah City Council Organisational Satisfaction Level 2010
3%
0%
6%3%
9% 9%
3%
44%
18%
6%
0%
5%
10%
15%
20%
25%
30%
35%
40%
45%
50%
1 2 3 4 5 6 7 8 9 10
1 = extremely dissatisfied 10 = very satisfied
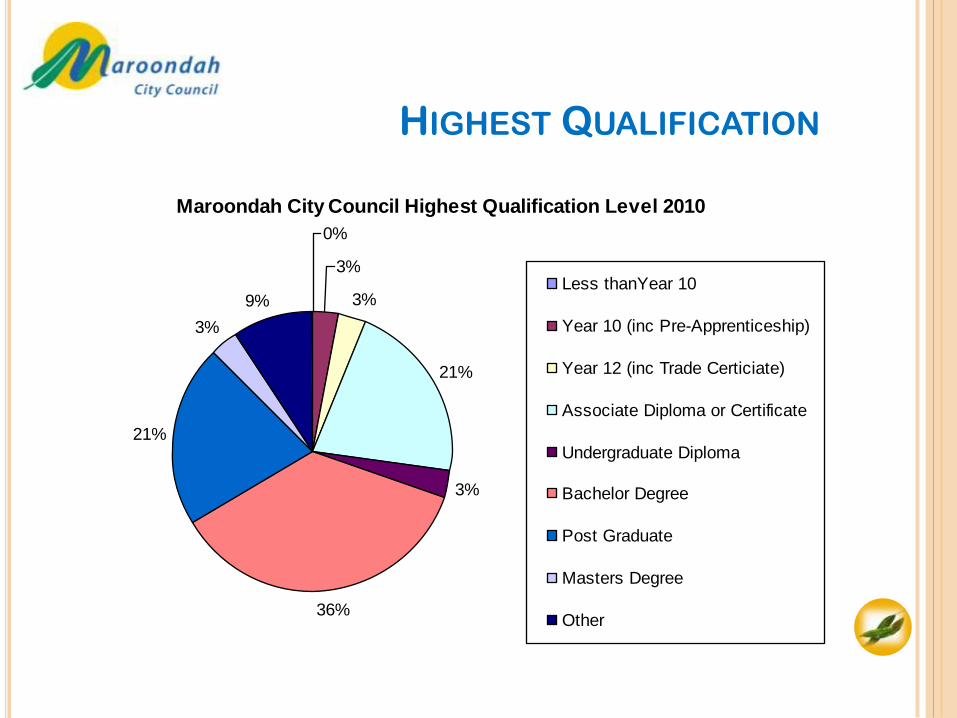
HIGHEST QUALIFICATION
Maroondah City Council Highest Qualification Level 2010
0%
3%
3%
21%
3%
36%
21%
3%
9%Less thanYear 10
Year 10 (inc Pre-Apprenticeship)
Year 12 (inc Trade Certiciate)
Associate Diploma or Certificate
Undergraduate Diploma
Bachelor Degree
Post Graduate
Masters Degree
Other

CAREERS OPTIONS
Maroondah City Council Career Options 2010
21%
22%
8%10%
8%4%
0%
0%
4%
5%
1%
9%
6%3%
Remain in current role
Enrichment - develop in current role
Exploration - test options
Vertical - seek promotion
Lateral - sideways move
Re-location - change of work area
Re-alignment - moving down
Re-direction - change of career
Proposal - create new job
External Vertical or Lateral
Mentoring
Coaching
Volunteering
Other

REASONS FOR WORKING AT COUNCIL
Maroondah City Council Reason for Working at Council
7%
6%
13%
10%
14%7%
3%
6%
6%
9%
6%
9%
3%
1%Appreciation
Career Development Opportunities
Challenging / Interesting Work
Employment Conditions
Location
Organisational Culture
Rewards and Recognition
Supervisor / Manager
Supportive Environment
Working Relationships
Work Responsibility and Autonomy
Work / Life Balance
Working for a Sustainable Community
Other

ANTICIPATED LENGTH OF SERVICE
Maroondah City Council Anticipated Length of Service 2010
0% 0%
20%
40%
0%
40%
0%
5%
10%
15%
20%
25%
30%
35%
40%
45%
6 - 12 months 1-2 Years 2-3 Years 3-4 Years 5+ Years Undecided

![Enhancing the performance of business process in …orizonturi.ucdc.ro/arhiva/2014_khe_6_pdf4/turkes_1.pdf · module. Several studies [4], already presented the benefits that the](https://img.pdfslide.net/doc/110x75/5ad763be7f8b9a9d5c8c036d/enhancing-the-performance-of-business-process-in-several-studies-4-already.jpg)