Embed Size (px)
Citation preview
Vol. 7(18), pp. 1791-1805, 14 May, 2013
DOI: 10.5897/AJBM11.2183
ISSN 1993-8233 © 2013 Academic Journals
http://www.academicjournals.org/AJBM
African Journal of Business Management
Full Length Research Paper
Enhancing credit scoring model performance by a hybrid scoring matrix
Bo-Wen Chi1, Chiun-Chieh Hsu1* and Mei-Hung Ho2
1Department of Information Management, National Taiwan University of Science and Technology, No. 43, Sec. 4,
Keelung Road, Taipei 10607, Taiwan. 2Department of International Business, National Taiwan University, No. 1, Sec. 4, Roosevelt Road, Taipei 10617, Taiwan.
Accepted 20 March, 2012
Competition of the consumer credit market in Taiwan has become severe recently. Therefore, most financial institutions actively develop credit scoring models based on assessments of the credit approval of new customers and the credit risk management of existing customers. This study uses a genetic algorithm for feature selection and decision trees for customer segmentation. Moreover, it utilizes logistic regression to build the application and credit bureau scoring models where the two scoring models are combined for constructing the scoring matrix. The scoring matrix undergoes more accurate risk judgment and segmentation to further identify the parts required enhanced management or control within a personal loan portfolio. The analytical results demonstrate that the predictive ability of the scoring matrix outperforms both the application and credit bureau scoring models. Regarding the K-S value, the scoring matrix increases the prediction accuracy compared to the application and credit bureau scoring models by 18.40 and 5.70%, respectively. Regarding the AUC value, the scoring matrix increases the prediction accuracy compared to the application and credit bureau scoring models by 10.90 and 6.40%, respectively. Furthermore, this study applies the scoring matrix to the credit approval decisions for corresponding risk groups to strengthen bank’s risk management practices. Key words: Scoring matrix, application scoring model, credit bureau scoring model, genetic algorithm, logistic regression, decision trees.
INTRODUCTION With the rapid growth in the credit industry and the management of large loan portfolios, application and behavioral scoring models have been extensively used for the credit risk evaluation decisions by the finance industry.
Application scoring models help banks determine whether credit should be granted to new applicants based on customer characteristics such as income, education, age, and so on (Akhavein, 2005). Behavioral scoring models help banks predict the probability that existing customer will default or become delinquent based on consumer's repayment and usage behavior (Boyer and Hult, 2005).
In this paper, we utilize a hybrid mining approach in the
design of credit scoring models to support credit approval decisions based on the four main steps: (1) using genetic algorithm (GA) to select input features, (2) using decision trees for customer segmentation, (3) using regression (LR) to build the application and credit bureau scoring models based on important input variables of bank’s internal application data and credit bureau data, (4) combining the application and credit bureau scoring models to construct the scoring matrix. LITERATURE REVIEW
A variety of statistical methods are used to develop credit
*Corresponding author. E-mail: [email protected]. Tel: +886-2-27376766.
1792 Afr. J. Bus. Manage. scoring models including linear discriminant analysis (Altman et al., 1994), LR (Lee et al., 2006; Dinh and Kleimeier, 2007), neural networks (Khashman, 2010; Tsai and Wu, 2008), k-nearest neighbor (Henley and Hand, 1996), decision trees (Feldman and Gross, 2005; Zhou et al., 2008; Zhang et al., 2010), genetic programming (Abdou, 2009; Huang et al., 2006) and support vector machines (Huang et al., 2007; Zhou et al., 2009), etc. Among these statistical methods, LR, neural networks, decision trees and support vector machine are generally regarded as the most efficient individual credit scoring models. Recently, some hybrid approaches (Hsieh, 2005; Lee and Chen, 2005; Zhang et al., 2008; Chen et al., 2009; Chuang and Lin, 2009; Huang et al., 2006; Lin, 2009) are presented to overcome the drawbacks of the individual credit scoring models. These hybrid approaches perform well and have shown higher predictabilities than those of any individual methods.
These previous studies have focused on creating more accurate classifiers with various hybrid architectures. However, there is scant research on the practical application of combined classifiers because it is difficult to implement functional composition or explain the underlying principle behind the decision of rejecting credit applications when applying the hybrid approach to the banks’ risk management practices.
Therefore, this study evolves a GA-based feature selection and a hybrid model that combines two credit risk modeling approaches, the application and credit bureau scoring models to construct the scoring matrix for credit risk management of personal loan customers. The scoring matrix undergoes more accurate risk judgment and segmentation to further identify the parts required to enhance management or control within a personal loan portfolio. Furthermore, this study applies the scoring matrix to the credit approval decisions for corresponding risk groups to strengthen the bank’s risk management practices. SCORING MATRIX DEVELOPMENT
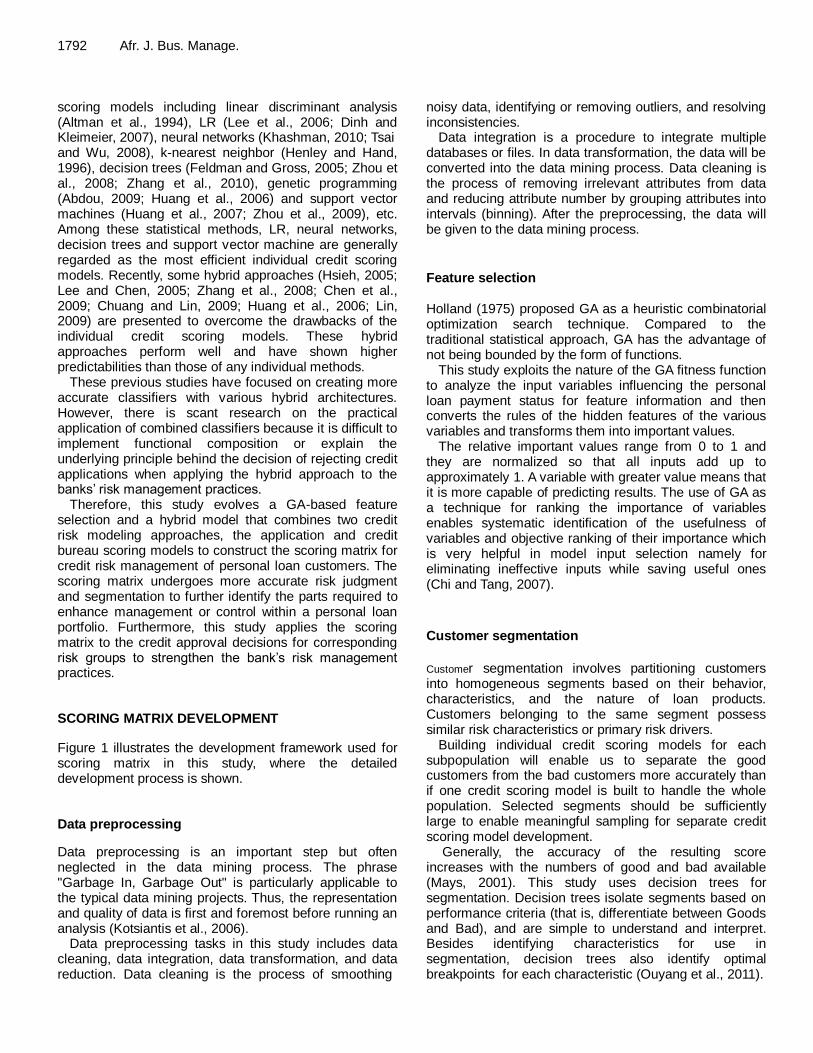
Figure 1 illustrates the development framework used for scoring matrix in this study, where the detailed development process is shown. Data preprocessing
Data preprocessing is an important step but often neglected in the data mining process. The phrase "Garbage In, Garbage Out" is particularly applicable to the typical data mining projects. Thus, the representation and quality of data is first and foremost before running an analysis (Kotsiantis et al., 2006).
Data preprocessing tasks in this study includes data cleaning, data integration, data transformation, and data reduction. Data cleaning is the process of smoothing
noisy data, identifying or removing outliers, and resolving inconsistencies.
Data integration is a procedure to integrate multiple databases or files. In data transformation, the data will be converted into the data mining process. Data cleaning is the process of removing irrelevant attributes from data and reducing attribute number by grouping attributes into intervals (binning). After the preprocessing, the data will be given to the data mining process.
Feature selection Holland (1975) proposed GA as a heuristic combinatorial optimization search technique. Compared to the traditional statistical approach, GA has the advantage of not being bounded by the form of functions.
This study exploits the nature of the GA fitness function to analyze the input variables influencing the personal loan payment status for feature information and then converts the rules of the hidden features of the various variables and transforms them into important values.
The relative important values range from 0 to 1 and they are normalized so that all inputs add up to approximately 1. A variable with greater value means that it is more capable of predicting results. The use of GA as a technique for ranking the importance of variables enables systematic identification of the usefulness of variables and objective ranking of their importance which is very helpful in model input selection namely for eliminating ineffective inputs while saving useful ones (Chi and Tang, 2007).
Customer segmentation
Customer segmentation involves partitioning customers into homogeneous segments based on their behavior, characteristics, and the nature of loan products. Customers belonging to the same segment possess similar risk characteristics or primary risk drivers.
Building individual credit scoring models for each subpopulation will enable us to separate the good customers from the bad customers more accurately than if one credit scoring model is built to handle the whole population. Selected segments should be sufficiently large to enable meaningful sampling for separate credit scoring model development.
Generally, the accuracy of the resulting score increases with the numbers of good and bad available (Mays, 2001). This study uses decision trees for segmentation. Decision trees isolate segments based on performance criteria (that is, differentiate between Goods and Bad), and are simple to understand and interpret. Besides identifying characteristics for use in segmentation, decision trees also identify optimal breakpoints for each characteristic (Ouyang et al., 2011).
Chi et al. 1793
Application data set
Building credit
scoring models
Application scoring model
Credit bureau scoring model
Customer
segmentation
Decision trees
Scoring matrix
Credit strategy
applications
Feature selection
Genetic
algorithm
Credit bureau data set
Data preprocessing
Logistic regression
Figure 1. The development process of scoring matrix.

1794 Afr. J. Bus. Manage. Building credit scoring models
The literature has outlined the theoretical background for
using LR for classification in credit scoring, and also shows that LR usually performs well in determining good and bad loans in similar tasks to the one examined here (Charitou et al., 2004; Kočenda and Vojtek, 2009). This study uses LR to build application and credit bureau scoring models based on important input variables of bank’s internal application data and credit bureau data, respectively.
LR uses a set of predictor variables to predict the probability of a binary outcome. The equation for the logit transformation of the probability of an event is as follows:
kk xxp
pLogit
....)
1( 110 ,
Where p is the posterior probability of Goods, x is the
input variables, 0 is the intercept of the regression line,
and k is the parameters.
The LR transformation is the log of the G/B odds and is used to linearize posterior probability and limit estimated probability outcomes in the model to between 0 and 1.
Maximum likelihood is used to estimate parameters 1 to
k . These parameter estimates measure the rate of
change of logit for one unit change in the input variable, that is, they are the slopes of the regression line between
the target and their respective input variables 1x to kx .
To facilitate the use and interpretation of credit scoring models, credit scores are commonly scaled linearly to take more integer points. This study scales the points such that a total credit score of 300 points corresponds to G/B odds of 1 to 1, and that an increase in the credit score of 20 points corresponds to a doubling of G/B odds. Equations 1 and 2 show the derivation of the scaling rule that transforms the credit scores of each attribute.
)1(
)(
)(
)ln(
,
1,
,
1,
,
1,
n
offsetfactor
n
awoe
offsetfactorn
awoe
offsetfactorawoe
offsetfactoroddsscore
ij
nk
ij
nk
ij
ij
nk
ij
ij
(1)
)2()1ln(*300
)2ln(/20
)2ln(320
)1ln(300
factoroffset
factor
offsetfactor
offsetfactor
(2)
Where woe is the weight of evidence for each grouped attribute, β is the regression coefficient for each variable, a is the intercept term from LR, n is the number of variables and k is the number of attributes for each variable. Owing to the score-to-odds relationship having different meanings in different segments, this investigation applies calibration to standardize the relationship between the score and G/B odds. Credit scores in different segments thus can be compared directly.
To facilitate the use of credit strategies, credit scores are generally divided into different risk ranks according to the degree of risk score. This investigation classifies customers into five risk ranks, ranging from APS1 to APS5 and CBS1 to CBS5, based on application and credit bureau scores, respectively. Scoring matrix In this process, the five risk ranks of the personal loan application scoring model and the credit bureau scoring model are combined to construct a 5x5 scoring matrix.
The purpose is to present the possibility of customer payment using objective and specific data. This scoring matrix can better differentiate customer risk and further design corresponding credit strategies. Credit strategy applications Banks can design and implement related credit strategies based on the application scoring model they apply to personal loan application process. However, incorporating the credit bureau scoring model into the application scoring model enables banks to undertake more refined risk segmentation. This study applies the scoring matrix in credit approval decision. METHODLOGY
Data collection
The internal application data contains various socio-demographic characteristics and other information collected by a major bank in Taipei, Taiwan.
The sample comprises of 16,040 individual customers who were granted loans during 2009/11/1 to 2010/10/1. The internal
application data are incomplete because of a lack of data on interactions between bank’s internal customers and other financial institutions, namely the proprietary information resulting from business competition.
To improve the credit scoring model’s performance, this study also collects credit-related information on personal loan customers from the public credit registers, as well as collecting bank’s internal data.
In this study, the internal application data based on borrower
characteristics in addition to credit bureau data. Meanwhile, the credit bureau data comprised five major dimensions which payment history, recent searches for credit, length of credit history, types of
Chi et al. 1795
Cumulative percent of sample K - S Statistics (%)
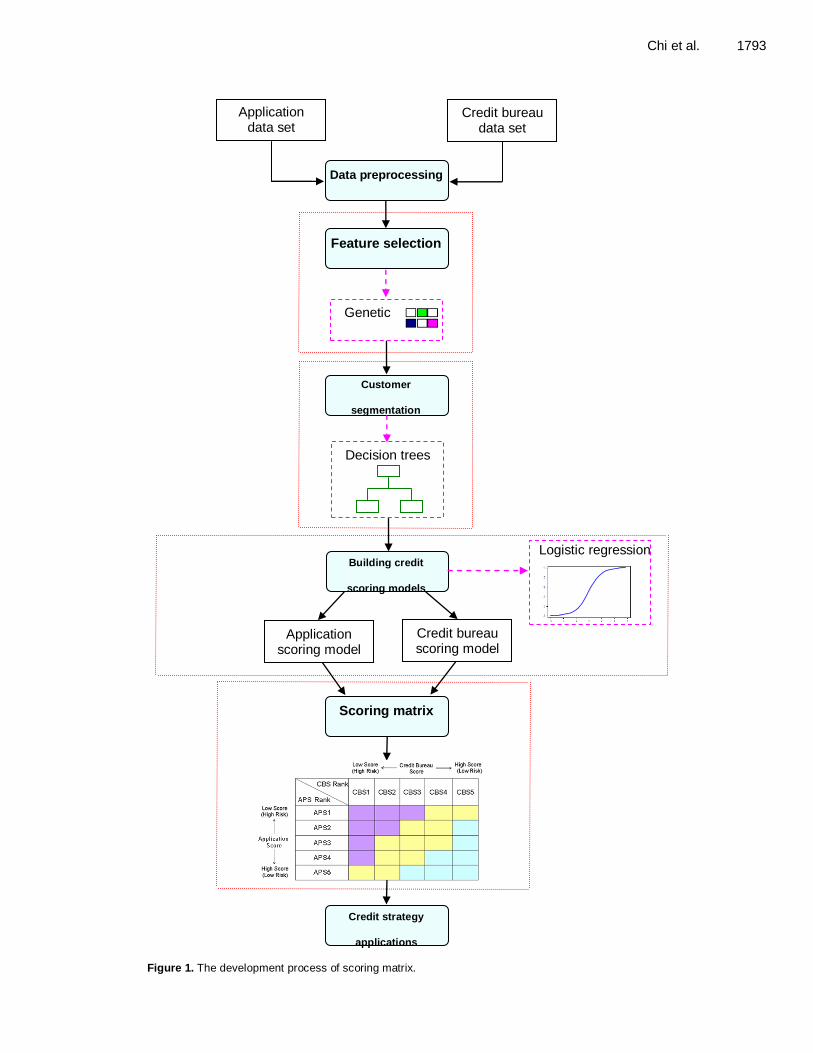
Figure 2. The K-S statistic.
credit used and credit utilization.
Sample Customers are classified as either good or bad based on their payment performance connected with the loan. Those who are two or more installments in arrears being classified as bad. Of the 16,040 total personal loan customers, 15,532 are good while 508 are bad.
Therefore, the G/B odds ratio is 15532/508=30.6. To avoid over
fitting the construction model, this study uses the G/B odds ratio of 3 (Chuang and Chen, 2006). That is, 1,492 good are randomly selected and combined with 508 bad to form the development sample. To validate the stability and accuracy of the application scoring model, the data set of 2,000 customers is split into training and testing data sets using a ratio of 8:2 (Lee et al., 2006). Evaluation of model performance When a statistical model is used as a predictive tool, doubts can exist regarding the generalization of the model over time and new observations. Several methods exist for measuring the performance of statistical prediction models.
Two of the most widely applied methods are the Kolmorogov-Smirnoff (K-S) statistic and the receiver operating characteristic (ROC) curve analysis. The K-S statistic measures how far apart the
cumulative distribution functions of the scores of Good and Bad are. The credit scoring model generating the greatest separability between the two distributions is considered the better model. The equation is as follows:
(s)F - (s)F maxS-K BGS
(3)
Where (s)FG and (s)FB are cumulative distribution functions of
Good and Bad and s is the corresponding score for the individual
loan. Figure 2 shows that bad accumulate rapidly at low scores while
good accumulate more rapidly at high scores. Additionally, the cumulative distribution function curve of the Goods lies to the right of that of the Bad.
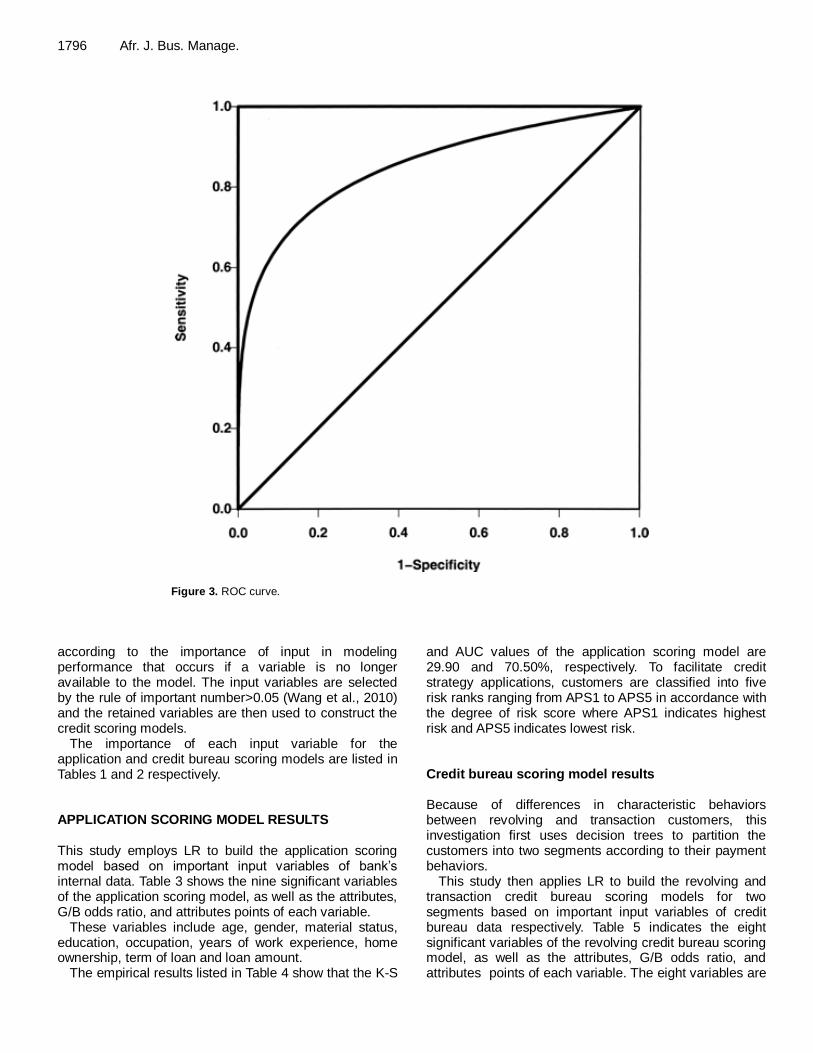
The ROC curve analysis is commonly used for assessing the performance of various classification tools including biological markers, diagnostic tests and binary outcome models (Medema et al., 2009; Yu, 2009). The ROC curve as depicted in Figure 3 is the plot that displays the full picture of trade-off between the percentage of hits (for example, sensitivity) of a credit scoring model on the y-
axis against the percentage of false alarms (for example, 1-specificity) for all possible classification thresholds.
If high scores are defined to present a low default probability, then x-values represent the error rate with which good are classified as bad using a credit scoring model (for example, Type II error) and y-values represent one minus the error rate with which bad are classified as good using a credit scoring model (for example, Type I error). The ROC curve thus also completely represents Type I and Type II errors.
The area under the ROC curve (AUC) is widely used for assessing the discriminatory ability of a credit scoring model which can be interpreted as the probability that a classier is able to distinguish a randomly chosen good customer from a randomly chosen bad customer. The AUC value is equivalent to both the Gini coefficient (Thomas et al., 2002) and the Wilcoxon-Mann- Whitney test statistic (Hanley and McNeil, 1982). The AUC value ranges from 0.5 to 1, where larger AUC value indicates a more accurate
credit scoring model. In most cases where good data is being used, the AUC value exceeding 0.7 represents good discrimination capacity (Cholongitas et al., 2006).
RESULTS Input feature selection GA is employed to eliminate ineffective variables
1796 Afr. J. Bus. Manage.
Figure 3. ROC curve.
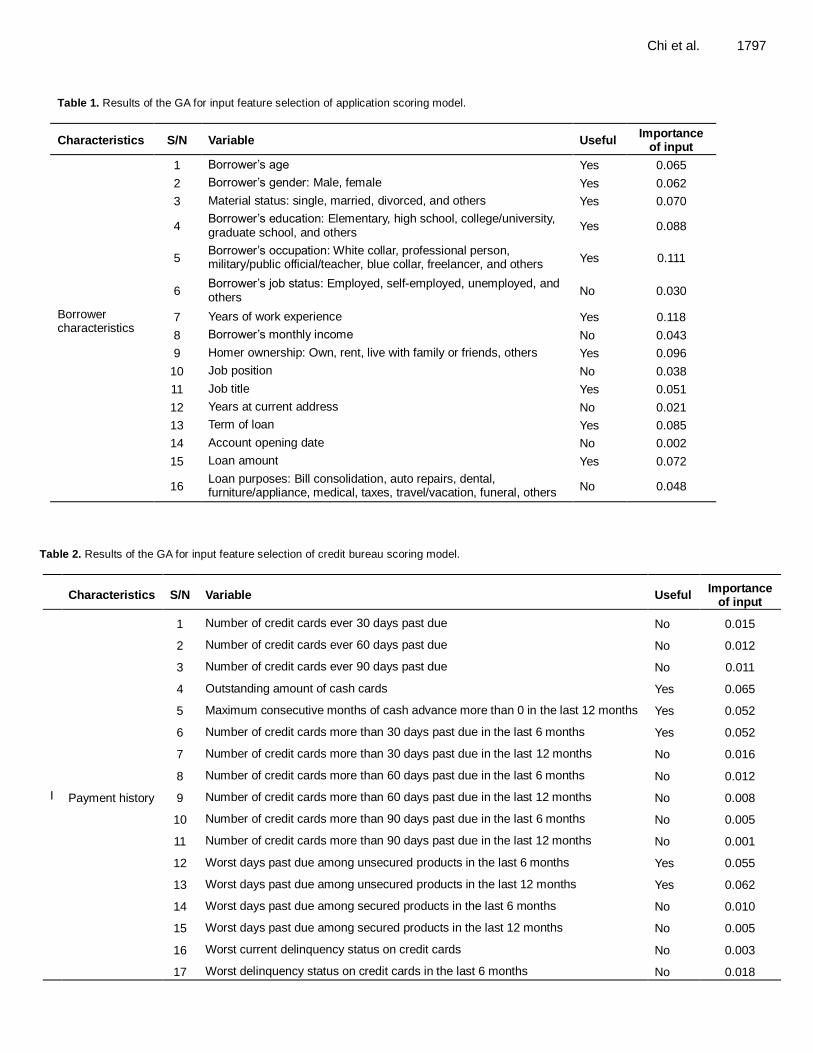
according to the importance of input in modeling performance that occurs if a variable is no longer available to the model. The input variables are selected by the rule of important number>0.05 (Wang et al., 2010) and the retained variables are then used to construct the credit scoring models.
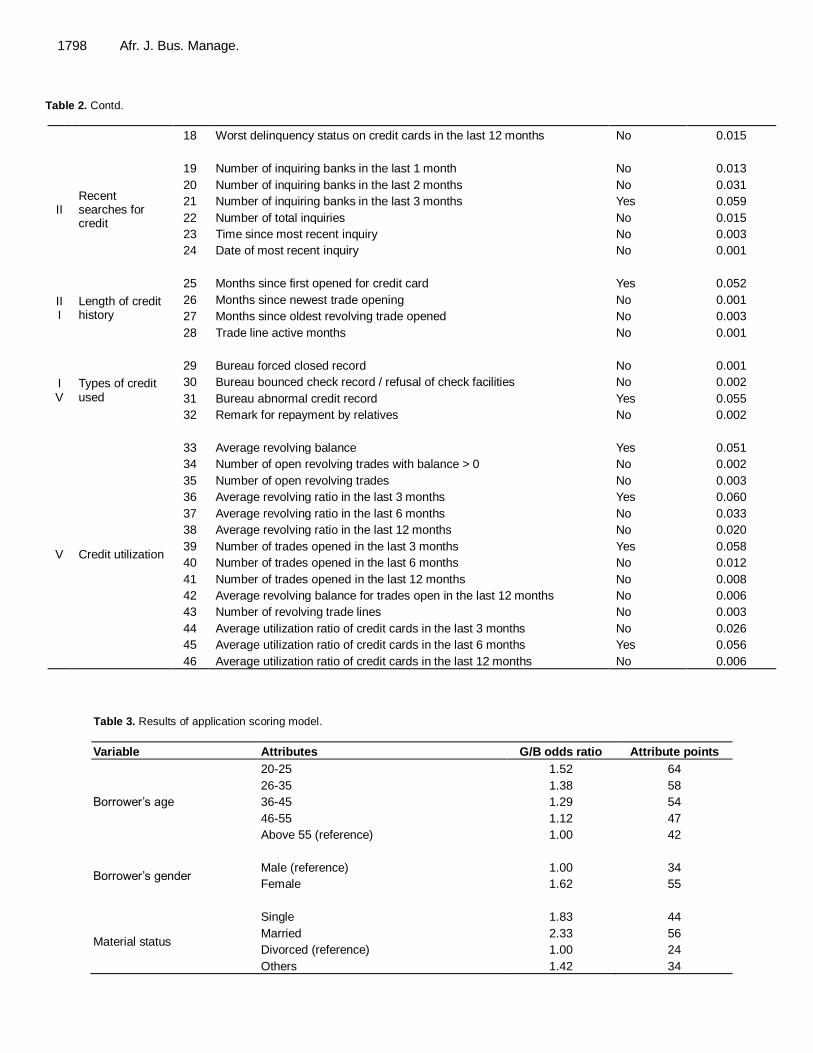
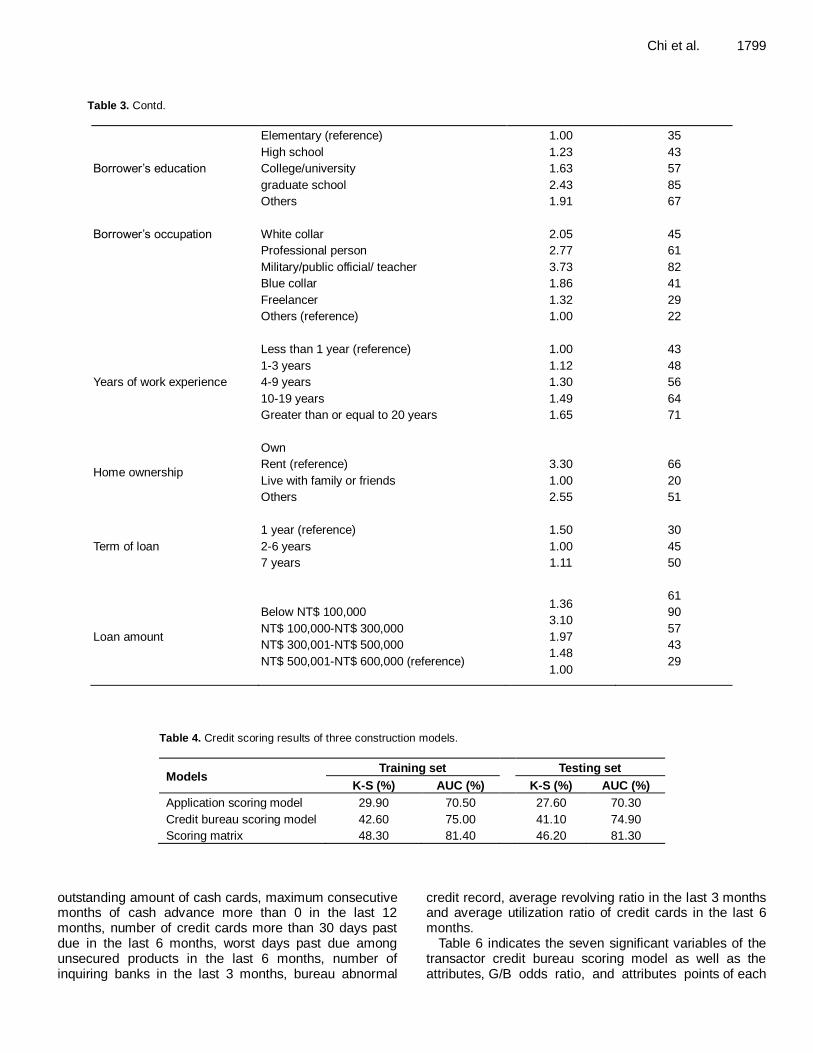
The importance of each input variable for the application and credit bureau scoring models are listed in Tables 1 and 2 respectively. APPLICATION SCORING MODEL RESULTS This study employs LR to build the application scoring model based on important input variables of bank’s internal data. Table 3 shows the nine significant variables of the application scoring model, as well as the attributes, G/B odds ratio, and attributes points of each variable.
These variables include age, gender, material status, education, occupation, years of work experience, home ownership, term of loan and loan amount.
The empirical results listed in Table 4 show that the K-S
and AUC values of the application scoring model are 29.90 and 70.50%, respectively. To facilitate credit strategy applications, customers are classified into five risk ranks ranging from APS1 to APS5 in accordance with the degree of risk score where APS1 indicates highest risk and APS5 indicates lowest risk. Credit bureau scoring model results Because of differences in characteristic behaviors between revolving and transaction customers, this investigation first uses decision trees to partition the customers into two segments according to their payment behaviors.
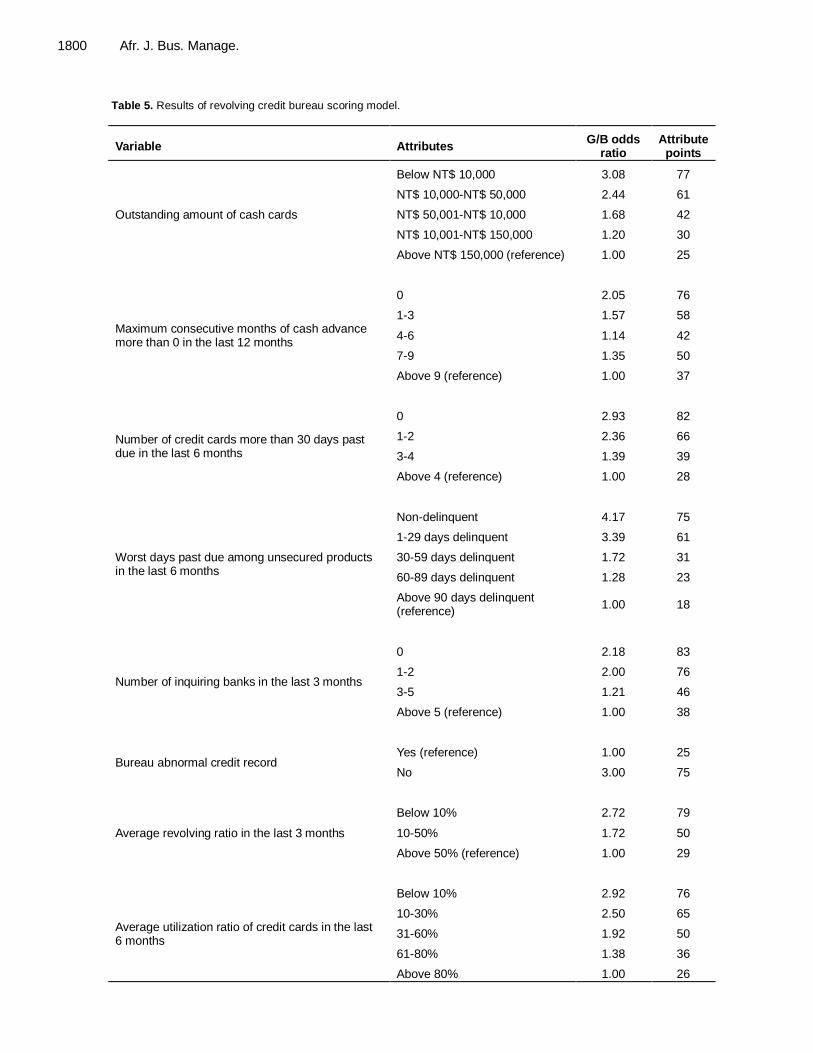
This study then applies LR to build the revolving and transaction credit bureau scoring models for two segments based on important input variables of credit bureau data respectively. Table 5 indicates the eight significant variables of the revolving credit bureau scoring model, as well as the attributes, G/B odds ratio, and attributes points of each variable. The eight variables are
Chi et al. 1797
Table 1. Results of the GA for input feature selection of application scoring model.
Characteristics S/N Variable Useful Importance
of input
Borrower characteristics
1 Borrower’s age Yes 0.065
2 Borrower’s gender: Male, female Yes 0.062
3 Material status: single, married, divorced, and others Yes 0.070
4 Borrower’s education: Elementary, high school, college/university, graduate school, and others
Yes 0.088
5 Borrower’s occupation: White collar, professional person, military/public official/teacher, blue collar, freelancer, and others
Yes 0.111
6 Borrower’s job status: Employed, self-employed, unemployed, and others
No 0.030
7 Years of work experience Yes 0.118
8 Borrower’s monthly income No 0.043
9 Homer ownership: Own, rent, live with family or friends, others Yes 0.096
10 Job position No 0.038
11 Job title Yes 0.051
12 Years at current address No 0.021
13 Term of loan Yes 0.085
14 Account opening date No 0.002
15 Loan amount Yes 0.072
16 Loan purposes: Bill consolidation, auto repairs, dental, furniture/appliance, medical, taxes, travel/vacation, funeral, others
No 0.048
Table 2. Results of the GA for input feature selection of credit bureau scoring model.
Characteristics S/N Variable Useful Importance
of input
I Payment history
1 Number of credit cards ever 30 days past due No 0.015
2 Number of credit cards ever 60 days past due No 0.012
3 Number of credit cards ever 90 days past due No 0.011
4 Outstanding amount of cash cards Yes 0.065
5 Maximum consecutive months of cash advance more than 0 in the last 12 months Yes 0.052
6 Number of credit cards more than 30 days past due in the last 6 months Yes 0.052
7 Number of credit cards more than 30 days past due in the last 12 months No 0.016
8 Number of credit cards more than 60 days past due in the last 6 months No 0.012
9 Number of credit cards more than 60 days past due in the last 12 months No 0.008
10 Number of credit cards more than 90 days past due in the last 6 months No 0.005
11 Number of credit cards more than 90 days past due in the last 12 months No 0.001
12 Worst days past due among unsecured products in the last 6 months Yes 0.055
13 Worst days past due among unsecured products in the last 12 months Yes 0.062
14 Worst days past due among secured products in the last 6 months No 0.010
15 Worst days past due among secured products in the last 12 months No 0.005
16 Worst current delinquency status on credit cards No 0.003
17 Worst delinquency status on credit cards in the last 6 months No 0.018
1798 Afr. J. Bus. Manage.
Table 2. Contd.
18 Worst delinquency status on credit cards in the last 12 months No 0.015
II Recent searches for credit
19 Number of inquiring banks in the last 1 month No 0.013
20 Number of inquiring banks in the last 2 months No 0.031
21 Number of inquiring banks in the last 3 months Yes 0.059
22 Number of total inquiries No 0.015
23 Time since most recent inquiry No 0.003
24 Date of most recent inquiry No 0.001
III
Length of credit history
25 Months since first opened for credit card Yes 0.052
26 Months since newest trade opening No 0.001
27 Months since oldest revolving trade opened No 0.003
28 Trade line active months No 0.001
IV
Types of credit used
29 Bureau forced closed record No 0.001
30 Bureau bounced check record / refusal of check facilities No 0.002
31 Bureau abnormal credit record Yes 0.055
32 Remark for repayment by relatives No 0.002
V Credit utilization
33 Average revolving balance Yes 0.051
34 Number of open revolving trades with balance > 0 No 0.002
35 Number of open revolving trades No 0.003
36 Average revolving ratio in the last 3 months Yes 0.060
37 Average revolving ratio in the last 6 months No 0.033
38 Average revolving ratio in the last 12 months No 0.020
39 Number of trades opened in the last 3 months Yes 0.058
40 Number of trades opened in the last 6 months No 0.012
41 Number of trades opened in the last 12 months No 0.008
42 Average revolving balance for trades open in the last 12 months No 0.006
43 Number of revolving trade lines No 0.003
44 Average utilization ratio of credit cards in the last 3 months No 0.026
45 Average utilization ratio of credit cards in the last 6 months Yes 0.056
46 Average utilization ratio of credit cards in the last 12 months No 0.006
Table 3. Results of application scoring model.
Variable Attributes G/B odds ratio Attribute points
Borrower’s age
20-25 1.52 64
26-35 1.38 58
36-45 1.29 54
46-55 1.12 47
Above 55 (reference) 1.00 42
Borrower’s gender Male (reference)
Female
1.00
1.62
34
55
Material status
Single
Married
Divorced (reference)
Others
1.83
2.33
1.00
1.42
44
56
24
34
Chi et al. 1799
Table 3. Contd.
Borrower’s education
Elementary (reference)
High school
College/university
graduate school
Others
1.00
1.23
1.63
2.43
1.91
35
43
57
85
67
Borrower’s occupation
White collar
Professional person
Military/public official/ teacher
Blue collar
Freelancer
Others (reference)
2.05
2.77
3.73
1.86
1.32
1.00
45
61
82
41
29
22
Years of work experience
Less than 1 year (reference)
1-3 years
4-9 years
10-19 years
Greater than or equal to 20 years
1.00
1.12
1.30
1.49
1.65
43
48
56
64
71
Home ownership
Own
Rent (reference)
Live with family or friends
Others
3.30
1.00
2.55
66
20
51
Term of loan
1 year (reference)
2-6 years
7 years
1.50
1.00
1.11
30
45
50
Loan amount
Below NT$ 100,000
NT$ 100,000-NT$ 300,000
NT$ 300,001-NT$ 500,000
NT$ 500,001-NT$ 600,000 (reference)
1.36
3.10
1.97
1.48
1.00
61
90
57
43
29
Table 4. Credit scoring results of three construction models.
Models Training set
Testing set
K-S (%) AUC (%) K-S (%) AUC (%)
Application scoring model 29.90 70.50 27.60 70.30
Credit bureau scoring model 42.60 75.00 41.10 74.90
Scoring matrix 48.30 81.40 46.20 81.30
outstanding amount of cash cards, maximum consecutive months of cash advance more than 0 in the last 12 months, number of credit cards more than 30 days past due in the last 6 months, worst days past due among unsecured products in the last 6 months, number of inquiring banks in the last 3 months, bureau abnormal
credit record, average revolving ratio in the last 3 months and average utilization ratio of credit cards in the last 6 months.
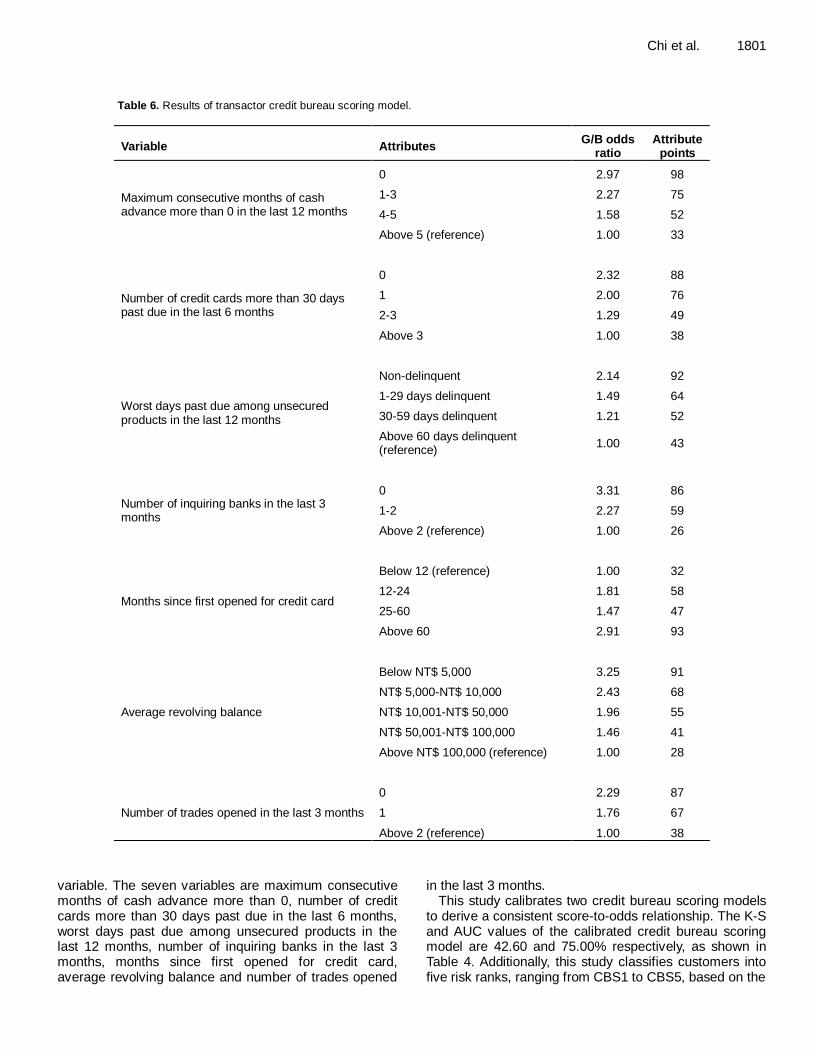
Table 6 indicates the seven significant variables of the transactor credit bureau scoring model as well as the attributes, G/B odds ratio, and attributes points of each
1800 Afr. J. Bus. Manage.
Table 5. Results of revolving credit bureau scoring model.
Variable Attributes G/B odds
ratio Attribute
points
Outstanding amount of cash cards
Below NT$ 10,000 3.08 77
NT$ 10,000-NT$ 50,000 2.44 61
NT$ 50,001-NT$ 10,000 1.68 42
NT$ 10,001-NT$ 150,000 1.20 30
Above NT$ 150,000 (reference) 1.00 25
Maximum consecutive months of cash advance more than 0 in the last 12 months
0 2.05 76
1-3 1.57 58
4-6 1.14 42
7-9 1.35 50
Above 9 (reference) 1.00 37
Number of credit cards more than 30 days past due in the last 6 months
0 2.93 82
1-2 2.36 66
3-4 1.39 39
Above 4 (reference) 1.00 28
Worst days past due among unsecured products in the last 6 months
Non-delinquent 4.17 75
1-29 days delinquent 3.39 61
30-59 days delinquent 1.72 31
60-89 days delinquent 1.28 23
Above 90 days delinquent (reference)
1.00 18
Number of inquiring banks in the last 3 months
0 2.18 83
1-2 2.00 76
3-5 1.21 46
Above 5 (reference) 1.00 38
Bureau abnormal credit record Yes (reference) 1.00 25
No 3.00 75
Average revolving ratio in the last 3 months
Below 10% 2.72 79
10-50% 1.72 50
Above 50% (reference) 1.00 29
Average utilization ratio of credit cards in the last 6 months
Below 10% 2.92 76
10-30% 2.50 65
31-60% 1.92 50
61-80% 1.38 36
Above 80% 1.00 26
Chi et al. 1801
Table 6. Results of transactor credit bureau scoring model.
Variable Attributes G/B odds
ratio Attribute
points
Maximum consecutive months of cash advance more than 0 in the last 12 months
0 2.97 98
1-3 2.27 75
4-5 1.58 52
Above 5 (reference) 1.00 33
Number of credit cards more than 30 days past due in the last 6 months
0 2.32 88
1 2.00 76
2-3 1.29 49
Above 3 1.00 38
Worst days past due among unsecured products in the last 12 months
Non-delinquent 2.14 92
1-29 days delinquent 1.49 64
30-59 days delinquent 1.21 52
Above 60 days delinquent (reference)
1.00 43
Number of inquiring banks in the last 3 months
0 3.31 86
1-2 2.27 59
Above 2 (reference) 1.00 26
Months since first opened for credit card
Below 12 (reference) 1.00 32
12-24 1.81 58
25-60 1.47 47
Above 60 2.91 93
Average revolving balance
Below NT$ 5,000 3.25 91
NT$ 5,000-NT$ 10,000 2.43 68
NT$ 10,001-NT$ 50,000 1.96 55
NT$ 50,001-NT$ 100,000 1.46 41
Above NT$ 100,000 (reference) 1.00 28
Number of trades opened in the last 3 months
0 2.29 87
1 1.76 67
Above 2 (reference) 1.00 38
variable. The seven variables are maximum consecutive months of cash advance more than 0, number of credit cards more than 30 days past due in the last 6 months, worst days past due among unsecured products in the last 12 months, number of inquiring banks in the last 3 months, months since first opened for credit card, average revolving balance and number of trades opened
in the last 3 months. This study calibrates two credit bureau scoring models
to derive a consistent score-to-odds relationship. The K-S and AUC values of the calibrated credit bureau scoring model are 42.60 and 75.00% respectively, as shown in Table 4. Additionally, this study classifies customers into five risk ranks, ranging from CBS1 to CBS5, based on the
1802 Afr. J. Bus. Manage.
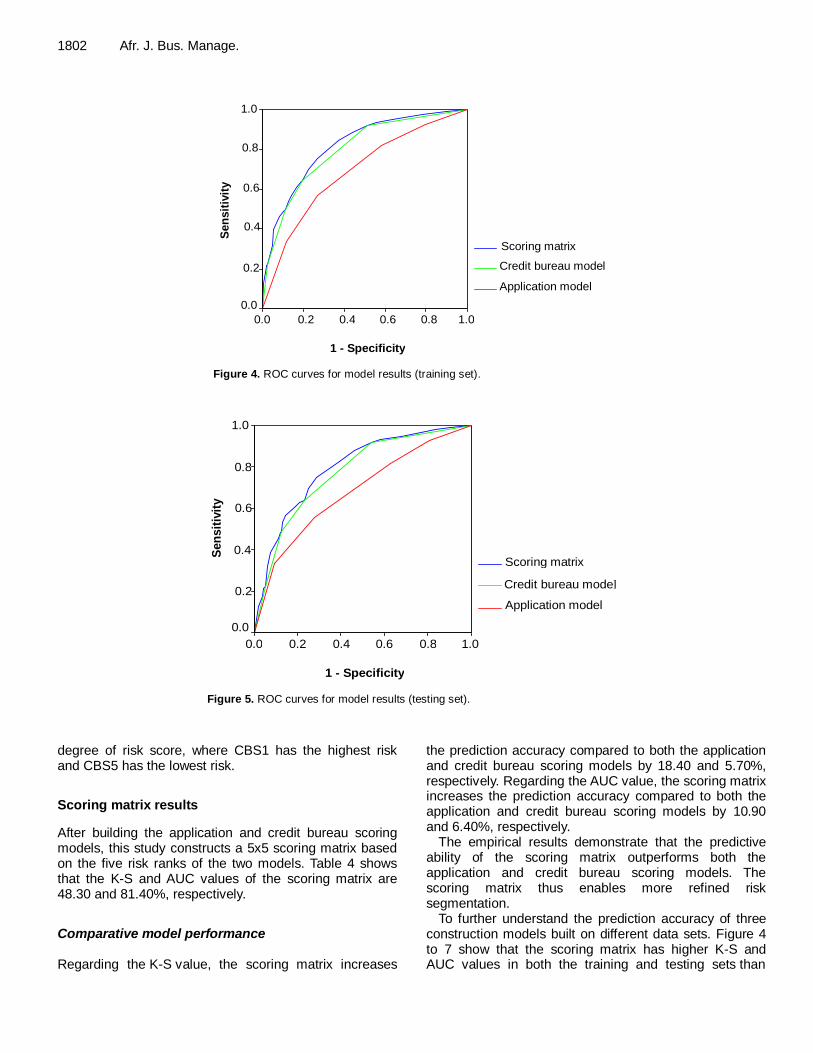
Figure 4. ROC curves for model results (training set).
1 - Specificity
1.0 0.8 0.6 0.4 0.2 0.0
Sen
sit
ivit
y
1.0
0.8
0.6
0.4
0.2
0.0
Scoring matrix
Application model
Credit bureau model
Figure 5. ROC curves for model results (testing set).
1 - Specificity
1.0 .8 .6 .4 .2 0.0
Sen
sit
ivit
y
y
1.0
.8
.6
.4
.2
0.0
Scoring matrix
Credit bureau model
Application model
Figure 4. ROC curves for model results (training set).
1 - Specificity
1.0 0.8 0.6 0.4 0.2 0.0
Sen
sit
ivit
y
y
1.0
0.8
0.6
0.4
0.2
0.0
Scoring matrix
Credit bureau model
Application model
Figure 5. ROC curves for model results (testing set).
degree of risk score, where CBS1 has the highest risk and CBS5 has the lowest risk.
Scoring matrix results
After building the application and credit bureau scoring models, this study constructs a 5x5 scoring matrix based on the five risk ranks of the two models. Table 4 shows that the K-S and AUC values of the scoring matrix are 48.30 and 81.40%, respectively.
Comparative model performance Regarding the K-S value, the scoring matrix increases
the prediction accuracy compared to both the application and credit bureau scoring models by 18.40 and 5.70%, respectively. Regarding the AUC value, the scoring matrix increases the prediction accuracy compared to both the application and credit bureau scoring models by 10.90 and 6.40%, respectively.
The empirical results demonstrate that the predictive ability of the scoring matrix outperforms both the application and credit bureau scoring models. The scoring matrix thus enables more refined risk segmentation.
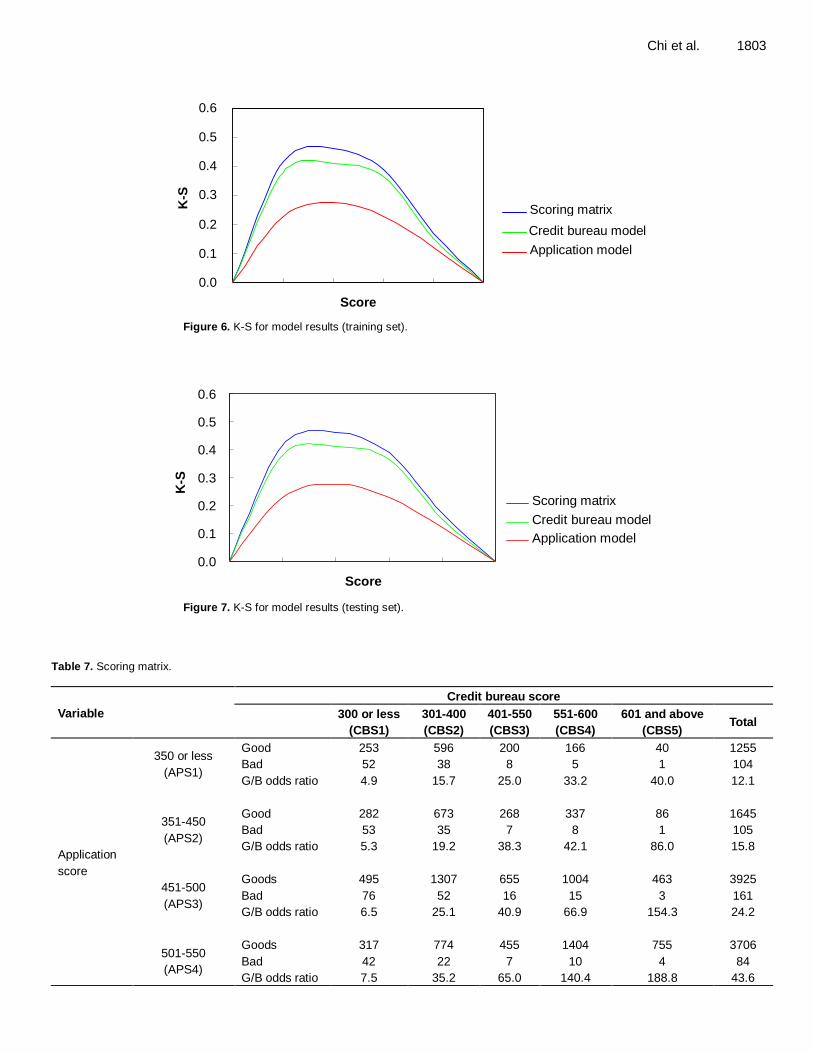
To further understand the prediction accuracy of three construction models built on different data sets. Figure 4 to 7 show that the scoring matrix has higher K-S and AUC values in both the training and testing sets than
Chi et al. 1803
0.0
0.1
0.2
0.3
0.4
0.5
0.6
Score
K-S
S
Scoring matrix
Credit bureau model
Application model
Figure 6. K-S for model results (training set).
0.0
0.1
0.2
0.3
0.4
0.5
0.6
Score
K-S
Scoring matrix
Credit bureau model
Application model
Figure 7. K-S for model results (testing set).
Table 7. Scoring matrix.
Variable
Credit bureau score
300 or less
(CBS1)
301-400
(CBS2)
401-550
(CBS3)
551-600
(CBS4)
601 and above
(CBS5) Total
Application
score
350 or less
(APS1)
Good 253 596 200 166 40 1255
Bad 52 38 8 5 1 104
G/B odds ratio 4.9 15.7 25.0 33.2 40.0 12.1
351-450
(APS2)
Good 282 673 268 337 86 1645
Bad 53 35 7 8 1 105
G/B odds ratio 5.3 19.2 38.3 42.1 86.0 15.8
451-500
(APS3)
Goods 495 1307 655 1004 463 3925
Bad 76 52 16 15 3 161
G/B odds ratio 6.5 25.1 40.9 66.9 154.3 24.2
501-550
(APS4)
Goods 317 774 455 1404 755 3706
Bad 42 22 7 10 4 84
G/B odds ratio 7.5 35.2 65.0 140.4 188.8 43.6
1804 Afr. J. Bus. Manage.
Table 7. Contd.
551 and above
(APS5)
Goods 263 820 596 1504 1819 5001
Bad 22 13 7 6 5 54
G/B odds ratio 12.0 63.1 85.1 250.7 363.8 94.4
Total
Good 1610 4171 2174 4415 3162 15532
Bad 245 159 45 44 15 508
G/B odds ratio 6.6 26.2 48.3 100.3 210.8 30.6
Table 8. Credit strategy.
Group G/B odds
ratio Credit strategy
Low-risk group 125.4 Banks can offer their best rates and terms to borrowers in this group.
Medium-risk group
38.0 Banks can extend credit but require much higher interest payments to compensate for the increased risk associated with this group.
High-risk group 11.6 Banks can reject loan applications.
those of the application and credit bureau scoring models. Additionally, the empirical results listed in Table 4 show that the testing set has slightly lower accuracy than the training set, indicating the scoring matrix is stable. CREDIT STRATEGY APPLICATION The analysis results indicate that the K-S and AUC values of the scoring matrix are significantly higher than those of the application and credit bureau scoring models. By applying the scoring matrix to personal loan portfolio management, this investigation classifies 16,040 personal loan customers into the 25 cells thus allowing more accurate segmentation of customer risk.
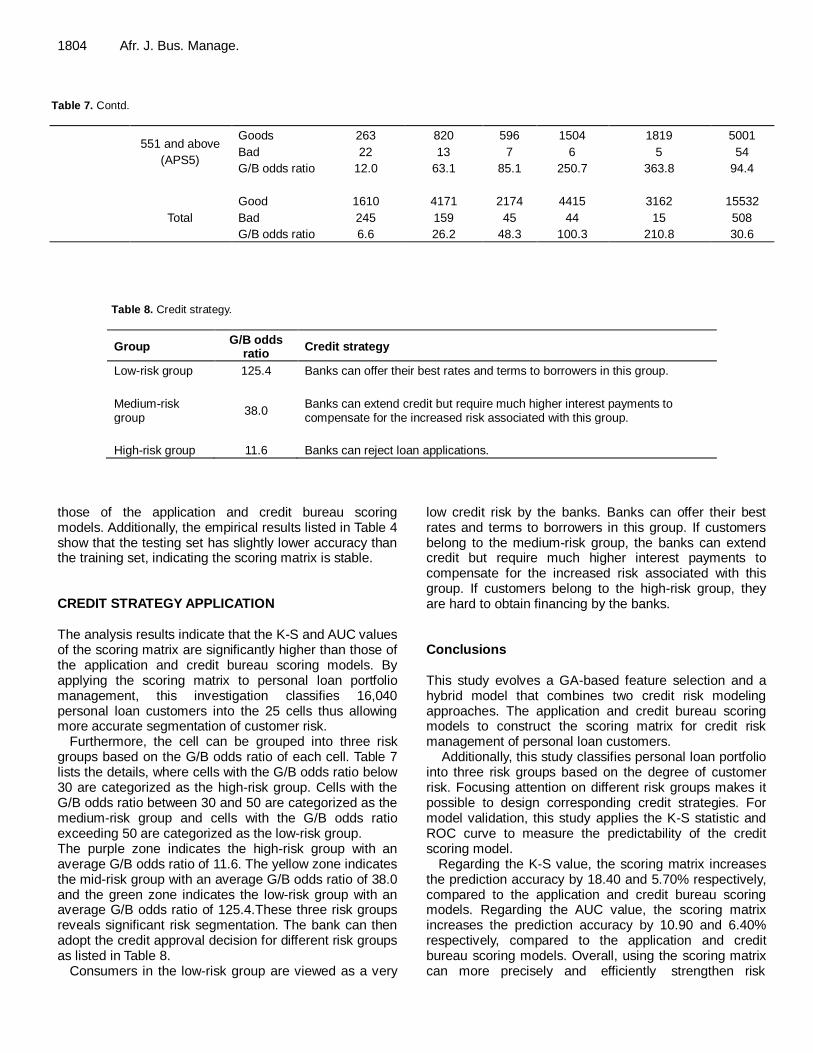
Furthermore, the cell can be grouped into three risk groups based on the G/B odds ratio of each cell. Table 7 lists the details, where cells with the G/B odds ratio below 30 are categorized as the high-risk group. Cells with the G/B odds ratio between 30 and 50 are categorized as the medium-risk group and cells with the G/B odds ratio exceeding 50 are categorized as the low-risk group. The purple zone indicates the high-risk group with an average G/B odds ratio of 11.6. The yellow zone indicates the mid-risk group with an average G/B odds ratio of 38.0 and the green zone indicates the low-risk group with an average G/B odds ratio of 125.4.These three risk groups reveals significant risk segmentation. The bank can then adopt the credit approval decision for different risk groups as listed in Table 8.
Consumers in the low-risk group are viewed as a very
low credit risk by the banks. Banks can offer their best rates and terms to borrowers in this group. If customers belong to the medium-risk group, the banks can extend credit but require much higher interest payments to compensate for the increased risk associated with this group. If customers belong to the high-risk group, they are hard to obtain financing by the banks. Conclusions This study evolves a GA-based feature selection and a hybrid model that combines two credit risk modeling approaches. The application and credit bureau scoring models to construct the scoring matrix for credit risk management of personal loan customers.
Additionally, this study classifies personal loan portfolio into three risk groups based on the degree of customer risk. Focusing attention on different risk groups makes it possible to design corresponding credit strategies. For model validation, this study applies the K-S statistic and ROC curve to measure the predictability of the credit scoring model.
Regarding the K-S value, the scoring matrix increases the prediction accuracy by 18.40 and 5.70% respectively, compared to the application and credit bureau scoring models. Regarding the AUC value, the scoring matrix increases the prediction accuracy by 10.90 and 6.40% respectively, compared to the application and credit bureau scoring models. Overall, using the scoring matrix can more precisely and efficiently strengthen risk
identification, assessment and management, making it an indispensable risk management tool for financial institutions. REFERENCES
Abdou HA (2009). Genetic programming for credit scoring: The case of
Egyptian public sector banks. Exp. Syst. Appl. 36(9):11402-11417. Akhavein J, Frame WS, White LJ (2005). The diffusion of financial
innovations: An examination of the adoption of small business credit
scoring by large banking organisations. J. Bus. 78(2):577-596. Altman EI, Marco G, Varetto F (1994). Corporate distress diagnosis:
Comparisons using linear discriminant analysis and neural networks.
J. Bank. Financ. 18(3):505-529. Boyer KK, Hult GTM (2005). Customer behavior in an online ordering
application: a decision scoring model. Decis. Sci., 36(4): 569-598.
Charitou A, Neophytou E, Charalambous C (2004). Predicting corporate failure: empirical evidence for the UK. Eur. Account. Rev. 13(3):465-497.
Chen W, Ma C, Ma L (2009). Mining the customer credit using hybrid support vector machine technique. Exp. Syst. Appl. 36(4):7611-7616.
Chi LC, Tang TC (2007). Impact of reorganization announcements on
distressed-stock returns. Econ. Model. 24(5): 749-767. Cholongitas E, Senzolo M, Patch D, Shaw S, Hui C, Burroughs AK
(2006). Review article: scoring systems for assessing prognosis in
critically ill adult cirrhotics. Aliment. Pharm. Ther. 24(3):453-464. Chuang CL, Lin RH (2009). Constructing a reassigning credit scoring
model. Exp. Syst. Appl. 36(2):1685-1694.
Chuang RJ, Chen MJ (2006). The building of credit scoring system on the residential mortgage finance. J. Hous. St. 15(2):65-90.
Dinh THT, Kleimeier S (2007). A credit scoring model for Vietnam's retail
banking market. Int. Rev. Financ. Anal. 16(5):471-495. Feldman D, Gross S (2005). Mortgage default: classification tree
analysis. J. Real Estate Financ. Econ. 30(4):369-396.
Hanley JA, McNeil BJ (1982). The meaning and use of the area under a receiver operating characteristics curve. Radiology 143(1):29-36.
Henley WE, Hand DJ (1996). A k-nearest-neighbor classifier for
assessing consumer credit risk. The Statistician 45(1):77-95. Holland J (1975). Adaptation in natural and artificial systems. The
University of Michigan Press. Reissued by The MIT Press.
Hsieh NC (2005). Hybrid mining approach in the design of credit scoring models. Exp. Syst. Appl. 28(4):655-665.
Huang CL, Chen MC, Wang CJ (2007). Credit scoring with a data
mining approach based on support vector machines. Exp. Syst. Appl. 33(4):847-856.
Huang JJ, Tzeng GH, Ong CS (2006). Two-stage genetic programming
(2SGP) for the credit scoring model. Appl. Math. Comput. 174(2):1039-1053.
Chi et al. 1805 Khashman A (2010). Neural networks for credit risk evaluation:
Investigation of different neural models and learning schemes. Exp. Syst. Appl., 37(9): 6233-6239.
Kočenda E, Vojtek M (2009). Default predictors and credit scoring models for retail banking. CESifo Working Paper Series.
Kotsiantis S, Kanellopoulos BD, Pintelas P (2006). Data Preprocessing
for Supervised Leaning. Int. J. Comput. Sci., 2(2): 111-117. Lee TS, Chen IF (2005). A two-stage hybrid credit scoring model using
artificial neural networks and multivariate adaptive regression splines.
Exp. Syst. Appl., 28(4): 743-752. Lee TS, Chiu CC, Chou YC, Lu CJ (2006). Mining the customer credit
using classification and regression tree and multivariate adaptive
regression splines. Comput. Stat. Data Anal. 50(4):1113-1130. Lin SL (2009). A new two-stage hybrid approach of credit risk in banking
industry. Exp. Syst. Appl. 36(4):8333-8341.
Mays E (2001). Handbook of credit scoring. Global Professional Publishing. pp. 23-56.
Medema L, Koning RH, Lensink R (2009). A practical approach to
validating a PD model. J. Bank. Financ. 33(4):701-708. Ouyang J, Patel N, Sethi IK (2011). From centralized to distributed
decision tree induction using CHAID and fisher's linear discriminant
function algorithms. Intell. Decis. Technol. 5(2):133-149. Thomas LC, Edelman DB, Cook JN (2002). Credit scoring and its
applications. Society for Industrial Mathematics Publishers,
Philadelphia. Tsai CF, Wu JW (2008). Using neural network ensembles for bankruptcy
prediction and credit scoring. Exp. Syst. Appl. 34(4):2639-2649.
Wang ML, Feng ZY, Chang YH (2010). A preliminary application of genetic algorithm on slope stability analysis. J. Soil Water Conserv. 42(1):65-82.
Yu B (2009). Approximating the risk score for disease diagnosis using MARS. J. Appl. Statist. 36(7):769-778.
Zhang D, Hifi M, Chen Q, Ye W (2008). A hybrid credit scoring model
based on genetic programming and support vector machines. Fourth international conference on natural computation. 7:8-12.
Zhang D, Zhou X, Leung SCH, Zheng J (2010). Vertical bagging
decision trees model for credit scoring. Exp. Syst. Appl. 37(12):7838-7843.
Zhou L, Lai KK, Yen J (2009). Credit scoring models with AUC
maximization based on weighted SVM. Int. J. Inform. Technol. Decision Making. Technol. Decis. Making 8(4):677-696.
Zhou XY, Zhang DF, Jiang Y (2008). A new credit scoring method based
on rough sets and decision tree. Lecture Notes in Artificial Intelligence 5012:1081-1089.


![Enhancing Collaborative Filtering Systems with …...most commonly used dimensionality reduction approaches [6]. Researchers have also used hybrid recommender systems, which combine](https://img.pdfslide.net/doc/110x75/5ea81d5f780a4f1e385d206a/enhancing-collaborative-filtering-systems-with-most-commonly-used-dimensionality.jpg)