Embed Size (px)
Citation preview
ENIGMA - JOURNAL OF INFORMATION SECURITY AND CRYPTOGRAPHY, VOL. 6, NO. 1, 2019 9
1Abstract— Analyzing attacks on computer networks is
complex given the volume of data considered and the large
number of machines, even in small networks. The volume of data
is large and the time to process and analyze it is short. The goal is
to extract and analyze information about network attacks that
has been obtained from open sources. Using a robust, elastic and
scalable architecture that makes use of processing techniques
with the use of Hadoop so that the information is available in a
timely manner. With the proposed architecture implemented all
the desired characteristics were obtained allowing the processing
of the data in near real time. The system provides intelligence
information about large-scale attacks with agility and efficiency.
Keywords— Attack detection, K-means Clustering, Threat
Intelligence, Big data
I. INTRODUCTION
he mastery of information is a fundamental point for the
evolution of humanity since its inception. Being able to
analyze data on threats to systems is essential for
structuring protection and recovery plans. Big Data applies
information that cannot be processed or analyzed using
traditional processes or tools, with the focus of the systems on
obtaining the greatest amount of data on transactions and their
users.
According to [7], three characteristics are inherent to Big
Data: volume, variety and velocity. The volume refers to what
has already been addressed about the large amount of data that
are and will be generated in the future, making centralized
systems unable to process the entire data set. The variety
refers to the diversity of sources from which the data
originates, low-level access records, location information,
accelerometers, writing patterns, among others, form the
origin of the information. Finally, the speed at which this data
cannot be processed in the background, in an increasingly
dynamic environment a few seconds can mean the loss of
brand value and consequently a financial loss. However, the processing of large volumes of data is
hampered by a number of problems that need to be
considered, such as shortening the access time and recording
of information, consulting all the data in a large database and
realizing interactive data analysis. The solution found was to
divide and distribute the data across multiple disks and
parallelize access to them, to reduce space wastage, access to
all disks would be shared between processes and users
ensuring that on average the use of this additional space is
always optimized.
1J. V. C. Júnior, Universidade de Brasília, Brasília, Distrito Federal,
Brasil, [email protected]. J. J. C. Gondim, Universidade de Brasília, Brasília, Distrito Federal,
Brasil, [email protected]. Corresponding author: José Valdy Campelo Júnior
The main contribution presented here is to build a low-cost
environment for organizing, understanding, and better viewing
threats on open-source switch networks. As a long-term goal,
this architecture seeks to generate threat intelligence using
open sources with the capacity for abstract difficulties listed
so far. Additionally, it demonstrates how the environment can
be used to build profiles of attackers and targets. This work is organized as follows: Section 2 discusses some
of the works present in the literature as well as the differences
between the approaches to this work. Section 3 describes the
proposed architecture and its components, and Section 4 deals
with the data sources used to develop this work. The results of
the experiments are detailed in Section 5, and finally Section 6
presents conclusions and some final observations.
II. RELATED WORK
In the literature, there are several works that use Hadoop-
based architectures, both for extraction and for analysis of
large masses of data with objectives related to information
security. In Bachupally et al. [2], for example, a HDFS- and Hive-
based architecture is used to process network captures for
threat identification and network attacks. The main
improvement pointed out by the author was the possibility of
processing a large amount of data in a short period of time. Janeja et al. [8] proposed a distributed in-trusion detection
system, basing its development on the HAMRframework [12]
that operates with a real-time data flow with an in-memory
computing mechanism. The architecture seeks to detect
multifaceted intrusions that can be distributed over time and
also over the network. In the same line Jia [9] explains about an architecture based
on Big Data for the detection of Advanced Persistent Threats,
decomposing its examination layer by layer and using various
security techniques. Similarly, the objective of this work is to propose an
architecture for Big Data processing, based on the Hadoop
suite for capturing and analyzing data related to information
security. Among the differences for the related works is the
simplifying factor of the analysis, allowing that without great
knowledge about the architecture and processing of the data it
is possible to extract information.
III. METHODS AND MATERIALS
Environment Architecture
In order to allow the insertion and processing of the mass of
data obtained through the open sources, a robust architecture
was necessary. Thinking about it, four general characteristics
were defined that guided the development of this approach,
T
Environment for Threat Intelligence Analysis and
Generation using Open Sources
J. V. C. Júnior1 and J. J. C. Gondim
10 ENIGMA - JOURNAL OF INFORMATION SECURITY AND CRYPTOGRAPHY, VOL. 6, NO. 1, 2019 are they:1. Scalability 2. Elasticity 3. High availability 4.
Adaptability Following these concepts, the system will meet the growing
increase in the number of fingerprints and allow several types
of analysis and an agile extraction of data in the face of the
vertiginous increase in information about attacks generated
daily, thus allowing the application of various techniques of
analysis on the data. The artifact chosen to compose the solution proposed in this
work is the Hadoop suite that already has a distributed file
system the Hadoop Distributed FileSystem(HDFS) [3], a tool
for processing large amounts of data the MapReduce [5] and
the Yet Another Resource Negotiator(YARN) [11] that
controls the tasks executed without a Hadoop cluster. This
choice aimed to simplify the management and installation of
the components that make up the Hadoop cluster and
centralize the control and monitoring of all services and
equipment present. From this, it is possible to add and remove
computers from the cluster, and also add and remove services
on all computers belonging. These features allow the
execution of programs in this environment to be elastic,
scalable and adaptable. To ensure high availability, the cluster
has been configured in a public cloud that ensures
uninterrupted system operation. Figure 1 illustrates the configuration of the complete
architecture for implementing the capture system. Attack data
is captured by the catcher who acts as a proxy simulating a
real connection to the site providing the information, such as
the LookingGlassCyber NorseCorp site. This program
receives the data from open sources and creates a HTTP GET
type request, then sends a message to Flume via an HTTP
source.
Figure 1. System architecture
This source is connected and replicating the data to two
channels, Kafka Channel and File Channel. After the data is
sent to these two channels, by a Flume feature, it will only be
removed from the channel after it has been delivered to its
respective sink. In this case there are two sinks, MorphlineSolr
Sink and AsyncHBase Sink. The first one processes the data
to insert them into the Solr program, the second one processes
them to store the HBase program. With all data already entered and persisted, the HUE tool is
responsible for displaying this data in a clear, objective and
simple way. There are countless options for displaying and
filtering the data, with the user being able to extract
information in real time and build up prior knowledge on a
number of aspects of the captured attack data.
Data Capture
The data capture protocol seeks to simulate a legitimate
connection from a browser to the data source website. Using
the websocket-client library, the program creates a websocket-
type connection directly to the source server. The use of this
protocol as a basis for the capture program is due to the fact
that most of the data sources use this protocol for
communication between the client application and the server. Many other sources of attack data can be found on the
Internet, such as: 1.ThreatMap CheckPoint- [4] 2.Digital
Attack Map - [1]. One of the data sources chosen was the
NorseCorp website. A Cybersecurity company specializes in
delivering intelligence against network attacks, security
breaches, and various threats. It offers continuous network
state updates through various sensors around the world. To disseminate the technology used, NorseCorp provides
part of this information through an online tool in the form of
an interactive map. The site can be accessed at
http://map.norsecorp.com/, being possible to visualize in real
time the attacks occurring against the company's clients. The data received by this data source is preprocessed by the
company and limited.. Table 1 provides a summary of the data
that is stored in the database followed by examples of values.
As there was no description of the data available, it remained
the observation of the data where it was possible to obtain
some initial information such as the existence of redundant
data such as dport and svc that always have the same value.
The vector_id and type only have meaning when used inside
the company page because they are used during the map
design functions. Even so, all data is stored in the database for
completeness. TABLE I
DESCRIPTION OF THE DATA CAPTURED FROM THE COMPANY
NORSECORP
Data name Description Example
_id Unique identifier of the
object in the database ObjectId("58d1bbbf
e2e558522a") city City of origin of the attack Washington
city2 City where the target of the
attack resides De Kalb Junction
dport Door on which the attack
was carried out 25
countrycode Code of the country of origin
of the attack US
countrycode2 Target country code US
country Identification of the country
of origin of the attack US
country2 Identification of the target
country US
latitude Approximate latitude of the
source of the attack 38.95
longitude Approximate longitude of
attack source -77.02
latitude2 Approximate latitude of
target -44.48
longitude2 Approximate longitude of
target -75.3
svc Service exploited by the 25
ENIGMA - JOURNAL OF INFORMATION SECURITY AND CRYPTOGRAPHY, VOL. 6, NO. 1, 2019 11
attack
timestamp Date and time at time of data
capture 2017-03-21
23:48:15.161973
vector_id Information forwarded by
the server for drawing on
animation screen
NumberLong("3032
41862584")
org Organization that holds the
IP address block that
originated the attack
Microsoft
Corporation
type Information about the
company's tool that captured
the attack information ipviking.honey
md5 IP number of the machine
that sent the attack 65.55.169.250
IV. RESULTS AND DISCUSSION
After implementing the architecture defined in Section 3,
data capture and ingestion began. Between the months of
August and December 2017, about 14 million records of
attacks were internalized. Even with this large number of entries, the queries in the
tool did not vary in their response time, displaying the result
almost immediately after the filters were selected. This
behavior is related to the fact that the indexing of the data is
carried out at the moment of their insertion. Thus, the
processing required during the queries is reduced
considerably. Google Cloud Platform was the solution chosen to host
the cluster. In this environment two machines were created,
a so-called Master with 2 virtual CPU's, 14GB of RAM and
100GB of secondary memory. And another so-called Slave
with 1 virtual CPU, 4GB of RAM and 100GB of secondary
memory. After internalizing the data and processing them, it was
observed that TCP ports with 50864 and 53413 values were
frequent. Thus, two filter options were defined for a more
accurate analysis: attacks that target port 50864 and attacks
that use port 53413 for the same purpose. The choice of
ports was based on all the previous information about
vulnerabilities in these ports and because of the
concentration of their source. After making this selection
again, all data in the tool pane displays only the selected
data.
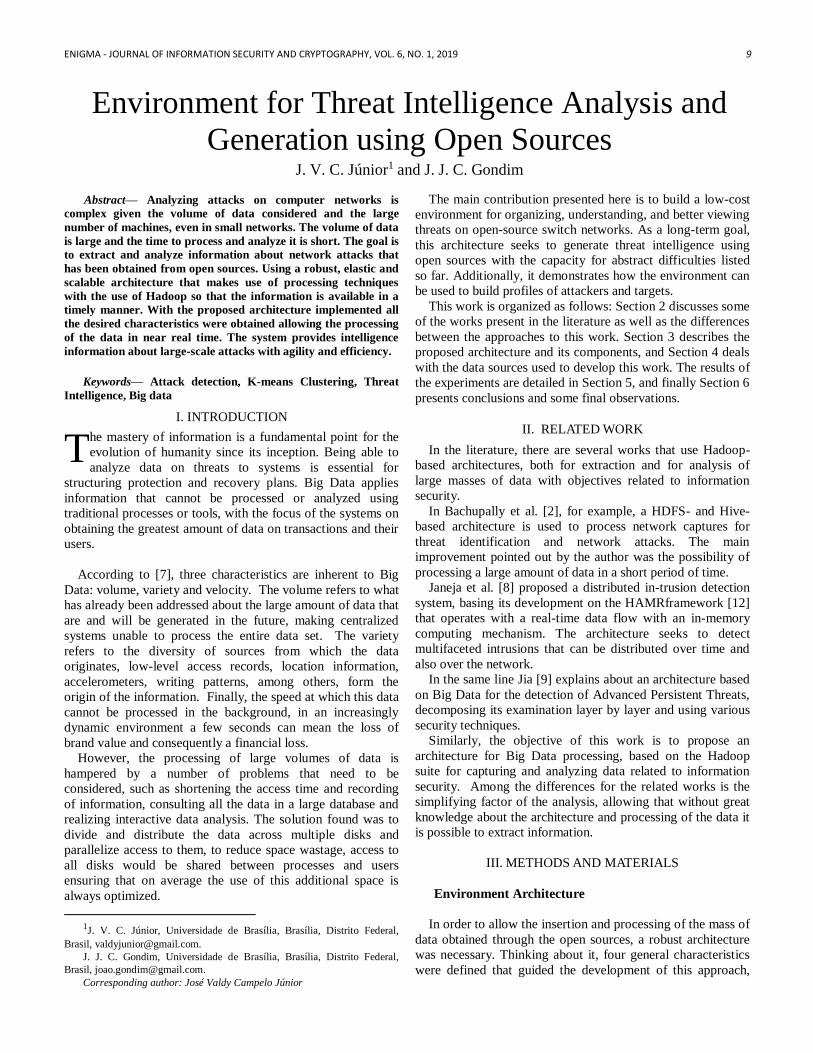
Figure 2. Region of origin of the attacks port 50864
The Figures 2 to 5 illustrates the regions from which the
attacks that exploited possible vulnerabilities on these ports
originated. In Figure 2, only the eastern region of China is
shown where the green markers represent the grouping of
cities from which we started attacks, while in Figure 5, in
addition to this, the region of South Korea also appears as
one of the main origins.
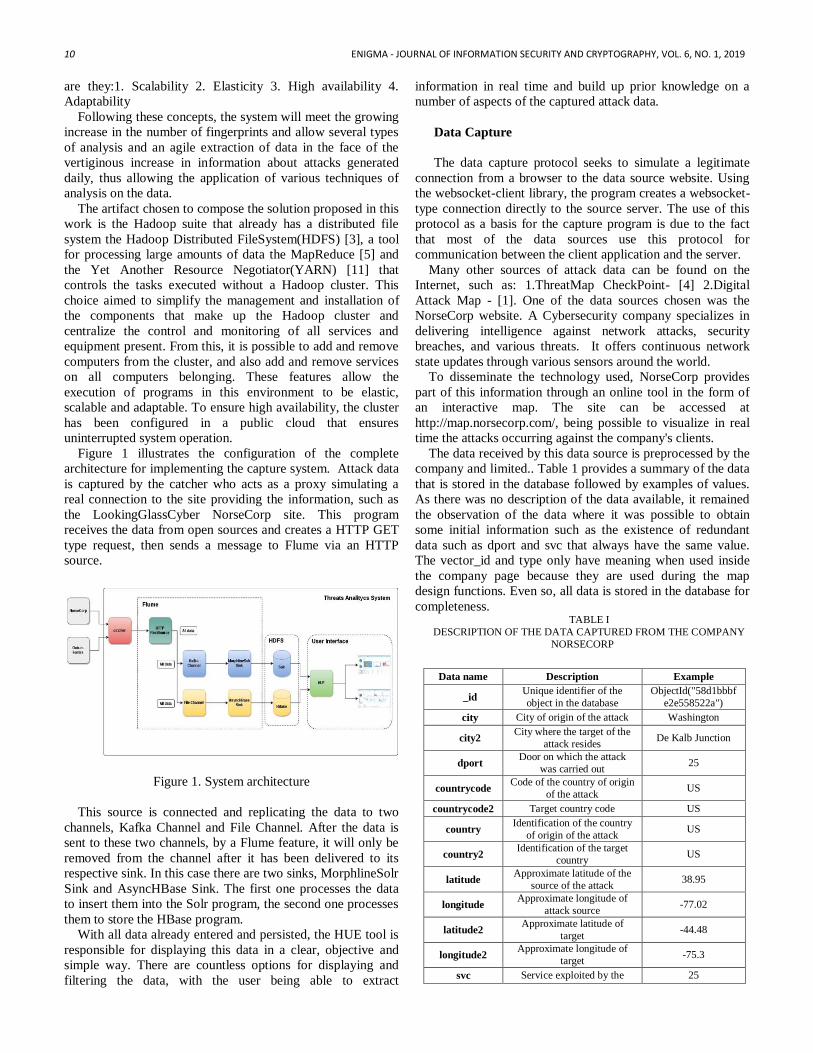
Figure 3. Region of origin of the attacks port 53413
However, the map represented in Figure 5 at the time of
image capture was centered in a specific region, so it does
not fully display all the countries that use this port. The
Figures 2 and 3, which shows the attacking countries and
their respective cities.
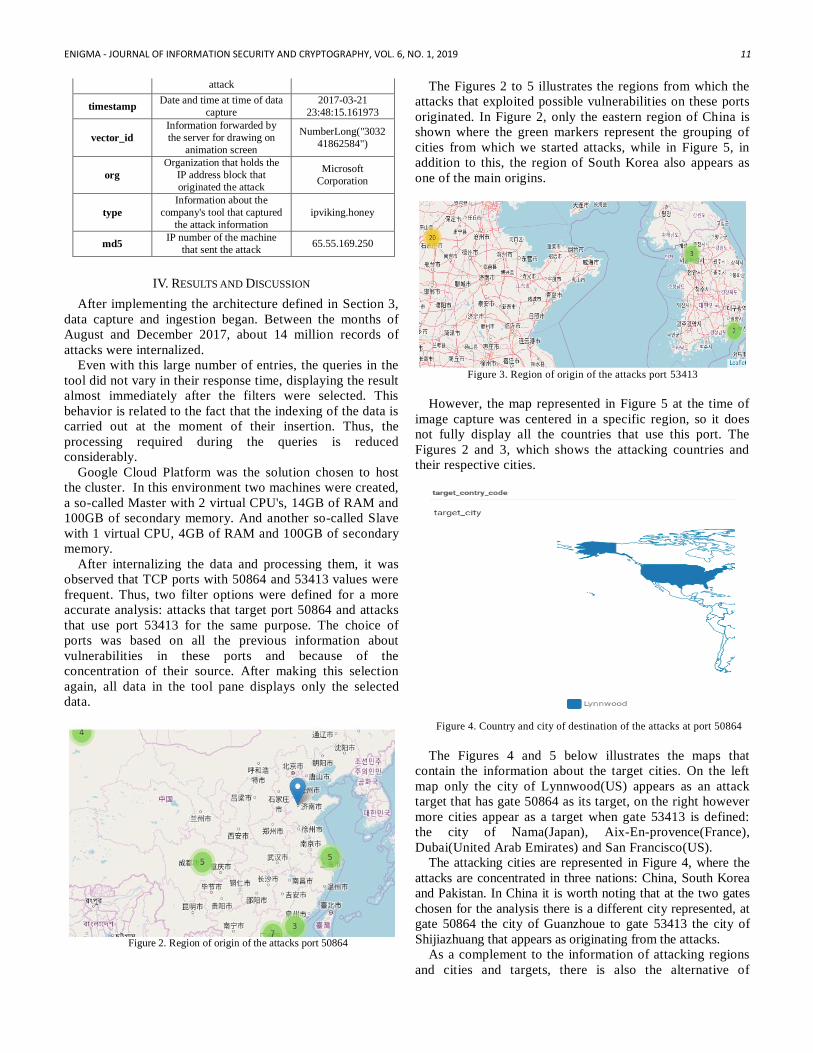
Figure 4. Country and city of destination of the attacks at port 50864
The Figures 4 and 5 below illustrates the maps that
contain the information about the target cities. On the left
map only the city of Lynnwood(US) appears as an attack
target that has gate 50864 as its target, on the right however
more cities appear as a target when gate 53413 is defined:
the city of Nama(Japan), Aix-En-provence(France),
Dubai(United Arab Emirates) and San Francisco(US). The attacking cities are represented in Figure 4, where the
attacks are concentrated in three nations: China, South Korea
and Pakistan. In China it is worth noting that at the two gates
chosen for the analysis there is a different city represented, at
gate 50864 the city of Guanzhoue to gate 53413 the city of
Shijiazhuang that appears as originating from the attacks. As a complement to the information of attacking regions
and cities and targets, there is also the alternative of
12 ENIGMA - JOURNAL OF INFORMATION SECURITY AND CRYPTOGRAPHY, VOL. 6, NO. 1, 2019 studying the number and origin of attacks through the filter
tools: attacker_country_code and target_country_code.
Sometimes it is more readable to access information by
looking at these fields than other tool options. Performing a quick search, several forums and websites
have emerged reporting the interest of Chinese attackers in
ports with values above 40,000 with emphasis on ports
50,866, 50,864 and 54,413 [10]. Another information that
emerged during the surveys was a possible backdoor in
Netis routers made in China from the company Netcore
Group[6], where using port 54,413[10] attackers could take
full control of the device without any knowledge of its
owner.
Figure 5. Country and city of destination of the attacks at port 53413
These references corroborate the results obtained by
observing the data captured, and also provide new information
on which countries are using these vulnerabilities. In addition
to the filters for countries that appear as targets for attacks,
there is also the option of filtering the countries from which
the attacks originate. This option is motivated by the fact that
two different countries play a role as sources of attacks. To
illustrate the difference, the two largest attacking countries
registered in the database were chosen, the United States (US)
and China (CN). Each filter was selected independently, and the results of
the visualization tools can be seen in Figures 8 and 9. The first
two tools show the ports that received the most attacks, Figure
8 refer to information about the most attacked ports by
machines located in China. Figure 9 illustrate the same
information only as in the United States.
Figure 6. Country and city of origin of the attacks at port 50864
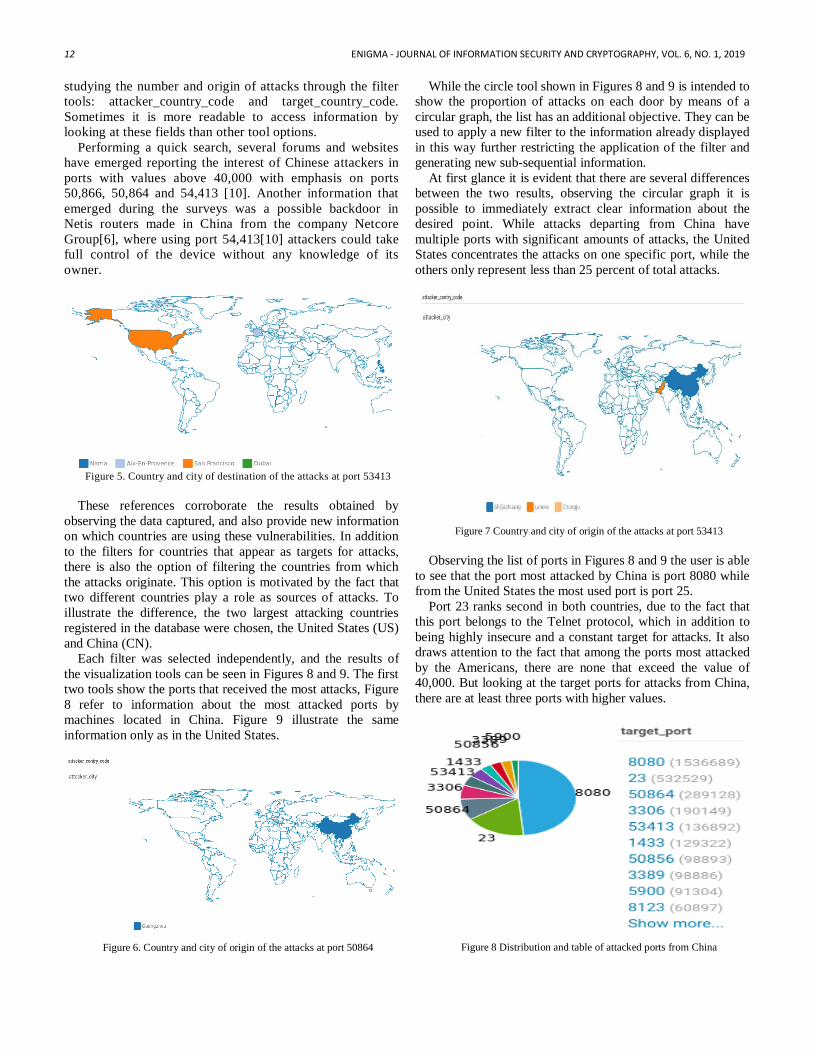
While the circle tool shown in Figures 8 and 9 is intended to
show the proportion of attacks on each door by means of a
circular graph, the list has an additional objective. They can be
used to apply a new filter to the information already displayed
in this way further restricting the application of the filter and
generating new sub-sequential information. At first glance it is evident that there are several differences
between the two results, observing the circular graph it is
possible to immediately extract clear information about the
desired point. While attacks departing from China have
multiple ports with significant amounts of attacks, the United
States concentrates the attacks on one specific port, while the
others only represent less than 25 percent of total attacks.
Figure 7 Country and city of origin of the attacks at port 53413
Observing the list of ports in Figures 8 and 9 the user is able
to see that the port most attacked by China is port 8080 while
from the United States the most used port is port 25. Port 23 ranks second in both countries, due to the fact that
this port belongs to the Telnet protocol, which in addition to
being highly insecure and a constant target for attacks. It also
draws attention to the fact that among the ports most attacked
by the Americans, there are none that exceed the value of
40,000. But looking at the target ports for attacks from China,
there are at least three ports with higher values.
Figure 8 Distribution and table of attacked ports from China
ENIGMA - JOURNAL OF INFORMATION SECURITY AND CRYPTOGRAPHY, VOL. 6, NO. 1, 2019 13
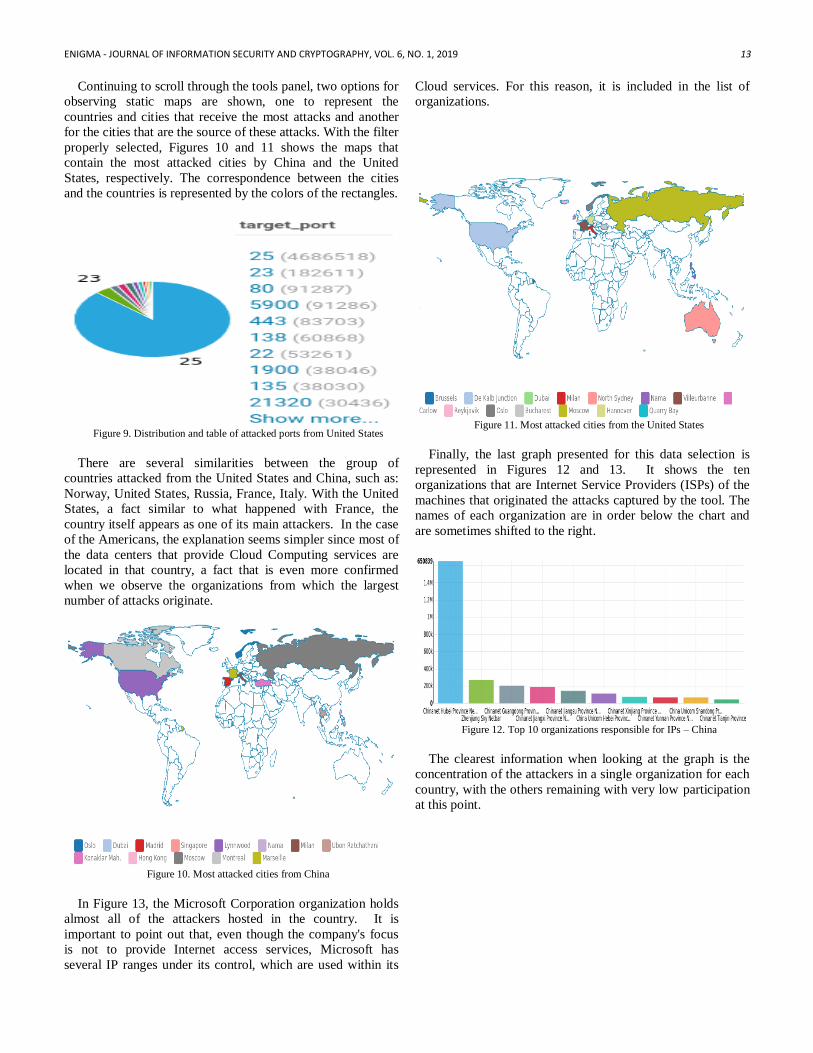
Continuing to scroll through the tools panel, two options for
observing static maps are shown, one to represent the
countries and cities that receive the most attacks and another
for the cities that are the source of these attacks. With the filter
properly selected, Figures 10 and 11 shows the maps that
contain the most attacked cities by China and the United
States, respectively. The correspondence between the cities
and the countries is represented by the colors of the rectangles.
Figure 9. Distribution and table of attacked ports from United States
There are several similarities between the group of
countries attacked from the United States and China, such as:
Norway, United States, Russia, France, Italy. With the United
States, a fact similar to what happened with France, the
country itself appears as one of its main attackers. In the case
of the Americans, the explanation seems simpler since most of
the data centers that provide Cloud Computing services are
located in that country, a fact that is even more confirmed
when we observe the organizations from which the largest
number of attacks originate.
Figure 10. Most attacked cities from China
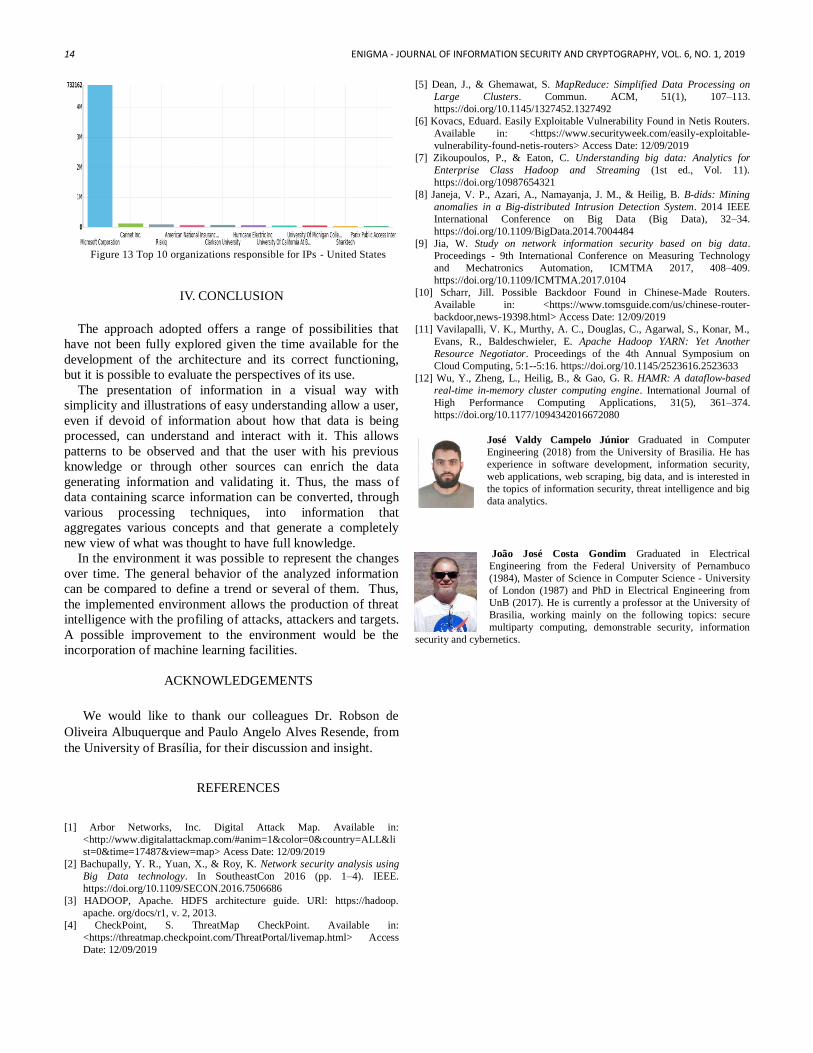
In Figure 13, the Microsoft Corporation organization holds
almost all of the attackers hosted in the country. It is
important to point out that, even though the company's focus
is not to provide Internet access services, Microsoft has
several IP ranges under its control, which are used within its
Cloud services. For this reason, it is included in the list of
organizations.
Figure 11. Most attacked cities from the United States
Finally, the last graph presented for this data selection is
represented in Figures 12 and 13. It shows the ten
organizations that are Internet Service Providers (ISPs) of the
machines that originated the attacks captured by the tool. The
names of each organization are in order below the chart and
are sometimes shifted to the right.
Figure 12. Top 10 organizations responsible for IPs – China
The clearest information when looking at the graph is the
concentration of the attackers in a single organization for each
country, with the others remaining with very low participation
at this point.
14 ENIGMA - JOURNAL OF INFORMATION SECURITY AND CRYPTOGRAPHY, VOL. 6, NO. 1, 2019
Figure 13 Top 10 organizations responsible for IPs - United States
IV. CONCLUSION
The approach adopted offers a range of possibilities that
have not been fully explored given the time available for the
development of the architecture and its correct functioning,
but it is possible to evaluate the perspectives of its use. The presentation of information in a visual way with
simplicity and illustrations of easy understanding allow a user,
even if devoid of information about how that data is being
processed, can understand and interact with it. This allows
patterns to be observed and that the user with his previous
knowledge or through other sources can enrich the data
generating information and validating it. Thus, the mass of
data containing scarce information can be converted, through
various processing techniques, into information that
aggregates various concepts and that generate a completely
new view of what was thought to have full knowledge. In the environment it was possible to represent the changes
over time. The general behavior of the analyzed information
can be compared to define a trend or several of them. Thus,
the implemented environment allows the production of threat
intelligence with the profiling of attacks, attackers and targets.
A possible improvement to the environment would be the
incorporation of machine learning facilities.
ACKNOWLEDGEMENTS
We would like to thank our colleagues Dr. Robson de
Oliveira Albuquerque and Paulo Angelo Alves Resende, from
the University of Brasília, for their discussion and insight.
REFERENCES
[1] Arbor Networks, Inc. Digital Attack Map. Available in:
<http://www.digitalattackmap.com/#anim=1&color=0&country=ALL&li
st=0&time=17487&view=map> Acess Date: 12/09/2019
[2] Bachupally, Y. R., Yuan, X., & Roy, K. Network security analysis using
Big Data technology. In SoutheastCon 2016 (pp. 1–4). IEEE.
https://doi.org/10.1109/SECON.2016.7506686
[3] HADOOP, Apache. HDFS architecture guide. URl: https://hadoop.
apache. org/docs/r1, v. 2, 2013.
[4] CheckPoint, S. ThreatMap CheckPoint. Available in:
<https://threatmap.checkpoint.com/ThreatPortal/livemap.html> Access
Date: 12/09/2019
[5] Dean, J., & Ghemawat, S. MapReduce: Simplified Data Processing on
Large Clusters. Commun. ACM, 51(1), 107–113.
https://doi.org/10.1145/1327452.1327492
[6] Kovacs, Eduard. Easily Exploitable Vulnerability Found in Netis Routers.
Available in: <https://www.securityweek.com/easily-exploitable-
vulnerability-found-netis-routers> Access Date: 12/09/2019
[7] Zikoupoulos, P., & Eaton, C. Understanding big data: Analytics for
Enterprise Class Hadoop and Streaming (1st ed., Vol. 11).
https://doi.org/10987654321
[8] Janeja, V. P., Azari, A., Namayanja, J. M., & Heilig, B. B-dids: Mining
anomalies in a Big-distributed Intrusion Detection System. 2014 IEEE
International Conference on Big Data (Big Data), 32–34.
https://doi.org/10.1109/BigData.2014.7004484
[9] Jia, W. Study on network information security based on big data.
Proceedings - 9th International Conference on Measuring Technology
and Mechatronics Automation, ICMTMA 2017, 408–409.
https://doi.org/10.1109/ICMTMA.2017.0104
[10] Scharr, Jill. Possible Backdoor Found in Chinese-Made Routers.
Available in: <https://www.tomsguide.com/us/chinese-router-
backdoor,news-19398.html> Access Date: 12/09/2019
[11] Vavilapalli, V. K., Murthy, A. C., Douglas, C., Agarwal, S., Konar, M.,
Evans, R., Baldeschwieler, E. Apache Hadoop YARN: Yet Another
Resource Negotiator. Proceedings of the 4th Annual Symposium on
Cloud Computing, 5:1--5:16. https://doi.org/10.1145/2523616.2523633
[12] Wu, Y., Zheng, L., Heilig, B., & Gao, G. R. HAMR: A dataflow-based
real-time in-memory cluster computing engine. International Journal of
High Performance Computing Applications, 31(5), 361–374.
https://doi.org/10.1177/1094342016672080
José Valdy Campelo Júnior Graduated in Computer
Engineering (2018) from the University of Brasilia. He has
experience in software development, information security,
web applications, web scraping, big data, and is interested in
the topics of information security, threat intelligence and big
data analytics.
João José Costa Gondim Graduated in Electrical
Engineering from the Federal University of Pernambuco
(1984), Master of Science in Computer Science - University
of London (1987) and PhD in Electrical Engineering from
UnB (2017). He is currently a professor at the University of
Brasilia, working mainly on the following topics: secure
multiparty computing, demonstrable security, information
security and cybernetics.