Embed Size (px)
Citation preview

ABSTRACT
HEIDI L. VERMEULEN. The Synthesis of Deuterated Bromodichloromethane,Deuterated Chlorodibromomethane, and Mixed Halogenated Acetic Acids. (UnderThe Direction of Dr. Avram Gold)
The purpose of this research project was to develop procedures for thepreparation of isotopically-labeled, mixed halogenated disinfection by-products.Deuterated bromodichloromethane (deuterated BDCM), was synthesized using analuminum catalyzed reaction. Equal volumes of deuterated chloroform (25 mL) andbromoethane (25 mL) were mixed in a 100 mL round bottom flask. Enough AICI3was added to the flask such that the reaction mixture turned dark red in color. Thereaction was allowed to stir for 46 hours. The product was purified throughfractional distillation, in which three fractions were collected. Through GC-MSanalysis, the purity of fraction 2 (65 - 72 °C) was calculated to be 93 % and that offraction 3 (73 - 78 °C) was 85%. For both fractions, BDCM was 99% deuteriumenriched. "C NMR and GC-MS analyses indicated that the impurity in both offractions 2 and 3 was deuterated chlorodibromomethane. This indicated that AICI3was reacting with the generated deuterated BDCM to yield deuteratedchlorodibromomethane. Therefore, by letting this same reaction stir for 7 days it waspossible to obtain a significant amount (approximately 5 g) of deuteratedchlorodibromomethane.
Bromochloro-, chlorodibromo-, and bromodichloroacetic acid were all obtainedthrough a literature synthesis (Zimmer et al., 1990). A new experimental procedurewas developed for the synthesis of bromodichloroacetic acid (CBrCl2C00H).Allowing bromodichloromethane to react with 1.6 M n-butyllithium in hexanes,yielded the bromodichloromethide anion. The anion was carboxylated by the additionof dry ice to yield CBrCl2C02"Li"^. The lithium salt was added to water and acidifiedwith concentrated hydrochloric acid. CBrCl2COOH was extracted from solution withmethylene chloride. Having demonstrated the feasibility of this reaction, attemptswere made to develop a procedure based on Ba^'^COs as a source of CO2. Pilotstudies involving BaC03/H2S04 as the CO2 source proved unsuccessful. While usingunrealistic quantities of BaCOj (5 g), only trace quantities of bromodichloroacetic acidwere obtained.

Table of Contents
Page
List of Figures........................................................... i
List of Tables............................................................. ii
Acknowledgements....................................................... iii
L Literature Review......................................................... 1A. Disinfection............................................................ 1B. Bromodichloromethane (BDCM)................................... 4
1. Chemical and Physical Properties............................... 42. Occurrence and Prevalence...................................... 53. Metabolism......................................................... 74. Toxicity.............................................................. 9a. Hematological Effects........................................... 10b. Hepatic Effects................................................... 10c. Renal Effects..................................................... 11
5. Carcinogenicity.................................................... 12C. Halogenated Acetic Acids.......................................... 13
1. Chemical and Physical Properties.............................. 132. Occurrence and Prevalence...................................... 143. Metabolism.......................................................... 16
4. Toxicity.............................................................. 195. Carcinogenicity..................................................... 22
n. Introduction............................................................... 26
in. Experimental Materials and Methods.................................. 29A. Instrumentation and Laboratory Materials........................ 29B. Synthesis of Mixed Halogenated Acetic Acids................... 30
1. Bromochloroacetic Acid........................................... 302. Chlorodibromoacetic Acid........................................ 313. Bromodichloroacetic Acid........................................ 32
a. Literature Synthesis............................................. 32b. Synthesis through Lithium Salt Formation................. 33
C. Synthesis of Deuterated Bromodichloromethane................ 34D. Synthesis of Deuterated Chlorodibromomethane................ 36
IV. Results and Discussion .................................................. 37A. Mixed Halogenated Acetic Acids................................... 37B. Deuterated Bromodichloromethane.................................. 39
1. Lithium Salt Formation........................................... 392. Bromination of Dichloromethide Anion........................ 40

Page
3. Hydrogenolysis of Dibromodichloromethane.................. 414. Aluminum Chloride Catalyzed Reaction........................ 425. Redistribution of Halogens in a Mixture of Chloroform
and Bromoform Under Alkaline Conditions.................... 45
V. Conclusions............................................................... 48
VI. References................................................................. 51

List of Figures
Figure Page
1 Chemical Structures of THMs.......................................... 582 Carbon Centered Oxidation Metabolic Pathway for THMs....... 593 Halogen Centered Oxidation Metabolic Pathway for THMs..... 604 Reductive Metabolic Pathway for THMs............................ 615 Reaction Scheme for CHClBrCOOH................................. 626 Mass Spectrum of CHClBrCOOH.................................... 637 Reaction Scheme for CClBr2C00H.................................. 648 Mass Spectrum of CClBrzCOOH...................................... 659 Reaction Scheme for CClaBrCOOH.................................. 6610 Mass Spectrum of CClzBrCOOH..................................... 6711 Reaction Scheme for CCl2BrC00H via Lithium Salt
Formation................................................................. 6812 Mass Spectrum of CCl2BrCOOH from Li Salt Reaction......... 6913 Proposed Reaction Scheme for ^^C-labeled CCl2BrC00H....... 7014 Reaction Scheme for Deuterated BDCM (AICI3 Reaction)....... 7115 *^C NMR of Deuterated BDCM Fraction 2......................... 7216 '^C NMR of Deuterated BDCM Fraction 3......................... 7417 GC-MS of Deuterated BDCM Fraction 2........................... 7618 GC-MS of Deuterated BDCM Fraction 3........................... 7719 Reaction Scheme for Deuterated Chlorodibromomethane
(CDBM)................................................................... 7820 "C NMR of Deuterated BDCM Fraction 2
(7 Day AICI3 Catalyzed Reaction).................................... 7921 "C NMR of Deuterated BDCM Fraction 3
(7 Day AICI3 Catalyzed Reaction).................................... 8122 "C NMR of Deuterated BDCM and CDBM Fraction 4
(7 Day AICI3 Catalyzed Reaction).................................... 8323 "C NMR of Deuterated BDCM and CDBM Fraction 5
(7 Day AICI3 Catalyzed Reaction).................................... 8524 Proposed Reaction Scheme for Deuterated BDCM
Via Lithium Salt Formation........................................... 8725 "C NMR of BDCM From Lithium Salt Reaction................. 8826 Mass Spectrum of Deuterated BDCM From Lithium
Salt Reaction.............................................................. 9027 Proposed Reaction Scheme for Deuterated BDCM
Via Bromination of Dichloromethide Anion........................ 9128 Proposed Reaction Scheme for Deuterated BDCM
Via Lithium Aluminum Deuteride.................................... 9229 Generation of Dichlorocarbenes Under Catalytic
Two-Phase Conditions.................................................. 9330 Reaction Scheme for BDCM Via Mixing Chloroform
and Bromoform Under Alkaline Conditions......................... 94

List of Tables
Table Page
1 Haloacids Identified as Drinking Water ChlorinationBy-Products in a Ten-City Survey................................... 95
2 Quarterly Median Values for Haloacetic Acidsin U.S. Drinking Waters.............................................. 96
3 Cancer Incidence in Mice Exposed to ChloroaceticAcids in Drinking Water.............................................. 97
4 Melting Points of Mixed Halogenated Acetic Acids.............. 985 Mass Spectral Data For Mixed Halogenated Acetic Acids
and Deuterated BDCM............................................... 996 '^C NMR Chemical Shifts........................................... 100
11

ACKNOWLEDGEMENTS
I would like to sincerely thank Dr. Gold for all of his guidance and support
throughout this entire project. He has been an excellent research and academic
advisor, and has made my educational experience here at the University of North
Carolina a pleasant one. I would like to give special thanks to Dr. Sangaiah. He has
been a true inspiration for the past two years. I am indebted to him for his vast
knowledge in organic chemistry. I am also very thankful to have shared a laboratory
with two very fine scientists, Dr. Jayaraj and soon to be Dr. Rachel Austin. Their
insights and support throughout this project have been greatly appreciated. I would
also like to thank Dr. Ball and Dr. Christman for being on my research committee. I
am very thankful for all of their help and guidance both in my research and in writing
my masters technical report.
In closing, I would like to express my sincere gratitude to Dr. McKinney and the
Environmental Protection Agency (EPA) for their support throughout this project
(Grant # CR818552). I am very appreciative for the funding that they have provided
for this research project and for my education here at UNC.
lu

I. LITERATURE REVIEW
A. DISINFECTION
Disinfection of drinking water was instituted at a time when infectious diseases
were the primary focus in public health. From the earliest times, it was clear thatwater was an important route of transmission for these diseases (Akin et al., 1982).Since 1904, chlorine has been in continuous use as a water disinfectant in the United
States and thus has played a vital role in controlling waterbome infectious diseases. Itis important to realize that the use of chlorine as a disinfectant began prior to thedevelopment of concerns about possible effects of chronic exposure to chlorine and
disinfection by-products.
Due to the availability of antibiotics to treat water borne diseases, the
microbiological hazards of water have faded from the public mind (Bull and Kopfler,1991). Because of the shifts in the social and political perceptions of risk,
toxicological issues concerning disinfection of drinking water have been given greaterprominence. The public does need to be reminded however, that the hazards that
could arise from the abolition of disinfection would far outweigh any presently provenbenefits from reduced toxicological hazards.
Nevertheless, it is important to recognize that there are toxicological risks
associated with drinking water disinfection. Since chlorine is the most widely useddisinfectant, most research to date has evolved around chlorinated disinfection by-
1

products, specifically trihalomethanes (THMs).
Chlorine dissolves rapidly in water and establishes an equilibrium with
hypochlorous acid (HOCl) and hydrochloric acid (HCl).
CI2 + H2O < = = = = > HOCl + H+ + CI- (pKa = 9.5) (1)
In dilute solutions and at pH levels above 4.0, the equilibrium, as shown in Reaction
(1), is displaced to the right and very little molecular chlorine exists in solution.
Between pH 6.0 and 8.5, hypochlorous acid dissociates almost completely to form the
hypochlorite ion (OCl) (lARC Monographs, 1991).
HOCl <= = = = > OCl- + H+ (2)
At pH levels above 9.0, hypochlorite ions are the dominant species. The total
concentration of molecular chlorine, hypochlorous acid and hypochlorite ion is
defined as "free available chlorine". Total available chlorine may be defined as the
mass equivalent of chlorine contained in all chemical species that contain chlorine in
an oxidized state. Combined available chlorine can be defined as the difference
between total available chlorine and free available chlorine and represents the amount
of chlorine that is in chemical association with various compounds, but that is also
capable of disinfecting. Free chlorine species are generally more effective
disinfectants than combined chlorine species.

An important reaction that often occurs in the chlorination of water that contains
bromide ion, is the formation of hypobromous acid from bromide.
HOCl + Br —> HOBr + CI' (3)
Even at low bromide concentrations. Reaction (3) leads to readily detectable levels of
brominated organic by-products, (ie. brominated trihalomethanes), due to the
reactivity of hypobromous acid. Bromide concentrations in untreated water vary
widely across the United States. For example, in nine rivers in various regions of the
United States, bromide levels ranged from 10 to 245 ug/L (Amy et ah, 1985).
Addition of chlorine to waters containing dissolved organic compounds can result
in three possible reactions: (1) addition (2) ionic substitution and (3) oxidation. All
of these reactions result in an increase in the oxidation state of the substrate (Pierce,
1978). The amount of organic matter in untreated water varies considerably.
Normally, high quality groundwater contains up to 1 mg/L (as organic carbon), river
water contains 1-10 mg/L (as organic carbon), and upland water may contain up to 20
mg/L (as organic carbon) which is almost entirely of natural origin (humic
substances). The total organic matter present would be roughly double these
concentrations (lARC Monographs, 1991).

B. BROMODICHLOROMETHANE (BDCM)
The four most commonly studied trihalomethanes (THMs) are: chloroform
(CHCI3), bromodichloromethane (CHBrCy, chlorodibromomethane (CHBrjCl), and
bromoform (CHBrj). A chemical structure is given for each of these in Figure 1.
All of these chemical compounds are known to be chlorination disinfection by¬
products. Of these four, bromodichloromethane (BDCM) will be discussed in detail.
1. CHEMICAL AND PHYSICAL PROPERTIES
Bromodichloromethane (BDCM) is a colorless, heavy, nonbumable liquid
(Clement Assoc, 1989). It has a density of 1.980 g/mL at 20.4 °C, a boiling point of
90.1 °C, a melting point of -57.1 °C, and a molecular weight of 163.83 g/mol,
BDCM is slightly soluble in water (4.5 g/L at 20 °C) (Mabey et al, 1982), and
soluble in acetone, ethanol, benzene, chloroform and diethyl ether (Weast, 1989). It
has a vapor pressure of 50 mm Hg at 20 °C and its hydrolysis rate at neutral pH and
25 °C is 5.76x10-* per hour (Mabey er fl/., 1982).
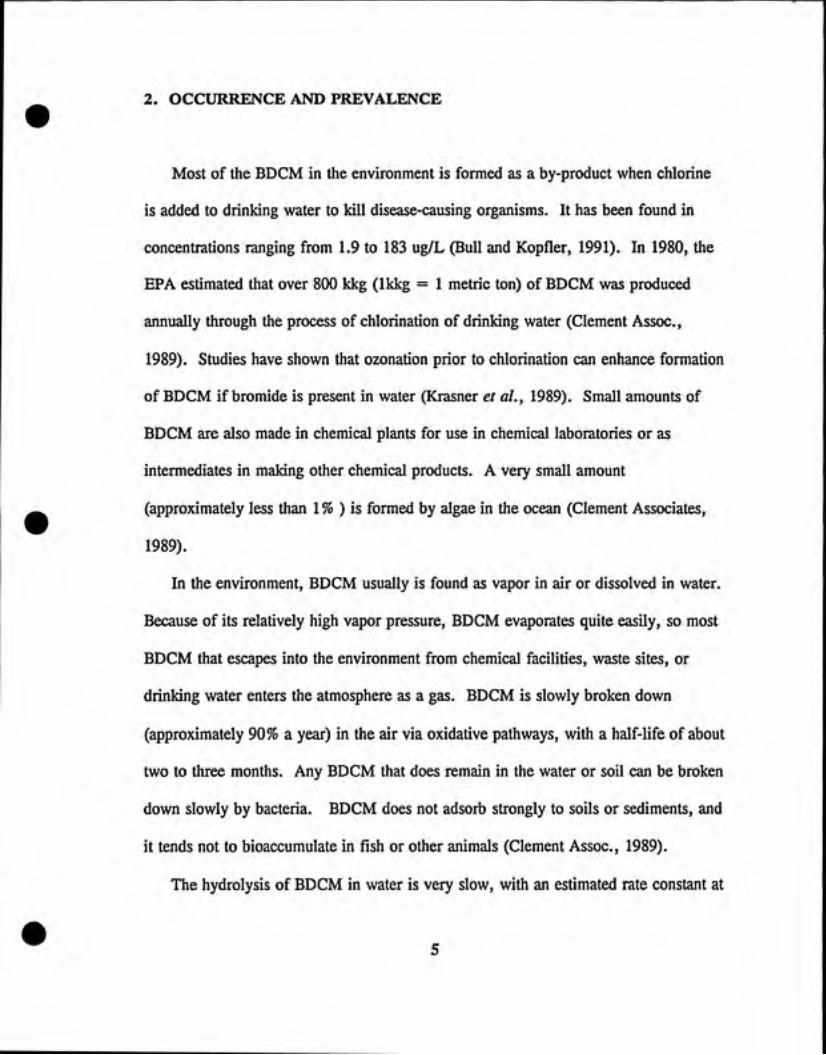
2. OCCURRENCE AlSfD PREVALENCE
Most of the BDCM in the environment is formed as a by-product when chlorineis added to drinking water to kill disease-causing organisms. It has been found in
concentrations ranging from 1.9 to 183 ug/L (Bull and Kopfler, 1991). In 1980, theEPA estimated that over 800 kkg (Ikkg = 1 metric ton) of BDCM was produced
annually through the process of chlorination of drinking water (Clement Assoc,1989). Studies have shown that ozonation prior to chlorination can enhance formationof BDCM if bromide is present in water (Krasner et al., 1989). Small amounts of
BDCM are also made in chemical plants for use in chemical laboratories or as
intermediates in making other chemical products. A very small amount
(approximately less than 1 % ) is formed by algae in the ocean (Clement Associates,1989).
In the environment, BDCM usually is found as vapor in air or dissolved in water.
Because of its relatively high vapor pressure, BDCM evaporates quite easily, so mostBDCM that escapes into the environment from chemical facilities, waste sites, or
drinking water enters the atmosphere as a gas. BDCM is slowly broken down
(approximately 90% a year) in the air via oxidative pathways, with a half-life of abouttwo to three months. Any BDCM that does remain in the water or soil can be broken
down slowly by bacteria. BDCM does not adsorb strongly to soils or sediments, andit tends not to bioaccumulate in fish or other animals (Clement Assoc, 1989).
The hydrolysis of BDCM in water is very slow, with an estimated rate constant at

neutral pH of 5.76x10"* per hour. This corresponds to a half-life of more than 1,000
years.
The concentration of BDCM in chlorinated water depends on a number of factors,
which include: temperature, pH, bromide ion concentration in the source water, fulvic
and humic substance concentration in the water, and the chlorination treatment
practices. Bellar et al. (1974) has shown that the amount of BDCM tends to increase
as a function of increasing organic content and bromide ion in the source water,
BDCM has also been detected in chlorinated swimming pools, where the total
THM concentrations averaged from 120 to 660 ug/L (Beech et al., 1980). In
freshwater pools, most of the total THM was chloroform, with BDCM levels ranging
from 13 to 34 ug/L. For saltwater pools, bromoform was the principal THM present,
and the BDCM concentrations were approximately the same as those BDCM
concentrations found in freshwater pools.
Bromodichloromethane is known not to be a common contaminant of food. It
occurs only in trace amounts in some samples. Entz et al. performed a market basket
study in 1982. Of 39 items tested, BDCM was detected in one dairy sample at 1.2
ppb and in butter at 7 ppb. A study of BDCM in food processing water and
processed foods indicated no detectable levels except in ice cream at one processing
plant (0.6 to 2.3 ppt) (Uhler and Diachenko, 1987). Soft drinks have also been found
to contain BDCM, usually at concentrations of 0.1 to 6 ug/L (Abdel-Rahman, 1982;
Entz et al., 1982). It should be noted that cooking foods in water containing BDCM
is unlikely to lead to contamination, since BDCM would rapidly volatilize.

3. METABOLISM
BDCM is believed to be metabolized by at least three pathways. These include,
microsomal oxidation, microsomal reduction, and conjugation with glutathione (GSH).
Most studies to date have centered around analyzing the oxidative metabolism of
BDCM. The primary site of oxidation is carbon, by insertion of oxygen in the C-H
bond, to give a trihalogenated methanol (CCl2Br-0H) intermediate which
spontaneously loses HBr to yield phosgene (COCy (see Figure 2). Studies are
currently being conducted to determine the importance of the halogen-centered
oxidation of BDCM (see Figure 3).
In studies where oral doses of BDCM have been administered, it has been shown
that BDCM was metabolized to CO2 in rats and mice (Mink et al., 1986) and to CO
and CO2 in rats (Anders et al, 1978; Mathews et al, 1990).
One of the most recent BDCM metabolism studies was done by Mathews and
colleagues (1990). In this study, it was determined that after administering '"^C-
labeled BDCM to male Fischer rats, approximately 80-90% of the BDCM was
metabolized within 24 hours of dosing, with 70-80% of the administered dose
appearing as ^''COj and 3-5% as "CO. Urinary and fecal elimination were
considerably less, accounting for only 4-5% and 1-3% of the dose, respectively. The
results indicated that there was saturation of metabolism at a dose level of 100 mg/kg,
which was indicated by the lower production of CO2. CO2 production dropped to
33% of the total dose administered. This is in comparison to 62% and 66% CO2

production at the 1 and 10 mg/kg doses, respectively.
The persistence of BDCM in tissues was relatively low (3-4% of dose). Most of
the accumulation (1-3% of dose) was in the liver. The kidney, a known target for
BDCM, was the next highest in concentration of '*C-label, particularly the cortical
region, which exhibited tissue/blood ratios of 5-8. Like the liver, the cortical region
of the kidney contains cytochrome P-450, which is an enzyme that aides in the
production of phosgene. As mentioned previously, phosgene is a known intermediate
in the metabolism of THM's. This explains why there may be higher concentrations
of radiolabeled chemicals in the tissues of these two organs.
At a dose of 100 mg/kg/d for 10 days, BDCM was extensively metabolized to
CO2. The initial rate of CO2 production from daily doses however, doubled after day
1, and stayed at that rate for the remainder of the 10 day experiment. This suggests
that BDCM induces its own metabolism, however no increase in liver weight or
toxicity was observed.
Mink et al. (1986) did a study to determine the absorption, distribution and
excretion characteristics of four THM's (chloroform, bromodichloromethane,
chlorodibromomethane, and bromoform) using '"C-labeled compounds in both mice
and rats. The study indicated that there were differences in the distribution and
elimination with respect to intercompound/interspecies comparisons. For instance, the
mice eliminated 40-81% of the total ^'^C-labeled THM as '*C02 and 5-26% as the
unmetabolized parent compound. The rats, on the other hand, eliminated 4-18% of
the total '"^C-labeled THM dose as ''*C02, and 41-67% as the unmetabolized parent
8

THM. The data in Mink's study (1986) indicate that BDCM exhibits limited
metabolic activation, due to recovery of a high percentage of the dose as the parent
compound.
4. TOXICITY
Bromodichloromethane has been shown to produce liver and kidney damage in
both mice and rats (Chu et al, 1982; Munson et al, 1982). The effects of BDCM
obviously depend on how much is taken into the body. High levels of BDCM can
also cause effects in the brain, leading to incoordination and sleepiness. There is also
some evidence that suggests that BDCM may be toxic to developing fetuses.
However, this suggestion has not been well studied.
Most estimates of acute oral LD50 values for BDCM in rodents range between 400
and 1000 mg/kg (Chu et al, 1980; Aida et al, 1987). The pathological changes that
were observed in the acutely poisoned animals included: fatty infiltration of liver and
hemorrhagic lesions in the kidney, adrenals, lung and brain (Bowman et al, 1978).
In a 14 day repeated-dose study in mice, all animals dosed with 150 mg/kg/day died
(NTP, 1987). Males appeared to be slightly more susceptible to the lethal effects of
BDCM compared to females in both mice (Bowman et al, 1978) and rats (Aida et
al, 1987; Chnetal, 1980).

a. Hematological Effects
Chu et al. (1982) showed that hemoglobin and hematocrit were significantly
reduced in male rats following a single dose of 390 mg/kg of BDCM, Exposure in
drinking water for 90 days to a dose of 213 mg/kg/day caused no effect on
lymphocyte levels in either males or females. Rats fed BDCM in their diets at intake
levels of 130 mg/kg/day for 24 months exhibited no hematological changes compared
to controls (Tobe et al, 1982).
b. Hepatic Effects
Many animal studies have indicated that the liver is susceptible to injury by
BDCM. The typical signs include: increased liver weight, pale discoloration,
increased levels of hepatic tissue enzymes in serum, decreased levels of secreted
hepatic proteins (fibrinogen) in blood, and focal areas of inflammation or
degeneration. These effects have been observed at doses of around 1,250 mg/kg and
higher in acute (single dose) studies (NTP, 1987). It should also be mentioned that
this dose level causes death within two weeks (NTP, 1987),
In subchronic studies (10 to 14 days) in both mice and rats, mild effects on the
liver have been observed at doses as low as 37 mg/kg/day (Condie et al., 1983) and
50 mg/kg/day (Ruddick et ah, 1983). The effects include a slight increase in liver
weights and microscopic changes that are rated as "minimal". The effects become
10

more pronounced at doses of 125 to 300 mg/kg/day (Condie et al., 1983).
Most long-term studies report signs of liver injury in rats or mice at doses of 50
to 200 mg/kg/day (NTP, 1987). These doses are not significantly different from
those reported to cause hepatic injury in acute and short-term studies. This suggests
that there is a relatively low tendency toward cumulative injury to the liver.
c. Renal Effects
Animal studies indicate that the kidney is also susceptible to injury by BDCM,
normally at dose levels similar to those that affect the liver. Munson et al. (1982)
performed 14 day studies in which increases in blood urea nitrogen (BUN) in mice
dosed with 250 mg/kg/day were observed. Condie et al. (1983) observed a decrease
in the uptake of p-aminohippurate (PAH) into kidney slices from mice dosed with 74
to 148 mg/kg/day. Similarly, Ruddick et al. (1983) reported an increased in renal
weight in rats dosed with 200 mg/kg/day for 10 days.
In longer-term animal studies, areas of focal necrosis were observed in the
proximal tubular epithelium in male mice exposed for 13 weeks to doses of 100
mg/kg/day. Cytomegaly was observed following chronic exposure to 25 mg/kg/day
(NTP, 1987). Female mice were somewhat less susceptible than males. In rats,
cytomegaly and nephrosis were observed in both males and females at chronic
exposure levels of 50 to 100 mg/kg/day (NTP, 1987).
11

5. CARCINOGENICITY
Although no studies with statistically significant conclusions have been done
regarding the carcinogenic effects in humans following chronic oral exposure to
BDCM, there are several epidemiological studies that indicate that there may be an
association between ingestion of chlorinated drinking water (which normally contains
BDCM) and an increased risk of cancer in humans (Cantor et al., 1978; Morris et
al., 1992). However, such studies cannot resolve possible effects of one or more of
the hundreds of other by-products that are also present in chlorinated drinking water.
Chronic oral animal studies do however provide convincing evidence that BDCM
is carcinogenic. In rats, increased frequency of liver tumors was observed in females
exposed to 150 mg/kg/day for 180 weeks (Tumasonis et ah, 1985), and kidney
tumors were observed in both males and females exposed to 1(X) mg/kg/day (NTP,
1987). The incidence of renal tumors was 13/50 and 15/50 in males and females,
respectively. Tumors of the large intestine were also reported in rats, at incidences of
13/50 and 45/50 in males exposed to 50 and 100 mg/kg/day, and at an incidence of
12/47 in females dosed at 100 mg/kg/day. In mice, renal tumors were observed in
males dosed with 50 mg/kg/day, and hepatic tumors were observed in females dosed
with 75 or 150 mg/kg/day. Increased intestinal tumors were not observed in mice
(NTP, 1987).
12
C. HALOGENATED ACETIC ACmS
Halogenated carboxylic acids are products of the chlorination of fulvic and humic
acids. While the haloacetic acids are the most abundantly produced species, a variety
of saturated and unsaturated monobasic and dibasic acids containing several carbons
have been identified in several laboratory studies as reaction products of chlorine and
humic and fulvic acids (Bull and Kopfler, 1991).
Although brominated and mixed halogenated acetic acids have been identified as
chlorinated disinfection by-products, little research has been done concerning the
metabolism and toxicity of these compounds. Therefore, the following metabolic and
toxicological information centers around di- and trichloroacetic acid.
1. CHEMICAL AND PHYSICAL PROPERTIES
Dichloroacetic acid (DCA) (FW = 128.94 g/mol), is a colorless liquid with a
pungent odor. It has a boiling point of 193-194 °C and a density of 1.563 g/mL. Its
two crystalline forms melt at 9.7 °C and -4 °C. DCA is soluble in water, alcohol,
ether, and acetone. (Weast, 1989). Dichloroacetic acid is used as a chemical
intermediate and in pharmaceuticals and medicine specifically to treat diabetic or
hyperlipoproteinemic patients.
13

Trichloroacetic acid (TCA) (FW = 163.39 g/mol), takes the form of
nonflammable, deliquescent colorless crystals. TCA, like DCA has a sharp, pungent
odor. The crystals melt at 57.5 °C and boil at 197.5 °C. At 25 °C, 1.2 kg of TCA
crystals are soluble in 1 liter of water. Trichloroacetic acid is used: in organic
syntheses, as a reagent for detection of albumin, in medicine for the removal of
warts, as an astringent, in pharmacy, and in herbicides (National Research Council,
1987).
2. OCCURRENCE AND PREVALENCE
In 1977, Rook identified dichloroacetic acid (DCA) as one of the products
obtained from chlorinating a solution of peat-derived humic acid. Quimby et al. in
1980, chlorinated solutions of soil-derived humic and fulvic acids and identified
trichloroacetic acid (TCA) as one of the reaction products.
Miller and Uden (1983) determined that the chlorination pH had only a small
effect on the amount of DCA produced but that when the reaction was carried out at
pH 7 or higher, the amount of TCA formed was drastically reduced.
Legube et al. (1989) found that preozonation of fulvic acid destroyed both DCA
and TCA precursor sites when the fulvic acid was subsequently chlorinated. It was
also discovered that the bicarbonate ion significantly improved organohalide precursor
14

destruction. Thus, Legube et al. (1989) proposed that bicarbonate ions stabilize
molecular ozone in water by inhibiting the radical chain reaction, and that molecular
ozone reacts more readily with nucleophilic aromatic parts of the fulvic acid than does
the hydroxyl radical.
Ozonation of fulvic acid in the presence of bromide ion was found to increase the
formation of brominated halo acids, such as bromoacetic acid and dibromoacetic acid
(Legube et ah, 1989). Ozone oxidized the bromide to hypobromite and the
bromoacids were formed.
Several studies have been done in recent years to determine the prevalence of halo
acids in finished drinking water. Stevens et al. (1989a, 1989b), compared clarified
Ohio River water to raw, unclarified Ohio River water which was chlorinated at pH
5,7, and 9.4. Clarification of the water prior to chlorination reduced the quantity of
both DC A and TCA formed. The quantities of TCA formed at pH 5 and 7 were
similar, and the amount produced at pH 9.4 was drastically lower at any given
reaction time. The concentration of TCA that was produced by chlorination of the
clarified water at these pH values ranged from 20 to 30 ug/L after 144 hr of reaction
time. The concentrations of DCA were essentially independent of pH, and the
concentrations after 144 hr of reaction time also ranged from 20 to 30 ug/L.
In 1985, Stevens et al. (1990) investigated the occurrence of disinfection by¬
products at 10 utilities in the United States. These 10 utilities represented a wide
geographic area, and included both surface and groundwaters with high and low
organic carbon content. The utilities served both large and small communities. All
15

of the utilities in the investigation used free chlorine at some point. Three of the ten
utilities were selected because they were known to have high levels of THMs or
because use of high chlorine levels on high TOC waters was expected to maximize
formation of chlorination by-products. The haloacids identified in these finished
waters are listed in Table 1. Semiquantitative data were obtained for the chloroacetic
acids, and only the presence at levels three times the blank level was reported for the
others. Chloroacetic acid was reported at levels less than 10 ug/L . Dichloroacetic
acid was found in two supplies at less than 10 ug/L, in six supplies at levels between
10 and 100 ug/L, and in two supplies at concentrations greater than 100 ug/L.
Trichloroacetic acid was reported in two supplies at less than 10 ug/L and in four
supplies at levels between 10 and 100 ug/L.
Table 2 gives the quarterly median values for haloacetic acids found in U.S.
drinking waters from Spring 1988 through Winter 1989 (Krasner et al., 1989). The
study included 25 utilities across the United States with 10 utilities in California.
3. METABOLISM
Mono, di and trichloroacetic acids have been found to activate the pyruvate
dehydrogenase (PDH) complex in several species, including man, by inhibiting
pyruvate dehydrogenase kinase (Blackshear et al., 1974; Whitehouse et al., 1974;
16

Crabb et al., 1976). This enzyme allows pyruvate dehydrogenase phosphatase to
convert inactive phosphorylated PDH to the active form. Of the three chlorinated
acetic acids, dichloroacetic acid has been more extensively studied, because of its
potential use as a hypoglycemic, hypolactatemic, and hypolipidemic agent. It has
been hypothesized that the effects of the PDH complex are at least partially
responsible for the large accumulations of glycogen that are seen in the livers of
animals treated with DCA and to a lesser extent TCA (Bull et al., 1990). DCA is
also known to stimulate gluconeogenesis in fed rats, probably by increasing acetyl-
CoA production by PDH. Acetyl-CoA is an activator of pyruvate carboxylase, an
enzyme in gluconeogenesis (Crabb er a/., 1981).
In 1981, Crabb et al. summarized the effects of DCA on metabolic processes. As
stated previously, DCA activates PDH in many tissues by inhibiting PDH kinase;
similarly, DCA activates myocardial branched-chain alpha-ketoacid dehydrogenase by
inhibiting branched-chain alpha-ketoacid dehydrogenase kinase (Paxton and Harris,
1984). In an in vitro preparation, DCA inhibited lactate gluconeogenesis by
hepatocytes because of the inhibition by oxalate of pyruvic carboxylase, and
stimulated the oxidation of leucine because of the transamination of leucine by
glyoxalate. In vivo, DCA was found to decrease blood glucose by restricting the
supply of precursors for gluconeogenesis in the liver. This effect is consequent to
activation in peripheral tissues of pyruvic dehydrogenase. It was also stated in this
review by Crabb et al. (1981) that DCA lowers blood cholesterol in hyperlipidemic
patients but no conclusion concerning the mechanism was given.
17

The effects of DCA and TCA have been shown to vary substantially between
individuals. In a study done by Enser and Whittington (1983), two doses of 300
mg/kg body weight/d of DCA were administered to obese/hyperglycemic mice and to
lean mice. It was found that DCA increased blood glucose in obese mice, which was
attributable to a failure to secrete insulin. This increase in blood glucose could also
be the reason for the increase in fatty acids in the adipose tissue. In the lean mice,
DCA decreased blood glucose and lactate levels. The numerous studies that have
been done on humans, has shown similar results at dose levels ranging from 35 to 50
mg/kg/d (Stacpoole et al., 1983; Curry et ah, 1985).
Stacpoole and associates (1983) administered sodium dichloroacetate (NaDCA) to
13 patients who were hospitalized in an intensive-care unit. All patients had lactic
acidosis, defined as a level of lactate in arterial blood of 5 mM/liter or higher. Also,
their acidosis had been refractory to sodium bicarbonate treatment. Because two of
the patients were inadvertently given sodium bicarbonate after initiation of DCA
therapy, which was in violation of the intended protocol, these patients were excluded
in the analysis of the results.
The results indicated that arterial plasma lactate decreased in all of the 11
patients, with an average decrease of 29%. The DCA-induced reduction in lactate
was significant, being greater than a 20% reduction in 7 of the patients. The arterial
alanine levels were normal or elevated prior to treatment and fell an average of 54%
in the 7 responding patients. Beta-hydroxybutrate concentrations increased an average
of 34% after DCA treatment.
18
The study concluded that although the DCA therapy caused a marked
improvement in overall morbidity, only one of their patients survived to leave the
hospital. Previously, however, none of their patients with hyperiactatemia of this
magnitude had survived. Further, the patients whose hyperiactatemia was reversed by
DCA treatment died because of the failure to reverse their primary, life-threatening
illnesses. It was concluded that the DCA stimulated PDH activity, leading to
accelerated oxidation of pyruvate, lactate, and alanine, as well as to increased
bicarbonate formation and consequently, to a rise in arterial pH.
4. TOXICITY
Katz et al. (1981) administered sodium dichloroacetate daily for 3 months to CD
rats and beagle hounds. Ten rats of each sex (131 to 156 g bw) were intubated with
an aqueous solution of 125 and 500 mg/kg bw per day, and 15 of each sex were
intubated with 0 or 2,000 mg/kg bw per day. Dogs received 0, 50, 75, and 100
mg/kg bw orally as a solid contained in gelatin capsules (4 of each sex at 0 and 100
mg/kg bw, 3 of each sex at 50 and 75 mg/kg bw). In rats, 2,000 mg/kg bw proved
lethal and 500 mg/kg bw nonlethal. In dogs, the lethal dosage was 75 mg/kg bw with
50 mg/kg bw being nonlethal. Both species experienced reduced food consumption
and body weight gain; hind limb weakness; frequent urination; progressive reduction
19

in erythrocyte counts, hematocrit, and hemoglobin levels; reduced blood levels of
glucose, lactate ^d pyruvate; vacuolation of myelinated white tracts in the cerebrumI
and to a lesser extent, in the cerebellum; and degeneration of germinal epithelium of
the testes, with syncytial giant cell formation. In addition to these symptoms, rats
often had aspermatogenesis, whereas dogs had atrophy of the prostate gland, cystic
mucosal hyperplasia in the gall bladder, hemosiderin-laden Kupffer cells, and eye
lesions consisting of bilateral lenticular opacities, injected bulbar conjunctivae, and
superficial corneal vascularization, with a tendency toward keratoconjunctivitis sicca.
Some animals of each species in this study were not killed at the end of the
experiment, but were allowed a 1 month recovery period before being necropsied.
During this time frame, there was some recovery, however, the lenticular opacities
and gall bladder anomalies in dogs, the brain lesions in both species, and the
aspermatogenesis and loss of testicular germinal epithelium in rats persisted or
improved only minimally.
At the time of necropsy, the weight of the livers of the female rats at 500 and
2,000 mg/kg bw, were significantly heavier than those of the controls. Relative liver
weights were significantiy increased at all doses among both sexes, in a dose-
dependent manner. There were also significant increases in relative weights of
kidneys (females at all doses) and adrenals (males at 500 mg/kg bw and females at
2,000 mg/kg bw). Absolute and relative organ weights of intoxicated rats approached
I those of the controls at the end of the month recovery period.
The brain lesions in the dogs were at first thought to be characteristic of edema.
20

However, the lesions persistence in the hounds, which were permitted to recover for
5 weeks, indicated that more than simple edema was involved in the development of
the lesions. Moreover, the lesions were not seen in the optic or sciatic nerves.
The high dose of 2,000 mg/kg bw resulted in a 13% mortality rate in both male
and female rats. Piloerection, tactile-induced vocalization, low body position, and
unthriftiness occurred prior to death in male rats. Female rats that died, first
exhibited cachexia and unthriftiness. Dogs, on the other hand were dramatically more
sensitive. One of the three females died at a dosage level of 75 mg/kg bw and one of
the four males died at 100 mg/kg bw. In contrast to the changes observed after oral
administration of DCA, the administration by vein to dogs (up to 100 mg/kg bw for
30 days) was without evidence of testicular, prostate, or central nervous system
effects.
Woodward et al. (1941) reported an oral LD50 for TCA in fasted mice to be 4.97
g/kg/d and 3.32 g/kg/d for fasted rats. Both the rats and mice quickly passed into a
state of narcosis and within 36 hours had either recovered or died. B6C3F1 mice
exposed to chronic levels of TCA resulted in massive accumulation of fat, some
increases in cell size, and deposition of large amounts of lipofuscin in the liver.
These effects have been observed at doses as low as 60 mg/kg/d.
21

5. CARCINOGENICITY
DCA and TCA have been tested for carcinogenicity in male B6C3F1 mice
(Herren-Freund et al., 1987). The mice received either a single initiating dose of 2.5
mg/kg ethylnitrosourea or vehicle at 15 d of age. Groups of animals were exposed to
5 g/L and 2 g/L DCA (39 mM and 16 mM) or TCA (31 mM and 12 mM) in drinking
water for 61 weeks, starting when the mice were 28 d of age. The test chemicals
were neutralized with NaOH, and the control groups were exposed to drinking water
containing equivalent sodium as sodium chloride.
Exposure to both DCA and TCA resulted in an increased incidence of liver
cancer and an increased tumor burden (see Table 3). A prior treatment with an
initiating dose of ethylnitrosourea was not required for the chloroacetic acids. This
suggests that both DCA and TCA appear to be functioning as complete carcinogens in
the B6C3F1 mice. On a molar basis, however, DCA appeared to be a more potent
hepatocarcinogen than TCA.
In this study (Herren-Freund et al., 1987), no response was observed between the
high dose (5 g/L) and the low dose (2 g/L) test groups for either DCA or TCA.
Because water consumption measurements were not made during this study, an
average daily intake for the mice in the two experimental groups could not be
calculated. Herren-Freund and associates (1987) observed that when the mice were
exposed to drinking water containing DCA or TCA, the test mice initially limited
their daily intake to almost one-half of the amount consumed by the control animals.
22

However, after a period of 4 to 6 weeks, the treated mice increased their intake to
90% of that of the control mice.
Although both DCA and TCA appeared to function as complete carcinogens in
this particular study, their role as initiators, with an ability to directly damage DNA is
still not understood. Neither DCA nor TCA possessed mutagenic activity in tests
using various Salmonella strains. Meier and Blazak (1985) discovered that both DCA
and TCA could induce weak statistically significant increases in sister chromatid
exchanges in cultured Chinese hamster ovary cells, but only at high concentrations
and in the absence of metabolic activation. When tested in the mouse in vivo,
however, neither DCA nor TCA induced bone marrow sister chromatid exchanges ormicronucleus formation.
It should also be mentioned that the B6C3F1 mouse is noted for a high incidence
of spontaneous liver tumors; therefore, it is quite possible that DCA and TCA might
be promoting the outgrowth of spontaneously initiated cells (Reddy, et ah, 1980).
Although most data indicates that DCA and TCA have little potential for inducing
genotoxicity, much data does suggest that the carcinogenicity of DCA and TCA might
be caused by their ability to function as peroxisome proliferators. Several studies
indicate that following short-term administration, both DCA and TCA induced
peroxisome proliferation in mice and rats (Elcombe, 1985; Everett, 1985 and
DeAngelo et ah, 1986). Because many of the chemicals that induce peroxisome
proliferation also increase the incidence of hepatocellular cancer in rodents, Reddy et
al. (1980) proposed that they constitute a unique class of chemical carcinogens which
23

share other biological properties, including the ability to induce hepatomegaly andhypolipidemia. The mechanism by which peroxisome proliferator compounds induceliver tumors involves the excessive production of hydrogen peroxide and the reactiveoxygen species, which results from lipid peroxidative reactions. The accumulation ofhydrogen peroxide and the reactive intermediates initiate carcinogenesis by damagingcellular DNA.
In DeAngelo's study (1990), the data indicate that peroxisome proliferation is nota mechanism for the carcinogenicity of DCA and TCA. DCA, a potent carcinogenrelative to TCA, was the weaker inducer of peroxisome proliferation. In fact, in thisstudy, the cancer incidence and liver tumor burden were the same for both the highdose mice with a moderate elevation of palmitoyl CoA oxidase activity and the lowdose mice with a statistically significant lower activity of this marker enzyme in theliver.
Both DCA and TCA increased liver weights in exposed B6C3F1 mice, and thedegree of enlcu-gement correlated with the carcinogenicity of the acid. Although DCAwas a relatively weak inducer of peroxisome activity, the hydrogen peroxide andreactive oxygen intermediates formed could result in large amounts of DNA damageif hepatocytes were turning over. The damage from TCA, which is a relativelystrong peroxisome proliferator, would be less if it did not induce a large amount ofhyperplasia. However, since little data is available on the mitogenic potential ofeither DCA or TCA, the role of liver cell hyperplasia in the carcinogenicity ofchlorinated acids is not clear.
24
To date, no studies have been done concerning the toxicity or carcinogenicity of
the mixed halo acetic acids, specifically, bromochloroacetic acid, bromodichloroaceticacid, and chlorodibromoacetic acid. One can only hypothesize that the mixed haloacetic acids would react similarly to DCA and TCA.
25

n. INTRODUCTION
Bromochloroacetic acid, dibromochloroacetic acid, and bromodichloroacetic acid,
are known to occur in drinking water as a result of chlorination of raw water
containing a high bromide ion concentration. When chlorine is added to water
containing bromide ion, the bromide is oxidized to hypobromous acid according to
Reaction (3).
HOCl + Br <= = = = > HOBr + CI" (3)
This reaction is the basis for bromine-containing disinfectant by-products.
Particular areas of the United States that are prone to high bromide ion
concentrations in their raw water include; Brownsville, Texas; Lexington, Kentucky
and a number of coastal cities of Florida. Because these halo acids represent a
potential health hazard to the consumers of these waters, several studies have been
done in order to synthesize and identify these three mixed halogenated acetic acids for
use in investigations of biological effects. (Ireland et al., 1988 and Zimmer et al.,
1990)
Trihalomethanes are a prevalent contaminant of chlorinated drinking water
supplies, and have been measured in concentrations ranging from 0.1 to 540 ug/L
(U.S. EPA, 1990). In waters containing bromide ion, the trihalomethane,
26

bromodichloromethane (BDCM) is known to form. BDCM has been known to induce
neoplasms in the kidney and large intestine of male and female rats, in the liver of
female mice, and in the kidney of male mice (NTP, 1987). Chloroform (CHCI3), the
most prevalent THM in chlorinated drinking water and perhaps the most extensively
studied THM, appears to be less carcinogenic compared to BDCM (Dunnick et al.,
1987). Studies also indicate that BDCM is more acutely toxic than CHCI3 (Chu et
ah, 1982). The results of these studies indicate the need for further research on
BDCM.
Current research is being conducted to determine the relationship of the
chemical structure of BDCM to metabolism and its relationship to different toxic
endpoints, including carcinogenicity. In order to do this, an understanding of the
potentially important metabolic pathways is needed. The three major metabolic
pathways that are known for BDCM include: oxidation, reduction, and conjugation
reactions with glutathione. By using deuterium-labeled BDCM in rodent studies,
researchers will be able to study the heavy isotopic effect in bond cleavage. This
information will lead to a clearer understanding of the metabolism of this compound
by indicating whether C-H bond cleavage is a rate-determining step.
In a study done by Pohl and Krishna (1978), on the deuterium isotope effect of
chloroform, they found that the cleavage of the C-H bond appeared to be the rate-
determining step in the reaction, since deuterium labeled chloroform is biotransformed
into phosgene (COCy more slowly than CHCI3. Pohl and Krishna believed that
CHCI3 was metabolically activated to phosgene by cytochrome P-450 which is found
27
in the liver microsomes. This reaction was hypothesi7ed to proceed through an
oxidative dechlorination mechanism that involved the oxidation of the C-H bond of
CHCI3 to produce the trichloromethanol (CI3C-OH) derivative, which would
spontaneously dehydrochlorinate to produce COCI2. CDCI3 also appeared to be less
hepatotoxic compared to CHCI3. At a dosage of 2.49 mmole/kg, CDCI3 produced
only minor histological changes, and there was no elevation of the level of serum
glutamic pyruvic transaminase (SGPT) (which was used to assess hepatic damage).
At this same dosage, CHCI3, produced considerable necrosis of the centrolobular
region of the liver as well as elevated SGPT values. When the dosage was increased
to 4.98 mmole/kg, 85% of the rats treated with CHCI3 died within 24 hours, whereas
all of the CDCI3 treated rats survived. This information suggests that a similar
pathway of metabolism is responsible for the hepatotoxic properties of chloroform.
28

III. EXPERIMENTAL MATERIALS AND METHODS
A. INSTRUMENTATION AND LABORATORY MATERIALS
'^C nuclear magnetic resonance (NMR) spectra were obtained at the UNC
Department of Chemistry on a Varian XL-400 at 100.573 MHz. Deuterated acetone,
obtained from Aldrich Chemical Company, Inc. (Milwaukee, WI), was used as the
solvent. Mass spectral analyses were performed in the Department of Environmental
Sciences and Engineering at UNC on a VG 70S 250SEQ mass spectrometer in the EI
mode at 70 eV. GC-MS analyses were performed in the Department of
Environmental Sciences and Engineering at UNC in Dr. Rappaport's laboratory. The
gas chromatograph was a Hewlett Packard 5890 Series II model and the mass
spectrometer was a Hewlett Packard 5971 Mass Selective Detector. The column was
a 30 meter DB-1 from J & W Scientific (Folsom, California). The carrier gas was
helium (He), with a flow rate of 1 mL/min. The port temperature was set at 250 °C
and the detector temperature was set at 280 °C. The column temperature program
was as follows: 50 °C for 3 minutes, 25 "C/min. to 150 "C. One microliter of a 1
mg/mL sample in hexane was injected into the GC in the splitless mode. All melting
points were determined using a Fischer-Johns apparatus and are uncorrected.
All of the routine chemicals were purchased from Aldrich Chemical Company,
Inc. (Milwaukee, WI) or Eastman Kodak (Rochester, NY). All solvents were reagent
29
grade, and were dried over CaH2 or LiAl4 and distilled where indicated.
B. SYNTHESIS OF MIXED HALOGENATED ACETIC ACIDS
A literature synthesis (Zimmer et al., 1990) was used to obtain bromochloroacetic
acid, chlorodibromoacetic acid, and bromodichloroacetic acid.
1. BROMOCHLOROACETIC ACID
To a mixture of 0.1 mole of malonic acid and 70 mL of anhydrous ether, cooled
in an ice bath to 10 °C, was added 16.0 g (0.1 mole) of bromine. The bromine was
added dropwise through an addition funnel over a period of 6 hours. Volatile
materials were distilled off, leaving a yellowish solid residue product. This product
was filtered and washed with cold chloroform to give bromomalonic acid (see Figure
5 for reaction scheme) which was dissolved in 40 mL anhydrous ether, cooled to 10
°C, and reacted with 0.1 mole of distilled sulfuryl chloride. The distilled sulfuryl
chloride was added dropwise to the flask, using an addition funnel, over a fifteen
minute period. After the addition was complete, stirring was continued for an
30

additional 30 minutes at room temperature. The solvent and volatile materials were
again evaporated using the rotary evaporator. Upon adding petroleum ether, colorless
crystals of bromochloromalonic acid formed. This product was heated to 130 °C for
decarboxylation. To the resulting brownish liquid, were added 10 mL anhydrous
ether. The solution was treated with activated carbon and filtered to yield
bromochloroacetic acid. The product was confirmed through melting point
determination (Table 4) and through MS EI mode analysis (Figure 6).
2. CHLORODIBROMOACETIC ACID
To a 3 neck 50 mL round bottom flask which was flushed with argon (Ar) gas
and equipped with a reflux condenser and addition funnel, were added 12.5 g
monochloroacetaldehyde diethyl acetal. Using the addition funnel, 26.5 g (8.5 mL)
of bromine were added to the flask. With the use of an oil bath, the reaction flask
was heated to 65 °C when bromine started to disappear. The temperature was then
increased slowly to 100 °C. The bromine addition took approximately 7 hours.
After the addition of bromine, unreacted bromine and ethyl bromide were distilled off
at 100 °C. The remaining liquid was treated with 1.0 g of solid calcium carbonate
and distilled (120 °C - 140 °C) to give a clear liquid. This liquid was treated with 1.0
g phosphorus pentoxide and distilled again, yielding dibromochloroacetaldehyde (135
31
"C - 140 °C) (see reaction scheme, Figure 7). To 4.0 g of this aldehyde were added 6
mL of red fuming nitric acid. This mixture was heated in a 50 mL round bottom
flask equipped with a reflux condenser for two hours. Upon cooling, the reaction
mixture was placed in the refrigerator to allow for crystallization. The formation of
chlorodibromoacetic acid was confirmed by melting point determination (Table 4) and
MS EI mode analysis (Figure 8).
3. BROMODICHLOROACETIC ACID
a. Literature Synthesis
To a 100 mL 3 neck round bottom flask, equipped with a reflux condenser and
addition funnel, were added 24.0 g (0.128 moles) of dichloroacetaldehyde diethyl
acetal. The flask, under argon gas, was placed in an oil bath and heated to 110 "C.
Bromine (6.6 mL = 0.128 moles) was added to the flask through an addition funnel
over a period of 8 hours. Upon completing the bromine addition, the volatile
materials were distilled off. The remaining liquid was cooled to 0 °C and shaken for
approximately 1 minute with 25 mL cold concentrated sulfuric acid in a separatory
funnel. This mixture was allowed to stand at room temperature for 30 minutes. The
bottom layer was collected in a 50 mL Erlenmeyer flask containing 2.5 g of solid
calcium carbonate and was left to stand for 3 hours. The mixture was filtered, and
32
the filtrate was distilled. The fraction that was collected between 110 "C and 120 °C
was treated with 1.8 g of phosphorus pentoxide and redistilled giving
dichlorobromoacetaldehyde (see reaction scheme, Figure 9). This aldehyde was
collected at 115 °C - 121 °C. The dichlorobromoacetaldehyde was refluxed with 3
mL red fuming nitric acid for 3 hours at 100 ° C. Upon cooling, the reaction flask
was placed in the refrigerator to allow for crystallization. The crystals formed
slowly. Bromodichloroacetic acid was confirmed through melting point
determination (Table 4) and through MS EI mode analysis (Figure 10).
b. Synthesis Through Lithium Salt Formation
To a 3 neck, 250 mL round bottom flask, purged with Ar(g), were added 1 mL
bromodichloromethane and 50 mL distilled THF. The flask was placed in a dry ice
acetone bath and allowed to stir for 5 minutes. Upon cooling the flask, 8.0 mL of
1.6 M n-butyllithium in hexanes were added to the flask slowly via syringe. This
reaction mixture was allowed to stir 1.5 hours. Carbon dioxide was bubbled into the
reaction flask for 30 minutes, using dry ice as the CO2 source (see Figure 11). After
30 minutes, the reaction mixture was poured into a beaker containing a layer of dry
ice. Deionized water was added to the lithium salt and then the reaction mixture was
acidified with concentrated hydrochloric acid. The solution was saturated with
sodium chloride and extracted three times with methylene chloride. The three organic
33

extracts were combined, dried over sodium sulfate and filtered into a 100 mL round
bottom flask. A rotary evaporator was used to remove the methylene chloride. The
sample was placed in the refrigerator for crystallization to occur.
Bromodichloroacetic acid crystals did form and were confirmed by MS EI mode
analysis (Figure 12).
Several attempts were made to develop a procedure based on Ba^COs as a source
of CO2 (see reaction scheme, Figure 13). In pilot studies, BaCOj was treated with
concentrated H2SO4 and the evolved CO2 was condensed in a liquid Nj cold trap. The
LiCBrClj solution was then added to the trap, which was allowed to warm to -80 °C.
Using this procedure, it has been possible only to recover trace quantities of
CBrCl2C00H using unrealistic quantities of BaCOj (5 g) to generate CO2. Since it is
possible to use no more than 10 mCi (300 - 1000 mg) based on an activity of 20 - 60
mCi/mol, this route did not appear practicable for preparation of the '"C-labeled
compound.
C. SYNTHESIS OF DEUTERATED BROMODICHLOROMETHANE
The synthesis of deuterated BDCM was based on the procedure of Dougherty
(1929) involving an aluminum chloride catalyzed reaction. To a 100 mL round
bottom flask, equipped with a magnetic stir bar, were added 25 mL 99.8% d-
34

chloroform and 25 mL bromoethane (see Figure 14). The reaction flask was placed
in an ice bath, while the aluminum chloride was being added. Enough AICI3 was
added so that the reaction mixture turned a bright crimson red. A drying tube was
used to seal the flask to prevent any moisture from entering. The reaction mixture
was allowed to stir for 46 hours. During this time, the reaction mixture remained a
bright crimson red color.
The reaction was stopped by adding approximately 15 mL deionized water,
followed by dilute HCl. The water layer was removed by the use of a separatory
funnel. The organic layer was washed with 30 mL of a 5% NaOH solution, and
again the water layer was removed by the use of a separatory funnel. The product
was dried over sodium sulfate and collected in a 100 mL round bottom flask. The
solution was distilled using a Vigreux column distillation apparatus. Three distillation
fractions were collected; fraction 1: 24-64 °C, fraction 2: 65-72 °C, and fraction 3:
73-78 °C.
By "C NMR analysis, deuterated BDCM was identified in Fractions 2 and 3 (see
Figures 15 and 16). Using the relative peak areas given by GC analysis for fractions
2 and 3, the purity of fraction 2 was calculated to be 93% and that of fraction 3 was
85% (see Figures 17 and 18). For both fractions, the bromodichloromethane was
99% deuterium enriched.
35

D. SYNTHESIS OF DEUTERATED CHLORODffiROMOMETHANE
To a 100 mL round bottom flask, equipped with a magnetic stir bar, were added
25 mL 99.8% CDCI3 and 25 mL CjHsBr. While the reaction flask was placed in an
ice bath, AICI3 was added to the flask until the reaction mixture turned a dark
crimson red (see reaction scheme, Figure 19). A drying tube was used to seal the
flask to prevent any moisture from entering the reaction. This solution was then
allowed to stir for 7 days. Over this time, the color of the reaction did not dissipate.
The reaction was stopped by adding approximately 15 mL of deionized water and
a dilute solution of HCl. The organic layer was removed from the water layer by use
of a separatory funnel. The organic layer was subsequently washed with 30 mL of a
5% NaOH solution. The organic layer was collected and dried over sodium sulfate
and collected in a 100 mL round bottom flask. The solution was distilled using a
Vigreux column distillation apparatus. Five fractions were collected: fraction 1: 27 -
67 °C; fraction 2: 68 - 72 °C; fraction 3: 73 - 78 °C; fraction 4: 79 - 84 °C and
fraction 5: 90 °C (under vacuum).
'^C NMR analyses (see Figures 20 - 23) indicate that deuterated
chlorodibromomethane is present in fractions 4 and 5 by observation of a 1:1:1 triplet
peak centered about 36 ppm. Deuterated BDCM is present in all four fractions as
indicated by a 1:1:1 triplet peak centered at 59 ppm.
36

rV. RESULTS AND DISCUSSION
A. MIXED HALOGENATED ACETIC ACIDS
The synthesis of bromochloroacetic acid (CHBrClCOOH), chlorodibromoacetic
acid (CBr2ClC00H), and bromodichloroacetic acid (CBrClzCOOH) was obtained
using the literature synthesis published by Zimmer et al. (1990). Each of these halo
acids was confirmed by melting point determination (see Table 4) and by mass spec
analysis (see Figures 6, 8, and 10). The variations between the observed melting
points and the literature values most likely reflects the need for recrystallization to
remove traces of water. We did not recrystallize any of the three halo acids, all of
which are hygoroscopic, thus likely to contain some water. The presence of water
will lower the melting points. The mass spectra indicate the correct isotopic clusters
at the appropriate molecular weights for each of these acetic acids (172, 174, 176 for
bromochloroacetic acid; 250, 252, 254, 256 for chlorodibromoacetic acid; 206, 208,
210, 212 for bromodichloroacetic acid). Due to facile fragmentation, the molecular
ion in each case is relatively weak.
Although, it was possible to obtain bromodichloroacetic acid (CBrClzCOOH)
using the procedure described by Zimmer et al. (1990), this synthetic approach was
not feasible for the preparation of "C-labeled bromodichloroacetic acid because
labeled starting compounds were not readily accessible. A synthetic approach was
developed, in which 1.6 M n-butyllithium in hexanes was reacted with either
37

CHBrCl2 or CBr2Cl2 and carboxylated to yield the lithium salt of bromodichloroacetic
acid (see Figure 11) (Fischer and Kobrich, 1968),
As seen in Figure 11, the bromodichloromethide anion is carboxylated by the
addition of dry ice to yield CBrCl2C02'Li"^, which is subsequently poured over a layer
of dry ice. This procedure generated a significant yield of CBrClzCOOH. The
product was confirmed by mass spectra EI mode analysis (see Figure 12).
Having demonstrated the feasibility of this reaction, attempts were made to
develop a synthetic procedure based on Ba^COj as a source of CO2. In pilot studies,
BaCOj was treated with concentrated H2SO4 and the evolved CO2 was condensed in a
liquid nitrogen cold trap (see Figure 13). The LiCBrClj solution was then added to
the trap, which was allowed to warm to -80 °C. This approach did not yield the
significant quantity of product obtained with a large excess of CO2 from dry ice.
Only trace quantities of CBrCljCOOH were recovered while using impractically large
quantities of BaCOj (5 g) to generate CO2. Since it is not possible to use more than
10 mCi (300 - 1(XK) mg) based on an activity of 20-60 mCi/mol, this route does not
appear to be practicable for the synthesis of the ^''C-labeled compound.
A second route was proposed that involved the chlorination of commercially
available bromoacetic acid (CHjBrCOOH). '"^C-labeled bromoacetic acid is available
as either CH2Br"C00H or as *''CH2BrC00H. This synthetic approach could also be
used to generate the other mixed halogenated acetic acids. However, to date no pilot
studies involving the chlorination of unlabeled bromoacetic acid have been initiated.
38

B. SYNTHESIS OF DEUTERATED BROMODICHLOROMETHANE
1. LITHIUM SALT FORMATION
Because of the feasibility of generating the bromodichloromethide anion, attempts
were made to synthesize deuterated bromodichloromethane (see Figure 24) by
quenching the anion with D2O.
It was hypothesized that deuterium oxide would exchange rather rapidly with
lithium to yield deuterated bromodichloromethane. However, this did not appear to
be the case, since no color change was observed when deuterium oxide was added to
the reaction flask. The crude sample was analyzed by ''C NMR and MS (see Figures
25 and 26) which indicated the presence of a number of different by-products. Based
upon the relative intensities of the isotopic clusters from the mass spectral data,
bromodichloromethane, present in trace amounts, was estimated to be 20% deuterium
enriched. Attempts to isolate bromodichloromethane by distillation through a packed
column were unsuccessful. In order to purify the sample, a preparative GC would
have been needed.
Sherman and Bernstein (1951), describe a similar reaction, in which 0.1 mole of
purified halomethane (CHBrCla and CHBraCl) was mixed with 0.1 mole 98% D2O
and 0.01 mole sodium deuteroxide in a heavy-walled Pyrex vessel. The contents
were outgassed at -78 °C, and the vessel was sealed and placed in an oven at 105 °C
for four days. After four days, the reaction vessel was cooled to -195 °C and opened.
39

The yield reported was 43% CBr2ClD and 16% CBrCl2D. Upon recharging the
reactor the yields increased to 64% and 36% respectively. They concluded that the
rate of exchange of halogens between bromodichloromethane and
chlorodibromomethane is more rapid than the rate of hydrolysis.
2. BROMINATION OF DICHLOROMETHroE ANION
Due to the poor yield and our inability to purify CDBrClj through fractional
distillation using the approach shown in Figure 24, a similar reaction was proposed
that involved brominating the dichloromethide anion (Blumberts, LaMontagne, and
Stevens, 1972).
The reaction involves mixing deuterated methylene chloride with 1.6 M n-
butyllithium in hexanes, to yield the deuterated dichloromethide anion. This product
is subsequently brominated to give the desired product (see Figure 27). The reaction,
as before, was performed at -78 °C in order to stabilize the lithium salt. However,
bromine did not react with LiCDClz at -78 °C, presumbaly because, bromine froze out
of solution. The reaction was repeated with addition of bromine at 0 °C, and again
the bromine remained unreactive. Since the dichloromethide anion would be unstable
at higher temperatures, it was apparent that this approach was not feasible for the
synthesis of deuterated BDCM.
40
3. HYDROGENOLYSIS OF DIBROMODICHLOROMETHANE
Pilot studies were started involving the hydrogenation of dibromodichloromethane
by lithium aluminum hydride (see Figure 28). Johnson and co-workers (1948)
hydrogenated several alkyl halides by lithium aluminum hydride and lithium hydride.
Since aluminum hydride reacts with lithium hydride in ether to produce lithium
aluminum hydride, it was considered reasonable that alkyl halides could be
hydrogenated by means of lithium hydride with only a small amount of lithium
aluminum hydride present. Johnson et al. reported that tetrahydrofuran (THF) was an
excellent reaction medium because it is a good solvent for the reagent, it is miscible
with water and it has a boiling point (65 °C) that allows for convenient separations of
products by distillation. Nevertheless, the boiling point of THF still permits the use
of a temperature range so that the reactions can be accelerated. The temperature
should however be kept below 100 °C, since lithium aluminum hydride may
decompose violently above this temperature. Using this synthetic approach, it was
evident that lithium aluminum hydride acts as the hydrogen carrier, since no reaction
seemed to occur with lithium hydride alone. The use of lithium hydride greatly
reduces the amount of lithium aluminum hydride that is necessary, and minimizes the
possibility of the formation of aluminum halide. Johnson and co-workers (1948) also
found that in general, alkyl bromides reacted more readily than alkyl chlorides with
lithium aluminum hydride. Primary halides reacted more readily than secondary
halides which in turn reacted more readily than tertiary halides. Alicyclic and
41

aromatic halides proved to be very unreactive.
Based upon this information, an attempt was made to react CBr2Cl2 with lithium
hydride and a minimum amount of lithium aluminum hydride as shown in Figure 28.
If this reaction proved to be successful, lithium deuteride (LiD), and lithium
aluminum deuteride (LiAlD4) would be used as the deuterium source. "C NMR
analysis were performed on the reaction mixture after 1, 4 and 8 hours. In each case,
there was no evidence of CHBrClj. Thus, this reaction did not prove feasible for the
synthesis of deuterated BDCM.
4. ALUMINUM CHLORmE CATALYZED REACTION
In 1929, Dougherty discussed the catalytic activity of aluminum chloride.
Aluminum chloride forms addition compounds with many different types of organic
molecules, and in an attempt to explain the mechanism of this Friedel-Crafts reaction,
the catalytic activity of the aluminum chloride has been connected to the formation of
these complexes. The ability of aluminum chloride to act as a strong lewis acid
complexing agent is normally explained electronically on the grounds that the
aluminum atom in aluminum chloride has an outer shell consisting of six electrons,
and in order to achieve the more stable arrangement of eight, aluminum will share a
pair belonging to some other atom or molecule. Unless a rearrangement occurs, this
42
new molecule will be polar. It has been proven that solutions of aluminum halides in
alkyl halides, and organic aluminum halide solutions in general, often display
considerable conductivity.
Dougherty described the action of aluminum chloride on halogen compounds
using the following reactions:
RX + AICI3 < = = = > RX-AICI3 < = = = > R+-(XAlCl3)- (4)R,Xi + AICI3 < = = = > RjXi-AlClj < = = = > R,+-(XiAlCl3)- (5)R+-(XAlCl3)- + Rj-^-CXiAlClj)- < = = > R^-CXiAlCy- + Ri^-CXAIC^" (6)R+-(XiAlCl3)- < = = = > RXi + AICI3 (7)Ri+-(XA1C13)- < = = = > RjX + AICI3 (8)
If either of the new alkyl halides, RjX or RX, are volatile in comparison with RX and
RjXi, the reaction RX + RjX, — > RjX + RX, should occur. If all of the alkyl
halides are of the same order of volatility, the reaction should proceed to an
equilibrium point.
Dougherty (1929) discovered that the reaction between chlorides and bromides in
the presence of aluminum chloride, undergo such Friedel-Crafts reactions without
appreciable formation of complex by-products and tars. Mixing equal portions of
bromoethane and chloroform and adding a small amount of aluminum chloride,
bromodichloromethane was synthesized, giving approximately a 35% yield.
This procedure given by Dougherty (1929) was used to synthesize deuterated
bromodichloromethane. This compound was prepared by mixing equal volumes of
bromoethane and deuterated chloroform, adding enough aluminum chloride such that
the reaction mixture turned dark red in color, and letting the reaction mixture stir for
43

approximately 46 hours (see Figure 14). The yield of deuterated
bromodichloromethane calculated for this reaction was approximately 28%, in which
the compound was 99% deuterium enriched. These calculations were based upon "C
NMR and GC-MS analysis (Figures 15 - 18). These results also indicated the
presence of another deuterated product in the highest boiling distillation fraction (see
Figures 16 and 18). The "C NMR indicated the presence of a deuterated
trihalomethane at approximately 37 ppm. Based upon literature values of methyl
carbon shieldings of chlorobromomethanes, the value given for chlorodibromomethane
is 34.6 (Strothers, 1972). Mass spectra data indicated a molecular ion peak at 207,
209, 211 which is consistent for the isotopic masses for deuterated
chlorodibromomethane. In fact, Dougherty (1929) notes that a small fraction (b.p.
120-132 ° C) was collected in which he believed to be a mixture of bromoform and
chlorodibromomethane. However, due to difficulties in the fractional distillation, he
was not able to identify these two compounds with certainty.
It was hypothesized that as our desired product (deuterated BDCM) was forming,
aluminum chloride was reacting with it to yield deuterated chlorodibromomethane (see
Figure 19). Thus, it was assumed that if the reaction was allowed to react long
enough, a significant yield of deuterated chlorodibromomethane could be obtained.
The same reaction was repeated; however instead, of letting the reaction stir for 46
hours, it was allowed to stir for seven days. "C NMR results, as shown in Figures
20-23, do indicate a substantial yield of deuterated chlorodibromomethane
(approximately 5 g) in the highest distillation fraction (fraction 5 = 90 °C under
44

vacuum). Thus, one can conclude that this aluminum catalyzed reaction can be used
to synthesize both deuterated bromodichloromethane and deuterated
chlorodibromomethane in substantial yields and at 99% deuterium enrichment. The
reaction is not only simple to perform but it is also relatively easy to purify the
samples through simple fractional distillation.
Because of the feasibility of this reaction, "C and ''^C-labeled
bromodichloromethane and chlorodibromomethane can be obtained. For both of these
syntheses, a preparative GC will be required for purification on a small scale. A GC
with a thermal conductivity detector has been obtained from NIH. While waiting for
the delivery of 10 g '^CHClj from Cambridge Isotope Inc., the GC is being assembled
to perform preparative analysis.
5. REDISTRIBUTION OF HALOGENS IN A MIXTURE OF CHLOROFORM
AND BROMOFORM UNDER ALKALINE CONDITIONS
Fedorynski et al. (1977) report that when dichloro- or dibromocarbene are
generated under catalytic two-phase conditions (CTP) in the presence of
tetraalkylammonium phase transfer reagents, they remain in equilibrium with their
carbanionic precursors and thus with the starting haloforms. This phenomenon is due
to the excellent solubility of tetraalkylammonium trihalomethides and halides in
45

haloforms and other nonpolar solvents. When a mixture of chloroform and
bromoform is treated with a concentrated sodium hydroxide solution in the presence
of triethylbenzylammonium chloride (TEBA) and an alkene, three dihalocyclopropanes
form. This result is explained in terms of an equilibrium that exists between
dihalocarbenes and trihalomethylanions (see Figure 29). It is this equilibrium that
prompted Fedorynski et al. (1977) to test whether or not these conditions could be
applied to the redistribution of halogens in a mixture of chloroform and bromoform
without trapping the dihalocarbenes. One possible disadvantage of this reaction is the
hydrolysis of the haloforms.
Fedorynski et al (1977) successfully synthesized bromodichloromethane and
chlorodibromomethane by reacting bromoform and chloroform with concentrated
aqueous NaOH and triethylbenzylammonium chloride (TEBA) (see Figure 30). This
reaction gave a mixture of products, including tetrahalomethanes. Fedorynski et al.
states that the mixture was easily separated via fractional distillation. The yields
reported for BDCM and CDBM were 33% and 54% respectively. When the
haloforms were regenerated the yields improved to 48% and 72% respectively.
Although hydrolysis of the haloforms is a possible drawback to this reaction,
Fedorynski and co-workers reported that hydrolysis in their experiments did not
exceed 15%.
Although this synthetic approach is less time consuming (reaction time = 1 hr), it
is not practicable for labeled compounds. In order to obtain deuterated BDCM,
deuterated chloroform, deuterated bromoform, NaOD, and D2O would all be
46
required. Because of the number of products this reaction yields, this method is also
only applicable on a large scale.
47

V. CONCLUSIONS
Chlorine, is by far the most commonly used chemical for the disinfection of
drinking water. The primary purpose of disinfection is to protect the consumer from
unnecessary exposures to water borne diseases. However, in the past two decades the
discovery of potentially toxic compounds in drinking water as a result of chlorination
has raised many concerns. Adding to the problem is the fact that the composition of
chlorinated drinking water to which the consumer is exposed varies according to
location. Variables that affect the production of possible harmful disinfection by¬
products include, total organic carbon concentrations, pH, ammonium and bromide
ion concentrations and the qualitative composition of the organic matter (IARC,
1991). Because of these possible health risks, current research is focusing on the
metabolism of these compounds, so that proper risk assessments can be made.
Trihalomethanes (THMs) are perhaps one of the most studied classes of disinfection
by-products.
The purpose of this project was to develop a synthesis for deuterated
bromodichloromethane, so that it could be used eventually for the study of the heavy
isotopic effect in bond cleavage. This will lead to a clearer understanding of the
metabolism of this compound. The importance of bromodichloromethane is that past
research has shown that this compound is suspected to be more toxic compared to
chloroform. Therefore it is of great importance to understand the metabolism of this
compound in order to develop any sort of hazard/risk assessment. Deuterated
48

bromodichloromethane was synthesized using an aluminum catalyzed reaction as
described by Dougherty (1929). The reaction gave a yield of 28% deuterated
bromodichloromethane, in which the desired compound was 99% deuterium enriched.
The reaction proved not only to be quite simple, but BDCM could be purified through
simple fractional distillation.
This reaction proved to have an additional advantage, in that it was possible to
synthesize not only deuterated BDCM but also deuterated chlorodibromomethane. By
allowing the reaction mixture to react for one week, it was possible to obtainconsiderable amounts of both deuterated BDCM and deuterated
chlorodibromomethane.
Because of the considerable success and ease of this reaction, the lack of complex
by-products and convenient separation of desired products, this synthetic procedure
can be used to generate the desired '^C and '''C-radiolabeled compounds in small
scale. The only requirement for the small scale reactions is a preparative gas
chromatograph for efficient separation. The use of large amounts of '^C and ^''C
chloroform is unrealistic because of cost and in the case of '"C, the undersirability of
handling large quantities of radioactive compounds. Work is currentiy being done on
setting up a preparative GC, while waiting for the delivery of 10 g of "C-labeled
chloroform (99% enrichment) from Cambridge Isotope Inc.. Once synthesized, the
'^C-labeled bromodichloromethane, will be used in human studies as a measuring
device, to determine the amount of '^COj that is expired by the subjects. This will
allow insight into how bromodichloromethane is metabolized in the human body.
49

Recently, the finding of mixed halogenated acetic acids in areas where water
contains high concentrations of bromide ion has raised a lot of concern. These acids,
like THMs represent a potential health hazard to those who consume these waters.
To date most of the toxicological data available on acetic acids has centered around
dichloroacetic acid (DCA) and trichloroacetic acid (TCA). Little is known about the
mixed bromo-chloroacetic acids.
A procedure was developed for the synthesis of bromodichloroacetic acid that
involved the generation of the bromodichloromethide anion which was subsequently
carboxylated using dry ice as the CO2 source. The success of this reaction, prompted
a pilot synthetic procedure based on Ba'^COj as a source of CO2. BaCO, was treated
with concentrated H2SO4 and the evolved CO2 was condensed in a liquid nitrogen cold
trap. The bromodichloromethide anion solution was added to the trap, and the
reaction mixture was allowed to warm to -80 °C. Unfortunately, the pilot studies
proved to be unsuccessful in obtaining significant amount of bromodichloroacetic
acid. Only trace quantities were recovered while using impractically large quantities
of BaCOj (5 g). Because it is not possible to use more than 10 mCi (300 - 1000 mg,
based on an activity of 20-60 mCi/mol), it was concluded that this synthetic route was
not applicable to "C-labeled bromodichloroacetic acid.
A second route was proposed that involved the chlorination of commercially
available bromoacetic acid. ^'*C-labeled bromoacetic acid is available as either
BrCH2*'*C00H or Br*'*CH2COOH. However, to date no pilot studies, involving the
chlorination of unlabeled bromoacetic acid have been initiated.
50

VI. REFERENCES
Abdel-Rahman, M.S. (1982) The Presence of Trihalomethanes in Soft Drinks. J.Appl. Toxicol. 2(3): 165-166.
Aida, Y.; Takada, K.; Momma, J,; et al. (1987) Acute and Subacute Toxicities ofThree Trihalomethanes in Rats (I). J. Toxicol. Sci. 12:585.
Akin, E.W.; Hoff, J.C. and Lippy, E.G. (1982) Waterbome Outbreak Control:Which Disinfectant? Environ. Health Persp., 46:7-12.
Amy, G.L.; Chadick, P.A.; Chowdhury, Z.K.; King, P.H. and Cooper, W.J. (1985)Factors Affecting Incorporation of Bromide Into Brominated TrihalomethanesDuring Chlorination. In: JoUey, R.L.; Bull, R.J.; Davis, W.P.; Katz, S.;Roberts, M.H. Jr. and Jacobs, V.A., eds.. Water Chlorination: Chemistry,Environmental Impact and Health Effects, Vol. 5, Chelsea, MI, Lewis Publishers,pp. 907-922.
Anders, M.W.; Stevens, J.L.; Sprague, R.W.; Shaath, Z.; and Ahmed, A.E. (1978)Metabolism of Haloforms to Carbon Monoxide II. In Vivo Studies. Drug Metab.Dispos. 6(5):556-560.
Beech, J.A.; Diaz R.; Ordaz, CO.; et al. (1980) Nitrates, Chlorates andTrihalomethanes in Swimming Pool Water. Am. J. Public Health 70:79-82.
Bellar, T.A.; Lichtenberg, J.J. and Kroner, R.C. (1974) The Occurrence ofOrganohalides in Chlorinated Drinking Waters. J. AWWA 66:703-706.
Blackshear, P.J.; Holloway, P.A.H.; and Alberti, K.G.M.M. (1974) The MetabolicEffects of Sodium Dichloroacetate in the Starved Rat. Biochem. J. 142:279-286.
Blumberts P.; LaMontagne, M.P.; and Stevens, J.I. (1972) The Preparation andOxidation of Alpha-Hydroxyaldehydes. J. Org. Chem. 37:1248-1251.
Bowman, F.J.; Borzelleca, J.F.; Munson, A.E. (1978) The Toxicity of SomeHalomethanes in Mice. Toxicol. Appl. Pharmacol. 44:213-215.
Bull, R.J.; Sanchez, I.M.; Nelson, M.A.; Larson, J.L.; and Lansing, A.J. (1990)Liver Tumor Induction in B6C3F1 Mice by Dichloroacetate and Trichloroacetate.Toxicology 63:341-359.
Bull, R.J. and Kopfler, F.C. (1991) Health Effects of Disinfectants and DisinfectionBy-Products. AWWA Research Foundation.
51
Cantor, K.P.; Hoover, R.; Mason, T.J.; McCabe, L.J. (1978) Association of CancerMortality With Halomethanes in Drinking Water. J. Natl. Cancer Inst. 61:979-985.
Chu, L; Secours, V.; Marino, L; et al. (1980) The Acute Toxicity of FourTrihalomethanes in Male and Female Rats. Toxicol. Appl. Pharmacol. 52:351-353.
Chu, I.; Secours, V.E.; ViUenueve, D.C.; et al. (1982) Toxicity of Trihalomethanes:I The Acute and Subacute Toxicity of Chloroform, Bromodichloromethane,Chlorodibromomethane and Bromoform in Rats. J. Environ. Sci. HealthB17:205-224.
Clement Associates (1989) Toxicological Profile For Bromodichloromethane.Contract No. 205-88-0608. Prepared for: Agency for Toxic Substances andDisease Registry U.S. Public Health Service, in collaboration with U.S.Environmental Protection Agency (EPA).
Condie, L.W.; Smallwood, C.L.; and Laurie, R.D. (1983) Comparative Renal andHepatotoxicity of Halomethanes: Bromodichloromethane, Bromoform,Chloroform, Dibromochloromethane, and Methylene Chloride. Drug Chem.Toxicol. 6:563-578.
Crabb, D.W.; Mapes, J.P.; Boersma, R.W.; and Harris, R.A. (1976) Effect ofDichloroacetate on Carbohydrate and Lipid Metabolsim of Isolated Hepatocytes.Arch. Biochem. Biophys. 173:658-665.
Crabb, D.W.; Yount, E.A.; and Harris, R.A. (1981) The Metabolic Effects ofDichloroacetate. Metab. Clin. Exp. 30:1024-1039.
Curry, S.H.; Pei-I Chu, B.S.; Baumgartner, T.G.; and Stacopoole, P.W. (1985)Plasma Concentrations and Metabolic Effects of Intravenous SodiumDichloroacetate. Clin. Pharmacol. Ther. 37:89-93.
Davis, M.E. (1986) Effect of Chloroacetic Acids on the Kidneys. Environ. HealthPerspect. 69:209-214.
DeAngelo, A.D., et al. (1986) Species Sensitivity to the Induction of PeroxisomeProliferation by Trichloroethylene and Its Metabolites. Toxicologist 6:113.
52

DeAngelo, A.D., and McMillan, L.P. (1990) Carcinogenicity of Chlorinated AceticAcids. In: JoUey, R.L.; Condie L.W.; Johnson, J.D.; Katz, S.; Minear, R.A.;Mattice, J.S.; and Jacobs, V.A. eds. Water Chlorination: Chemistry,Environmental Impact, and Health Effects Volume 6. Chelsea, MI, LewisPublishers, Inc. pp. 193-199.
Dougherty, G. (1929) Some Observations on the Catalytic Activity of AluminumChloride. JACS 51:576-580.
Dunnick, J.K.; Eustis, S.L.; and Lilja, H.A. (1987) Bromodichloromethane, ATrihalomethane That Produces Neoplasms in Rodents. Cancer Research 47:5189-5193.
Elcombe, C.R. (1985) Species Differences in Carcinogenicity and PeroxisomeProliferation Due to Trichloroethylene: A Biochemical Human HazardAssessment. Arch. Toxicol. Suppl. 8:6-17.
Enser, M. and Whittington, P.M. (1983) The Actions of Dichloroacetic Acid onBlood Glucose, Liver Glycogen and Fatty Acid Synthesis in Obese-Hyperglycemic(ob/ob) And Lean Mice. Horm. Metabol. Res. 15:225-229.
Entz, R.C.; Thomas, K.W. and Diachenko E.W. (1982) Residues of VolatileHalocarbons in Foods Using Headspace Gas Chromatography. J. Agric. Chem.30:846-849.
Everett, R. (1985) Factors Affecting Spontaneous Tumor Incidence in Rats andMice: A Literature Review. CRC Crit. Rev. Toxicol. 13(3):235-51.
Fedorynski, M.; Poplawska, M.; Nitschke, K.; Kowalski, W.; and Makosza, M.(1977) A Simple Method For Preparation of Dibromochloromethane andBromodichloromethane. Syn. Comm. 7(4):287-292.
Fischer, R.H. and Kobrich, G. (1968) Darstellung von Tribrommethyllithium.Chem. Ber. 101:3230-3233.
Harris, R.A.; Crabb, D.W.; and Sans, R.M. (1978) Studies on the Regulation ofLeucine Catabolism. II. Mechanism Responsible for Dichloroacetate Stimulationof Leucine Oxidation by the Liver. Arch. Biochem. Biophys. 190:8-16.
Herren-Freund, S.L.; Pereira, M.A.; Khoury, M.D.; and Olson, G. (1987) TheCarcinogenicity of Trichloroethylene and Its Metabolites, Trichloroacetic Acidand Dichloroacetic Acid in Mouse Liver. Toxicol. Appl. Pharmacol. 90:183-189.
53

lARC Monographs on the Evaluation of Carcinogenic Risks to Humans. (1991)Chlorinated Drinking Water; Chlorination By-Products; Some Other HalogenatedCompounds; Cobalt and Cobalt Compounds Vol. 52.
Ireland, J.C; Moore, L.A.; Pourmoghaddas, H.; and Stevens, A.A. (1988) GasChromatography/Mass Spectrometry Study of Mixed Haloacetic Acids Expectedto be Found in Chlorinated Drinking Water. Biomed. Environ. Mass. Spectrom.17:483-486.
Johnson, J.E.; Blizzard, R.H.; and Carhart, H.W. (1948) Hydrogenolysis of AlkylHalides by Lithium Aluminum Hydride. JACS 70:3664-3665.
Katz, R.; Tai, C.N.; Diener, R.M.; McConnell, R.F.; and Semonick, D.E. (1981)Dichloroacetate, Sodium: 3-Month Oral Toxicity Studies in Rats and Dogs.Toxicol. Appl. Pharmacol. 57:273-287.
Krasner, S.W.; McGuire, M.J.; Jacangelo, J.G.; et al. (1989) The Occurrence ofDisinfection By-Products in U.S. Drinking Water. J. AWWA 81:41-53.
Legube, B,; Croue, J.; DeLaat, and Dore, M. (1989) Ozonation of ExtractedAquatic Fulvic Acid: Theoretical and Practical Aspects. Ozone Sci. and Eng.11:69-92.
Lukas, G.; Vyas, K.H.; Brindle, S.D.; Le Sher, A.R.; and Wagner, W.E. Jr. (1980)Biological Disposition of Sodium Dichloroacetate in Animals and Humans AfterIntravenous Administration. J. Pharm. Sci. 69:419-421.
Mabey, W.R.; Smith, J.H.; PodoU, R.T.; et al. (1982) Aquatic Fate Process Data forOrganic Priority Pollutants. U.S. Environmental Protection Agency, Office ofWater Regulations and Standards. Washington, D.C. EPA 440/4-81-014. PB87-169090.
Matthews, J.M.; Troxler, P.S.; and Jeffcoat, A.R. (1990) Metabolism andDistribution of Bromodichloromethane in Rats After Single and Multiple OralDoses. J. Toxicol. Environ. Health 30:15-22.
Meier, J.R., and Blazak, W.F. (1985) Evaluation of Genotoxicity of DichloroaceticAcid and Trichloroacetic Acid. Presented at the Second International Symposiumon Health Effects of Drinking Water Disinfectants and Disinfectant By-Products,Cincinnati, OH.
Miller, J.W. and Uden, P.C. (1983) Characterization of Nonvolatile AqueousChlorination Products of Humic Substances. Environ. Sci. Technol. 17:150-152.
54

Mink, F.L.; Brown, T.J.; and Rickabaugh, J. (1986) Absorption, Distribution, andExcretion of ^'•C-Trihalomethanes in Mice and Rats. Bull. Environ. Contam.Toxicol. 37:752-758.
Morris, R.D.; Audet, A.M.; Angelillo, I.F.; Chalmers, T.C.; and Mosteller, F.(1992) Chlorination, Chlorination By-Products, and Cancer: A Meta-Analysis.Am. J. of Public Health 82:955-963.
Munson, A.E.; Sain, L.E.; Sanders, V.M.; et al. (1982) Toxicology of OrganicDrinking Water Contaminants: Trichloromethane, Bromodichloromethane,Dibromochloromethane and Tribromomethane, Environ. Health Perspect.46:117-126.
National Research Council (1987) Drinking Water and Health; Disinfectants andDisinfectant By-Products Vol. 7. National Academy Press, Washington, D.C.
NTP, (1987) National Toxicology Program. Toxicology and Carcinogenesis Studies ofBromodichloromethane (CAS No. 75-27-4) in F344/N Rats and B6C3F1 Mice(gavage studies). U.S. Department of Health and Human Service, Public HealthService, National Institutes of Health, NIH Publication No. 88-2537, TR-321.
Paxton, R. and Harris, R.A. (1984) Clofibric Acid, Phenylpyruvate, andDichloroacetate Inhibition of Branched-Chain Alpha-Ketoacid DehydrogenaseKinase in vitro and in Perfused Rat Heart. Arch. Biochem. Biophys. 231:58-66.
Pierce, R.C. (1978) The Aqueous Chlorination of Organic Compounds: ChemicalReactivity and Effects on Environmental Quality (NRCC Publ. No. 16450),Ottawa, National Research Council of Canada.
Pohl, L.R. and Krishna, G. (1978) Deuterium Isotope Effect in Bioactivation andHepatotoxicity of Chloroform. Life Sciences 23:1067-1072.
Pohl, L.R.; George, J.W.; Martin, J.L.; and Krishna, G. (1979) Deuterium IsotopeEffect In In Vivo Bioactivation of Chloroform to Phosgene. Biochem. Pharm.28:561-563.
Quimby, B.D.; Delaney, M.F.; Uden, P.C.; and Barnes, R.M. (1980) Determinationof the Aqueous Chlorination Products of Humic Substances by GasChromatography With Microwave Emission Detection. Anal. Chem. 52:259-263.
Reddy, J.K., et al. (1980) Hypolipidemic Hepatic Peroxisome Proliferators Form aNovel Class of Chemical Carcinogens. Nature 283:397-98.
55

Rook, J.J. (1977) Chlorination Reactions of Fulvic Acids in Natural Waters.Environ. Sci. Technol. 11:478-482.
Ruddick, J.A.; Villenueve, D.C.; and Chu, I. (1983) A Teratological Assessment ofFour Trihalomethanes in the Rat. J. Environ. Sci. Health 818:333-349.
Sherman, R.H. and Bernstein, R.B. (1951) Exchange of Deuterium Oxide WithBromodichloromethane and Chlorodibromomethane. JACS 73:1376-1377.
Stacpoole, P.W.; Harman, E.M.; Curry, S.H.; Baumgartner, T.G.; and Misbin, R.I.(1983) Treatment of Lactic Acidosis With Dichloroacetate. N. Engl. J. Med.309:390-396.
Stevens, A.A.; Moore, L.A.; and Mittner, R.J. (1989a) Formation and Control ofNon-Trihalomethane Disinfection By-Products. J. AWWA 81:54-60.
Stevens, A.A.; Moore, L.A.; Slocum, C.J.; Smith, B.L.; Seeger, D.R.; and Ireland,J.C. (1989b) Chlorinated Humic Acid Mixtures: Criteria for Detection ofDisinfection By-Products in Drinking Water. In I.H. Suffet and P. MacCarthy,eds., Aquatic Humic Substances, Washington, D.C., American Chemical Society,pp. 681-695.
Stevens, A.A.; Moore, L.A.; Slocum, C.J.; Smith, B.L.; Seeger, D.R.; and Ireland,J.C. (1990) By-Products of Chlorination at Ten Operating Utilities. In R.L.JoUey et al., eds. Water Chlorination: Environmental Impact and Health EffectsVol. 6. Chelsea, MI: Lewis Publishers, pp. 579-604.
Stothers, J.B. (1972) Carbon-13 NMR Spectroscopy: Organic Chemistry, A Seriesof Monographs Volume 24. Academic Press, Inc. Orlando, Florida, eds. AlfredT. Blomquist and Harry Wasserman.
Tobe, M.; Suzuki, Y.; Aida, K.; et al. (1982) Studies on the Chronic Oral Toxicityof Tribromomethane, Dibromochloromethane, and Bromodichloromethane.Tokyo Medical and Dental University unpublished report to the National Instituteof Hygienic Sciences, Tokyo, Japan.
Tumasonis, C.F.; McMartin, D.N.; and Bush, B. (1985) Lifetime Toxicity ofChloroform and Bromodichloromethane When Administered Over A Lifetime inRats. Ecotoxicol. Environ. Safety 9:233-240.
U.S. EPA (Environmental Protection Agency) (1990) Final Report for DisinfectionBy-Products in United States Drinking Waters. Vol. 1. EPA Publication No.570/9-90/OlOA, NTIS No. PB90240078.
56

Uhler A.D. and Diachenko G.W. (1987) Volatile Halocarbon Compounds in ProcessWater and Processed Foods. Bull. Environ. Contam. Toxicol. 39:601-607.
Weast, R.C., ed. (1989) CRC Handbook of Chemistry and Physics, 70th ed., BocaRaton, FL, CRC Press, p. C-348.
Whitehouse, S.; Cooper, R.H.; and Randle, P.J. (1974) Mechanism of Activation ofPyruvate Dehydrogenase by Dichloroacetate and Other Halogenated CarboxylicAcids. Biochem. J. 141:761-764.
Woodward, G.; Lange, S.W.; Nelson, K.W.; and Calvery, H.O. (1941) The AcuteOral Toxicity of Acetic, Chloroacetic, Dichloroacetic, and Trichloroacetic Acids.J. Ind. Hyg. Toxicol. 23:78-82.
Zimmer, H.; Amer, A.; and Rahi, M. (1990) On The Synthesis And Mass-Spectroscopical Identification of Certain Polyhalogenated Acetic Acids.Analytical Letters 23(4):735-746.
57

Figure 1: Chemical Structures of Trihalomethanes (THMs)
CI
H — C — CII
CI
H
CI
•CIBr
CI
Chloroform Bromodichloromethane
CII
H —C—BrIBr
Chlorodibromomethane
BrI
H — C ~ BrIBr
Bromoform
58
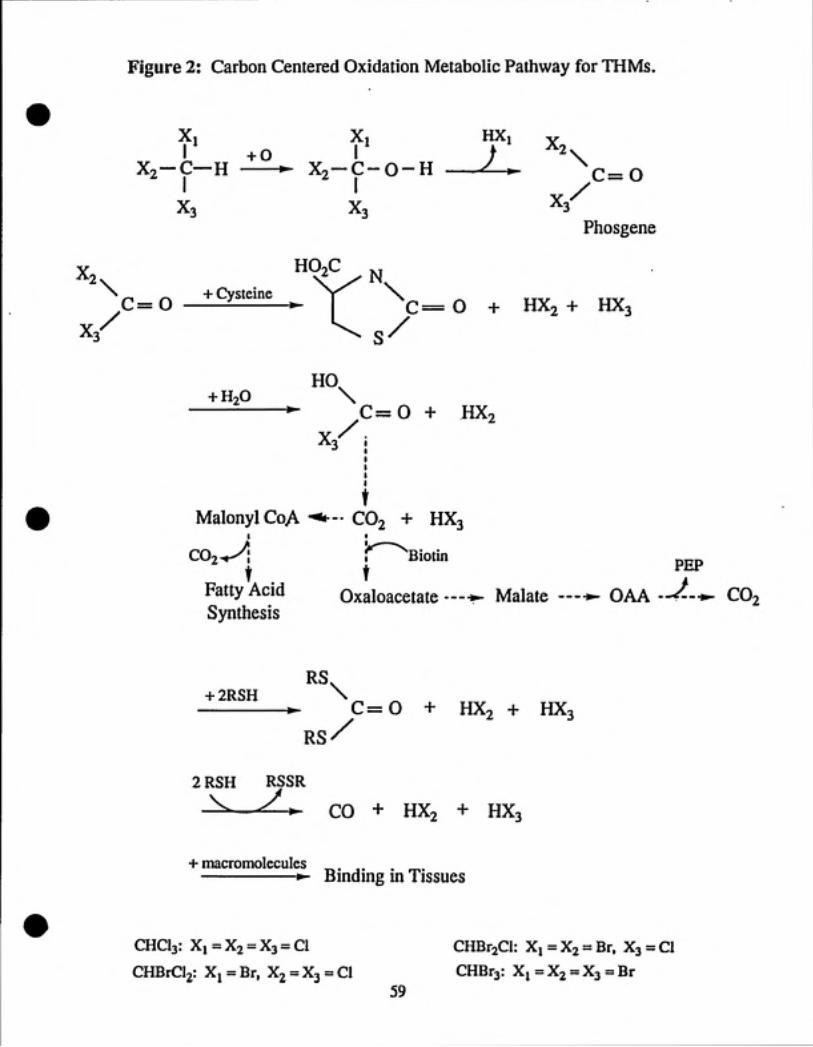
Figure 2: Carbon Centered Oxidation Metabolic Pathway for THMs.
Xi Xi HXi Y
X2-C—H ----^ X2-C-O-H ----^^-^^ C=0I I /
X3 X3 ^3Phosgene
X2 "O2C j^\^^^_^Cysteine_ V- \_ O + HX^ + HX3x/ \ 0/"^3
+ H2O \--------------^ C=0 + HX2
tMalonylCoA-* -• CO2 + HX3
PEPCOo^ i'^'^^Biotint � ,
Fatty Acid Oxaloacetate —-»- Malate — *- OAA --^-.^ CO2Synthesis
RS+ 2RSH \---------------^ C=0 + HX, + HX,
RS/
2 RSH RSSR
^ - ^» CO + HXo + HXo
+ macromolecules
--------------•«- Binding in Tissues
CHCI3: Xi = X2 = X3 = Cl CHBraCl: Xj = Xj = Br, X3 = CI
CHBrClj: X^ = Br, X2 = X3 = CI CHBrj: Xj = X2 = X3 = Br59

Figure 3: Halogen Centered Oxidation Metabolic Pathway for THMsO
Xi XiI +0 r
X2-C—H ------^ Xo-C—HI IX.
x,o
X,
o-
I
-^-Xo-C—H ^I
X3
X2.
X
V HXi
c=o —^
x,o-
X2-C^—HI
X3
X.
ox,I
-c-I
X3
H
X2-C^—HI
X3+ GSH
Binding to Macromolecules-*-
+ H2O
S-GI
X2-C-HIX3
OH
^^ X5-C-HIX,
HOX,
Formyltetrahydrofolate
�
—*- CO + HX3
HoO
NAD^ NADH
^--^ CO2
CHCI3: Xi = X2 = X3 = CI
CHBrCl2: Xj = Br, Xj = X3 = CI
PurinesThymineMethionineGlycine
60
CHBrjCl: X, = X2 = Br. X3 = CI
CHBra: Xi=X2 = X3 = Br

Figure 4: Reductive MetaboHc Pathway for THMs.
X,
X2—C — HIX,
H X,e � I---------^^-^^ Xo—C
IX3
-• Interactions with macromolecules:
LipidsProteinsNucleic Acids
^ X2-C—HX,
CHCI3: Xi=X2 = X3 = ClCHBrClj: Xj = Br, X2 = X3 = CI
CHBriCl: Xj = Xj = Br. X3 = CICHBrj: Xi=X2 = X3 = Br
61

Figure 5: Synthetic Reaction Scheme for Bromochloroacetic Acid
HoC/
\
COOH
COOH
Bro
Ether
COOH
H—C —COOHIBr
SO2CI2Ether
COOH
CI—C-HIBr
Z^
CO,
COOH
CI — C — COOH
IBr
62

Figure 6: Mass Spectrum of Bromochloroacetic Acid
I III11 III 111111iIII 111111111111111111111111111111111111111111111111111i 11111.111.ll 11111i111 11111
H O
H
o
o
o
o
o
inH
H
o
H
o
o00'
o
o00
o
Om'
o
oin
h*" h '-'
iiiHiiiiliiiHiiiHiiiHmi[Minniniiiniiiniiii|iiinim[nininniiiniiiniiiHiiini»iilooinotooinotooiooinoinoinomo- - ' <r n n N N H iHO) <y\ oo 00 (o lo in in
63

Figure 7: Synthetic Reaction Scheme for Chlorodibromoacetic Acid
H
ICCI — C — C — H
OEt
Ic
IH
IOEt
2Bt2 CI
Br
IC
IBr
OIICH
HNOo
Br
ICI — C — COOH
IBr
64

:48
173
File:Vl6l5 Scan:4 Acq:22-0CT-91 18:57:05 +0:0970SEQ EI+ Function:Magnet Bpl:4131086 TIC:44567808File Text:VERMEULEN DIBROMOCHLORO ACETIC PROBE100 129
95i
90i
85i
BOi
75i
70i
65J
60J
55J
50.
45J
40J
35
30J
25i
20i
15i
lOj
5J
Oi
79
63
.iiiii I. II.
91
107
60.180
—|.l.l|i,.i|i„i|.00 12
145
160
^140
208
21 252
160 i6o 260 Ic220 240 ^0 2^260 280
4. 1E6
L3.9E6
L3.7E6
L3.5E6
L3.3E6
13.1E6
L2.9E6
L2.7E6
L2.5E6
L2.3E6
L2. 1B6
Ll.9E6
L1.7B6
Ll.4E6
L1.2E6
Ll.0E6
L8.3E5
L6.2E5
L4. 1E5
L2. 1E5
J-O.OEOM/Z

Figure 9: Synthetic Reaction Scheme for Bromodichloroacetic Acid
CI
CI
IC
IH
OEt
IC—H
IOEt
Bro
H^CI —
CI oI IIC-CH
IBr
66
HNO,
CI
CI
IC
IBr
COOH

File.:V2090 Scaa:2i Acq:21-JJ0V-»l 21:16:16 +0:467QSZQ, KE+ Puaction:Maga«t Bpl: 3954626 TIC:27511722Fil* Text :VERiJDBLSN OICHBRACZTXC ACID PROBSxoo
95J90j8SJSOJTSJ70JGSJ€0lSSJSOJ
45J40J3SJ30jZSJ20j1SJ10JsJ
8.3 .Z25.00-
63
tl,..|ll.ljl lll.i.ljul.ji
127
99
-oa
80 IdOWi
lio'
163
140 J160 180 200illn:
Si
4.0E6
L3.8S6
L3.6E6L3.4S6m
L3.2B6 'm
13.0E6iz.szsL2.6E6L2.4E6L2.2B6m
L2.0S6L1.8S6
L1.6B6
L1.4E6
|1.2S6.L9.9Z5L7.9E5
L5.9BSL4.0BS
L2.0ES
220 240 2^0LO. 0E0
M/2
U3C
(0
20)0)01
w
orr
c3
Oit)
wno3o
otr
o
oCJororfH-O
>o

Figure 11: Synthetic Reaction For Bromodichloroacetic Acid Via LithiumSalt Formation.
CHBrCl2or
CBr2Cl2 J
CI
+ LiC4H9
dry iceI
t
^ LiCBrCl2 + C02(s)
CI — C — COOHDIH2OHCl
Br
CI O
I IICI- c - c
IBr
—O — Li^
68

t
ou
"70SED EW- PrmctdoniMagaet BpI:B14aiS4 TIC: 121417888M* -TextiTERMEUIEN DICEBRJ^CETIC ACID EII0IU 8?
Btz
: €3 127•CTJssiSOJ-4SJ-4S40J
H ' 'I'lm ii .in la3li ii iiii ss20Jis]IDJ5J0,
117
lM
71
IlJ
SI
lit)
ib lili 1
156173
€0 60 100 lio11
207
iLi. -JJ.140 160 180 260 220 240 260
t3.3S€-» an> 1-1
o
Qi

14
Figure 13: Proposed Scheme for C-Labeled Bromodichloroacetic Acid
Ba CO3 + H2SO4
CHBrCl2or
CBr2Cl2 J- + LiC4H9
CI
ICI — C — COOH
IBr
t
LiCBrCl2 + CO2
DIH2OHCl
CI o
CI- c - cIBr
— O—Li^
70

Figure 14: Synthetic Reaction Scheme for Deuterated Bromodichloromethane
D-
CI
1H H
c-ci1Cl
+ H-C-C— C—Br
AlCL
Cl
D-C—ClIBr
+
H HI IC-CI IH H
H-C-C —Cl
71
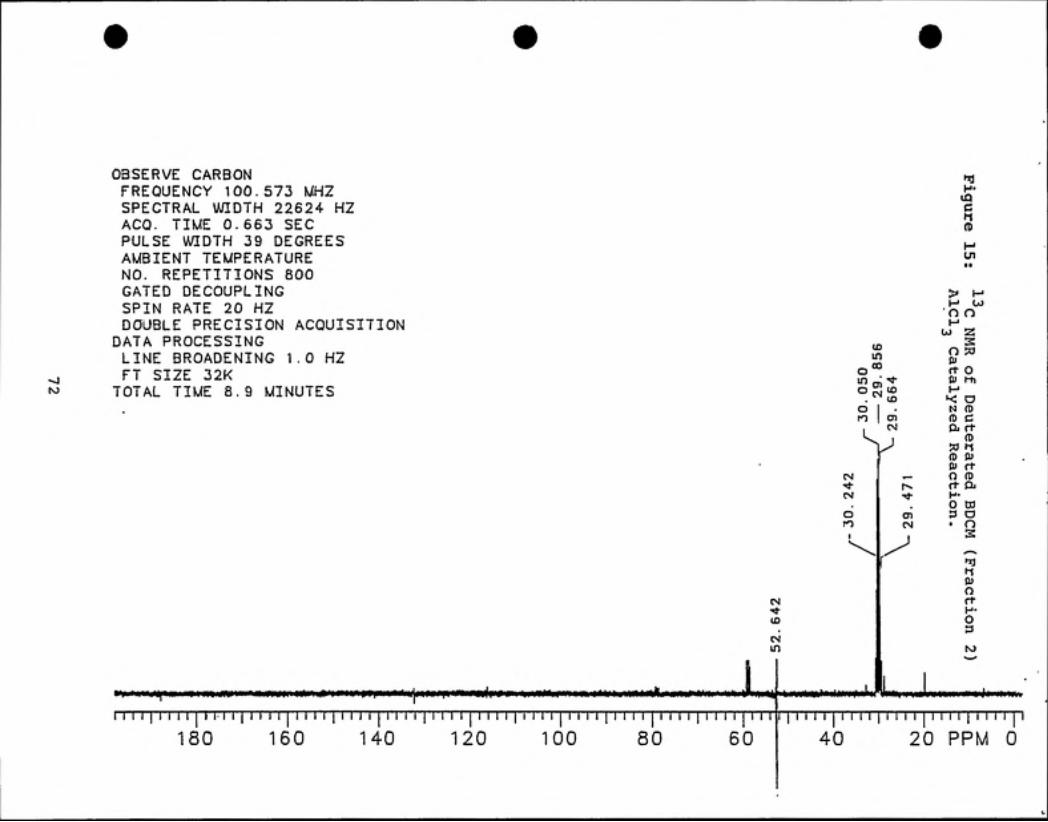
OBSERVE CARBONFREQUENCY 100.573 MHZSPECTRAL WIDTH 22624 HZACQ. TIME 0.663 SECPULSE WIDTH 39 DEGREESAMBIENT TEMPERATURENO. REPETITIONS 800GATED DECOUPLINGSPIN RATE 20 HZ
DOUBLE PRECISION ACQUISITIONDATA PROCESSINGLINE BROADENING 1.0 HZFT SIZE 32KTOTAL TIME 8.9 MINUTES
o
CM
CM
in
•iMi«<ilWMIIpwnii«M««««M||MaiM«MIWWMaM«^ MMHMMMMmAwmMWNiM Ml
I I I I I I I M I n I I I I I M I I I I I I M J I I I I I I I I I I 1 I I I I I I M I 1 I I I I 1 I M M I I I M I I M i I 1180 160 140 120 100 80 60
>i»wr<MM*>*W»i>i|twLnwil^ I >iir
inc
(D
cn
> MH Wn oH
w 2S
O W0)ft o&) MlH
< oN (0(D COj n-
(0?d M(D fuQJ rt
«s~ O rt)r^ ft Oi<*• I--
0 aOl 3 aCM • n
1s
,^
<-^hjOJorth- ;o3
N>
wiin—w—wjitimmiin
I I I I 11 I I I I I I M I I I I I I I I I I M I I40 20 PPM 0

fD
to
>»wJw^iH>,||»MM> I f,iVi*|«i'ii^M»»ifW>N^<M»* '»l>UiiH >V<»^-»V>»%N<^''^»»-i*^i»rtt» W'iy^'y^#%<Mfcw>)fy)w CvM.iS'i'y' * MmiuMfr>«**><*»J^ii<^;<vv^'ifcyttV^ '>«>*r' ^Mi ^ ^»\i>s>^»w-»-t*'*'ifi^''r» *wiiw^«»A ^
1 1 I 1 I I I I I70
7-T I I I6080
I I I I I I I I50
"1 i r~r~T 1 r
401 I I i ! n r
30 PPMI'll
20

OBSERVE CARBON
FREQUENCY 100.573 MHZSPECTRAL WIDTH 22624 HZACQ. TIME 0. 663 SECPULSE WIDTH 39 DEGREESAMBIENT TEMPERATURENO. REPETITIONS 800GATED DECOUPLINGSPIN RATE 20 HZDOUBLE PRECISION ACQUISITION
DATA PROCESSING
LINE BROADENING 1 . 0 HZFT SIZE 32K
TOTAL TIME 8.9 MINUTES
CM
O
csai
(N in
kOl
CM
/J
CM
Ol
O)— 03
00 CTl. >!-
COID 00
'^ , inOln
CMin
^
in
ch(D
CTl
n n
3n »
(+0)
oMl
*< o
CD CQi ft
fD?d i-(fD OJDJ rtO fDrt OiH-O ddP O• n
O(+
o3
jll<ii|l<»llilwft<Mk*|i|fl|i|<iiii|i»<ii|l[<ii|iM>lli>iiiWi<|lI I I 1 I M I I I I I I I I I I I I I I I I I I I I I I I I I I I I I I I I I I I I I I I I I I I I I I I { I M I I M I I I I I I I I 1 11 I I I 1 I i I 1 M I I I M I I I I I I I n 11 I I
180 160 140 120 100 80 60 40 20 PPM 0

I-"
Cn
H
>
i«'4w^wr^^vk<*'y'VfM»iS^ft»»M>>>M»i4i| ' ' ' 1 I I I I I ( I I t t [ t 'l 1 J | i I ] 1 | I I 1 I | I I I 1 | I I I I [ 1 I 1 1 j I I TT [ I. I i I 1 I I i. I [
80 70 60 50 40 3a PPM 20
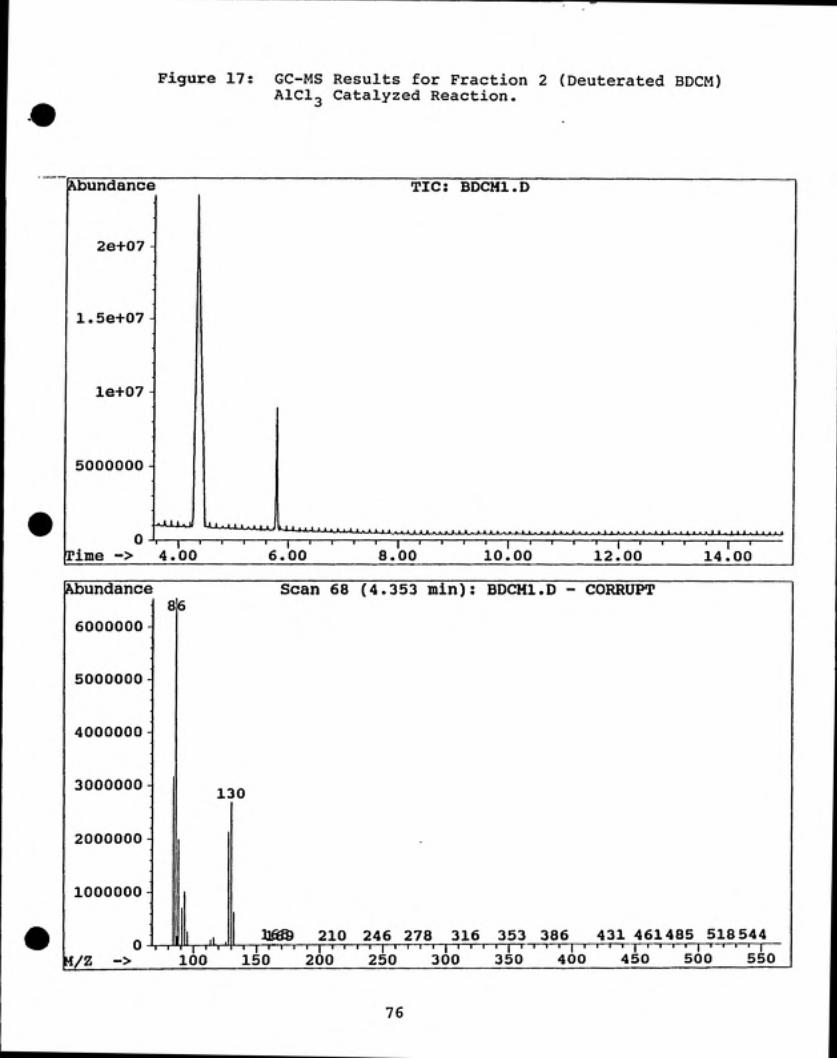
Figure 17: GC-MS Results for Fraction 2 (Deuterated BDCM)AlCl^ Catalyzed Reaction.
[Abundancei
TIC: BDCMl.D
2e+07 -
1.5e+07
le+07
1
5000000-
1
.^JuUuJ '"-XJUuoUuJ 'MlX^J.OjUUOi.>^>*-*-/-*-*^JULa,j^JULJ.JLvwJuJLJki-JU*-JLJLJLjU«-A^>-Jl-a_iOL-*-JuX-j^J_*-Jl-.wVJ^AJ-^J.J^.,A--*vjLJUL-0.a,Ju>^-fULJUUul_JL,.^J^JLjuu»0^^--1—
Time -> 4.001----T----1----1----1----1----1—
6.001 1 1 1 1
8.001 1 1 1 1"
10.00, , 1 , ,
12.00, , 1 '
14.00 1
p^bundance Scan 68 (4.353 min): BDCMl.D - CORRUPT |86 ,6000000- 1
5000000
4000000-
3000000 i:JO
2000000-
1000000-
f\ 1 1. , 1 31^ 210 246 278 316 353 386 431 461485 518544 |U -" 1 IflU^—[-"V^M/Z -> 100 150 200 250 300 350 400 450 500 550 |76

Figure 18: GC-MS Results for Fraction 3 (Deuterated BDCM)AlCl^ Catalyzed Reaction.
[Abundance1 ^
TIC: BDCM2.D
2.5e+07 -
2e+07 -
1.5e+07 -
le+07 -
5000000 -
v-j»-<-JUUuJ '^-J->-tJOl_n_>_«_l_kJ *- *—^--'^- '—*^-*~~'-*—*~J--i-^_JLj_^^ __LJU>_.VwJ>w*_J ^^A_J~-*-^--A->-JUjl^ A-_A—>L_>wi-*-A-*^J'-
0 -h—1—1—I—rime -> 4.00
1 1 1 1 1 1 15.00 e
1 ' '• .00
' ' 1 ' ' ' ' 1 ' ' ' ' 1 ' '7.00 8.00 9.00
1 1 1 1 110.00
1 1 1 1 111.00
' ' 1 '12.00 1
Abundance
6000000
5000000-
4000000
3000000
2000000-
1000000
86Scan 67 (4.341 min): BDCM2.D - CORRUPT
130
Ifty 200 26378 305 346 393409 46476 506 540_j---—.J---1 r "T"
M/Z ->1—I "•( I—I I "r—I—I—r^T—1—I—[^—1—I—1—1—]—I—I—1—1—I—1 ] 1 I I 1 I I I I I I I I I ' 1 r-100 150 200 250 300 350 400 450 500 550
77
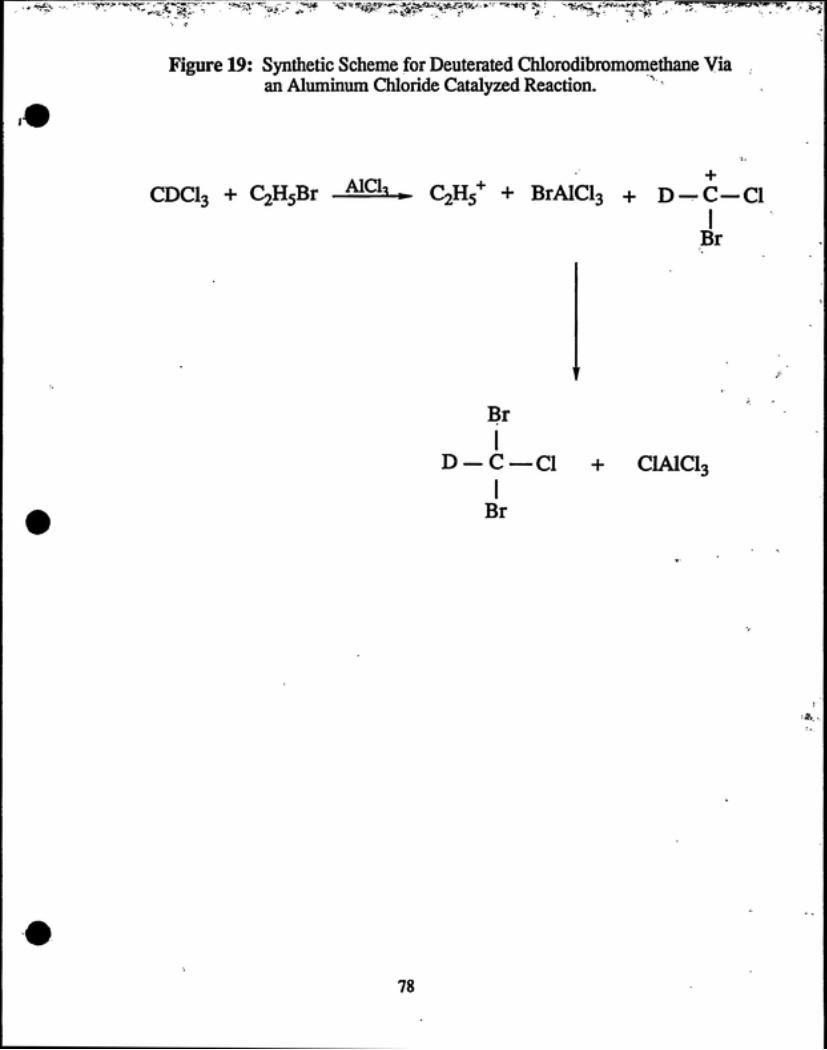
Figure 19: Synthetic Scheme for Deuterated Chlorodibromomethane Viaan Aluminum Chloride Catalyzed Reaction.
CDCI3 + C2H5Br ^^^^^ . C2H5^ + BrAlCl3 + D-C-ClIBr
D
Br
IC- 01 + CIAICI3
Br
78

OPSETRVE CARSONFREQUENCY 100.573 MHZSPECTRAL WIDTH 22624 HZACQ. TIME 0.663 SECPULSE WIDTH 39 DEGREESAMBIENT TEMPERATURENG REPETITIONS 800GATED DECOUPLINGSPIN RATE 20 HZDOUBLE PRECISION ACQUISITION
DATA PROCESSINGLINE BROADENING 1.0 HZFT SIZE 32KTOTAL TIME 8.9 MINUTES
ino
on
oID
CO
01
o
ID~D
cnCM
— oo
o
iil^i^mii00(t^^
iflCh(T)
too
O O
sn to
rt
M•<NO
OJOrtH-O3
OHi
Oocft(D
rt
• * CO-M 0C O
W(D(UOrtH-O3
COoo
KiiHiii'inyii m]qtfiwi*m*
H0)ort
o3
mmmimim**
r i i i | i i i i [ i i i i | i i i i | i i i i | i i i i [ i i i i | i i i i [ i i i i | i i i i [ i i i i | i i i i | i i i i | i i i i [ i i i 'i | i i i i [ i i i i | i i i i I i i i i | i i i i i i180 150 140 120 100 80 60 40 20 PPM 0

COo
i i i i i i i r
lyJUM(mft'#)n» ^x^w^^n,!^ »w^i, {mm w>*v'**fii<iwimt*h w&Hfvtohiv* ^;*«MrtHHV%Vtt»*W>Wi»»
| I 1 I 1 | I I 1 I | I I' I Ii i i r
80 70 'r i i i i i J i "| i I |30 PPM 20

00
OBSERVE CARBONFREQUENCV 100.573 MHZSPECTRAL WIDTH 22624 HZACQ. TIME 0.663 SECPULSE WIDTH 39 DEGREESAMBIENT TEMPERATURENO. REPETITIONS 800GATED DECOUPLINGSPIN RATE 20 HZDOUBLE PRECISION ACQUISITION
DATA PROCESSINGLINE BRO^DENING 1. 0 HZFT SIZE 32K
TO'AL TIME E. 9 MINUTES
a
CO
I I I I | M I I | 1 M I | I 1 I I | I I I I | I 1 I 1rrrr
i-
cn(D
to
I I 1 i I 11 I I100
TTT
C) > MN ID M LJ
CO n niO m
c w 2
CI S
10CN n so
k
of Deutertalyzed Rro *i (D o»us Cl fU ft'NJ * O (D
ft Pid en H-•ni
N
BDCM (Fraction 3)on (7 Day Reaction).I'l 1 i 1 i
40
I I 1 1
2I10
1 i 1 | i M i 1
PPM 0180 160 140 120
TTTTTT
80rfTTTTp
60
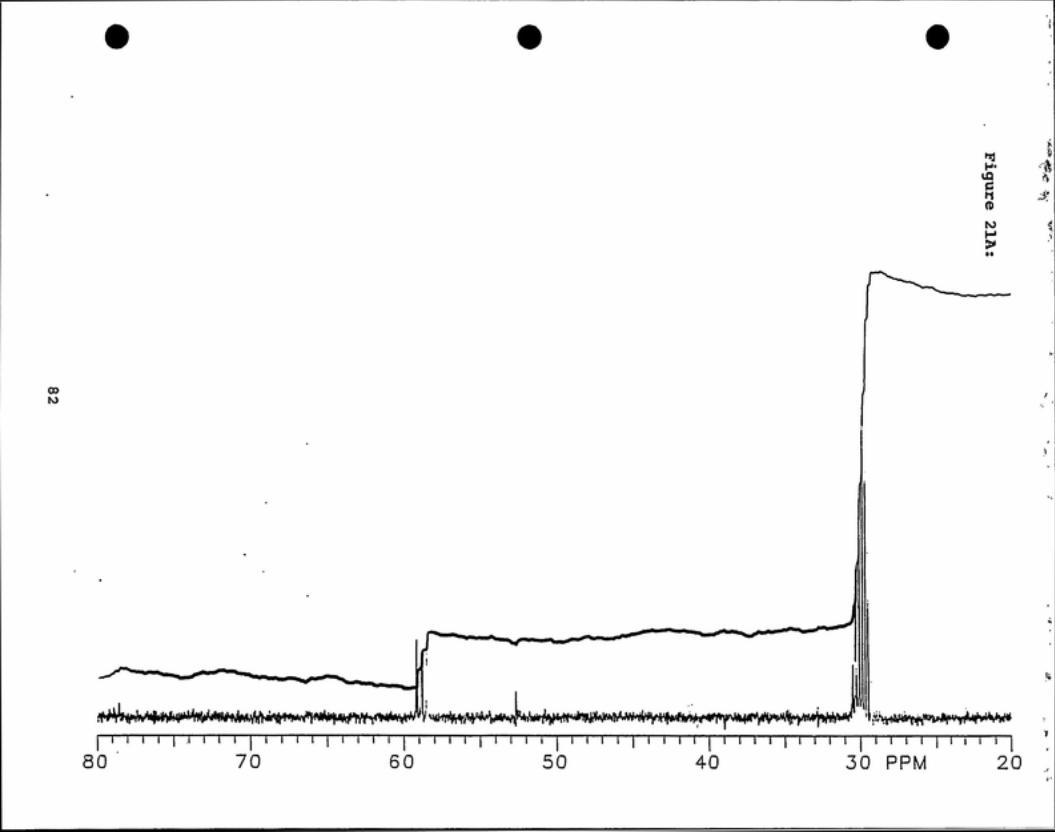
Ch
COto
mW^mii^^^w^^^I I I I I [~~I I i I-? i i I I | I I I I I i I T80 70 60
i i i i i i i i r
50i | i i i i I i i i i |i i i i I i n i | i i
40 30 PPM 20

00
inen
OBSERVE CARBON
FREQUENCY 100.573 MHZSPECTRAL WIDTH 22624 HZAGO. TIME 0.663 SECPULSE WIDTH 39 DEGREESAMBIENT TEMPERATURENO. REPETITIONS 800GATED DECOUPLINGSpIN RATE 20 HZDOUBLE PRECISION ACQUISITION
DATA PROCESSING
LINE BROADENING 1 . 0 HZFT SIZE 32K
TOTAL TIME 6.9 MINUTES
i I'l I | I i I i | i i I 1 | I i I i I I I i I I I I | i I I140
•-' o ro
— 00 m
cn colTJ "J CO
TTTTTTT
120
TTT
1001111 i 1111 I [ I 1111111111 I I'l 111111111 111111 111 111111 i 11
20 PPM 0180 160 80 50 40
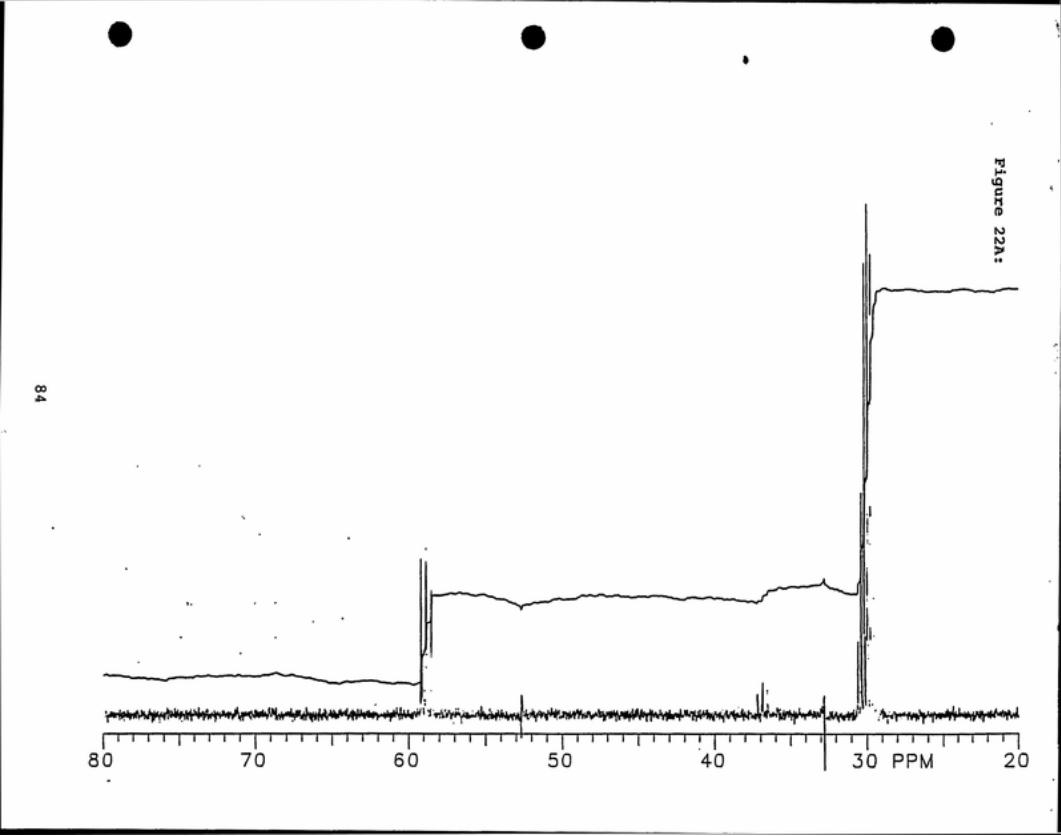
00
y^WMftWHtfb^^I I 1 I I I I I i I I i I i I I 1 I I I I i I
^V^Jim^^^Ww^W^v^^ "•^ 'wt.y^4t-^^^Mi rn i i i i i i i i i i i i n i i i i r i i | i i i i I i i i i [
30 PPM 20F
80 70 60 50 40
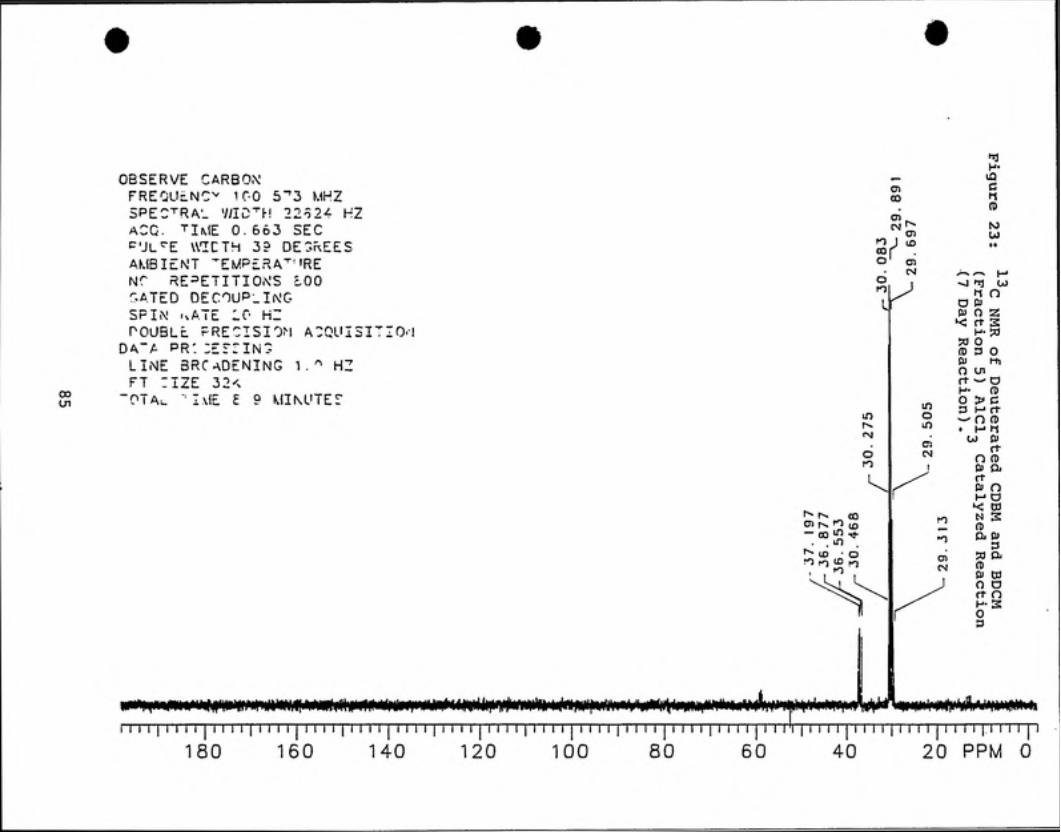
00U1
OBSERVE CARBONFREOU=.NCv 100 5^3 MHZ5PECTRA'_ WID^H 22t24 HZACG. tI\IE 0.663 SECC,JLCE U1CTH 3? DE3REESAMBIENT "EMP£RAT'»RENC RE::,ETITIOiN:S LOOGATED DECOUPLINGSPIN tvATE 10 HZ
rOUBLE. PRECISION A^QUISITIO.Ida"a pr: :Er:iNSLINE SRCaDENING 1.^ HZFT :iZE 32<
"OTAu "; IxlE £ 9 MINUTET
0*fimmmMwmm iHmH**m*^^
1111111111111111111111180 160
I I | i i i I J I I I I | I I I I I I I M | I I I I I I I I I | I I I I I i I I I | I140 120 100 80 60
h n
a Cb
| I I I 1 | I I I I | I I I I j I i I I |.l I I 1 | I40 20 PPM 0

00
i i i i i I iiit r~i i i i | i i i i i i r i i
cn(D
>
*ftf^M»l4fWM if
I i I I | i 1 I I40
i r i i | i i i i
80 70 60 50i i t i i i i i i | i i i i |
30 PPM 20
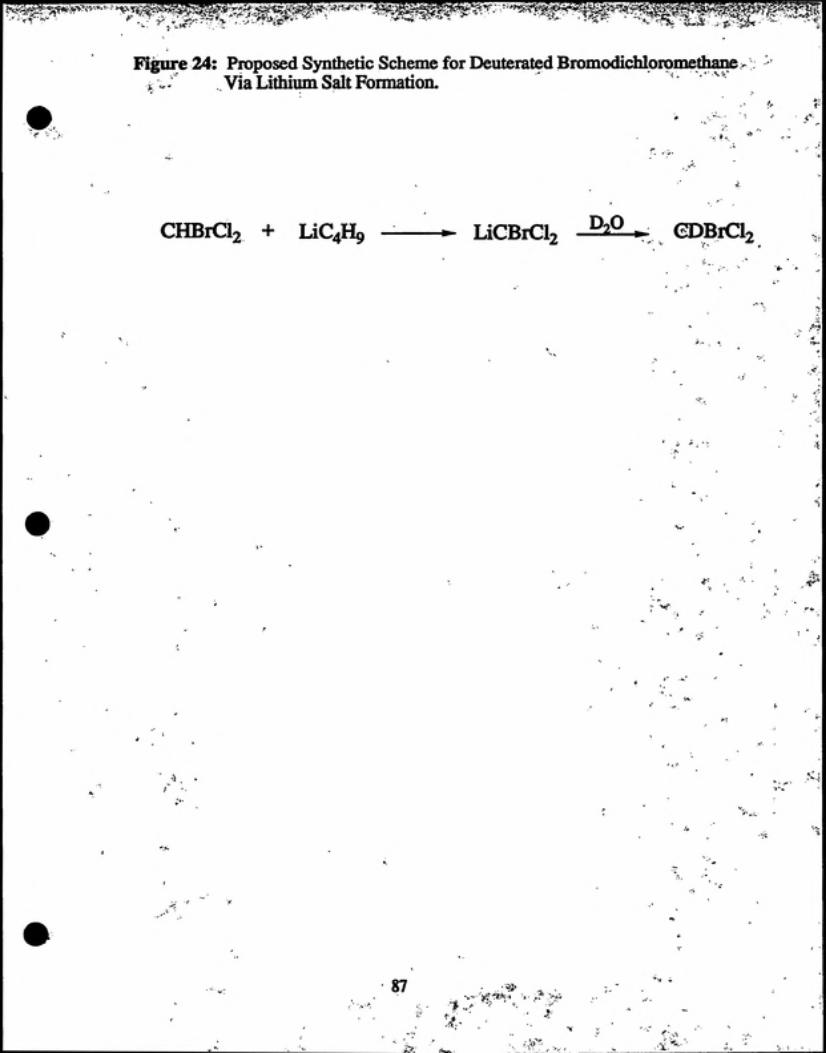
Figure 24: Proposed Synthetic Scheme for Deuterated BromodichloromethaneVia Lithium Salt Formation.
CHBrCl2 + LiC4H9 ----------*- LiCBrCl2 ^^Q „ CDBrCl2
87

0000
OBSERVE CARBONFREQUENCY 100.572 MHZSPECTRAL WIDTH 22624 HZACQ. TIME 0.663 SECPULSE WIDTH 39 DEGREESAMBIENT TEMPERATURENO. REPETITIONS BOOGATED DECOUPLINGSPIN RATE 20 HZDOUBLE PRECISION ACQUISITION
DATA PROCESSINGLINE BROADENING 1 . 0 HZFT SIZE 32K
TOTAL TIME 8.9 MINUTES
eo f^ _,- O) ci
J77S
l*MiWrtN*llrt^^
tQcna
2S
i.... i
U) to ^
* CO
^>^>#>i^(^^W mmm
CZ-U

»acn(D
to
^
CO
j i; i T j i. i •! 1 ^j i i i i j I i i i j I i i i j i i i i i I i i i j i i I i j i i I i j i i i i j i i i i j i ] i To : ' 70 -. .= • .. A*-* 3 J 40 30 PPM 20
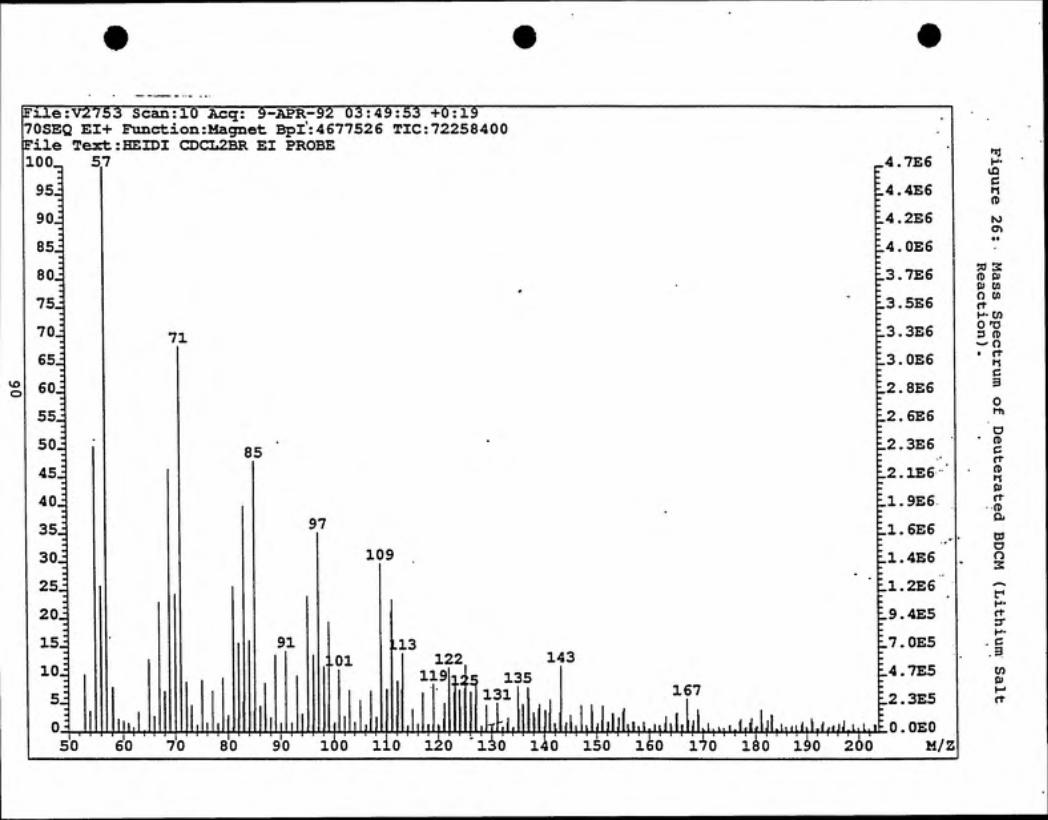
#
Flle:V2753 Scan:10 Acq: 9-APR-92 03:49:53 +0:1970SEQ E1+ Function:Magnet Bpl:4677526 TIC:72258400File Text:HEIDI CDCI.2BR EI PROBE100 57
95i
90i
85i
80J
75J
70J
651
sol
55i
50i
45J
40 J
35i
30j 10925J
2o|15j 91 il3
1 ni103
5i
OJ—iiiiiiiii|i|
71
50
85
60 70
97
80 90
122
119
143
t
¥-^ 135
131
t
167
|i!ltl!UljlHiit'titl|i|l(iiMifliifkhM'»if'^'^^lOO 110 120 130 140 150 160 170 1^0 190 20
.4.7E6
.4.4E6
.4.2E6
.4,0E6
.3.7E6
.3.5E6
.3.3E6
.3.0E6
.2.8E6
.2. 6E6
.2.3E6
.2.1E6
.1. 9E6
.1.6E6
.1.4E6
.1.2E6
.9.4E5
.1. 0E5
L4.7E5
L2.3E5
LI^O.OEO200 M/Z
c
to
50 2(D D)01 0)o cn(i-H- cn0 T3D (D•^ a• rt
t-ic3
OMl
o• (D
Crt(Dnturt(Da.
Dos
ft
c3
CO0)

Figure 27: Proposed Reaction Scheme for Deuterated Bromodichloromethane ViaBromination of the Dichloromethide Anion.
CD2CI2 + LiC.Hg JTHF^ LiCDClo + Bu-D
Bro
CDBrCl2 + LiBr
91

Figure 28: Proposed Reaction Scheme for Deuterated BromodichloromethaneVia Lithium Aluminum Deuteride.
CBr2Cl2 + LiD ^!^^^ * CDBrCl2 + LiBr
92

Figure 29: Generation of Dichlorocarbene Under Catalytic Two-PhaseConditions (Fedorynski et al., 1977).
CHCi3„,g. + ^N^^cr^rg. + NaOH
CCl," N. + NaCl/ \
orgaq + H20,q
CCV/N^org
CCl2org. + )N;^Cl-,rg.
93
Figure 30: Synthesis of BDCM By Reacting Chloroform and Bromoform UnderAlkaline Conditions (Fedorynski etal., 1977).
CHBr3 + CHCI3
NaOHaq
CHBr3 + CHBr2Cl + CHBrCl2 + CHCI3 + CCI4 + CBr4
* Triethylbenzylammonium Chloride (TEBA) phase transfer catalyst
94
Table 1: Haloacids Identified as Drinking Water Chlorination By-Productsin a 10-City Survey (Stevens et al, 1990).
Haloacid Number of Supplies SampledChloroacetic 6
Dichloroacetic 10
Trichloroacetic 6
Bromochloroacetic 4
2,2-Dichloropropanoic 9
2-Chloropropanoic 8
3,3-Dichloropropenoic 5
Chlorobutanedioic, isomer 9
2,2-Dichlorobutanoic 2
Chloro-methoxy-dicarboxylic 1
95

Table 2: Quarterly Median Values for Haloacetic Acids in U.S. Drinking Waters(Krasner er a/., 1989).
Spring 1988 Summer 1988 Autumn 1988 Winter 1989
Haloacid (ugA^)
<1.0
(ug/L) (ugyl.) (ug/L)
Chloroacetic 1.2 <1.0 1.2
Dichloroacetic 7.3 6.8 6.4 5.0
Trichloroacetic 5.8 5.8 6.0 4.0
Bromoacetic <0.5 <0.5 <0.5 <0.5
Dibromoacetic 0.9 1.5 1.4 1.0
Total Haloacids 18 20 21 13
96

Table 3: Cancer Incidence in Mice Exposed to Chloroacetic Acids in DrinkingWater (Herren-Freund et al., 1987),
Prior ^InitiationConcentration of 2Chloroacetic Acid
Mice WithCarcinomas (%)
Carcinomasper Mouse (No.)
- NaCl (22) 0 0
+ NaCl (22) 5 0.05 t 0.05
- 39 mM DCA (26) 81 1.69 - 0.29
+ 39 mM DCA (32) 72 1.47 - 0.24
+ 16 mM DCA (29) 66 1.17 - 0.22
- 31mMTCA(22) 32 0.50 t 0.17
+ 31mMTCA(23) 48 0.57 t 0.21
+ 12mMTCA(33) 48 0.64 - 0.14
2.5 ug ethylnitrosourea/g body weight at 15 d of age.9 Parentheses indicate the number of mice at sacrifice.
97

Table 4: Mixed Halogenated Acetic Acid Melting Points
m.p. (lit, values ) °C m.p. (exp. values) °C
BrClCHOOH 25
Br2ClCCOOH 108 - 110 97-102
BrCl2CCOOH 78 - 80 69 - 74
98

Table 5: Mass Spectral Data for Mixed Halogenated Acetic Acids and DeuteratedBDCM.
Compound (M/Z) Nt -COoH M""-Br M" -C02-Br M^"-CICHClBrCOOH^'^ 172 127 93 49 137(Figure 6) (3,5.5,2.5) (0.9,0.2,0) (41.5,42.3) (8.8,3,0.5) (0.9,3.9)
CClBr2COOH'' 250 205 171 127 215(Figure 8) (2, 5.9,5,2) (4,9.2,6.8,1.2) (52,73.5,35) (86.9,100,37.9) (6.5,12.1,6)
CCl2BrC00H^ 206 161 127 83 171(Figure 10) (2.5,4,3.2,1.2) (6,9.1,4.8,1.2) (41.5,37,8.5) (100,73.5,16.8) (2,2.5,1)
CDCl2Br*' 163 84 128(Figure 17) (weak) (48.4,100,30.8) (32.4,40.7,9.9)
^ In spectra, M"^-Br and M'^-Cl daughter peaks appear to absorb a hydrogen.
Numbers in parentheses represent the relative intensity of peaks atX, X+2, X+4, and X+6 respectively due to chlorine and bromine isotopes.
99
Table 6: ^^C NMR Chemical Shifts (5)
Compound
d-Acetone
d-Bromodichloromethane
d-Chlorodibromomethane
d-Chloroform
d-Methylene Chloride
Tetrahydrofuran
5 (ppm)
29.8 (7)
59 (3)
37 (3)
77 (3)
53.8 (5)
67.4 (1)
() indicates multiplicity
100