Embed Size (px)
Citation preview

1
Microsoft Excel 2007
Entering survey results into excelAssumed knowledge – use of outlines, cell adjustments and formatting and basic functionalityGriffith High School PLT 2, 2011
2
Entering data into excel
Once you have received your survey results from students you will need to create an excel spreadsheet to record this data. The information displayed in this training demonstrates how I used my survey results to analyse the training needs of teachers at Griffith High School.
There were 10 questions I had the teachers fill out from the survey for the purpose of action research at school but I needed to create some graphs to represent the final analysis.
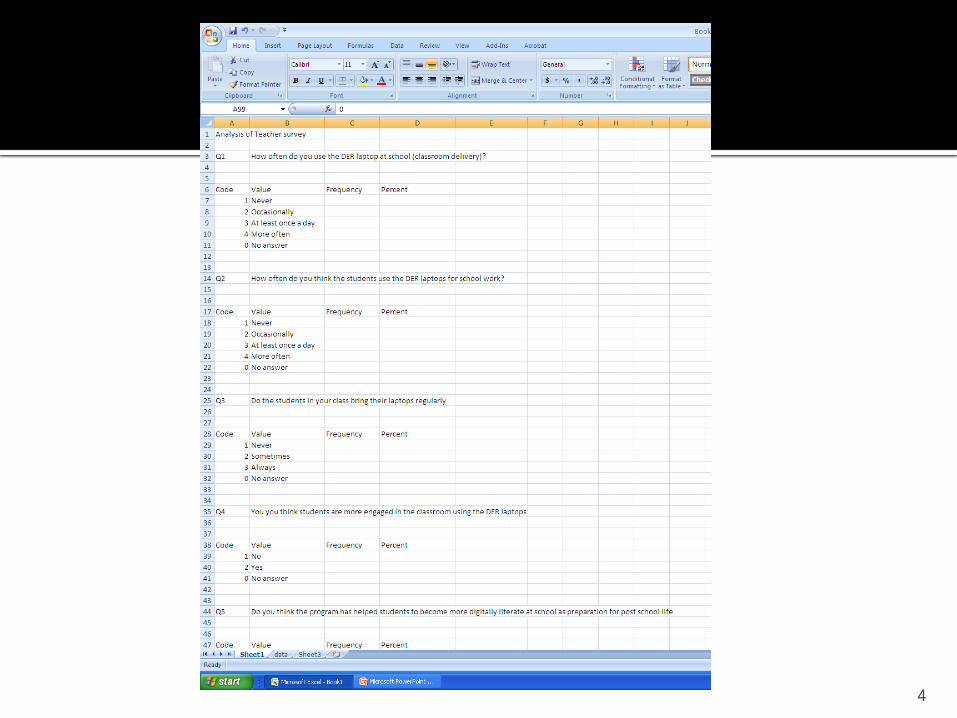
This image demonstrates the format for entering in the 10 questions I used in the survey. For this exercise I will ask you to enter the same data as displayed. This may be useful as a template or reflection when you need to enter your survey data.
3
Question code values
When you use a database style value, response items need to be entered as a numbered code. To do this, assign numbers to your responses prior to entering your data.
A response item is one possible answer to your survey question. In the first question on the next slide “How often do you use your DER laptop at school”. There are four possible answers as demonstrated on the next slide. If you survey does not have this format you will need to convert your answers into this type of value.
Copy the example on the next page. For information that is not displayed copy from the spreadsheet file.
4
5
Changing your views to side by side
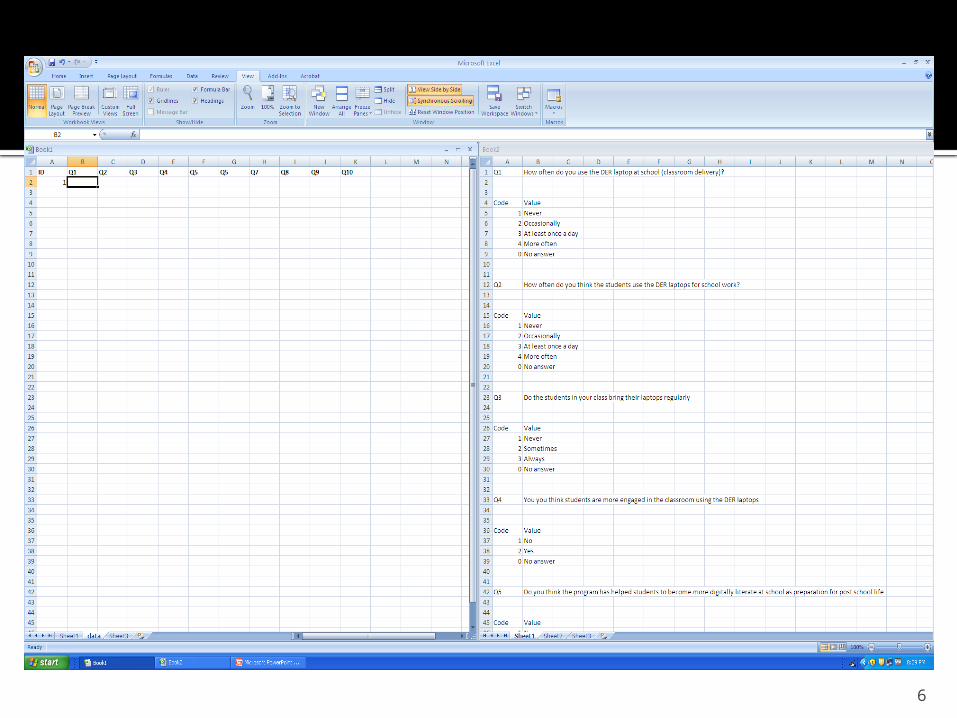
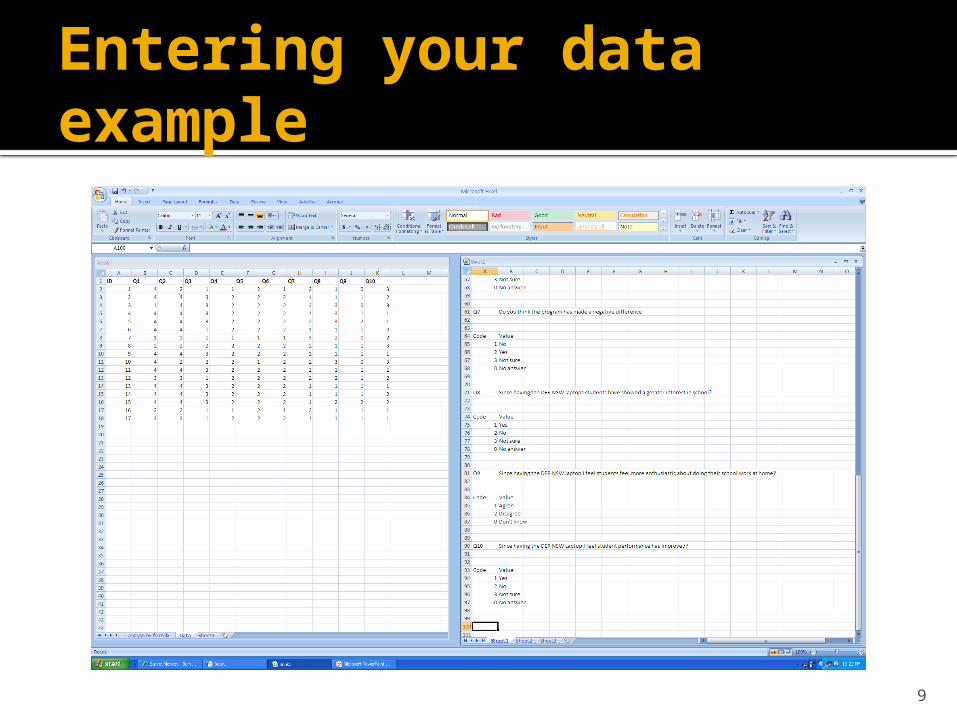
As you will see on the next slide I have changed the view so the information is easier to copy the details. You can also elect to use synchronious scrolling which will scroll your pages together. Use the VIEW tab to activate these features
6
7
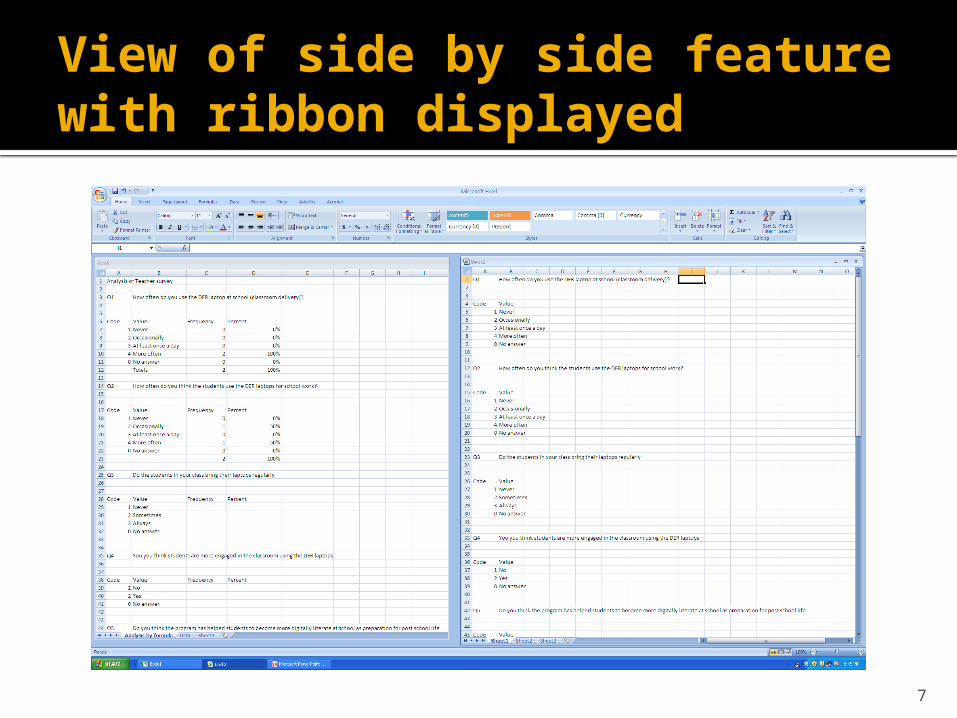
View of side by side feature with ribbon displayed
8
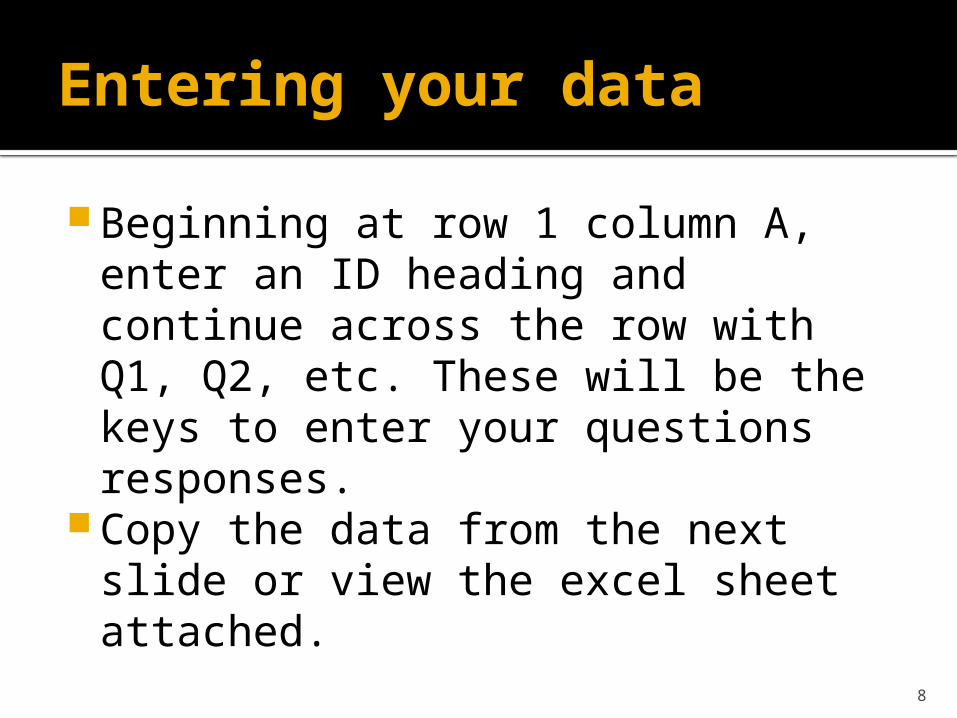
Entering your data
Beginning at row 1 column A, enter an ID heading and continue across the row with Q1, Q2, etc. These will be the keys to enter your questions responses.
Copy the data from the next slide or view the excel sheet attached.
9
Entering your data example
10
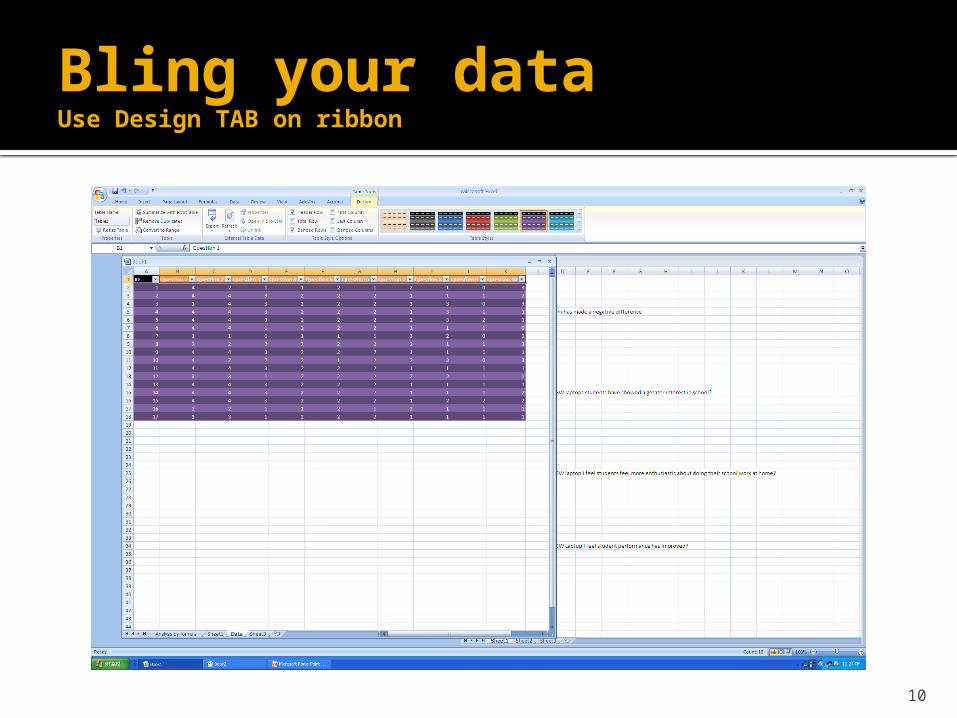
Bling your dataUse Design TAB on ribbon

11
COUNTIF Functions and Formulas
Once all your data has been included you will now need excel to perform functions and formulas to answer your queries.
We have already entered data to represent how many responses to questions answered but now we need to calculate the frequency and percentage.
Follow the steps on the analysis by formula sheet tab on the excel file attached.
To do the COUNTIF function we will be utilising the two tab sheets we had previously entered our survey data into.
12
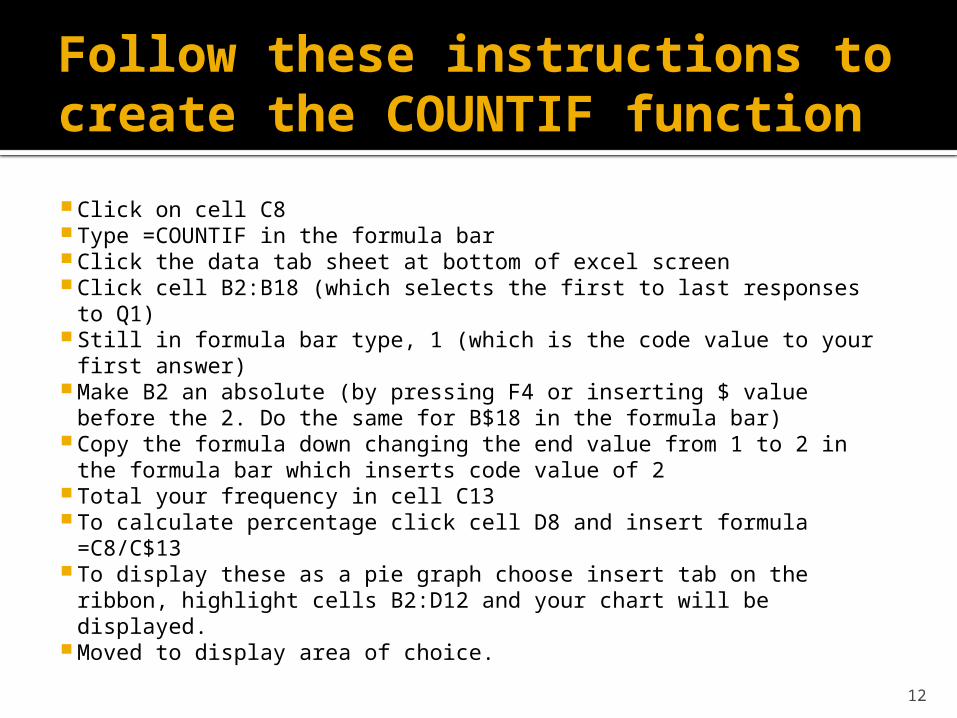
Follow these instructions to create the COUNTIF function
Click on cell C8 Type =COUNTIF in the formula bar Click the data tab sheet at bottom of excel screen Click cell B2:B18 (which selects the first to last responses to Q1) Still in formula bar type, 1 (which is the code value to your first
answer) Make B2 an absolute (by pressing F4 or inserting $ value before
the 2. Do the same for B$18 in the formula bar) Copy the formula down changing the end value from 1 to 2 in the
formula bar which inserts code value of 2 Total your frequency in cell C13 To calculate percentage click cell D8 and insert formula =C8/C$13 To display these as a pie graph choose insert tab on the ribbon,
highlight cells B2:D12 and your chart will be displayed. Moved to display area of choice.
13
Analyse your data
Tips – Think about what you would like to do with your results:
Who will read or use the data? What do they want to know? What types of analysis will they want? What will ne of most interest? Will you want charts or graphs to illustrate
your findings?Use the answers to these questions to
determine what analysis will meet your needs.
14
Inserting Formulas and Functions
I required question responses to be displayed in pie graph format so I used formulas to calculate the responses.
(See Excel handout for details and enter data)
I also included in my summary a pivot chart which displays the total of responses, I then displayed this in chart format as displayed on next screen
15
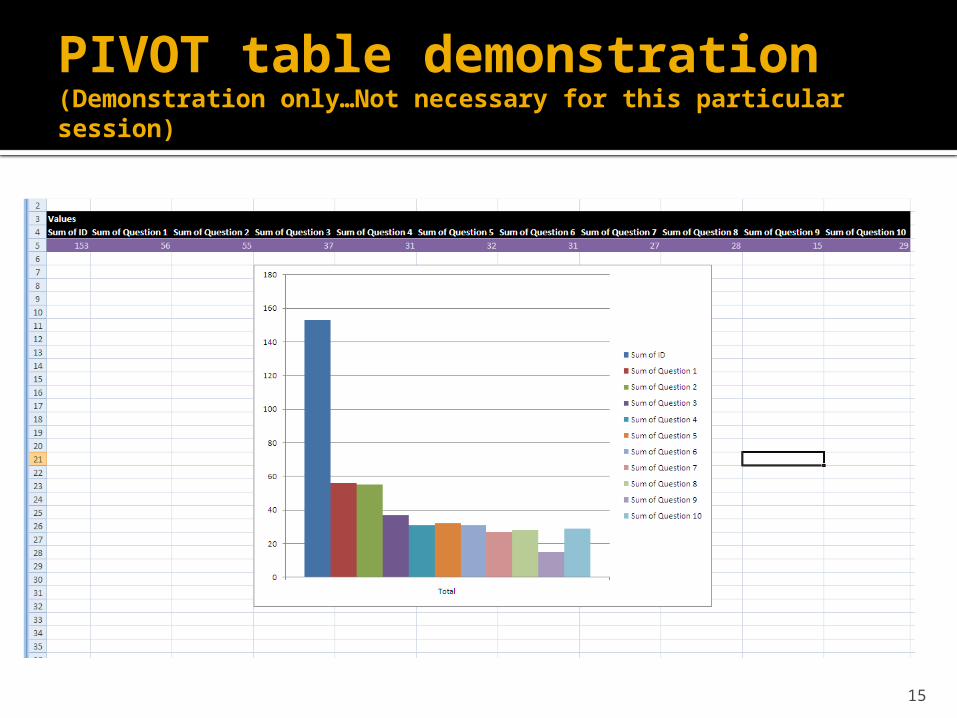
PIVOT table demonstration(Demonstration only…Not necessary for this particular session)
16
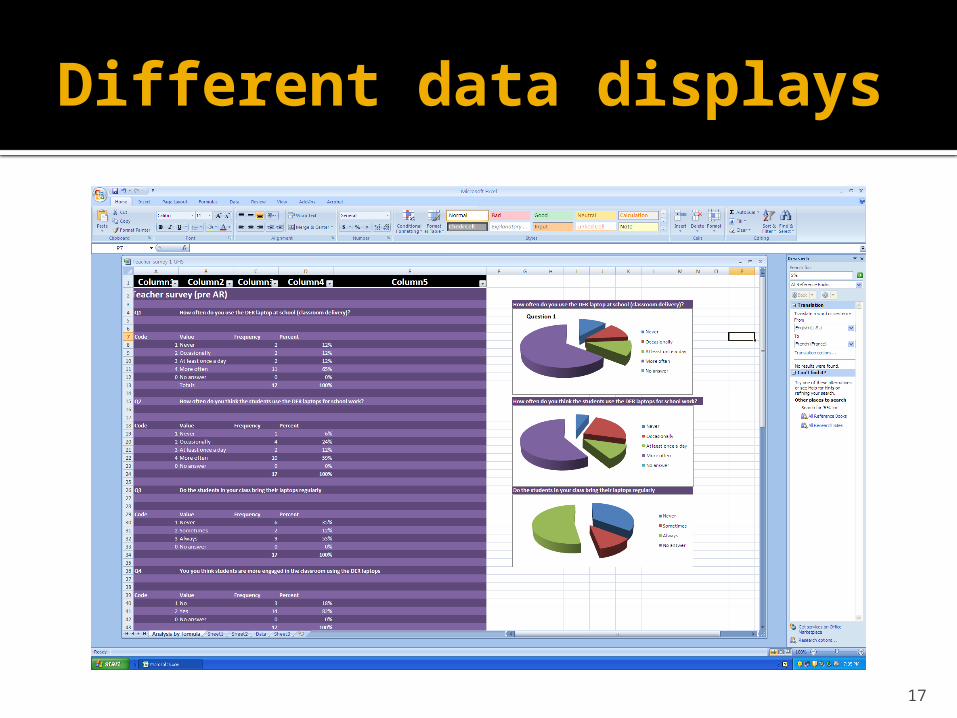
Different data displays
The following screen shot displays how I have displayed my collected data.
The screen to the left displays typed results of survey while the right side of the screen displays a pie chart view of the results. You may find a pie chart a style that is easier to read than text.
17
Different data displays