Embed Size (px)
Citation preview
All rights reserved. Enterprise Products Partners L.P.
Enterprise Products Partners L.P.Bear Stearns Fixed Income Conference
May 15, 2007
Michael A. CreelExecutive Vice President & CFO
All rights reserved. Enterprise Products Partners L.P. 2
This presentation contains forward-looking statements and information that are based on Enterprise’s beliefs and those of its general partner, as well as assumptions made by and information currently available to them. When used in this presentation, words such as “anticipate,” “project,” “expect,” “plan,” “goal,”“forecast,” “intend,” “could,” “believe,” “may,” and similar expressions and statements regarding the contemplated transaction and the plans and objectives of Enterprise for future operations, are intended to identify forward-looking statements. Although Enterprise and its general partner believe that such expectations reflected in such forward looking statements are reasonable, neither it nor its general partner can give assurances that such expectations will prove to be correct. Such statements are subject to a variety of risks, uncertainties and assumptions. If one or more of these risks or uncertainties materialize, or if underlying assumptions prove incorrect, actual results may vary materially from those Enterprise anticipated, estimated, projected or expected. Among the key risk factors that may have a direct bearing on Enterprise’s results of operations and financial condition are:
Fluctuations in oil, natural gas and NGL prices and production due to weather and other natural and economic forces;A reduction in demand for its products by the petrochemical, refining or heating industries;The effects of its debt level on its future financial and operating flexibility;A decline in the volumes of NGLs delivered by its facilities;The failure of its credit risk management efforts to adequately protect it against customer non-payment;Actual construction and development costs could exceed forecasted amounts;Operating cash flows from our capital projects may not be immediate;Terrorist attacks aimed at its facilities; andThe failure to successfully integrate its operations with assets or companies, if any, that it may acquire in the future.
Enterprise has no obligation to publicly update or revise any forward-looking statement, whether as a result of new information, future events or otherwise.
Forward Looking Statements
All rights reserved. Enterprise Products Partners L.P. 3
Use of Non-GAAP Financial MeasuresThis presentation utilizes the Non-GAAP financial measures of Gross Operating Margin and Consolidated EBITDA and makes references to Distributable Cash Flow. In general, we define Gross Operating Margin as operating income before (i) depreciation, amortization and accretion expense; (ii) operating lease expense for which we do not have the payment obligation; (iii) gains and losses on the sale of assets and (iv) general and administrative expenses.In general, we define Distributable Cash Flow as net income or loss plus (i) depreciation, amortization and accretion expense; (ii) operating lease expense for which we do not have the payment obligation; (iii) cash distributions received from unconsolidated affiliates less equity in the earnings of such affiliates; (iv) the subtraction of sustaining capital expenditures; (v) gains and losses on the sale of assets; (vi) cash proceeds from the sale of assets or return of investment from unconsolidated affiliates; (vii) gains or losses on monetization of financial instruments recorded in Accumulated Other Comprehensive Income less related amortization of such amount to earnings; (viii) transition support payments received from El Paso related to the GTM Merger; (ix) the addition of losses or subtraction of gains related to other miscellaneous non-cash amounts affecting net income for the period; and (x) the addition of minority interest amounts related to the public unitholders of Duncan Energy Partners L.P. less cash distributions to such unitholders. Distributable Cash Flow is a significant liquidity metric used by our senior management to compare basic cash flows generated by us to the cash distributions we expect to pay partners. Distributable Cash Flow is also an important Non-GAAP financial measure for our limited partners since it serves as an indicator of our success in providing a cash return on investment. Distributable Cash Flow is also a quantitative standard used by the investment community with respect to publicly traded partnerships such as ours because the value of a partnership unit is in part measured by its yield (which in turn is based on the amount of cash distributions a partnership pays to a unit holder). The GAAP measure most directly comparable to Distributable Cash Flow is net cash provided by operating activities.This presentation also includes references to credit leverage ratios that utilize Consolidated EBITDA, which is a term defined in the $1.25 billion revolving credit facility of Enterprise Products Operating L.P. These credit ratios are used by certain of our lenders to evaluate our ability to support debt service. The GAAP measure most directly comparable to Consolidated EBITDA is net cash flows provided by operating activities. Please see Slides 29 through 31 for our calculations of these Non-GAAP financial measures along with the appropriate reconciliations.
All rights reserved. Enterprise Products Partners L.P. 4
Overview
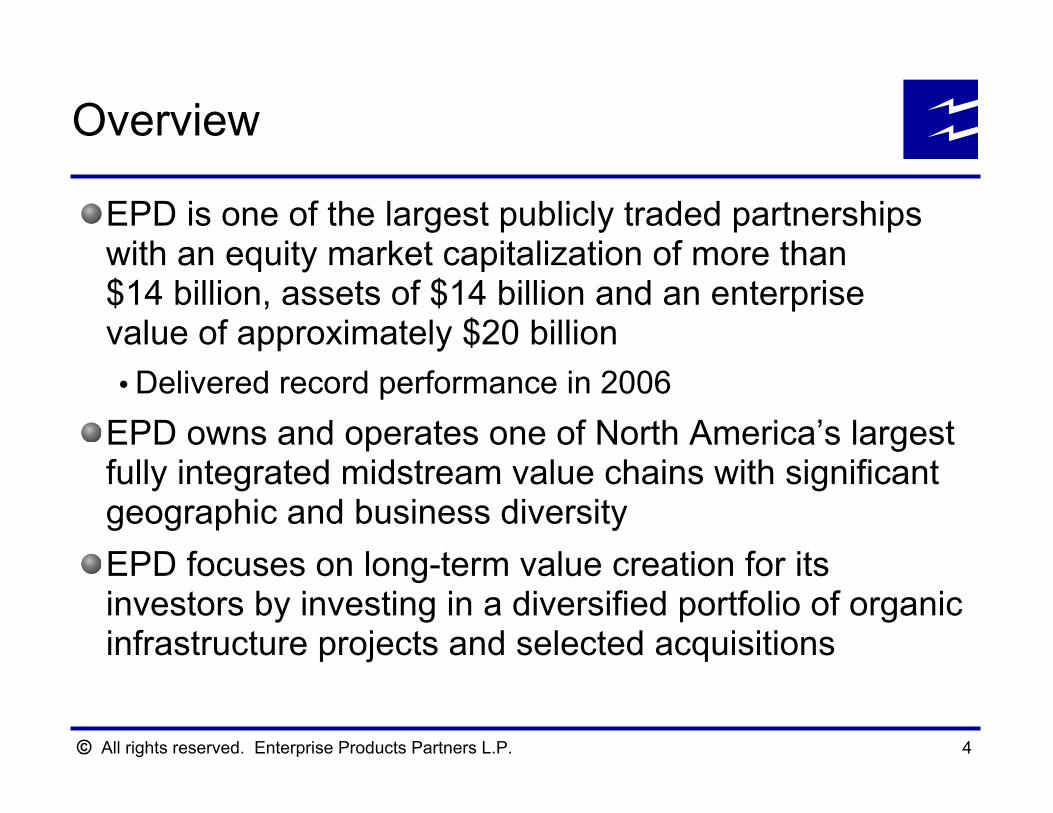
EPD is one of the largest publicly traded partnerships with an equity market capitalization of more than $14 billion, assets of $14 billion and an enterprise value of approximately $20 billion
Delivered record performance in 2006EPD owns and operates one of North America’s largest fully integrated midstream value chains with significant geographic and business diversityEPD focuses on long-term value creation for its investors by investing in a diversified portfolio of organic infrastructure projects and selected acquisitions
All rights reserved. Enterprise Products Partners L.P. 5
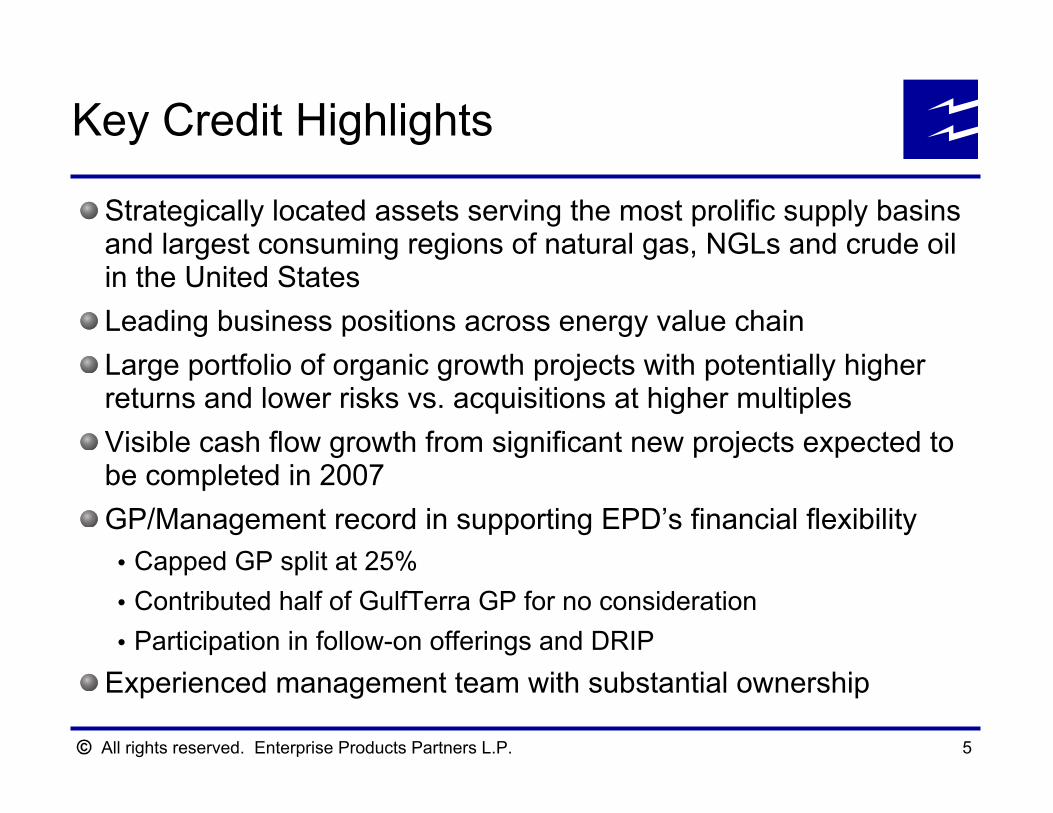
Strategically located assets serving the most prolific supply basins and largest consuming regions of natural gas, NGLs and crude oilin the United States Leading business positions across energy value chainLarge portfolio of organic growth projects with potentially higher returns and lower risks vs. acquisitions at higher multiplesVisible cash flow growth from significant new projects expected to be completed in 2007GP/Management record in supporting EPD’s financial flexibility
Capped GP split at 25%Contributed half of GulfTerra GP for no considerationParticipation in follow-on offerings and DRIP
Experienced management team with substantial ownership
Key Credit Highlights
All rights reserved. Enterprise Products Partners L.P. 6
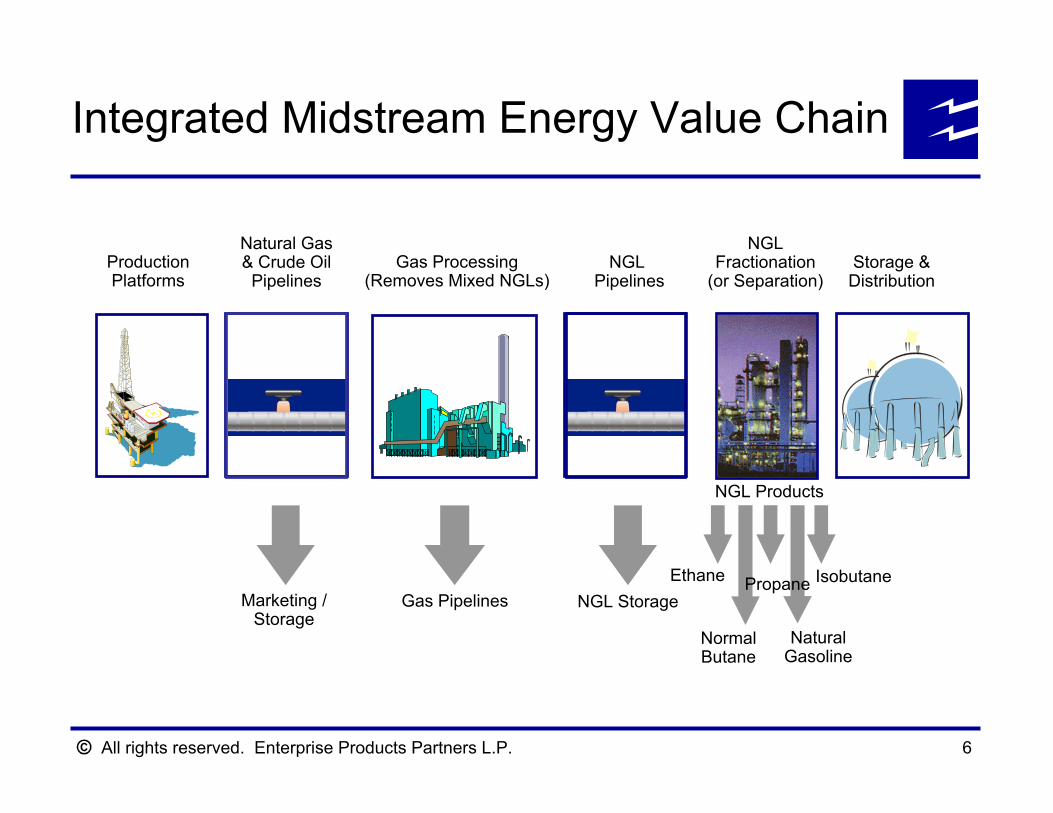
Integrated Midstream Energy Value Chain
Storage &Distribution
ProductionPlatforms
Gas Processing(Removes Mixed NGLs)
Gas Pipelines
Normal Butane
NGL Fractionation
(or Separation)
NGL Products
IsobutanePropane
Natural Gasoline
EthaneNGL Storage
NGLPipelines
Marketing /Storage
Natural Gas& Crude Oil
Pipelines
All rights reserved. Enterprise Products Partners L.P. 7
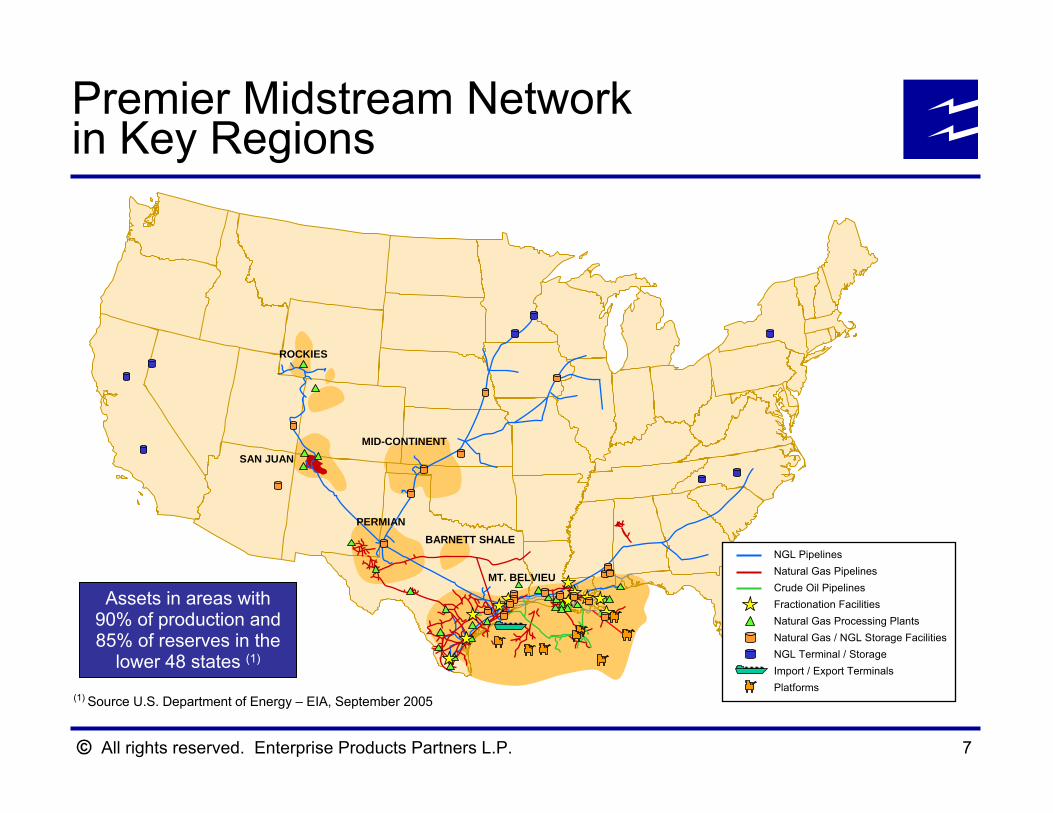
Assets in areas with 90% of production and 85% of reserves in the
lower 48 states (1)
(1) Source U.S. Department of Energy – EIA, September 2005
Premier Midstream Network in Key Regions
ROCKIES
SAN JUAN
BARNETT SHALEPERMIAN
MID-CONTINENT
MT. BELVIEU
NGL PipelinesNatural Gas PipelinesCrude Oil PipelinesFractionation FacilitiesNatural Gas Processing PlantsNatural Gas / NGL Storage FacilitiesNGL Terminal / StorageImport / Export TerminalsPlatforms
All rights reserved. Enterprise Products Partners L.P. 8
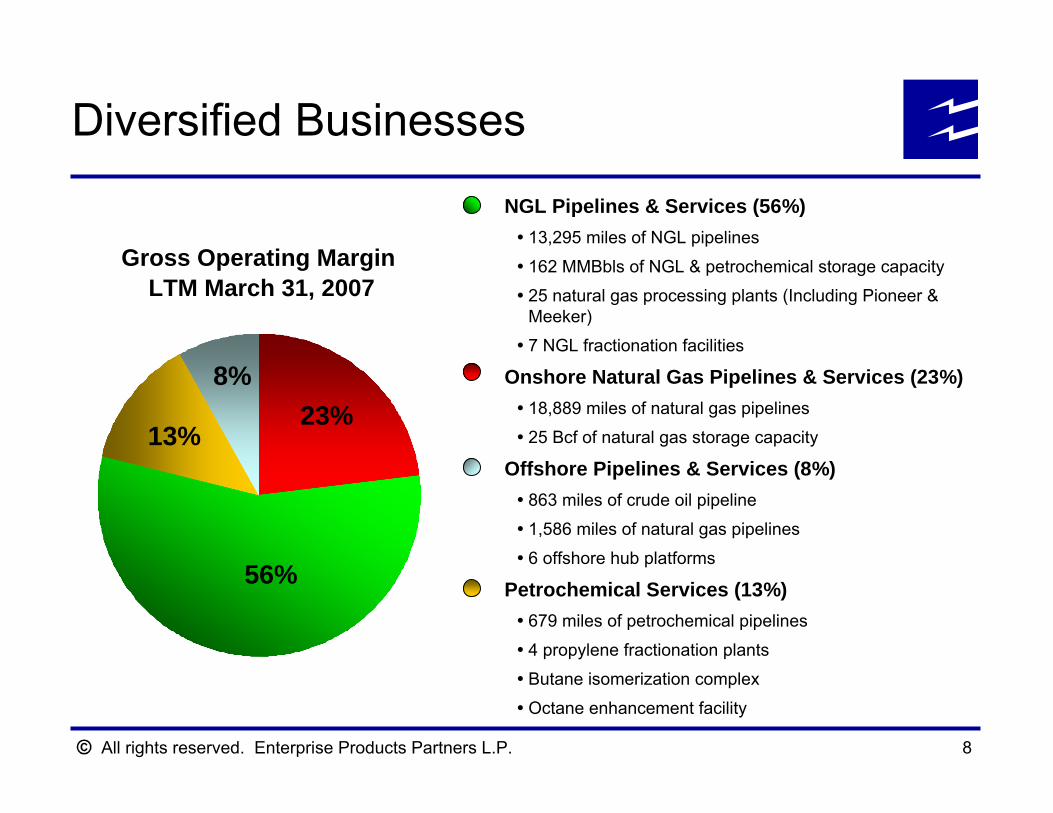
56%
23%8%
13%
Gross Operating Margin LTM March 31, 2007
NGL Pipelines & Services (56%)13,295 miles of NGL pipelines
162 MMBbls of NGL & petrochemical storage capacity
25 natural gas processing plants (Including Pioneer & Meeker)
7 NGL fractionation facilities
Onshore Natural Gas Pipelines & Services (23%)18,889 miles of natural gas pipelines
25 Bcf of natural gas storage capacity
Offshore Pipelines & Services (8%)863 miles of crude oil pipeline
1,586 miles of natural gas pipelines
6 offshore hub platforms
Petrochemical Services (13%)679 miles of petrochemical pipelines
4 propylene fractionation plants
Butane isomerization complex
Octane enhancement facility
Diversified Businesses
All rights reserved. Enterprise Products Partners L.P. 9
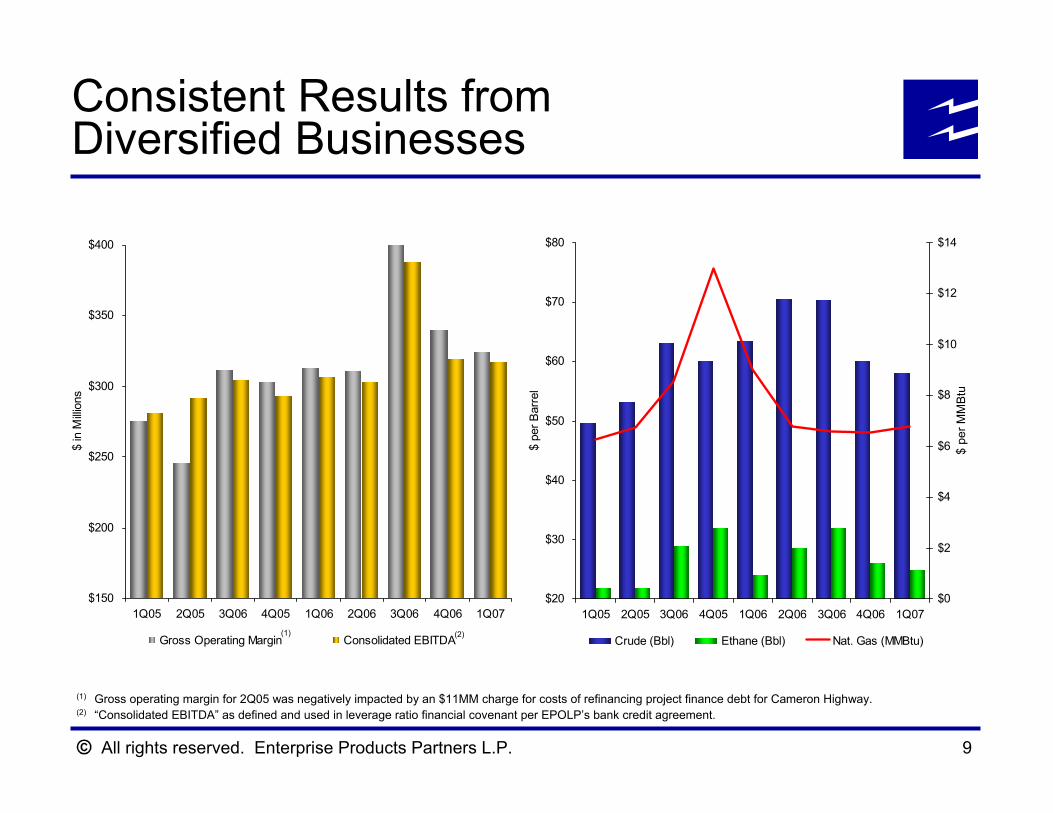
(1) Gross operating margin for 2Q05 was negatively impacted by an $11MM charge for costs of refinancing project finance debt for Cameron Highway.(2) “Consolidated EBITDA” as defined and used in leverage ratio financial covenant per EPOLP’s bank credit agreement.
Consistent Results fromDiversified Businesses
(1) (2)
$150
$200
$250
$300
$350
$400
1Q05 2Q05 3Q06 4Q05 1Q06 2Q06 3Q06 4Q06 1Q07
$ in
Milli
ons
Gross Operating Margin Consolidated EBITDA
$20
$30
$40
$50
$60
$70
$80
1Q05 2Q05 3Q06 4Q05 1Q06 2Q06 3Q06 4Q06 1Q07
$ pe
r Bar
rel
$0
$2
$4
$6
$8
$10
$12
$14
Crude (Bbl) Ethane (Bbl) Nat. Gas (MMBtu)
$ pe
r MM
Btu
All rights reserved. Enterprise Products Partners L.P. 10
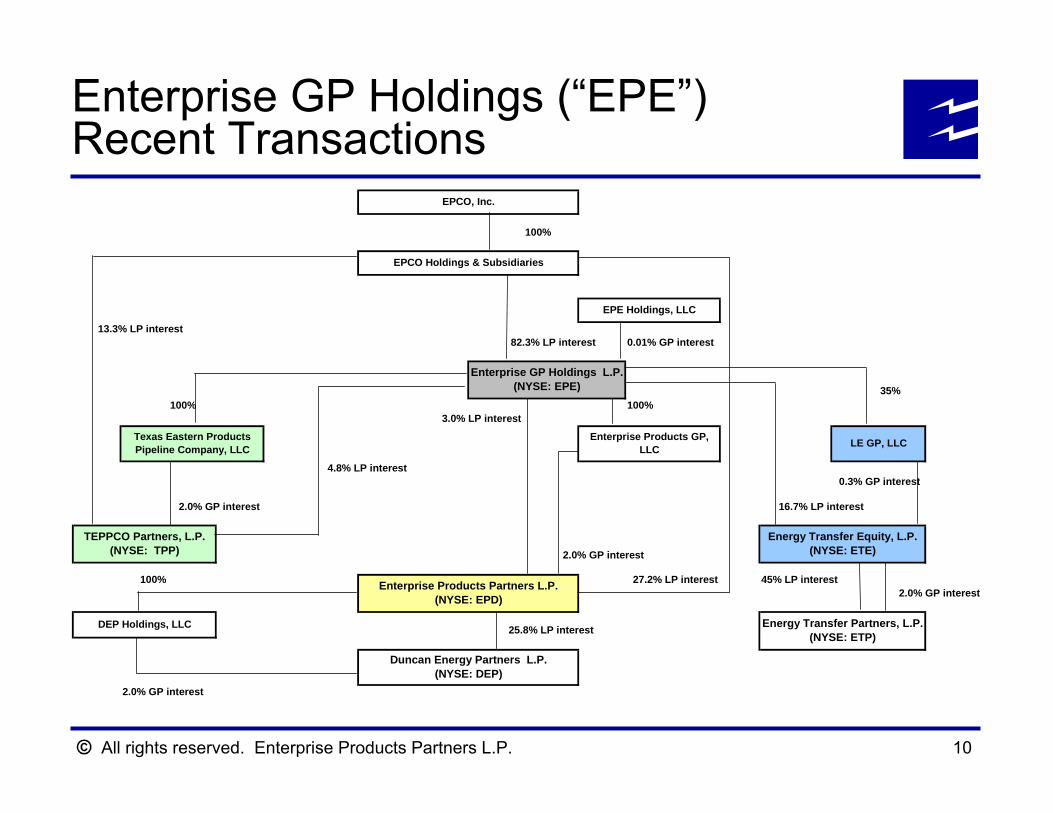
Enterprise GP Holdings (“EPE”) Recent Transactions
100%
13.3% LP interest 82.3% LP interest 0.01% GP interest
35%100% 100%
3.0% LP interest
4.8% LP interest 0.3% GP interest
2.0% GP interest 16.7% LP interest
2.0% GP interest
100% 27.2% LP interest 45% LP interest 2.0% GP interest
25.8% LP interest
2.0% GP interest
EPCO, Inc.
TEPPCO Partners, L.P. (NYSE: TPP)
DEP Holdings, LLC
Duncan Energy Partners L.P. (NYSE: DEP)
EPCO Holdings & Subsidiaries
LE GP, LLC
Energy Transfer Equity, L.P. (NYSE: ETE)
Energy Transfer Partners, L.P. (NYSE: ETP)
Enterprise Products Partners L.P. (NYSE: EPD)
EPE Holdings, LLC
Enterprise GP Holdings L.P. (NYSE: EPE)
Texas Eastern Products Pipeline Company, LLC
Enterprise Products GP, LLC
All rights reserved. Enterprise Products Partners L.P.
Key Assets and Opportunities
Cash Flow Visibility
All rights reserved. Enterprise Products Partners L.P. 12
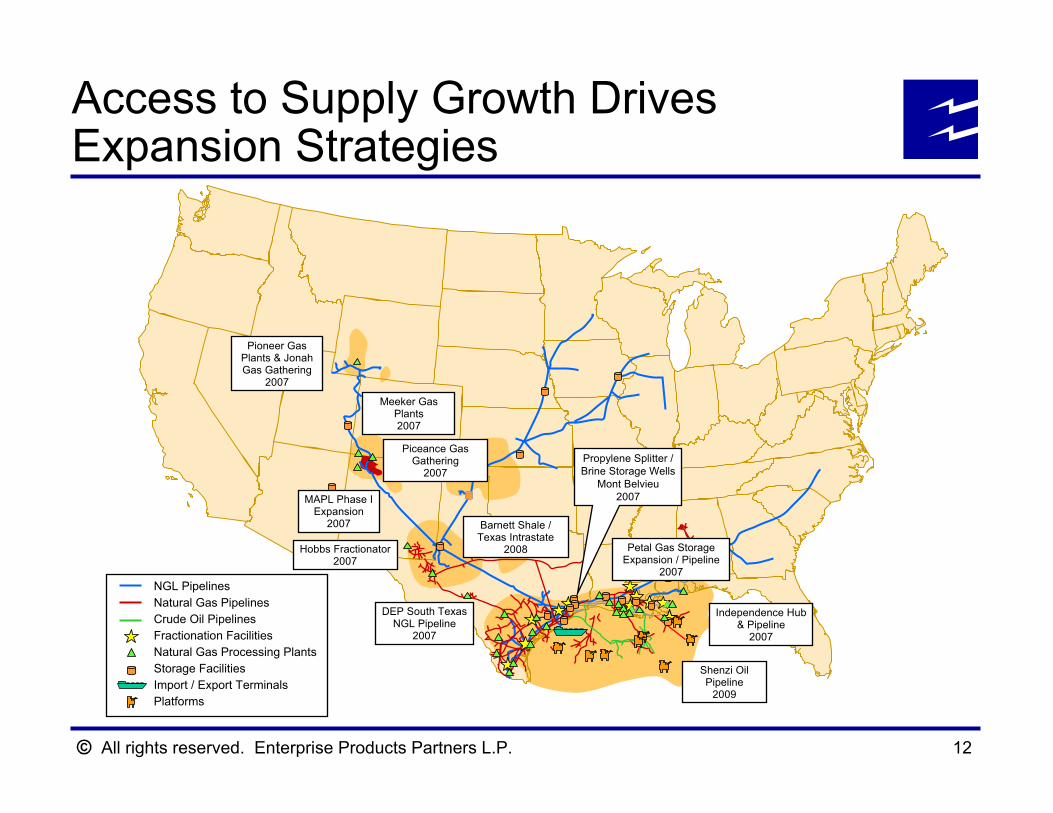
Access to Supply Growth Drives Expansion Strategies
Pioneer Gas Plants & Jonah Gas Gathering
2007
Petal Gas StorageExpansion / Pipeline
2007
DEP South TexasNGL Pipeline
2007
Shenzi Oil Pipeline
2009
Independence Hub& Pipeline
2007
Meeker Gas Plants2007
Hobbs Fractionator2007
NGL PipelinesNatural Gas PipelinesCrude Oil PipelinesFractionation FacilitiesNatural Gas Processing PlantsStorage FacilitiesImport / Export TerminalsPlatforms
Piceance Gas Gathering
2007Propylene Splitter / Brine Storage Wells
Mont Belvieu2007MAPL Phase I
Expansion 2007 Barnett Shale /
Texas Intrastate2008
All rights reserved. Enterprise Products Partners L.P. 13
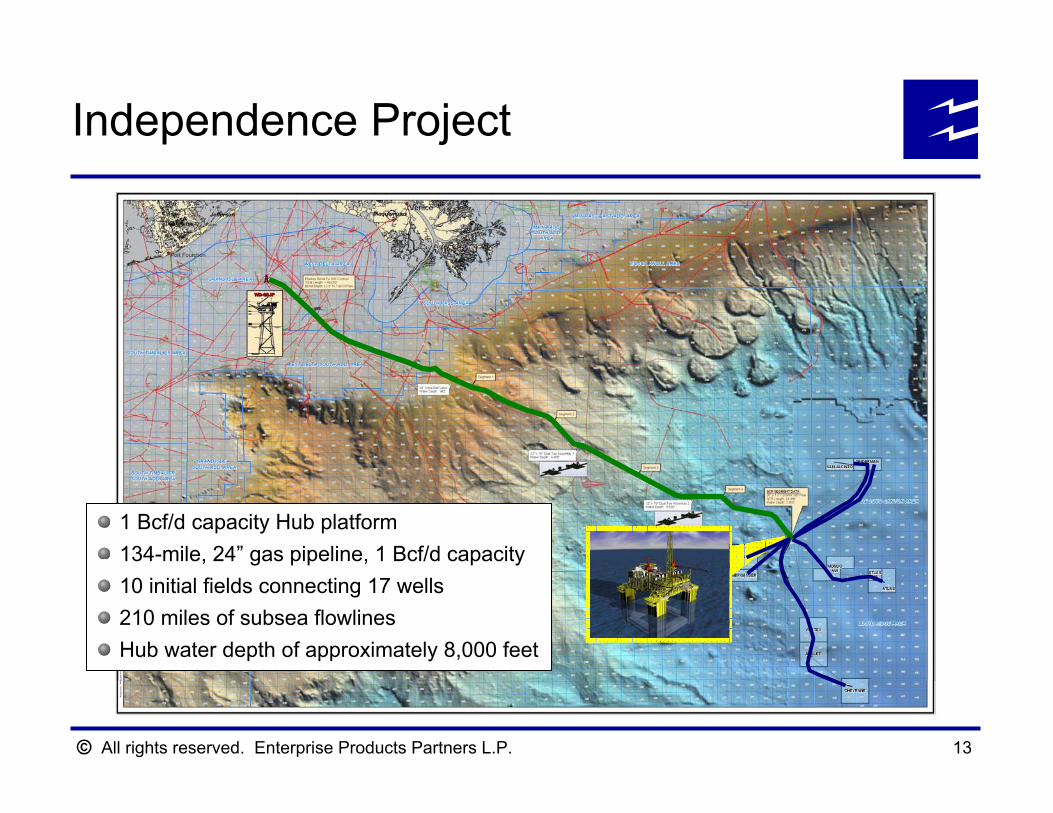
Independence Project
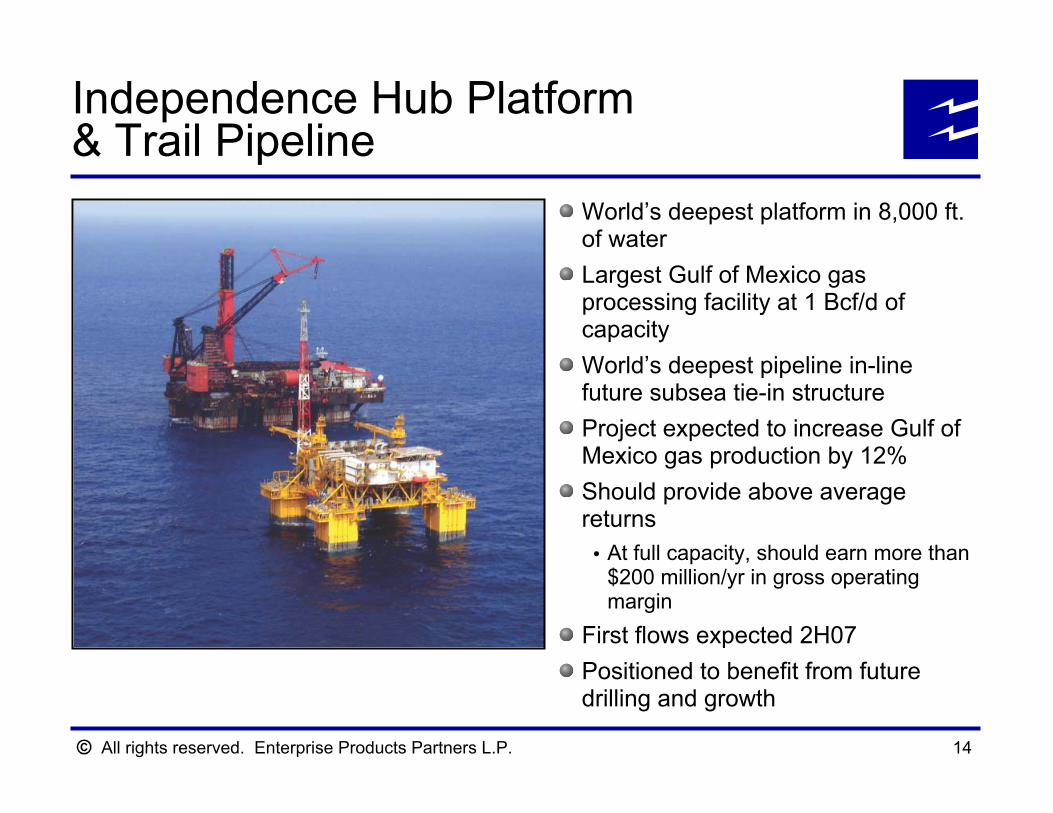
1 Bcf/d capacity Hub platform134-mile, 24” gas pipeline, 1 Bcf/d capacity10 initial fields connecting 17 wells210 miles of subsea flowlinesHub water depth of approximately 8,000 feet
All rights reserved. Enterprise Products Partners L.P. 14
Independence Hub Platform & Trail Pipeline
World’s deepest platform in 8,000 ft. of waterLargest Gulf of Mexico gas processing facility at 1 Bcf/d of capacityWorld’s deepest pipeline in-line future subsea tie-in structureProject expected to increase Gulf of Mexico gas production by 12%Should provide above average returns
At full capacity, should earn more than $200 million/yr in gross operating margin
First flows expected 2H07Positioned to benefit from future drilling and growth
All rights reserved. Enterprise Products Partners L.P. 15
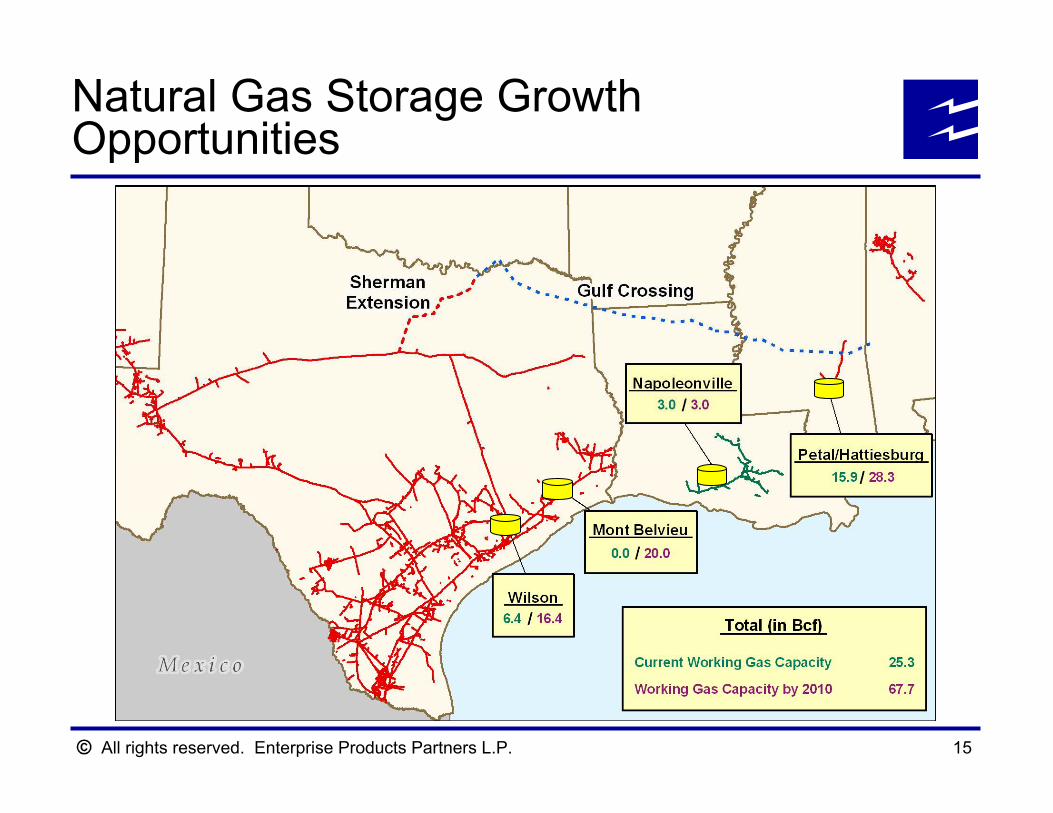
Natural Gas Storage Growth Opportunities
All rights reserved. Enterprise Products Partners L.P. 16
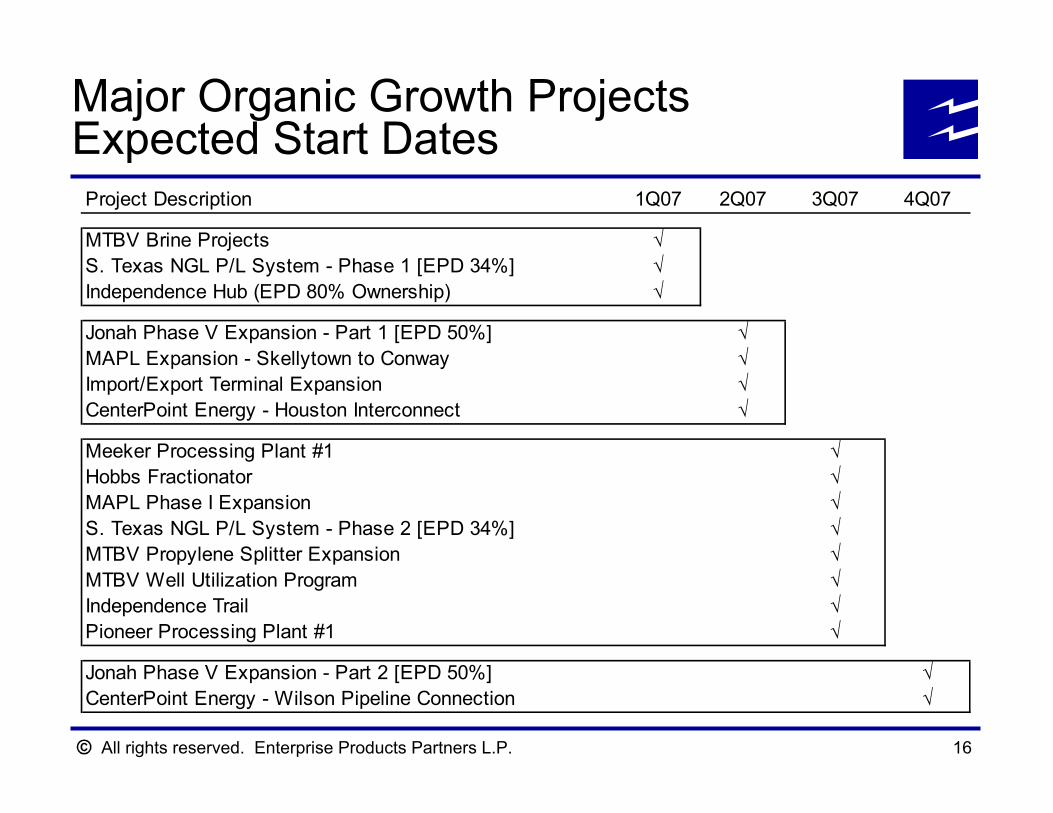
Project Description 1Q07 2Q07 3Q07 4Q07
MTBV Brine Projects √S. Texas NGL P/L System - Phase 1 [EPD 34%] √Independence Hub (EPD 80% Ownership) √
Jonah Phase V Expansion - Part 1 [EPD 50%] √MAPL Expansion - Skellytown to Conway √Import/Export Terminal Expansion √CenterPoint Energy - Houston Interconnect √
Meeker Processing Plant #1 √Hobbs Fractionator √MAPL Phase I Expansion √S. Texas NGL P/L System - Phase 2 [EPD 34%] √MTBV Propylene Splitter Expansion √MTBV Well Utilization Program √Independence Trail √Pioneer Processing Plant #1 √
Jonah Phase V Expansion - Part 2 [EPD 50%] √CenterPoint Energy - Wilson Pipeline Connection √
Major Organic Growth Projects Expected Start Dates

All rights reserved. Enterprise Products Partners L.P.
Financial Overview
All rights reserved. Enterprise Products Partners L.P. 18
Maintain a strong balance sheet and credit metrics that support investment grade credit ratings
Key financial objective since IPOIncrease cash flows from fee-based businessesPrudently invest to expand the partnership through organic growth, acquisitions and joint ventures with strategic partners Manage capital and distributable cash flow to strengthen balance sheet and provide financial flexibility
Financial Objectives
All rights reserved. Enterprise Products Partners L.P. 19
Financial discipline while executing EPD’s growth strategyFinanced 56% of $14.2 billion in capital investment since 1999 with equity (including estimate for 2007)Retired $1.2 billion acquisition term loan used to finance the acquisition of the Mid-America and Seminole Pipelines in less than 7 months (5 months ahead of schedule)Financed 65% of $6 billion GTM merger with equitySuccessfully and rapidly integrated businesses after GTM merger
– Refinanced GTM debt to reduce annual interest expense by approximately $50 million– Recognized merger synergies well in excess of street expectations
Strong track record of management supportEPCO, its affiliates and management have invested approximately $450 million in new equity issues since EPD’s IPOEliminated 50% GP IDRs
Strong coverage of distributions to limited partners – 1.2x coverage since 1999
History of Financial Discipline
All rights reserved. Enterprise Products Partners L.P. 20
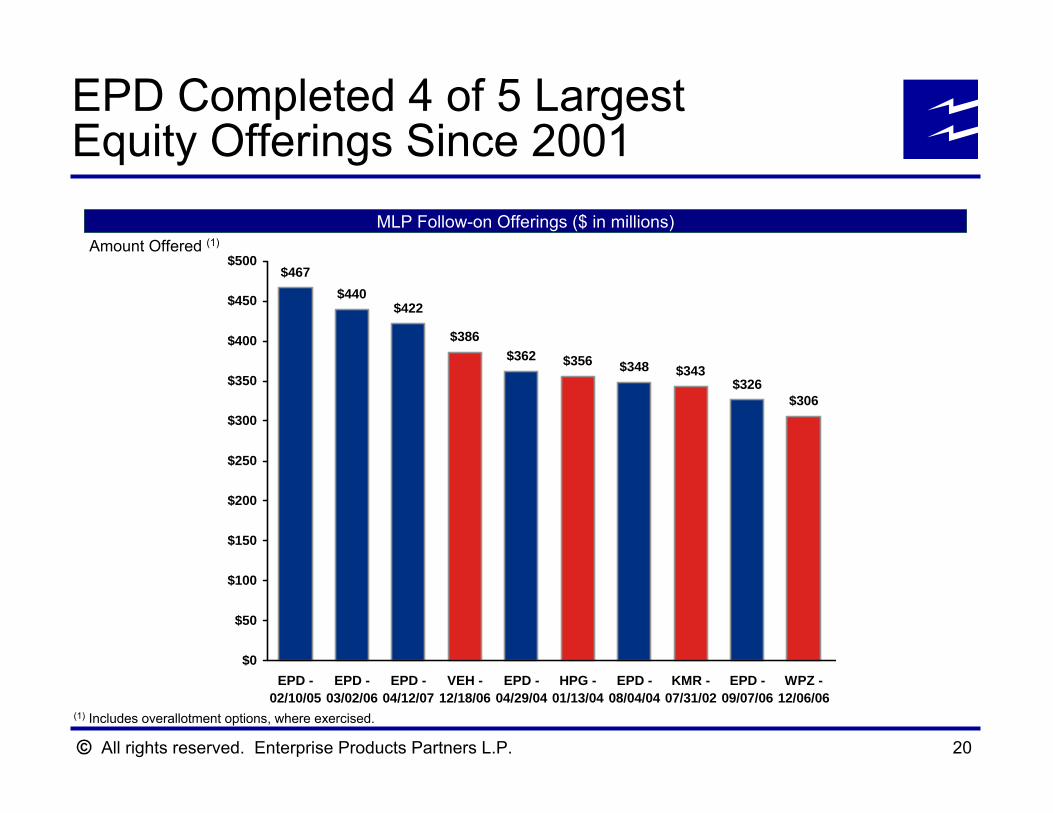
MLP Follow-on Offerings ($ in millions)
(1) Includes overallotment options, where exercised.
EPD Completed 4 of 5 Largest Equity Offerings Since 2001
Amount Offered (1)
$467$440
$422
$386$362 $356 $348 $343
$326$306
$0
$50
$100
$150
$200
$250
$300
$350
$400
$450
$500
EPD -02/10/05
EPD -03/02/06
EPD -04/12/07
VEH -12/18/06
EPD -04/29/04
HPG -01/13/04
EPD -08/04/04
KMR -07/31/02
EPD -09/07/06
WPZ -12/06/06
All rights reserved. Enterprise Products Partners L.P. 21
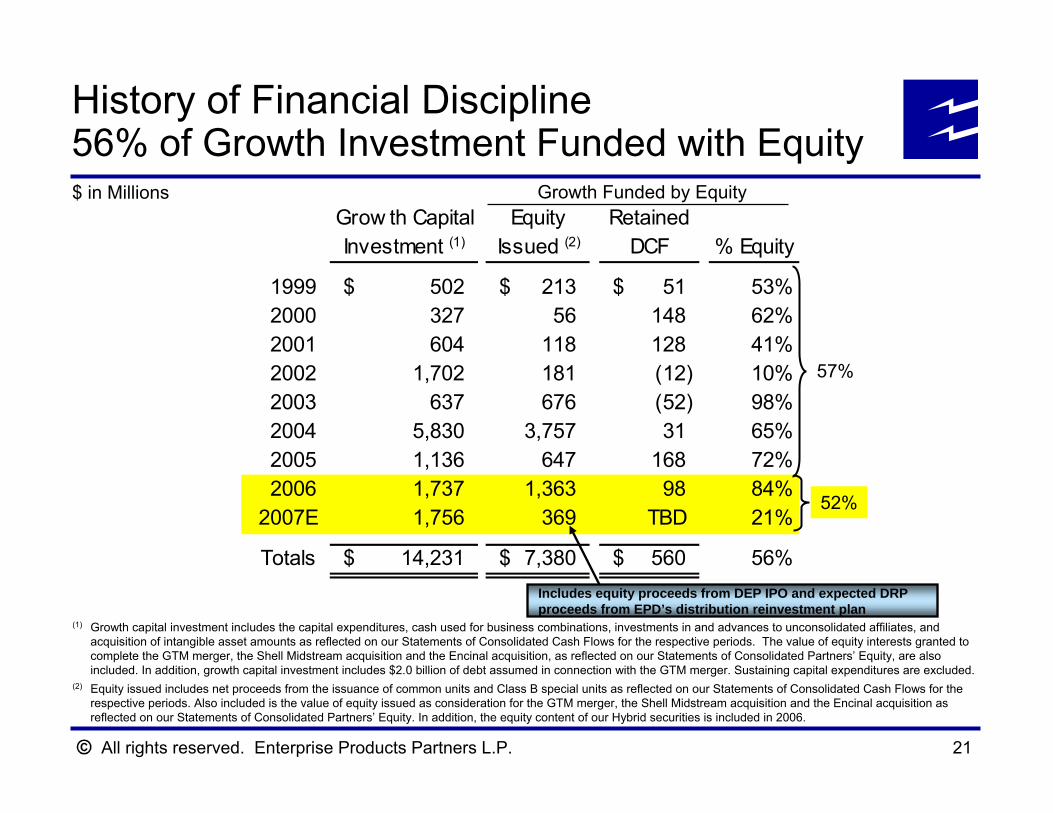
History of Financial Discipline56% of Growth Investment Funded with Equity
(1) Growth capital investment includes the capital expenditures, cash used for business combinations, investments in and advances to unconsolidated affiliates, and acquisition of intangible asset amounts as reflected on our Statements of Consolidated Cash Flows for the respective periods. The value of equity interests granted to complete the GTM merger, the Shell Midstream acquisition and the Encinal acquisition, as reflected on our Statements of Consolidated Partners’ Equity, are also included. In addition, growth capital investment includes $2.0 billion of debt assumed in connection with the GTM merger. Sustaining capital expenditures are excluded.
(2) Equity issued includes net proceeds from the issuance of common units and Class B special units as reflected on our Statements of Consolidated Cash Flows for the respective periods. Also included is the value of equity issued as consideration for the GTM merger, the Shell Midstream acquisition and the Encinal acquisition as reflected on our Statements of Consolidated Partners’ Equity. In addition, the equity content of our Hybrid securities is included in 2006.
$ in MillionsGrow th Capital Equity RetainedInvestment (1) Issued (2) DCF % Equity
1999 502$ 213$ 51$ 53%2000 327 56 148 62%2001 604 118 128 41%2002 1,702 181 (12) 10%2003 637 676 (52) 98%2004 5,830 3,757 31 65%2005 1,136 647 168 72%2006 1,737 1,363 98 84%
2007E 1,756 369 TBD 21%
Totals 14,231$ 7,380$ 560$ 56%
52%
57%
Growth Funded by Equity
Includes equity proceeds from DEP IPO and expected DRP proceeds from EPD’s distribution reinvestment plan
All rights reserved. Enterprise Products Partners L.P. 22
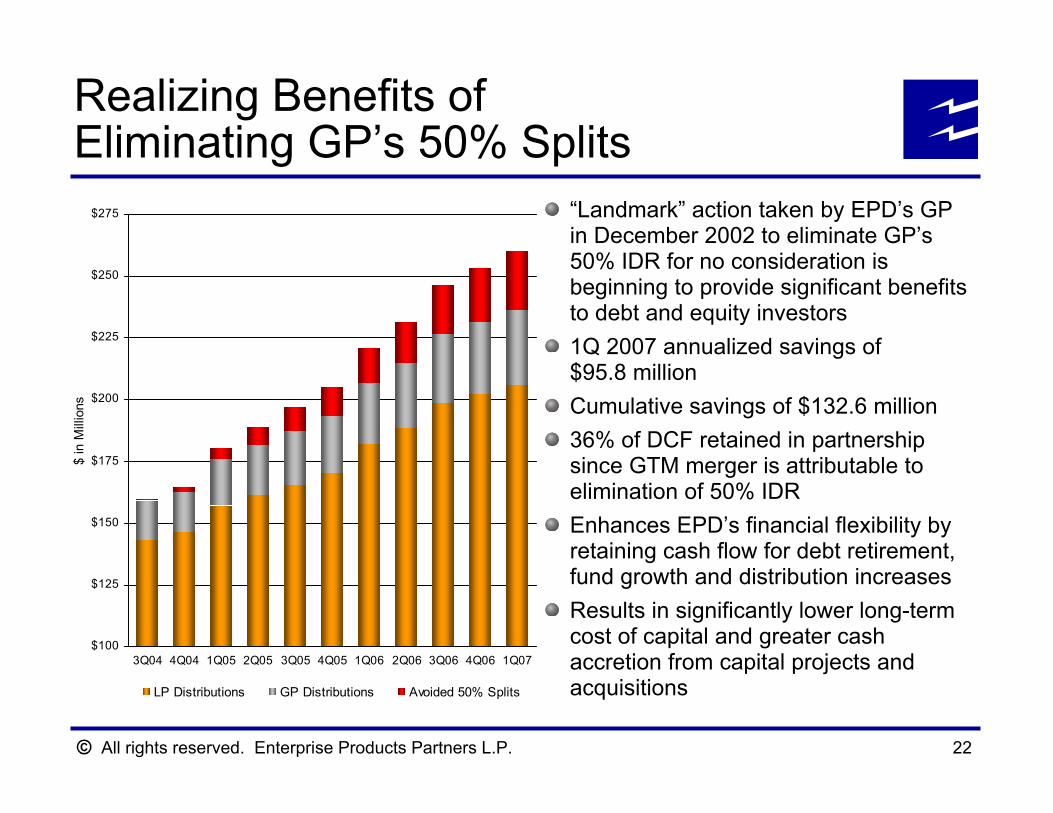
Realizing Benefits ofEliminating GP’s 50% Splits
$100
$125
$150
$175
$200
$225
$250
$275
3Q04 4Q04 1Q05 2Q05 3Q05 4Q05 1Q06 2Q06 3Q06 4Q06 1Q07
$ in
Mill
ions
LP Distributions GP Distributions Avoided 50% Splits
“Landmark” action taken by EPD’s GP in December 2002 to eliminate GP’s 50% IDR for no consideration is beginning to provide significant benefits to debt and equity investors1Q 2007 annualized savings of $95.8 millionCumulative savings of $132.6 million36% of DCF retained in partnership since GTM merger is attributable to elimination of 50% IDREnhances EPD’s financial flexibility by retaining cash flow for debt retirement, fund growth and distribution increasesResults in significantly lower long-term cost of capital and greater cash accretion from capital projects and acquisitions
All rights reserved. Enterprise Products Partners L.P. 23
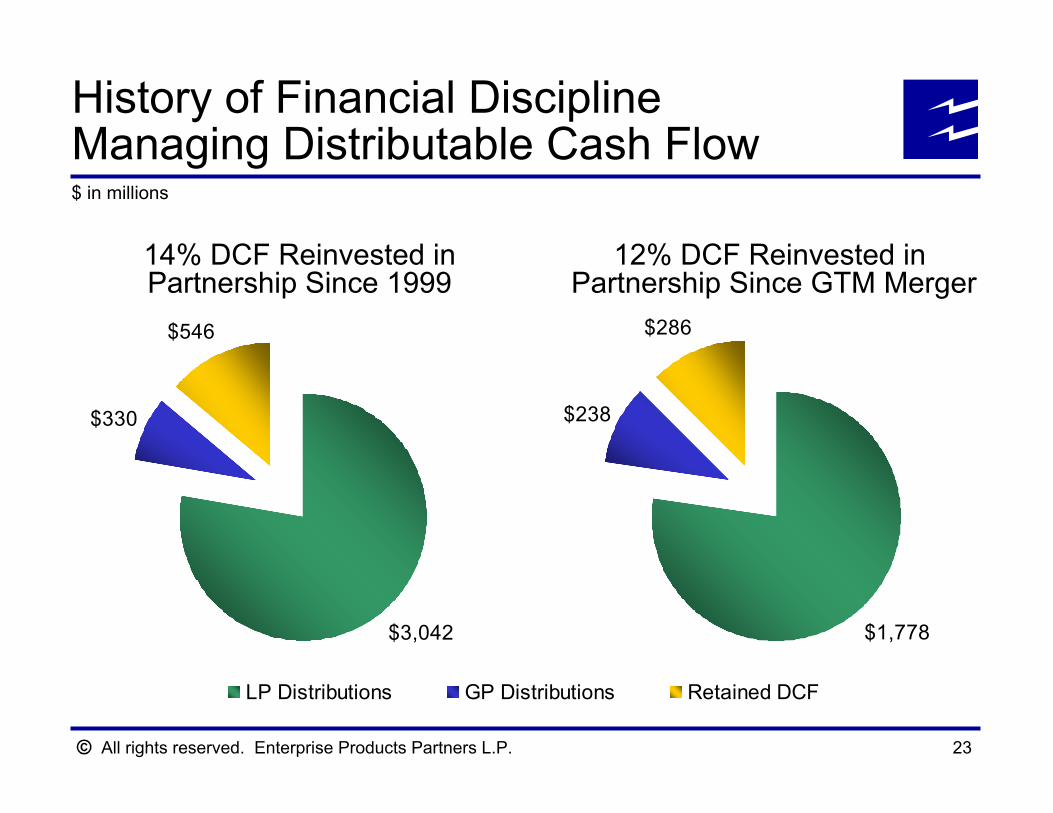
History of Financial DisciplineManaging Distributable Cash Flow
$1,778
$238
$286
$3,042
$330
$546
LP Distributions GP Distributions Retained DCF
14% DCF Reinvested inPartnership Since 1999
$ in millions
12% DCF Reinvested in Partnership Since GTM Merger
All rights reserved. Enterprise Products Partners L.P. 24
Issuance of Hybrids Provides Additional Financial Flexibility
Description$550 Million Principal Amount Long-Term Junior Subordinated Notes – 60 Year Maturity; Fixed coupon 8.375% first 10 years Partial equity treatment by rating agencies
– 75% Fitch; 50% Moody’s and S&P – Allow 10–15% of book capitalization in Hybrids
EPD RationaleProvide financial flexibility by broadening and diversifying sources of debt and equity capitalPartial equity treatment by rating agencies, allows for larger security issuances and decreases equity overhang issues making future equity offerings more attractiveProvide additional layer of protection for senior debt holders
All rights reserved. Enterprise Products Partners L.P. 25
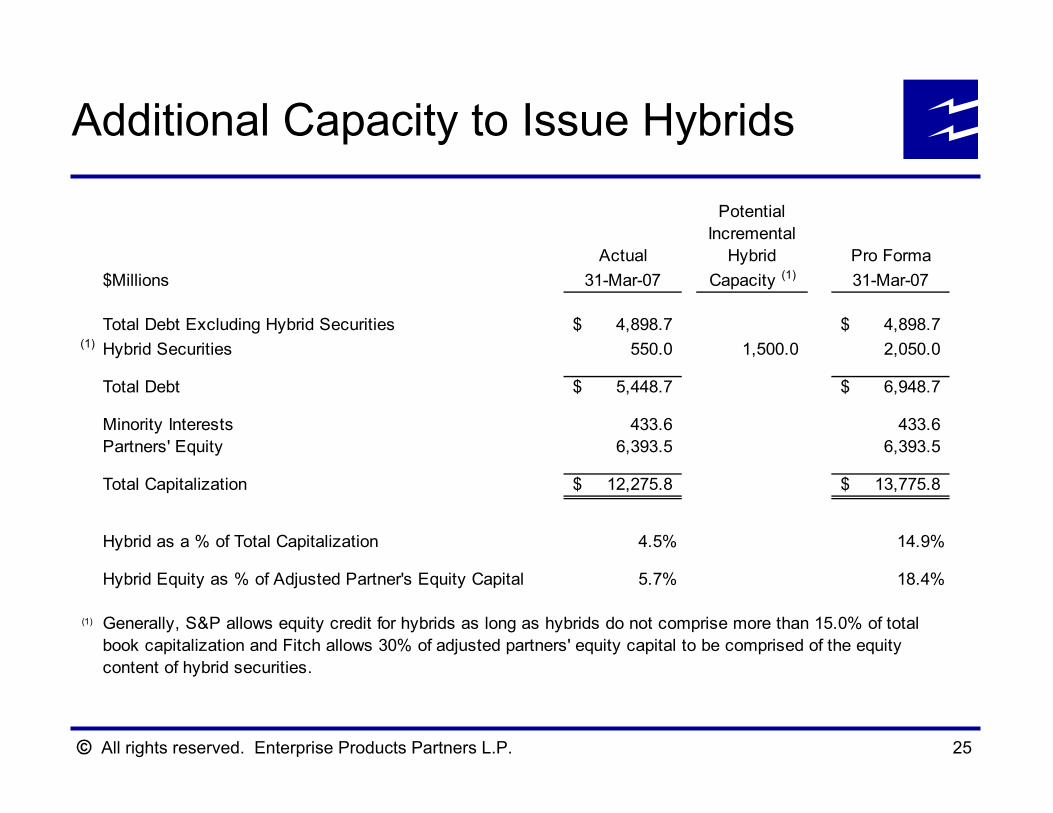
Additional Capacity to Issue Hybrids
PotentialIncremental
Actual Hybrid Pro Forma$Millions 31-Mar-07 Capacity (1) 31-Mar-07
Total Debt Excluding Hybrid Securities 4,898.7$ 4,898.7$ (1) Hybrid Securities 550.0 1,500.0 2,050.0
Total Debt 5,448.7$ 6,948.7$
Minority Interests 433.6 433.6 Partners' Equity 6,393.5 6,393.5
Total Capitalization 12,275.8$ 13,775.8$
Hybrid as a % of Total Capitalization 4.5% 14.9%
Hybrid Equity as % of Adjusted Partner's Equity Capital 5.7% 18.4%
(1) Generally, S&P allows equity credit for hybrids as long as hybrids do not comprise more than 15.0% of totalbook capitalization and Fitch allows 30% of adjusted partners' equity capital to be comprised of the equity content of hybrid securities.
All rights reserved. Enterprise Products Partners L.P. 26
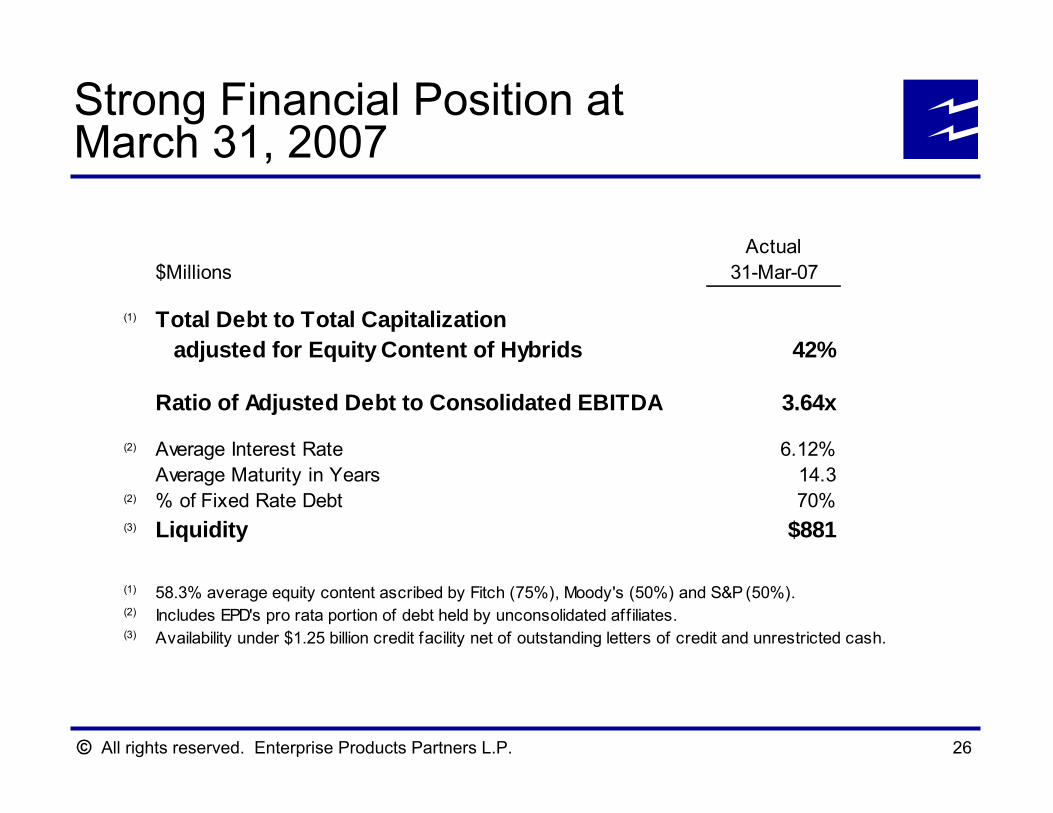
Strong Financial Position at March 31, 2007
Actual$Millions 31-Mar-07
(1) Total Debt to Total Capitalization adjusted for Equity Content of Hybrids 42%
Ratio of Adjusted Debt to Consolidated EBITDA 3.64x
(2) Average Interest Rate 6.12%Average Maturity in Years 14.3
(2) % of Fixed Rate Debt 70%(3) Liquidity $881
(1) 58.3% average equity content ascribed by Fitch (75%), Moody's (50%) and S&P (50%).(2) Includes EPD's pro rata portion of debt held by unconsolidated affiliates.(3) Availability under $1.25 billion credit facility net of outstanding letters of credit and unrestricted cash.
All rights reserved. Enterprise Products Partners L.P. 27
2007 Outlook
Another year of strong operating fundamentalsSignificant new projects begin operations
$44 million of annualized demand charges net to EPD at Independence Hub platform began mid-March 2007First production to Independence Hub and Trail and majority of other projects expected to commence in 2H 2007 and start to contribute cash flow late 2007 and 2008Ramp up of new projects in 2007 are key for improving on record 2006 performance
New opportunities to increase cash flow from organic growth projects that integrate with our large base of assets
All rights reserved. Enterprise Products Partners L.P.
Non-GAAP Reconciliations
All rights reserved. Enterprise Products Partners L.P. 29
Non-GAAP Reconciliations
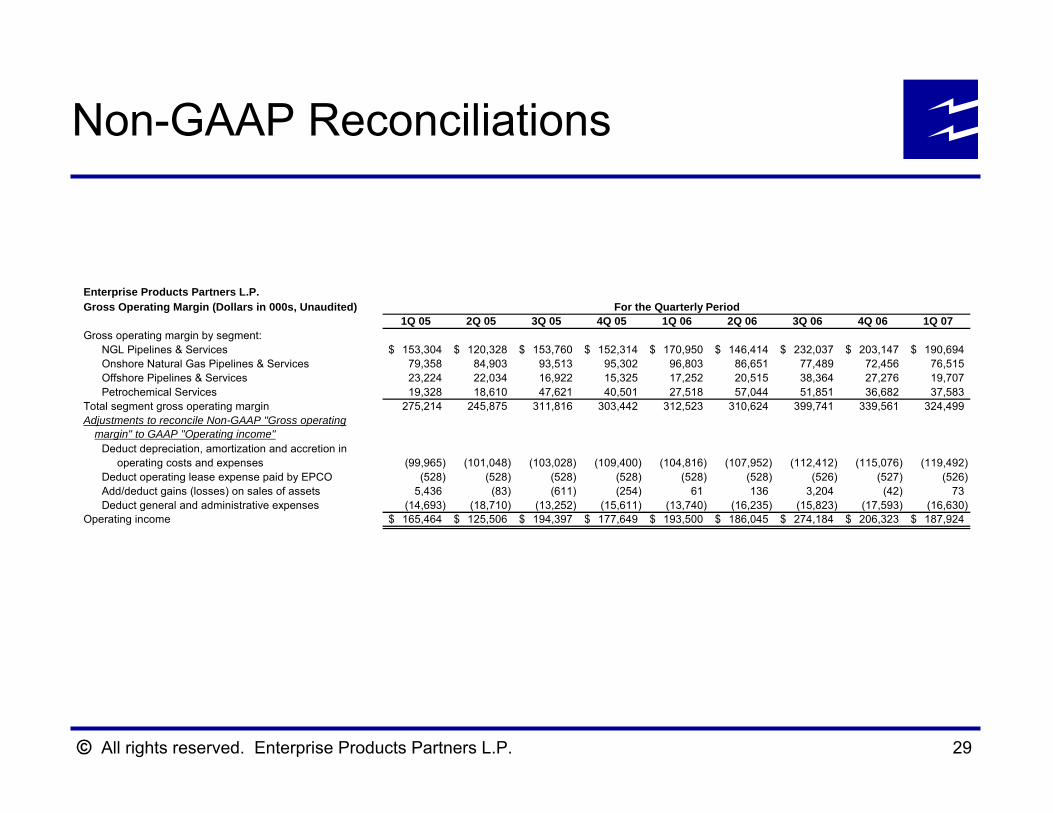
Enterprise Products Partners L.P.Gross Operating Margin (Dollars in 000s, Unaudited)
1Q 05 2Q 05 3Q 05 4Q 05 1Q 06 2Q 06 3Q 06 4Q 06 1Q 07Gross operating margin by segment:
NGL Pipelines & Services 153,304$ 120,328$ 153,760$ 152,314$ 170,950$ 146,414$ 232,037$ 203,147$ 190,694$ Onshore Natural Gas Pipelines & Services 79,358 84,903 93,513 95,302 96,803 86,651 77,489 72,456 76,515 Offshore Pipelines & Services 23,224 22,034 16,922 15,325 17,252 20,515 38,364 27,276 19,707 Petrochemical Services 19,328 18,610 47,621 40,501 27,518 57,044 51,851 36,682 37,583
Total segment gross operating margin 275,214 245,875 311,816 303,442 312,523 310,624 399,741 339,561 324,499 Adjustments to reconcile Non-GAAP "Gross operating margin" to GAAP "Operating income"
Deduct depreciation, amortization and accretion in operating costs and expenses (99,965) (101,048) (103,028) (109,400) (104,816) (107,952) (112,412) (115,076) (119,492) Deduct operating lease expense paid by EPCO (528) (528) (528) (528) (528) (528) (526) (527) (526) Add/deduct gains (losses) on sales of assets 5,436 (83) (611) (254) 61 136 3,204 (42) 73 Deduct general and administrative expenses (14,693) (18,710) (13,252) (15,611) (13,740) (16,235) (15,823) (17,593) (16,630)
Operating income 165,464$ 125,506$ 194,397$ 177,649$ 193,500$ 186,045$ 274,184$ 206,323$ 187,924$
For the Quarterly Period
All rights reserved. Enterprise Products Partners L.P. 30
Non-GAAP Reconciliations
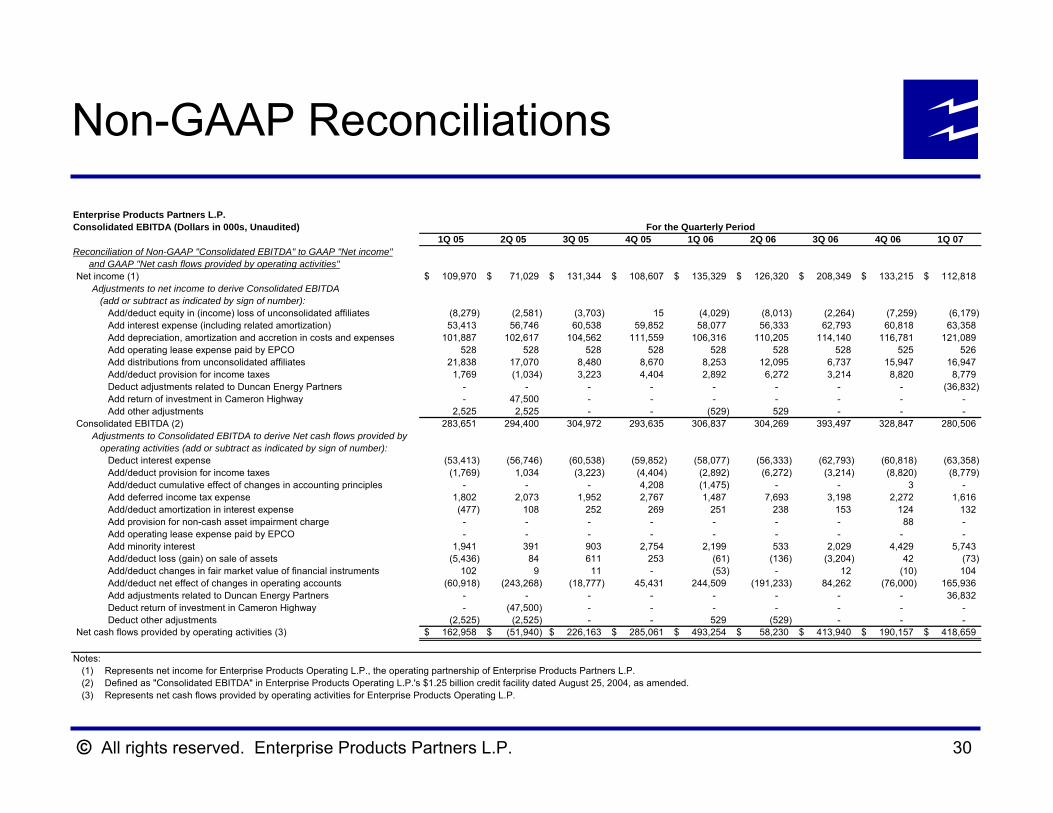
Enterprise Products Partners L.P.Consolidated EBITDA (Dollars in 000s, Unaudited)
1Q 05 2Q 05 3Q 05 4Q 05 1Q 06 2Q 06 3Q 06 4Q 06 1Q 07Reconciliation of Non-GAAP "Consolidated EBITDA" to GAAP "Net income"
and GAAP "Net cash flows provided by operating activities"Net income (1) 109,970$ 71,029$ 131,344$ 108,607$ 135,329$ 126,320$ 208,349$ 133,215$ 112,818$
Adjustments to net income to derive Consolidated EBITDA (add or subtract as indicated by sign of number):
Add/deduct equity in (income) loss of unconsolidated affiliates (8,279) (2,581) (3,703) 15 (4,029) (8,013) (2,264) (7,259) (6,179) Add interest expense (including related amortization) 53,413 56,746 60,538 59,852 58,077 56,333 62,793 60,818 63,358 Add depreciation, amortization and accretion in costs and expenses 101,887 102,617 104,562 111,559 106,316 110,205 114,140 116,781 121,089 Add operating lease expense paid by EPCO 528 528 528 528 528 528 528 525 526 Add distributions from unconsolidated affiliates 21,838 17,070 8,480 8,670 8,253 12,095 6,737 15,947 16,947 Add/deduct provision for income taxes 1,769 (1,034) 3,223 4,404 2,892 6,272 3,214 8,820 8,779 Deduct adjustments related to Duncan Energy Partners - - - - - - - - (36,832) Add return of investment in Cameron Highway - 47,500 - - - - - - - Add other adjustments 2,525 2,525 - - (529) 529 - - -
Consolidated EBITDA (2) 283,651 294,400 304,972 293,635 306,837 304,269 393,497 328,847 280,506 Adjustments to Consolidated EBITDA to derive Net cash flows provided by operating activities (add or subtract as indicated by sign of number):
Deduct interest expense (53,413) (56,746) (60,538) (59,852) (58,077) (56,333) (62,793) (60,818) (63,358) Add/deduct provision for income taxes (1,769) 1,034 (3,223) (4,404) (2,892) (6,272) (3,214) (8,820) (8,779) Add/deduct cumulative effect of changes in accounting principles - - - 4,208 (1,475) - - 3 - Add deferred income tax expense 1,802 2,073 1,952 2,767 1,487 7,693 3,198 2,272 1,616 Add/deduct amortization in interest expense (477) 108 252 269 251 238 153 124 132 Add provision for non-cash asset impairment charge - - - - - - - 88 - Add operating lease expense paid by EPCO - - - - - - - - - Add minority interest 1,941 391 903 2,754 2,199 533 2,029 4,429 5,743 Add/deduct loss (gain) on sale of assets (5,436) 84 611 253 (61) (136) (3,204) 42 (73) Add/deduct changes in fair market value of financial instruments 102 9 11 - (53) - 12 (10) 104 Add/deduct net effect of changes in operating accounts (60,918) (243,268) (18,777) 45,431 244,509 (191,233) 84,262 (76,000) 165,936 Add adjustments related to Duncan Energy Partners - - - - - - - - 36,832 Deduct return of investment in Cameron Highway - (47,500) - - - - - - - Deduct other adjustments (2,525) (2,525) - - 529 (529) - - -
Net cash flows provided by operating activities (3) 162,958$ (51,940)$ 226,163$ 285,061$ 493,254$ 58,230$ 413,940$ 190,157$ 418,659$
Notes:Represents net income for Enterprise Products Operating L.P., the operating partnership of Enterprise Products Partners L.P.Defined as "Consolidated EBITDA" in Enterprise Products Operating L.P.'s $1.25 billion credit facility dated August 25, 2004, as amended.Represents net cash flows provided by operating activities for Enterprise Products Operating L.P.
For the Quarterly Period
(3)
(1)(2)
All rights reserved. Enterprise Products Partners L.P. 31
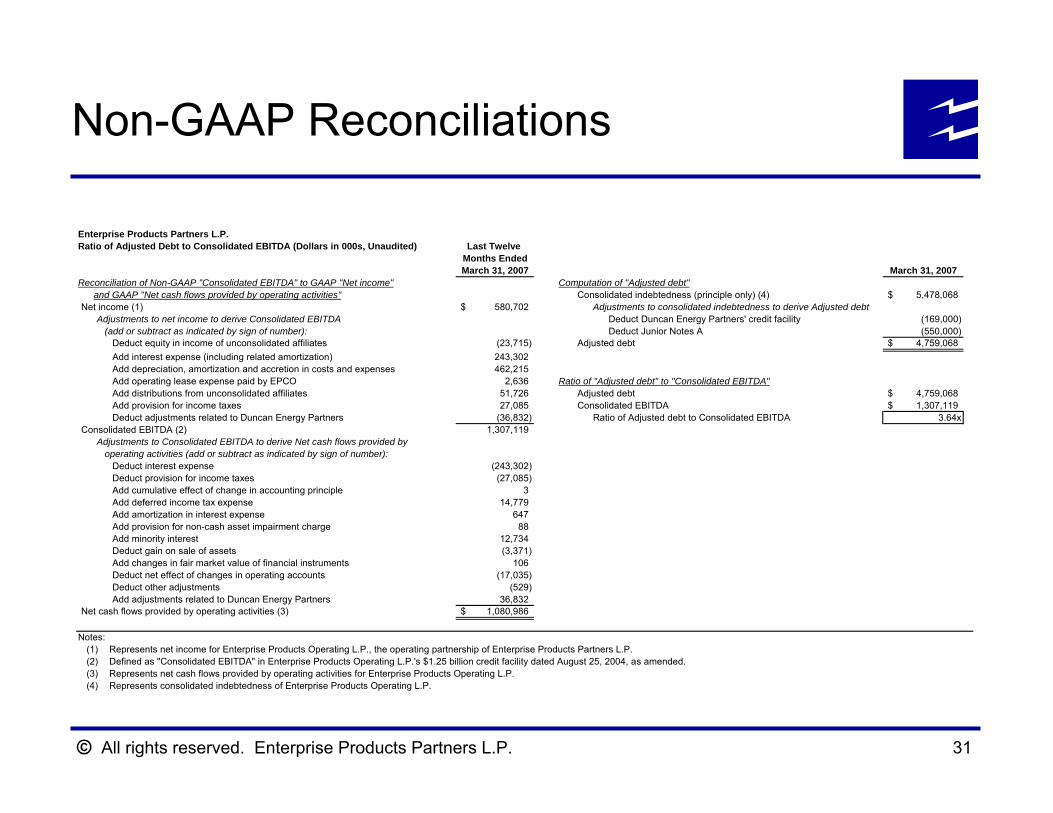
Non-GAAP Reconciliations
Enterprise Products Partners L.P.Ratio of Adjusted Debt to Consolidated EBITDA (Dollars in 000s, Unaudited) Last Twelve
Months EndedMarch 31, 2007 March 31, 2007
Reconciliation of Non-GAAP "Consolidated EBITDA" to GAAP "Net income" Computation of "Adjusted debt"and GAAP "Net cash flows provided by operating activities" Consolidated indebtedness (principle only) (4) 5,478,068$
Net income (1) 580,702$ Adjustments to consolidated indebtedness to derive Adjusted debtAdjustments to net income to derive Consolidated EBITDA Deduct Duncan Energy Partners' credit facility (169,000) (add or subtract as indicated by sign of number): Deduct Junior Notes A (550,000)
Deduct equity in income of unconsolidated affiliates (23,715) Adjusted debt 4,759,068$ Add interest expense (including related amortization) 243,302 Add depreciation, amortization and accretion in costs and expenses 462,215 Add operating lease expense paid by EPCO 2,636 Ratio of "Adjusted debt" to "Consolidated EBITDA"Add distributions from unconsolidated affiliates 51,726 Adjusted debt 4,759,068$ Add provision for income taxes 27,085 Consolidated EBITDA 1,307,119$ Deduct adjustments related to Duncan Energy Partners (36,832) Ratio of Adjusted debt to Consolidated EBITDA 3.64x
Consolidated EBITDA (2) 1,307,119 Adjustments to Consolidated EBITDA to derive Net cash flows provided by operating activities (add or subtract as indicated by sign of number):
Deduct interest expense (243,302) Deduct provision for income taxes (27,085) Add cumulative effect of change in accounting principle 3 Add deferred income tax expense 14,779 Add amortization in interest expense 647 Add provision for non-cash asset impairment charge 88 Add minority interest 12,734 Deduct gain on sale of assets (3,371) Add changes in fair market value of financial instruments 106 Deduct net effect of changes in operating accounts (17,035) Deduct other adjustments (529) Add adjustments related to Duncan Energy Partners 36,832
Net cash flows provided by operating activities (3) 1,080,986$
Notes:Represents net income for Enterprise Products Operating L.P., the operating partnership of Enterprise Products Partners L.P.Defined as "Consolidated EBITDA" in Enterprise Products Operating L.P.'s $1.25 billion credit facility dated August 25, 2004, as amended.Represents net cash flows provided by operating activities for Enterprise Products Operating L.P.Represents consolidated indebtedness of Enterprise Products Operating L.P.
(3)
(1)(2)
(4)