Embed Size (px)
Citation preview

Entrepreneurship among Disadvantaged Groups: An Analysis of the Dynamics of Self-Employment by Gender, Race, and Education
forthcoming in the Handbook of Entrepreneurship eds. Simon C. Parker, Zoltan J. Acs, and David R. Audretsch
Kluwer Academic Publishers
Robert W. Fairlie Department of Economics University of California Santa Cruz, CA 95060
(831) 459-3332 [email protected]
July 2005
1. Introduction
Policies to promote entrepreneurship and business ownership among disadvantaged
groups are widespread. In the United States, for example, there exist at least 650 non-profit
programs providing loans, training, and/or technical assistance to disadvantaged entrepreneurs
(Aspen Institute 2002). Many countries have programs providing financial and other assistance
to the unemployed to start businesses.1 Several states in the United States also have programs
providing transfers to unemployment insurance recipients and programs promoting self-
employment as a way to leave the welfare rolls (Vroman 1997, Kosanovich et al. 2001, Guy,
Doolittle, and Fink 1991, and Raheim 1997). The federal government and several states have
also promoted self-employment as a way to leave the welfare rolls.
There also exist a large number of federal, state and local government programs
providing set-asides and loans to minorities, women, and other disadvantaged groups.2 These
affirmative action programs, which target government contracts for disadvantaged and minority-
owned firms, have been and continue to be extremely controversial. During the late 1970s and
1980s there was tremendous growth in the value of federal, state, and local government contracts
reserved for minority-owned businesses in the United States. The purpose of these set-aside
programs was to develop minority enterprise, counter the effects of past discrimination, and
reduce unemployment among minorities. For the last 15 years, however, the state and local
programs established in the 1980s have been both judicially and legislatively challenged and in
many cases dismantled. The constitutionality of government-sponsored set-aside programs has
been seriously questioned with the 1989 Richmond v. J.A. Croson Co. and 1995 Adarand
Constructors Inc. v. Peña U.S. Supreme Court decisions.
The interest in entrepreneurship and business development programs has been spurred by
arguments from academicians and policymakers that entrepreneurship provides a route out of
1 See OECD (1992) for descriptions of programs in Beligium, Canada, Finland, France, Greece, Netherlands, Portugal, Spain and the United Kingdom. 2 See Bates (1993) for a description of programs promoting self-employment among minorities.
2
poverty and an alternative to unemployment or discrimination in the labor market.3 For example,
Glazer and Moynihan (1970, p. 36) argue that "business is in America the most effective form of
social mobility for those who meet prejudice." Proponents also note that many disadvantaged
groups facing discrimination or blocked opportunities in the wage/salary sector have used
business ownership as a source of economic advancement. It has been argued, for example, that
the economic success of earlier immigrant groups in the United States, such as the Chinese,
Japanese, Jews, Italians, and Greeks, is in part due to their ownership of small businesses (See
Loewen 1971, Light 1972, Baron et al. 1975, and Bonacich and Modell 1980). More recently,
Koreans have purportedly used business ownership for economic mobility (Min 1989, 1993).
Finally, stimulating business creation in sectors with high growth potential (e.g., construction,
wholesale trade, and business services) may represent an effective public policy for promoting
economic development and job creation in poor neighborhoods (Bates 1993).
The desire for entrepreneurship is also strong in many countries around the world. When
individuals are asked the question of whether they would prefer "being an employee or being self-
employed" a large percentage reported "self-employment (Blanchflower, Oswald and Stutzer
2001)." Slightly more than 70 percent of respondents in the United States express a desire to be
self-employed. In many other countries, including Germany, Italy and Canada for example, more
than half of all individuals reported a desire for self-employment.4 Interest in self-employment is
also strong among disadvantaged groups. More than 60 percent of young women and 75 percent
of young blacks report being interested in starting their own business (Kourilsky and Walstad
1998 and Walstad and Kourilsky 1998). Among young men and whites, 72 and 63 percent of
respondents are interested in starting a business. Although many disadvantaged individuals may
possess a strong desire for entrepreneurship, they ultimately do not operate successful small
3 See Glazer and Moynihan (1970), Light (1972, 1979), Sowell (1981), and Moore (1983). 4 Job satisfaction is also much higher among the self-employed than wage/salary workers (Blanchflower, Oswald and Stutzer 2001).
3
businesses due to a lack of knowledge of business opportunities, sector-specific human capital,
and financial capital.
In this study, I examine entrepreneurship patterns among several disadvantaged groups. I
first document rates of business ownership using microdata from the U.S. Current Population
Survey (CPS) and U.S. Census, and aggregate data from the OECD Labour Force Statistics,
Canadian Census, and British Census making comparisons to more advantaged groups. New
estimates of self-employment rates for several ethnic and racial groups from the Canadian, U.K.
and U.S. Censuses are presented. Next, using microdata from the CPS, I explore differences in
entry rates into and exit rates out of self-employment across groups. This dynamic approach is
useful for identifying the causes of differences in self-employment rates between groups and
changes over time in self-employment rates. In previous research, I use this approach to analyze
the causes of black/white differences in business ownership rates in the United States (Fairlie
1999). I also use a non-linear decomposition technique to identify the contributions from racial
and ethnic differences in education, assets and other factors to gaps in self-employment entry and
exit rates.
Several major disadvantaged groups are analyzed in this study -- women, blacks, Latinos,
Native Americans, immigrants, and the less-educated. All of these groups have substantially
lower earnings than their more advantaged counterparts. Among year-round, full-time workers,
women earn only 66 percent of what men earn (U.S. Bureau of the Census 2004). Latinos,
blacks, and Native Americans earn only 2/3 to 3/4 of the earnings of white, non-Latinos.5
Immigrants earn 90 percent of natives, and high school dropouts earn only 43 percent of college-
educated workers. Most of these groups have also been targeted by set-aside programs in the
United States. As discussed below, extensive literatures on female, minority and immigrant
entrepreneurship currently exist and a relatively small literature is emerging on less-educated
5 A comparison of poverty rates reveals even more alarming differences. The Latino, black and Native American poverty rates range from 2.8 to 3.1 times the white, non-Latino poverty rate (U.S. Bureau of the Census 2003).
4
entrepreneurs. The lack of research on less-educated workers is somewhat surprising as this
group also faces limited opportunities in the wage/salary sector and has experienced declining
wages relative to the wages of their college-educated counterparts.6 Furthermore, similar to other
disadvantaged groups limited access to capital may represent a significant barrier to
entrepreneurial success for this group.
2. Business Ownership among Disadvantaged Groups
Using data from the Current Population Survey (CPS) Annual Demographic Files (ADF),
I first examine patterns of self-employment across several disadvantaged groups. These surveys,
conducted annually by the U.S. Bureau of the Census and the Bureau of Labor Statistics, are
representative of the entire U.S. population and contain observations for more than 130,000
people. Several recent years of the ADFs are combined to increase the precision of estimates,
especially for smaller groups.
Self-employed workers are defined as those individuals who identify themselves as self-
employed in their own not incorporated or incorporated business on the class of worker question.7
The class of worker question refers to the job with the most hours during the reference week. I
restrict the sample to include only prime-age individuals (ages 25 to 55) to lessen concerns
regarding schooling and retirement decisions.
Table 1 reports estimates of self-employment ratios and rates by sex, race/ethnicity,
immigrant status, and education level. The self-employment ratio is defined as the percent of all
individuals ages 25-55 who report being a self-employed business owner. The self-employment
rate conditions on employment. For both measures, women have substantially lower levels of
self-employment than men. Although female self-employment rates have risen dramatically in
recent decades (see Aronson 1991, Devine 1994a, U.S. Small Business Administration 1998, and
6 See Levy and Murname (1992) and Katz and Autor (1999) for reviews of the literature on wage inequality. 7 Unpaid family workers are not counted as self-employed.
5
Fairlie 2004 for example), the prevalence of business ownership among women is only 50-60
percent of that for men.
The low rate of self-employment among women permeates across ethnic/racial groups
and countries. Estimates from the 1990 Census indicate that female self-employment rates are
typically around 55 percent of male rates within detailed ethnic/racial groups and rarely deviate
from this ratio (Fairlie and Meyer 1996). In fact, of the 60 detailed ethnic/racial groups studied
only 4 groups have female/male self-employment rate ratios that lie outside the range of 0.35 to
0.75. British data reveal a similar pattern of low rates among women within ethnic groups
although the ratios of female to male rates are generally lower than in the United States.
Estimates from the Fourth National Survey of Ethnic Minorities indicate that female/male ratios
ranging from 0.22 to 0.63 with the exception of the Chinese ratio of 0.88 (Clark and Drinkwater
2000).
An examination of aggregate data from the OECD also indicates that women are less
likely to be self-employed than men for every reported country. Table 2 reports estimates of the
percent of all workers who are self-employed in all industries and non-agricultural industries for
men and women. Although self-employment rates vary substantially across countries, female
rates are substantially lower than male rates in almost every reported country. The average and
median female/male self-employment rate ratios across all countries are 0.543 and 0.548 percent,
respectively. Several countries have female self-employment rates that are roughly one third
male rates, and only Canada, Mexico and the United States have female/male self-employment
rate ratios greater than 0.7. The U.S. female/male self-employment rate ratio also appears to be
inflated because incorporated business owners are not included in the OECD estimates for the
United States. Estimates from the CPS reported in Table 1 indicate a U.S. female/male self-
employment rate ratio of 0.613. Clearly, women are substantially less likely to be self-employed
6
than are men, which is quite consistent around the world and across different ethnic/racial
groups.8
Returning to estimates from the CPS reported in Table 1, a clear ordering of self-
employment propensities across ethnic and racial groups emerges. White, non-Latinos and
Asians have the highest self-employment rates and ratios. Among white, non-Latinos, 10.7
percent of the population ages 25-55 is self-employed and 12.8 percent of the workforce is self-
employed. The Asian self-employment rate and ratio are slightly lower. Relative to these two
groups, blacks, Native Americans and Latinos are much less likely to be self-employed. The
likelihood of business ownership among Latinos is only slightly higher than 50 percent of that for
white, non-Latinos. Native Americans have even lower levels of business ownership. Finally, of
the five ethnic/racial groups identified in this analysis blacks have the lowest rates of business
ownership. For example, the black self-employment ratio of 3.8 percent is roughly one-third the
white self-employment ratio. Similarly low rates of black business ownership date back to at
least 1910 (see Fairlie and Meyer 2000). Clearly, the three major disadvantaged minority groups
in the United States -- blacks, Latinos and Native Americans -- are substantially underrepresented
in business ownership.
The ordering of self-employment rates across ethnic/racial groups is similar to that
reported in previous studies using alternative data sources and years. These include, but are not
limited to, estimates for some or all groups from the 1980 Census (Borjas 1986, Borjas and
Bronars 1989, Light and Rosenstein 1995), the 1990 Census (Fairlie and Meyer 1996 and Razin
and Light 1998), the General Social Survey (Hout and Rosen 2000), the Panel Study of Income
Dynamics (Fairlie 1999), and the Survey of Income and Program Participation (Meyer 1990,
Bates 1997).
8 Estimates from the CPS also indicate that women have substantially lower rates of self-employment than men even after stratifying the sample by the presence of children, marital status, full-time or part-time status, education level, and age group.

7
Using aggregate data from the 2001 Canadian and U.K. Censuses and microdata from the
2000 U.S. Census, I provide new estimates of self-employment rates for several ethnic and racial
groups (see Table 3).9 All ethnic/racial groups that are roughly comparable for at least two of the
three countries selected. Black self-employment rates are higher in the United Kingdom than in
Canada and the United States, but remain relatively low. Even in the United Kingdom, where 8.3
percent of blacks are self-employed business owners, this represents less than 2/3rd the white rate
of business ownership. Two additional disadvantaged groups -- Latinos and Natives -- have
similarly low self-employment rates in both Canada and the United States. For example, only 7.2
percent of Latinos are self-employed business owners in the United States and 7.9 percent of
Latinos in Canada are self-employed.
There exists substantial heterogeneity across Asian groups. Only 3.6 and 5.0 percent of
Filipinos are self-employed in Canada and the United States, respectively. In contrast, 32.3
percent of Koreans are self-employed business owners in Canada and 23.8 percent of Koreans are
self-employed in the United States. Another interesting finding is that Chinese, Indians, and all
Asians have substantially higher rates of business ownership in the United Kingdom than in
Canada and the United States.
The estimates reported in Table 3 indicate a clear pattern in ethnic/racial entrepreneurship
-- disadvantaged groups, such as blacks, Latinos and Natives, have relatively low rates of
business ownership in all of the countries reported. Thus, low rates of business ownership among
these ethnic/racial groups are not peculiar to the United States or one country. Although more
research is needed, disadvantaged groups may have similar characteristics that are associated with
low levels of entrepreneurship or face similar institutional barriers such as consumer or lending
discrimination in each of the countries.
9 Estimates from the 1991 Census and the 1993-94 Fourth National Survey of Ethnic Minorities indicate similar ethnic and racial patterns in self-employment rates for Britain (Clark and Drinkwater 1998, 2000).

8
Another disadvantaged group that has received considerable attention in the literature is
immigrants. Although immigrants appear to be disadvantaged along many other lines, such as
education, income and wealth, their propensity to own businesses is comparable to native-born
Americans. The self-employment ratio among immigrants is only slightly lower than the native
ratio and the immigrant self-employment rate is the same as the native rate.
A few recent studies have focused on an additional disadvantaged group -- the less
educated (see Fairlie 2004 and Krashinsky 2004 for example). Estimates from the CPS indicate
that only 6.5 percent of individuals who do not have a high school diploma are self-employed. In
contrast, 11.0 percent of college-educated individuals own a business. The differences are
smaller, however, after conditioning on employment. The fraction of less-educated individuals
who are not employed is higher than that of college-educated individuals.
Estimates from the CPS indicate that disadvantaged groups generally have low rates of
business ownership. Although these groups may face limited opportunities in the wage/salary
sector, their rates of business ownership are substantially lower than rates for more advantaged
groups even conditioning on employment. The major exception studied here is immigrants who
have roughly similar levels of self-employment as native-born Americans.
3. The Dynamics of Business Ownership
The large disparities in self-employment ratios and rates noted above are created by
group differences in transition rates into and out of self-employment. In fact, the steady-state
self-employment rate in a simple model of two labor market states is simply equal to E / (E+X),
where E is the entry rate into self-employment and X is the exit rate from self-employment. In a
more complicated model with several possible states, the steady-state self-employment ratio is a
function of the transition rates to and from each state and their relative shares of the population.
A comparison of self-employment transitions across groups may provide insights into the causes
of disparities in business ownership.
9
In previous research using a two-state model, I find that the low rate of self-employment
among blacks is due to a black transition rate into self-employment that is approximately one-half
the white rate, and a black transition rate out of self-employment that is twice the white rate
(Fairlie 1999). Building on these results, I examine transition patterns among additional
disadvantaged groups allowing for three possible states -- not employed, wage/salary employed,
and self-employed. The use of additional labor market states is becoming increasingly popular in
the empirical literature on self-employment (see Constant and Zimmerman 2004, Martinez-
Granado 2002, Kuhn and Schuetze 2001, and Carrasco 1999 for a few recent examples). For
some disadvantaged groups unemployment may represent a common path into self-employment.
Although the CPS ADFs are primarily used as cross-sectional samples in the previous
literature, one-year transitions can be identified by linking consecutive surveys. Households in
the CPS are interviewed each month over a 4-month period. Eight months later they are re-
interviewed in each month of a second 4-month period. Thus, individuals who are interviewed in
March of one year are interviewed again in March of the following year. The rotation pattern of
the CPS makes it possible to match the information from one survey to the following survey
creating a one-year panel for up to half of all respondents in a given ADF. To match data from
one survey to the next, I use the procedure described in Madrian and Lefgren (2000).
Table 4 reports estimates of transition matrices by sex, race/ethnicity, immigrant status,
and education level.10 The first three columns of the table report the percentage of individuals in
a specific labor market state in the first survey year who are not employed, employed in a
wage/salary job, or self-employed one year later. Women have lower rates of entry into self-
employment from both non-employment and wage/salary employment. For example, only 2.1
percent of women in wage/salary employment start businesses the following year, whereas 3.0
percent of wage/salary men switch to self-employment. Women also have substantially higher
exit rates from self-employment than men contributing to their relatively low rate of self- 10 Estimates are similar excluding agricultural workers.
10
employment. Slightly more than a third of all self-employed women leave by the following year
compared to 24.6 percent of self-employed men. Women are also much more likely to make the
transition from self-employment to non-employment. Thus, it appears as though the lower entry
rate into self-employment among women and the higher exit rate contribute to their relatively low
rate of business ownership.11
Of all reported ethnic/racial groups, Asians have the highest entrepreneurship rates.
Three and a half percent of Asian wage/salary workers start businesses which is higher than the
white wage/salary to self-employment transition rate of 2.7 percent. Asians, however, have a
lower retention rate in self-employment than whites. The result is roughly similar self-
employment rates for Asians and whites.
Blacks, Latinos, and Native Americans are less likely to start businesses than are whites.
All three groups are also more likely to leave self-employment. The differences in transition
probabilities between these disadvantaged groups and whites are striking, especially for blacks.
Only 1.2 percent of wage/salary blacks become entrepreneurs, which is less than half the white
rate of entrepreneurship. For all three disadvantaged minority groups exit rates are at least 40
percent, whereas the white exit rate is 26.8 percent. Another interesting finding is that these
higher exit rates are partly driven by higher transition probabilities to non-employment. For all
three groups more than 1 out 10 business owners is non-employed the following year.
The results for differences between blacks and whites are roughly consistent with those
from the PSID reported in Fairlie (1999). Estimates from the PSID indicate that 2.0 percent of
black men and 4.0 percent of white men enter self-employment annually, and 36.6 percent of
black men and 18.5 percent of white men exit self-employment annually. Excluding women and
non-employment from the CPS sample for comparability, I find black and white transition rates
11 Estimates from Canada indicate a slightly higher entry rate into self-employment from wage/salary work, a much higher entry rate into self-employment from non-employment, and a slightly higher exit rate out of self-employment for women than men (Kuhn and Schuetze 2001). Their estimates, however, are not directly comparable because they count incorporated business owners as wage/salary workers.
11
into self-employment of 2.0 and 3.3, respectively. The black exit rate is 29.1 percent and the
white exit rate is 20.8 percent.
Table 4 also reports estimates by immigrant status. Immigrants have a higher transition
rate into self-employment from wage/salary employment than natives, but not from non-
employment. The total transition rate into self-employment, however, is higher among
immigrants. On the other hand, immigrants are more likely than natives to leave self-
employment. Thirty-three percent of self-employed immigrants leave annually, whereas 27.5
percent of self-employed natives leave annually.
Estimates from transition matrices by major education level also reveal a few interesting
patterns. First, education and entry into self-employment from wage/salary employment have an
U-shaped relationship. Entry into business ownership from non-employment, however, is clearly
increasing with education. Only 1.6 percent of non-employed high school dropouts start a
business the following year compared to 4.1 percent of non-employed college-educated
individuals.12 Second, exit rates from self-employment decrease with education contributing to
the positive relationship between self-employment and education shown in Table 1. Finally, a
much higher percentage of those leaving self-employment move to non-employment among the
less-educated than among the more-educated. In fact, the probability of becoming non-employed
conditional on self-employment is more than twice as high for high school dropouts as it is for
college graduates.
To summarize, all disadvantaged groups, with the exception of immigrants, have
relatively low rates of entering self-employment and high rates of exiting self-employment.
Disadvantaged groups also generally have high rates of movement from self-employment to non-
employment. Interestingly, however, their rates of entry into self-employment from non-
employment are lower across all of the dimensions analyzed here, including immigrants. This
12 Krashinsky (2004) also notes high rates of entry into self-employment among less-educated workers displaced from their jobs.

12
finding contrasts with disadvantaged theory, which states that disadvantages such as poverty,
unemployment and discrimination push certain groups into self-employment instead of
wage/salary work. Furthermore, although disadvantaged groups have relatively high rates of non-
employment, the preponderance of entrants into self-employment come from wage/salary
employment for all groups.
4. The Determinants of Self-Employment Entry and Exit
To identify the independent effects of sex, race, immigrant status and education, I
estimate logit regressions for self-employment transition probabilities. Separate logit regressions
are estimated for the probability of entry into self-employment and the probability of exit from
self-employment. To simplify, I do not estimate separate regressions for the probability of entry
from non-employment and wage/salary employment. I also do not distinguish between leaving
self-employment for non-employment or for wage/salary employment. Instead, non-employment
and wage/salary employment are grouped together and a dummy variable is included for non-
employment in the entry regression. The non-employed represent 22.5 percent of entrants into
self-employment and 22.3 percent of leavers from self-employment. I find that results
conditioning on employment in both years, and thus focusing on wage/salary to self-employment
and self-employment to wage/salary transitions are qualitatively similar.13
Estimates for the probability of entry into self-employment are reported in Table 5 and
are discussed first.14 Marginal effects and their standard errors are reported.15 All of the
independent variables are measured in the first year surveyed, which is prior to when the self-
employment entry decision is measured. Specification 1 reports estimates from four separate
13 The main exceptions are that the high school dropout coefficient in the entry logit is no longer negative and statistically significant and the female and high school dropout coefficients in the exit logit are much smaller in magnitude. 14 Estimates are similar if agricultural workers are excluded. 15 The reported marginal effect provides an estimate of the effect of a 1-unit increase in the independent
variable on the self-employment entry probability. It equals the sample average of )1/( ˆˆ ββ ii XX ee + .
13
regressions that include dummies for sex, racial groups, immigrant status, and education levels.
Each regression includes only one set of variables. The marginal effects estimates on these
dummies capture a weighted average of differences in the transition probabilities into self-
employment reported in Table 4. The comparison or left-out groups in the four separate
regressions are men, non-Latino whites, natives, and college graduates, respectively. The
coefficient estimates create a baseline for comparison to other specifications and indicate that
disadvantaged groups, with the exception of immigrants, have substantially lower business entry
rates than do the comparison advantaged groups.
It is well known that race, immigrant status and education levels are related. To explore
the effects of these correlations on self-employment entry rates for disadvantaged groups,
Specification 2 includes the sex, race, immigrant status and education dummies in one regression.
The marginal effects estimates capture differences in transition probabilities accounting for these
correlations. Two key patterns emerge from comparing these estimates to the previous estimates.
First, the black, Native American, high school dropout and high school graduate coefficients
become smaller in absolute value because of the correlation between these racial groups and low
levels of education. Second, the negative coefficient on Latino becomes larger in absolute value
and the positive coefficient on Asian essentially disappears at the same time the positive
coefficient on immigrant increases substantially. Apparently, the preponderance of immigrants
among Asians and Latinos makes the coefficient estimates for these racial/ethnic groups sensitive
to controlling for immigrant status. Overall, the logit estimates clearly indicate that
disadvantaged groups, with the exception of immigrants, have substantially lower business entry
rates than do the comparison advantaged groups.
Returning to the issue of the interrelatedness of race/ethnicity and immigration, I find that
54.7 percent of Latinos and 73.9 percent of Asians are immigrants in my sample, and that these
two groups comprise roughly two-thirds of all immigrants. Although immigrants from different
races and ethnicities share some common attributes, such as language barriers and unfamiliarity

14
with U.S. institutions, they may differ substantially along many other dimensions, such as reasons
for emigrating, home country economic conditions, networks, and unobserved skills.
Specification 3 addresses this concern by including interactions between immigrant status and
race/ethnicity. A clear pattern emerges -- white, Asian and black immigrants are substantially
more likely to become business owners than their native-born counterparts, whereas Latino
immigrants are slightly less likely to enter self-employment than native Latinos (although the
difference is not statistically significant).16 Apparently, immigrant status has an independent
effect on self-employment entry, but its effects differ somewhat by race/ethnicity. Thus, I allow
for differential effects by race/ethnicity below.
Specification 4 adds controls for age, marital status, number of children, region of the
country, central city status, survey year and non-employment in the regressions. The probability
of entering self-employment increases with age (up to age 43), being married, the number of
children and non-employment. Controlling for these characteristics generally does not have a
large effect on the majority of the female, race/immigrant and education coefficients. The
exceptions are that the black coefficient declined in absolute value, and the Native American,
Asian and high school dropout coefficients increased in absolute value. Clearly, the inclusion of
these controls does not "explain away" the general finding of low rates of entry into self-
employment by most disadvantaged groups.
The importance of assets has taken center stage in the literature on the determinants of
self-employment. Numerous studies using various methodologies, measures of assets and
country microdata explore the relationship between assets and self-employment. Several recent
studies estimate the relationship by modeling the decision of wage/salary workers or other non-
business owners to switch into self-employment over a fixed period of time.17 These studies
16 The exact causes of these differences are unknown and are beyond the scope of this chapter. 17 For example, see Evans and Jovanovic (1989), Evans and Leighton (1989), Meyer (1990), Holtz-Eakin, Joulfaian, and Rosen (1994), Dunn and Holtz-Eakin (1999) Fairlie (1999, 2002) and Hurst and Lusardi (2004) for evidence from U.S. microdata, Holtz-Eakin and Rosen (2004) for U.S. and Germany, and

15
generally find that asset levels (e.g. net worth or asset income) measured in one year increase the
probability of entering self-employment by the following year suggesting that entrepreneurs may
face liquidity constraints. 18 Recent studies also indicate that blacks have substantially lower
levels of assets than whites and that these differences contribute to racial differences in business
ownership levels (Bates 1989, Fairlie 1999 and Fairlie and Robb 2003). Although less is known
for other disadvantaged groups, disparities in asset levels may be large and explain why these
groups are also less likely to become business owners.
In Specification 5, I add several measures of assets available in the CPS to the logit
regression. Home ownership is included as well as dividend, interest and rental income.
Investment and rental income are not a direct measure of assets, but are roughly proportional to
asset levels. These measures are included separately to allow for differential values on the
underlying assets and liquidity. All measures of assets are measured prior to the self-employment
decision.19 As expected, home owners are more likely to enter self-employment.20 In the
presence of liquidity constraints, the ability of owners to borrow against the value of their home,
such as home equity loans, may make it easier to finance new business ventures. The
relationships between the probability of making a transition into self-employment and dividend,
Johansson (2000) for Finland. 18 The focus on transitions to self-employment attempts to avoid the endogeneity problem of including assets in a static model of self-employment. A positive relationship found in a cross-sectional analysis may simply reflect the possibility that business owners accumulate more wealth instead of wealth increasing the likelihood of owning a business. Although individuals may save in anticipation of becoming self-employed, a measure of assets in the prior year should be more exogenous to the entrepreneurial decision than a contemporaneous measure of assets. 19 Another approach that has been taken in the literature is to use inheritances, gifts, lottery winnings or insurance settlements as a measure of or instrument for assets (see Holtz-Eakin, Joulfaian, and Rosen 1994a, Fairlie 1999 and Hurst and Lusardi 2004 for U.S. microdata, Blanchflower and Oswald 1998 and Taylor 2001 for British microdata, and Lind and Ohlsson 1994 for Swedish data). Inheritances and other unanticipated, or at least less-anticipated, lump sum payments represent a more exogenous measure of assets than net worth and are generally found to increase the probability of entering or being self-employed suggesting that entrepreneurs face liquidity constraints. Hurst and Lusardi (2004), however, find that future inheritances also increase the probability of self-employment entry suggesting that liquidity constraints are not the underlying cause of the positive relationship. 20 Previous studies find that home prices, home ownership and property restitution increase the likelihood of business creation and self-employment (Fairlie 2004, Black, de Meza and Jeffreys 1996, Johansson 2000, and Earle and Sakova 2000).
16
interest and rental income are concave and increasing at the means of each measure of asset
income. Similar to previous studies, I find that higher levels of assets increase the probability of
entry into self-employment.
Controlling for differences in asset levels reduces (in absolute value) the coefficients for
most disadvantaged groups. All of the main effects for ethnic and racial groups become smaller
in absolute value (or increase) suggesting that assets levels are relatively low among native-born
minorities compared to native-born whites and that these low levels of assets limit their
opportunities to start businesses. I also find that the coefficient estimates on all of the
immigrant/race interactions increase suggesting that controlling for assets explains an additional
amount of the difference in entry rates between racial groups and whites among immigrants. For
example, the native Latino differential drops from 0.48 percentage points to 0.36 percentage
points after controlling for assets, whereas the immigrant Latino differential drops from 0.67 to
0.51 percentage points. Low levels of assets appear to limit entrepreneurial opportunities among
disadvantaged ethnic and racial groups, however, it is difficult to identify the importance of this
factor. I explore this question further in the Section 5.
The coefficients decline sharply for high school dropouts and high school graduates after
the addition of assets. This result suggests that, all else equal, less-educated individuals have
relatively low levels of assets resulting in lower entry rates. Indeed, a direct comparison of asset
levels by education level reveals that high school graduates and especially high school dropouts
have substantially lower levels of assets than do college graduates. For example, only 60.1
percent of high school dropouts own a house compared to 83.3 percent of college graduates, and
average interest income among dropouts is $109 compared to $1,190 among college graduates.
The presence of liquidity constraints and relatively low levels of assets appears to limit the ability
of less-educated workers to start businesses.
Even controlling for differences in asset levels, the individual's education level has a
strong positive effect on entry into self-employment. High school dropouts are nearly a full
17
percentage point less likely to enter self-employment, and high school graduates and individuals
with some college are slightly more than 0.3 percentage points less likely to enter self-
employment than are college graduates. Estimates from several other countries, however,
indicate a generally statistically insignificant relationship between education and self-
employment entry (see, for example, Holtz-Eakin and Rosen 2004 for Germany, Blanchflower
and Meyer 1994 for Australia, and Lin, Picot and Compton 2001 for Canada).21 On the other
hand, evidence from East European transition economies indicates a positive relationship between
schooling and transitions into self-employment.
FEMALE ENTREPRENEURSHIP
Interestingly, the female coefficient increases slightly in absolute value after the inclusion
of the main controls and does not change after inclusion of assets. The change in the marginal
effects estimate from Specification 3 to Specification 4 is primarily due to the higher percentage
of women who are not employed and the higher rate of entry from non-employment than from
wage/salary employment into self-employment. This finding suggests that the female/male
difference in self-employment entry rates would be slightly larger if not for the initial difference
in non-employment rates. As expected, controlling for other variables has little effect on the
female coefficient estimate because men and women have very similar characteristics.22 Women
are much less likely than men to enter self-employment, all else equal. Similar results are found
using microdata from the European Union. Blanchflower (2000, 2004) finds large female/male
differences in the probability of being self-employed after including education and other
measurable individual characteristics as well as country dummies.
21 Cross-sectional data for Europe indicates a negative relationship between education and self-employment (Blanchflower 2004). 22 Estimates from the National Center for Educational Statistics indicate that women received 49.6 and 40.7 percent of all Bachelor's and Master's degrees in business conferred in 2000-01 (U.S. Department of Education 2002).

18
Recent studies focusing on gender differences in self-employment provide some
interesting findings, but provide only limited direct evidence on the question of what explains the
large gender difference in self-employment rates.23. For example, these studies find that women
who are married to self-employed men are more likely to be self-employed or enter self-
employment and that the choice of self-employment is partly driven by the desire for flexible
schedules and other family-related reasons for women relative to men (Bruce 1999, Boden 1996,
1999, Carr 1996, Devine 1994b, Lombard 2001, and Lohmann 2001).24 Gender earnings
differentials in the wage/salary sector may contribute, but there is also considerable evidence
indicating large female/male earnings differences in the self-employment sector (Aronson 1991,
Devine 1994b, Hundley 2000 and U.S. Bureau of the Census 2004). In the end, unobservable
factors, such as different preferences, discrimination, and risk aversion, may be responsible for
low levels of female entrepreneurship.25 As noted above, an interesting finding is that a lower
percentage of young women than men report a desire for being self-employed in the United States
(Kourilsky and Walstad 1998). Using a combined sample from many countries, Blanchflower,
Oswald and Stutzer (2001) also find a lower probability of preferring self-employment among
women after controlling for other factors. In both cases, however, the differences are not large
and represent roughly 15 percentage points.
TRANSITIONS OUT OF SELF-EMPLOYMENT
Logit regressions are also estimated for the probability of exit from self-employment.
Estimates are reported in Table 6. Specification 1 reports estimates from four separate
regressions that include dummies for sex, ethnic/racial groups, immigrant status, and education
levels. All disadvantaged groups have relatively high exit rates from self-employment.
23 See Gatewood, et al. 2003 and Parker 2004 for recent reviews of the literature. 24 Another possibility is that female entrepreneurs have access to different business and investment social networks than male entrepreneurs (Brush, et al. 2004). 25 See Coleman (2001) for a discussion of constraints faced by women-owned firms.

19
Specification 2 accounts for the correlations between sex, race, immigrant status and education.
Again, women, blacks, Latinos, Native Americans, and high school dropouts have relatively high
exit rates from self-employment. The difference between immigrants and natives, although
positive, is now small and statistically insignificant. The coefficients on all of the race/ethnicity,
immigrant and education dummies become smaller in absolute value due to the correlation
between these factors.
Specification 3 includes race/immigrant status interactions. Interestingly, white
immigrants have high exit rates relative to white natives, whereas black and Asian immigrants
have lower exit rates than their native counterparts (although the differences are not statistically
significant). Finally, there appears to be no difference between transition rates out of self-
employment between native and immigrant Latinos.
Specification 4 includes controls for individual characteristics. The exit rate decreases
with age (until age 47) and being married. The coefficient estimates for blacks, Latinos, and
white immigrants become notably smaller, whereas the coefficient estimate for Native Americans
becomes larger. In the final specification, I include controls for asset levels. As expected home
ownership decreases the probability of exit from self-employment and the asset income measures
generally have a negative relationship with the exit probability. Even after controlling for asset
levels, most disadvantaged groups are substantially more likely to leave business ownership
annually.
Overall, disadvantaged groups have relatively low rates of entry into self-employment
and high rates of exit from self-employment. The only exception is immigrants who have a
higher rate of entry into self-employment than natives, but this comparison does not hold for all
groups. Among Latinos, immigration is not associated with a higher level of entry. These
patterns of low entry rates and high exit rates among disadvantaged groups persist even after
controlling for the correlated effects of other disadvantages (i.e. race and education), individual
characteristics, and asset levels. Again, immigrants represent the exception as the
20
immigrant/native difference in exit rates becomes negligible for some groups after controlling for
other factors. I now turn to a more detailed analysis of the causes of low rates of self-
employment entry and exit among disadvantaged minority groups.
5. Identifying the Causes of Ethnic and Racial Differences in Entry and Exit Rates
The estimates reported in Tables 5 and 6 indicate that the relatively low rates of entry and
high rates of exit from self-employment among disadvantaged minority groups can be explained,
in part, by group differences in education, assets and other individual characteristics. The
estimates, however, cannot identify the separate contributions from group differences in each of
these variables. To explore these issues further, I employ a variant of the familiar technique of
decomposing inter-group differences in a dependent variable into those due to different
observable characteristics across groups and those due to different "prices" of characteristics of
groups (see Blinder 1973 and Oaxaca 1973). The technique that I describe here takes into
account the nonlinearity of the logit regressions discussed above (see Fairlie 1999, 2003 for more
details).
For a linear regression, the standard Blinder-Oaxaca decomposition of the white/minority
gap in the average value of the dependent variable, Y, can be expressed as:
where jX is a row vector of average values of the independent variables and jβ̂ is a vector of
coefficient estimates for race j. For a nonlinear equation, such as Y = F(X β̂ ), the decomposition
can be written as:
(5.1) [ ] [ ],)-(X + )X-X( = Y-YMWMWMWMW βββ ˆˆˆ
(5.2) ,N
)XF( -
N
)XF( +
N
)XF( -
N
)XF( = Y-Y M
MMi
N
=1iM
WMi
N
=1iM
WMi
N
=1iW
WWi
N
=1i
MWMMMW
⎥⎥⎦
⎤
⎢⎢⎣
⎡
⎥⎥⎦
⎤
⎢⎢⎣
⎡∑∑∑∑ ββββ ˆˆˆˆ

21
where Nj is the sample size for race j. This alternative expression for the decomposition is used
because Y does not necessarily equal F( X β̂ ). In both (5.1) and (5.2), the first term in brackets
represents the part of the racial gap that is due to group differences in distributions of X, and the
second term represents the part due to differences in the group processes determining levels of Y.
To calculate the decomposition, I define Y as the self-employment entry or exit rate and F as the
logistic cumulative distribution function.
An equally valid method of calculating the decomposition is to use the minority
coefficient estimates, Mβ̂ , as weights in estimating the contributions from group differences in
the independent variables. This alternative method of calculating the decomposition often
provides different estimates, which is the familiar index problem with the Blinder-Oaxaca
decomposition technique. A third commonly-used alternative is to weight the first term of the
decomposition expression using coefficient estimates from a pooled sample of the two groups or
all groups (see Oaxaca and Ransom 1994 for example). I follow this approach to calculate the
decompositions. In particular, I use coefficient estimates from logit regressions that include
pooled samples of all ethnic and racial groups.
The first term in (5.2) provides an estimate of the contribution of racial differences in the
entire set of independent variables to the racial gap, but I am particularly interested in identifying
the effects of group differences in specific variables, such as education and asset levels. To
identify contributions from these variables an additional calculation is needed. To simplify,
assume that X includes two variables, X1 and X2. Using coefficient estimates from a logit
regression for a pooled sample, *β̂ , the independent contribution of X1 to the racial gap can then
be expressed as:
(5.3) .ˆˆˆˆˆˆ ****** )X+XF()X+XF( N1
2W2i1
M1i2
W2i1
W1i
N
=1iM
M
ββαββα +−+∑

22
Similarly, the contribution of X2 can be expressed as:
The contribution of each variable to the gap is thus equal to the change in the average predicted
probability from replacing the black distribution with the white distribution of that variable while
holding the distributions of the other variable constant.26 A useful property of this technique is
that the sum of the contributions from individual variables will be equal to the total contribution
from all of the variables evaluated with the full sample.
Table 7 reports estimates from this procedure for decomposing the gap between the
native-born white and minority gaps in self-employment entry rates. I report estimates only for
those race/immigrant groups that have large enough sample sizes. The individual contributions
from racial differences in education, marital status and children, non-employment, assets, region,
and central city status are reported. I first describe the results for native-born blacks, which are
reported in Specification 1. The native white/black gap in the self-employment entry rate is large
(0.0144). Racial differences in sex and age explain virtually none of the gap. Marital status and
children explain only a small part of the gap (5.0 percent). This contribution is primarily due to
blacks having a substantially lower probability of currently being married than whites and the
positive effect of marriage on entry into self-employment. Slightly more of the gap is explained
by relatively low levels of education among blacks. In the sample, 14.3 percent of blacks are
high school dropouts compared to only 6.2 percent of whites.
26 The calculation of (5.3) and (5.4), however, is not possible without first matching the white distribution of X1 and the minority distribution of X2. I draw a random subsample of whites with a sample size equal to NM and match it to the minority sample based on the predicted probability of the dependent variable. To approximate the use of the entire white sample, I draw 1000 random white samples for matching and calculate the mean value of estimates from all of these matched samples. See Fairlie (2003) for more details.
(5.4) .)X+XF()X+XF( N1
2M2i1
M1i2
W2i1
M1i
N
=1iM
M
ββαββα ˆˆˆˆˆˆ****** +−+∑
23
As expected, the largest factor explaining racial disparities in business creation rates are
differences in asset levels.27 Lower levels of assets among blacks account for 15.5 percent of the
white/black gap in the probability of entry into self-employment. In the presence of liquidity
constraints, low levels of assets appear to limit opportunities for blacks to start businesses. The
finding is very similar to estimates reported in Fairlie (1999) for men in the PSID. Estimates
from the PSID indicate that 13.9 to 15.2 percent of the black/white gap in the transition rate into
self-employment can be explained by differences in assets.
The overrepresentation of blacks in regions of the country with low entry rates explains a
modest portion of the gap. Also, the underrepresentation of blacks in rural areas, which have
relatively high entry rates, contributes to the gap. Overall, racial differences in the explanatory
variables explain roughly one third of the black/white gap in business creation rates. The
remaining or "unexplained" portion of the racial gaps in self-employment entry rates may be due
to lending discrimination and consumer discrimination against black-owned firms and/or the
omission of important unmeasurable factors such as risk aversion.28
Table 7 also reports estimates for native-born and immigrant Latinos (reported in
Specifications 2 and 3, respectively). The two most important factors in explaining the gaps
between the two Latino groups and native-born whites are assets and education. Relatively low
levels of assets explain more than half of the entry rate gap for native-born Latinos and slightly
less than half of the gap for immigrant Latinos. Apparently, low levels of assets are limiting
opportunities for Latinos to start businesses and this factor, at least in percentage terms, is more
important for Latinos than for blacks.
27 See Menchik and Jianakoplos (1997), Altonji and Doraszelski (2001), and Gittleman and Wolff (2004) for a few recent studies on racial differences in asset levels, and Bradford (2003) on wealth holding among black and white entrepreneurs. 28 See Cavalluzzo, Cavalluzzo, and Wolken (2002), Blanchflower, Levine and Zimmerman (2003), Borjas and Bronars (1989), and Meyer (1990) for evidence on lending and consumer discrimination against blacks, and see Fairlie (2002) for evidence on risk aversion.
24
Relatively low levels of education among Latinos, especially immigrants, are also a
limiting factor in business creation. A surprisingly high 53.1 percent of immigrant Latinos and
20.4 percent of native-born Latinos did not complete high school. Education differences account
for 44.8 percent of the entry rate gap for Latino immigrants and 34.3 percent of the entry rate gap
for Latino natives.
The underrepresentation of Latinos residing in rural areas also contributes to the gaps in
entry rates. On the other hand, Latinos have a favorable regional distribution as evidenced by the
negative contribution estimates. Latinos are disproportionately located in the West South Central,
Mountain, and Pacific regions where business entry rates are relatively high. This finding
suggests that the entry rate gap would be even larger if Latinos had a similar geographical
dispersion as whites. Similarly, entry rate gaps would be larger if not for the relatively high rates
of non-employment among Latinos and high entry rates into self-employment from non-
employment.
The entry rate into self-employment is 0.55 percentage points lower among Native
Americans than native-born whites. Low levels of education and assets are mainly responsible.
Education and asset differences explain 36.1 and 54.1 percent of the gap, respectively. Although
these factors alone explain nearly the entire gap in business creation rates, there exist a number of
offsetting factors. The Native American regional composition, overrepresentation in rural areas,
high levels of non-employment, and family characteristics are favorable in terms of increasing
business formation. These results imply that if Native Americans had similar geographical
locations, family structures and levels of employment as whites the gap in entry rates would be
substantially larger than that reported.
THE CAUSES OF HIGH EXIT RATES FOR DISADVANTAGED MINORITY GROUPS
Table 8 reports estimates for the decomposition of exit rates from self-employment for
native blacks, native Latinos, and immigrant Latinos. Sample sizes are relatively small for these
25
groups (250-301 observations) because they condition on business ownership in the first survey
year. Sample sizes for Native American business owners are too small to report estimates.
Native-born blacks are nearly twice as likely to leave self-employment annually as
native-born whites. Although there is no clear dominant factor explaining the disparity in exit
rates, racial differences in asset levels, region distributions and central city status contribute to the
gap. The overrepresentation of blacks in inner city areas, which have relatively high exit rates,
provides the largest single contribution (9.8 percent). Racial differences in asset levels explain
7.3 percent of the gap, which is in the range of estimates from the PSID reported in Fairlie
(1999). Estimates from the PSID indicate that 1.8 to 11.1 percent of the male black/white gap in
exit rates from self-employment is explained by differences in asset levels. Recent estimates
from the Characteristics of Business Owners (CBO) survey indicate that 43.2 percent of the gap
in business closure rates is explained by differences in the amount of required startup capital
(Fairlie and Robb 2003), but the focus on businesses, startup capital, and closure rates makes the
results difficult to compare.29
Both native-born and immigrant Latinos have substantially higher exit rates than native-
born whites. Lower levels of education and assets, a younger population of business owners, and
underrepresentation in rural areas partly explain why Latinos are more likely to leave self-
employment. Education and assets are especially important factors for Latino immigrants,
explaining 20.7 and 16.5 percent of the gap in self-employment exit rates, respectively.
OTHER POTENTIAL EXPLANATIONS FOR ETHNIC/RACIAL DIFFERENCES
Additional factors that might explain low rates of entry and high rates of exit from self-
employment among disadvantaged minority groups include, but are not limited to, racial
differences in parental self-employment, sector-specific human capital, and lending and consumer
29 Using the 1982 CBO, Bates (1989) finds that racial differences in levels of financial capital partly explain racial patterns in business failure rates.
26
discrimination. Early researchers emphasized the role that past inexperience in business played in
creating low rates of business ownership among blacks. In particular, Du Bois (1899), and later
Myrdal (1944), Cayton and Drake (1946) and Frazier (1957) identify the lack of black traditions
in business enterprise as a major cause of low levels of black business ownership at the time of
their analyses. The lack of black traditions in business argument relies on a strong
intergenerational link in business ownership. Indeed, several recent studies find that the
probability of self-employment is substantially higher among the children of the self-employed
(see Lentz and Laband 1990, Fairlie 1999, Dunn and Holtz-Eakin 2000, and Hout and Rosen
2000).
Recent research has also examined whether the strong intergenerational link in business
ownership is detrimental to disadvantaged minorities. Hout and Rosen (2000) note a "triple
disadvantage" faced by black men in terms of business ownership. They are less likely than
white men to have self-employed fathers, to become self-employed if their fathers were not self-
employed, and to follow their father in self-employment. Fairlie (1999) provides evidence from
the PSID that current racial patterns of self-employment are in part determined by racial patterns
of self-employment in the previous generation. Finally, Fairlie and Robb (2003) find related
evidence that the lack of prior work experience in a family business among black business
owners, perhaps by limiting their acquisition of general and specific business human capital,
negatively affects black business outcomes, such as closures, employment and sales. They also
find that racial differences in business inheritance are negligible and cannot explain differences in
outcomes.
Lending and consumer discrimination may also contribute to the patterns documented
above. Recent evidence indicates that black-owned businesses experience higher loan denial
probabilities and pay higher interest rates than white-owned businesses even after controlling for
differences in credit-worthiness, size and other factors (Blanchflower, Levine and Zimmerman
2003 and Cavalluzzo, Cavalluzzo, and Wolken 2002). Minority-owned firms are also more likely

27
to report not applying for loans because of concerns over being denied and that the availability of
credit was a major problem. The evidence on consumer discrimination against minority-owned
firms, however, is less clear (see Borjas and Bronars 1989 and Meyer 1990 for example).
6. Conclusions
Estimates from the CPS indicate that several major disadvantaged groups have relatively
low rates of entrepreneurship in the United States. Women, disadvantaged minorities (i.e. blacks,
Latinos and Native Americans), and less-educated workers are found to have substantially lower
business ownership rates than men, white non-Latinos, and college-educated workers,
respectively. An analysis of the dynamics of self-employment reveals some underlying causes of
these patterns.
Although female self-employment rates have risen dramatically in recent decades, the
prevalence of business ownership among women is only 50-60 percent of that for men. The low
rate of self-employment among women permeates across ethnic/racial groups and countries.
Evidence from U.S. and British data indicate that only a handful of detailed ethnic/racial groups
have female/male self-employment rate ratios larger than 0.75 (Fairlie and Meyer 1996 and Clark
and Drinkwater 2000), and aggregate data from the OECD indicate that female self-employment
rates are substantially lower than male rates in almost every reported country with an average
ratio of 0.543.
Estimates from one-year transition matrices using matched CPS data indicate that women
have lower rates of entry into self-employment from both non-employment and wage/salary
employment than men. Women also have substantially higher exit rates from self-employment
than men. Slightly more than one third of all self-employed women leave by the following year
compared to one fourth of self-employed men. These estimates imply that the low rate of
business ownership among women is due to both a relatively low entry rate into self-employment
and a relatively high exit rate out of self-employment.
28
Logit regressions for the probability of self-employment entry and exit are estimated to
control for differences in ethnicity/race, immigration, education, non-employment, assets, age,
marital status, number of children, region of the country, and central city status. As expected the
inclusion of these controls has little effect on the female/male entry and exit rate differentials
because men and women generally have similar observable characteristics. Although previous
research indicates that the determinants of self-employment differ between men and women
(Bruce 1999, Boden 1996, 1999, Carr 1996, Devine 1994b, Lombard 2001, and Lohmann 2001),
the question of what explains the large gender gap in self-employment entry and exit remains
largely unanswered. As reported above, evidence from the United States and several other
countries suggests that women are less likely than men to report having a desire for self-
employment, although the difference is not large (Kourilsky and Walstad 1998 and Blanchflower,
Oswald and Stutzer 2001). In the end, unobservable factors, such as different preferences,
discrimination, and risk aversion, may be responsible for low levels of female entrepreneurship.
Estimates from the CPS indicate a clear ordering of self-employment propensities across
ethnic and racial groups. White, non-Latinos and Asians have the highest self-employment rates
followed distantly by Latinos. The likelihood of business ownership among Latinos is only
slightly higher than 50 percent of that for white, non-Latinos. Native Americans have even lower
levels of business ownership, and blacks have the lowest rates of business ownership, which are
36 to 39 percent of white rates. Aggregate data from the 2001 Canadian and U.K. Censuses and
microdata from the 2000 U.S. Census, indicate similar patterns of ethnic/racial entrepreneurship -
- disadvantaged groups, such as blacks, Latinos and Natives, have relatively low rates of business
ownership in all of the countries reported. Thus, low rates of business ownership among these
ethnic/racial groups are not peculiar to the United States or one country.
Blacks, Latinos, and Native Americans are less likely to start businesses than are whites.
All three groups are also more likely to leave self-employment. The differences in transition
probabilities between these disadvantaged groups and whites are striking, especially for blacks.
29
Only 1.2 percent of wage/salary blacks become entrepreneurs over a one year period, which is
less than half the white rate of entry into self-employment. For all three disadvantaged minority
groups exit rates are at least 40 percent, whereas the white exit rate is 26.8 percent. Clearly, low
rates of business ownership among disadvantaged minorities are driven by both low entry rates
and high exit rates.
To identify the contributions from ethnic and racial differences in education, assets and
other factors to gaps in self-employment entry and exit rates a non-linear decomposition
technique is employed. For entry rates, the largest factor explaining disparities between native
blacks and whites are racial differences in asset levels. Lower levels of assets among blacks
account for 15.5 percent of the white/black gap in the probability of entry into self-employment.
The two most important factors in explaining the gaps between native-born and immigrant
Latinos and native-born whites are assets and education. Relatively low levels of assets explain
more than half of the entry rate gap for native-born Latinos and slightly less than half of the gap
for immigrant Latinos. Apparently, low levels of assets are limiting opportunities for Latinos to
start businesses and this factor, at least in percentage terms, is more important for Latinos than for
blacks. Relatively low levels of education among Latinos, especially immigrants, are also a
limiting factor in business creation. Education differences account for 44.8 percent of the entry
rate gap for Latino immigrants and 34.3 percent of the entry rate gap for Latino natives. Low
levels of education and assets are also mainly responsible for the entry rate gap between Native
Americans and native-born whites. Education differences explain 36.1 percent of the gap and
asset differences explain 54.1 percent of the gap, however, there exist many offsetting factors
such as regional composition, overrepresentation in rural areas, high levels of non-employment,
and family characteristics which are favorably associated with business creation.
The non-linear decomposition technique is also used to identify factors explaining
ethnic/racial differences in exit rates out of self-employment. Although there is no clear
dominant factor explaining the black/white disparity in exit rates, racial differences in asset

30
levels, regional distributions and central city status contribute to the gap. Lower levels of
education and assets, a younger population of business owners, and underrepresentation in rural
areas partly explain why Latinos are more likely to leave self-employment. Education and assets
are especially important factors for Latino immigrants, explaining 20.7 and 16.5 percent of the
gap in self-employment exit rates, respectively.
A few recent studies have focused on an additional disadvantaged group -- the less
educated (see Fairlie 2004 and Krashinsky 2004 for example). Estimates from the CPS indicate
that only 6.5 percent of individuals who do not have a high school diploma are self-employed. In
contrast, 11.0 percent of college-educated individuals own a business. The differences are
smaller, however, after conditioning on employment. Estimates from transition matrices also
reveal an U-shaped relationship between education and entry into self-employment from
wage/salary employment. Entry into business ownership from non-employment, however, is
clearly increasing with education. Also contributing to the positive relationship between self-
employment and education, exit rates from self-employment are found to be decreasing with
education.
The addition of controls for ethnicity/race and assets in logit regressions is found to
reduce the self-employment entry and exit rate differentials between the less-educated and college
graduates. The presence of liquidity constraints and relatively low levels of assets may limit the
ability of less-educated workers to start businesses. Even controlling for differences in
ethnicity/race and asset levels, however, the individual's education level has a large positive effect
on entry into self-employment and a large negative effect on exit out of self-employment. High
school dropouts are nearly a full percentage point less likely to enter self-employment and are 7.2
percentage points more likely to exit from self-employment than college graduates. Although
many entrepreneurship programs targeted towards disadvantaged groups currently exist, the
estimates presented here indicate continuing disparities in levels of business ownership

31
References
Altonji, Joseph G., and Ulrich Doraszelski. 2001. "The Role of Permanent Income and Demographics in Black/White Differences in Wealth," NBER Working Paper No. 8473. Aronson, Robert L. 1991. Self-Employment: A Labor Market Perspective, Ithaca: ILR Press. Aspen Institute. 2002. "Directory of Microenterprise Programs," The Aspen Institute: Washington, D.C. Baron, Salo W., Arcadius Kahan, and others. 1975. Economic History of the Jews, ed, Nachum Gross. New York: Schocken Books. Bates, Timothy. 1989. "The Changing Nature of Minority Business: A Comparative Analysis of Asian, Nonminority, and Black-Owned Businesses." The Review of Black Political Economy, 18, Fall: 25-42. Bates, Timothy. 1993. Assessment of State and Local Government Minority Business Development Programs. Report to the U.S. Department of Commerce Minority Business Development Agency. Washington, D.C.: U.S. Department of Commerce. Bates, Timothy. 1997. Race, Self-Employment & Upward Mobility: An Illusive American Dream, Washington, D.C.: Woodrow Wilson Center Press and Baltimore: John Hopkins University Press. Black, Jane, David de Meza, and David Jeffreys. (1996). "House Prices, The Supply of Collateral and the Enterprise Economy." The Economic Journal. 106 (434):60-75. Blanchflower, David G. (2000), "Self-employment in OECD countries", Labour Economics, 7, September, pp. 471-505. Blanchflower, David G. (2004), "Self-employment: more may not be better", forthcoming in Swedish Economic Policy Review. Blanchflower, David G., P. Levine and D. Zimmerman (2003), "Discrimination in the small business credit market", Review of Economics and Statistics, November, 85(4), pp. 930-943. Blanchflower, David G., and Bruce D. Meyer. 1994. "A Longitudinal Analysis of the Young Self-Employed in Australia and the United States." Small Business Economics. 6(1):1-19. Blanchflower, David G., and Andrew J. Oswald. 1998. "What Makes an Entrepreneur?" Journal of Labor Economics, 16 (1), pp. 26-60. Blanchflower, David G., Andrew Oswald, and Alois Stutzer. 2001. "Latent entrepreneurship across nations." European Economic Review. 45:680-691. Blinder, Alan S. 1973. "Wage Discrimination: Reduced Form and Structural Variables." Journal of Human Resources, 8, pp. 436-455. Boden, Richard. 1996. "Gender and Self-Employment Selection: An Empirical Assessment," The Journal of Socio-Economics, Vol. 25, pp. 671-682.
32
Boden, Richard J. 1999. "Flexible working hours, family responsibilities, and female self-employment: gender differences in self-employment selection." The American Journal of Economic Sociology. 58(1):71-76. Bonacich, Edna and John Modell. 1980. The Economic Basis of Ethnic Solidarity in the Japanese American Community. Berkeley: University of California Press. Borooah, Vani K. and Mark Hart. 1999. "Factors Affecting Self-Employment among Indian and Black Caribbean Men in Britain." Small Business Economics. 13:111-129. Borjas, George. 1986. "The Self-Employment Experience of Immigrants." Journal of Human Resources, 21, Fall: 487-506. Borjas, George, and Stephen Bronars (1989): "Consumer Discrimination and Self-Employment," Journal of Political Economy, 97, pp. 581-605. Bradford, William D. 2003. "The Wealth Dynamics of Entrepreneurship for Black and White Families in the U.S.," Review of Income and Wealth, 49(1): 89-116. Brown, Charles, James Hamilton, and James Medoff (1990): Employers Large and Small, Cambridge: Harvard University Press. Brush, Candida, Nancy Carter, Elizabeth Gatewood, Patricia Greene, and Myra Hart. 2004. Gatekeepers of Venture Growth: A Diana Project Report on the Role and Participation of Women in the Venture Capital Industry, Kauffman Foundation. Bruce, Donald. 1999. "Do Husbands Matter? Married Women Entering Self-Employment." Small Business Economics. 13:317-329. Carr, Deborah. 1996. "Two Paths to Self-Employment? Women’s and Men’s Self-Employment in the United States, 1980," Work and Occupations, Vol. 23, pp. 26-53. Carrasco, Raquel. 1999. "Transitions to and from Self-Employment in Spain: An Empirical Analysis." Oxford Bulletin of Economics and Statistics, 61(3): 315-341. Cavalluzzo, Ken, Linda Cavalluzzo, and John Wolken. 2002. “Competition, Small Business
Financing, and Discrimination: Evidence from a New Survey,” Journal of Business, Vol. 25 no. 4. Cayton, Horace R. and St. Clair Drake. 1946. Black Metropolis. London: Jonathan Cape. Clark, Kenneth and Stephen Drinkwater. 1998. "Ethnicity and Self-Employment in Britain." Oxford Bulletin of Economics and Statistics. 60, pp.383-407. Clark, Kenneth and Stephen Drinkwater. 2000. "Pushed out or pulled in? Self-employment among ethnic minorities in England and Wales." Labour Economics. 7, pp.603-628. Coleman, Susan. 2001. "Constraints Faced by Women Small Business Owners: Evidence from the Data," Paper presented at the United States Association for Small Business and Entrepreneurship Annual Meetings.
33
Constant, Amelie, and Klaus F. Zimmerman. 2004. "Self-Employment Dynamics across the Business Cycle: Migrants versus Natives," IZA Working Paper. Devine, Theresa J. 1994 "Changes in Wage-and-Salary Returns to Skill and the Recent Rise in Female Self-Employment." American Economic Review 84(2):108-13. Devine, Theresa J. 1994. "Characteristics of self-employed women in the United States." Monthly Labor Review. 117(3):20-34. Du Bois, W.E.B. 1899. The Philadelphia Negro, Philadelphia: University of Pennsylvania. Dunn, Thomas A. and Douglas J. Holtz-Eakin (2000), "Financial capital, human capital, and the transition to self-employment: evidence from intergenerational links", Journal of Labor Economics 18 (2): 282-305. Earle, John S., and Zuzana Sakova. 2000. "Business start-ups or disguised unemployment? Evidence on the character of self-employment from transition economies," Labour Economics, 7:(5): 575–601. Evans, David and Boyan Jovanovic. 1989. "An Estimated Model of Entrepreneurial Choice Under Liquidity Constraints." Journal of Political Economy 97(4):808-27. Evans, David, and Linda Leighton (1989): "Some Empirical Aspects of Entrepreneurship," American Economic Review, 79, pp. 519-535. Fairlie, Robert W. 1999. "The Absence of the African-American Owned Business: An Analysis of the Dynamics of Self-Employment." Journal of Labor Economics, 17(1): 80-108. Fairlie, Robert W. 2002. "Drug Dealing and Legitimate Self-Employment," Journal of Labor Economics 20 (3): 538-567. Fairlie, Robert W. 2004. "Earnings Growth among Less-Educated Business Owners," Industrial Relations, 43 (3): 634-659. Fairlie, Robert W. 2004. "Recent Trends in Ethnic and Racial Business Ownership." Small Business Economics, 23: 203-218. Fairlie, Robert W. 2004. "The Personal Computer and Entrepreneurship." University of California, Santa Cruz Working Paper. Fairlie, Robert W. 2003. "An Extension of the Blinder-Oaxaca Decomposition Technique to Logit and Probit Models," Economic Growth Center, Yale University Discussion Paper No. 873. Fairlie, Robert W., and Bruce D. Meyer. 1996. "Ethnic and Racial Self-Employment Differences and Possible Explanations," Journal of Human Resources, 31, Fall 1996, pp. 757-793. Fairlie, Robert W., and Bruce D. Meyer. 2000. "Trends in Self-Employment among Black and White Men: 1910-1990." Journal of Human Resources, 35(4): 643-669.
34
Fairlie, Robert W., and Alicia Robb. 2003. "Why are Black-Owned Businesses Less Successful than White-Owned Businesses: The Role of Families, Inheritances, and Business Human Capital," Joint Center for Poverty Research Working Paper 336. Frazier, E. Franklin (1957): The Negro in the United States, 2nd Edition, New York: McMillan. Gatewood, Elizabeth J., Nancy M. Carter, Candida G. Brush, Patricia G. Greene, and Myra M. Hart. 2003. Women Entrepreneurs, Their Ventures, and the Venture Capital Industry: An Annotated Bibliography. Stockholm: Entrepreneurship and Small Business Research Institute. Gittleman, Maury, and Edward N. Wolff. 2004. "Racial Differences in Patterns of Wealth Accumulation," Journal of Human Resources, 34(1): 193-227. Glazer, Nathan and Daniel P. Moynihan. 1970. Beyond the Melting Pot: the Negroes, Puerto Ricans, Jews, Italians, and Irish of New York City, 2nd Edition. Cambridge: MIT Press. Guy, Cynthia, Fred Doolittle, and Barbara Fink. 1991. Self-Employment for Welfare Recipients: Implementation of the SEID Program. New York: Manpower Demonstration Research Corporation. Holtz-Eakin, Douglas, and Harvey Rosen (2004): "Cash Constraints and Business Start-Ups: Deutschmarks Versus Dollars," Syracuse University Working Paper. Holtz-Eakin, Douglas, David Joulfaian, and Harvey Rosen (1994a): "Entrepreneurial Decisions and Liquidity Constraints," Rand Journal of Economics, 23, 2, pp. 334-347. Hout, Michael and Harvey S. Rosen. 2000. "Self-Employment, Family Background, and Race," Journal of Human Resources, 35(4): 670-92. Hundley, Greg. 2001. "Why Women Earn Less Than Men in Self-Employment." Journal of Labor Research. 22(4):817-829. Hundley, Greg. 2000. "Male/Female Earnings Differences in Self-Employment: The Effects of Marriage, Children, and the Household Division of Labor." Industrial and Labor Relations Review. 54(1):95-104. Hurst, Erik, and Annamaria Lusardi (2004): "Liquidity Constraints, Household Wealth, and Entrepreneurship," Journal of Political Economy, 112(2): 319-347. Johansson, Edvard. 2000. "Self-employment and Liquidity Constraints: Evidence from Finland." Scandinavian Journal of Economics, 102 (1):123-134. Katz, Lawrence F. and David H. Autor. 1999. "Changes in the Wage Structure and Earnings Inequality," in Orley Ashenfelter and David Card, eds., Handbook of Labor Economics, Vol. 3. Amsterdam: North-Holland. Kosanovich, William T., Heather Fleck, Berwood Yost, Wendy Armon, and Sandra Siliezar. 2001. Comprehensive Assessment of Self-Employment Assistance Programs, U.S. Department of Labor Report.
35
Kourilsky, Marilyn L. and William B. Walstad. 1998. "Entrepreneurship and Female Youth: Knowledge, Attitudes, Gender Differences, and Educational Practices." Journal of Business Venturing. 13, pp. 77-88. Krashinsky, Harry. 2004. "Self-Employment for Less-Educated Workers," University of Toronto Working Paper. Kuhn, Peter J., and Herb J. Schuetze. 2001. "Self-Employment Dynamics and Self-Employment Trends: A Study of Canadian Men and Women, 1982-1998," Canadian Economics Association, 34(3): 760-784. Lentz, Bernard, and David Laband. 1990. "Entrepreneurial Success and Occupational Inheritance among Proprietors," Canadian Journal of Economics, 23, No. 3, pp. 563-579. Levy, Frank and Richard J. Murname. 1992. "U.S. Earnings Levels and Earnings Inequality: A Review of Recent Trends and Proposed Explanations," Journal of Economic Literature, 30: 1333-1381. Lindh T., and H. Ohlsson (1996). ‘Self-employment and windfall gains: evidence from the Swedish lottery’, Economic Journal, 106: (439), November, pp.1515-1526. Light, Ivan. 1972. Ethnic Enterprise in America. Berkeley: University of California Press. Light, Ivan. 1979. "Disadvantaged Minorities in Self Employment." International Journal of Comparative Sociology 20(1-2):31-45. Light, Ivan, and Carolyn Rosenstein. 1995. Race, Ethnicity, and Entrepreneurship in Urban America. New York: Aldine de Gruyter. Lin, Zhengxi, and Garnett Picot, and Janice Compton. 2001. "The Entry and Exit Dynamics of Self-Employment in Canada," Small Business Economics, 15(2): 105-125. Loewen, James W. 1971. The Mississippi Chinese: Between Black and White. Cambridge: Harvard University Press. Lohmann, Henning. 2001. "Self-Employed or Employee, Full-Time or Part-Time? Gender Differences in the Determinants and Conditions for Self-Employment in Europe and the US." Mannheim Centre for European Social Research Working Paper 38, 2001. Lombard, Karen V. 2001. "Female Self-Employment and Demand for Flexible, Nonstandard Work Schedules." Economic Inquiry. 39(2):214-237. Madrian, Brigette C., and Lars John Lefgren. 2000. "An Approach to Longitudinally Matching Current Population Survey (CPS) Respondents," Journal of Economic and Social Measurement, 26, 31-62. Martinez-Granado, Maite. 2002. "Self-employment and Labour Market Transitions: a Multiple State Model," Universidad Carlos III de Madrid Working Paper. Menchik, Paul L. and Nancy A. Jianakoplos. 1997. "Black-White Wealth Inequality: Is Inheritance the Reason?," Economic Inquiry, 35(2), p. 428-442.

36
Meyer, Bruce 1990. "Why Are There So Few Black Entrepreneurs?," National Bureau of Economic Research, Working Paper No. 3537. Min, Pyong Gap. 1989. "Some Positive Functions of Ethnic Business for an Immigrant Community: Koreans in Los Angeles," Final Report Submitted to the National Science Foundation, Washington, D.C. Min, Pyong Gap. 1993. "Korean Immigrants in Los Angeles," in Immigration and Entrepreneurship: Culture, Capital, and Ethnic Networks," in eds., Ivan Light and Parminder Bhachu, New Brunswick: Transaction Publishers. Myrdal, Gunnar. 1944. An American Dilemma, New York: Harper and Brothers. Oaxaca, Ronald. 1973. "Male-Female Wage Differentials in Urban Labor Markets," International Economic Review, 14 (October), pp. 693-709. Oaxaca, Ronald, and Michael Ransom. 1994. "On Discrimination and the Decomposition of Wage Differentials," Journal of Econometrics, 61, 5-21. OECD, 1992, Employment Outlook 1992, Paris: OECD. http://www.oecd.org/dataoecd/4/8/2409984.pdf Parker, Simon C. 2004. The Economics of Self-Employment and Entrepreneurship. Cambridge: Cambridge University Press. Raheim, Salome. 1997. "Problems and prospects of self-employment as an economic independence option for welfare recipients," Social Work, 42, 1, pp. 44-53. Razin, Eran and Ivan Light. 1998. "Ethnic Entrepreneurs in America's Largest Metropolitan Areas." Urban Affairs Review, 33(3): 332-360. Taylor, Mark. 2001. "Self-Employment and Windfall Gains in Britain: Evidence from Panel Data." Economica. 63, pp. 539-565. U.S. Bureau of the Census. 2003. Poverty: 1999, Census 2000 Brief, http://www.census.gov/prod/2003pubs/c2kbr-19.pdf U.S. Bureau of the Census. 2004. Evidence From Census 2000 About Earnings by Detailed Occupation for Men and Women, Census 2000 Special Reports, http://www.census.gov/prod/2004pubs/censr-15.pdf U.S. Department of Education. 2002. Digest of Education Statistics, 2002, Washington, D.C.: National Center for Education Statistics. U.S. Small Business Administration. 1998. Women in Business. Office of Advocacy. Washington, DC. U.S. Small Business Administration. 1999. Minorities in Business. Office of Advocacy. Washington, DC.

37
Vroman, Wayne. 1997. "Self-Employment Assistance: Revised Report." Urban Institute. Walstad, William B. and Marilyn L. Kourilsky. 1998. "Entrepreneurial Attitudes and Knowledge of Black Youth," Entrepreneurship Theory & Practice, 23(2): 5-18.
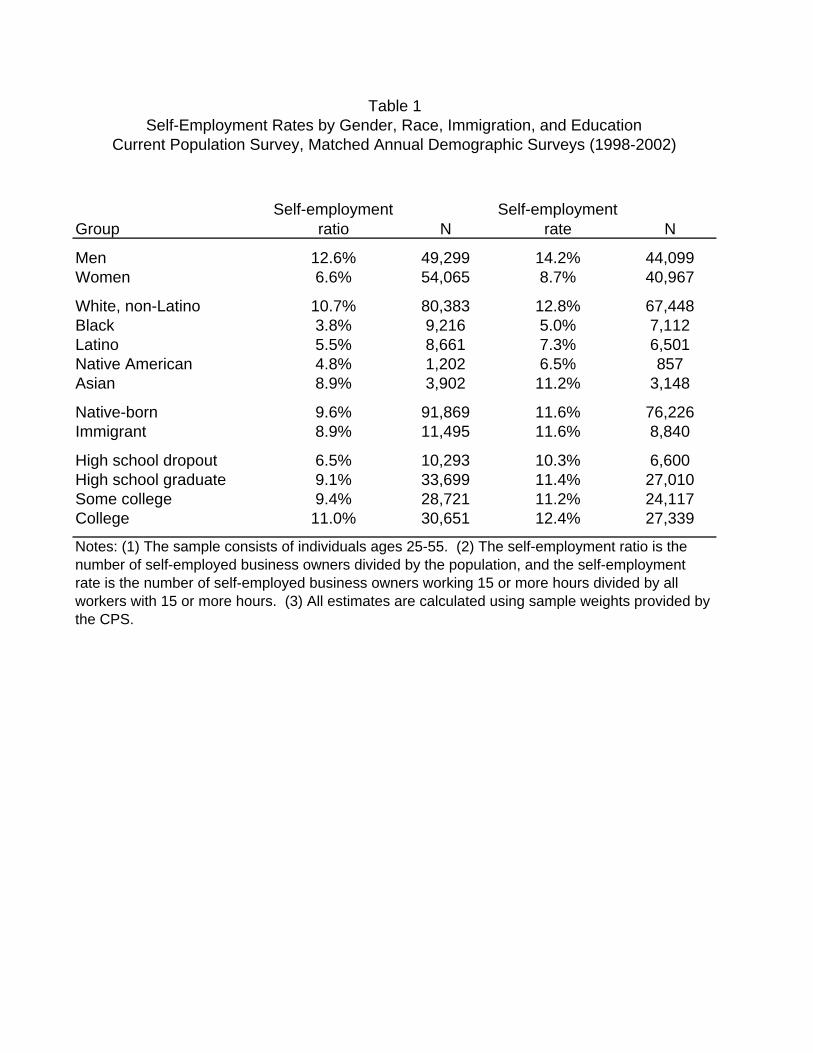
GroupSelf-employment
ratio NSelf-employment
rate N
Men 12.6% 49,299 14.2% 44,099Women 6.6% 54,065 8.7% 40,967
White, non-Latino 10.7% 80,383 12.8% 67,448Black 3.8% 9,216 5.0% 7,112Latino 5.5% 8,661 7.3% 6,501Native American 4.8% 1,202 6.5% 857Asian 8.9% 3,902 11.2% 3,148
Native-born 9.6% 91,869 11.6% 76,226Immigrant 8.9% 11,495 11.6% 8,840
High school dropout 6.5% 10,293 10.3% 6,600High school graduate 9.1% 33,699 11.4% 27,010Some college 9.4% 28,721 11.2% 24,117College 11.0% 30,651 12.4% 27,339
Table 1Self-Employment Rates by Gender, Race, Immigration, and Education
Current Population Survey, Matched Annual Demographic Surveys (1998-2002)
Notes: (1) The sample consists of individuals ages 25-55. (2) The self-employment ratio is the number of self-employed business owners divided by the population, and the self-employment rate is the number of self-employed business owners working 15 or more hours divided by all workers with 15 or more hours. (3) All estimates are calculated using sample weights provided by the CPS.
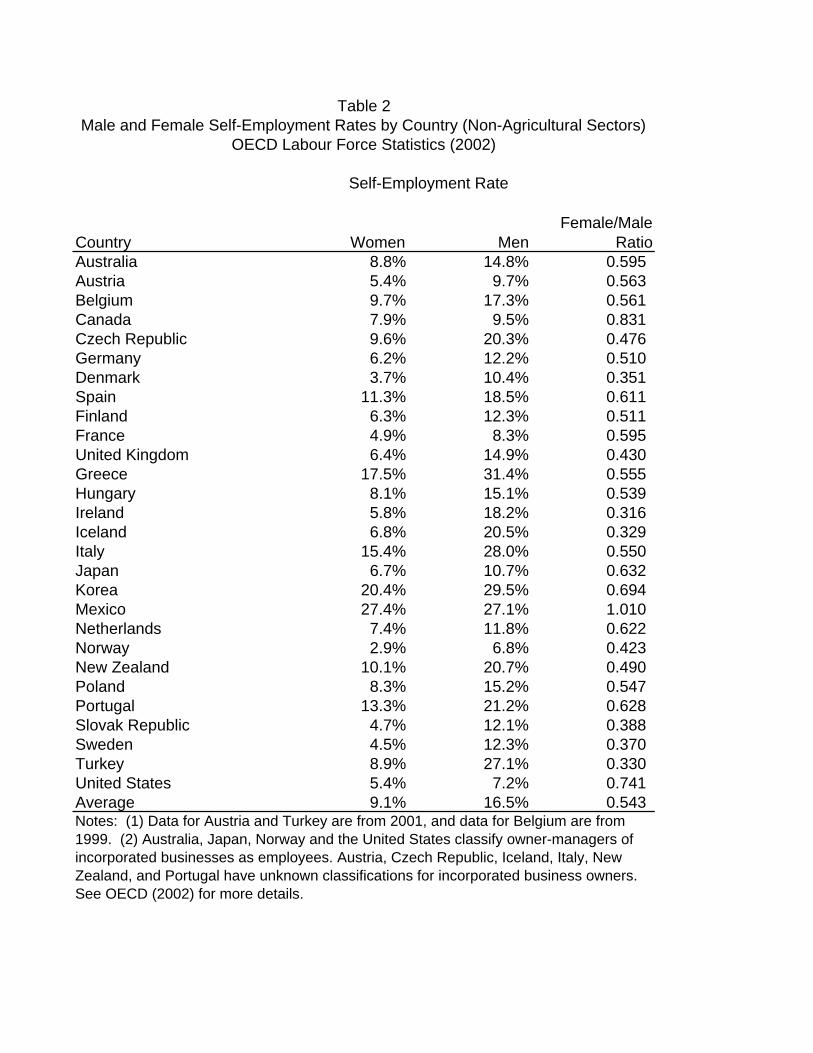
Country Women MenFemale/Male
RatioAustralia 8.8% 14.8% 0.595 Austria 5.4% 9.7% 0.563 Belgium 9.7% 17.3% 0.561 Canada 7.9% 9.5% 0.831 Czech Republic 9.6% 20.3% 0.476 Germany 6.2% 12.2% 0.510 Denmark 3.7% 10.4% 0.351 Spain 11.3% 18.5% 0.611 Finland 6.3% 12.3% 0.511 France 4.9% 8.3% 0.595 United Kingdom 6.4% 14.9% 0.430 Greece 17.5% 31.4% 0.555 Hungary 8.1% 15.1% 0.539 Ireland 5.8% 18.2% 0.316 Iceland 6.8% 20.5% 0.329 Italy 15.4% 28.0% 0.550 Japan 6.7% 10.7% 0.632 Korea 20.4% 29.5% 0.694 Mexico 27.4% 27.1% 1.010 Netherlands 7.4% 11.8% 0.622 Norway 2.9% 6.8% 0.423 New Zealand 10.1% 20.7% 0.490 Poland 8.3% 15.2% 0.547 Portugal 13.3% 21.2% 0.628 Slovak Republic 4.7% 12.1% 0.388 Sweden 4.5% 12.3% 0.370 Turkey 8.9% 27.1% 0.330 United States 5.4% 7.2% 0.741 Average 9.1% 16.5% 0.543
Table 2
Notes: (1) Data for Austria and Turkey are from 2001, and data for Belgium are from 1999. (2) Australia, Japan, Norway and the United States classify owner-managers of incorporated businesses as employees. Austria, Czech Republic, Iceland, Italy, New Zealand, and Portugal have unknown classifications for incorporated business owners. See OECD (2002) for more details.
Self-Employment Rate
Male and Female Self-Employment Rates by Country (Non-Agricultural Sectors)OECD Labour Force Statistics (2002)

Self-Employment
RateWorkers
000s
Self-Employment
RateWorkers
000s
Self-Employment
RateWorkers
000sTotal 12.0% 15,516 13.7% 22,796 10.6% 115,146
White 12.4% 13,208 13.6% 21,277 11.8% 85,743 Black 6.1% 315 8.3% 424 4.8% 11,368 Latino 7.9% 114 7.2% 10,696 Native 7.2% 377 7.8% 808 Asian 11.0% 1,284 18.7% 849 10.9% 4,034
Chinese 13.3% 477 25.5% 89 11.2% 984 Indian 10.0% 374 17.0% 445 10.7% 693 Vietnamese 8.8% 74 11.0% 411 Korean 32.3% 43 23.8% 386 Japanese 13.5% 36 11.7% 345 Filipino 3.6% 180 5.0% 820
Table 3Self-Employment Rates by Race/Ethnicity for Selected Countries
2000-2001
Notes: (1) Estimates are from the Canadian 2001 Census, the U.K. 2001 Census and the U.S. 5% Public Use Microdata Sample from the 2000 Census. (2) Canadian minority groups include multiracial responses to the race question. Canadian whites, and all U.S. and U.K. groups include only monoracial responses to the race question.
Canada United Kingdom United States
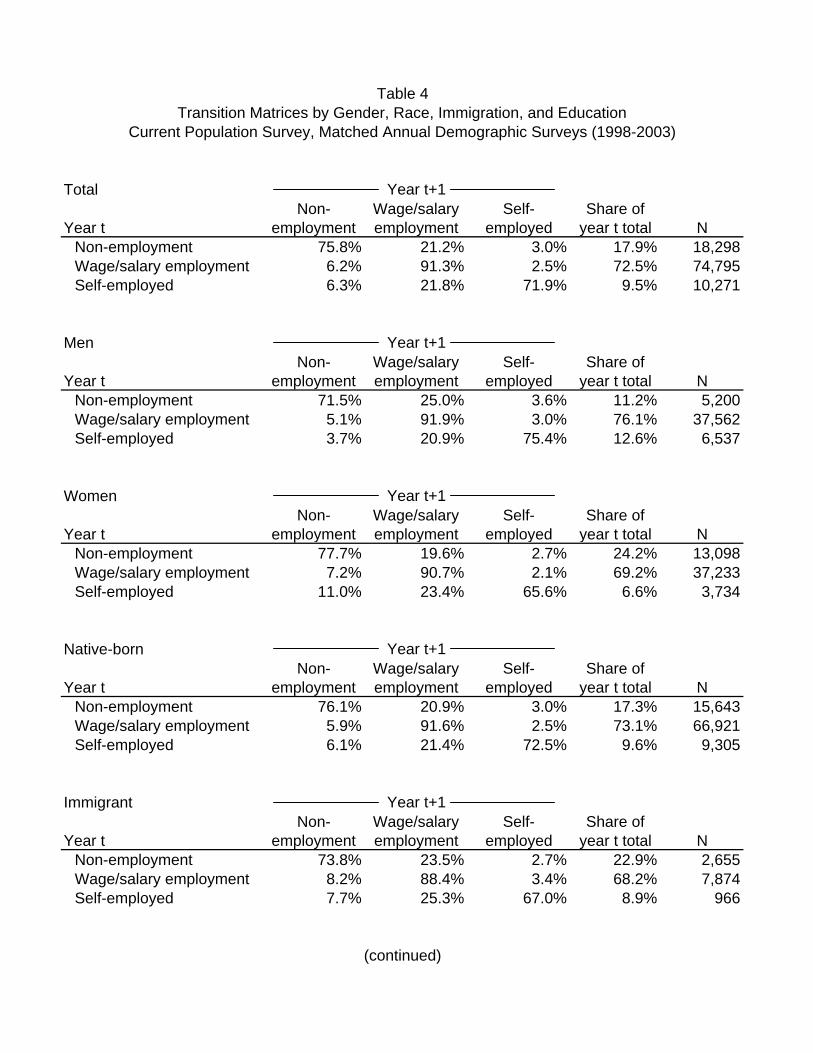
Total
Year tNon-
employmentWage/salary employment
Self-employed
Share of year t total N
Non-employment 75.8% 21.2% 3.0% 17.9% 18,298Wage/salary employment 6.2% 91.3% 2.5% 72.5% 74,795Self-employed 6.3% 21.8% 71.9% 9.5% 10,271
Men
Year tNon-
employmentWage/salary employment
Self-employed
Share of year t total N
Non-employment 71.5% 25.0% 3.6% 11.2% 5,200Wage/salary employment 5.1% 91.9% 3.0% 76.1% 37,562Self-employed 3.7% 20.9% 75.4% 12.6% 6,537
Women
Year tNon-
employmentWage/salary employment
Self-employed
Share of year t total N
Non-employment 77.7% 19.6% 2.7% 24.2% 13,098Wage/salary employment 7.2% 90.7% 2.1% 69.2% 37,233Self-employed 11.0% 23.4% 65.6% 6.6% 3,734
Native-born
Year tNon-
employmentWage/salary employment
Self-employed
Share of year t total N
Non-employment 76.1% 20.9% 3.0% 17.3% 15,643Wage/salary employment 5.9% 91.6% 2.5% 73.1% 66,921Self-employed 6.1% 21.4% 72.5% 9.6% 9,305
Immigrant
Year tNon-
employmentWage/salary employment
Self-employed
Share of year t total N
Non-employment 73.8% 23.5% 2.7% 22.9% 2,655Wage/salary employment 8.2% 88.4% 3.4% 68.2% 7,874Self-employed 7.7% 25.3% 67.0% 8.9% 966
Year t+1
Year t+1
(continued)
Year t+1
Year t+1
Table 4Transition Matrices by Gender, Race, Immigration, and Education
Current Population Survey, Matched Annual Demographic Surveys (1998-2003)
Year t+1
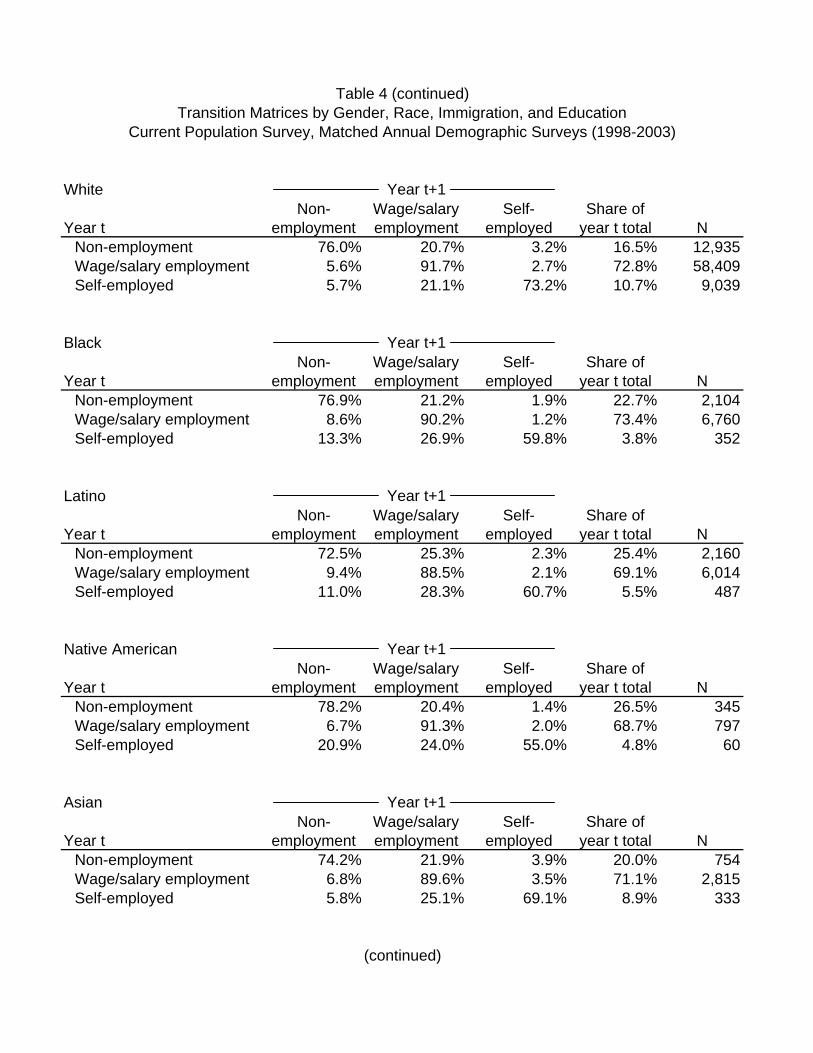
White
Year tNon-
employmentWage/salary employment
Self-employed
Share of year t total N
Non-employment 76.0% 20.7% 3.2% 16.5% 12,935Wage/salary employment 5.6% 91.7% 2.7% 72.8% 58,409Self-employed 5.7% 21.1% 73.2% 10.7% 9,039
Black
Year tNon-
employmentWage/salary employment
Self-employed
Share of year t total N
Non-employment 76.9% 21.2% 1.9% 22.7% 2,104Wage/salary employment 8.6% 90.2% 1.2% 73.4% 6,760Self-employed 13.3% 26.9% 59.8% 3.8% 352
Latino
Year tNon-
employmentWage/salary employment
Self-employed
Share of year t total N
Non-employment 72.5% 25.3% 2.3% 25.4% 2,160Wage/salary employment 9.4% 88.5% 2.1% 69.1% 6,014Self-employed 11.0% 28.3% 60.7% 5.5% 487
Native American
Year tNon-
employmentWage/salary employment
Self-employed
Share of year t total N
Non-employment 78.2% 20.4% 1.4% 26.5% 345Wage/salary employment 6.7% 91.3% 2.0% 68.7% 797Self-employed 20.9% 24.0% 55.0% 4.8% 60
Asian
Year tNon-
employmentWage/salary employment
Self-employed
Share of year t total N
Non-employment 74.2% 21.9% 3.9% 20.0% 754Wage/salary employment 6.8% 89.6% 3.5% 71.1% 2,815Self-employed 5.8% 25.1% 69.1% 8.9% 333
Year t+1
(continued)
Year t+1
Year t+1
Year t+1
Year t+1
Table 4 (continued)Transition Matrices by Gender, Race, Immigration, and Education
Current Population Survey, Matched Annual Demographic Surveys (1998-2003)
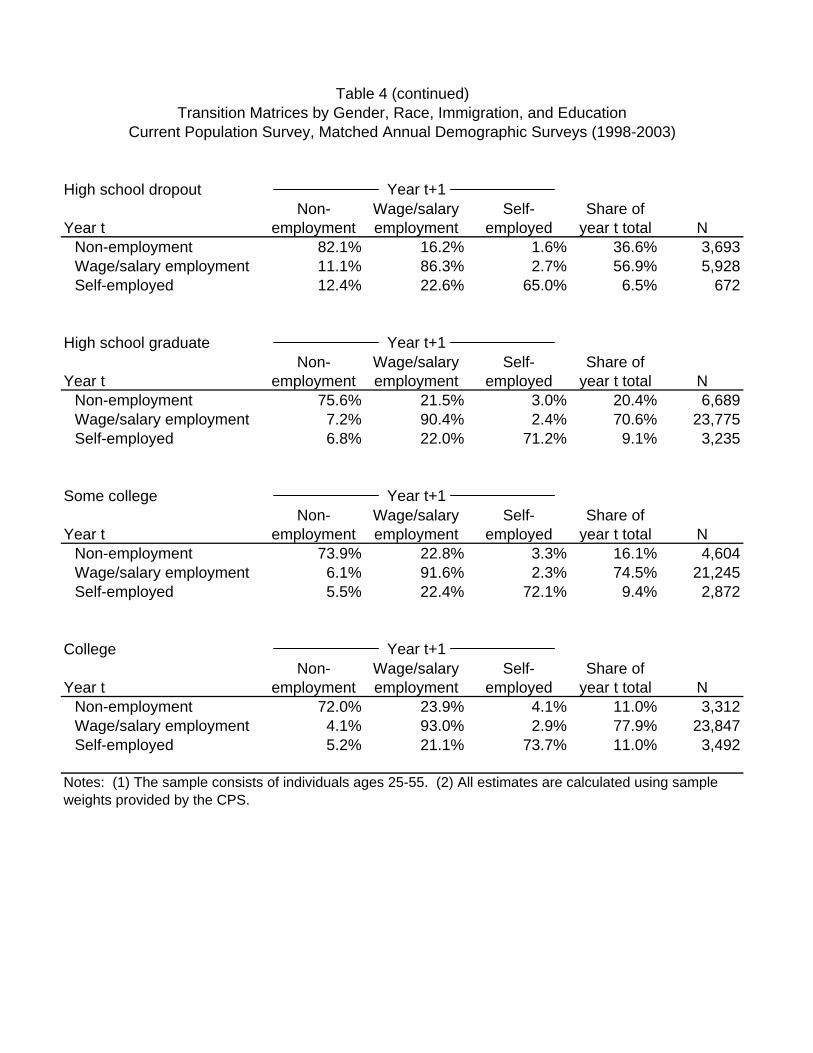
High school dropout
Year tNon-
employmentWage/salary employment
Self-employed
Share of year t total N
Non-employment 82.1% 16.2% 1.6% 36.6% 3,693Wage/salary employment 11.1% 86.3% 2.7% 56.9% 5,928Self-employed 12.4% 22.6% 65.0% 6.5% 672
High school graduate
Year tNon-
employmentWage/salary employment
Self-employed
Share of year t total N
Non-employment 75.6% 21.5% 3.0% 20.4% 6,689Wage/salary employment 7.2% 90.4% 2.4% 70.6% 23,775Self-employed 6.8% 22.0% 71.2% 9.1% 3,235
Some college
Year tNon-
employmentWage/salary employment
Self-employed
Share of year t total N
Non-employment 73.9% 22.8% 3.3% 16.1% 4,604Wage/salary employment 6.1% 91.6% 2.3% 74.5% 21,245Self-employed 5.5% 22.4% 72.1% 9.4% 2,872
College
Year tNon-
employmentWage/salary employment
Self-employed
Share of year t total N
Non-employment 72.0% 23.9% 4.1% 11.0% 3,312Wage/salary employment 4.1% 93.0% 2.9% 77.9% 23,847Self-employed 5.2% 21.1% 73.7% 11.0% 3,492
Table 4 (continued)Transition Matrices by Gender, Race, Immigration, and Education
Current Population Survey, Matched Annual Demographic Surveys (1998-2003)
Notes: (1) The sample consists of individuals ages 25-55. (2) All estimates are calculated using sample weights provided by the CPS.
Year t+1
Year t+1
Year t+1
Year t+1
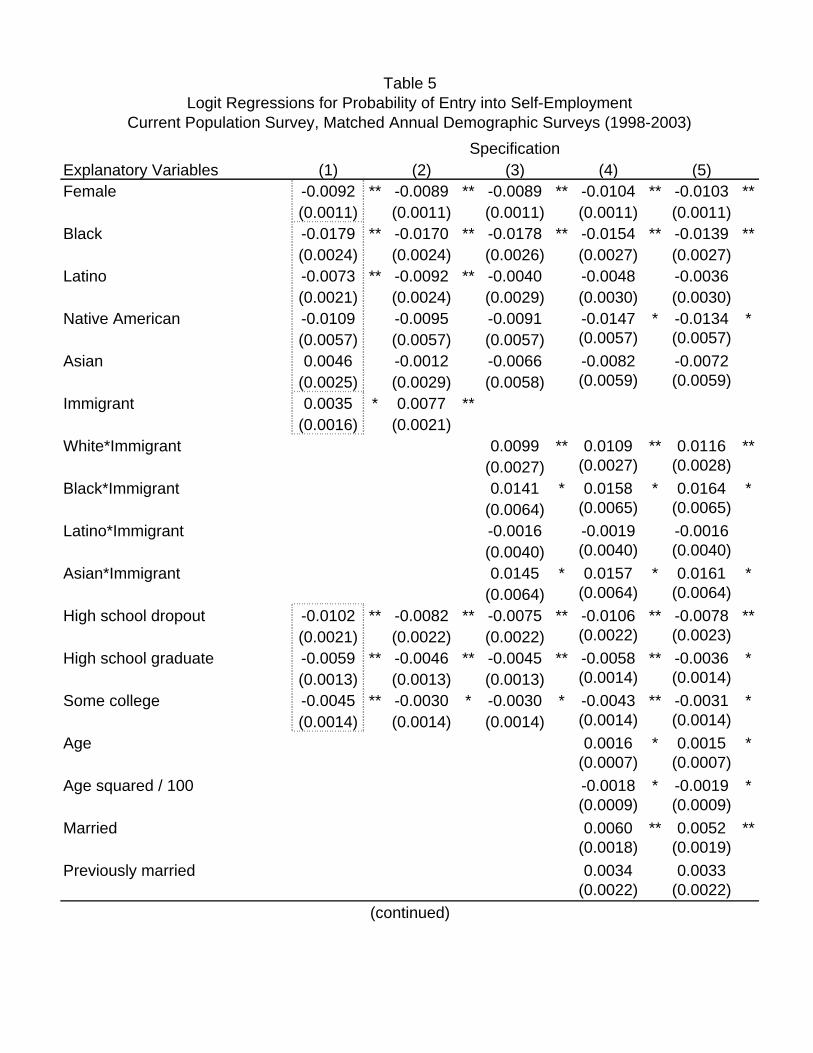
Explanatory Variables (1) (2) (3) (4) (5)Female -0.0092 ** -0.0089 ** -0.0089 ** -0.0104 ** -0.0103 **
(0.0011) (0.0011) (0.0011) (0.0011) (0.0011)Black -0.0179 ** -0.0170 ** -0.0178 ** -0.0154 ** -0.0139 **
(0.0024) (0.0024) (0.0026) (0.0027) (0.0027)Latino -0.0073 ** -0.0092 ** -0.0040 -0.0048 -0.0036
(0.0021) (0.0024) (0.0029) (0.0030) (0.0030)Native American -0.0109 -0.0095 -0.0091 -0.0147 * -0.0134 *
(0.0057) (0.0057) (0.0057) (0.0057) (0.0057)Asian 0.0046 -0.0012 -0.0066 -0.0082 -0.0072
(0.0025) (0.0029) (0.0058) (0.0059) (0.0059)Immigrant 0.0035 * 0.0077 **
(0.0016) (0.0021)White*Immigrant 0.0099 ** 0.0109 ** 0.0116 **
(0.0027) (0.0027) (0.0028)Black*Immigrant 0.0141 * 0.0158 * 0.0164 *
(0.0064) (0.0065) (0.0065)Latino*Immigrant -0.0016 -0.0019 -0.0016
(0.0040) (0.0040) (0.0040)Asian*Immigrant 0.0145 * 0.0157 * 0.0161 *
(0.0064) (0.0064) (0.0064)High school dropout -0.0102 ** -0.0082 ** -0.0075 ** -0.0106 ** -0.0078 **
(0.0021) (0.0022) (0.0022) (0.0022) (0.0023)High school graduate -0.0059 ** -0.0046 ** -0.0045 ** -0.0058 ** -0.0036 *
(0.0013) (0.0013) (0.0013) (0.0014) (0.0014)Some college -0.0045 ** -0.0030 * -0.0030 * -0.0043 ** -0.0031 *
(0.0014) (0.0014) (0.0014) (0.0014) (0.0014)Age 0.0016 * 0.0015 *
(0.0007) (0.0007)Age squared / 100 -0.0018 * -0.0019 *
(0.0009) (0.0009)Married 0.0060 ** 0.0052 **
(0.0018) (0.0019)Previously married 0.0034 0.0033
(0.0022) (0.0022)
Specification
Table 5Logit Regressions for Probability of Entry into Self-Employment
Current Population Survey, Matched Annual Demographic Surveys (1998-2003)
(continued)
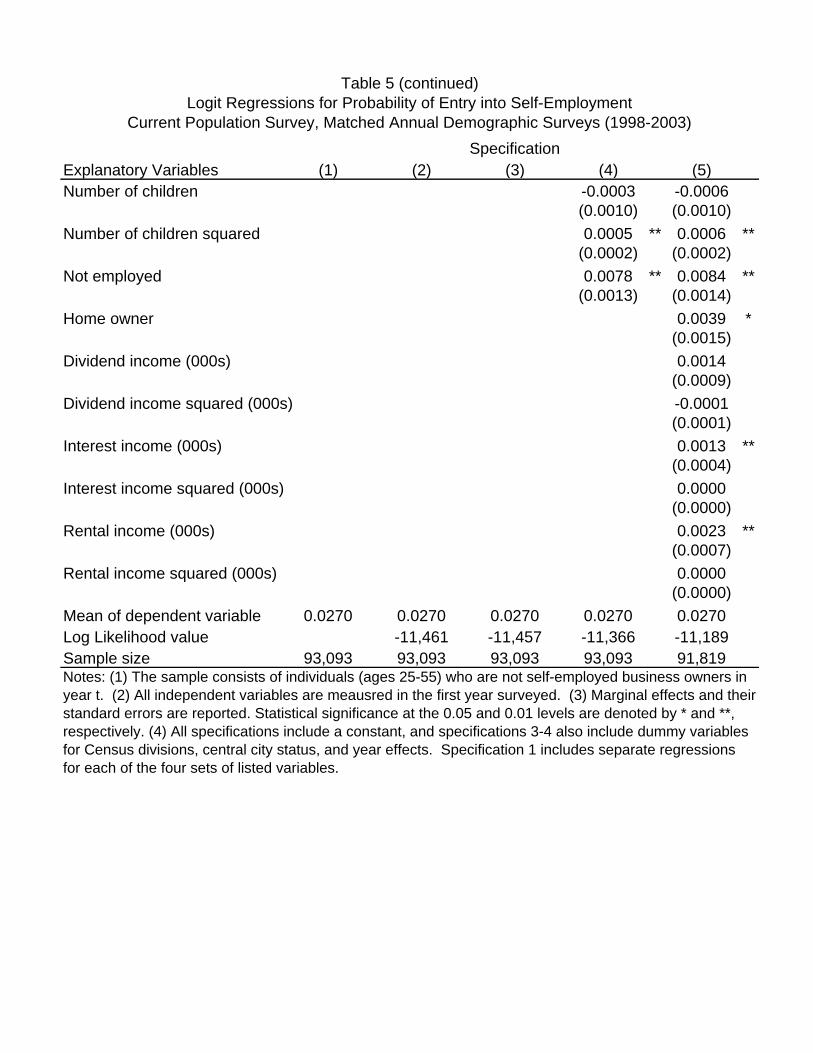
Explanatory Variables (1) (2) (3) (4) (5)Number of children -0.0003 -0.0006
(0.0010) (0.0010)Number of children squared 0.0005 ** 0.0006 **
(0.0002) (0.0002)Not employed 0.0078 ** 0.0084 **
(0.0013) (0.0014)Home owner 0.0039 *
(0.0015)Dividend income (000s) 0.0014
(0.0009)Dividend income squared (000s) -0.0001
(0.0001)Interest income (000s) 0.0013 **
(0.0004)Interest income squared (000s) 0.0000
(0.0000)Rental income (000s) 0.0023 **
(0.0007)Rental income squared (000s) 0.0000
(0.0000)Mean of dependent variable 0.0270 0.0270 0.0270 0.0270 0.0270Log Likelihood value -11,461 -11,457 -11,366 -11,189Sample size 93,093 93,093 93,093 93,093 91,819
Specification
Notes: (1) The sample consists of individuals (ages 25-55) who are not self-employed business owners in year t. (2) All independent variables are meausred in the first year surveyed. (3) Marginal effects and their standard errors are reported. Statistical significance at the 0.05 and 0.01 levels are denoted by * and **, respectively. (4) All specifications include a constant, and specifications 3-4 also include dummy variables for Census divisions, central city status, and year effects. Specification 1 includes separate regressions for each of the four sets of listed variables.
Table 5 (continued)Logit Regressions for Probability of Entry into Self-Employment
Current Population Survey, Matched Annual Demographic Surveys (1998-2003)

Explanatory Variables (1) (2) (3) (4) (5)Female 0.0989 ** 0.1001 ** 0.0999 ** 0.0997 ** 0.0993 **
(0.0088) (0.0088) (0.0088) (0.0088) (0.0089)Black 0.1439 ** 0.1320 ** 0.1453 ** 0.1010 ** 0.0967 **
(0.0216) (0.0216) (0.0229) (0.0235) (0.0238)Latino 0.1097 ** 0.0841 ** 0.0989 ** 0.0771 ** 0.0701 *
(0.0189) (0.0210) (0.0276) (0.0278) (0.0281)Native American 0.1432 ** 0.1263 * 0.1303 * 0.1456 ** 0.1448 **
(0.0513) (0.0512) (0.0512) (0.0510) (0.0510)Asian 0.0546 * 0.0383 0.1118 ** 0.1075 * 0.1052 *
(0.0236) (0.0263) (0.0434) (0.0438) (0.0439)Immigrant 0.0653 ** 0.0253
(0.0142) (0.0171)White*Immigrant 0.0586 ** 0.0399 0.0380
(0.0213) (0.0214) (0.0215)Black*Immigrant -0.0708 -0.0648 -0.0707
(0.0654) (0.0651) (0.0653)Latino*Immigrant 0.0013 -0.0057 -0.0116
(0.0369) (0.0369) (0.0372)Asian*Immigrant -0.0730 -0.0804 -0.0826
(0.0510) (0.0507) (0.0508)High school dropout 0.0906 ** 0.0699 ** 0.0703 ** 0.0749 ** 0.0720 **
(0.0176) (0.0180) (0.0181) (0.0183) (0.0186)High school graduate 0.0168 0.0109 0.0107 0.0211 0.0168
(0.0109) (0.0108) (0.0108) (0.0110) (0.0113)Some college 0.0084 0.0016 0.0011 0.0089 0.0076
(0.0113) (0.0112) (0.0112) (0.0113) (0.0115)Age -0.0260 ** -0.0229 **
(0.0059) (0.0059)Age squared / 100 0.0278 ** 0.0245 **
(0.0071) (0.0072)Married -0.0323 * -0.0220
(0.0159) (0.0162)Previously married -0.0084 -0.0073
(0.0189) (0.0191)
Specification
Table 6Logit Regressions for Probability of Exit from Self-Employment
Current Population Survey, Matched Annual Demographic Surveys (1998-2003)
(continued)

Explanatory Variables (1) (2) (3) (4) (5)Number of children -0.0058 -0.0051
(0.0088) (0.0089)Number of children squared 0.0017 0.0016
(0.0021) (0.0021)Home owner -0.0563 **
(0.0136)Dividend income (000s) -0.0059
(0.0069)Dividend income squared (000s) 0.0003
(0.0005)Interest income (000s) 0.0044
(0.0033)Interest income squared (000s) -0.0001
(0.0001)Rental income (000s) -0.0056
(0.0050)Rental income squared (000s) 0.0001
(0.0002)Mean of dependent variable 0.2696 0.2696 0.2696 0.2696 0.2692 Log Likelihood value -5,875 -5,870 -5,798 -5,714Sample size 10,271 10,271 10,271 10,271 10,145Notes: (1) The sample consists of individuals (ages 25-55) who are self-employed business owners in year t. (2) All independent variables are meausred in the first year surveyed. (3) Marginal effects and their standard errors are reported. Statistical significance at the 0.05 and 0.01 levels are denoted by * and **, respectively. (4) All specifications include a constant, and specifications 3-4 also include dummy variables for Census divisions, central city status, and year effects. Specification 1 includes separate regressions for each of the four sets of listed variables.
Specification
Table 6 (continued)Logit Regressions for Probability of Exit from Self-Employment
Current Population Survey, Matched Annual Demographic Surveys (1998-2003)

Native-born Blacks
Native-born Hispanics
Hispanic immigrants
Native Americans
Explanatory Variables (1) (2) (3) (4)White/minority gap in entry rate 0.0144 0.0047 0.0071 0.0079Contributions from racial differences in:
Sex -0.0002 -0.0006 -0.0009 -0.0006-1.6% -16.8% -14.7% -17.2%
Education 0.0009 0.0012 0.0028 0.00126.0% 34.3% 44.8% 36.1%
Age 0.0000 0.0002 0.0001 0.00010.0% 4.5% 0.9% 2.2%
Marital status and children 0.0007 -0.0002 -0.0010 -0.00095.0% -6.1% -16.3% -27.5%
Not-employed -0.0005 -0.0004 -0.0008 -0.0013-3.4% -10.9% -12.0% -37.1%
Assets 0.0022 0.0018 0.0028 0.001915.5% 55.4% 45.0% 54.2%
Region 0.0010 -0.0018 -0.0018 -0.00276.7% -54.5% -28.1% -78.3%
Central city status 0.0008 0.0010 0.0013 -0.00235.4% 29.4% 20.5% -66.5%
Year effects 0.0001 0.0001 0.0000 0.00020.6% 2.9% 0.8% 5.7%
All included variables ("explained" 0.0049 0.0013 0.0025 -0.0043part of the gap) 34.0% 27.1% 35.6% -54.6%
Notes: (1) The sample consists of individuals (ages 25-55) who are not self-employed business owners in year t. (2) Contribution estimates are from non-linear decompositions. See text for more details
Table 7Decomposition of Racial/Ethnic Gaps in Self-Employment Entry Rates
Specification
Current Population Survey, Matched Annual Demographic Surveys (1998-2003)
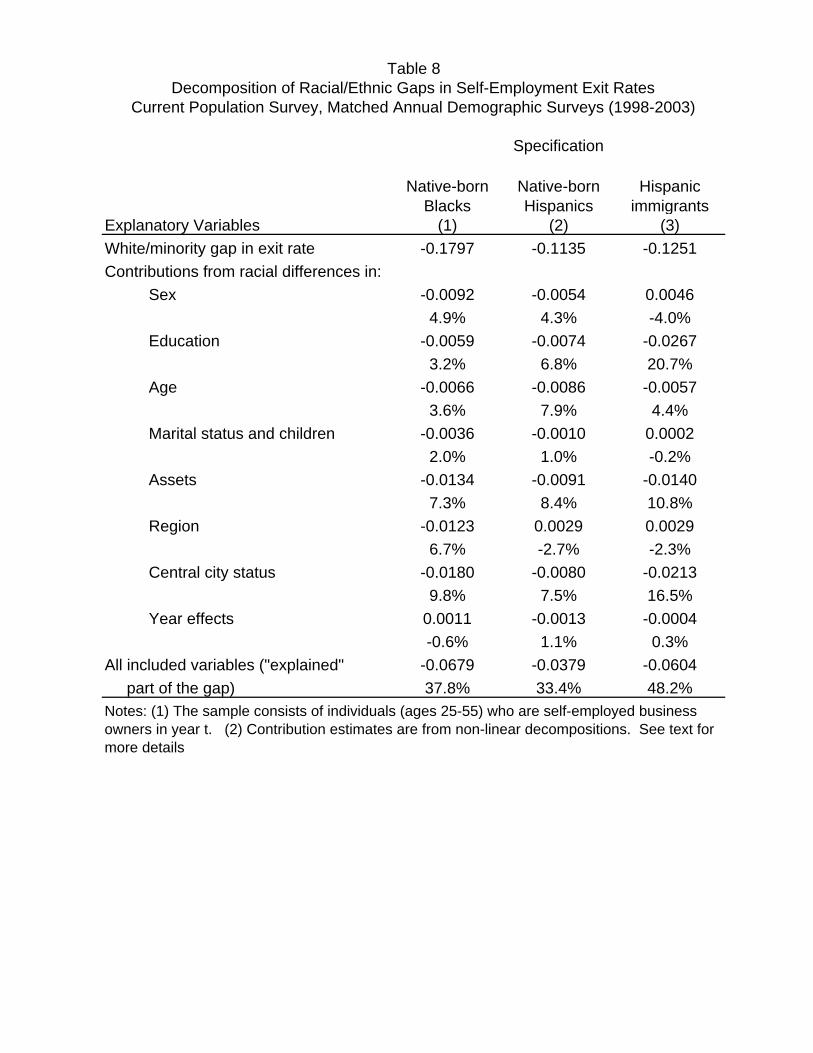
Native-born Blacks
Native-born Hispanics
Hispanic immigrants
Explanatory Variables (1) (2) (3)White/minority gap in exit rate -0.1797 -0.1135 -0.1251Contributions from racial differences in:
Sex -0.0092 -0.0054 0.00464.9% 4.3% -4.0%
Education -0.0059 -0.0074 -0.02673.2% 6.8% 20.7%
Age -0.0066 -0.0086 -0.00573.6% 7.9% 4.4%
Marital status and children -0.0036 -0.0010 0.00022.0% 1.0% -0.2%
Assets -0.0134 -0.0091 -0.01407.3% 8.4% 10.8%
Region -0.0123 0.0029 0.00296.7% -2.7% -2.3%
Central city status -0.0180 -0.0080 -0.02139.8% 7.5% 16.5%
Year effects 0.0011 -0.0013 -0.0004-0.6% 1.1% 0.3%
All included variables ("explained" -0.0679 -0.0379 -0.0604part of the gap) 37.8% 33.4% 48.2%
Notes: (1) The sample consists of individuals (ages 25-55) who are self-employed business owners in year t. (2) Contribution estimates are from non-linear decompositions. See text for more details
Table 8Decomposition of Racial/Ethnic Gaps in Self-Employment Exit Rates
Specification
Current Population Survey, Matched Annual Demographic Surveys (1998-2003)
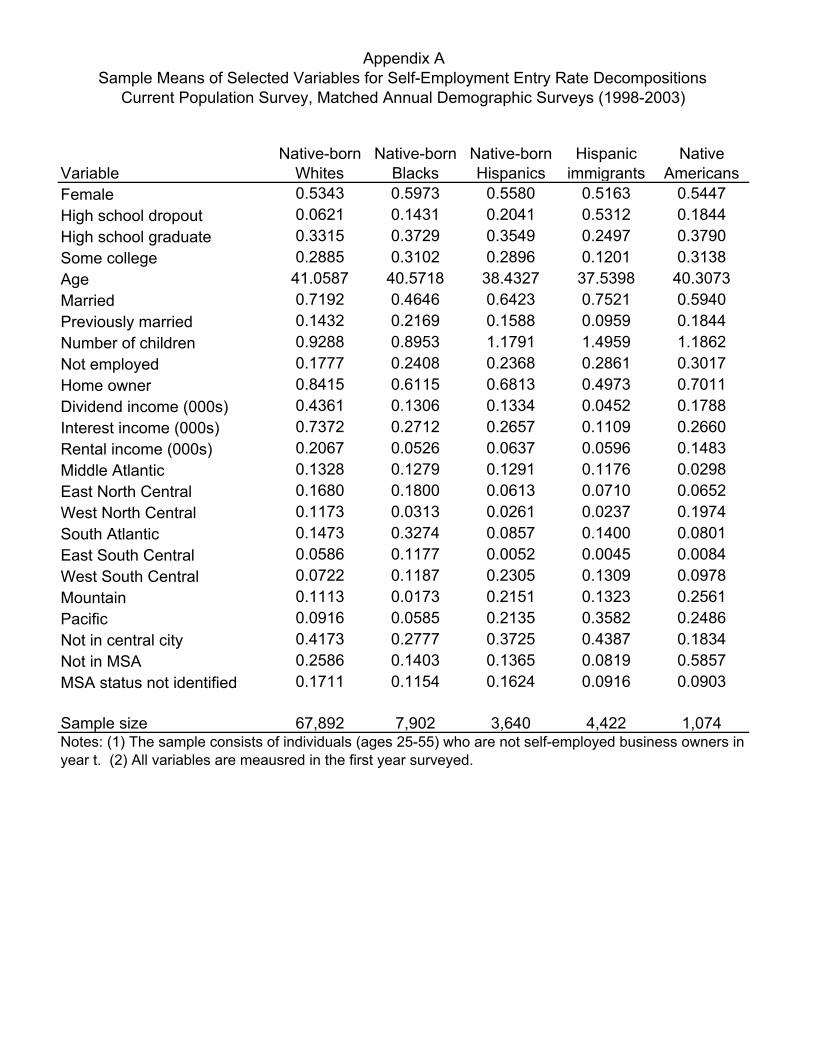
VariableNative-born
WhitesNative-born
BlacksNative-born Hispanics
Hispanic immigrants
Native Americans
Female 0.5343 0.5973 0.5580 0.5163 0.5447High school dropout 0.0621 0.1431 0.2041 0.5312 0.1844High school graduate 0.3315 0.3729 0.3549 0.2497 0.3790Some college 0.2885 0.3102 0.2896 0.1201 0.3138Age 41.0587 40.5718 38.4327 37.5398 40.3073Married 0.7192 0.4646 0.6423 0.7521 0.5940Previously married 0.1432 0.2169 0.1588 0.0959 0.1844Number of children 0.9288 0.8953 1.1791 1.4959 1.1862Not employed 0.1777 0.2408 0.2368 0.2861 0.3017Home owner 0.8415 0.6115 0.6813 0.4973 0.7011Dividend income (000s) 0.4361 0.1306 0.1334 0.0452 0.1788Interest income (000s) 0.7372 0.2712 0.2657 0.1109 0.2660Rental income (000s) 0.2067 0.0526 0.0637 0.0596 0.1483Middle Atlantic 0.1328 0.1279 0.1291 0.1176 0.0298East North Central 0.1680 0.1800 0.0613 0.0710 0.0652West North Central 0.1173 0.0313 0.0261 0.0237 0.1974South Atlantic 0.1473 0.3274 0.0857 0.1400 0.0801East South Central 0.0586 0.1177 0.0052 0.0045 0.0084West South Central 0.0722 0.1187 0.2305 0.1309 0.0978Mountain 0.1113 0.0173 0.2151 0.1323 0.2561Pacific 0.0916 0.0585 0.2135 0.3582 0.2486Not in central city 0.4173 0.2777 0.3725 0.4387 0.1834Not in MSA 0.2586 0.1403 0.1365 0.0819 0.5857MSA status not identified 0.1711 0.1154 0.1624 0.0916 0.0903
Sample size 67,892 7,902 3,640 4,422 1,074
Appendix ASample Means of Selected Variables for Self-Employment Entry Rate Decompositions
Current Population Survey, Matched Annual Demographic Surveys (1998-2003)
Notes: (1) The sample consists of individuals (ages 25-55) who are not self-employed business owners in year t. (2) All variables are meausred in the first year surveyed.
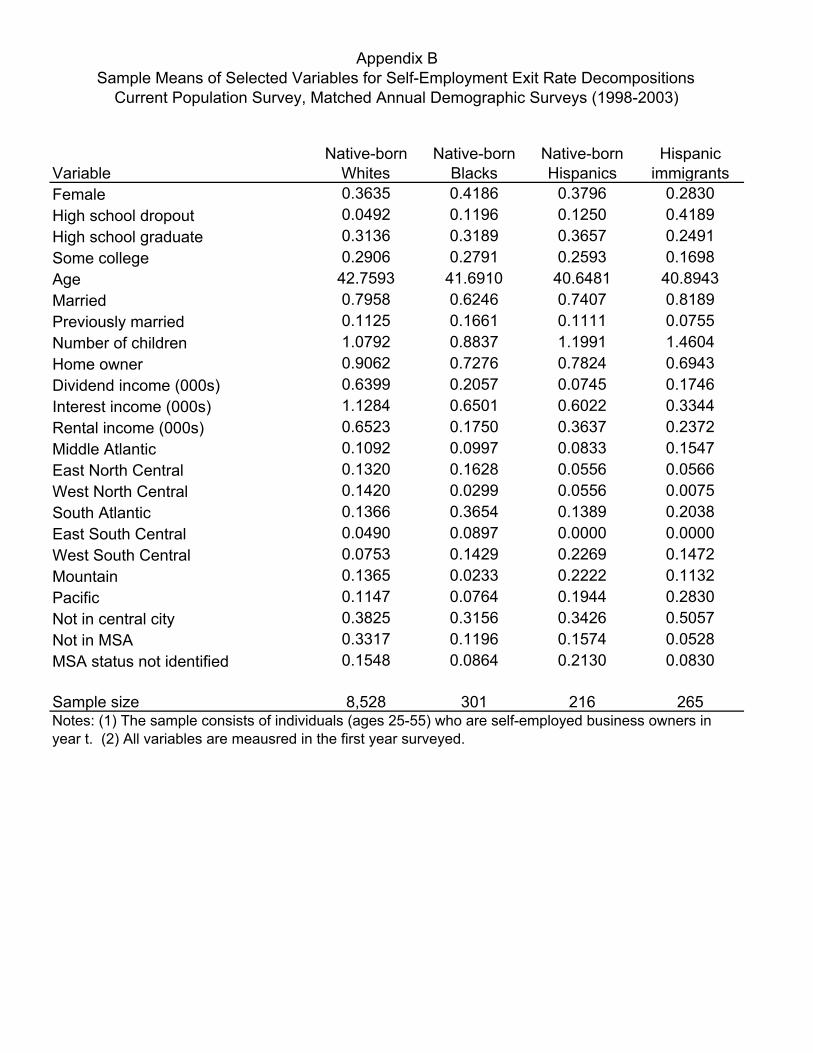
VariableNative-born
WhitesNative-born
BlacksNative-born Hispanics
Hispanic immigrants
Female 0.3635 0.4186 0.3796 0.2830High school dropout 0.0492 0.1196 0.1250 0.4189High school graduate 0.3136 0.3189 0.3657 0.2491Some college 0.2906 0.2791 0.2593 0.1698Age 42.7593 41.6910 40.6481 40.8943Married 0.7958 0.6246 0.7407 0.8189Previously married 0.1125 0.1661 0.1111 0.0755Number of children 1.0792 0.8837 1.1991 1.4604Home owner 0.9062 0.7276 0.7824 0.6943Dividend income (000s) 0.6399 0.2057 0.0745 0.1746Interest income (000s) 1.1284 0.6501 0.6022 0.3344Rental income (000s) 0.6523 0.1750 0.3637 0.2372Middle Atlantic 0.1092 0.0997 0.0833 0.1547East North Central 0.1320 0.1628 0.0556 0.0566West North Central 0.1420 0.0299 0.0556 0.0075South Atlantic 0.1366 0.3654 0.1389 0.2038East South Central 0.0490 0.0897 0.0000 0.0000West South Central 0.0753 0.1429 0.2269 0.1472Mountain 0.1365 0.0233 0.2222 0.1132Pacific 0.1147 0.0764 0.1944 0.2830Not in central city 0.3825 0.3156 0.3426 0.5057Not in MSA 0.3317 0.1196 0.1574 0.0528MSA status not identified 0.1548 0.0864 0.2130 0.0830
Sample size 8,528 301 216 265
Appendix BSample Means of Selected Variables for Self-Employment Exit Rate Decompositions
Current Population Survey, Matched Annual Demographic Surveys (1998-2003)
Notes: (1) The sample consists of individuals (ages 25-55) who are self-employed business owners in year t. (2) All variables are meausred in the first year surveyed.